of the national insurance fund - nib...
TRANSCRIPT

7th Actuarial Reviewof the
National Insurance Fundas of
31 December 2001
THE BAHAMAS


Table of Contents
Page
Page
Executive Summary v Chapter 1
Review Of Financial Experience & Other Activities
1
1.1 Financial Experience, 1975 - 2001 1 1.2 Activities Since Last Actuarial Review 4 1.3 Investment Portfolio 5 Chapter 2
Population & Economic Projections
7
2.1 Population Projections 7 2.2 Economic & Labour Market
Projections
9 Chapter 3
National Insurance Financial & Demographic Projections
11
3.1 Projection Results 11 3.2 Projected Benefit Costs 15 3.3 Sensitivity Tests – Intermediate
Scenario
16 3.4 Preserving National Insurance For
Future Generations
17
Chapter 4
Policy & Administrative Issues
19
4.1 Insurable Wage Ceiling 19 4.2 Pension Increases 19 4.3 Eligibility Requirements For Pensions 20 4.4 Wages Used For Calculating Pensions 21 4.5 Payment of Both Retirement &
Survivors Benefits
22 4.6 Assistance Pensions 23 4.7 Civil Servants & NIB 23
4.8 Self-employed Persons 25 4.9 Review Of NIB Legislation 25 4.10 Administrative Costs 26 4.11 Medical Benefits Branch 26 4.12 Annual Contribution Statements 27 4.13 Public Relations 28 4.14 Miscellaneous Issues 28
Chapter 5
Investments
31
5.1 Asset Mix 31 5.2 Investment Policy Statement 32 5.3 Investment Management 33
Appendix I
Summary of Contributions & Benefit Provisions
35
Appendix II
Methodology, Data & Assumptions
41 Appendix III
Projection Results – Pessimistic & Optimistic Scenarios
47
Appendix IV
Benefit Experience & Branch Analysis
49 IV.1 Pensions Branch 49 IV.2 Short-term Benefits Branch 50 IV.3 Industrial Benefits Branch 53 Appendix V
NIB Income & Expenditure, 1997-2001 57
i

List of Tables
Page
Page
1. Income & Expenditure, 1997 – 2001 4
2. Summary of Investments, 2001 & 1996 6
3. Projected Bahamas Population 8
4. Principal Economic Assumptions 9
5. Scenario Assumptions 11
6. Summary of Key Projection Results 12 7. Projected Cash Flows & Reserve –
Intermediate Scenario 13 8. Projected Benefit & Assistance
Expenditure – Intermediate Scenario 13 9. Projected Contributors & Pensioners at
Year-end 14
10. Projected Contribution Rates 15
11. Actuarial Balance 15
12. Sensitivity Tests Results 17 13. Staff Complement & Administrative
Costs in Several CARICOM Schemes 26
14. Maturities of NIB Investments 32
15. Age-Specific & Total Fertility Rates 41
16. Mortality Rates & Life Expectancy 42
17. Net Immigration 42
18. Labour Force Participation Rates 43 19. 2000 Active Insured Population,
Earnings & Past Credits 44 20. Contributory Pension in Payment -
December 2001 45 21. Non-contributory Pensions in Payment –
December 2001 45
22. Density of Contributions 46
23. Rates of Entry Into Invalidity 46
24. Probability of a Deceased Insured Having Eligible Survivors & Their Average Ages 46
25. Projected Cash Flows & Reserve – Pessimistic Scenario 47
26. Projected Benefit & Assistance Expenditure – Pessimistic Scenario 47
27. Projected Cash Flows & Reserve – Optimistic Scenario 48
28. Projected Benefit & Assistance Expenditure – Optimistic Scenario 48
29. Pensions Branch Expenditure as a Percent of Insurable Wages, 1997 - 2001 49
30. Pensions In Payment, Awarded & Terminated, 1996 to 2001 50
31. Sickness Benefit Experience, 1997 to 2001 51
32. Maternity Benefit Experience, 1997 to 2001 51
33. Maternity & Funeral Grant Experience, 1997 to 2001 51
34. Administrative & Total Expenditure – STB Branch 52
35. Projected STB Branch Costs 52
36. Injury Benefit Experience, 1997 to 2001 53 37. Medical Care & Disablement Grant
Experience, 1997 to 2001 53 38. Disablement & Death Benefit Awards &
Pensions in Payment, 1997 to 2001 53 39. Administrative & Total Expenditure –
IB Branch 54
40. Projected IB Branch Costs 54
ii

List of Charts
Page
1. Income By Major Category 1
2. Expenditure By Major Category 1
3. Income, Expenditure & Surplus 2 4. Contributions & Expenditure as a % of
Insurable Wages 2
5. Reserve-Expenditure Ratio 2
6. Yield on Reserves 3 7. Proportional Distribution of Benefit
Expenditure 3 8. Administrative Expenditure as % of
Contribution Income 3
9. Projected Bahamas Population 8 10. Economic Status of Projected
Population Aged 16 & Over 10
11. Projected NIB Reserves 12
12. Reserve-Expenditure Ratio 12
13. # of Contributors Per Pensioner 14 14. Projected Contribution Rates –
Intermediate Scenario 15
15. Assistance Awards, 1990 to 2001 23
16. NIB Investments, Dec, 2001 31
17. NIB’s Holdings of BGRS 31
18. Projected Coverage Rates 43
iii

iv

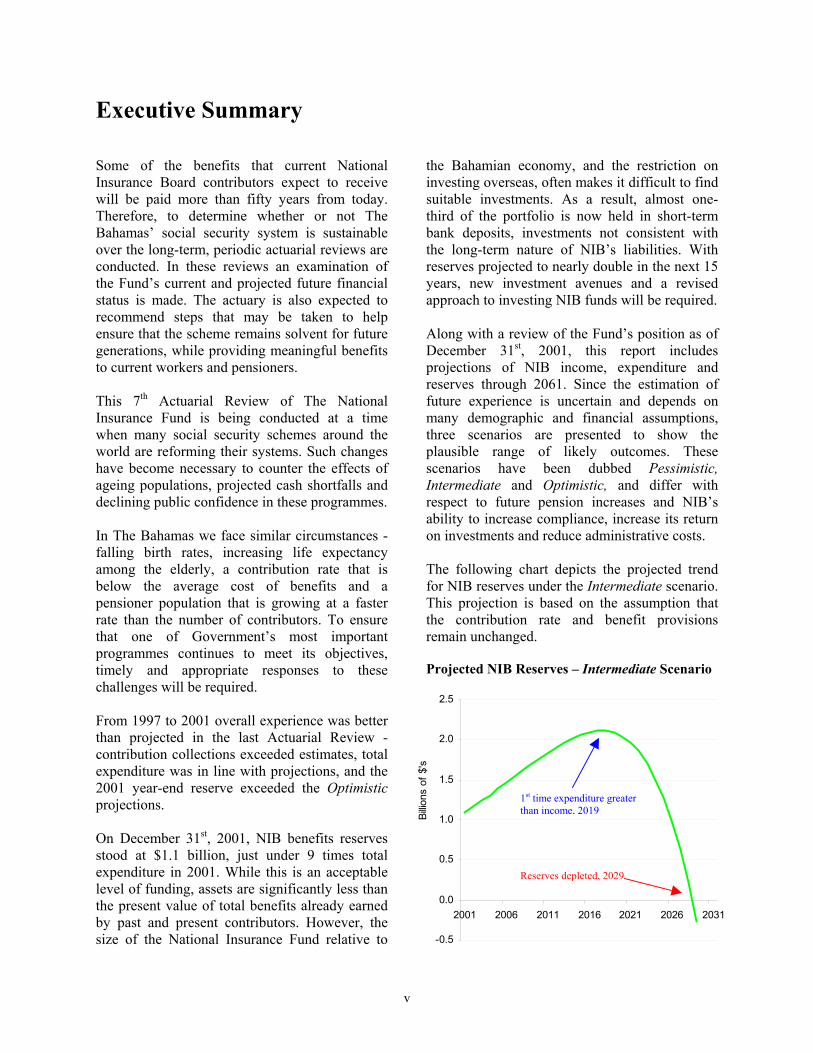
ExecutiveSummary

Executive Summary Some of the benefits that current National Insurance Board contributors expect to receive will be paid more than fifty years from today. Therefore, to determine whether or not The Bahamas’ social security system is sustainable over the long-term, periodic actuarial reviews are conducted. In these reviews an examination of the Fund’s current and projected future financial status is made. The actuary is also expected to recommend steps that may be taken to help ensure that the scheme remains solvent for future generations, while providing meaningful benefits to current workers and pensioners. This 7th Actuarial Review of The National Insurance Fund is being conducted at a time when many social security schemes around the world are reforming their systems. Such changes have become necessary to counter the effects of ageing populations, projected cash shortfalls and declining public confidence in these programmes. In The Bahamas we face similar circumstances - falling birth rates, increasing life expectancy among the elderly, a contribution rate that is below the average cost of benefits and a pensioner population that is growing at a faster rate than the number of contributors. To ensure that one of Government’s most important programmes continues to meet its objectives, timely and appropriate responses to these challenges will be required. From 1997 to 2001 overall experience was better than projected in the last Actuarial Review - contribution collections exceeded estimates, total expenditure was in line with projections, and the 2001 year-end reserve exceeded the Optimistic projections. On December 31st, 2001, NIB benefits reserves stood at $1.1 billion, just under 9 times total expenditure in 2001. While this is an acceptable level of funding, assets are significantly less than the present value of total benefits already earned by past and present contributors. However, the size of the National Insurance Fund relative to
the Bahamian economy, and the restriction on investing overseas, often makes it difficult to find suitable investments. As a result, almost one-third of the portfolio is now held in short-term bank deposits, investments not consistent with the long-term nature of NIB’s liabilities. With reserves projected to nearly double in the next 15 years, new investment avenues and a revised approach to investing NIB funds will be required. Along with a review of the Fund’s position as of December 31st, 2001, this report includes projections of NIB income, expenditure and reserves through 2061. Since the estimation of future experience is uncertain and depends on many demographic and financial assumptions, three scenarios are presented to show the plausible range of likely outcomes. These scenarios have been dubbed Pessimistic, Intermediate and Optimistic, and differ with respect to future pension increases and NIB’s ability to increase compliance, increase its return on investments and reduce administrative costs. The following chart depicts the projected trend for NIB reserves under the Intermediate scenario. This projection is based on the assumption that the contribution rate and benefit provisions remain unchanged.
Projected NIB Reserves – Intermediate Scenario
-0.5
0.0
0.5
1.0
1.5
2.0
2.5
2001 200
Billio
ns o
f $'s
v
Reserves depleted, 2029
1st time expenditure greater than income, 2019
6 2011 2016 2021 2026 2031

The key results of the Intermediate scenario projections are: The ageing of the general population will
have a major impact on the ratio of workers to retirees. It is projected that the number of NIB contributors for each pensioner will fall from 4.8 in 2001 to 1.5 in 2061. For the entire projection period annual
expenditure is projected to exceed that year’s contribution income. Benefit expenditure will increase from 1.9%
of GDP in 2001 to 8.4% of GDP in 2061. Reserves are expected to begin decreasing in
2019, when total expenditure will exceed total income for the first time. Ten years later in 2029, reserves are projected to become exhausted. The pay-as-you-go-rate in 2029, or the rate
required to produce just enough contribution income to meet expenditure if there is no Fund, will be 17.1%. This rate will increase gradually to almost 25% in 2061. Between 2001 and 2061 the present value of
total expenditure is projected to exceed the present value of contributions plus current assets by $3.4 billion. The contribution rate beginning 2003 that
will make the present value of contributions equal to the present value of expenditure through 2061 is 15.5%.
For the Pessimistic scenario, the first cash flow deficit is expected in 2014 with Fund depletion in 2025, while under Optimistic assumptions, expenditure is projected to exceed income beginning in 2023 with Fund depletion in 2034. These results, although slightly more optimistic, are consistent with those presented in the last Actuarial Review. They indicate that under all reasonable scenarios, depletion of reserves is expected within 35 years unless reforms are made. They also show that the contribution rate in the future will have to be much higher than the present average combined rate of 8.4%. Therefore, if NIB is to meet its commitments to future generations of pensioners, higher contribution rates and/or reduced benefit promises will be required.
Recommendations
Several recommendations are made throughout this report and are summarised as follows:
(a) Review the level of the insurable wage ceiling and include in National Insurance Regulations when and by how much the ceiling, and all pensions in payment, will be increased. (Presently, the Government determines when changes are made.) These adjustments should occur annually and reflect the increases in either official wage or price indexes, as are commonplace in social security schemes in developed countries. Frequent and predictable adjustments will ensure that insurance coverage and the purchasing power of pensions keep pace with inflation, enhancing the scheme’s overall effectiveness. (Sections 4.1 & 4.2)
(b) Gradually increase the contribution period required to qualify for a Retirement pension from 3 years to 10 years. For those persons who fail to meet revised minimum contribution requirements a one-time grant should be payable. (Section 4.3)
(c) Gradually increase the number of years over which wages are averaged for calculating pensions so that pension amounts more closely reflect earnings over one’s career, and not just over only the three years with greatest earnings. (Section 4.4)
(d) Consider paying more than just the greater of Retirement benefit and Survivors benefit where the widowed spouse has earned his/her own pension. The current practice of paying only the higher pension may cause the survivor’s standard of living to fall following the spouse’s death. (Section 4.5)
(e) Ensure that the income test applied to non-contributory pensioners is strictly adhered to so that only those who are truly eligible receive assistance payments. (Section 4.6)
(f) Review the terms under which pensionable civil servants participate in the National Insurance programme with an objective of enacting similar provisions for all insured persons. The $110 per week contribution ceiling has been fixed since 1974 and the
vi

Retirement pension payable to a 60-year old, career pensionable civil servant in 2002 is only $5 more than the monthly non-contributory pension. To avoid excessive combined NIB & Government pensions, concurrent changes should also be made to the Pensions Act. Also, Government’s policy of paying full salary when its employees receive NIB Sickness and Maternity benefits should be reviewed. Such payments accounted for over $4 million in 2001. (Section 4.7)
(g) Initiate a comprehensive review of NIB’s Act & Regulations. This review should ensure that all provisions are relevant to prevailing socio-economic conditions and that legislation is consistent with current practice, intent, and other Bahamian laws. Obsolete provisions should be removed and the language simplified. Once completed, the present Act and Regulations should be repealed and replaced with new editions. (Section 4.9)
(h) Approve and adopt an Investment Policy Statement for the investment of the Board’s assets and seek new investment avenues for surplus funds, both locally and abroad. The proportion of short-term deposits should be reduced and replaced with long-term investments. Membership of the Investment Committee should include investment specialists and the Committee should have delegated authority. Consideration should also be given to outsourcing the management of a portion of NIB’s investment portfolio. (Chapter 5)
(i) Reduce significantly the amount spent on administrative expenses. Although declining in recent years, operating costs remain too high, accounting for 19.2% of contribution income in 2001. The most effective ways of achieving lower costs would be reductions in staff size and adopting new approaches to providing adequate service to customers in the Family Islands. An appropriate medium-term goal for administrative costs is 10% of contribution income. (Section 4.10)
(j) Transfer $50 million from the Medical Benefits Branch to the Pensions Branch and
identify specific projects to be funded from remaining reserves. In addition to using Medical Benefits Branch reserves to develop health infrastructure, funds may be allocated to studying the social and financial effects of specific illnesses, such as obesity and HIV/ AIDS, and funding preventive programmes. (Section 4.11)
(k) Change the percentages of contribution income allocated to the Short-term and Industrial Benefits Branches from 16.5% to 18.5% and from 8.5% to 6.5%, respectively. This will ensure that each branch’s income closely reflects expected expenditure. The Death and Disablement Reserve should be eliminated and the accounting method for Industrial pensions changed. A total of $85 million should be transferred from the Death and Disablement Branch and the Industrial Benefits Branch to the Pensions Branch. These transfers and re-allocations only affect internal accounting procedures and will have no impact on NIB’s long-term finances. (Appendix IV)
(l) Provide to all past and current contributors annual contribution statements that indicate past contributions, their benefit eligibility status and what, if any, additional contributions are required to qualify for certain benefits. Through this statement, insured persons would know their benefit status and be better prepared to plan for retirement. Compliance levels should also be enhanced, as employers would be more likely to quickly hand over contributions deducted from employees’ wages. Queries made by insureds will also cause an improvement in the completeness of NIB’s database, ensuring that pensioners ultimately receive the correct pension. (Section 4.12)
(m) Initiate extensive public relations campaigns aimed at increasing general awareness of National Insurance, the benefits offered and the need to plan for retirement. Emphasis should also be placed on encouraging self-employed persons to contribute. The public should be properly informed of NIB’s future challenges and the likely reforms that will be required. These campaigns would be an ideal
vii

precursor to public hearings aimed at obtaining ideas on practical ways of ensuring that NIB remains adequately funded, indefinitely. (Sections 4.8 & 4.13)
The projection results highlighted in this report are not unlike those of similarly designed social security schemes in the United States, Canada, Europe and the Caribbean. In the U.S., for example, where the contribution rate is 12.4% for pensions (6.2% in The Bahamas) the Social Security Trust Fund is projected to incur its first deficit in 2017, and be exhausted in 2041. Recently, a Presidential Commission established to study, report and make recommendations to modernise and strengthen the US social security system presented its report that is now being reviewed by Congress and the President. In Canada, where retirement benefits are only 25% of career average earnings, major changes were made in 1998 following broad consultation with Canadians. After several benefit reforms, increases to the contribution rate and new approaches to the way assets are invested, projections now suggest that a contribution rate of 9.8% will be sufficient to sustain the Canada Pension Plan indefinitely. Similar in-depth research leading to reforms is necessary in The Bahamas. With an average contribution rate of 8.4% for all benefits, the National Insurance programme is financially unsustainable. This rate is only slightly more than half of the average cost of benefits payable over the next 60 years (15.5% under the Intermediate scenario.) Meantime, pension provisions are relatively generous, changes to key contribution and benefit provisions are not automatic and administrative costs are too high. Key to ensuring that NIB remains responsive to social and economic conditions is legislating the timing and amount of pension increases and adjustments to the insurable wage ceiling. Presently the Government decides the timing and amount of each adjustment. While there has been no blatant abuse of these powers, the failure to increase the ceiling regularly and the granting of pension increases that exceeded inflation have
resulted in low insurance coverage for extended periods, extra long-term costs to the scheme and inequitable pensions. The National Insurance Board is presently not in crisis. Ignoring the long-term projections of this and previous actuarial reviews, however, will exacerbate future financial challenges and weaken our social security system. Instead of making amendments that will merely postpone depletion of reserves by a few years, Government is encouraged to initiate changes that will bring long-term sustainability to the Fund. In deciding what changes are appropriate, a long-term perspective is required with consideration given to the following two questions: (i) What is the maximum contribution rate that
would be acceptable to workers and employers 10, 20 and 50 years from now?
(ii) If benefit promises have to be reduced to avoid excessive contribution rates, what redesigned benefit package will provide equitable, adequate and affordable pensions?
Before making major changes wide-ranging and frank discussions with Bahamians should be held. A consultative committee made up of politicians from both government and opposition, as well as leaders of key stakeholder groups, should be formed. Their mandate should include reviewing the programme’s objectives, analysing reforms adopted in other countries, listening to contributors and pensioners, and recommending practical ways of securing NIB pensions for future generations. As the population ages and more persons become pensionable, NIB’s role as a provider of income security in retirement will be more vital than it is today. Additional national and personal savings must be encouraged and contributors’ confidence in NIB’s promise of a Retirement benefit should not be allowed to erode. Decisive action and tough decisions are required. The alternatives will be more costly - high contribution rates, reductions in benefits and/or increased government subsidies. The time to act is now.
viii

MainReport


Chapter 1 Review Of Financial Experience and Other Activities 1.1 Financial Experience, 1975 –
2001 The National Insurance Board began operations in October 1974. Since then, the growth of contributions, benefits and reserves have for the most part, been consistent with initial
expectations. Annual surpluses each year have led to increasing reserves that at the end of 2001, stood at $1.1 billion. Following are eight charts that illustrate NIB’s financial experience in several key aspects during its first 27 years.
Chart 1. Income By Major Category
The primary source of income remains contributions. Ceiling increases in 1984 and 1999 account for the larger increases in those years. Increases in collections are generally expected each year due to more employed persons, higher wages and/or improving compliance. As NIB reserves increase investment income has become a significant part of total income, adding to funds that will be available to pay benefits in the future. Other income represents the grant received from the Consolidated Fund that offsets part of the non-contributory pensions.
Chart 2. Expenditure By Major Category NIB offers three main types of benefits – Short-term, Industrial and Pensions. Short-term benefits are payable for sickness, maternity and funeral. Pensions, which represent the largest and fastest growing category, include both contributory and non-contributory (assistance) benefits. Industrial benefits, which were introduced in 1981, cover benefits related to injuries sustained due to employment accidents. Note: Administrative expenditure in the chart includes small amounts classified in financial statements as “other” expenditure.
Contribution Income
Investment Income
Other Income
-
20
40
60
80
100
120
140
160
180
200
1975 1980 1985 1990 1995 2000
Mill
ions
Pensions
Administrative Expenditure
-
20
40
60
80
100
120
140
1975 1980 1985 1990 1995 2000
Mill
ions
Short-term Benefits
Industrial Benefits
1
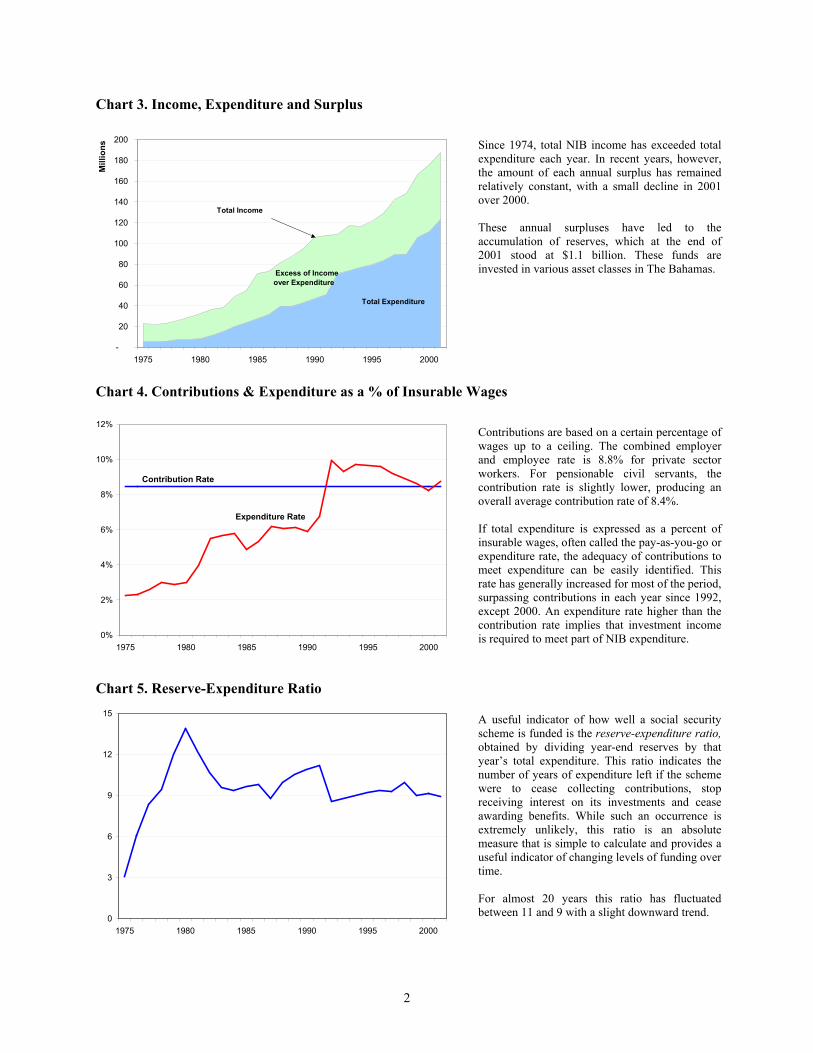
Chart 3. Income, Expenditure and Surplus
Since 1974, total NIB income has exceeded total expenditure each year. In recent years, however, the amount of each annual surplus has remained relatively constant, with a small decline in 2001 over 2000. These annual surpluses have led to the accumulation of reserves, which at the end of 2001 stood at $1.1 billion. These funds are invested in various asset classes in The Bahamas.
Chart 4. Contributions & Expenditure as a % of Insurable Wages
Contributions are based on a certain percentage of wages up to a ceiling. The combined employer and employee rate is 8.8% for private sector workers. For pensionable civil servants, the contribution rate is slightly lower, producing an overall average contribution rate of 8.4%. If total expenditure is expressed as a percent of insurable wages, often called the pay-as-you-go or expenditure rate, the adequacy of contributions to meet expenditure can be easily identified. This rate has generally increased for most of the period, surpassing contributions in each year since 1992, except 2000. An expenditure rate higher than the contribution rate implies that investment income is required to meet part of NIB expenditure.
Chart 5. Reserve-Expenditure Ratio A useful indicator of how well a social security scheme is funded is the reserve-expenditure ratio, obtained by dividing year-end reserves by that year’s total expenditure. This ratio indicates the number of years of expenditure left if the scheme were to cease collecting contributions, stop receiving interest on its investments and cease awarding benefits. While such an occurrence is extremely unlikely, this ratio is an absolute measure that is simple to calculate and provides a useful indicator of changing levels of funding over time. For almost 20 years this ratio has fluctuated between 11 and 9 with a slight downward trend.
Excess of Income over Expenditure
Total Expenditure
-
20
40
60
80
100
120
140
160
180
200
1975 1980 1985 1990 1995 2000
Mill
ions
Total Income
0%
2%
4%
6%
8%
10%
12%
1975 1980 1985 1990 1995 2000
Contribution Rate
Expenditure Rate
0
3
6
9
12
15
1975 1980 1985 1990 1995 2000
2

Chart 6. Yield on Reserves As the Fund has grown and market interest rates have generally declined, NIB’s return on investments has also declined over the past 15 years. However, changes in the Consumer Price Index (inflation) have been low over the past decade, resulting in acceptable real rates of return. Nominal Rate of Return 2001 6.25% Last 5 years 6.61% Last 10 years 6.91% Real Rate of Return 2001 4.25% Last 5 years 5.25% Last 10 years 4.96%
Chart 7. Proportional Distribution of Benefit Expenditure In 1974, NIB inherited the Assistance programme from Government and in the early years, this made up the greatest portion of expenditure. With the number of persons receiving assistance declining and more persons qualifying for larger contributory pensions, there has been a gradual decline in the relative size of assistances and an increase in contributory pensions. In recent years short-term benefits represented between 15% and 20% of benefit expenditure with Industrial benefits accounting for less than 8%.
Chart 8. Administrative Expenditure as % of Contribution Income
Since 1987 when there was a steep increase in staff strength, administrative costs have consumed between 18% and 27% of contribution income. By regional and international standards this is very high. While there has been some reduction in the expense ratio in recent years, most of the decrease is attributable to the increases in contribution income that have exceeded the rate of increase in administrative expenditure.
30%
0%
2%
4%
6%
8%
10%
12%
1975 1980 1985 1990 1995 2000
Non-contributory Pensions
Short-term Benefits
Industrial Benefits
Contributory Pensions
0%
20%
40%
60%
80%
100%
1975 1980 1985 1990 1995 2000
0%
5%
10%
15%
20%
25%
1975 1980 1985 1990 1995 2000
3

1.2 Activities Since The Last Actuarial Review
The last Actuarial Review of the National Insurance Fund was performed as of December 31st, 1996. Since then several amendments to the National Insurance Act & Regulations took effect. Also, better than expected financial experience, especially contribution collections, has produced a 2001 year-end reserve that exceeded both the Main and Optimistic projections of the last Review. 1.2.1 Amendments To Act & Regulations Following the presentation of the 1996 Actuarial Review to Government, several amendments to the National Insurance Act & Regulations were passed by Parliament. These changes took effect in January 1999 and were designed to increase insurance coverage to higher paid persons, adjust pensions to compensate for inflation, improve several benefit provisions and make certain areas of the law more relevant to current needs. The following list summarises the changes that have a direct financial impact on the Fund. i. The ceiling on insurable wages was
increased from $250 to $400 per week, the first adjustment since 1984;
ii. Pensions in payment were increased by 10% with a $20 increase to minimum pensions in both January 1999 and July 2001;
iii. Non-contributory assistance pensions were increased from $160 to $180 per month in January 1999 and to $200 in July 2001;
iv. The funeral grant was increased from $1,000 to $1,500;
v. The maternity grant was increased from $250 to $400;
vi. Eligibility requirements for Maternity grant were relaxed to allow women to qualify without first qualifying for Maternity benefit;
vii. The reduction factors applied to pensions for persons claiming Retirement benefit between age 60 and 64 were changed to 4% for each year below age 65 for a maximum reduction of 20% at age 60; (Previous reductions were
not the same for each year below 65 and the former age 60 reduction was 25%)
viii. The amount of employment income that Retirement pensioners under 70 could earn (either through employment or self-employment) and still receive their pension was increased from $120 to $200; (there is no longer a limit for pensioners 70 and over)
ix. Several changes to the eligibility conditions for Survivors benefit were made, the most significant being similar qualifying conditions for both widows and widowers;
x. The maximum age that children pursuing full-time education could continue to receive Survivors benefit was raised from 18 to 21;
xi. A Disablement pensioner who requires constant care and attendance is now awarded an additional 20% of the benefit;
xii. A new maximum period of 40 weeks, or 2 years if the degree of disablement exceeds 25%, during which Medical Care shall be paid, was introduced;
A summary of NIB’s key coverage, contribution and benefit provisions is provided in Appendix I. 1.2.2 Financial Experience The following table provides a summary of income and expenditure for 1997 to 2001. Additional details may be found in Appendix V. Table 1. Summary of Finances, 1997 - 2001
1997 1998 1999 2000 2001
IncomeContributions 81.5 84.8 103.7 114.0 118.5 Investment 55.4 58.2 57.6 59.3 64.2 Other 5.1 5.4 5.1 5.0 5.0 Total 141.9 148.5 166.5 178.3 187.7
ExpenditureBenefits 65.5 68.5 82.6 88.7 94.8 Administrative 19.8 19.9 22.0 21.2 22.8 Other 3.9 1.2 1.2 1.3 5.4 Total 89.2 89.7 105.8 111.2 123.1
Surplus 52.7 58.8 60.7 67.1 64.7
831.0 890.2 951.4 1,019.0 1,097.9 Benefits ReservesAmounts are in millions of $’s
4

Following is a brief comparison of actual experience during the past five years with the projections of the last Actuarial Review. Due to a combination of increased
employment, higher wages, improved compliance and an increase in the contribution ceiling from $250 to $400 per week in 1999, contribution collections were higher than projected. Investment income fell short of projections,
due mainly to the ¾% fall in the Prime Rate in July 1999. (Just over one-half of NIB’s assets have rates of return that are tied to Prime.) Also, the unavailability of suitable long-term investments which led to increased deposits at commercial banks and sometimes significant amounts yielding no interest, further contributed to lower returns on reserves – average of 6.6% over the 5-year period, falling from 7.1% in 1997 to 6.25% in 2001. Total benefit expenditure was slightly higher
than expected due to increases in pensions in 1999 and 2001. Increases in administrative expenditure were
less than projected, with an average annual increase of 3% versus the 5% increase assumed. However, the expense rate continues to be well above acceptable levels consuming between 19% and 24% of contribution income during the review period.
1.3 Investment Portfolio At the end of 2001, National Insurance investments (including cash) stood at $1.088 billion, up from $770 million at the end 1996. During the review period, no new major types of investments were introduced. With few other opportunities available, the amount held in fixed deposits increased 3.6 times while there has been a significant reduction in the proportion held in
Bahamas Government and Government-backed securities – 82.2% in 1996 to 58.9% in 2001. When the operations of Gulf Union Bank were suspended in 1997 NIB deposits with the bank stood at $2.8 million. As of August 2002, 10% of this deposit has been reimbursed and it is anticipated that another 15% will be recovered. Loans made to the Water and Sewerage Corporation (1984 and 1987) and Bahamasair (1989) remain in default. While only the loans to the Water & Sewerage Corporation are backed by a Government guarantee, The Bahamas Government has indicated its intention to make good both loans. An analysis of National Insurance Fund investments at the end of December 2001 reveals the following:
47.8% of the portfolio was held directly in Government of Bahamas securities. 11.3% of investments were either Bahamas
Government Corporation bonds or loans. Most of these have Bahamas Government guarantees. Almost 30% of the investments were held in
cash & fixed deposits, a small portion of which was in non-interest bearing accounts at the Central Bank of The Bahamas. This is a major change from 1996 when only 12% of the portfolio was held in short-term deposits. Equities made up less than 1% of the
portfolio. All of the Fund’s investments are domiciled
in the Bahamas. The asset mix of the investment portfolio, by major category, at year-ends 2001 and 1996 is presented in the following table. A more detailed analysis and discussion of NIB investments, along with recommendations for enhancing the portfolio’s yield, diversification, asset-liability match and overall management may be found in Chapter 5.
5
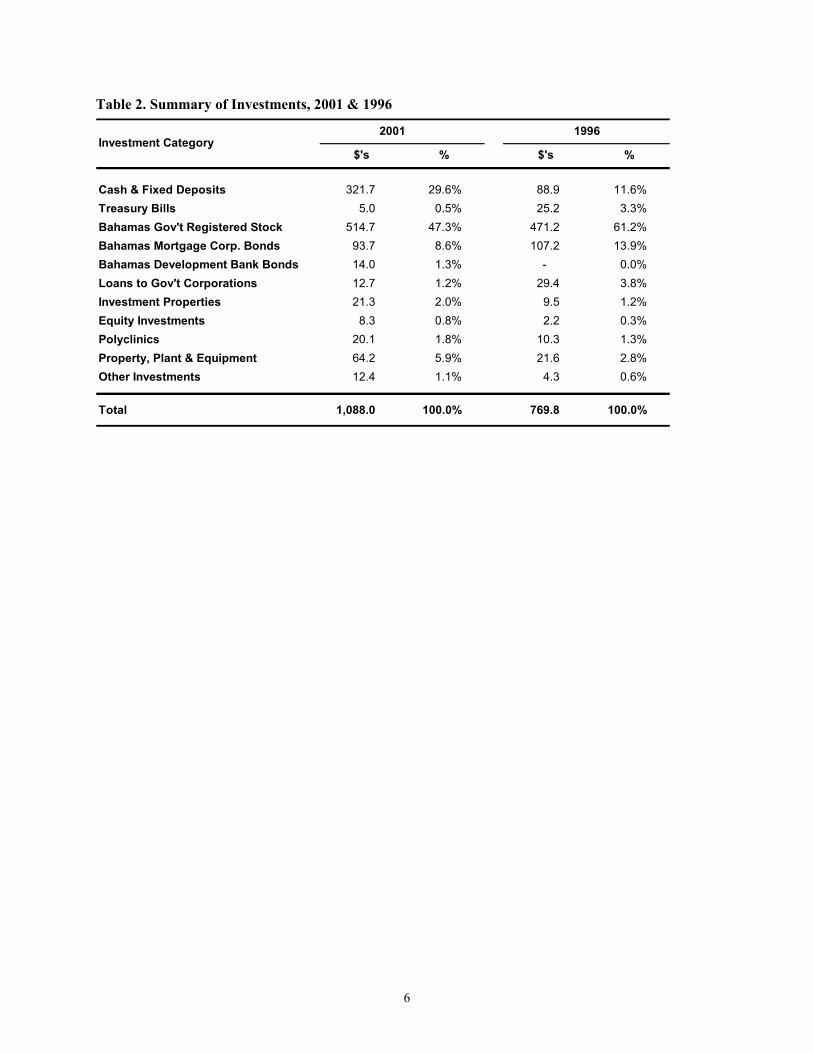
Table 2. Summary of Investments, 2001 & 1996
Cash & Fixed Deposits 321.7 29.6% 88.9 11.6%Treasury Bills 5.0 0.5% 25.2 3.3%Bahamas Gov't Registered Stock 514.7 47.3% 471.2 61.2%Bahamas Mortgage Corp. Bonds 93.7 8.6% 107.2 13.9%Bahamas Development Bank Bonds 14.0 1.3% - 0.0%Loans to Gov't Corporations 12.7 1.2% 29.4 3.8%Investment Properties 21.3 2.0% 9.5 1.2%Equity Investments 8.3 0.8% 2.2 0.3%Polyclinics 20.1 1.8% 10.3 1.3%Property, Plant & Equipment 64.2 5.9% 21.6 2.8%Other Investments 12.4 1.1% 4.3 0.6%
Total 1,088.0 100.0% 769.8 100.0%
%$'s
1996Investment Category
$'s %
2001
6

Chapter 2 Population & Economic Projections To best estimate future National Insurance income and expenditure, projections of The Bahamas’ total population and future economic activity are required. Population projections provide estimates of the number of persons who will make up the labour force and likely NIB contributors, while projections of gross domestic product (GDP) and worker productivity growth indicate how many workers are needed in the economy and what their likely incomes will be. This chapter presents only a summary of the assumptions and projection results. Further details may be found in Appendix II. 2.1 Population Projections The official results of the last national census indicate a population of 303,611 persons in May 2000, compared with 255,049 in 1990. This increase of almost 50,000 persons exceeds the difference between reported births and deaths, indicating average net immigration during the 10-year period of approximately 325 persons per annum. The trend of decreasing birth rates continues. The total fertility rate, or the average number of children each woman of childbearing age would have if she had all her children in a particular year, has fallen from 3.2 in 1980, to 2.5 in 1990
and to 2.0 in 2000. (A total fertility rate of 2.1 is considered replacement rate.) No official estimates of life expectancy have been published since 1992. However, the number of recorded deaths in recent years suggests worsening mortality during the 1990’s, due mainly to the growing prevalence of HIV/AIDS. However, there has been continued improvement in infant mortality. The key assumptions for the population projections made for this report, described in detail in Appendix II, can be summarised as follows:
The total fertility rate will decline from 2.0 in 2000 to 1.85 in 2020, remaining constant thereafter. Annual net immigration of 0.12% of the total
population – about 370 in 2002 Mortality rates improve at a moderate pace
throughout the projection period, with deaths due to HIV & AIDS limiting usual life expectancy improvements.
The following chart presents the projected total population for the Bahamas up to 2061, split into three major age categories. The changes in the relative size of each age group illustrate the gradual ageing of the total population.
7
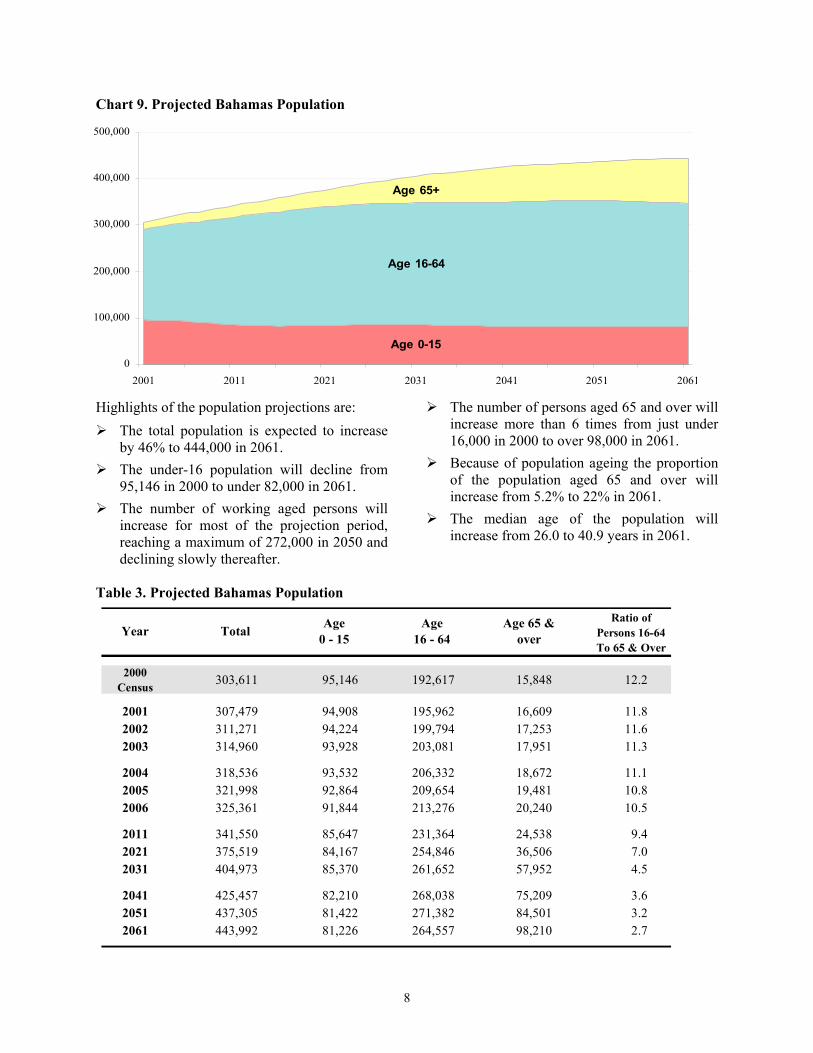
Chart 9. Projected Bahamas Population
Age 0-15
Age 16-64
Age 65+
0
100,000
200,000
300,000
400,000
500,000
2001 2011 2021 2031 2041 2051 2061
Highlights of the population projections are: The total population is expected to increase
by 46% to 444,000 in 2061. The under-16 population will decline from
95,146 in 2000 to under 82,000 in 2061. The number of working aged persons will
increase for most of the projection period, reaching a maximum of 272,000 in 2050 and declining slowly thereafter.
The number of persons aged 65 and over will increase more than 6 times from just under 16,000 in 2000 to over 98,000 in 2061. Because of population ageing the proportion
of the population aged 65 and over will increase from 5.2% to 22% in 2061. The median age of the population will
increase from 26.0 to 40.9 years in 2061.
Table 3. Projected Bahamas Population
2000 Census 303,611 95,146 192,617 15,848 12.2
2001 307,479 94,908 195,962 16,609 11.8 2002 311,271 94,224 199,794 17,253 11.6 2003 314,960 93,928 203,081 17,951 11.3
2004 318,536 93,532 206,332 18,672 11.1 2005 321,998 92,864 209,654 19,481 10.8 2006 325,361 91,844 213,276 20,240 10.5
2011 341,550 85,647 231,364 24,538 9.4 2021 375,519 84,167 254,846 36,506 7.0 2031 404,973 85,370 261,652 57,952 4.5
2041 425,457 82,210 268,038 75,209 3.6 2051 437,305 81,422 271,382 84,501 3.2 2061 443,992 81,226 264,557 98,210 2.7
Age 65 & overYear Total Age
0 - 15Age
16 - 64
Ratio of Persons 16-64 To 65 & Over
8

Presently, the Bahamian population is relatively young. However, between 2000 and 2061, the number of working aged persons for each person of pension age is projected to decrease from 12.2 to 2.7. For the National Insurance Board, where pension payments to the elderly already represent more than half of benefit payments, and contributions from workers are needed to meet expenditure, population ageing has significant long-term consequences. Population ageing will also create major challenges for the Bahamas Government, as a larger and older society will place increased and different demands on physical infrastructure, health and other social programmes. Proactive measures by both Government and the National Insurance Board, therefore, are required to ensure that the needs of future generations will be sufficiently met. 2.2 Economic & Labour Market
Projections As contribution income is primarily based on the earnings of employed persons, economic and labour market activity directly affect NIB finances. Projections of the economy and labour force are necessary, therefore, to estimate the number of employed persons and total insurable earnings in each projection year. During the last 5 years the Bahamian economy has averaged annual real GDP growth rates of 3% to 3.5%, with 2001 being the first year with negative growth for almost 10 years. Unemployment rates have declined in recent years to a low of 6.9% in 2001, and the rate of inflation has been low, averaging 2% over the past 10 years. While there is no official Bahamian wage index, National Insurance contribution records, Department of Statistics household surveys and results of the 1990 and 2000 censuses suggest that average wages have increased at rates higher than the rate of inflation during the 1990’s. The economic projections prepared for this report assume stable and positive GDP growth and
labour productivity in all years. Although simplistic, they approximate usual economic cycles and volatility that encompass periods of expansion and recession. They also account for projected increases in the population and labour force that will provide the capacity for additional production through more workers and increased productivity. Meantime, age-specific labour force participation rates are assumed to increase at advanced ages for males and all ages for females. These increases are expected as older workers remain in the workforce longer, fertility rates fall and possible labour shortages emerge. Table 4 below provides a summary of the principal economic assumptions with details presented in Appendix II. Table 4. Principal Economic Assumptions
Average Real GDP Growth During Each Period
2002 – 05 2.25% p.a. 2006 –10 2.75% ” 2011 – 20 2.25% ” 2021 – 61 1.75% ”
Labour Productivity Growth
1% p.a.
Inflation 2% in 2002 increasing to 2.5% p.a. in 2005, constant thereafter
Nominal Wage Increases 3.5% p.a.
Similar to the population projections results, the economic and labour market projections suggest increasing employment for most of the projection period. As the population ages, the number of inactive persons over age 15 increases quite rapidly, while the number of unemployed persons is expected to remain relatively stable, with unemployment rates between 5% and 8%. Chart 10 shows the projected over-15 population, separated into the following three main labour market categories: (i) employed persons, (ii) unemployed persons, and (iii) inactives (those 16 and over who are not
seeking employment - mainly the elderly.)
9

Chart 10. Economic Status of Projected Population Aged 16 & Over 50,
Employed
Unemployed
Inactive
-
000
100,000
150,000
200,000
250,000
300,000
350,000
400,000
2001 2011 2021 2031 2041 2051 2061
Of the employed population shown above, over 80% are expected to be regular NIB contributors each year. After several years of improving compliance, contributions are now being received from approximately 95% of employed persons and 17% of self-employed persons. This suggests that between 25,000 and 30,000 of the estimated 150,000 employed persons do not contribute to NIB. While most of those not complying are self-employed, workers of small businesses represent the main category of employed persons for whom contributions are not been made. In projecting future NIB contributors the following assumptions have been made:
The portion of employed persons making NIB contributions will increase from 81% to 86% over the projection period; The number of pensionable civil servants
will increase slightly over the projection period.
Many factors, both domestic and international, will impact future population levels, economic activity, and NIB’s finances. To keep this report relatively simple, only one set of population, labour market and economic projections are presented. Therefore, the assumptions adopted reflect expectations that may be considered intermediate – that is, neither overly optimistic nor overly pessimistic. For the National Insurance financial projections presented in the following chapter, three scenarios have been used with varying assumptions for the factors over which NIB and Government have some control. If additional population and economic scenarios were modelled, it is fair to conclude that NIB financial results would be more favourable if a larger population and economy were projected, and less favourable if population and economic growth were lower.
10

Chapter 3 National Insurance Financial & Demographic Projections This chapter presents and analyses projections of NIB finances up to 2061. The purpose of these projections is twofold. First, they are used to identify long-term trends for contributions, benefits and the reserve, so that the financial viability of the National Insurance Fund may be assessed. Secondly, by using these projections as a base, the sensitivity of the results to changes in the assumptions, and/or contribution and benefit provisions, may be identified. Three sets of financial projections have been modelled and are dubbed Intermediate, Pessimistic and Optimistic. Also, to illustrate the effect of individual assumptions on overall results, several sensitivity tests have been performed using the Intermediate scenario. These projections are based on results of the population and economic projections presented in Chapter 2, several NIB-specific assumptions and the contribution and benefit provisions in place on January 1, 2002. While increases to the contribution ceiling and pensions in payment are not legislated, periodic adjustments are expected, and thus have been assumed. The main assumptions that have been made are:
The insurable wage ceiling will increase to $500 per week in 2004, with future increases each year in line with general wages; $4.9 million is received from the
Consolidated Fund each year for the payment of assistance pensions; Annual inflation of 2% in 2002 increasing to
2.5% per annum in 2005, and constant thereafter; Short-term Benefits Branch expenditure will
increase from 1.25% to 1.5% of insurable wages between 2002 and 2061; Industrial Benefits Branch expenditure,
excluding Disablement & Death benefits,
increases from 0.3% to 0.4% of insurable wages between 2002 and 2061; New awards of Old Age Non-contributory
pensions and Invalidity assistance will decline from 200 to 100 per year in 15 years, remaining constant thereafter; Pension increases, the yield on reserves, and
reductions in relative administrative costs are shown in the following table. For contribution collections, the rates shown for Pessimistic and Optimistic scenarios are relative to the Intermediate scenario.
Table 5. Scenario Assumptions
Pessimistic Intermediate Optimistic
2004 Pension Increase
10% 7% 5%
Annual Pension
Increases
Inflation + 1%
Inflation + ½%
Inflation + 0%
Yield on Reserves 5.0% 6.0% 7.0%
Contrib. Collections 3% less - 3% more
Decreasing linearly from 1.62% in 2001 to: Admin. Expenses as a % of
Ins. Wages
1.25% in 2021
0.75% in 2021
0.5% in 2021
3.1 Projection Results The results of these actuarial projections are generally consistent with those presented in the 1996 Actuarial Review. This time, however, projections have been performed for a longer period, 60 years. Projected NIB reserves under the three scenarios are illustrated in the following chart.
11
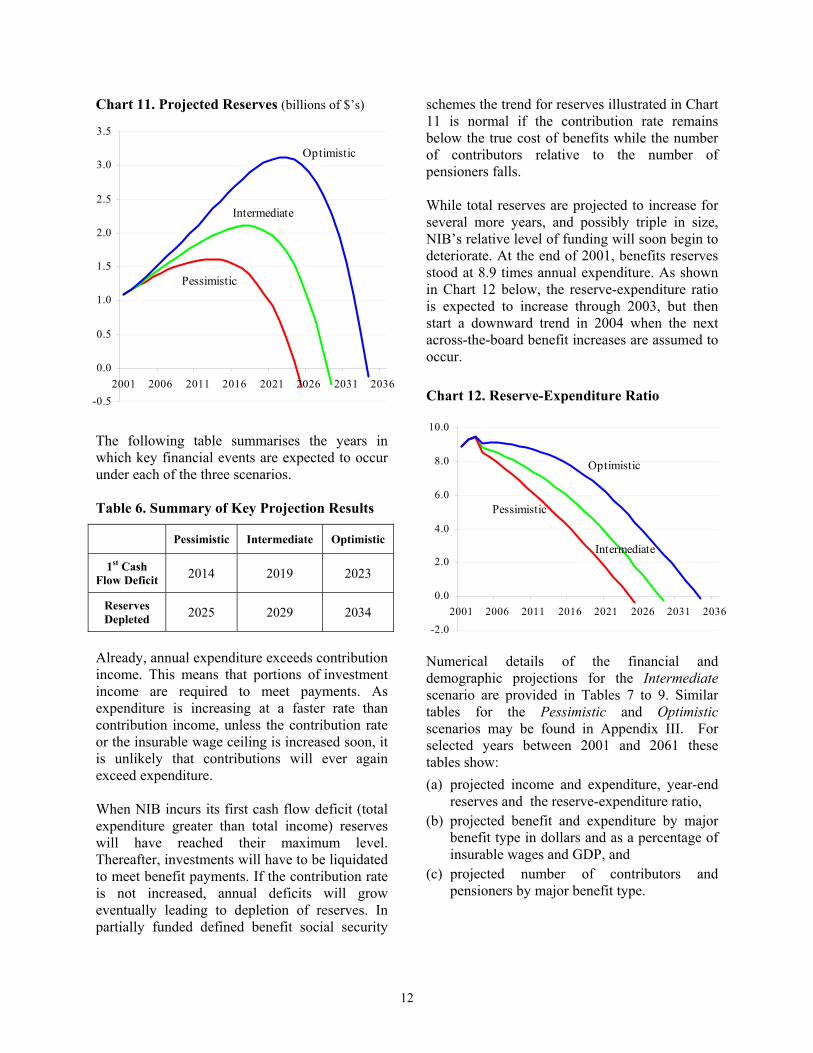
Chart 11. Projected Reserves (billions of $’s) The following table summarises the years in which key financial events are expected to occur under each of the three scenarios. Table 6. Summary of Key Projection Results
Pessimistic Intermediate Optimistic
1st Cash Flow Deficit 2014 2019 2023
Reserves Depleted 2025 2029 2034
Already, annual expenditure exceeds contribution income. This means that portions of investment income are required to meet payments. As expenditure is increasing at a faster rate than contribution income, unless the contribution rate or the insurable wage ceiling is increased soon, it is unlikely that contributions will ever again exceed expenditure. When NIB incurs its first cash flow deficit (total expenditure greater than total income) reserves will have reached their maximum level. Thereafter, investments will have to be liquidated to meet benefit payments. If the contribution rate is not increased, annual deficits will grow eventually leading to depletion of reserves. In partially funded defined benefit social security
schemes the trend for reserves illustrated in Chart 11 is normal if the contribution rate remains below the true cost of benefits while the number of contributors relative to the number of pensioners falls.
-0.5
0.0
0.5
1.0
1.5
2.0
2.5
3.0
3.5
2001 2006 2011 2016 2021 2026 2031 2036
Optimistic
Intermediate
Pessimistic
While total reserves are projected to increase for several more years, and possibly triple in size, NIB’s relative level of funding will soon begin to deteriorate. At the end of 2001, benefits reserves stood at 8.9 times annual expenditure. As shown in Chart 12 below, the reserve-expenditure ratio is expected to increase through 2003, but then start a downward trend in 2004 when the next across-the-board benefit increases are assumed to occur. Chart 12. Reserve-Expenditure Ratio 10. -2.0
0.0
2.0
4.0
6.0
8.0
0
2001 2006 2011 2016 2021 2026 2031 2036
Optimistic
Intermediate
Pessimistic
Numerical details of the financial and demographic projections for the Intermediate scenario are provided in Tables 7 to 9. Similar tables for the Pessimistic and Optimistic scenarios may be found in Appendix III. For selected years between 2001 and 2061 these tables show: (a) projected income and expenditure, year-end
reserves and the reserve-expenditure ratio, (b) projected benefit and expenditure by major
benefit type in dollars and as a percentage of insurable wages and GDP, and
(c) projected number of contributors and pensioners by major benefit type.
12

Table 7. Projected Cash Flows & Reserve, Intermediate Scenario (millions of $’s) Cash Outflow
TotalEnd of Year
2001 118.5 64.2 5.0 187.7 94.8 28.2 123.1 64.7 1,098 8.9
2002 122.3 67.5 5.0 194.8 101.9 23.9 125.9 68.9 1,166 9.3 2003 126.4 70.0 5.0 201.4 107.0 24.1 131.1 70.3 1,236 9.4 2004 146.2 74.2 5.0 225.4 122.4 26.9 149.3 76.2 1,312 8.8
2005 155.0 78.7 5.0 238.8 132.9 27.7 160.5 78.2 1,391 8.7 2006 163.1 83.3 5.0 251.4 144.6 28.2 172.8 78.7 1,469 8.5 2007 171.8 87.9 5.0 264.7 157.5 28.8 186.3 78.4 1,548 8.3
2011 209.6 105.3 5.0 320.0 220.0 30.5 250.5 69.5 1,843 7.4 2016 266.3 121.0 5.0 392.3 329.5 31.6 361.1 31.2 2,093 5.8 2021 333.5 117.2 5.0 455.7 497.7 30.7 528.4 -72.7 1,973 3.7
2026 415.4 67.0 5.0 487.5 740.3 38.0 778.2 -290.8 1,003 1.3 2031 515.7 -65.4 5.0 455.2 1,054.5 46.9 1,101.4 -646.2 -1,451 -1.3 2036 641.7 -327.1 5.0 319.5 1,444.1 58.1 1,502.2 -1,182.6 -6,213 -1.3
2041 795.7 -775.7 5.0 25.1 1,891.8 71.8 1,963.6 -1,938.5 -14,294 -7.3 2051 1,201.0 -2,575.0 5.0 -1,368.9 3,083.7 107.9 3,191.6 -4,560.5 -46,498 -14.6 2061 1,779.8 -6,646.4 5.0 -4,861.6 5,022.9 159.3 5,182.2 -10,043.8 -119,141 -23.0
Negative reserves indicate the indebtedness of the Fund and negative investment income is the current cost of servicing that debt.
YearBenefits
# of times current year's expenditure
Contribution Income
Investment Income Total
Other Income
Cash Inflow ReservesAdmin.&
Other Expenses
Surplus/ (Deficit)
Table 8. Projected Benefit & Assistance Expenditure– Intermediate Scenario (millions of $’s)
Retirement Invalidity Survivors Assistance Short-term Industrial GDP
2001 40.1 6.5 8.2 17.1 17.5 5.7 6.8% 1.9%
2002 43.4 7.0 9.5 17.3 18.7 6.0 7.0% 2.0%2003 47.0 7.6 10.4 16.9 18.8 6.4 7.1% 2.0%2004 54.5 8.8 12.2 17.6 21.8 7.4 7.1% 2.2%
2005 60.5 9.7 13.8 17.7 23.2 8.0 7.2% 2.3%2006 67.4 10.7 15.5 17.8 24.5 8.6 7.5% 2.3%2007 75.2 11.9 17.3 17.9 25.9 9.3 7.7% 2.4%
2011 114.8 17.7 24.4 18.6 32.0 12.5 8.8% 2.8%2016 190.3 28.3 32.7 19.1 41.4 17.7 10.4% 3.3%2021 315.0 43.1 42.7 19.8 52.7 24.5 12.6% 4.0%
2026 501.5 61.2 57.0 20.9 66.7 33.0 15.0% 4.9%2031 747.5 82.2 75.0 22.6 84.1 43.3 17.2% 5.6%2036 1,052.6 106.3 98.1 24.8 106.3 55.9 19.0% 6.3%
2041 1,396.1 134.6 128.2 27.7 133.8 71.2 20.0% 6.8%2051 2,301.5 220.3 202.8 35.8 208.2 115.1 21.6% 7.5%2061 3,823.6 354.9 297.2 47.6 317.6 182.0 23.8% 8.4%
Benefits as a % of: Year
Pensions & Benefits Insurable
Wages
13

Table 9. Projected Contributors & Pensioners at Year-end
Retirement Invalidity Widow(er)s Children
2001 121,030 10,687 1,716 1,940 2,608 8,081 446 25,478 4.8
2002 122,249 11,361 1,831 2,078 3,133 7,625 478 26,507 4.6 2003 124,054 12,192 1,934 2,215 3,567 7,416 512 27,836 4.5 2004 125,839 13,057 2,039 2,362 4,032 7,224 550 29,264 4.3
2005 128,266 13,935 2,147 2,519 4,506 7,046 588 30,741 4.2 2006 130,762 14,884 2,263 2,684 4,958 6,880 628 32,297 4.0 2007 133,249 15,885 2,386 2,853 5,359 6,724 668 33,876 3.9
2011 142,568 20,305 2,944 3,537 6,115 6,155 817 39,873 3.6 2016 152,756 27,271 3,793 4,327 5,543 5,443 981 47,359 3.2 2021 160,821 36,856 4,723 5,113 4,883 4,835 1,155 57,565 2.8
2026 168,252 48,381 5,585 5,929 4,691 4,401 1,335 70,323 2.4 2031 172,243 59,767 6,280 6,701 4,477 2,815 1,484 81,525 2.1 2036 175,903 69,542 6,783 7,433 4,384 3,898 1,600 93,640 1.9
2041 180,020 76,163 7,130 8,091 4,493 3,768 1,688 101,333 1.8 2051 185,122 85,458 7,868 8,821 4,343 3,634 1,844 111,969 1.7 2061 184,482 96,526 8,503 8,736 3,813 3,596 1,934 123,107 1.5
Ratio of Contributors to Pensioners
# of Contributors Year
Assistance
Total # of PensionersDeath &
Disablement
# of Pensioners
The projected ageing of the general population is also noticeable in NIB demographic projections. As shown above, the number of contributors is only expected to increase from 121,000 to 184,000, while the number of pensioners is projected to increase nearly 5 times, to 123,000. As NIB benefits are only partially funded future generations of contributors will help meet the benefit costs of previous generations. With the projected decline in the number of contributors to pensioners (see adjacent chart), and the expected trends for income and expenditure, future smaller generations of workers will be required to pay significantly higher contribution rates for the same benefits.
Chart 13. # of Contributors Per Pensioner 4.8
2.8
1.8 1.5 2061
2041
2021
2001
14

3.2 Projected Benefit Costs The cost of National Insurance benefits and administrative expenditure may be viewed from several perspectives. Firstly, each year’s total expenditure can be expressed as a percentage of that year’s insurable wages. This is often referred to as the pay-as-you-go rate and is the answer to the question “what contribution rate is required to exactly meet that year’s expenditure?” The second rate, called the general average premium, is the average level contribution rate required over the next 60 years to fully cover total expenditure during that period. In Chart 14 the relationships between the pay-as-you-go rate and the general average premium for the Intermediate scenario, and the present contribution rate, can be readily noted. Chart 14. Projected Contribution Rates -
Intermediate Scenario As shown above, the current average contribution rate of 8.4% is 7.1% below the general average premium of 15.5% (green line). The increasing pay-as-you-go curve indicates that from 2002, contribution income (blue line) will be insufficient to meet total expenditure (red line). Therefore, investment income, and eventually proceeds from the sale of assets, will be required to meet benefit payments and administrative costs. If the Fund becomes depleted, there would be no investment income, and thus contribution rates of almost 25% in 2061 would be required to meet current expenditure (red line).
The general average premium and pay-as-you-go rates are shown in Table 10. As expected, the Optimistic scenario indicates the lowest pay-as-you-go contribution rate, 22.5% in 2061, while the Pessimistic scenario produces a pay-as-you-go contribution rate of 26.9% in 2061. Table 10. Projected Contribution Rates
Pay-as-you-go Rate
Scenario General Average Premium
When Reserves Depleted
In 2061
Pessimistic 17.8% 16.8% (2025)
26.9%
Intermediate 15.5% 17.1% (2029)
24.5%
Optimistic 13.7% 17.7% (2034)
22.5%
Another measure of the financial sustainability of a social security system is called “actuarial balance”. For a given period, the actuarial balance can be defined as the difference between:
0%
5%
10%
15%
20%
25%
2001 2011 2021 2031 2041 2051 2061
Pay-as-you-go
Current Contribution Rate - 8.4%
General Average Premium - 15.5%
(1) the sum of the beginning reserves and the present value of future contributions (money available to meet expenditure), and
(2) the present value of future expenditure,
divided by the present value of future insurable earnings. This formula produces a rate that indicates the adequacy or insufficiency of the present contribution rate for a given period. The following table shows the calculation of actuarial balances for three periods. Table 11. Actuarial Balance ($’s are in billions)
2002 to 2021
2002 to 2041
2002 to 2061
Reserves at Dec. 2001 $1.10 $1.10 $1.10
PV of Future Contributions $2.33 $4.06 $5.32
PV of Future Expenditure ($2.85) ($6.48) ($9.83)
PV of Surplus/(Shortfall
)$0.58 ($1.32) ($3.41)
Actuarial Balance (% of Insurable
Earnings) 1.8% (2.9%) (5.5%)
15

A positive actuarial balance, as projected for the next 20 years, indicates that estimated income (assets and contributions) will be more than sufficient to meet estimated expenditures for that period. This excess is expressed in terms of a contribution rate, or percentage of insurable wages. The 1.8% positive actuarial balance for this period indicates that up to 2021, the present contribution rate is 1.8% higher than it needs to be if the funding objective were to ensure reserves last until 2021. Conversely, a negative actuarial balance indicates that together with assets, the contribution rate is insufficient to meet future expenditure for that period. From the previous table, the negative 5.5% actuarial balance for the 60-year period indicates that in order for reserves to last up to 2061, the contribution rate would have to be 5.5% higher – 13.9% up from 8.4%. 3.3 Sensitivity Tests –
Intermediate Scenario This section analyses several additional projections of NIB finances, showing the effect of different assumptions on long-term costs. For simplicity, only the Intermediate scenario will be used to analyse changes in cost that are expressed in terms of the general average premium. 3.3.1 Higher Pension Adjustments One of the main assumptions of these projections is the frequency and amount of pension increases. While such adjustments are not legislated it is envisaged that from time to time pensions will be adjusted to offset reduced purchasing power. Past pension increases have not occurred at even intervals and have often favoured persons with smaller pensions. In most cases they have exceeded the effect inflation had on individual pensions. For the Intermediate scenario projections, pension increases have been assumed to be 0.5% above price inflation, or 3.0% per annum. If instead, pension increases average 3.5% per annum, long-term costs will be higher,
with the general average premium being 16.1% instead of 15.5%. 3.3.2. Higher Return on Investments Increasing investment earnings is one aspect over which Government policy and management’s initiatives could directly serve to extend the life of NIB reserves. Such higher returns may be achieved by introducing new types of investments to the portfolio and adopting new approaches to investing. (See Chapter 5) The Intermediate scenario long-term yield on reserves assumption is 6% per annum, or 3.5% above inflation. If a real rate of return of 4.5% could be achieved, long-term NIB costs would be reduced by 0.8%. 3.3.3. Revised Pension Eligibility Conditions Present regulations provide for the payment of a Retirement pension after only 3 years of contributions. Compared with regional and international social security schemes this is extremely generous. (In most Caribbean schemes at least 10 years of contributions are required.) If the number of years of contributions required for a Retirement benefit was increased from 3 to 10, as recommended in Section 4.3 long-term costs would be reduced by 0.3%. 3.3.4. Career Average Formula Another of the recommendations in this report is increasing the number of years over which wages are averaged for the calculation of pensions. This will ensure that the benefit amount is closely related to contributions paid. Under the present formula, this relationship is very loose. If under a revised formula of calculating pensions the average new Retirement pension each year were 10% lower than that under the present formula, long-term costs would be 1.1% lower. 3.3.5. Improved Compliance Each year, a significant amount of contributions due to NIB remain uncollected. In some cases, benefits are paid and contribution credits granted
16

even though actual contributions are not received from employers. If through improved compliance, contribution income is 3% higher each year and there is no associated increase in benefits, the general average premium would be 15.1% instead of 15.5%. 3.3.6 Higher Administrative Expenses The assumption for administrative costs under the Intermediate scenario is a gradual decline from 1.6% to 0.75% of insurable wages over 20 years. If the Board is unable to reduce operating costs and they remain at 1.6% of insurable wages, the general average premium would be 0.7% higher, or 16.2%. From a cash-flow perspective, however, expenditure in 2060 would require a contribution rate of 0.85% more. The results of these sensitivity tests show that, although each individual change would not have a major overall impact, small positive variances in areas over which management and policymakers have control can reduce long-term costs significantly. The following table summarises the results of each sensitivity test described above. Table 12. Sensitivity Tests Results
Variations From Intermediate Scenario
General Average Premium
Intermediate Scenario 15.5%
Annual pension increases of 3½% instead 3% 16.1%
7% p.a. return on reserves instead of 6% p.a. 14.7%
10 years of contributions required for Retirement benefit instead of 3 years
15.2%
Wages average over a longer period for calculating pensions 14.4%
3% improvement in compliance 15.1%
Administrative costs remain at present level 16.2%
3.4 Preserving National Insurance For Future Generations
The projection results thus far discussed suggest that, unless the contribution rate is increased or benefit reforms made, NIB will not be able to meet its obligations beyond 2029 (Intermediate scenario). Such projections are comparable to similarly designed social security schemes in the United States and the Caribbean. The main reasons why the Bahamas social security programme, in its present form, is financially unsustainable for the long-term are:
The eligibility conditions and pension formulae provide benefits that cost more than the contribution rate, and Declining birth rates and increasing life
expectancy will result in a decreasing number of contributors per pensioner.
The most costly benefit provisions now in place are the payment of a benefit of up to 60% of one’s average insurable wages, the short reference period (3 years) over which highest wages are averaged, and the short contribution period (3 years) required to receive a lifetime pension. In total, NIB pensions are significantly greater than those offered by social security schemes in Canada and the United States. For the next round of amendments to the National Insurance Act & Regulations, therefore, these provisions should be looked at as the most effective ways of reducing long-term costs. A career average benefit formula, in which the pension reflects earnings over an entire career, should also be considered. Ensuring that an appropriate level of reserves always exists could also be achieved by increasing the contribution rate. Such an increase could be an immediate jump to 15.5% so that the present funding level may be preserved. A more prudent approach, however, would be gradual, step-like increases to a rate slightly higher than 15.5%. The ultimate rate would be established based on the desired long-term funding objective. If, for example, a reserve of at least 5 times annual expenditure in 2061 was the objective,
17

two possible schedules of rate increases that could achieve this are:
(a) 1% increases in the contribution rate each year from 2004 to 2011, reaching a high of 15.9%, or
(b) 2% increases every 5 years, beginning 2004 and ending in 2024 when the total contribution rate will be 17.0%.
While a contribution rate increase is not required now, future adjustments are inevitable. Also, the longer these increases are deferred the higher the ultimate rate will have to be. The issue of social security reform is topical throughout the world with countries taking different approaches to securing the viability of their programmes. Some countries have suspended their traditional state-run defined benefit schemes and opted for defined contribution, privately managed schemes. Others have kept the traditional defined benefit approach and have made reforms that reduce long-term
costs. A few others have chosen a hybrid approach combining defined contribution and defined benefit, public and private management as well as fully funded and partially funded tiers. The preferred option depends heavily on the country’s socio-economic conditions, the current and projected financial state of the scheme, the development of domestic capital markets, and the philosophy of the government and people. While there is no need for the Bahamas to change NIB’s defined benefit structure at this time, some reforms will be required to ensure that pension promises can be met without charging excessive contribution rates in the future. Thoughtful consideration, discussions with Bahamians and learning from the experiences of other countries should precede fundamental changes. To complement NIB’s role of providing security in old age, new ways of encouraging national and personal savings, either within or outside the National Insurance framework, should also be devised.
18
Chapter 4 Policy & Administrative Issues 4.1 Insurable Wage Ceiling Since 1974 the ceiling on insurable earnings has been increased only twice – from $110 to $250 per week in 1984 and then to $400 per week in 1999. On each occasion a significant increase was necessary to restore reasonable insurance coverage to higher paid persons. Results of the 2000 Census indicate that the average income of employed persons was approximately $410 per week. By International Labour Organisation (ILO) standards, a ceiling close to the average income is low. NIB records show that approximately 25% of contributors in 2001 had regular wages of at least $400 per week. (This percentage would be higher if service-sector employees contributed on their entire earnings, not just on base wages.) With a $400 per week ceiling many claimants receive short-term benefits that are less than 60% of regular wages and pensions based on wages well below their full salary. While there is no single worldwide acceptable level for the income ceiling (approximately 2.4 times average wage in the United States and equal to the average industrial wage in Canada), the issues to be considered when setting the ceiling include:
(a) The types and amount of mandatory employment related benefits,
(b) Levels of participation among workers in private-sector pension plans and the security provided by those arrangements, and
(c) The role the government wishes to play in providing income security for high-income workers.
Given prevailing socio-economic conditions, income distributions, and the role that the private sector now plays with regards pensions and other employment benefits, the present ceiling is at the
low end of the range of ceilings found in most social security schemes throughout the world. The Government is, therefore, encouraged to discuss this issue with representatives of workers and employers to arrive at an appropriate and acceptable higher level for the ceiling. Whatever its level, the ceiling on insurable wages should be increased frequently, no less often than every three years. Annual adjustments (as practiced in most industrialised countries) would be ideal and should be a medium-term objective if felt to be too drastic a change at this time. The amount of each increase should be the estimated change in average wages since the last increase, and both the timing and method of determining the adjustment should be placed in National Insurance Regulations. (With no official Bahamian wage index, changes in the Consumer Price Index or an NIB created wage index may be used.) Frequent ceiling increases will ensure that the National Insurance programme remains relevant to higher paid contributors. Also, by placing the timing and method of determining ceiling increases in NIB regulations, future adjustments will be predictable, appropriate and free of political pressures. 4.2 Pension Increases Along with frequent and legislated wage-ceiling increases, there should also be automatic increases to pensions in payment. While pension increases have been more frequent than ceiling increases, they have often exceeded the amounts warranted when compared with inflation, and have also favoured those receiving non-contributory pensions and minimum contributory pensions. For example, pension increases during the last 10 years occurred as follows:
19

December 1991
Assistance increased by $20 to $120 per month.
Benefit increases ranging from 25% to 3% depending on the year the benefit was awarded, 1986 or before, to 1991.
Minimum pension increased to $150 per month. ($125 for 60-year olds)
August 1992
Assistance increased by $40 to $160 per month.
Minimum pension increased to $190 per month. ($165 for 60-year olds)
January 1999
Assistance increased by $20 to $180 per month.
Benefit increases of 10% to those above the minimum.
Minimum pension increased to $210 per month. ($185 for 60-year olds)
July 2001 Assistance increased by $20 to $200 per month.
Up to $20 increase to Retirement, Invalidity and Survivors benefits with pensions of less than $230 per month.
Minimum pension increased to $230 per month. ($205 for 60-year olds)
The increases granted in 1991 were the first since 1982 and varied depending on the year the pension was awarded. This ensured that the same increase was not granted to a new pensioner whose benefit was unaffected by inflation and someone whose pension was not adjusted for nine years. The increases granted in 1992 affected only persons receiving small contributory pensions and non-contributory pensions, but were as high as 33% for those receiving assistance. Since only 9 months had elapsed since the previous increase these adjustments significantly exceeded the effect inflation had on these pensions. In 1999, the 10% increase was a fair approximation of cumulative price inflation between 1992 and 1999. Therefore, those with pensions awarded prior to 1992 received an appropriate adjustment. However, since all pensioners received an adjustment of at least 10%, many persons received increases that exceeded adjustments necessary to compensate
for the cost-of-living increase. This resulted in additional immediate and long-term cost to NIB. Similarly, the adjustment in July 2001 of only non-contributory pensions and contributory pensions below $230 per month far exceeded inflation, once again increasing long-term NIB benefit expenditure. The minimum contributory pension has more than doubled since 1991 and is now so high that 49% of all Retirement pensioners receive minimum pensions. The main reason for granting pension increases is to allow pensioners to maintain the purchasing power of the pension that they had when it was first awarded. Therefore, pension adjustments should occur annually in line with inflation during the previous 12 months, with the timing and adjustment formula placed in NIB’s Regulations. If triennial adjustments are preferred, actual increases should vary based on the year each person’s pension was awarded or last increased. 4.3 Eligibility Requirements For
Pensions To qualify for a contributory pension (Retirement, Invalidity or Survivors) one needs to have made at least 150 weekly contributions. As the following example illustrates, a lifetime pension after only three years of contributions is extremely generous. Contribution period: 3 years or 150 contributions Average wage: $150 per week. Total employer contributions: $1,215 Total employee contributions: $ 765 Retirement Benefit at age 65:
15% x $150 = $22.50 p.w. or $97.50 p.m. Since this is less than the minimum pension, $230 per month would be payable. Ignoring interest, the pensioner would receive pension payments equivalent to employer and employee contributions after only 8.6 months. If short-term or industrial benefits were paid prior to retirement this would further reduce the number of months necessary for a return of contributions paid.
20

While the example shown above may appear extreme, 7% of new retirement pensioners have fewer than 200 contributions to their credit and 51% of awards in 2001 received the minimum pension. All of these pensioners will receive significantly more than their contributions could otherwise provide. This and several other benefit provisions make the National Insurance system relatively generous and, at the present contribution rate, financially unsustainable. In almost all Caribbean social security schemes at least 10 years of contributions are required for a Retirement pension, while a few require as many as 15 years of contributions. In most industrialised countries, pensions are based on career earnings so short periods of employment and contributions produce small pensions. Present NIB Regulations include provisions that appear to suggest an intention to gradually increase the number of contribution weeks required for a pension from 150 to 750. As in other regional schemes, 150 weeks was set as the minimum required in the early years so that persons could qualify for a pension soon after inception. However, this change was never made in The Bahamas. It is, therefore, recommended that the minimum number of contributions required for a Retirement pension be increased to 10 years or 500 weekly contributions. In recent years, between 65% and 70% of new Retirement pensioners had at least 500 credits. Such a change should not take place in one step but instead should occur gradually at a minimum pace of 50 weeks each year. This would mean that 500 contribution weeks would be required after a transition period of 7 years. For those persons who do not qualify for a pension a one-time grant should be paid. The amount of the grant can be either directly related to the actual contributions made by the insured with appropriate deductions for administrative expenses and additions of interest on contributions, or on some other equitable basis. One concern re a one-time grant to those who do not qualify for a retirement pension is the
payment of lifetime non-contributory pensions to those who never contributed. However, if the payment of OANCP is restricted to persons who are truly in need, past contributors who do not meet the minimum contribution requirements will receive a fair payment representing a refund of their contributions with interest. 4.4 Wages Used For Calculating
Pensions Although contributions are based on earnings over one’s career, only wages in the best three years in the last ten years are used to calculate pensions. Therefore, two persons with different career earnings who happen to have three years of similar high earnings, and the same number of contributions, will receive the same pension. The following chart shows the career earnings of two workers. For all but the last three years their insurable wages were different. While each would have been awarded different short-term benefits while working, under the present formula they would both receive the same lifetime pension.
0Year
Insu
rabl
e W
ages
As only three years of wages are used, the amount of the pension bears little relationship to actual contributions. Also, since the highest wages are used, the pension is often significantly higher than an amount that actual contributions accumulated with interest could purchase from a private insurance company. Therefore, using only the three highest years’ wages produces inequities among generations (different contribution history but same pension) and between generations (passing on part of the cost of one’s pension to future contributors.)
21

Using only three years wages also produces inflated benefits for those retiring shortly after a ceiling increase. For example, someone with high earnings retiring in July 2002, contributed at the $400 weekly ceiling for only 3½ years. Before that, maximum insurable wages were $250 per week for 15 years. However, the pension will be based on the higher wages in only the best three years. (An amendment made in 1999 to adjust wages above $250 per week for benefit reduced slightly this inconsistency.) The method of calculating social security pensions in almost all OECD countries uses indexed career earnings. In some cases, there are provisions to drop a certain number of years of no earnings or ignore years in which earnings were low – for example when a parent stayed home with young children. For The Bahamas, a best 25-year indexed earnings formula is now being recommended. Indexing older wages to their current value will ensure that older wages are appropriately weighted. Also, a 25-year period is long enough to ensure that the pension is closely related to actual contributions but short enough to have years of low earnings dropped from those with long careers. For people who do not have at least 25 years of contributions, years of no earnings would be included but the presence of the minimum pension would ensure that their benefit does not fall below a certain amount. Applying this approach to a random sample of recent retirees indicates that there will be little effect on low-income workers while the pensions to higher-income contributors will be lower, but consistent with their actual contributions. 4.5 Payment of Both Retirement &
Survivors Pensions Regulations preclude a surviving spouse who has earned the right to his/her own Retirement or Invalidity Benefit from receiving two pensions. Instead, only the higher of the two pensions is payable. This practice could serve to erode the
security of the survivor as household income will likely fall by more than household expenditure. Also, the payment of only one benefit favours households where only one spouse worked compared with another in which both spouses were employed, assuming both have the same combined pre-retirement/death income. This is illustrated in the following example. Household 1 Household 2 Husband Wife Husband Wife Wages before retirement $400 - $240 $160 Retirement Pension $200 - $120 $80 Survivors Pension $100 $60
Pension to spouse $100 $80
All amounts are weekly and assume Retirement Benefit is 50% of average insurable wages.
As seen above, the wife who never worked and did not earn a Retirement benefit receives a larger pension following her husband’s death than the wife who had her own pension, even though household income prior to retirement and prior to the husband’s death were the same. The example also shows that household income may fall by more than 50%. However, the cost of living for one person is almost as high as it is for two people living together. (The US poverty line for an individual is only 20% less than that for a couple.) Therefore, if the NIB pension is the primary source of household income, the standard of living for the survivor is likely to fall following a spouse’s death. Options for paying more than the greater of the Retirement and Survivors pensions include:
(i) payment of both pensions in full, without limit;
(ii) payment of both with a maximum combined monthly amount;
(iii) payment of full Retirement/Invalidity plus a portion (say ½) of the survivors pension
While each of these options will increase overall costs the one that will be most equitable is Option (iii). It will also be simple to understand and compute. It is difficult to estimate how many
22

more claims there would be. However, if new awards for Survivor spouse benefits double the extra long-term cost would be 0.5% of insurable earnings. This does not include the cost of awarding a second benefit to those who already are receiving the greater of two pensions. 4.6 Assistance Since 1974, NIB has paid Non-contributory assistance pensions to the elderly, the invalid and survivors of deceased persons. While the qualifying conditions for assistance require one to have both insufficient NIB contributions and minimum household income, it was envisaged that as the National Insurance programme matured there would be a reducing number of new assistance awards, especially as one needs only 3 years of contributions to qualify for a benefit. This has not been the case. Chart 15 below shows the number of new Old Age Non-contributory Pensions (OANCP) and Invalidity assistance awards for 1990 to 2001. Chart 15. Assistance Awards, 1990 to 2001
There are several other concerns with the administration and payment of Non-contributory assistances by the NIB. These include:
The application of the income test, both at the time of claim and during semi-annual
verifications, appears lenient, resulting in payments of assistance to many persons who may not be eligible; Many new assistance pensioners are persons
who worked for more than 3 years and failed to pay NIB contributions; The small difference in the amount of the
assistance ($200) and the minimum contributory Retirement pension for a 60-year old ($205) serves as an incentive to self-employed persons to not contribute; Pension increases appear to be guided by the
desire to increase non-contributory pensions resulting in increases to assistance payments that significantly exceeded cost of living increases.
Each year the Bahamas Government provides a grant towards the payment of Non-contributory pensions. Since 1993, this amount has been $4.9 million per annum, which in 2001, represented only 29% of total assistance payments. Since 1993, however, the rate of monthly assistance has been increased twice without any adjustment in the government grant. The Bahamas Government should, therefore, consider increasing its grant to the NIB now that the monthly assistance is $200.
100
150
200
250
300
350
1990 1992 1994 1996 1998 2000Invalidity Assistance OANCP
To alleviate some of the concerns mentioned above the following may be considered:
Improve the quality of the income verification exercise both at the time of award and every 6 months. This will ensure that only those truly in need are awarded and remain eligible to receive assistance; Increase the gap between the assistance and
the minimum contributory pension. This could be achieved by not increasing the rate of assistance for some time while increases are awarded only to contributory pensioners.
4.7 Civil Servants & NIB The ceiling on insurable wages has increased twice – from $110 to $250 per week in 1984 and then to $400 per week in 1999. For pensionable civil servants, however, the maximum wage on which their contributions for Retirement and
23

Invalidity benefits is based, has remained at $110 per week. Therefore, the contributions paid by most government employees are less than those of other insured persons and thus they are entitled to smaller pensions. As the following example shows, a public servant who retires in 2002 at age 60, after making contributions every week since October 1974, is entitled to a pension that is only $5 more than the non-contributory pension.
Contribution period: October 1974 to June 2002 – 1,441 contribution weeks
Average insurable wage: $110 per week. Benefit percentage: 53% Retirement benefit at age 60:
53% x $110 x 80% = $46.64 p.w. or $202.11 p.m. Since this is less than the minimum pension for a 60-year old, $205 per month would be payable.
The contribution ceiling for pensionable civil servants has not been increased because the benefits in Government’s non-contributory pension plan are not integrated with National Insurance benefits. (A pension plan is integrated if the pension payable from the plan is adjusted for any NIB pension. This will ensure that combined pensions are not excessive and that pensions to low and high paid retirees are equitable.) While the combined public service and NIB pensions may be adequate, the payment of such a small Retirement pension may reflect poorly on NIB. It also may cause discontent among civil servants who contribute for many years and get only slightly more than persons who have never contributed. For insured persons who worked in both the public and private sectors, their pensions are also limited because of the lower wage ceiling during the years they worked in the public service. Therefore, Government is encouraged to review its pension plan rules so that both short and long-serving public servants can enjoy more relevant NIB contribution and benefit provisions and an appropriately integrated civil service pension. As part of a comprehensive study on fully incorporating public officers into NIB,
Government should have long-term projections of its unfunded, non-contributory pension plan performed. Pension payments in 2002/03 will be an estimated $26.5 million, or 2.6% of current expenditure and will increase each year as more civil servants become entitled to pensions from the Consolidated Fund. The Government should also review its ongoing pension commitments to employees of newly created public corporations, such as the Airport Authority and the Public Hospitals Authority. To date staffs of both institutions remain eligible to pensions from the Consolidated Fund. Since pensions are an integral part of employee compensation packages, their cost should be reflected in current periods. By allowing these corporations to effectively operate without a pension plan, the true operating costs of that institution is understated while the Government’s unfunded pension liability continues to grow. Meanwhile, NIB should ensure that the correct contributions are collected from workers at statutory corporations who are eligible to pensions from the Consolidated Fund. The payment of regular wages to civil servants during periods of sick or maternity leave when NIB pays a benefit remains unresolved. During such periods, employees receive more than their regular wages contrary to NIB’s goal that short-term benefits should replace lost income. This is possibly the reason why Government employees have a higher incidence of Sickness benefit claims than other employees. In many private and public sector organisations, NIB payments for Sickness, Maternity and Injury benefits are either deducted from employees’ earnings or NIB cheques are endorsed to the employer. In either case, the net effect is that the employee receives no more than full salary. Each NIB short-term benefit payment made to a government employee who receives full pay represents money that could be saved in salaries - estimated at $4.3 million in 2001. Since both Government and its employees contribute to NIB for these benefits, Government should consider changing its present practice and reduce regular wages by the amount of NIB Sickness, Maternity
24

or Injury benefits. Appropriate arrangements aimed at simplifying administration of the proposed change could be agreed upon by NIB and the Ministry of Public Service. 4.8 Self-employed Persons Although coverage is mandatory, only 17% of the estimated 23,000 self-employed persons made at least 1 contribution in 2000. Also, self-employed persons declare relatively low wages, which in 2001 averaged $198 per week compared with $288 for employed persons. They also tend to pay for fewer than 12 months during the year – average of 8.6 months in 2001. Compliance among the self-employed and informal sector workers is a challenge to social security schemes throughout the world. Public relations programmes that highlight the many advantages of self-employed persons contributing to NIB is one way of encouraging higher levels of participation. Other initiatives that may be considered for implementation by the Board are:
Simplifying the contribution process by accepting contribution payments by credit card, direct bank transfers and on a single contribution form for a year; Enhancing relationships with Government
departments from which self-employed persons conduct business. For example, the Business License Office may withhold renewal licenses to businesses not in compliance with NIB. A similar relationship now exists with the Department of Immigration where employers seeking work permit renewals must confirm that their NIB contributions are up to date; Establishing fixed monthly contribution
amounts due for several income bands, with the self-employed person selecting the band in which monthly income usually falls; Eliminating the payment of assistance to
former self-employed persons as many are of the view that, even if they do not qualify for a benefit, they will be entitled to a Non-contributory pension.
4.9 Review Of NIB Legislation
While many amendments have been made to NIB’s Act & Regulations a major legislation review has never been conducted. After 27 years of operations, several aspects of NIB Regulations are outdated and do not provide for some current day realities. Also, past amendments have made many sections of the Regulations complicated and there is a general desire by NIB personnel to simplify the language.
It is, therefore, recommended that a review of the entire National Insurance Act & Regulations be conducted to:
Review all coverage, contribution and benefit provisions with the view of making the social security programme in The Bahamas consistent with present-day social and economic realities and ensuring that its financial strength and fiduciary soundness is maintained for future generations; Ensure that the legislation is consistent with
the scheme’s intent; Ensure that all current practices are covered
by regulations; Ensure that the legislation is consistent with
other laws of The Bahamas; Introduce provisions that will allow the
system to be more responsive to socio-economic changes; Introduce provisions that will serve to reduce
the number of amendments required when certain provisions are changed. For example, if the Funeral and Maternity grant are directly related to the minimum pension or the ceiling, when the primary amount is changed, the amounts of each grant will automatically change as well. Simplify the language so that it is easier to
read and interpret; Remove obsolete provisions.
Once the review is completed, the present legislation may be repealed and replaced with a new version of the Act & Regulations.
25

4.10 Administrative Costs The issue of high operating costs was raised in the last two actuarial reviews as an area of concern and in need of immediate attention. While there has been some improvement since 1997, the level of operating costs remains high and continues to undermine the basis on which the contribution rate was initially set.
Admin. Expenses 1997 1998 1999 2000 2001
Millions of $’s 19.8 19.9 22.0 21.2 22.8
As % of Contribution
Income 24.4% 23.5% 21.2% 18.6% 19.2%
If NIB’s role is viewed as safe-keeping workers’ savings so that they can receive a benefit or pension at a later date, having 19 cents of each dollar saved spent on operating costs would be unacceptable to commercial bank and insurance company customers. Similarly, this expense ratio is excessive for NIB’s customers. As shown in the following table, when compared with several regional social security schemes, NIB’s staff complement and operating costs are among the highest. (To better compare costs in schemes with different contribution rates, insurable wages are used as the reference base. This rate indicates the portion of a worker’s insurable wages used to meet operating costs.) Table 13. Staff Complement & Administrative
Costs in Several CARICOM Schemes
Country Staff per 1,000
Population, 2001
Admin. Costs as % of Insurable Wages, 2001
Bahamas 1.5 1.6%
Barbados 0.9 0.7%
Dominica 0.7 1.6% Grenada 0.7 1.3% Guyana 0.7 1.8% St. Kitts-Nevis 2.2 2.1% St. Lucia 0.6 1.3% St. Vincent 0.4 1.1% Trinidad & Tobago (2000) 0.3 0.6%
An appropriate medium-term goal for the percentage of contribution income that is used to cover administrative costs is 10%. The two key areas that may be considered as ways of immediately reducing costs are: (i) Reductions to NIB’s staff complement.
Although no formal study of the appropriate staff size has been performed it is fair to conclude that at 471 employees (September 2002) NIB is overstaffed. Therefore, a comprehensive study of the Board’s operations should be conducted so that appropriate staffing levels are determined.
(ii) The outsourcing of several functions that could be more effectively provided by private firms or individuals. These could include the management of NIB properties, public relations, investment of assets, internal audit and computer programming. With funds under management of over $1 billion, many issues can easily distract management’s focus from its core business of collecting contributions and the administration and payment of benefits. Also, NIB does not have the in-house expertise that some other firms do, to manage a large investment portfolio and the growing number of properties.
A review of Family Island operations is also recommended. While the need to provide service for employers, insured persons and pensioners throughout the Bahamas is appreciated, cost must be balanced with the reasonable needs and expectations of customers. Options for reducing the cost of Family Island operations include:
Joining forces with other organisations with Family Island operations, sharing office space, staff and other resources; In islands where NIB has more than one
office, one office may service all areas, either using a mobile office or by having offices open on only certain days of the week.
4.11 Medical Benefits Branch For accounting purposes, NIB finances are separated into branches, with one branch for each of the major benefit types. Unlike the other
26

branches, no benefits are paid out of the Medical Benefits Branch. Instead, this branch was created in 1985 so that a specific portion of NIB contributions would be set aside to provide:
“funding for the development of health infrastructure and funding for studies relating to circumstances, manner and conditions under which medical care and attention can be provided to an insured person and his dependants.”
Section 3, Financial and Accounting Regulations With an initial endowment of $40.6 million plus 1.1% of annual contribution income along with investment income on branch reserves, funds from this branch have been used to build, equip and maintain eighteen polyclinics throughout The Bahamas. In recent years, this branch has realised annual surpluses of over $3 million and at the end of 2001, reserves stood at $94.7 million. With only $27.7 million of this total representing the cost of polyclinics, over $67 million is now available for the construction of additional polyclinics, other health infrastructure and health studies. To date, Medical Benefits Branch funds have been used solely for developing health infrastructure. In line with the Branch’s mandate set out in Regulations, funds could also be well spent on research studies and educational preventive programmes. Such studies and programmes could relate to obesity and HIV/AIDS in the Bahamas, two areas of concern of local health professionals. These and other preventable diseases result in frequent absenteeism, reduced productivity and increased benefit expenditure. Also, given the economic threat that HIV/AIDS poses to The Bahamas, the scope of Medical Benefits Branch reserves may be expanded to finance prevention activities as well as the treatment of infected contributors. Funds allocated to these areas could result in direct positive returns to NIB and the overall economy. The Government and the NIB are therefore encouraged to identify medical-related studies and programmes that could be funded from the Medical Benefits Branch. With a significant amount of free reserves available in the Medical Benefits Branch, it is
recommended that $50 million be transferred from the Medical Benefits Branch to the Pensions Branch with continued allocations of contribution income. This transfer will boost the funding of the Pensions Branch while leaving sufficient funds for further improvements in health infrastructure. Alternatively, the allocation of contribution income to the Medical Benefits Branch could be suspended and added to the amount now allocated to the Pensions Branch. 4.12 Annual Contribution
Statements Most NIB contributors are unaware of what their past contributions entitle them to and what their pension at retirement is likely to be. Some persons may even have had contributions deducted from earnings that were never paid to NIB by their employer. Also, the completeness of NIB’s contribution data, especially for old periods, is suspect, resulting in possible underpayments to pensioners.
To deal with each of these issues, annual contribution statements to insured persons should be introduced. These statements could include the following:
Basic personal information of the insured; Insured’s entire contribution history (number
of weeks and total insurable wages for each year since 1974); Benefit (Invalidity or Retirement) that would
have been payable had the insured retired or become invalid on the statement date; If the person does not yet meet the minimum
qualifying contribution conditions for Retirement benefit, an indication of what these requirements are and how many more contributions are required could be shown.
A well-designed annual statement to contributors will:
Allow insureds to confirm that NIB records are complete showing the periods they worked and contributions made; Inform insureds of their entitlements earned
thus far and how many more, if any,
27
contributions are still required to meet minimum eligibility conditions; Allow for better planning for retirement as
the insured will obtain some idea of what his/her pension may be; Improve compliance by reducing the
likelihood that employers will withhold employee contributions and not immediately turn them over to NIB, as insureds will know whether or not employer contributions have been made on their behalf.
4.13 Public Relations NIB administers one of the most important public programmes in the Bahamas. Most people, however, are not fully aware that, at the present contribution rate, the national insurance programme is not financially sustainable. Many people also do not appreciate the many advantages of making regular NIB contributions. This is especially true for self-employed persons. Appropriate and sustained public relations campaigns are therefore necessary. The specific goals of such efforts should be to increase compliance among self-employed persons and to promote the need for workers to secure at least one additional source of income after retirement. The results of the long-term projections and the recommendations presented in this report should also be widely disseminated. Contributors and pensioners must be made aware of the challenges that lie ahead and the fundamental reforms that will be required to ensure that the National Insurance Fund is sustainable for future generations. Their understanding of these issues will be necessary in order for the government to readily make significant changes. 4.14 Miscellaneous Issues There are other policy matters that should be reviewed at this time, for which only a summary of each issue is presented.
The earnings restriction placed on pensioners under 70 years old who wish to work but keep receiving their Retirement Benefit. (Even if the age is not changed, the present requirement that those 70 and over, must actually retire and then return to work in order to qualify should be removed).
The exclusion of tips and gratuities from the wages on which NIB contributions are based for service sector workers. These workers often take home wages well in excess of base pay but receive NIB benefits based only on their basic wage.
The introduction of unemployment benefits. Two benefits included in the ILO’s recommended package of social security benefits not presently offered in The Bahamas are unemployment and health. During several periods, more recently in the months following the Bay Street fire and the September 11th, 2001 terrorist attacks in the U.S., a formal income-replacement benefit would have eased social and financial tensions during periods of involuntary unemployment.
The introduction of health insurance benefits. Over the past fifteen years several studies into the introduction of various forms of national health insurance (NHI) have been conducted. In July 2002, the Government named a broad-based commission that will recommend a suitable structure for such a programme. If implemented, Government should ensure that the scheme’s design is consistent with the level of private insurance health coverage now in place, the advanced medical capabilities of both the public and private sectors, and the quality of care expectations of Bahamians. Such a programme should not simply provide more funds for the public health sector.
For both unemployment and health benefits additional premiums or contributions would have to be charged.
The continued payment of a portion of Invalidity benefit once the pensioner returns to work. In some cases, re-employment produces very low earnings but the
28
satisfaction gained from working is more personal and self-fulfilling (due to being productive again) than it is financial.
Elimination of Sickness Assistance. With already generous eligibility conditions for Sickness benefit, this form of assistance is paid when the claimant is in need and there has been recent employment but insufficient contributions to qualify for the benefit.
Payment of contributions for employees who have more than one job. Present regulations only require contributions from the first or primary employer.
Reciprocal arrangements with other countries. In September 2001 The Bahamas ratified the CARICOM Agreement on Social Security allowing NIB contributors who worked elsewhere to have contributions made in participating CARICOM countries count towards their social security pensions. Negotiating similar agreements may be considered with the Turks & Caicos Islands, United Kingdom, United States and Canada. Such agreements will allow citizens of these countries, as well as Bahamians who work there, to benefit from contributions to other social security schemes. Without such agreements, contributions during short stints of employment are insufficient to enable qualification for a pension.
Extending industrial benefit coverage to all self-employed persons. Presently, only a few categories of self-employed workers are entitled – licensed drivers whose vehicle is
for hire, licensed fruit/straw/vegetable vendors and share fishermen who own their boats. All other self-employed persons do not qualify for benefits following job-related accidents or injuries.
Appointment of Board members in accordance with the Act. The National Insurance Act stipulates that the Board be made up of 11 members – three representing employers, three representing insured persons (workers) and five appointed by the Minister in his discretion. (Second Schedule of the Act) It also states that the members representing employers and workers should be appointed only after consultation with respective employer confederations and trade unions. In the past, Board appointments have appeared not to follow the specifics of the Act. Government is therefore encouraged to ensure that future Boards are appointed in accordance with the National Insurance Act.
National pension legislation that encourages other forms of long-term savings and provides for the regulation of pension plans. Such legislation should be comprehensive, encompass both individual and employer-sponsored plans and include provisions for benefit portability. With a well-designed and regulated pensions system Bahamian workers could look forward to more than one source of income after retirement and enhanced income security in their old age.
29

30

Chapter 5 Investments National Insurance investments are an integral part of the Bahamian economy. They also serve as a major source of funds that will be required to pay benefits when expenditure surpasses contribution income. Therefore, NIB investments should contribute to economic and social development as well as enhance the long-term sustainability of the Fund. As these two objectives may oftentimes conflict, a delicate balance must be achieved. 5.1 Asset Mix At $1.1 billion, the National Insurance Fund is approximately 22% of The Bahamas’ GDP. Given the significant size of this all-Bahamian portfolio it is becoming increasingly difficult to find suitable investments locally. As a result, surplus funds often remain uninvested for lengthy periods and there has been a dramatic increase over the last few years in the proportion of short-term investments and a concurrent decrease in the percentage of long-term assets. Such a shift is directly opposite to what a prudent asset-liability matching strategy would call for, given that NIB’s liabilities are predominantly long-term. NIB’s asset mix at the end of 2001 is shown in the following chart. Chart 16. NIB Investments, Dec. 2001
There are limited investment opportunities within The Bahamas that meet accepted social security criteria – yield, risk, liquidity and social utility. Also, NIB Regulations and Government policy limit the types of investments available to the Board. For years, most surplus funds have been invested in Bahamas Government Registered Stock (BGRS), presently the best domestic investment available for NIB funds. Recently, however, there have been fewer issues of BGRS and increased demand from other pension plans and institutional investors. This has resulted in a reduction in the amount of new BGRS that NIB has been able to purchase. The following chart shows that both the proportion of Registered Stock in NIB’s portfolio (top line) and the proportion of all outstanding BGRS that NIB holds (bars) have declined in recent years. Chart 17. NIB’s Holding of BGRS 65
%
%
%
%
%
%
1995 1996 1997 1998 1999 2000 2001
NIB's Holdings of Outstanding BGRSBGRS as % of NIB's Investments
60
55
50
45
30%
47%
11%
12%
Cash & Fixed Deposits Bahamas Gov't Securities
Gov't Corp. Bonds & Loans Other
40
With the decline in the amount of available Registered Stock and few other available long-term investment opportunities, NIB has been forced to place most of its new surplus funds in short-term deposits at local commercial banks. Between 1996 and 2001, cash and fixed deposits
31

have increased from $89 million to $322 million, or from 12% to 30% of the portfolio. During this period, there has also been a decline in the overall yield on reserves. (See Chart 6 on page 3) In July 2002, deposits at most commercial banks were at or very close to maximum levels set out in internal investment guidelines. As previously mentioned, the short-term component of the portfolio exceeds appropriate levels. Therefore, the Board should ensure that these internal guidelines are neither broken nor altered simply to accommodate additional bank deposits, as they represent prudent limits for investments in individual institutions. The rapid increase in the amount of short-term investments is cause for concern. Firstly, the rates of return on fixed deposits are usually lower than on longer-term investments. Secondly, large amounts of short-term investments produce cash flow mismatches between assets and liabilities. In NIB’s case, investments mature and money becomes available even though it is not needed to meet expenditure. In an environment of declining yields on investments, having to reinvest assets at lower rates reduces the overall rate of return of the Fund. A review of the maturity structure of NIB’s investments at the end of 2001 is shown below. Table 14. Maturities of NIB Investments
Maturity Millions of $’s %
Less than 1 year 353 35%
1 – 5 years 171 17%
5 – 10 years 198 19%
10 + years 289 29%
All Maturities 1,011 100% Property, Plant & Equipment and Loans have been excluded. As shown above, 71% of present investments will mature within the next 10 years. In addition, annual cash flow surpluses for the next 10 years are projected to exceed $65 million, and the need to sell assets to help meet benefit expenditure is not expected until 2019. With new issues of BGRS unlikely to be sufficient to consume
excess NIB funds and little room for additional bank deposits, new types of investments will be required to ensure that NIB funds are fully and carefully invested. Should yields fall below the rates assumed in the projections, there will be earlier than projected cash-shortfalls and the need to increase contribution rates by more than they otherwise would have to be increased. For many years there has been some hesitation by decision-makers to add significant amounts of equities to NIB’s portfolio. Instead, the preference has been for the traditional fixed-income securities - bonds, loans and fixed deposits. Of the nineteen publicly traded companies whose common shares trade locally, NIB has holdings in only four. At the end of 2001 the market value of these shares was less than 1% of the portfolio. Historically, including equities in pension funds has been a good long-term strategy in more developed markets. Similarly, in The Bahamas’ growing economy and new capital market, shares in quality companies have the potential to produce higher returns than bonds and fixed deposits. A significant investment in local equities could also provide a positive boost for the local capital market. Other options for NIB funds that should be considered at this time are:
Adequately secured loans to private institutions, Mortgages, not necessarily administered by
NIB, and Overseas investments.
5.2 Investment Policy Statement To help ensure that NIB’s assets are prudently and efficiently invested, an Investment Policy Statement (IPS) is required. An IPS sets out policies, guidelines and a general framework within which assets may be invested. In both the U.S. and Canada IPS’s are required of all pension plans and investment funds. While an IPS for the National Insurance Fund was drafted in 1999, it is yet to be formally approved and implemented.
32

A well-designed IPS communicates the investment philosophy of the Fund, describes its objectives and investment strategy, and identifies the roles of those involved in the investment process, and what is expected of them. Issues dealt with in a typical IPS include:
The categories of acceptable investments; Portfolio diversification – across asset classes
and within asset classes, by maturity – short, medium & long-term, by location – local versus overseas; Risk inherent in the portfolio – risk of default
and risk of price fluctuations; Asset mix – desired ranges for the proportion
of different types of investments; Rate of return expectations of the entire
portfolio and individual investments; Liquidity needs; How investments are valued; Authority granted to various parties –
Director, Investment Committee, Board, Minister.
An Investment Policy Statement is a blueprint for the effective investment of assets. Because of limited opportunities, the selection of new NIB investments has historically paid little attention to their fit in the overall portfolio. Without specific guidelines, and the restrictions mentioned earlier, the mix of National Insurance assets has been allowed to deviate significantly from one that is consistent with the Fund’s liabilities and purpose. To ensure that NIB funds achieve desired objectives, it is therefore recommended that an Investment Policy Statement be adopted and its guidelines and policies adhered to. 5.3 Investment Management Although investments exceed $1 billion, NIB does not have the qualified and skilled personnel that local private investment companies that manage smaller portfolios do. However, NIB has not been severely disadvantaged given the limited scope of investments held and the overly cautious management style - most of NIB’s assets are bonds, loans and fixed deposits that are
held to maturity and thus require very little daily monitoring and action. Also, only limited economic research and forecasting is performed, and initiatives for new investment opportunities seldom come from within. While the Board has been able to manage its domestic portfolio with few resources and a passive investment style reasonably well, greater returns may have been achieved if alternative approaches were adopted. Along with the introduction of new types of investments, a review of certain policies and practices could enhance NIB’s investment performance in the future. These include:
Granting increased levels of investment authority to the Director, Investment Committee and Board; Allowing external fund managers and
investment firms to manage portions of NIB’s local portfolio; Removing the restriction on investing NIB
funds outside the Bahamas. The research and day-to-day management required to properly administer other types of investments could be extensive. Also, it would be best if the people and institutions with specialised competencies perform these tasks, leaving NIB’s Board and management to focus on their core business of collecting contributions and administering benefits. Therefore, instead of increasing the number of in-house staff with investment expertise, outsourcing the day-to-day management of some of NIB funds should be considered. Such outsourcing could take the form of allocating specific amounts to different firms who will manage and invest:
(i) Local equities, (ii) Mortgages and/or mortgage backed bonds, (iii) Private institutional loans, and (iv) An international portfolio of bonds and
equities. The decision making process for new investments should also be reviewed. For example, equity shares held in the National Insurance Fund were all purchased either during
33
initial public offerings or rights offerings. In each instance, prior approval was required from the Minister. (Except for fixed deposits, BGRS and Treasury Bills, all other investments require prior approval by the Board, and in most cases the Minister.) To enable the speedy purchase of shares on BISX, consideration should be given to granting delegated authority to the Director or Investment Committee. On occasion, blocks of
shares that become available are offered to NIB, but administrative hurdles often make speedy decision making difficult. Such authority may initially take the form of permitting a certain portion of the portfolio to be invested in local equities, with the selection of individual stocks left to the discretion of the Director, with final approval from the Investment Committee.
34

Appendices


Appendix I Summary of Contribution & Benefit Provisions I.1 Benefits, Insured Persons &
Contribution Rates The National Insurance Board began operations in October 1974 and as of December 2001, provided the following benefits: (a) Long-term contributory benefits:
Retirement, Invalidity and Survivors’ benefits.
(b) Long-term assistance: Old Age Non-contributory pension, Invalidity and Survivors’ assistance.
(c) Short-term benefits: Sickness benefit, Maternity benefit & grant, Funeral benefit.
(d) Short-term assistance: Sickness assistance.
(e) Industrial benefits: Injury benefit, Disablement benefit, Medical Care, Industrial Death benefit and Industrial Funeral benefit.
Insured Persons Employed, self-employed and voluntary insured persons aged 16 and over are covered for the above contingencies as follows: Employed persons: All contingencies. Self-employed persons:
• Category A - All contingencies except Industrial benefits;
• Category B – All contingencies. This group includes licensed drivers whose vehicle is for hire, licensed fruit/straw/vegetable vendors and share fishermen who own their boats.
Voluntary insured persons: Retirement, Invalidity, Funeral and Survivors’ benefits.
Employed persons under age 16 or over age 69 are covered for employment injury benefits only.
Insurable Earnings & Contributions Earnings used for determining contributions and benefits are limited to $400 per week or $1,733 per month. Earnings include basic wages and pay in lieu of notice but exclude bonuses, overtime and tips. The ceilings on insurable wages since 1974 are:
1974 to 1984 $ 110.00 per week 1984 to 1998 $ 250.00 per week 1999 to present $ 400.00 per week
For pensionable Bahamas Government employees, the ceiling for long-term benefits (pensions) is $110 per week. Contributions are computed as a percentage of insurable earnings. The contribution rates for all categories of contributors are shown below:
Employee Type Employee Employer Total
Private & non-Pensionable Civil Servants
3.4% 5.4% 8.8%
Pensionable Civil Servants
Wages <=110 > 110
3.4% 1.7%
5.4%
2.55%
8.8% 4.25%
Self-employed A 6.8%
Self-employed B 8.8%
Voluntary 5.0%
Summer Students 2.0% 2.0%
35
I.2 Qualifying Conditions & Benefit Rates
I.2.1. LONG-TERM BENEFITS (a) RETIREMENT BENEFIT Eligibility Requirements: The applicant must be age 65 or older and have paid at least 150 weekly contributions. A reduced pension is payable beginning from age 60. Amount Of Benefit: A percentage of average insurable earnings over the best 3 years in the last 10. The applicable percentages are:
150 – 199 contributions 15% 200 – 249 contributions 17% 250 – 749 contributions 20% + 2% for each
set of 50 above 250 750 or more contributions 40% + 1% for each
set of 50 above 750 If average insurable earnings exceed $250 per week, the excess is reduced by 25%. The amount of benefit is reduced by 4% for each year that the insured is less than 65. Maximum Pension: 60% of adjusted average monthly earnings over the best three years.
Minimum Pension: $230.00 per month. ($205 for early retirement at age 60) Initial Contribution Credits: Persons over age 35 in October 1974 who made at least 150 contributions in the programme’s first 3 years were awarded special credits at the rate of 25 contributions for each year their age exceeded 35, subject to a maximum of 600 credits. (b) OLD AGE NON-CONTRIBUTORY
PENSION Eligibility: Age 65, insufficient credits to qualify for Retirement benefit, Bahamian citizen or resident in the Bahamas as an employed or self-
employed person for at least 12 months in the 15 years immediately before claiming, and has a share of household income of less than $46.15 per week. Amount Of Assistance: $200.00 per month. (c) INVALIDITY BENEFIT Eligibility Requirements: The applicant must have paid at least 150 weekly contributions and be:
(i) Less than 65; (ii) Incapable of work as a result of a
specified disease of bodily or mental disablement, otherwise than as a result of an employment injury, which is likely to remain permanent.
Amount Of Benefit: Calculated in the same manner as for Retirement benefit without applying a reduction factor for payment before age 65. Maximum Pension: 60% of adjusted average earnings over the best three years.
Minimum Pension: $230.00 per month.
(d) INVALIDITY ASSISSTANCE
Eligibility Requirements: The applicant must:
(i) have insufficient credits to qualify for Invalidity benefit;
(ii) be less than 65; (iii) be medically declared an invalid, other
than as a result of an employment injury. Amount of Benefit: $200.00 per month. (e) SURVIVORS BENEFIT Eligibility Requirements: The deceased, at time of death, had paid at least 150 contributions. A widow or widower must have been married to the deceased for at least one year (includes common-law spouse), children must be under 16, 21 if in full-time education, and any age if invalid.
36

Parents need to have been dependent on the deceased. Amount Of Benefit: The proportion of Retirement/Invalidity benefit shown below:
Widow or widower: 50%; Children: 10% per child – up to 5 children at any one time, 10 if there is no widow(er); Parents: 50%; Minimum pensions:
Widow(er)/Parent - $230.00 per month Children - $95.00 per month Orphans - $97.50 - $110.50 per month
Duration Of Benefit:
Widow or widower older than 40 and incapable of economic employment at time of insured’s death, or widow or widower who is disabled, or a widow pregnant by her late husband at the time of his death, or a widow who has the care of a child of the deceased: life pension or until the beneficiary is entitled to a larger Retirement or Invalidity pension in his/her own right. The Survivor’s pension will cease upon remarriage or cohabitation;
Children: payable until age 16, age 21 if receiving fulltime education or training, for life if invalid;
Parents: payable for life. (f) SURVIVORS’ ASSISSTANCE Eligibility Requirements: Other than for the contribution requirement of the deceased, the applicant must be eligible for survivors pension. Amount Of Benefit:
Widow(er) / Parent - $200.00 per month Children - $80.00 per month Orphans - $82.33 - $95.33 per month
I.2.2. SHORT-TERM BENEFITS (a) SICKNESS BENEFIT Contribution Requirements: At least 40 paid weekly contributions plus one of:
(i) at least 13 contributions in the 26 weeks preceding sickness,
(ii) at least 26 contributions in the last 52 weeks,
(iii) at least 26 contributions in the preceding contribution year.
Waiting Period: 3 days.
Amount Of Benefit: 60% of average weekly insurable earnings during the applicable qualifying period used above, subject to a minimum of $53.08 per week.
Duration Of Benefit: 26 weeks in any continuous period that may be extended to 40 weeks subject to approval of the Medical Officer. Any two or more periods of incapacity separated by not more than eight weeks shall be treated as a continuous period of incapacity. (b) MATERNITY BENEFIT Contribution Requirement: At least 50 paid weekly contributions plus one of:
(i) at least 26 contributions in the 40 weeks prior to commencement of benefit,
(ii) at least 26 contributions in the preceding contribution year.
Amount Of Benefit: 60% of average weekly insurable earnings during the applicable qualifying period used above, subject to a minimum of $53.08 per week. Duration Of Benefit: 13 weeks, starting no earlier than 6 weeks before the expected date of confinement. This may be extended by up to 2 weeks if confinement is delayed.
37

(c) MATERNITY GRANT Contribution Requirement: At least 50 paid contributions.
Amount Of Grant: Lump sum of $400.00
(d) FUNERAL BENEFIT Eligibility: Death of an insured person, other than as a result of an employment-related accident, or the deceased is the spouse of an insured. The insured person must have paid at least 50 contributions. Amount Of Benefit: $1,500 (e) SICKNESS ASSISTANCE Eligibility Requirements: Gainfully employed in the contribution year or the 52 week period preceding incapacity but fails to qualify for Sickness benefit and meets the means test.
Waiting Period: 3 days.
Amount Of Benefit: $46.15 per week.
Duration Of Benefit: 26 weeks in any continuous period that may be extended to 40 weeks subject to approval of the Medical Officer. Any two or more periods of incapacity separated by not more than eight weeks shall be treated as a continuous period of incapacity. I.2.3. INDUSTRIAL BENEFITS (a) INJURY BENEFIT Eligibility: Incapable of work as a result of an accident arising out of insured employment, or as a result of an illness related to employment. There are no qualifying contribution requirements for Injury benefits. Waiting Period: 3 days.
Amount Of Benefit: 66 2/3% of average insurable earnings in the 26 weeks before the accident or disease occurred. Duration Of Benefit: Maximum 40 weeks. (b) DISABLEMENT BENEFIT Eligibility: Partial or total loss of any physical or mental faculty as a result of a job-related accident or disease. Waiting Period: Period of Injury benefit. Amount Of Benefit: The payment of a pension or a grant is based on the percentage loss of faculty suffered.
If degree of disablement is less than 25%, a grant equal to 100 times the percentage degree of disability is paid;
If degree of disablement is 25% or more a benefit equal to the percentage loss of faculty times the rate of injury benefit is paid. A grant of $500 is also paid for disablement assessed at 25% - 66%, and $1,000 for disablement assessed at greater than 66%.
If degree of disablement is 100% and the insured requires constant care and attendance, an allowance of 20% of the disablement benefit shall also be paid.
(c) DEATH BENEFIT Eligibility: Dependants are defined as for survivors’ benefit. Amount Of Benefit: Proportion of disablement pension, the same percentage as for Survivors benefit. (d) INDUSTRIAL FUNERAL BENEFIT Eligibility: Death was due to an accident arising out of and in the course of employment Amount Of Benefit: $1,500.
38

(e) MEDICAL CARE Eligibility: Insured suffers injury or illness arising out of and in the course of employment. Expenses Covered: Reasonable expenses for doctor’s fees, medication, hospitalisation, travelling and constant care and other specified
costs incurred as a result of an employment injury or prescribed disease. Duration: 40 weeks from the date of injury unless the degree of disablement is greater than 25% in which case it is payable for 2 years from the date of injury. This may be extended at the discretion of the Director.
39

40

Appendix II Methodology, Data & Assumptions This actuarial review makes use of the new comprehensive methodology developed at the Financial and Actuarial Service of the ILO (ILO FACTS) for reviewing the long-term actuarial and financial status of a national pension scheme. The review has been undertaken by modifying the generic version of the ILO modelling tools to fit the specific case of The Bahamas and the National Insurance Board. These modelling tools include a population model, an economic model, a labour force model, a wage model, a long-term benefits model and a short-term benefits model. The actuarial valuation begins with a projection of The Bahamas’ future demographic and economic environment. Next, projection factors specifically related to National Insurance are determined and used in combination with the demographic/economic framework to estimate future cash flows and reserves. Assumption selection takes into account both recent experience and future expectations with emphasis placed on long-term trends rather than giving undue weight to recent experience. II.1 Modelling the Demographic &
Economic Developments The Bahamas’ population has been projected beginning with results of the 2000 national census and applying appropriate mortality, fertility and migration assumptions. Only one set of population projections is included in this report . The total fertility rate is assumed to decrease from 2.0 in 2000 to 1.85 in 2020, and remain
constant thereafter. Table 15 shows age-specific and total fertility rates for sample years, including the year the ultimate level is reached. Table 15. Age-Specific & Total Fertility Rates
Age 2001 2010 2020+
15 - 19 0.058 0.036 0.026 20 - 24 0.111 0.097 0.091 25 - 29 0.100 0.104 0.105 30 - 34 0.069 0.078 0.082 35 - 39 0.042 0.043 0.043 40 - 44 0.017 0.018 0.018 45 - 49 0.005 0.006 0.007
TFR 1.99 1.89 1.85
Mortality rates have been determined with the methodology used for the development of the United Nations model life tables and rates in The Bahamas 1989-1991 Life Table. This methodology uses as a base the life expectancy at birth, which for The Bahamas was estimated at 69.7 for males and 75.5 for females in 2001. Improvements in life expectancy have been assumed to follow the “medium” rate as established by the United Nations, beginning in 2001, with explicit provisions made for deaths due to HIV and AIDS. Sample mortality rates and the life expectancies at birth and at age 65 for sample years are provided in Table 16.
41

Table 16. Mortality Rates & Life Expectancy
Males Females
2001 2031 2061 2001 2031 2061
0 0.0191 0.0099 0.0070 0.0189 0.0050 0.0050 5 0.0007 0.0003 0.0001 0.0008 0.0002 0.0001
15 0.0005 0.0002 0.0001 0.0004 0.0002 0.0001 25 0.0033 0.0010 0.0012 0.0018 0.0004 0.0003 35 0.0047 0.0017 0.0013 0.0027 0.0009 0.0006 45 0.0067 0.0032 0.0025 0.0036 0.0019 0.0013 55 0.0128 0.0077 0.0067 0.0065 0.0038 0.0027 65 0.0257 0.0185 0.0145 0.0146 0.0090 0.0059 75 0.0498 0.0401 0.0344 0.0360 0.0278 0.0189 85 0.1034 0.0925 0.0964 0.0871 0.0897 0.0715 95 0.2718 0.2646 0.2878 0.1971 0.2254 0.2014
Life Exp at: Birth 69.7 76.2 77.4 75.5 81.4 84.0
Age 65 16.1 17.7 18.1 19.0 20.2 21.9
Age
Net migration (in minus out) assumed to be 0.12% of the total population and 45% male, by
10-year age groups for sample years are provided in Table 17.
Table 17. Net Immigration
Males Females2001 2031 2061 2001 2031 2061
0 - 9 30 39 43 18 24 27
10 - 19 15 19 21 21 28 3120 - 29 83 110 121 112 149 16430 - 39 40 53 58 44 58 6440 - 49 5 6 7 6 8 950 - 59 -3 -4 -4 0 0 060 - 69 -3 -4 -4 -1 -1 -1
70+ -2 -2 -2 0 0 0
All Ages 164 218 240 200 266 293
Age
The projection of the labour force, i.e. the number of people available for work, is obtained by applying assumed labour force participation rates to the projected number of persons in the total population. Labour force participation rates have been estimated using the results of the
recent Labour Force Surveys conducted by the Department of Statistics. Between 2001 and 2061, age-specific labour force participation rates are assumed to increase at advanced ages for males and all ages for females.
42

Table 18 shows the assumed age-specific labour force participation rates in 2001 and 2061. Between these two years, rates are assumed to change linearly. Table 18. Labour Force Participation Rates
The projected real GDP divided by the projected labour productivity per worker gives the number of employed persons required to produce total output. Unemployment is then measured as the difference between the projected labour force and employment. Estimates of increases in the total wages as well as the average wage earned are required. Annual average real wage increases are assumed equal to the increase in labour productivity, as it is expected that wages will adjust to efficiency levels over time. The inflation assumption affects nominal average wage increases. The insured population is obtained by applying age-specific coverage rates to each year’s projected employed population. Coverage rates refer to the proportion of employed persons that are regular NIB contributors. Age-specific coverage rates are assumed to increase for both males and females as the population ages. The following chart shows projected total coverage rates for males and females from 2001 to 2061.
Chart 18. Projected Coverage Rates 60%
70%
80%
90%
100%
2001 2011 2021 2031 2041 2051 2061
Females
Males2001 2061 2001 2061
17 40% 40% 28% 31%22 87% 87% 78% 80%27 97% 97% 88% 90%32 97% 97% 85% 88%37 95% 95% 87% 89%42 94% 94% 82% 85%47 92% 92% 79% 82%52 89% 90% 71% 76%57 88% 88% 64% 70%62 67% 79% 40% 49%
AgeMales Females
II.2 Projection of NIB Income &
Expenditure This actuarial review addresses all National Insurance revenue and expenditure items. For short-term and employment injury benefits, income and expenditure are projected as a percentage of insurable earnings. For the Long-term Benefits Branch, projections of pensions are performed following a year-by-year cohort methodology. For each year up to 2061, the number of contributors and pensioners, and the dollar value of contributions, benefits and administrative expenditure, is estimated. Once the projections of the insured (covered) population, as described in the previous section, are complete, contribution income is then determined from the projected total insurable earnings, the contribution rate, contribution density and the collection rate. Contribution density refers to the average number of weeks of contributions persons make during a year. Benefit amounts are obtained through contingency factors based primarily on plan experience and applied to the population entitled to benefits. Investment income is based on the assumed yield on the beginning-of-year reserve and net cash flow in the year. NIB’s administrative expenses are modelled as a decreasing percentage of insurable earnings. Finally, the end-of-year reserve is the beginning-
43

of-year reserve plus the net result of cash inflow and outflow. II.3 NIB Population Data and
Assumptions The data required for the valuation of the NIB is extensive. As of December 31st, 2001, required data includes the insured population by active and inactive status, the distribution of insurable wages among contributors, the distribution of paid and credited contributions and pensions in payment, all segregated by age and sex. Scheme specific assumptions such as the incidence of invalidity, the distribution of
retirement by age, density and collection of contributions, are determined with reference to the application of the scheme’s provisions and historical experience. Projecting investment income requires information of the existing assets at the valuation date and past performance of each class. Future expectations of changes in asset mix and expected rates of return on each asset type together allow for long-term rate of return expectations. Details of NIB specific input data and the key assumptions used in this report are provided in tables 19 through 24.
Table 19. 2001 Active Insured Population, Earnings & Past Credits
Male Female Male Female Male Female
15 - 19 3,745 3,083 736 659 55 66 20 - 24 8,529 8,188 1,190 1,084 184 203 25 - 29 8,847 9,658 1,327 1,259 359 422 30 - 34 8,839 9,732 1,505 1,343 551 474 35 - 39 8,503 9,403 1,557 1,377 751 577 40 - 44 6,951 7,793 1,567 1,431 944 654 45 - 49 5,319 5,684 1,602 1,508 1,047 681 50 - 54 3,744 4,107 1,591 1,521 1,094 728 55 - 59 2,844 2,737 1,536 1,455 1,119 765 60 - 64 1,488 1,229 1,441 1,312 1,122 784 65 - 69 349 257 1,422 1,179 936 784
All Ages 59,158 61,872 1,412 1,309 612 488
AgeAverage # of Months of
Past Credits# of Active Insureds Average Monthly Insurable Earnings
44

Table 20. Contributory Pensions in Payment - December 2001
M ale Female M ale Female M ale Female M ale Female
0 - 4 47 51 5 - 9 297 257
10 - 14 527 518 15 - 19 376 415 20 - 24 1 58 65 1 25 - 29 6 3 1 20 12 2 30 - 34 23 21 5 42 26 7 35 - 39 46 41 13 95 46 15 40 - 44 61 62 16 133 22 14 45 - 49 86 72 12 173 19 22 50 - 54 96 111 12 197 22 18 55 - 59 103 207 7 239 16 15 60 - 64 949 1,360 153 248 4 243 12 15 65 - 69 1,520 1,753 96 136 3 248 8 6 70 - 74 1,151 1,245 45 81 1 187 10 2 75 - 79 749 743 5 12 154 2 80 - 84 411 418 1 83 1
85 + 210 178 49
4,990 5,697 722 994 1,379 3,169 195 118
342.00 293.76 322.44 298.28 99.24 167.02 358.49 368.52
Retirement Benefit Invalidity Benefit Disablement Benefit
Avg M onthly Pension
# of Pensioners
Survivors BenefitsAge
Table 21. Non-contributory Pensions in Payment - December 2001
M ale Fem ale M ale Fem ale M ale Fem ale
0 - 4 19 16 5 - 9 135 154
10 - 14 295 268 15 - 19 37 21 170 218 20 - 24 130 95 17 25 25 - 29 151 124 3 30 - 34 159 149 1 4 35 - 39 167 167 14 40 - 44 171 172 1 12 45 - 49 135 102 19 50 - 54 74 93 15 55 - 59 58 98 37 60 - 64 77 155 47 65 - 69 199 374 94 153 56 70 - 74 219 437 36 110 42 75 - 79 219 540 9 29 32 80 - 84 206 571 1 1 9
85 + 225 711 1 2
1 ,068 2 ,633 1 ,300 1 ,469 638 973
200.00 200.00 200.00 200.00 77 .40 107.13
O ld A ge N on-C ontributory Pension
A vg M onth ly Pension
Invalid ity A ssistance Survivors A ssistance
# of Pensioners
A ge
45

Due to the economic downturn in 2001, and projected increased levels of unemployment and underemployment in the coming years, the average number of weeks worked during a year is expected to be lower in the next few years than it was in the past few years. The following table shows assumed long-term density factors, or the average portion of the year for which contributions are made for non-civil servants. For 2002 to 2005, density factors are assumed to be 97%, 98%, 99% and 100% of the rates shown. A contribution density of 100% is assumed for all civil servants. Table 22. Density Of Contributions
The following table shows the expected incidence rates of insured persons qualifying for Invalidity benefit. Table 23. Rates of Entry Into Invalidity
Females
17 - - 22 0.078 0.062 27 0.254 0.193 32 0.612 0.453 37 0.967 0.795 42 1.317 1.259 47 2.174 2.635 52 3.791 5.376 57 5.848 8.563
Age Males
F em ales
17 41% 36%22 66% 64%27 75% 77%32 81% 83%37 82% 86%42 84% 88%47 85% 90%52 86% 90%57 87% 89%
A ge M ales
Table 24 shows the assumed probability of Survivor benefit claims and the average ages of new claimants, groups by the age of the deceased.
Table 24. Probability of a Deceased Insured Having Eligible Survivors & Their Average Ages
Males Females
17 0% - 0% - 22 6% 0.0 0% 0.1 27 14% 0.1 2% 0.3 32 18% 0.5 5% 0.7 37 23% 0.9 14% 1.4 42 24% 1.4 14% 1.3 47 25% 1.3 14% 1.2 52 27% 0.8 11% 0.9 57 32% 0.5 6% 0.2 62 35% 0.6 3% 0.1 67 20% 0.2 2% - 72 19% 0.2 2% - 77 14% 0.2 0% - 82 8% 0.1 0% - 87 6% 0.0 0% -
Avg # of Eligible
Children
Age Avg # of Eligible Children
Probability of Eligible Spouse
Probability of Eligible Spouse
46

Appendix III
Projection Results – Pessimistic & Optimistic Scenarios Table 25. Projected Cash Flows & Reserve, Pessimistic Scenario (millions of $’s)
Cash Outflow
TotalEnd of Year
2001 118.5 64.2 5.0 187.7 94.8 28.2 123.1 64.7 1,098 8.9
2002 120.4 65.8 5.0 191.2 101.6 23.9 125.5 65.7 1,163 9.3 2003 122.6 66.8 5.0 194.4 106.3 24.1 130.4 64.0 1,227 9.4 2004 141.8 67.3 5.0 214.2 124.1 27.4 151.5 62.6 1,289 8.5
2005 150.4 67.5 5.0 222.9 135.1 28.6 163.7 59.1 1,348 8.2 2006 158.3 67.1 5.0 230.3 147.3 29.7 177.0 53.3 1,402 7.9 2007 166.6 69.6 5.0 241.2 160.8 30.9 191.7 49.5 1,451 7.6
2011 203.4 77.0 5.0 285.4 225.8 35.7 261.5 23.9 1,591 6.1 2016 258.3 75.7 5.0 339.0 340.0 42.2 382.2 -43.1 1,530 4.0 2021 323.5 49.8 5.0 378.4 514.7 49.0 563.7 -185.3 928 1.6
2026 402.9 -24.4 5.0 383.5 766.2 60.7 826.9 -443.4 -724 -0.9 2031 500.2 -177.6 5.0 327.6 1,092.2 75.2 1,167.4 -839.9 -4,065 -3.5 2036 622.4 -448.5 5.0 178.9 1,498.0 93.3 1,591.3 -1,412.4 -9,907 -3.5
2041 771.9 -883.2 5.0 -106.3 1,967.2 115.5 2,082.7 -2,189.0 -19,207 -9.2 2051 1,165.0 -2,499.8 5.0 -1,329.8 3,213.6 173.7 3,387.4 -4,717.1 -53,617 -15.8 2061 1,726.4 -5,879.4 5.0 -4,148.0 5,245.7 257.0 5,502.7 -9,650.7 -125,374 -22.8
Negative reserves indicate the indebtedness of the Fund and negative investment income is the current cost of servicing that debt.
YearBenefits
# of times current year's expenditure
Contribution Income
Investment Income Total
Other Income
Cash Inflow ReservesAdmin.&
Other Expenses
Surplus/ (Deficit)
Table 26. Projected Benefit & Assistance Expenditure– Pessimistic Scenario (millions of $’s)
Retirement Invalidity Survivors Assistance Short-term Industrial GDP
2001 40.1 6.5 8.2 17.1 17.5 5.7 6.8% 1.9%
2002 43.4 7.0 9.5 17.3 18.4 6.0 7.1% 2.0%2003 47.0 7.6 10.4 16.9 18.2 6.2 7.3% 2.0%2004 56.0 9.0 12.6 18.1 21.2 7.3 7.4% 2.2%
2005 62.2 10.0 14.2 18.3 22.5 7.9 7.6% 2.3%2006 69.5 11.0 15.9 18.5 23.8 8.6 7.8% 2.4%2007 77.6 12.2 17.8 18.7 25.1 9.2 8.1% 2.5%
2011 119.0 18.3 25.4 19.7 31.1 12.4 9.4% 2.8%2016 197.9 29.2 34.2 20.9 40.1 17.7 11.1% 3.4%2021 327.4 44.5 45.1 22.1 51.1 24.5 13.4% 4.2%
2026 520.5 63.2 60.7 23.9 64.7 33.1 16.0% 5.0%2031 775.4 85.0 80.4 26.4 81.6 43.6 18.4% 5.9%2036 1,093.2 110.0 105.8 29.8 103.1 56.2 20.3% 6.6%
2041 1,453.7 139.2 138.7 34.1 129.8 71.7 21.5% 7.1%2051 2,401.2 228.0 220.2 46.3 201.9 116.1 23.3% 7.8%2061 3,996.9 369.5 322.8 64.5 308.1 184.0 25.6% 8.7%
Benefits as a % of: Year
Pensions & Benefits Insurable
Wages
47

Table 27. Projected Cash Flows & Reserve, Optimistic Scenario (millions of $’s) Cash Outflow
TotalEnd of Year
2001 118.5 64.2 5.0 187.7 94.8 28.2 123.1 64.7 1,098 8.9
2002 124.1 71.4 5.0 200.5 102.3 24.1 126.4 74.1 1,171 9.3 2003 130.2 79.2 5.0 214.4 107.7 24.4 132.1 82.3 1,253 9.5 2004 150.6 88.0 5.0 243.6 121.4 27.0 148.5 95.1 1,349 9.1
2005 159.7 94.6 5.0 259.3 131.5 27.5 159.0 100.2 1,449 9.1 2006 168.0 101.5 5.0 274.5 142.8 27.8 170.6 104.0 1,553 9.1 2007 176.9 108.6 5.0 290.6 155.2 28.0 183.3 107.3 1,660 9.1
2011 215.9 139.1 5.0 360.0 215.2 28.2 243.4 116.6 2,115 8.7 2016 274.3 178.4 5.0 457.6 320.9 26.4 347.3 110.4 2,692 7.8 2021 343.5 207.8 5.0 556.4 483.5 21.4 504.9 51.5 3,097 6.1
2026 427.9 200.8 5.0 633.7 717.7 26.4 744.1 -110.4 2,911 3.9 2031 531.1 119.3 5.0 655.4 1,019.5 32.5 1,052.0 -396.5 1,562 1.5 2036 660.9 -86.9 5.0 579.1 1,392.7 40.2 1,432.9 -853.8 -1,718 1.5
2041 819.6 -482.2 5.0 342.4 1,818.2 49.6 1,867.8 -1,525.4 -7,902 -4.2 2051 1,237.1 -2,242.4 5.0 -1,000.4 2,946.5 74.4 3,020.9 -4,021.2 -35,181 -11.6 2061 1,833.2 -6,636.3 5.0 -4,798.0 4,781.1 109.7 4,890.8 -9,688.8 -102,990 -21.1
Negative reserves indicate the indebtedness of the Fund and negative investment income is the current cost of servicing that debt.
YearBenefits
# of times current year's expenditure
Contribution Income
Investment Income Total
Other Income
Cash Inflow ReservesAdmin.&
Other Expenses
Surplus/ (Deficit)
Table 28. Projected Benefit & Assistance Expenditure– Optimistic Scenario (millions of $’s)
Retirement Invalidity Survivors Assistance Short-term Industrial GDP
2001 40.1 6.5 8.2 17.1 17.5 5.7 6.8% 1.9%
2002 43.4 7.0 9.5 17.3 18.9 6.1 6.9% 2.0%2003 47.0 7.6 10.4 16.9 19.4 6.5 7.0% 2.0%2004 53.6 8.6 12.0 17.3 22.5 7.5 6.8% 2.2%
2005 59.2 9.5 13.5 17.3 23.9 8.1 6.9% 2.2%2006 65.9 10.5 15.1 17.3 25.2 8.7 7.2% 2.3%2007 73.4 11.6 16.8 17.3 26.7 9.4 7.4% 2.4%
2011 111.2 17.2 23.7 17.6 33.0 12.6 8.4% 2.7%2016 184.1 27.4 31.3 17.7 42.6 17.7 9.9% 3.2%2021 304.7 41.7 40.6 17.9 54.3 24.4 11.9% 3.9%
2026 484.7 59.2 53.7 18.4 68.7 32.9 14.1% 4.7%2031 720.8 79.4 70.1 19.4 86.6 43.0 16.2% 5.5%2036 1,013.1 102.5 91.3 20.8 109.5 55.5 17.8% 6.1%
2041 1,338.6 129.5 118.8 22.7 137.9 70.7 18.7% 6.5%2051 2,192.1 211.2 186.9 28.0 214.4 113.9 20.1% 7.2%2061 3,627.5 338.3 273.2 35.4 327.1 179.6 22.0% 8.0%
Benefits as a % of: Year
Pensions & Benefits Insurable
Wages
48

Appendix IV Benefit Experience & Branch Analysis NIB administers three major types of social security benefits - pensions, short-term and industrial or employment injury benefits. While the projections presented in Chapter 3 combined all benefit expenditure, internal accounting procedures separate them into three branches. This allows for better monitoring of experience as each benefit type has different characteristics and funding objectives. Each branch is also expected to meet its expenditure from its income and accumulated reserves. IV.1 Pensions Branch The Pensions Branch presently receives the largest share of contribution income, 73.9%, equivalent to 6.23% of insurable wages. Benefits payable from this branch are Retirement, Invalidity and Survivors benefits, Non-contributory Old Age, Invalidity and Survivors assistances. In most cases these are payable for life. Therefore, expenditure for this branch will
continue to increase for many decades as more pensioners with larger pensions are added. To date, the Pensions Branch has had surpluses every year and total reserves on December 31, 2001 stood at $882 million. This represents 9.8 times Branch expenditure in 2001. (The amount of reserves relative to annual expenditure is a useful measure of how well benefits are funded. While a ratio of almost 10 for pensions indicates that reserves are insufficient to cover total accrued liabilities, it is consistent with the partial funding method adopted by NIB.) Expenditure for each benefit and assistance, for 1997 to 2001, expressed as a percentage of insurable wages is shown in Table 29. While dollar expenditure has increased each year, costs as a percent of insurable wages decreased between 1997 and 2000 due mainly to higher than expected increases in contribution income. (Actual amounts paid by benefit type are provided in Appendix V.)
Table 29. Pensions Branch Expenditure as a Percent of Insurable Wages, 1997 - 2001
1997 1998 1999 2000 2001
Benefits Retirement 2.61% 2.70% 2.73% 2.70% 2.84%
Invalidity 0.42% 0.44% 0.45% 0.44% 0.47% Survivors 0.53% 0.54% 0.56% 0.55% 0.58%
Assistance OANCP 0.91% 0.83% 0.75% 0.63% 0.62%
Invalidity 0.52% 0.52% 0.50% 0.45% 0.46% Survivors 0.16% 0.17% 016% 0.14% 0.13%
Administrative & Other Expenses 1.93% 1.58% 1.42% 1.23% 1.28%
Total 7.08% 6.78% 6.57% 6.14% 6.38% Total Benefits (millions of $’s) $49.8 $52.3 $63.3 $66.3 $71.7
49

Table 30. Pensions In Payment, Awarded & Terminated, 1997 - 2001
Average Monthly Pension Paid in Dec 1996
Awards, 1997 - 2001
Terminated 1997 - 2001
Paid in Dec 2001 Dec. 1996 Dec. 2001
Benefits Retirement 7,304 5,228 1,845 10,687 $270 $316
Invalidity 1,166 1,129 579 1,716 $256 $308 Survivors 2,094 1,826 974 2,946 $136 $229
Assistance OANCP 4,751 909 1,959 3,701 $160 $200
Invalidity 2,483 1,097 811 2,769 $160 $200 Survivors 941 671 594 1,018 $86 $151
Figures for Survivors represent the number of claims, not the number of pensioners The above table highlights pension activity between 1997 and 2001. As expected the number of pensions in payment has increased for all benefits and assistances with the exception of OANCP. Also, the average monthly pensions for all benefits and assistances have increased over the past five years. The number of new awards of assistance remains higher than one would reasonably expect given that only three years of contributions are required for a contributory benefit. The Board is encouraged to tighten the administration of both the award and the semi-annual verification process to ensure that only those who are in need, and who meet the eligibility requirements, qualify. (See Section 4.3) Details of long-term projections of both the number of pensioners and expenditure are presented in Chapter 3. Given the long-term nature of pension benefits, expenditure will continue to increase, eventually surpassing income. Since it is expected that the other benefit branches will hold only small reserves, if the Pensions Branch ever exhausts, depletion of the entire National Insurance Fund would follow shortly thereafter. Therefore, future contribution rate increases will be required, with most of the increased revenue allocated to the Pensions Branch.
No change to the Pension Branch’s allocation of contribution income is required at this time. However, as will be discussed in Section IV.3, a transfer of reserves from the Industrial Benefits Branch to the Pensions Branch is recommended. IV.2 Short-term Benefits Branch Unlike the Pensions Branch, the Short-term Benefits (STB) Branch is financed on a pay-as-you-go basis. That is, current income is expected to meet current expenditure, with only a small reserve required to cover fluctuations in income and/or expenditure. Over time, the cost of benefits in this branch is not expected to increase significantly, and if it does, small adjustments to the allocation of contribution income between branches may be made. Analysis of the STB Branch is limited to determining whether or not the present portion of contribution income allocated is sufficient to meet projected payouts until the next actuarial review. By comparing total branch expenditure in recent years as a percentage of insurable earnings to the proportion of insurable wages allocated to that branch, the adequacy of the present allocation is assessed. If the percentage of contribution and investment income allocated is expected to meet the projected cost of benefits
50
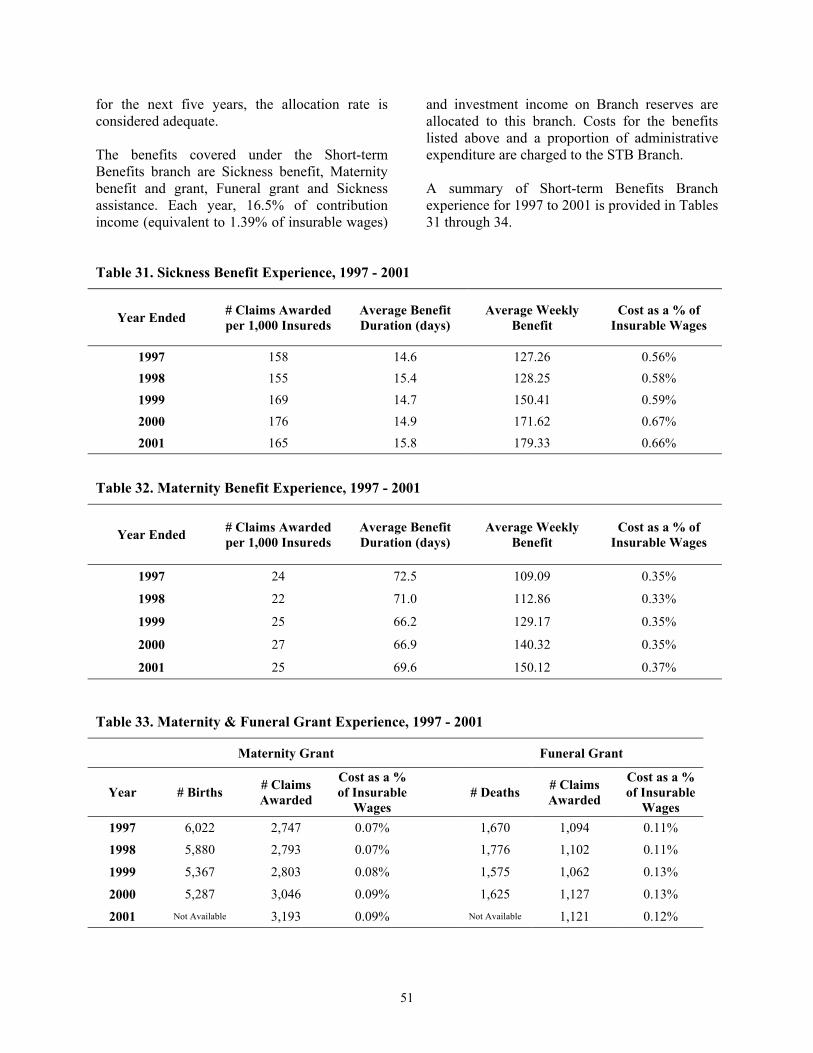
for the next five years, the allocation rate is considered adequate. The benefits covered under the Short-term Benefits branch are Sickness benefit, Maternity benefit and grant, Funeral grant and Sickness assistance. Each year, 16.5% of contribution income (equivalent to 1.39% of insurable wages)
and investment income on Branch reserves are allocated to this branch. Costs for the benefits listed above and a proportion of administrative expenditure are charged to the STB Branch. A summary of Short-term Benefits Branch experience for 1997 to 2001 is provided in Tables 31 through 34.
Table 31. Sickness Benefit Experience, 1997 - 2001
Year Ended # Claims Awarded per 1,000 Insureds
Average Benefit Duration (days)
Average Weekly Benefit
Cost as a % of Insurable Wages
1997 158 14.6 127.26 0.56% 1998 155 15.4 128.25 0.58% 1999 169 14.7 150.41 0.59% 2000 176 14.9 171.62 0.67% 2001 165 15.8 179.33 0.66%
Table 32. Maternity Benefit Experience, 1997 - 2001
Year Ended # Claims Awarded per 1,000 Insureds
Average Benefit Duration (days)
Average Weekly Benefit
Cost as a % of Insurable Wages
1997 24 72.5 109.09 0.35%
1998 22 71.0 112.86 0.33%
1999 25 66.2 129.17 0.35%
27 66.9 140.32 0.35%
2001 25 69.6 150.12 0.37%
2000
Table 33. Maternity & Funeral Grant Experience, 1997 - 2001
Maternity Grant Funeral Grant
Year # Births # Claims Awarded
Cost as a % of Insurable
Wages
# Deaths # Claims
Awarded
Cost as a % of Insurable
Wages 1997 6,022 2,747 0.07% 1,670 1,094 0.11%
1998 5,880 2,793 0.07% 1,776 1,102 0.11%
1999 5,367 2,803 0.08% 1,575 1,062 0.13%
2000 5,287 3,046 0.09% 1,625 1,127 0.13%
2001 Not Available 3,193 0.09% Not Available 1,121 0.12%
51

Table 34. Administrative & Total Expenditure – STB Branch
As a % of Insurable Wages Year Admin. & Other
Expenditure Total Branch Expenditure
1997 0.34% 1.44%
1998 0.33% 1.42%
1999 0.30% 1.46%
2000 0.28% 1.51%
2001 0.29% 1.53% With 1.39% of insurable wages allocated from contribution income plus investment returns, the STB Branch incurred deficits in 1999 to 2001 following small surpluses in 1997 and 1998. While experience has been relatively stable for most benefits, Sickness benefit expenditure increased significantly in 2000. However, administrative costs as a percent of insurable wages, has generally declined. Estimates of STB Branch annual expenditure for the next four years are shown in Table 35: Table 35. Projected STB Branch Costs
Benefit /Expense As a % of Insurable Wages
Sickness Benefit 0.68%
Maternity Benefit 0.35%
Maternity Grant 0.10%
Funeral Grant 0.12%
Sickness Assistance 0.00%
Admin. Expenses 0.25%
Total 1.50%
The total estimated cost of 1.5% of insurable earnings exceeds the 1.39% of insurable earnings now allocated to the STB Branch. Therefore, as only a small reserve on which investment income will be realised is maintained, the present allocation of contribution income is insufficient to meet projected Branch expenditure.
At the end of 2001, the STB Branch had reserves of $8.4 million, only 39% of the expected expenditure in 2002. This reserve is slightly below the minimum recommended reserve of 50% of the following year’s expenditure. With expenditure expected to exceed contribution income, and only a small amount of investment income anticipated, a transfer of reserves from another Branch may be required soon. The recently enacted Employment Act 2002 has resulted in an increase in mandatory maternity leave from 8 to 12 weeks and a reduction in the rate of wages payable from 40% to 331/3% while the woman is on maternity leave. It was also expected that NIB would raise the rate of payment for Maternity benefit from 60% to 662/3% of average insurable wages. Both changes will bring The Bahamas into line with ILO Convention 103. Another change will allow a husband’s contributions to enable his wife to qualify for a Maternity grant if her contributions are insufficient. If implemented, these changes will increase the cost of Maternity Benefits and thus the amount payable from the STB Branch. It is estimated that all proposed changes would increase Maternity benefit costs by between 0.05% and 0.1% of insurable wages. With the present allocation insufficient to cover expected outgo under current provisions, the proportion of contribution income allocated to the STB Branch will have to be increased. It is, therefore, recommended that an additional 0.17% of insurable wages be allocated to the STB Branch. This will bring STB Branch allocations to 1.56% of insurable wages or 18.5% of contribution income. As will be discussed in the following section, the proportion allocated to the Industrial Benefits Branch should be decreased by a similar percentage. While the STB Branch reserve is at the low end of the acceptable range, no transfer of reserves is being recommended if the allocation rate for contributions is increased.
52

IV.3 Industrial Benefits Branch Similar to the approach used for the Short-term Benefits Branch, the analysis of the Industrial Benefits Branch adopts a short-term perspective. Industrial Benefits are those payable following on-the-job accidents and illnesses that arise due to employment. Benefits include Injury benefit, Medical Care, Industrial Funeral grant,
Disablement grants, Death and Disablement pensions. Each year this branch receives 8.5% of contribution income, or 0.72% of insurable wages, plus investment income on its reserves, less benefit costs and a portion of NIB administrative expenditure. The following tables highlight Industrial Benefit Branch experience for 1997 to 2001.
Table 36. Injury Benefit Experience, 1997 to 2001
Year Ended # Claims Awarded per 1,000 Insureds
Average Benefit Duration (days)
Average Weekly Benefit
Cost as a % of Insurable Wages
1997 12 20.9 149.09 0.07%
1998 14 21.1 147.58 0.09%
1999 13 21.9 166.20 0.07%
2000 12 21.0 194.66 0.08%
2001 10 22.7 208.01 0.07%
Table 37. Medical Care & Disablement Grant Experience, 1997 - 2001
Medical Care Disablement Grant
Year # Claims Awarded Cost as a % of Insurable Wages # Claims Awarded Cost as a % of
Insurable Wages
1997 977 0.32% 43 0.004% 1998 1,311 0.29% 51 0.004%
1999 836 0.21% 56 0.004%
2000 749 0.21% 61 0.005%
2001 667 0.20% 110 0.007%
Table 38. Disablement & Death Benefit Awards & Pensions In Payment, 1997 - 2001
Disablement Benefit Death Benefit
Year # Pensions Awarded
Pensioners In Payment (December)
Payments as a % of Ins.
Wage
# Pensions Awarded
Pensioners In Payment (December)
Payments as a % of Ins.
Wages
1997 28 237 0.10% 10 73 0.02%
1998 19 245 0.11% 12 76 0.02%
1999 23 262 0.11% 9 83 0.02%
2000 15 288 0.11% 10 86 0.02%
2001 26 313 0.11% 2 86 0.02%
53

Table 39. Administrative & Total Expenditure – IB Branch
As a % of Insurable Wages Year Admin. & Other
Expenditure Total Branch Expenditure
1997 0.15% 0.68%
1998 0.16% 0.67%
1999 0.13% 0.55%
2000 0.13% 0.55%
2001 0.12% 0.53%
Estimates of Industrial Benefits Branch annual expenditure as a percentage of insurable earnings for the next four years are shown in Table 40: Table 40. Projected IB Branch Costs
Benefit /Expense As a % of Insurable Wages
Injury Benefit 0.10%
Medical Care 0.20% Disablement Benefit & Grant 0.13%
Death Benefit 0.02%
Admin. Expenses 0.10%
Total 0.55%
The total estimated cost of 0.55% of insurable wages is below the 0.72% of insurable wages now allocated to the Industrial Benefits Branch. The funding method adopted for the Industrial Benefits Branch is different from the Pensions and Short-term Benefit Branches. In fact, two separate methods are used:- (i) pay-as-you-go for Injury Benefit, Medical
Care, Industrial Funeral and Disablement Grants,
(ii) full funding for Disablement and Death Benefits. (This means that the present value of all expected future payments of each claim is charged at the time the claim is awarded.)
The ILO often recommends this dual approach for the funding of industrial benefits so that the cost of employment-related injuries is charged to current employers in the period during which the accident occurred. (Only employers contribute towards Industrial Benefit coverage.) This approach is also useful if the contribution rates payable by individual employers are based on industry experience. As indicated in the above tables, industrial accidents in The Bahamas are relatively few. Also, contribution rates are not experience rated. Therefore, this dual approach to funding Industrial Benefits serves little purpose for the NIB. From a practical standpoint it creates additional administrative procedures as well as a scenario where the cost of some pensions is fully funded while the majority of the Board’s future pension payments (Retirement pensions) are only partially funded. The present practice of setting aside specific amounts, commonly called “capital values,” from the Industrial Benefits Branch and allocating them to the Death and Disablement Reserve is not necessary and thus should be eliminated. Instead, Industrial benefits may be funded on the same pay-as-you-go basis as used for the STB Branch. At the end of 2001 the Industrial Benefits Branch had reserves of $96.5million and the balance in the Death & Disablement Reserve was $16.3 million. Together, this represents 15 times the branch’s 2001 cash expenditure. Such a high funding level is not required, even if the funding method is changed to pay-as-you-go. This large amount of reserves has accumulated as industrial accident experience has been much better than expected when the present allocation rate was established. A suitable funding level for the Industrial Benefits Branch under pay-as-you-go funding would be 2 to 3 times the previous year’s expenditure. (A higher funding level than for the STB Branch is appropriate as Medical Care costs can be quite volatile.) With estimated 2002 expenditure of $7.5 million, a reserve of $15 to $20 million is acceptable.
54

It is therefore recommended that the Death and Disablement Reserve be eliminated and a combined $95 million be transferred to the Pensions Branch from the Death and Disablement Reserve and the Industrial Benefits Branch. During the period 1997 to 2001, Industrial Benefits Branch cash expenditure averaged 0.6% of insurable wages, and 0.54% in 1999 to 2001. With contribution allocations of 0.72% of insurable wages plus investment income on Branch reserves, combined income over the period has averaged 1.11% of insurable wages.
Given past experience, the recommended change in funding method, and the transfer out of reserves, it is also recommended that the allocation of contribution income to the Industrial Benefits Branch be reduced from 0.72% to 0.55% of insurable earnings. This would change the allocation of contribution income from 8.5% to 6.5%. The 2% of contribution income no longer allocated to the Industrial Benefits Branch should instead be allocated to the Short-term Benefits Branch.
55

56

Appendix V NIB Income & Expenditure, 1997 – 2001
(Expressed in thousands of $’s)
1997 1998 1999 2000 2001
IncomeContribution Income 81,471 84,815 103,713 114,016 118,502 Investment Income 55,394 58,235 57,641 59,276 64,198 Other Income 5,083 5,450 5,125 5,008 5,049
Total Income 141,948 148,500 166,479 178,300 187,749
ExpenditureSickness Benefit 5,453 5,846 7,328 9,009 9,345 Maternity Benefit 3,438 3,330 4,270 4,733 5,145 Maternity Grant 687 698 1,038 1,262 1,283 Funeral Benefit 1,032 1,106 1,584 1,699 1,696 Sickness Assistance 25 25 22 19 21
Retirement Benefit 25,251 27,199 33,639 36,480 39,883 Invalidity Benefit 4,046 4,442 5,532 5,907 6,560 Survivor's Benefit 5,118 5,420 6,855 7,451 8,154 Old-Age Assistance 8,823 8,381 9,176 8,508 8,692 Invalidity Assistance 5,002 5,189 6,170 6,035 6,533 Survivor's Assistance 1,571 1,700 1,956 1,870 1,862
Medical Care 3,148 2,953 2,562 2,775 2,759 Injury Benefit 708 874 879 1,054 956 Disablement Benefit 938 1,074 1,315 1,523 1,552 Death Benefit 214 228 267 296 308 Disablement Grant 40 36 51 64 101
Total Benefits 65,495 68,500 82,644 88,685 94,850
Admininstrative Expenses 19,847 19,929 21,991 21,214 22,809 Admin. Exp - Medical Branch 257 395 285 428 4,445 Other Expenses 3,636 848 879 911 975
Total Admin. & Other Expenses 23,741 21,172 23,155 22,553 28,229
Total Expenditure 89,235 89,672 105,799 111,238 123,079
Surplus/(Deficit) 52,713 58,827 60,680 67,062 64,670
End of Year Benefits Reserves 831,001 890,229 951,351 1,018,999 1,097,910
57
The following persons assisted in the preparation of this report: Verdie Farquharson-Kriz Royston Jones Azella Major Yvette Morrison DeAndrea Neely
58

Notes
