olex thesis.pdf
TRANSCRIPT

8/10/2019 olex thesis.pdf
http://slidepdf.com/reader/full/olex-thesispdf 1/114
Singlet and Triplet Excitons inOrganic Semiconductors
Oleksandr V. Mikhnenko

8/10/2019 olex thesis.pdf
http://slidepdf.com/reader/full/olex-thesispdf 2/114
Singlet and Triplet Excitons in Organic Semiconductors
Oleksandr V. Mikhnenko
PhD Thesis
University of Groningen, the Netherlands
Zernike Institute PhD Thesis Series 2012-02
ISSN: 1570-1530
ISBN: 978-90-367-5201-5 (print)
ISBN: 978-90-367-5202-2 (digital)
This research forms part of the research program of the Dutch
Polymer Institute (DPI), Technology Area Functional Polymer Systems,
DPI project #518.
Cover design by Oksana Pasishnychenko (www.oksancia.com).
Printed by Uitgeverij BOXPress (www.proefschriftmaken.nl).
Copyright © Oleksandr Mikhnenko, Groningen 2011.

8/10/2019 olex thesis.pdf
http://slidepdf.com/reader/full/olex-thesispdf 3/114
RIJKSUNIVERSITEIT GRONINGEN
Dynamics of Singlet and TripletExcitons in Organic Semiconductors
Proefschrift
ter verkrijging van het doctoraat in de
Wiskunde en Natuurwetenschappen
aan de Rijksuniversiteit Groningen
op gezag van de
Rector Magnificus, dr. E. Sterken,
in het openbaar te verdedigen op
vrijdag 13 januari 2012
om 14:30 uur
door
Oleksandr Viktorovich Mikhnenko
geboren op 24 februari 1983
te Brusyliv, Oekraïne

8/10/2019 olex thesis.pdf
http://slidepdf.com/reader/full/olex-thesispdf 4/114
Promotores: Prof. dr. M. A. Loi
Prof. dr. ir. P. W. M. Blom
Beoordelingscommissie: Prof. dr. V. Dyakonov
Prof. dr. P. A. Bobbert
Prof. dr. J.C. Hummelen

8/10/2019 olex thesis.pdf
http://slidepdf.com/reader/full/olex-thesispdf 5/114
dedicated to my parents
“there is no greater gift than education”

8/10/2019 olex thesis.pdf
http://slidepdf.com/reader/full/olex-thesispdf 6/114
Contents
1. General Introduction .......................................................................... 9
1.1 Organic Semiconductors ......................................................................................... 10
1.2 Excitons are Energy Chunks .............................................................................. 11
1.3 Energy and Charge Transfer .............................................................................. 13
1.4 The Physics of Exciton Diffusion ....................................................................... 15
1.5 Exciton-exciton annihilation .............................................................................. 17
1.6 Diffusion Limited Exciton Quenching ............................................................... 19
1.7 Measuring Singlet Exciton Diffusion Length .................................................... 20
1.8 Do Triplets Diffuse Further? .............................................................................. 23
1.9 Motivation and Scope ......................................................................................... 24
1.10 References ........................................................................................................... 26
2. Exciton Quenching in Skin Layer of Spin-Coated Polymer Films ....... 31
2.1 Introduction ........................................................................................................ 32
2.2 Thickness Dependence of the PL Decay Times ................................................. 34
2.3 Measurements of Exciton Diffusion Length ...................................................... 36
2.4 Skin Layer in Spin-Coated Films ....................................................................... 38
2.5
Conclusions ......................................................................................................... 42
2.6 Methods .............................................................................................................. 42
2.7 References ........................................................................................................... 44
3. Exciton Diffusion Length in Narrow Band Gap Polymers .................. 47
3.1 Introduction ........................................................................................................ 48
3.2 Modeling Photoluminescence Decays ............................................................... 50
3.3 Checking for PCBM Aggregation ....................................................................... 52
3.4 Exciton Diffusion in Si-PCPDTBT ..................................................................... 54
3.5
Discussion ........................................................................................................... 55
3.6 Conclusions ......................................................................................................... 56
3.7 Methods ............................................................................................................... 57
3.8 References ........................................................................................................... 58
4. Effect of Thermal Annealing on Exciton Diffusion ............................ 61
4.1 Introduction ........................................................................................................ 62
4.2 Effect of Annealing on Crystallinity and Photophysical Properties ................. 63
4.3 Exciton Diffusion Measurements ...................................................................... 65
4.4
Using Different Exciton Quenching Molecule ................................................... 67
8/10/2019 olex thesis.pdf
http://slidepdf.com/reader/full/olex-thesispdf 7/114
4.5 Discussion ........................................................................................................... 69
4.6 Conclusions .......................................................................................................... 70
4.7 Methods .............................................................................................................. 70
4.8 References ........................................................................................................... 72
5. Sensitive Triplet Exciton Detection .................................................... 75
5.1 Introduction ........................................................................................................ 76
5.2 Increase of Phosphorescence Intensity ............................................................. 77
5.3 Photoinduced Absorption .................................................................................. 78
5.4 Dependence on Excitation Power ..................................................................... 80
5.5 Discussion ........................................................................................................... 81
5.6 Conclusions ......................................................................................................... 82
5.7 Methods .............................................................................................................. 82
5.8
References ........................................................................................................... 84
6. Direct Measurement of the Triplet Exciton Diffusion Length ........... 87
6.1 Introduction ....................................................................................................... 88
6.2 Sample Structure ................................................................................................ 89
6.3 Injection of Triplet Excitons .............................................................................. 91
6.4 Detection of Triplet Excitons ............................................................................. 93
6.5 Modeling the Triplet Penetration Profile .......................................................... 94
6.6 Discussion ........................................................................................................... 95
6.7
Conclusions ......................................................................................................... 95 6.8 Methods .............................................................................................................. 96
6.9 References ........................................................................................................... 97
Summary ............................................................................................ 99
Samenvatting ...................................................................................... 101
Curriculum Vitae ................................................................................ 105
List of Publications ............................................................................. 106
Acknowledgments ............................................................................... 109

8/10/2019 olex thesis.pdf
http://slidepdf.com/reader/full/olex-thesispdf 8/114

8/10/2019 olex thesis.pdf
http://slidepdf.com/reader/full/olex-thesispdf 9/114
9
Chapter 1
General Introduction
In this chapter basic concepts and definitions regarding the physical properties of
organic semiconductors are introduced. The importance of exciton diffusion for the
operation of optoelectronic devices is emphasized. By reviewing available
experimental methods to study exciton diffusion we show that new techniques are
needed to systematically measure singlet and triplet exciton diffusion length in
organic semiconductors. The precise measurement of these physical quantities willhave an important role in driving the design of new materials for high performing
solar cells and light emitting diodes. Finally the scope of this thesis is summarized.

8/10/2019 olex thesis.pdf
http://slidepdf.com/reader/full/olex-thesispdf 10/114
General Introduction
10
1.1 Organic Semiconductors
Organic semiconductors are carbon based compounds that show semiconducting
properties. All kinds of optoelectronic devices including light emitting diodes (LED), [1]
solar cells,[2] field effect transistors,[3] memories,[4] and sensors[5] have been made
using this class of semiconductors. Compared to the inorganic counterparts, the most
important advantage of organic semiconductors is the possibility of tuning their
properties by chemical modifications. Thus the efficiency of organic solar cells has been recently almost doubled up to 8.3% by synthesizing new polymers while keeping
the device structure the same.[6,7]
Organic electronics enables innovative thinking of applications. Imagine that to
put a solar cell to the roof of a house one would only need to paint it, several times
though. Illustrations and photographs in newspapers may become animated just like
in the world of Harry Potter.[8] Reality is not far from this technological world;
organic displays and flexible solar cells are already for sale. Organic semiconductors
will continue to find applications in new niche markets, in which flexible substrates,
lightweight, biocompatibility, and low cost are more important factors than highperformances. They, however, unlikely will substitute silicon in computer chips or
similar devices since the charge carrier mobility and stability at ambient conditions
are much better in inorganic semiconductors.
Alternation of single and double bonds between carbon atoms – conjugation – is
a common structural property of all organic semiconductors. This zigzag backbone
usually adopts planar conformation (Figure 1.1a). Covalent bonds between carbon
atoms of such a backbone are formed by three sp2 hybridized orbitals and one
unhybridized orbital, which is commonly denoted as p z .[9] Unhybridized orbitals p z
provide electron clouds above and below the molecular plain. The adjacent p z orbitals
Figure 1.1: (a) A conjugated backbone with overlapping p z orbitals that point out of the
molecular plain. (b) Highest occupied and lowest unoccupied molecular orbitals (HOMO
and LUMO). Arrows denote two electrons with different spins.

8/10/2019 olex thesis.pdf
http://slidepdf.com/reader/full/olex-thesispdf 11/114
Chapter 1
11
overlap resulting in shared molecular orbitals that are often referred as extended π-
system. Electrons on these orbitals are spatially delocalized meaning that they belong
to the whole π-system, but not to specific carbon atoms. A π-system can be extended
over the entire organic molecule or just over a part of it – conjugated segment.
In the ground state electrons fill orbitals of the lowest energies with maximum
two electrons of opposite spins per each orbital. The energetically highest occupied
(HOMO) and the lowest unoccupied (LUMO) molecular orbitals are very important
for electrical conductivity and optical properties of organic semiconductors. They are
often denoted as π and π* orbitals in π-systems, respectively (Figure 1.1b). The
energy difference between HOMO and LUMO is often referred as a band gap that
typically values between 1.5 and 3.5 eV.
Electrical charges can be conducted in a thin film composed of conjugated
molecules when, for instance, an electron is injected into LUMO of a molecule,followed by hopping to LUMO of a neighboring molecule and from that molecule to
other molecules etc. The physical mechanism that determines conductivity of charges
is hopping due to the weak interactions between molecules and to the significant
degree of disorder, which is usually present in amorphous or polycrystalline thin films
of organic semiconductors.[10] Positive charges can be conducted by hopping among
HOMOs of molecules.
1.2 Excitons are Energy Chunks
The ground state of the majority of organic molecules is electrically neutral and has
net spin zero. A molecule can be excited when one electron from the HOMO is
promoted to the LUMO, for instance by absorption of a photon. The Jablonski
diagram in Figure 1.2 presents possible transitions between electronic states of an
isolated molecule. These states are positioned vertically by their energy and grouped
horizontally by spin multiplicity. Electronic states with net spin zero or one are called
singlets or triplets, respectively. The arrow 1 represents the absorption of a photon
that brings a molecule from the ground state S0 to the first singlet excited state S1;
transitions to higher singlet excited states are also possible (not shown in Figure 1.2).The transition 2 results in the emission of light and is called fluorescence. Triplet
excited state T1 can be created via the intersystem crossing 4. The radiative transition
6 is called phosphorescence. Fluorescence and/or phosphorescence can be also
referred as photoluminescence (PL) when these transitions are initiated by
absorption of a photon. The non-radiative transitions 3 and 5 compete with
fluorescence and phosphorescence. And finally transition 7 is the absorption of a
photon that brings state T1 to higher triplet excited sates Tn. This process can be used
to detect triplet excitons in photoinduced absorption experiments.[11]

8/10/2019 olex thesis.pdf
http://slidepdf.com/reader/full/olex-thesispdf 12/114
General Introduction
12
In organic solids interactions of an excited molecule with neighbors impose
reorganization of intermolecular distances and partial polarization of electronic
configuration of the surrounding. This collective response to an excitation is called
exciton or, in case of particularly strong interactions with surrounding, exciton-
polaron.[12] Because intermolecular interactions are usually weak in organic materials
excitons are strongly localized; often the localization is limited mostly to a single
conjugated segment. Excitons are electrically neutral and bear potential energy that
can be released when the molecule returns to the ground state. Excitons with total
spin of zero or one are called singlet or triplet, respectively. Although the Jablonski
diagram in Figure 1.2 describes isolated molecules, transitions in organic solids are
usually similar. Therefore singlet and triplet excitons are often denoted as S1 and T1.
Two charged states – positive or negative polarons – can be created by
subtraction from the HOMO or addition to the LUMO of an electron, respectively.
Polaron entities include the charge and reorganization energy of the surrounding.
Terms “hole” and “electron” are often used to denote positive and negative charges.
An exciton can be described as a bound electron-hole pair, which is localized at a
single conjugated segment. Such localization is due to relatively low dielectric
constant of the organic medium resulting in the strong electrostatic attraction
between the opposite charges. Furthermore, the excitonic wavefunction is usually
localized at a single conjugated segment due to weak interactions between molecules
in organic solids. The work needed to separate electron and hole of an exciton is
called binding energy and is usually of the order of 0.3-0.5 eV for singlet excitons.[13-15]
Figure 1.2: The Jablonski diagram of electronic transitions in organic semiconductors.The energies of singlet (S0 and S1) and triplet (T1 and Tn) states are scaled vertically.
Absorption (1) fluorescence (2), intersystem crossing (4), phosphorescence (6),
nonradiative transitions (3 and 5), and photoinduced absorption (7) are presented as
arrows.

8/10/2019 olex thesis.pdf
http://slidepdf.com/reader/full/olex-thesispdf 13/114
Chapter 1
13
The binding energy of triplets is higher due to the attractive exchange interaction
between electron and hole of the same spin orientation.[11]
Triplet excitons cannot be directly generated by the absorption of a photon.
Photons do not show strong coupling to electronic spins, because electromagneticradiation does not carry any torque. The electron spin is an angular momentum that
must be conserved. Thus the assistance of spin-orbit coupling and electron-phonon
interaction are required to enable transitions such as the 4, 5 and 6 in Figure 1.2.
Organic semiconductors are composed of lightweight atoms such as carbon,
hydrogen, oxygen, nitrogen and sulfur, which do not show strong spin-orbit coupling.
Consequently, the transitions between excitonic states of different spin multiplicity
are normally not efficient in this class of materials. Therefore triplet lifetime is about
6 orders of magnitude longer than that of singlets in organic semiconductors.
The working principle of light emitting diodes is based on the generation ofexcitons. Electrons and holes are injected into an organic semiconductor, which
serves as active layer for the LED. Excitons are created when electron and hole meet
each other in the active layer. According to the quantum mechanical rules of
momentum addition, 25% of all excitons created in this way are singlets and 75% are
triplets. The radiative recombination of triplet excitons is not very probable, thus only
singlet excitons may contribute to the emitted light. That limits the internal quantum
efficiency of an LED to 25%.[11,16] In some materials with low charge carrier mobility
the formation of singlet excitons may be somewhat more or less favorable due to the
hyperfine fields.[17–26] Nevertheless, in order to achieve highly performing LEDs triplet
excitons should be manipulated toward radiative recombination.[11,27–31] In this
respect it is highly important to study the dynamics of both singlet and triplet
excitons in order to improve the performance of organic LEDs.
1.3 Energy and Charge Transfer
An exciton can be relocated from an exited “donor” molecule to an “acceptor”
molecule via a non-radiative process of energy transfer. At the end of this process the
donor molecule is in the ground state and the acceptor molecule is in the excitedstate. Förster and Dexter mechanisms of energy transfer are distinguished (Figure
1.3a and b).[32–34] Förster mechanism is based on a dipole-dipole electromagnetic
interaction and occurs when the emission spectrum of donor has significant overlap
with the absorption spectrum of acceptor. Therefore this type of energy transfer is
called resonant energy transfer (FRET). The efficiency of FRET decreases with the
distance r between donor and acceptor as 6r − . Significant FRET can be typically
observed for donor-acceptor separations in the range of 2-5 nm.[34–36] Usually, only
singlet excitons can be transferred via the Förster mechanism; however, a triplet
exciton that is located at a phosphorescent donor also can undergo FRET. [37–42]

8/10/2019 olex thesis.pdf
http://slidepdf.com/reader/full/olex-thesispdf 14/114
General Introduction
14
Figure 1.3: (a) Förster energy transfer. (b) Dexter energy transfer enables diffusion of
triplet excitons. The horizontal lines are HOMO and LUMO energy levels of donor (D)
and acceptor (A) molecules; the asterisk denotes excited state. The dashed arrows
represent simultaneous rearrangement of the electronic configuration. (c) Electron
transfer from an excited donor molecule (D*) to a neutral acceptor (A).
Förster energy transfer is observed in photosynthesis when the energy of absorbed
photons is channeled to the reaction center.
Actual exchange of electrons between donor and acceptor takes place during the
Dexter energy transfer (Figure 1.3b).[11,32,34] This may happen when donor and
acceptor are only about 1 nm apart so there is a significant overlap of molecular
orbitals. The probability of Dexter energy transfer exponentially decreases with the
distance between donor and acceptor. Both singlet and triplet excitons may be
transferred by this mechanism. FRET usually outperforms the efficiency of the Dexter
energy transfer for singlet excitons, while triplets may be transferred between non-phosphorescent molecules only by the Dexter mechanism. In contrast to FRET,
Dexter energy transfer does not require the overlap between emission and absorption
spectra of the donor and acceptor molecules. However, the exciton energy of the
acceptor should be lower than that of the donor molecule for efficient transfer.
Electron and hole, which are coloumbically bound in an exciton, can be
separated when their binding energy is overcome. Such a separation can be efficient
at the interface with an electron accepting material. If the energy of LUMO of the
acceptor is significantly lower than LUMO of the excited donor molecule, then
electron transfer from donor may take place (see Figure 1.3c). This process is called

8/10/2019 olex thesis.pdf
http://slidepdf.com/reader/full/olex-thesispdf 15/114
Chapter 1
15
charge transfer; it is a short range interaction that takes place when there is a
significant spatial overlap between wavefunctions of the donor and acceptor
molecules. As a result of the electron transfer donor and acceptor are positively andnegatively charged, respectively. Hole transfer is also possible when the energy levels
of a donor and an acceptor are properly aligned. The physical mechanism of this
process is the same as that of the electron transfer.
1.4 The Physics of Exciton Diffusion
Diffusion is a random motion of particles in space that leads to spreading from the
areas of high concentration to the areas of low concentration. Diffusion is regarded to
be normal when it can be described by the following equation:
2n n D n
t τ
∂= ∇ −
∂, (1.1)
where n is the concentration of particles, D is a diffusion coefficient, 2∇ is Laplace
operator, and τ is the particle lifetime. The room mean square displacement of a
particle from its initial position due to the diffusion process is called diffusion length,
which is given by:2
2i
D
dL L ZD
N
τ = = , (1.2)
Figure 1.4: Exciton diffusion process at low and room temperatures. The excitonic
Gaussian density of states is represented by the distribution of the excitonic energies. The
exciton-phonon coupling determines the position of the energy level of the most
populated states. (a) The downhill migration fully determines the exciton diffusion
process at low temperatures. (b) At room temperature, the thermally activated hopping
also contributes to the exciton diffusion length.

8/10/2019 olex thesis.pdf
http://slidepdf.com/reader/full/olex-thesispdf 16/114
General Introduction
16
where idL is the displacement of an exciton i from its original position, N is total
number of excitons; and Z is equal to 1, 2 or 3 in case of one-, two- or three-
dimensional diffusion, respectively.[12] However, the factor of two is sometimes
omitted in Equation (1.2):
D L ZDτ = . (1.3)
In this case the value D L is approximately equal to the average displacement of a
particle from its initial position. To be consistent with the literature we will refer to
the diffusion length that is given by the expression (1.3).
Amorphous and polycrystalline films are characterized by a significant degree of
disorder, in particular when they are cast from solution. Variation of molecular
conformations and size of conjugated segments (especially in polymers),
inhomogeneity of intermolecular interactions, chemical defects and impurities etc.
lead to a Gaussian distribution of the HOMO-LUMO energy gaps – and excitonicenergies. The half-width σ of the Gaussian is a measure for the disorder that is
present in the bulk material. Excitons undergo migration among conjugated segments
in solid organic material via energy transfer. Due to the disorder such a migration is a
random walk and can be regarded as diffusion. The exciton diffusion length D L is a
very important parameter for operation of optoelectronic devices.
Figure 1.4 schematically shows the process of exciton diffusion in thin films of
organic semiconductors at low and room temperatures.[43] If excitons are created by
absorption of a photon with energy that corresponds to the high energy tail of the
DOS then exciton diffusion will be defined by the downhill migration toward lowerenergy sites. This relaxation ends typically after about 100 ps when the excitons reach
the energy level of the most populated states. This energy level is proportional to2 / KT σ − under conditions of thermodynamic quasi-equilibrium and, more generally,
is responsible for the 0-0 peak position of the steady state PL spectrum. At low
temperatures (Figure 1.4a), such a level is situated deep in the tail of the Gaussian
DOS, whereas at high temperatures excitons are distributed closer to the middle of
the DOS (Figure 1.4b).
At low temperatures excitons are trapped after the downhill migration because
there is no thermal energy to promote excitons to higher energy states and the densityof lower energy states is not sufficient for hopping. As temperature increases, the
probability of phonon absorption by excitons also increases. The level of the most
populated energy sites climbs uphill on the DOS leading to the decrease of the energy
difference between the occupied and neighboring conjugated segments (Figure 1.4a
and b). If the temperature is high enough, the thermally activated hopping becomes
favorable (Figure 1.4b), which does not lead to a significant change of the exciton
energy but contributes to the exciton diffusion. Thus in the high temperature regime,
the exciton diffusion consists of two steps, namely the downhill migration and the

8/10/2019 olex thesis.pdf
http://slidepdf.com/reader/full/olex-thesispdf 17/114
Chapter 1
17
thermally activated hopping, while at lower temperatures the downhill migration fully
determines the exciton diffusion process.
Undoubtedly both the downhill migration and the temperature-activated
hopping can be considered as random walks due to the disordered nature of organicsemiconductor. However, not every random walk is a normal diffusion process that
can be described by Equation (1.1). For a random walk, the diffusion coefficient is
expressed by 2 / D l dt ∝ , where 2l is the ensemble average of the hop length squared,
and dt is the average hop time. Since the exciton hopping rate 1/dt depends[44] on l
stronger than 2l − , the necessary condition for the exciton migration to be a normal
diffusion is that l to be constant in time. Because the temperature-activated hopping
occurs among energy states of similar density, such a process can be considered as
normal diffusion. In contrast, the downhill migration is anomalous diffusion because
the average hopping length l is changing[45] as moving downward in the DOS (Figure
1.4a).
At low temperature, where the downhill migration is the main contribution to
the exciton diffusion, the diffusion coefficient D is expected to decrease with time. At
room temperature, the exciton diffusion coefficient does not vanish after the downhill
migration process but retains the value corresponding to the temperature-activated
hopping; consequently, the overall process of exciton diffusion can be approximated
as normal diffusion. It is important to note, that hopping of both singlet and triplet
excitons can be regarded as normal diffusion at room temperature.[43,46–51]
1.5 Exciton-exciton annihilation
High exciton densities and diffusion processes give rise to a high probability of two
excitons meeting each other during their lifetimes. Exciton-exciton annihilation
occurs when the interaction between these two excitons leads to a non-radiative
recombination of at least one of them.[11,52–56] For instance, annihilation of singlet (S1)
and triplet (T1) excitons may result in a ground state (S0) and a singlet exciton:
1 1 0 1S S S S + → + , (1.4)
1 1 0 1T T S S + → + . (1.5)
Other products of exciton annihilation are also possible.[57] Efficient exciton
annihilation (1.5) requires anti-parallel spins of triplet excitons due to the
conservation law of angular momentum. Singlet excitons that are created as the result
of exciton annihilation (1.5) may decay radiatively. Such emission is called delayed
fluorescence because it can be observed after a pulsed laser excitation at times much
longer than the PL decay time.

8/10/2019 olex thesis.pdf
http://slidepdf.com/reader/full/olex-thesispdf 18/114
General Introduction
18
Exciton-exciton annihilation can be described mathematically by the following
modification of the Equation (1.1):
2 2n n D n n G
t γ
τ
∂= ∇ − − +
∂, (1.6)
4 a R Dγ π = ; (1.7)
where γ is the annihilation rate constant, a R is the annihilation radius – the average
distance between two excitons that undergo annihilation, and G is the exciton
generation rate.
Under conditions of continuous and homogeneous generation G const = we can
set / 0n t ∂ ∂ = and 2 0n∇ = in Eq. (1.6):
20
nn Gγ
τ + − = , (1.8)
leading to the steady state solution:[56]
( )21 1 4 1
2n Gγτ
γτ = + − . (1.9)
Figure 1.5 shows an example plot of Equation (1.9) when 24 0.01γτ = (circles). The
dependence consists of two straight lines with slopes 1 and 0.5. In a log-log graph a
straight line denotes function in a form of cxα = , where α is the slope of that line.
Slope 1 denotes linear dependence n G∝ at generation intensities smaller than a
certain threshold value 0G . The square root dependence n G∝ at 0G G> indicates
the exciton-exciton annihilation. The threshold generation rate can be estimated from
Eq. (1.9):
Figure 1.5: Simulated exciton density (circles) versus the exciton generation rate using
Equation (1.9).
8/10/2019 olex thesis.pdf
http://slidepdf.com/reader/full/olex-thesispdf 19/114
Chapter 1
19
0 2
1G
γτ ≈ . (1.10)
The obtained expression shows that the exciton-exciton annihilation is a more
important decay process for triplets than for singlets because of the long triplet
lifetime τ . Triplet-triplet annihilation can be observed by recording the dependence
of the photoinduced absorption intensity (transition 7 in Figure 1.2) on the generation
rate G .[58]
1.6 Diffusion Limited Exciton Quenching
Excitons can be quenched in several ways leading to the reduction of the exciton
density, PL intensity and PL decay time. Exciton quenching is a very important
process in operation of devices and for studying excitonic dynamics. The energy of
excited state can be trapped during the diffusion process on non-radiative defect
states that are always present in thin films of organic semiconductors. Strong
quenching has been observed in the vicinity of metal interfaces. [59] Exciton
dissociation into non-radiative species such as free electrons and holes also leads toquenching. Furthermore, inhomogeneous regions of the amorphous films of higher
density, as expressed in g/cm3 etc., show higher rates of exciton quenching.[60–63]
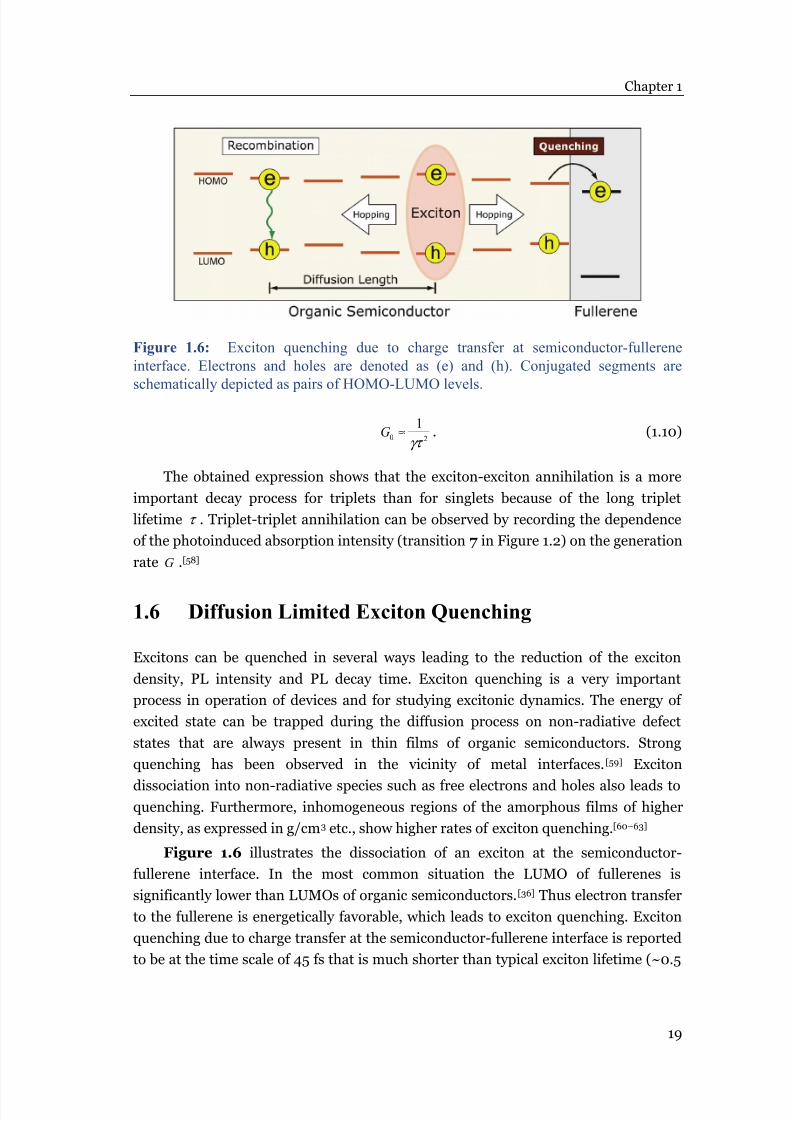
Figure 1.6 illustrates the dissociation of an exciton at the semiconductor-
fullerene interface. In the most common situation the LUMO of fullerenes is
significantly lower than LUMOs of organic semiconductors.[36] Thus electron transfer
to the fullerene is energetically favorable, which leads to exciton quenching. Exciton
quenching due to charge transfer at the semiconductor-fullerene interface is reported
to be at the time scale of 45 fs that is much shorter than typical exciton lifetime (~0.5
Figure 1.6: Exciton quenching due to charge transfer at semiconductor-fullerene
interface. Electrons and holes are denoted as (e) and (h). Conjugated segments are
schematically depicted as pairs of HOMO-LUMO levels.

8/10/2019 olex thesis.pdf
http://slidepdf.com/reader/full/olex-thesispdf 20/114
General Introduction
20
ns). Therefore fullerenes can be considered as perfect exciton quenchers for such
donor semiconductors.[64]
Semiconductor-fullerene heterojunctions are commonly used in organic solar
cells to separate electrons and holes.[2]
In the simplest case the active layer of anorganic solar cell consists of a bilayer semiconductor-fullerene heterojunction
(Figure 1.6). The semiconductor plays the role of a light absorber in which singlet
excitons are generated fairly homogeneously within the layer. The excitons undergo
diffusion so that some of them will reach the interface with fullerene, where electron
and hole are separated. These electrons and holes are then transported through layers
of fullerene and organic semiconductor, respectively, and then extracted at the
metallic electrodes of the solar cell resulting in photocurrent. Excitons that are
capable of reaching the fullerene interface may undergo dissociation. Therefore the
exciton diffusion length D L sets the geometrical constraints on the useful thickness of
the semiconductor layer. Excitons that are created at longer distance than D L from
the fullerene interface will not make a significant contribution to the photocurrent.
Terao et al. showed almost linear correlation between the short circuit current of a
solar cell and the exciton diffusion length.[65] Thus for the design efficient solar cells it
is important to measure and control the exciton diffusion length. Other parameters
that influence the performance of solar cells include morphology of donor-acceptor
interface and charge carrier mobility.
1.7 Measuring Singlet Exciton Diffusion Length
The singlet exciton diffusion length is typically reported in the range of 5-20 nm in
amorphous and polycrystalline organic semiconductors.[2,35,43,59,60,65–88] It is not
entirely clear why the exciton diffusion length is so similar in such a broad selection
of materials. What factors influence the exciton diffusion length? And finally how do
these factors – and the exciton diffusion length itself – correlate with the performance
of solar cells and LEDs? To answer these questions systematic measurements of
exciton diffusion lengths are needed in materials with various chemical composition,
morphology and performances in devices.[65,69,78,89] However, most of the previously
developed methods of measuring exciton diffusion length are not ideal for such
studies. The reasons are the overall complexity of experimental methods and/or the
theoretical model requiring several fitting parameters. In the following we summarize
the available methods and discuss the advantages and pitfalls of each.
Fluorescence Quenching in Bilayers
Perhaps the most popular method to measure singlet exciton diffusion length is
based on PL quenching in bilayers.[35,43,65,68,72,73,75,77,80,85,86,90] In this method one of the
interfaces of a thin film is brought into contact with an exciton quenching layer
(Figure 1.7). Fullerenes or TiO2 are commonly used as “quenching wall”. If the

8/10/2019 olex thesis.pdf
http://slidepdf.com/reader/full/olex-thesispdf 21/114
Chapter 1
21
thickness of the organic layer is of the order of the exciton diffusion length, then large
fraction of the excitons will be able to reach the “quenching wall” via diffusion.
Consequently the PL decay time of such a sample will be shorter than in an isolated
film. The measured PL decays are then fitted using a simple model that is based on
Eq. (1.1) yielding the exciton diffusion length.
There are advantages and disadvantages of the bilayer method. On the positive
side the modeling is straightforward with the exciton diffusion length as the only
fitting parameter. The thickness of the semiconductor layer can be accurately
measured using atomic force microscopy or ellipsometry. On the other hand the
sample preparation is quite demanding. It may be challenging to prepare
semiconductor layers as thin as 5 nm that are even in thickness and do not form pin-
holes or other defects. Furthermore, all the interfaces should be sharp [80] and ultra-
flat; typically root mean square roughness of about 1 nm on the area of 100 µm 2 is
required for accurate measurement. The effects of optical interference[75,91] and variation of the exciton density due to optical absorption[72] should be taken into
account. Often PL decay times of isolated films also depend on the layer thickness
even without the introduction of any quenchers,[60,72] we address this effect in Chapter
2. All these factors set limits to use the bilayer structure for systematic measurements
of the exciton diffusion length.
The problematic thickness-dependent effects can be avoided in an alternative
bilayer method.[69–71,87,92] A thick film, typically of the order of micrometers, is capped
either with exciton blocking or exciton quenching layer. This heterostructure is
excited with monochromatic light at various wavelengths. According to theabsorption spectrum of the semiconductor the exciton generation profile is
modulated. By comparing PL intensity of quenched and unquenched samples the
exciton diffusion length can be extracted. The advantage of this method is that only
two samples are needed for each material. However the mathematical model is
complex and this method works the best when the variation of the generation profile
is significant on the length scale of the exciton diffusion length. Therefore it is most
applicable for single crystals, which show extremely long exciton diffusion
length.[87,92]
Figure 1.7: Bilayer structure for exciton diffusion measurement. Organic semiconductor
is deposited on top of exciton quenching layer.

8/10/2019 olex thesis.pdf
http://slidepdf.com/reader/full/olex-thesispdf 22/114
General Introduction
22
Exciton-Exciton Annihilation
The exciton diffusion coefficient can be estimated by measuring the efficiency of
the exciton-exciton annihilation.[70,72,74] The exciton diffusion coefficient is calculated
from γ (Eq. 1.7), which can be measured experimentally by modeling the PL decays
measured at various intensities of the incident light. Only one sample is needed for
the measurements. However, the theoretical considerations are complex and there
are two unknown parameters that are needed for the modeling, namely the
annihilation radius a R and initial exciton density 0n . It is very difficult to set an
independent experiment to measure these parameters and they are typically assumed
to have a certain value. Only materials with exceptional photochemical stability can
be investigated using this method because intense laser light is required for the
exciton-exciton annihilation.
Microwave Conductivity
An interesting method to measure exciton diffusion length has been developed in
Delft.[82] Exciton quenching in semiconductor-TiO2 bilayers has been estimated by
observing enhancement in photoconductivity in the TiO2 layer due to electron
transfer from the semiconductor layer. The change in photoconductivity is estimated
by measuring the change of the intensity of reflected microwave radiation upon
optical excitation of the semiconductor. The microwave conductivity in TiO2 is then
modeled depending on the thickness of the organic layer. The important advantage of
this method is that it is also sensitive for non-emissive excitons, such as triplets.
However, this method has all the problems of the PL quenching methods in bilayersand therefore it is also not suitable for systematic studies.
Photocurrent Measurements
Exciton diffusion length can be estimated by modeling I-V characteristics of a
solar cell or a similar device.[2,83,84,88,93,94] The typical sample consists of at least one
organic semiconductor layer and two electrodes. The theoretical model includes the
electrical, optical, and exciton diffusion parts. It is a big challenge to describe the
charge transport through a specific organic layer as well as to understand charge
injection/extraction at the electrical contacts. The effect of metallic electrodes on the
distribution of the excitation light – and generated excitons – within the device
should be carefully calculated. Exciton quenching at metallic electrodes should be
also included into the model. These photocurrent measurements are the most difficult
way to extract the exciton diffusion length. It is reasonable to apply this method to a
semiconductor with superior performance in devices, but not to systematic studies of
many materials.

8/10/2019 olex thesis.pdf
http://slidepdf.com/reader/full/olex-thesispdf 23/114
Chapter 1
23
1.8 Do Triplets Diffuse Further?
Triplet excitons are expected to have longer diffusion length than singlets due to their
much longer lifetime, see Eq. (1.3). However, values as short as 10-20 nm have beenreported recently, similar to the singlet exciton diffusion length.[71,95–101] On the other
hand there are plenty of publications with triplet diffusion length of more than 100
nm.[21,92,102,103] Moreover, different values in the range of 10-250 nm have been
published for the same materials.[30,96,97,102,104] Such a controversy probably stems
from the fact that reliable measurements of the triplet exciton diffusion length is
difficult. The available techniques are complex and it is hard to control the relevant
processes that influence the exciton diffusion length. Moreover, simple PL quenching
techniques can only be applied to phosphorescent materials.[71,105] Here we summarize
some of the methods used to measure the triplet exciton diffusion length.
Measurements in LED Configuration
A specially designed multilayer light emitting diode can be used to measure
triplet exciton diffusion.[21,30,95–97,106,107] In these structures the charge recombination
region is spatially confined within a thin interfacial region between electron and hole
transporting layers. A phosphorescent dopant is deployed in one of the transporting
layers at certain distance L from the exciton generation region. The materials are
selected such that triplet energy transfer from the host semiconductor to the dopant is
favorable. Then the intensity of phosphorescent emission of the dopant molecules is
correlated to the triplet density of the host material in the vicinity of the dopant layer,i.e. at distance L from the charge recombination region. The profile of triplet exciton
density within the semiconductor layer is measured by recording the dependence of
phosphorescence intensity of the dopant molecules versus distance L . This profile is
theoretically modeled to extract the exciton diffusion length.
The emission intensity of the phosphorescent dopant is strongly affected by the
outcoupling efficiency that must be carefully calculated and included into the model.
In a working LED there is a significant amount of polarons that are efficient
quenchers of triplet excitons. However polaron-triplet interactions have been always
neglected in the LED-based methods.[108] The thickness and position of therecombination region depends on the total electrical current that flows through the
device. These effects set certain limits on the value of the working current. It is
difficult to evaluate the effect of triplet-triplet annihilation in this method. Due to
many complications and uncertainties in the LED methods, it is not surprising that
very different values of the triplet diffusion length have been extracted in the same
materials.

8/10/2019 olex thesis.pdf
http://slidepdf.com/reader/full/olex-thesispdf 24/114
General Introduction
24
Phosphorescent Detection in Bilayers
Triplet exciton diffusion can be directly probed in a bilayer structure comprising
a pure organic semiconductor layer and a layer that is heavily doped with
phosphorescent molecules.[104] Triplet excitons are created by intersystem crossing in
the semiconductor, followed by their diffusion toward the doped layer, where their
energy is transferred to the dopants and detected as phosphorescent emission. The
phosphorescence decay and delayed fluorescence are then modeled using the
diffusion equation, leading to the exciton diffusion length. The model used requires
four fitting parameters including the exciton diffusion length, triplet-triplet
annihilation rate, transfer rate from host material to the phosphorescent dopant, and
the initial triplet density. In 4,4′-bis(N-carbazolyl)biphenyl (CBP) the resulting
exciton diffusion length was estimated to be 25 nm when triplet-triplet annihilation is
efficient and 140 nm when the annihilation is absent.[104] Disadvantages of this
method are the large number of fitting parameters and the complex theoretical
model.
Photocurrent and Microwave Conductivity
Triplet exciton diffusion length can be also measured using previously described
methods such as the photocurrent modeling[94,98,99,102,109] and the microwave
conductivity measurements.[100,110] In these methods it is important to distinguish
contributions of triplet vs. singlet excitons to photocurrent or microwave conductivity
leading to an additional complication. The effect of triplet-triplet annihilation also has
been neglected when applying these methods. Values of triplet exciton diffusionlengths of 10-250 nm have been reported in several materials.
Other Techniques
There are only few reports describing other than the above mentioned methods
of measuring the triplet exciton diffusion length. Extremely long triplet diffusion
length of 2-4 µm has been measured in a ladder-type conjugated polymer using
detection of triplet excitons with photoinduced absorption in polymer-fullerene
blends.[103] An ultra-long exciton diffusion length of 5 µm has been also measured in
rubrene crystals using a combination of the photocurrent method with variation of
the absorption of linearly polarized light relative to the crystallographic
orientation.[92] Far diffusing excitons in rubrene crystal are assumed to be triplets.
The process of triplet-triplet annihilation has been left without attention in these
studies though.
1.9 Motivation and Scope
Exciton diffusion is an important process in the operation of organic solar cells and
light emitting diodes. In order to design new materials for efficient devices deep

8/10/2019 olex thesis.pdf
http://slidepdf.com/reader/full/olex-thesispdf 25/114
Chapter 1
25
understanding of excitonic processes in general is needed. In particular, the following
questions should be answered. What is the relation between the exciton diffusion
length and the performance of solar cells and LEDs? What is the influence of thermal
annealing on the exciton diffusion length? Why is the singlet exciton diffusion length
of the order of 10 nm in a very broad selection of materials, while triplet diffusion
length has been reported in the wide range of 10-5000 nm? What is the impact of
triplet-triplet annihilation on the triplet diffusion length? How do chemical
composition and film morphology influence the exciton diffusion length? This thesis
will answer many of these questions also with the development of new methods to
measure singlet and triplet exciton diffusion length.
In Chapter 2 we show why the PL decay time in spin-coated polymer thin films
depends on the thickness of the films. We show that the semiconductor-vacuum
interface introduces additional exciton quenching, which has to be accounted for
modeling of the exciton diffusion. This effect creates additional complications in
measurements of diffusion length using exciton quenching in bilayers.
In Chapter 3 we present a new method to measure the exciton diffusion length
which has numerous advantages compared to other techniques. The method is simple
and fast, therefore it is suitable for systematic studies. It is based on a Monte Carlo
simulation of the exciton diffusion, which enables modeling of exciton diffusion in
complex morphologies of organic semiconductor-fullerene blends.
This new method is applied to the study of the influence of the thermal annealing
on the exciton diffusion in Chapter 4. We show that exciton diffusion length
becomes considerably shorter upon annealing in a small molecule organic
semiconductor. An interesting approach to quantify quenching efficiency of new
electron accepting molecules is also presented.
Chapter 5 presents an in-depth study of triplet exciton detection using
phosphorescent Pd-coordinated porphyrin. We show that such detection does not
influence the triplet lifetime in the host material. In this respect the triplet population
is not perturbed. This detection method enables us to study processes such as triplet-
triplet annihilation.
In Chapter 6 we describe a new method to measure triplet exciton diffusionlength in organic semiconductors. We record the penetration profile of triplet
excitons, which were created at an interface of a thin film of organic semiconductor
with a triplet injecting material. A layer of triplet detecting Pd-coordinated porphyrin
is deployed at various distances from the injecting interface. The intensity of
phosphorescent emission of the detecting layer is proportional to the local triplet
density. The obtained penetration profile is then modeled to extract the triplet exciton
diffusion length being the only fitting parameter. We show that triplet-triplet
annihilation may lead to variation of the penetration depth in the range of 20-
100 nm.

8/10/2019 olex thesis.pdf
http://slidepdf.com/reader/full/olex-thesispdf 26/114
General Introduction
26
1.10 References
[1] J. R. Sheats, J. Mater. Res. 2004, 19, 1974-1989.[2] P. Peumans, A. Yakimov, S. R. Forrest, J. Appl. Phys. 2003, 93, 3693-3723.[3] T. W. Kelley, P. F. Baude, C. Gerlach, D. E. Ender, D. Muyres, M. A. Haase, D. E.
Vogel, S. D. Theiss, Chem. Mater. 2004, 16, 4413-4422.[4] R. C. G. Naber, K. Asadi, P. W. M. Blom, D. M. de Leeuw, B. de Boer, Adv.
Mater. 2010, 22, 933-945.[5] U. Lange, N. V. Roznyatovskaya, V. M. Mirsky, Anal. Chim. Acta 2008, 614, 1-
26.[6] M. Campoy-Quiles, T. Ferenczi, T. Agostinelli, P. G. Etchegoin, Y. Kim, T. D.
Anthopoulos, P. N. Stavrinou, D. D. C. Bradley, J. Nelson, Nat Mater 2008, 7 ,158-164.
[7] M. A. Green, K. Emery, Y. Hishikawa, W. Warta, Prog. Photovolt: Res. Appl. 2011, 19, 84-92.
[8] J. K. Rowling, Harry Potter and the Sorcerer’s Stone, Scholastic Inc, 1997.[9] K. P. C. Vollhardt, N. E. Schore, Organic Chemistry, W. H. Freeman, 2010.[10] U. Rauscher, H. Bässler, D. D. C. Bradley, M. Hennecke, Phys. Rev. B 1990, 42,
9830.[11] A. Köhler, H. Bässler, Mater. Sci. Eng., R 2009, 66, 71-109.[12] M. Pope, C. E. Swenberg, Electronic Processes in Organic Crystals and
Polymers, Oxford University Press, 1999.[13] M. Scheidler, U. Lemmer, R. Kersting, S. Karg, W. Riess, B. Cleve, R. F. Mahrt,
H. Kurz, H. Bässler, E. O. Göbel, P. Thomas, Phys. Rev. B 1996, 54, 5536.[14] A. Ruini, M. J. Caldas, G. Bussi, E. Molinari, Phys. Rev. Lett. 2002, 88, 206403.
[15] J.-L. Brédas, D. Beljonne, V. Coropceanu, J. Cornil, Chem. Rev. 2004, 104,4971-5004.[16] M. Carvelli, R. A. J. Janssen, R. Coehoorn, Phys. Rev. B 2011, 83, 075203.[17] P. A. Bobbert, Nat Mater 2010, 9, 288-290.[18] J. M. Lupton, D. R. McCamey, C. Boehme, ChemPhysChem 2010, 11, 3040-
3058.[19] T. D. Nguyen, G. Hukic-Markosian, F. Wang, L. Wojcik, X.-G. Li, E.
Ehrenfreund, Z. V. Vardeny, Nat Mater 2010, 9, 345-352.[20] A. P. Monkman, C. Rothe, S. M. King, Proceedings of the IEEE 2009, 97 , 1597-
1605.[21] M. A. Baldo, D. F. O’Brien, M. E. Thompson, S. R. Forrest, Phys. Rev. B 1999,
60, 14422.[22] J. S. Wilson, A. S. Dhoot, A. J. A. B. Seeley, M. S. Khan, A. Kohler, R. H. Friend,
Nature 2001, 413, 828-831.[23] Y. Cao, I. D. Parker, G. Yu, C. Zhang, A. J. Heeger, Nature 1999, 397 , 414-417.[24] C. Yang, Z. V. Vardeny, A. Köhler, M. Wohlgenannt, M. K. Al-Suti, M. S. Khan,
Phys. Rev. B 2004, 70, 241202.[25] M. Wohlgenannt, K. Tandon, S. Mazumdar, S. Ramasesha, Z. V. Vardeny,
Nature 2001, 409, 494-497.[26] S. P. Kersten, A. J. Schellekens, B. Koopmans, P. A. Bobbert, Phys. Rev. Lett.
2011, 106, 197402.[27] H. Kanno, Y. Sun, S. R. Forrest, Appl. Phys. Lett. 2006, 89, 143516-3.

8/10/2019 olex thesis.pdf
http://slidepdf.com/reader/full/olex-thesispdf 27/114
Chapter 1
27
[28] Y. Sun, N. C. Giebink, H. Kanno, B. Ma, M. E. Thompson, S. R. Forrest, Nature 2006, 440, 908-912.
[29] S. Reineke, F. Lindner, G. Schwartz, N. Seidler, K. Walzer, B. Lussem, K. Leo, Nature 2009, 459, 234-238.
[30] G. Schwartz, S. Reineke, T. C. Rosenow, K. Walzer, K. Higley, Adv. Funct. Mater. 2009, 19, 1319-1333.[31] Y. Chi, P.-T. Chou, Chem. Soc. Rev. 2010, 39, 638-655.[32] D. L. Dexter, J. Chem. Phys. 1953, 21, 836.[33] D. L. Dexter, R. S. Knox, T. Förster, Phys. Status Solidi B 1969, 34, K159-K162.[34] G. D. Scholes, Annu. Rev. Phys. Chem. 2003, 54, 57-87.[35] W. A. Luhman, R. J. Holmes, Adv. Funct. Mater. 2011, 21, 764-771.[36] R. Koeppe, N. S. Sariciftci, Photochem. Photobiol. Sci. 2006, 5 , 1122-1131.[37] V. Cleave, G. Yahioglu, P. L. Barny, R. H. Friend, N. Tessler, Adv. Mater. 1999,
11, 285-288.[38] V. Cleave, G. Yahioglu, P. Le Barny, D. H. Hwang, A. B. Holmes, R. H. Friend, N.
Tessler, Adv. Mater. 2001, 13, 44-47.[39] Y. Kawamura, S. Yanagida, S. R. Forrest, J. Appl. Phys. 2002, 92, 87-93.[40] X. Gong, S.-H. Lim, J. C. Ostrowski, D. Moses, C. J. Bardeen, G. C. Bazan, J.
Appl. Phys. 2004, 95 , 948-953.[41] J. Kalinowski, W. Stampor, M. Cocchi, D. Virgili, V. Fattori, P. Di Marco, Chem.
Phys. 2004, 297 , 39-48.[42] Y. Kawamura, J. Brooks, J. J. Brown, H. Sasabe, C. Adachi, Phys. Rev. Lett.
2006, 96, 017404-4.[43] O. V. Mikhnenko, F. Cordella, A. B. Sieval, J. C. Hummelen, P. W. M. Blom, M.
A. Loi, J. Phys. Chem. B 2008, 112, 11601-11604.[44] C. Madigan, V. Bulovic, Phys. Rev. Lett. 2006, 96, 046404-4.[45] L. M. Herz, C. Silva, A. C. Grimsdale, K. Müllen, R. T. Phillips, Phys. Rev. B
2004, 70, 165207.[46] S. T. Hoffmann, E. Scheler, J.-M. Koenen, M. Forster, U. Scherf, P. Strohriegl, H.
Bässler, A. Köhler, Phys. Rev. B 2010, 81, 165208.[47] V. Jankus, C. Winscom, A. P. Monkman, J. Phys.: Condens. Matter 2010, 22,
185802.[48] I. I. Fishchuk, A. Kadashchuk, L. S. Devi, P. Heremans, H. Bassler, A. Kohler,
Phys. Rev. B 2008, 78, 045211-8.[49] L. S. Devi, M. K. Al-Suti, C. Dosche, M. S. Khan, R. H. Friend, A. Kohler, Phys.
Rev. B 2008, 78, 045210-8.
[50] S. Athanasopoulos, E. V. Emelianova, A. B. Walker, D. Beljonne, Phys. Rev. B 2009, 80, 195209-7.[51] F. B. Dias, K. T. Kamtekar, T. Cazati, G. Williams, M. R. Bryce, A. P. Monkman,
ChemPhysChem 2009, 10, 2096-2104.[52] R. G. Kepler, J. C. Caris, P. Avakian, E. Abramson, Phys. Rev. Lett. 1963, 10,
400-402.[53] C. E. Swenberg, J. Chem. Phys. 1969, 51, 1753.[54] A. Suna, Phys. Rev. B 1970, 1, 1716-1739.[55] J. Partee, E. L. Frankevich, B. Uhlhorn, J. Shinar, Y. Ding, T. J. Barton, Phys.
Rev. Lett. 1999, 82, 3673-3676.[56] V. Dyakonov, G. Rösler, M. Schwoerer, E. L. Frankevich, Phys. Rev. B 1997, 56,
3852-3862.

8/10/2019 olex thesis.pdf
http://slidepdf.com/reader/full/olex-thesispdf 28/114
General Introduction
28
[57] R. E. Merrifield, Pure Appl. Chem. 1971, 27 , 481-498.[58] O. V. Mikhnenko, P. W. M. Blom, M. A. Loi, Phys. Chem. Chem. Phys. 2011, 13,
14453-14456.[59] D. E. Markov, P. W. M. Blom, Appl. Phys. Lett. 2005, 87 , 233511-3.
[60] O. V. Mikhnenko, F. Cordella, A. B. Sieval, J. C. Hummelen, P. W. M. Blom, M. A. Loi, J. Phys. Chem. B 2009, 113, 9104-9109.[61] M. A. Loi, A. Mura, G. Bongiovanni, Q. Cai, C. Martin, H. R. Chandrasekhar, M.
Chandrasekhar, W. Graupner, F. Garnier, Phys. Rev. Lett. 2001, 86, 732.[62] B. C. Hess, G. S. Kanner, Z. Vardeny, Phys. Rev. B 1993, 47 , 1407.[63] R. K. Tikhoplav, B. C. Hess, Synth. Met. 1999, 101, 236-237.[64] C. J. Brabec, G. Zerza, G. Cerullo, S. De Silvestri, S. Luzzati, J. C. Hummelen, S.
Sariciftci, Chem. Phys. Lett. 2001, 340, 232-236.[65] Y. Terao, H. Sasabe, C. Adachi, Appl. Phys. Lett. 2007, 90, 103515.[66] H. Wang, H.-Y. Wang, B.-R. Gao, L. Wang, Z.-Y. Yang, X.-B. Du, Q.-D. Chen, J.-
F. Song, H.-B. Sun, Nanoscale 2011, 3, 2280.
[67] S. Cook, H. Liyuan, A. Furube, R. Katoh, J. Phys. Chem. C 2010, 114, 10962-10968.
[68] K. Masuda, Y. Ikeda, M. Ogawa, H. Benten, H. Ohkita, S. Ito, ACS Appl. Mater. Interfaces 2010, 2, 236-245.
[69] R. R. Lunt, J. B. Benziger, S. R. Forrest, Adv. Mater. 2010, 22, 1233-1236.[70] S. Cook, A. Furube, R. Katoh, L. Han, Chem. Phys. Lett. 2009, 478, 33-36.[71] R. R. Lunt, N. C. Giebink, A. A. Belak, J. B. Benziger, S. R. Forrest, J. Appl. Phys.
2009, 105 , 053711-7.[72] P. E. Shaw, A. Ruseckas, I. D. W. Samuel, Adv. Mater. 2008, 20, 3516-3520.[73] C. Goh, S. R. Scully, M. D. McGehee, J. Appl. Phys. 2007, 101, 114503.
[74] A. J. Lewis, A. Ruseckas, O. P. M. Gaudin, G. R. Webster, P. L. Burn, I. D. W.Samuel, Org. Electron. 2006, 7 , 452-456.[75] S. R. Scully, M. D. McGehee, J. Appl. Phys. 2006, 100, 034907-5.[76] D. E. Markov, P. W. M. Blom, Phys. Rev. B 2006, 74, 085206-5.[77] Y. Wu, Y. C. Zhou, H. R. Wu, Y. Q. Zhan, J. Zhou, S. T. Zhang, J. M. Zhao, Z. J.
Wang, X. M. Ding, X. Y. Hou, Appl. Phys. Lett. 2005, 87 , 044104-3.[78] D. E. Markov, C. Tanase, P. W. M. Blom, J. Wildeman, Phys. Rev. B 2005, 72,
045217-6.[79] D. E. Markov, J. C. Hummelen, P. W. M. Blom, A. B. Sieval, Phys. Rev. B 2005,
72, 045216-5.[80] D. E. Markov, E. Amsterdam, P. W. M. Blom, A. B. Sieval, J. C. Hummelen, J.
Phys. Chem. A 2005, 109, 5266-5274.[81] L. Lüer, H.-J. Egelhaaf, D. Oelkrug, G. Cerullo, G. Lanzani, B.-H. Huisman, D.de Leeuw, Org. Electron. 2004, 5 , 83-89.
[82] J. E. Kroeze, T. J. Savenije, M. J. W. Vermeulen, J. M. Warman, J. Phys. Chem. B 2003, 107 , 7696-7705.
[83] C. L. Yang, Z. K. Tang, W. K. Ge, J. N. Wang, Z. L. Zhang, X. Y. Jian, Appl. Phys. Lett. 2003, 83, 1737-1739.
[84] T. Stubinger, W. Brutting, J. Appl. Phys. 2001, 90, 3632-3641.[85] M. Theander, A. Yartsev, D. Zigmantas, V. Sundström, W. Mammo, M. R.
Andersson, O. Inganäs, Phys. Rev. B 2000, 61, 12957.[86] A. Haugeneder, M. Neges, C. Kallinger, W. Spirkl, U. Lemmer, J. Feldmann, U.
Scherf, E. Harth, A. Gügel, K. Müllen, Phys. Rev. B 1999, 59, 15346.

8/10/2019 olex thesis.pdf
http://slidepdf.com/reader/full/olex-thesispdf 29/114
Chapter 1
29
[87] B. A. Gregg, J. Sprague, M. W. Peterson, J. Phys. Chem. B 1997, 101, 5362-5369.[88] J. J. M. Halls, K. Pichler, R. H. Friend, S. C. Moratti, A. B. Holmes, Appl. Phys.
Lett. 1996, 68, 3120-3122.[89] L. D. A. Siebbeles, A. Huijser, T. J. Savenije, J. Mater. Chem. 2009, 19, 6067.
[90] Y. C. Zhou, Y. Wu, L. L. Ma, J. Zhou, X. M. Ding, X. Y. Hou, J. Appl. Phys. 2006, 100, 023712-5.[91] C. Breyer, M. Vogel, M. Mohr, B. Johnev, K. Fostiropoulos, Phys. Status Solidi B
2006, 243, 3176 - 318.[92] H. Najafov, B. Lee, Q. Zhou, L. C. Feldman, V. Podzorov, Nat. Mater. 2010, 9,
938-943.[93] V. Bulovic, S. R. Forrest, Chem. Phys. Lett. 1995, 238, 88-92.[94] D. Qin, P. Gu, R. S. Dhar, S. G. Razavipour, D. Ban, Phys. Status Solidi A 2011,
208, 1967-1971.[95] W. Zhang, J. Yu, W. Wen, Y. Jiang, J. Lumin. 2011, 131, 1260-1263.[96] J. Wünsche, S. Reineke, B. Lüssem, K. Leo, Phys. Rev. B 2010, 81, 245201.
[97] M. Lebental, H. Choukri, S. Chenais, S. Forget, A. Siove, B. Geffroy, E. Tutis, Phys. Rev. B 2009, 79, 165318-13.
[98] W. A. Luhman, R. J. Holmes, Appl. Phys. Lett. 2009, 94, 153304-3.[99] B. P. Rand, S. Schols, D. Cheyns, H. Gommans, C. Girotto, J. Genoe, P.
Heremans, J. Poortmans, Org. Electron. 2009, 10, 1015-1019.[100] J. E. Kroeze, T. J. Savenije, L. P. Candeias, J. M. Warman, L. D. A. Siebbeles,
Sol. Energy Mater. Sol. Cells 2005, 85 , 189-203.[101] E. B. Namdas, A. Ruseckas, I. D. W. Samuel, S.-C. Lo, P. L. Burn, Appl. Phys.
Lett. 2005, 86, 091104-3.[102] N. Matsusue, S. Ikame, Y. Suzuki, H. Naito, J. Appl. Phys. 2005, 97 , 123512-5.[103] M. Samiullah, D. Moghe, U. Scherf, S. Guha, Phys. Rev. B 2010, 82, 205211.[104] N. C. Giebink, Y. Sun, S. R. Forrest, Org. Electron. 2006, 7 , 375-386.[105] T. Fushimi, A. Oda, H. Ohkita, S. Ito, J. Phys. Chem. B 2004, 108, 18897-
18902.[106] C. Wu, P. I. Djurovich, M. E. Thompson, Adv. Funct. Mater. 2009, 19, 3157-
3164.[107] M. A. Baldo, C. Adachi, S. R. Forrest, Phys. Rev. B 2000, 62, 10967.[108] N. C. Giebink, S. R. Forrest, Phys. Rev. B 2008, 77 , 235215-9.[109] Y. Shao, Y. Yang, Adv. Mater. 2005, 17 , 2841-2844.[110] J. E. Kroeze, R. B. M. Koehorst, T. J. Savenije, Adv. Funct. Mater. 2004, 14,
992-998.

8/10/2019 olex thesis.pdf
http://slidepdf.com/reader/full/olex-thesispdf 30/114

8/10/2019 olex thesis.pdf
http://slidepdf.com/reader/full/olex-thesispdf 31/114
31
Chapter 2
Exciton Quenching in Skin Layerof Spin-Coated Polymer Films
Here we report about efficient exciton quenching close to the polymer-vacuum
interface of spin-coated MDMO-PPV (poly[2-methoxy-5-(2'-ethyl-hexyloxy)- p-
phenylenevinylene]) films. The quenching efficiency is estimated to be as high as that
of the polymer-fullerene interface. This efficient quenching is consistent with
enhanced intermolecular interactions close to the polymer-vacuum interface due to
the formation of a “skin layer” during the spin-coating procedure. In the skin layer the
polymer density is higher, i.e. the intermolecular distances are shorter than in the rest
of the film. The effect of exciton quenching at the polymer-vacuum interface should
be taken into account when the thickness of the polymer film is of the order of the
exciton diffusion length; in particular, in the determination of the exciton diffusion
length.*
*O. V. Mikhnenko, F. Cordella, A. B. Sieval, J. C. Hummelen, P. W. M.Blom, M. A. Loi, J. Phys. Chem. B 2009, 113, 9104-9109.

8/10/2019 olex thesis.pdf
http://slidepdf.com/reader/full/olex-thesispdf 32/114
Exciton Quenching in Skin Layer of Spin-Coated Polymer Films
32
2.1 Introduction
Spin-coating or spin-casting is a thin film deposition technique from solution that is
conducted by first wetting and then spinning a flat substrate. Depending on the
rotation speed, the solution experiences centrifugal forces that, together with the
solvent evaporation process, are responsible for the film formation. Spin-coating is a
versatile deposition method that is used for various applications; for instance, to
deposit photoresists or dielectric layers in microcircuit technology, to fabricate
antireflection coatings for optical applications, or magnetic coatings in the data
storage industry. Furthermore, spin-coating is used to deposit thin films of
conjugated polymers to fabricate solar cells, field effect transistors, light-emitting
diodes, etc.Conjugated polymers show semiconducting properties and can be designed to be
soluble in common organic solvents. For low-cost electronic devices, however, spin-
coating is not as cost-effective as printing techniques, which are the most promising
deposition methods for mass production.[1] Nevertheless, in contrast to other
techniques, spin-coating is simple, well understood,[2,3] easy to control, and allows
preparation of thin films of precise thicknesses. Therefore, it is an excellent
deposition technique to investigate properties of conjugated polymers as well as to
optimize devices based on them.
Over the past few decades the morphology of spin-coated polymer films has beenstudied extensively. It was predicted theoretically [2,3] and shown experimentally [4,5]
that close to the polymer-vacuum interface, a “skin layer” is formed, which is
characterized by a high density and in-plane ordering of molecular chains (Figure
2.1). The rest of the film has uniform density, which is shown to be 3 times less than
the density of the skin layer in a typical conjugated polymer, such as poly[2-methoxy-
5-(2′-ethyl-hexyloxy)-p-phenylenevinylene] (MEH-PPV).[6] Because of such a density
difference, the rest of the film is sometimes regarded as a “spongy layer”.
The skin layer formation originates from the rapid solvent evaporation at the free
surface, which leads to a local increase in the polymer concentration during spinning.
Figure 2.1: The bilayered structure of a spin-coated polymer film.

8/10/2019 olex thesis.pdf
http://slidepdf.com/reader/full/olex-thesispdf 33/114
Chapter 2
33
This rise in the concentration can be so abrupt that the polymer becomes almost solid
close to the surface, which slows down the solvent evaporation rate from the rest of
the forming film.[3] Even when the film is fully formed, some of the solvent remains
trapped below the skin layer. Usually, such solvent residuals are removed by vacuum
baking. At this stage, the polymer viscosity is so high that the long chains cannot fill
the space that was previously filled by the solvent residuals. Thus, a spongy layer is
formed below the skin of the film.
The influence of the skin layer on the physical parameters, such as glass
transition temperature[6,7] and anisotropy of the refractive index,[8,9] becomes
apparent in relatively thin films, when the skin layer is a considerable part of the total
film thickness. The relevant thickness range depends on the polymer properties, the
solvent evaporation rate, and the spin conditions. In relatively thick films, the spongy
layer dominates the total film volume, which results in thickness-independent film
properties.
We report about the influence of the skin layer on the measurements of the
exciton dynamics in conjugated polymers. In this class of materials, excitons can be
considered as bound, localized electron-hole pairs. Once created, they tend to diffuse
among conjugated segments by means of energy transfer. The average displacement
of an exciton during its lifetime is called the exciton diffusion length. This parameter
is very important in the design of organic solar cells because it determines the volume
of the conjugated polymer from which excitons can reach the dissociation interface,
where they can be separated into free electrons and holes to contribute to
photocurrent.[10] The measurement of the exciton diffusion length is therefore
important both for the engineering of optoelectronic devices and for the fundamental
knowledge about conjugated polymers.
The exciton diffusion length is often extracted from photoluminescence (PL)
measurements by varying the thickness of the polymer film, which is deposited on top
of an exciton quenching layer.[10–17] When the polymer thickness is decreased to the
order of the exciton diffusion length, the PL decay times in such a polymer-quencher
heterostructure become shorter than those in the relatively thick films. The exciton
diffusion length can then be estimated by modeling the thickness dependence of the
PL decay process. The influence of the skin layer at the polymer-vacuum interface is
usually neglected in such models.
Here, we study the exciton behavior in the skin layer of spin-coated MDMO-PPV
films (for full name and chemical structure refer to Figure 2.2). We chose this
soluble derivative of PPV because it has been widely used in solar cell research.[18] For
this class of materials, the exciton diffusion length is typically reported in the range of
5 – 7 nm.[10,11,13–15,19–21] To extract the exciton diffusion length using polymer-quencher
heterostructures, the polymer thickness should be varied in the range of 5 – 50 nm
for MDMO-PPV. Absorption spectroscopy reveals that in this thickness range, the
skin layer considerably contributes to the total film thickness and, thus, cannot be

8/10/2019 olex thesis.pdf
http://slidepdf.com/reader/full/olex-thesispdf 34/114
Exciton Quenching in Skin Layer of Spin-Coated Polymer Films
34
neglected. We show that the PL decay times of the pristine MDMO-PPV films, spin-
coated on quartz substrates, exhibit a thickness dependence similar to that of the
polymer-quencher heterostructures. Such thickness dependence is caused by the
ef ficient exciton quenching in the skin layer. The ef ficiency of this quenching can be
estimated by measuring the exciton diffusion length both in the pristine films and in
polymer-quencher heterostructures. The values of the exciton diffusion length, which
are extracted from both kinds of samples, correspond to each other only if we assume
that the exciton quenching in the skin layer is as ef ficient as the quenching at the
polymer-fullerene interface, which is well-known for its high exciton quenching
ef ficiency.[10,22,23]
2.2 Thickness Dependence of the PL Decay Times
Figure 2.3 shows the PL decays of a 240-nm-thick polymer film serving as the
reference sample (solid line). PL decays of 13 nm thick polymer film deposited on
quartz substrate (pristine film, dotted line) and on insoluble fullerene layer of
poly(F2D) (heterostructure, dashed line) are also shown. The chemical structure of
F2D precursor is shown Figure 2.2. The PL decay times depend on polymer thickness
for both heterostructures and pristine films, being faster for thinner samples. The
dependence is monotonic and appears to be strongest in the polymer thickness range
between 5 and 50 nm, whereas > 200 nm thick films are characterized by a thickness-
independent PL decay. As stated above, excitons are ef ficiently quenched at the
polymer-fullerene interface;[10,22,23] the number of excitons that reach the interface is
limited by the exciton diffusion length D L .[23] Consequently, for polymer thicknesses
approaching D L , the relative number of quenched excitons in the heterostructure is
increased, leading to shorter PL decay times (Figure 2.3, dashed line).
Figure 2.2: Chemical structures of poly[2-methyl-5-(3′,7′-dimethyloctyloxy)-p-
phenylenevinylene] (MDMO-PPV) and 1‘-methyl-1‘,5‘-dihydro-2‘-(3,5-bis(undeca-4,6-diynyloxy)phenyl)-1H -pyrrolo[3‘,4‘:1,9](C60- I h)[5,6]fullerene (F2D).

8/10/2019 olex thesis.pdf
http://slidepdf.com/reader/full/olex-thesispdf 35/114
Chapter 2
35
The dotted line in Figure 2.3 shows that the PL decay times of pristine MDMO-
PPV films depend on thickness in a manner similar to the heterostructures, being
shorter for thinner films. Such thickness dependence can be ascribed to exciton
quenching at one or both interfaces of the pristine polymer film. We will show thatthe skin layer of a spin-coated MDMO-PPV film quenches excitons with an ef ficiency
similar to that of a polymer-fullerene interface.
To quantify the overall exciton quenching in a polymer film, we introduce the
relative quenching ef ficiency ( )Q L :
( ) 1 Total PL of sample with polymer thickness L
Q LTotal PL of thick reference sample
= − , (2.1)
where the total PL is the time integral of the PL decay normalized to its maximum
value, and the reference sample is a > 200 nm thick MDMO-PPV film. The thicknessdependencies of the relative quenching ef ficiency were measured for both pristine
films and heterostructures. They are shown in Figure 2.4 as circles and squares,
respectively. In general, the overall quenching in the heterostructures was found to be
more ef ficient than in pristine films. Hence, we can estimate that the quenching
ef ficiency of the polymer-quartz interface is much smaller than that of the polymer-
fullerene interface. On the other hand, if the exciton quenching ef ficiency is small or
zero at the polymer-quartz interface, then the excitons should be quenched ef ficiently
close to the polymer-vacuum interface (i.e. in the skin layer) to explain the
pronounced thickness dependence ( )Q L for the pristine films (Figure 2.4).
Figure 2.3: PL decays of pristine MDMO-PPV film (dotted line) and heterostructure
(dashed line) of the same polymer thickness, 13 nm. The PL decay of 240-nm-thick
reference pristine film is also shown (solid line). The PL decays are normalized to its
maximum value. The inset shows the composition of the pristine films and the
heterostructures.

8/10/2019 olex thesis.pdf
http://slidepdf.com/reader/full/olex-thesispdf 36/114
Exciton Quenching in Skin Layer of Spin-Coated Polymer Films
36
To independently quantify the exciton quenching at polymer-quartz interface
and in the skin layer of a MDMO-PPV film, we will assume that the characteristics of
the skin layer are essentially the same in the heterostructures and the pristine
films.[24,25] In the next section, we will quantify the quenching ef ficiency by following
this hypothesis.
2.3 Measurements of Exciton Diffusion Length
The exciton diffusion length in polymer films is often measured using the diffusion-
limited quenching at the interface with either fullerenes or fullerene
derivatives,[11,12,14,19–21] titania,[13,15] or metals.[16] The dependence of the relative
quenching ef ficiency, Q , on the polymer thickness, L , is recorded experimentally,
and it is fitted with a mathematical model based on a diffusion equation. Such a
fitting results in a value of D L typically in the range of 5 – 7 nm for PPVderivatives.[10,11,13–15,19–21]
Here, we measure the exciton diffusion length to estimate the ef ficiency of the
exciton quenching in the skin layer. For simplicity, we will neglect the finite thickness
of the skin layer in the modeling. Then the quenching in this layer can be considered
as an interface effect. Later, we will estimate the influence of a finite thickness of the
skin layer on our results.
The exciton diffusion length is an intrinsic property of the conjugated polymer
and should be the same in the heterostructures and the pristine films. Since in our
sample geometry, the effect of interface quenching enters the diffusion model as
Figure 2.4: Measured relative quenching ef ficiency, Q, of the pristine films (circles) and
the heterostructures (squares). The curves represent the best fits with Equations (2.8) and
(2.7), respectively.

8/10/2019 olex thesis.pdf
http://slidepdf.com/reader/full/olex-thesispdf 37/114
Chapter 2
37
boundary conditions, we can estimate the ef ficiencies of such quenching simply by
choosing the boundary conditions that lead to the proper value of D L for both types
of samples.
The exciton density, n , is modeled by the following diffusion equation:2
2
( , ) ( , ) ( , )( , ) ( ) ( , )
n x t n x t n x t D G x t S x n x t
t x τ
∂ ∂= − + −
∂ ∂, (2.2)
where τ denotes the exciton lifetime and D is the exciton diffusion coef ficient that is
related to the diffusion length by the equation D L Dτ = . Due to the sample
symmetry, n depends only on one spatial coordinate x , which is the distance from
the free interface. Because ultrafast photo excitation has been used, the generation
term ( , )G x t can be represented as the initial exciton distribution, which is taken to be
uniform due to the low absorption coef ficient at the excitation wavelength.
The term ( )S x in Equation (2.2) denotes the interface quenching; it can be
adjusted to mimic different boundary conditions. The polymer-vacuum interfaces of
the heterostructures and the pristine films are assumed to be equal, implying
common boundary conditions at this interface for both sorts of samples. As we noted
in the previous section, the quenching ef ficiency of the polymer-vacuum interface is
expected to be high. In our modeling, we assume it to be 100% ef ficient:
(0, ) 0n t = . (2.3)
The polymer-fullerene interface is known to be an ef ficient exciton quencher,
which provides the second boundary condition for the heterostructures with polymerthickness L :
( , ) 0n L t = . (2.4)
The polymer-quartz interface is expected to be a weak exciton quencher; therefore,
here, we assume that its quenching ef ficiency is negligible:
( , )0
n L t
x
∂=
∂. (2.5)
With these boundary conditions, Equation (2.2) can be simplified to Cauchy
problems and solved analytically for both types of samples. Then the relativequenching ef ficiency Q is simply
0 0
0
( , )
( , ) 1
L
quenched sample
D
dx n x t dt
Q L L LN τ
∞
= −
, (2.6)
where 0 LN τ is the total PL of a quencher free sample. Integration of Equation (2.6)
leads to the analytical expressions 2Q and 1Q for the heterostructures and the
pristine films, respectively:

8/10/2019 olex thesis.pdf
http://slidepdf.com/reader/full/olex-thesispdf 38/114
Exciton Quenching in Skin Layer of Spin-Coated Polymer Films
38
2
2( , )
2
D D
D
L LQ L L Tanh
L L= , (2.7)
1( , ) D D
D
L LQ L L Tanh
L L= . (2.8)
Here, the exciton diffusion length, D L , is the only fitting parameter, and the index
near Q denotes the number of quenching interfaces.
The fitting of the experimental data for the heterostructures and the pristine
films by Equations (2.7) and (2.8) is illustrated in Figure 2.4. The resulting values of
the exciton diffusion length are 4.5 and 5 nm, respectively. These values are similar
and were extracted from two different series of samples under the common
assumption that the polymer-vacuum interface ef ficiently quenches excitons. It is
important to note that the extracted values of the exciton diffusion length correspond
to the one of the spongy layer.
These values would diverge when the boundary condition at the polymer-vacuum
interface would be varied to reduce the quenching ef ficiency. In the limiting case,
when the quenching ef ficiency of the polymer-vacuum interface approaches zero, the
extracted exciton diffusion length from the heterostructures would be close to 9 nm,
whereas that from the pristine films will virtually approach infinity. Thus, we can
conclude that our assumption of ef ficient exciton quenching at the polymer-vacuum
interface is correct because it leads to the similar values of the exciton diffusion
length, extracted from either kind of sample.
2.4 Skin Layer in Spin-Coated Films
The theoretical prediction[2,3] of a dense skin layer close to the free interface (Figure
2.1) was followed by the experimental confirmation of a bilayered film structure. On
the basis of neutron reflection experiments on spin-coated MEH-PPV films, Webster
et al.[5] concluded that such films are composed of two well-defined and uniform
layers of different densities. They reported a density ratio as high as 3 between a 24
nm, thin, dense layer and a 136 nm, thick, “spongy” layer. Lu and coauthors[4]
discovered the bilayered structure of spin-coated polyacrylamide films by reflection-
absorption Fourier transform infrared spectroscopy. The molecules in the part of the
layer closest to the substrate were found to be randomly oriented, whereas the skin
layer showed spin-coating-induced in-plane chain orientation.[4,8,26,27] Moreover, the
idea of a bilayered structure of spin-coated films is also often used to explain the
thickness dependence of the glass transition temperature in conjugated polymers. [6,7]
Here, we report spectroscopic evidence of the bilayered structure of a thin polymer
film, which confirms the exciton quenching effect in the skin layer.

8/10/2019 olex thesis.pdf
http://slidepdf.com/reader/full/olex-thesispdf 39/114
Chapter 2
39
Figure 2.5: Normalized absorption and normalized photoluminescence spectra of polymer films with thicknesses 240 nm (solid, thick line), 42 nm (solid, thin line) and 7
nm (dashed-dotted line). The spectra are normalized to their maximum values.
Figure 2.6: Measured thickness dependencies of the maximum position of theabsorption spectrum (circles) and 0-0 PL transition (squares). The solid lines are shown
as guides for eyes.
The absorption spectra of MDMO-PPV films of several polymer thicknesses are
shown in Figure 2.5. It is important to note that the absorption spectra are equal for
heterostructures and pristine films of the same polymer thickness. Figure 2.6
displays the variation of the energy maximum of the absorption spectrum for films of
different thicknesses. The absorption maximum shifts by 0.14 eV toward lower
energies, when going from >200 nm to ∼ 15 nm thickness. A further thickness
decrease leads to the opposite trend; that is, to a blue shift. This thickness

8/10/2019 olex thesis.pdf
http://slidepdf.com/reader/full/olex-thesispdf 40/114
Exciton Quenching in Skin Layer of Spin-Coated Polymer Films
40
dependence is relatively strong. For comparison, the Stokes shift for the 240 nm thick
MDMO-PPV film is 0.34 eV (Figure 2.6), and the typical value for the half-width of
the Gaussian excitonic density of states[28] is ∼ 0.1 eV.
The thickness dependence of the absorption spectrum can be explained in termsof the bilayered structure of spin-coated polymer films. As mentioned previously, the
spin-coating procedure induces in-plane chain orientation in the skin layer of the
film,[4,8,26,27] whereas the polymer chains adopt random conformations in the spongy
layer (Figure 2.1). Consequently, the skin layer is characterized by polymer chains
with longer average conjugation length and by the red-shifted absorption,[29] as
compared to the spongy one. In > 200 nm thick films, the absorption spectrum is
dominated by the spongy layer, whereas in thinner films, the skin layer becomes more
important, leading to the red shift (Figure 2.6). For ultrathin films with thicknesses
below 15 nm, the influence of the substrate dominates over the spin-coating-induced
effects, resulting in the blue shift upon further thickness decrease.
One would expect that the exciton migration process is anisotropic at the
interface between the two layers of the spin-coated polymer film. Indeed, due to the
different degrees of ordering, a gradient of the conjugation length is formed between
such layers. Since the excitons tend to migrate toward longer conjugated segments,
one rather would expect a drift directed to the better-ordered skin layer than an
isotropic diffusion process. Such a drift depletes the exciton population in the spongy
layer and increases it in the skin layer. Since the density of states is considerably
shifted toward lower energy in the skin layer, one would expect that any PL from the
skin layer would be red-shifted. This would apply to samples in the thickness range of
5 – 50 nm.
Figure 2.5 shows the steady state PL spectra that correspond to the polymer films
of thicknesses 7, 42, and 240 nm. Figure 2.6 summarizes the thickness dependence of
the maximum position of the PL 0-0 transition. The dependence is weaker than that
of the absorption spectrum; moreover, we can resolve a monotonic shift to higher
energy with a thickness decrease in the range of 5 – 50 nm. It is important to note
that we did not find substantial differences in the peak positions of the PL spectra
between heterostructures and the corresponding pristine films.
We attribute the absence of the expected red shift of the PL spectrum to the
exciton quenching in the skin layer of the spin-coated film. The observed
photoluminescence is mostly coming from the spongy layer, which is not influenced
by the spin-coating procedure, and thus, its degree of ordering does not depend on
the sample thickness. In the thickness range of 5 – 20 nm, most of the excitons reach
a quenching interface; thus, the observed photoluminescence is originated at the early
stages of the exciton diffusion. During roughly the first 100 ps after the laser pulse,
excitons undergo a thermalization process; that is, a downhill migration toward lower
energy sites.[30] The photons emitted during this process are blue-shifted as compared
to the emission of thermalized excitons. In suf ficiently thin films, excitons get

8/10/2019 olex thesis.pdf
http://slidepdf.com/reader/full/olex-thesispdf 41/114
Chapter 2
41
quenched before the completion of thermalization. Therefore, we observe a slight blue
shift for films with thicknesses close to the exciton diffusion length (Figure 2.6).
One of the physical phenomena responsible for the exciton quenching in the skin
dense layer can be the interchain coupling that leads to formation of nonradiativedark states. Ruini et al.[31] performed ab initio calculations of PL intensity and real
space exciton wave function for both PPV crystal and an isolated chain, showing that
in the crystal, the lowest electronic excitation is an optically inactive exciton. They
also noted that the PL ef ficiency would strongly depend on the local polymer density,
being lower for more densely packed chains. Nguyen et al.,[32] using scanning near-
field optical microscopy, showed experimentally that the PL intensity is weaker from
the denser clusters of an inhomogeneous MEH-PPV film. The concept of exciton
quenching due to interchain interactions is supported by numerous reports on
decrease of the PL quantum yield under application of hydrostatic pressure in various
organic materials.[33–35]
Our measurements show that the PL is quenched with high ef ficiency in the skin
layer. Such a high quenching ef ficiency reflects the high number of excitons that decay
nonradiatively close to the polymer-vacuum interface. It is energetically favorable for
excitons to migrate into the region of higher density, which is characterized by longer
average conjugation length. Since the film density increases when going from the
spongy layer to the skin layer, excitons would rather drift into the latter than
anisotropically diffuse between the layers. In this way, the exciton concentration
increases in the skin dense layer, where the probability of nonradiative decay is
high.[31–35] As a result, the number of excitons that decay nonradiatively increases, and
finally, the exciton quenching within the skin layer can be approximated as the 100%
ef ficient quenching at the polymer-vacuum interface.
It is important to note that in the bilayered spin-coated film, the conformations
of the polymer chains in the vicinity of the free surface are decoupled from the
substrate and are fully determined by the spin-coating conditions. The detailed
surface analyses of spin-coated poly(3-hexylthiophene) films by ultraviolet
photoelectron spectroscopy, Penning ionization electron spectroscopy,[25] and X-ray
absorption fine structure spectroscopy [24,25] show that the polymer chain
conformation at the surface does not change upon thickness variation, obtained by
changing the polymer concentration and keeping the spin speed constant. This
supports our assumption that the skin layer is essentially the same for both the
heterostructure and the pristine film of corresponding thickness.
Finally, we address the neglect of the skin layer thickness in our modeling of the
relative quenching ef ficiency. Every exciton that passes from the spongy to the dense
layer does not diffuse back due to the energy gradient, but subsequently decays
nonradiatively due to the effect of enhanced density.[31–35] The interface between the
dense and the spongy layers is reported to be relatively sharp. [5] Thus, this interface,
not that of the polymer-vacuum, should be considered as the exciton quenching wall

8/10/2019 olex thesis.pdf
http://slidepdf.com/reader/full/olex-thesispdf 42/114
Exciton Quenching in Skin Layer of Spin-Coated Polymer Films
42
in our modeling. Consequently, we should use the thickness of the spongy layer
instead of the overall film thickness, L , in the modeling.
Although we had no opportunity to reliably estimate the thicknesses of the skin
and spongy layers, the obtained results of the exciton diffusion length still allow us todraw our main conclusion. Suppose the thickness of the skin layer is about 10% of the
overall film thickness, L . Then the thickness of the spongy layer is 0.9 L , which
should be put into the modeling as a sample thickness. Since the relative quenching
ef ficiencies (Equations 2.7 and 2.8) depend on the ratio / D L L , the resulting values of
the exciton diffusion length would be smaller than the obtained ones with a factor of
0.9 for both the heterostructures and the pristine films. This means that neglecting
the skin layer thickness affects the absolute values of the measured exciton diffusion
length, but not the ratio between them. Thus, we can still compare those values and
conclude that the skin layer ef ficiently quenches excitons.
2.5 Conclusions
We showed that in the skin layer of spin-coated MDMO-PPV film excitons are
quenched with high ef ficiency, comparable to that of a polymer-fullerene interface.
One of the physical phenomena responsible for such a quenching is the formation of
nonradiative states close to the polymer-vacuum interface due to higher polymer
density. This effect should be taken into account for films in the thickness range of 5 –
50 nm, in particular when the exciton population is measured or estimated.
2.6 Methods
MDMO-PPV was spin-coated from chlorobenzene on top of clean quartz
substrates and insoluble[14] cross-linked fullerene films – poly(F2D) – to form the
pristine films and heterostructures, respectively (inset to Figure 2.3). The spin speed
of 2000 rpm was kept constant for all the samples, and the polymer thickness
variation was ensured by changing the solution concentration. The sample
preparation was done under nitrogen atmosphere.The surfaces of the quartz substrates, of poly(F2D), and of MDMO-PPV were
characterized by atomic force microscopy (AFM). The root-mean-square roughness
was found to be <1 nm for all the surfaces on an area of 100 µm2 . The thicknesses of
organic layers were measured by AFM and nulling-zone ellipsometry. The thickness
of poly(F2D) was kept to < 30 nm in all the heterostructures.
PL decays, continuous wave (cw) absorption, and PL spectra were measured for
every sample. Time-resolved measurements were performed, exciting the samples
with 100 fs laser pulses, produced by a Ti - sapphire laser and frequency-doubled at
about 400 nm; the PL decays were recorded by a Hamamatsu streak camera. The

8/10/2019 olex thesis.pdf
http://slidepdf.com/reader/full/olex-thesispdf 43/114
Chapter 2
43
initial exciton density was estimated to be ~1013 – 1014 cm-3 , being several orders of
magnitude less than needed for exciton-exciton annihilation.[36] The cw PL spectra
were measured using a Hamamatsu CCD, and the absorption spectra were obtained
with a Perkin-Elmer spectrometer. The samples were kept in a dynamic vacuum of
10-6 – 10-5 mbar during the photoluminescence measurements, and no degradation
was observed. For the absorption measurements, the samples were sealed in a
chamber under nitrogen atmosphere. For analysis, the decays were spectrally
integrated and normalized to the maximum value. It was verified that optical
interference and self-absorption effects can be safely ignored in the thickness range
studied here.

8/10/2019 olex thesis.pdf
http://slidepdf.com/reader/full/olex-thesispdf 44/114
Exciton Quenching in Skin Layer of Spin-Coated Polymer Films
44
2.7 References
[1] C. J. Brabec, J. R. Durrant, MRS Bull. 2008, 33, 670.[2] C. J. Lawrence, Phys. Fluids 1988, 31, 2786.[3] D. E. Bornside, C. W. Macosko, L. E. Scriven, J. Appl. Phys. 1989, 66, 5185-
5193.[4] X. Lu, I. Cheng, Y. Mi, Polymer 2007, 48, 682-686.[5] G. R. Webster, W. J. Mitchell, P. L. Burn, R. K. Thomas, G. Fragneto, J. P. J.
Markham, I. D. W. Samuel, J. Appl. Phys. 2002, 91, 9066-9071.[6] M. Campoy-Quiles, M. Sims, P. G. Etchegoin, D. D. C. Bradley, Macromolecules
2006, 39, 7673-7680.[7] J. A. Forrest, K. Dalnoki-Veress, J. R. Stevens, J. R. Dutcher, Phys. Rev. Lett.
1996, 77 , 2002.
[8] M. Campoy-Quiles, P. G. Etchegoin, D. D. C. Bradley, Phys. Rev. B 2005, 72,045209-16.[9] J. Sturm, S. Tasch, A. Niko, G. Leising, E. Toussaere, J. Zyss, T. C. Kowalczyk, K.
D. Singer, U. Scherf, J. Huber, Thin Solid Films 1997, 298, 138-142.[10] P. Peumans, A. Yakimov, S. R. Forrest, J. Appl. Phys. 2003, 93, 3693-3723.[11] J. J. M. Halls, K. Pichler, R. H. Friend, S. C. Moratti, A. B. Holmes, Appl. Phys.
Lett. 1996, 68, 3120-3122.[12] A. Haugeneder, M. Neges, C. Kallinger, W. Spirkl, U. Lemmer, J. Feldmann, U.
Scherf, E. Harth, A. Gügel, K. Müllen, Phys. Rev. B 1999, 59, 15346.[13] J. E. Kroeze, T. J. Savenije, M. J. W. Vermeulen, J. M. Warman, J. Phys. Chem.
B 2003, 107 , 7696-7705.
[14] D. E. Markov, E. Amsterdam, P. W. M. Blom, A. B. Sieval, J. C. Hummelen, J. Phys. Chem. A 2005, 109, 5266-5274.
[15] S. R. Scully, M. D. McGehee, J. Appl. Phys. 2006, 100, 034907-5.[16] Y. Wu, Y. C. Zhou, H. R. Wu, Y. Q. Zhan, J. Zhou, S. T. Zhang, J. M. Zhao, Z. J.
Wang, X. M. Ding, X. Y. Hou, Appl. Phys. Lett. 2005, 87 , 044104-3.[17] Y. C. Zhou, Y. Wu, L. L. Ma, J. Zhou, X. M. Ding, X. Y. Hou, J. Appl. Phys.
2006, 100, 023712-5.[18] S. E. Shaheen, C. J. Brabec, N. S. Sariciftci, F. Padinger, T. Fromherz, J. C.
Hummelen, Appl. Phys. Lett. 2001, 78, 841-843.[19] M. Theander, A. Yartsev, D. Zigmantas, V. Sundström, W. Mammo, M. R.
Andersson, O. Inganäs, Phys. Rev. B 2000, 61, 12957.
[20] D. E. Markov, J. C. Hummelen, P. W. M. Blom, A. B. Sieval, Phys. Rev. B 2005,72, 045216-5.
[21] D. E. Markov, C. Tanase, P. W. M. Blom, J. Wildeman, Phys. Rev. B 2005, 72,045217-6.
[22] L. W. Barbour, R. D. Pensack, M. Hegadorn, S. Arzhantsev, J. B. Asbury, J. Phys.Chem. C 2008, 112, 3926-3934.
[23] C. J. Brabec, G. Zerza, G. Cerullo, S. De Silvestri, S. Luzzati, J. C. Hummelen, S.Sariciftci, Chem. Phys. Lett. 2001, 340, 232-236.
[24] D. M. DeLongchamp, B. M. Vogel, Y. Jung, M. C. Gurau, C. A. Richter, O. A.Kirillov, J. Obrzut, D. A. Fischer, S. Sambasivan, L. J. Richter, E. K. Lin, Chem. Mater. 2005, 17 , 5610-5612.

8/10/2019 olex thesis.pdf
http://slidepdf.com/reader/full/olex-thesispdf 45/114
Chapter 2
45
[25] X. T. Hao, T. Hosokai, N. Mitsuo, S. Kera, K. K. Okudaira, K. Mase, N. Ueno, J. Phys. Chem. B 2007, 111, 10365-10372.
[26] N. C. Ramsdale, Greenham C. M., Adv. Mater. 2002, 14, 212-215.[27] A. Boudrioua, P. A. Hobson, B. Matterson, I. D. W. Samuel, W. L. Barnes, Synth.
Met. 2000, 111-112, 545-547.[28] R. Kersting, B. Mollay, M. Rusch, J. Wenisch, G. Leising, H. F. Kauffmann, J.Chem. Phys. 1997, 106, 2850-2864.
[29] H. S. Woo, O. Lhost, S. C. Graham, D. D. C. Bradley, R. H. Friend, C.Quattrocchi, J. L. Brédas, R. Schenk, K. Müllen, Synth. Met. 1993, 59, 13-28.
[30] O. V. Mikhnenko, F. Cordella, A. B. Sieval, J. C. Hummelen, P. W. M. Blom, M. A. Loi, J. Phys. Chem. B 2008, 112, 11601-11604.
[31] A. Ruini, M. J. Caldas, G. Bussi, E. Molinari, Phys. Rev. Lett. 2002, 88, 206403.[32] T.-Q. Nguyen, B. J. Schwartz, R. D. Schaller, J. C. Johnson, L. F. Lee, L. H.
Haber, R. J. Saykally, J. Phys. Chem. B 2001, 105 , 5153-5160.[33] R. K. Tikhoplav, B. C. Hess, Synth. Met. 1999, 101, 236-237.
[34] B. C. Hess, G. S. Kanner, Z. Vardeny, Phys. Rev. B 1993, 47 , 1407.[35] M. A. Loi, A. Mura, G. Bongiovanni, Q. Cai, C. Martin, H. R. Chandrasekhar, M.
Chandrasekhar, W. Graupner, F. Garnier, Phys. Rev. Lett. 2001, 86, 732.[36] A. J. Lewis, A. Ruseckas, O. P. M. Gaudin, G. R. Webster, P. L. Burn, I. D. W.
Samuel, Org. Electron. 2006, 7 , 452-456.

8/10/2019 olex thesis.pdf
http://slidepdf.com/reader/full/olex-thesispdf 46/114

8/10/2019 olex thesis.pdf
http://slidepdf.com/reader/full/olex-thesispdf 47/114
47
Chapter 3
Exciton Diffusion Length inNarrow Band Gap Polymers
We developed a new method to accurately extract the exciton diffusion length in
organic semiconductors by blending them with a low concentration of
methanofullerene[6,6]-phenyl C61 butyric acid methyl ester (PCBM). The dependence
of photoluminescence (PL) decay time on the fullerene concentration provides
information on both exciton diffusion and the nanocomposition of the blend.
Experimentally measured PL decays of blends based on two narrow band gap
dithiophene-benzothiadizole polymers were modeled using a Monte Carlo simulation
of 3D exciton diffusion in the blend. The extracted exciton diffusion length is
10.5±1 nm in both narrow band gap polymers, being considerably longer than the
5.4±0.7 nm that was measured with the same method in the model compound poly(3-
hexylthiophene) as a reference. Our approach is simple, fast and allows to
systematically measure and compare exciton diffusion length in a large number of
compounds.*
*O. V. Mikhnenko, H. Azimi, M. Scharber, M. Morana,P.W.M. Blom, M. A. Loi, Submitted for publication

8/10/2019 olex thesis.pdf
http://slidepdf.com/reader/full/olex-thesispdf 48/114
Exciton Diffusion Length in Narrow Band Gap Polymers
48
3.1 Introduction
Various techniques to measure the exciton diffusion length have been reported in the
literature. The most popular method is the fluorescence quenching in thin films oforganic semiconductors, in which one or both interfaces act as exciton quenching
wall.[1–10] In this approach the dependence of the exciton quenching efficiency on the
semiconductor thickness is measured and modeled with 1D diffusion equation to
extract the diffusion length. This is a direct measurement, however it is rather
difficult to apply due to many experimental requirements and difficulties in modeling.
A sharp boundary is necessary between the semiconductor and the quenching wall.[3]
The variation of the exciton density due to optical interference and absorption,[5,11,12]
the effect of the polymer-vacuum interface[13] and Förster energy transfer[5,10,14] should
be carefully evaluated and taken into account in the modeling. Finally, high precision
thickness measurements are needed to accurately determine the exciton diffusion
length. Other measurement approaches include exciton density modulation due to
light absorption;[14–18] exciton-exciton annihilation;[12,19,20] photocurrent modeling in
solar cells[21–23] and microwave conductivity.[24] These methods have their advantages
and also limitations that are related to the difficulties in sample preparation and/or
sophisticated measurement technique, complicated modeling with many fitting
parameters, etc.
Fluorescence quenching in thin films with randomly distributed quenchers is an
interesting approach to measure the exciton diffusion length[1,25–27] If the
concentration of quencher sites is well controlled then the comparison of the
photoluminescence (PL) decay of the blend with that of pristine semiconductor gives
the value of the exciton diffusion length. On the experimental side, the sample
preparation is very simple as well as the measurement of PL decays. However, the
analytical model is rather tedious and can be applied only within certain
limitations.[1,26–28] Furthermore the knowledge about the nanocomposition of the
blend is required for accurate measurements. Quenching molecules can form phase
separated domains, leading to the reduction of the quenching efficiency and
underestimation of the exciton diffusion length.
Here we developed a simple method to verify if quencher molecules are
intimately mixed or form clusters in the blends with conjugated polymers and
accurately evaluate the exciton diffusion length. The method is based on a Monte
Carlo simulation that models PL decays in semiconductor-quencher mixtures. As
interesting testing materials we have chosen PCPDTBT:PCBM blends (for full names
and chemical structures refer to Figure 3.1). We measured for the first time the 3D
exciton diffusion length of 10.6±0.6 nm in PCPDTBT that is considerably longer than
5.4±0.7 nm in P3HT. As an additional example we measured exciton diffusion length
in other narrow band gap polymer – Si-PCPDTBT – with identical chemical structure
to PCPDTBT, except for the substitution of the methylene bridge by the silylene

8/10/2019 olex thesis.pdf
http://slidepdf.com/reader/full/olex-thesispdf 49/114
Chapter 3
49
bridge. Interestingly, the resulting value of the exciton diffusion length is the same as
for PCPDTBT. Our methodology has numerous advantages compared to other
approaches, including simple sample preparation and easy experimental
measurements, which allow to systematically study exciton diffusion length in a large
number of materials.
Figure 3.1: Measured photoluminescence decays in blends of PCPDTBT (a) or P3HT
(b) with PCBM of various volume fractions. The data were normalized to the value at
time zero. The insets show the chemical structures of poly[2,6-(4,4-bis-(2-ethylhexyl)-
4H-cyclopenta[2,1-b;3,4-b’]dithiophene)-alt -4,7-(2,1,3-benzothiadi-azole)] (PCPDTBT),
poly(3-hexylthiophene) (P3HT) and methanofullerene[6,6]-phenyl C61 butyric acid
methyl ester (PCBM).

8/10/2019 olex thesis.pdf
http://slidepdf.com/reader/full/olex-thesispdf 50/114
Exciton Diffusion Length in Narrow Band Gap Polymers
50
3.2 Modeling Photoluminescence Decays
Figure 3.1 shows photoluminescence decays of polymer:PCBM blends of various
PCBM volume fractions. Higher content of PCBM results in shorter PL decay timesfor both polymers PCPDTBT (Figure 3.1a) and P3HT (Figure 3.1b). The reduction of
the PL decay time is a result of the diffusion limited exciton quenching at the
polymer-PCBM interface. Considerable quenching is observed when the average
distance between PCBM molecules is comparable to – or smaller than – the exciton
diffusion length in the polymer phase. In this case the measured PL decay time
represents the average diffusion time to quenchers, rather than the natural decay
time.
The PL decay time strongly depends on the nanocomposition of the
polymer:PCBM blends. For a certain volume fraction of PCBM, the largest quenchingsurface – consequently the shortest PL decay time – is achieved when PCBM
molecules intimately mix with the polymer matrix and form a homogeneous spatial
distribution. If the quencher molecules cluster together in phase separated domains,
then the PL decay will show a slower dynamics due to the reduction of the quenching
surface. To model exciton diffusion in the polymer:PCBM blends it is therefore very
important to be aware of the nanocomposition in the blend.
We developed a Monte Carlo simulation of 3D exciton diffusion in a medium
with morphology of arbitrary complexity, including intimate mixture and clustered
quencher distribution. Non-interacting excitons undergo a random walk in this
medium and decay non-radiatively when they contact a quenching site during their
lifetime. The inputs of the simulation are the sample morphology, the natural PL
decay time and the only fitting parameter is the exciton diffusion length. As output we
get a PL decay that is the number of radiatively decayed excitons versus time. The
simulation is repeated with the adjusted fitting parameter until the modeled and
experimental data converge, resulting in the value of exciton diffusion length.
A cubic simulation box with the edge length of 50 nm and periodic boundary
conditions is considered to be a continuous medium of polymer phase, in which
PCBM quenchers are placed. PCBM molecules are approximated as balls of 1 nm in
diameter. Two types of morphologies have been considered, intimate mixture and
phase separated PCBM clusters of certain size. Intimate mixture is modeled by
randomly placing PCBM molecules to the simulation box. A cluster of N molecules is
modeled by a center molecule with N-1 nearest neighbors in the triclinic crystal
structure of PCBM.[29] The overlapping configurations are not accepted when
randomly placing a new quencher or cluster to the box. A Boolean 3D grid of 0.05 nm
pinch size is superimposed with the simulation box. Each 3D cell of the grid is given
the value true or false if it overlaps or not with a PCBM molecule. Excitons are
described as balls of 1 nm diameter in our Monte Carlo simulation. Since they interact
only with quenchers, we can simplify the exciton representation to point particles by

8/10/2019 olex thesis.pdf
http://slidepdf.com/reader/full/olex-thesispdf 51/114
Chapter 3
51
increasing the quencher size by the exciton radius. The spatial coordinates of the
excitons are not restricted to the Boolean grid nodes.
At room temperature exciton hopping in conjugated polymers can be described
by normal diffusion:[8,30,31]
2n n D n
t τ
∂= ∇ −
∂, (3.1)
where n is the exciton density, D is the diffusion coefficient, τ is the PL decay time
in a pristine polymer film. According to the Einstein’s theory of random walks normal
diffusion can be modeled as a random walk with constant step size.[6,32–35] Each time
iteration t δ every exciton is moved in a random 3D direction for a fixed distance sδ ,
which is related to the diffusion coefficient D by a relationship:2
6
s D
t
δ
δ
= . (3.2)
The time interval t δ is chosen such that sδ is several times smaller than the typical
quencher size. The exciton diffusion length D L is then given by the following
expression:
3 D L Dτ = . (3.3)
The exciton is considered to be quenched if its new position overlaps with a grid cell,
the value of which is true. Radiative recombination is assumed if an exciton has not
been quenched after time it ∆ , which had been fixed at the beginning of the
simulation by:
Figure 3.2: Fitting of experimentally measured PL decays (dotted lines) o
polymer:PCBM blends with Monte Carlo simulation (solid lines). The volume fraction o
PCBM was 0.05% in both blends. Data were normalized to their maximum value at time
zero.

8/10/2019 olex thesis.pdf
http://slidepdf.com/reader/full/olex-thesispdf 52/114
Exciton Diffusion Length in Narrow Band Gap Polymers
52
ln( )i it wτ ∆ = − , (3.4)
where iw is a random number between 0 and 1.
Figure 3.2 illustrates the measured PL decays (dotted lines) of P3HT:PCBM
and PCPDTBT:PCBM blends with PCBM volume fraction of 0.05%. The PL decays, which were modeled with the Monte Carlo simulation, are depicted as solid lines. Our
model fits the experimental data remarkably well and results in the values of the
exciton diffusion coefficient of 2.2×10⁻⁴ and 27×10-4 cm2/s that correspond to the
diffusion length of 5.5 and 10.8 nm in P3HT and PCPDTBT, respectively. “intimate
mixture” blend morphology was assumed when modeling these PL decays; we will
verify this assumption below. PL decays of blends with other volume fractions were
also modeled resulting in average values of exciton diffusion coefficients and lengths
of (2.2±0.3)×10-4 cm2/s and 5.4±0.7 nm in P3HT; (26±3)×10-4 cm2/s and 10.6±0.6
nm in PCPDTBT, respectively. The error is the standard deviation in the mean value.
3.3 Checking for PCBM Aggregation
PL decay times of samples of various PCBM fractions can be compared using the
relative quenching efficiency Q that is defined as:
1blend
pristine
PL dt Q
PL dt = −
, (3.5)
Figure 3.3: Measured dependencies of relative quenching efficiency versus volume
fraction of PCBM in blends with PCPDTBT (squares) and P3HT (pentagons). Curves
represent modeled data for intimate mixture between polymer and PCBM (solid lines)
and phase separated morphology of two PCBM molecules per cluster (dashed line).

8/10/2019 olex thesis.pdf
http://slidepdf.com/reader/full/olex-thesispdf 53/114
Chapter 3
53
where blend PL and pristine PL are normalized to the value at time zero PL decays of a
polymer:PCBM blend and pristine polymer, respectively. Nearly zero values of Q
indicate that the exciton quenching is insignificant, which is typical for low
concentrations of quenching molecules. At high PCBM concentrations most of the
excitons are quenched, resulting in a short PL decay time and a close to unity values
of Q .
The measured relative quenching efficiencies versus PCBM volume fraction are
shown in Figure 3.3 for PCPDTBT (squares) and P3HT (pentagons); the lines are
modeled using the Monte Carlo simulation. Solid lines are for the intimate
polymer:PCBM mixtures, while the dashed line represents the phase separated
morphology with two PCBM molecules per cluster. The exciton diffusion length was
set to the previously extracted values of 10.6 and 5.4 nm for PCPDTBT and P3HT
respectively. The measured data for PCPDTBT is excellently described by the
simulated curve in all the studied range of PCBM volume fractions. While the
modeled curve of P3HT follows the experimental data points only up to a PCBM
volume fraction of 0.3%; deviation from the measured values is observed for samples
of higher PCBM content.
The deviation between modeled curve and experimental data points in Figure
3.3 can be explained by the cluster formation in the P3HT-PCBM blends. It is
reasonable to assume that the formation of clusters during the solvent evaporation is
more likely in blends of higher PCBM fractions. An increase of the cluster size results
in the reduction of the interfacial area between polymer and PCBM. Consequently the
relative quenching efficiency is smaller in the phase separated sample as compared to
the intimately mixed blends of the same PCBM fraction. Indeed, the experimental
data for volume fraction of 0.8% and higher is much better described by the
simulation, in which PCBM molecules are set to form clusters of two molecules
(dashed line in Figure 3.3).
Contrary, the MC simulation accurately describes the experimentally acquired
data in PCPDTBT:PCBM blends assuming the formation of the intimate mixture
(Figure 3.3). Therefore we conclude that PCBM molecules do not form clusters in the
studied concentration range. Formation of clusters would be indicated by the
deviation between the modeled and experimental dependencies at higher PCBM
concentrations.
Regio-regular P3HT is known to form polycrystalline domains.[36] Therefore it is
not surprising that PCBM tend to phase separate in the blends. PCPDTBT does not
form crystalline domains if processed without additives,[37–41] which is in accordance
with the intimate mixture morphology deduced in this work. The exciton diffusion
length in P3HT has been previously reported in the range of 3 and 8.5 nm.[7,12,24,27]
Our measurements result in 5.4 nm, which is in agreement with the literature and
further confirms the validity of our method. The fact that the exciton diffusion length

8/10/2019 olex thesis.pdf
http://slidepdf.com/reader/full/olex-thesispdf 54/114
Exciton Diffusion Length in Narrow Band Gap Polymers
54
of 10.6 nm in PCPDTBT is longer than that in P3HT is consistent with the superior
solar cell performance of the former material.[37,42]
3.4 Exciton Diffusion in Si-PCPDTBT
The developed methodology for measuring exciton diffusion length can be easily
applied to various materials. As an additional example we investigated another
narrow band gap material, namely Si-PCPDTBT, for full name and chemical structure
refer to Figure 3.4. The chemical structure of this polymer is identical to PCPDTBT,
except the substitution of the methylene bridge by a silylene bridge (see Figures 3.4
and 3.1a). Si-PCPDTBT is a promising material for applications in solar cells as it does
not require processing additives or post annealing steps in order to reach power
conversion efficiency above 5%.[40]
Figure 3.4 shows the dependence of the measured relative quenching efficiency
on the PCBM volume fraction in Si-PCPDTBT:PCBM blends (circles). The fitting of
the PL decays of the blends with PCBM volume fraction below 0.3% using the Monte
Carlo simulation results in the average exciton diffusion coefficient of (11±2.2)×10 -4
cm2/s that corresponds to the diffusion length of 10.5±1 nm. The error is the standard
deviation in the mean value.
The solid line in Figure 3.4 is modeled using the mean value of the exciton
diffusion coefficient and assuming intimate mixture of Si-PCPDTBT:PCBM blends.
Figure 3.4: Measured (circles) relative quenching efficiency versus PCBM volume
fraction in poly[(4,4′-bis(2-ethylhexyl)dithieno[3,2-b:2′,3′-d ]silole)-2,6-diyl-alt -(2,1,3-
benzothiadiazole)-4,7-diyl] (Si-PCPDTBT). The curve is the fitting of the measured data
with the Monte Carlo simulation assuming the intimate mixture morphology of Si-
PCPDTBT:PCBM blends. The inset shows the chemical structure of Si-PCPDTBT.

8/10/2019 olex thesis.pdf
http://slidepdf.com/reader/full/olex-thesispdf 55/114
Chapter 3
55
The modeled curve deviates from the experimental data points at higher volume
fractions than 0.3%. Such a deviation indicates the phase separation of the
polymer:PCBM blends. Formation of PCBM clusters at higher PCBM concentration is
consistent with the fact that Si-PCPDTBT shows higher crystallinity than the carbon bridged polymer in as-cast films.[40] High degree of crystallinity, which is expected to
enhance the phase separation, is the common feature of Si-PCPDTBT and P3HT
films.
Interestingly, the silicon bridged polymer shows the same exciton diffusion
length as the carbon bridged material, while the exciton diffusion coefficient is about
two times smaller in Si-PCPDTBT. Mathematically such a contrast is possible due to
the fact that PL decay time of the silicon-bridged polymer in pristine film is about two
times longer than PL decay time of the carbon bridged one (see Eq. 3.3). Similar
result has been shown by Markov et. al. in a family of poly( p-phenylene vinylene)-derivatives, in which increase of the exciton diffusion coefficient was compensated by
the decrease of the PL decay time leading to the same values of the exciton diffusion
length.[43]
3.5 Discussion
Figure 3.5 shows the family of modeled dependencies of relative quenching
efficiency on the volume fraction of PCBM in P3HT; PCBM-PCPDTBT blends give
Figure 3.5: Modeled relative quenching efficiency versus volume fraction of PCBM in
P3HT setting various exciton diffusion length (solid lines) and clustering (dashed lines).
The insets schematically show the morphology of intimate mixture (top) and phase
separated blends of two and four molecules per cluster (right). The total number o
PCBM molecules (black dots) is the same in each inset.

8/10/2019 olex thesis.pdf
http://slidepdf.com/reader/full/olex-thesispdf 56/114
Exciton Diffusion Length in Narrow Band Gap Polymers
56
similar results (not shown in Figure 3.5). The solid lines are calculated by setting the
exciton diffusion length – from left to right – to 9, 7 and 5 nm. The dashed lines
represent samples with phase separated domains of 2 and 4 PCBM molecules per
cluster, setting the exciton diffusion length to 5 nm. In the intermediate concentration
range the relative quenching efficiency is very sensitive for the exciton diffusion
length and the blend morphology. As expected, the highest quenching efficiency is
achieved for the longest exciton diffusion length and homogeneous distribution of the
quenching molecules. While the lowest values of Q are obtained when PCBM
molecules are set to form clusters of the largest size.
Remarkably the curves in Figure 3.5 do not cross in the intermediate
concentration range, but rather replicate each other by a translation along the
horizontal axis. Therefore we can summarize our methodology as follows: if the
experimental data can be described by one of the curves then the quencher molecules
form either an intimate mixture with the polymer or clusters of fixed size in the whole
concentration range. The latter option is unlikely because the cluster formation
probability is increasing with the concentration of quenchers. If the measured relative
quenching efficiency grows with the PCBM volume fraction more slowly than a typical
modeled curve, then quenchers form larger phase separated domains in that
concentration range.
The developed methodology of exciton diffusion measurement has numerous
advantages as compared to other approaches. The only fitting parameter is the
exciton diffusion length; the model does not require assumptions, for instance, about
the exciton-exciton annihilation cross-section.[12,19,20] The measured exciton diffusion
length corresponds to the diffusion in three dimensions, which is the case in the bulk
heterojunction solar cells. The effects at interfaces can be safely neglected because the
samples are much thicker than the exciton diffusion length. The exciton density
variations due to optical interference and light absorption do not influence the PL
decay in the blends because samples are isotropic and low excitation densities have
been used, which are insufficient for the considerable exciton-exciton annihilation.
The simplicity of sample preparation and experimental methods makes it practical to
systematically measure and compare exciton diffusion length in large number of
materials. Finally, we can access the polymer-quencher morphology of low quencherconcentrations using the MC simulation. To the best of our knowledge, this question
has not been addressed before in the PCBM concentration range of 0.01-5 wt%.
3.6 Conclusions
Using a newly developed method we found that PCBM molecules form intimate
mixtures with PCPDTBT in blends with PCBM concentration ranging from 0.01 to 5
wt%. Phase separated domains have been detected in Si-PCPDTBT and P3HT at
concentrations above 0.9 wt% and 1.8 wt%, respectively. The knowledge about the

8/10/2019 olex thesis.pdf
http://slidepdf.com/reader/full/olex-thesispdf 57/114
Chapter 3
57
blend morphology allows us to model 3D diffusion and accurately determine the
exciton diffusion coefficients of (2.2±0.5)×10-4, (26±3)×10-4 and (11±2)×10-4 cm2/s
that correspond to the diffusion lengths of 5.4±0.7, 10.6±0.6, and 10.5±1 nm in
P3HT, PCPDTBT and Si-PCPDTBT, respectively. Remarkably the exciton diffusion
length is the same in both narrow band gap polymers. Compared to other approaches,
the proposed method for exciton diffusion measurement has numerous advantages
and is suitable for systematic studies in a large number of materials.
3.7 Methods
PCPDTBT and Si-PCPDTBT were synthesized by Konarka Technologies; PCBM and
regio-regular P3HT were purchased from Solene BV and Sigma-Aldrich, respectively.
Polymer solutions in chlorobenzene were mixed with various fractions of PCBMdilute solution, and spin-coated on glass substrates to produce ~100 nm thick films of
polymer:PCBM blends. Samples were prepared under inert nitrogen atmosphere and
encapsulated with a glass substrate to further protect films from air during the optical
measurements. No annealing steps have been applied to the blends. The PCPDTBT-
and Si-PCPDTBT-based blends were excited at 760 nm by the principal harmonics of
a 100 fs pulsed Ti-Sapphire laser. P3HT-based blends were excited 380 nm by
frequency doubled pulses of the same laser. The initial exciton density was kept well
below 1015 cm-3. PL decays were measured by two Streak cameras sensitive in the near
infrared and the visible spectral parts, respectively. The PL decays of PCPDTBT were
deconvoluted with the instrument response function and fitted as mono- or bi-
exponential decays for further analysis. Software for Monte Carlo simulations has
been specifically developed to model exciton diffusion in polymer:PCBM blends.
Mersenne twister algorithm[44] has been used as a pseudo random number generator,
implemented by A. Fog.[45]
The PCBM volume fraction is the volume occupied by PCBM molecules, which
are assumed to be balls with diameter of 1 nm, divided by the total volume of the
blend. The polymer density is an important parameter for determination of the PCBM
volume ratio. In our simulation we took a P3HT density of 1.1 g/cm3 (Ref. [46,47]). The
density of PCPDTBT and Si-PCPDTBT has not been reported yet, however conjugated
polymers typically have densities in the range of 0.9 – 1.4 g/cm 3 (Ref. [46–48]). We
found it reasonable to set the density to 1.3 g/cm3 in our simulations, resulting in the
exciton diffusion length of ~10.5 nm. Generally, the fitting results depend only weakly
on the polymer density. Thus settings of 1.2 or 1.4 g/cm3 in the simulation lead to an
exciton diffusion length of 11.1 and 10.2 nm, respectively, resulting in a change of
approximately 0.5 nm per 0.1 g/cm3.

8/10/2019 olex thesis.pdf
http://slidepdf.com/reader/full/olex-thesispdf 58/114
Exciton Diffusion Length in Narrow Band Gap Polymers
58
3.8 References
[1] A. Haugeneder, M. Neges, C. Kallinger, W. Spirkl, U. Lemmer, J. Feldmann, U.Scherf, E. Harth, A. Gügel, K. Müllen, Phys. Rev. B 1999, 59, 15346.[2] M. Theander, A. Yartsev, D. Zigmantas, V. Sundström, W. Mammo, M. R.
Andersson, O. Inganäs, Phys. Rev. B 2000, 61, 12957.[3] D. E. Markov, E. Amsterdam, P. W. M. Blom, A. B. Sieval, J. C. Hummelen, J.
Phys. Chem. A 2005, 109, 5266-5274.[4] Y. Wu, Y. C. Zhou, H. R. Wu, Y. Q. Zhan, J. Zhou, S. T. Zhang, J. M. Zhao, Z. J.
Wang, X. M. Ding, X. Y. Hou, Appl. Phys. Lett. 2005, 87 , 044104-3.[5] S. R. Scully, M. D. McGehee, J. Appl. Phys. 2006, 100, 034907-5.[6] Y. C. Zhou, Y. Wu, L. L. Ma, J. Zhou, X. M. Ding, X. Y. Hou, J. Appl. Phys.
2006, 100, 023712-5.
[7] C. Goh, S. R. Scully, M. D. McGehee, J. Appl. Phys. 2007, 101, 114503.[8] O. V. Mikhnenko, F. Cordella, A. B. Sieval, J. C. Hummelen, P. W. M. Blom, M. A. Loi, J. Phys. Chem. B 2008, 112, 11601-11604.
[9] K. Masuda, Y. Ikeda, M. Ogawa, H. Benten, H. Ohkita, S. Ito, ACS Appl. Mater. Interfaces 2010, 2, 236-245.
[10] W. A. Luhman, R. J. Holmes, Adv. Funct. Mater. 2011, 21, 764-771.[11] C. Breyer, M. Vogel, M. Mohr, B. Johnev, K. Fostiropoulos, Phys. Status Solidi B
2006, 243, 3176 - 318.[12] P. E. Shaw, A. Ruseckas, I. D. W. Samuel, Adv. Mater. 2008, 20, 3516-3520.[13] O. V. Mikhnenko, F. Cordella, A. B. Sieval, J. C. Hummelen, P. W. M. Blom, M.
A. Loi, J. Phys. Chem. B 2009, 113, 9104-9109.
[14] R. R. Lunt, N. C. Giebink, A. A. Belak, J. B. Benziger, S. R. Forrest, J. Appl. Phys. 2009, 105 , 053711-7.
[15] H. Najafov, B. Lee, Q. Zhou, L. C. Feldman, V. Podzorov, Nat. Mater. 2010, 9,938-943.
[16] R. R. Lunt, J. B. Benziger, S. R. Forrest, Adv. Mater. 2010, 22, 1233-1236.[17] S. Cook, A. Furube, R. Katoh, L. Han, Chem. Phys. Lett. 2009, 478, 33-36.[18] B. A. Gregg, J. Sprague, M. W. Peterson, J. Phys. Chem. B 1997, 101, 5362-5369.[19] S. Cook, H. Liyuan, A. Furube, R. Katoh, J. Phys. Chem. C 2010, 114, 10962-
10968.[20] A. J. Lewis, A. Ruseckas, O. P. M. Gaudin, G. R. Webster, P. L. Burn, I. D. W.
Samuel, Org. Electron. 2006, 7 , 452-456.[21] C. L. Yang, Z. K. Tang, W. K. Ge, J. N. Wang, Z. L. Zhang, X. Y. Jian, Appl. Phys.
Lett. 2003, 83, 1737-1739.[22] T. Stubinger, W. Brutting, J. Appl. Phys. 2001, 90, 3632-3641.[23] J. J. M. Halls, K. Pichler, R. H. Friend, S. C. Moratti, A. B. Holmes, Appl. Phys.
Lett. 1996, 68, 3120-3122.[24] J. E. Kroeze, T. J. Savenije, M. J. W. Vermeulen, J. M. Warman, J. Phys. Chem.
B 2003, 107 , 7696-7705.[25] H. Wang, H.-Y. Wang, B.-R. Gao, L. Wang, Z.-Y. Yang, X.-B. Du, Q.-D. Chen, J.-
F. Song, H.-B. Sun, Nanoscale 2011, 3, 2280.[26] D. E. Markov, P. W. M. Blom, Phys. Rev. B 2006, 74, 085206-5.
[27] L. Lüer, H.-J. Egelhaaf, D. Oelkrug, G. Cerullo, G. Lanzani, B.-H. Huisman, D.de Leeuw, Org. Electron. 2004, 5 , 83-89.

8/10/2019 olex thesis.pdf
http://slidepdf.com/reader/full/olex-thesispdf 59/114
Chapter 3
59
[28] B. Y. Balagurov, V. G. Vaks, JETP 1973, 65 , 1939-1946.[29] M. T. Rispens, A. Meetsma, R. Rittberger, C. J. Brabec, N. S. Sariciftci, J. C.
Hummelen, Chem. Commun. 2003, 2116.[30] F. B. Dias, K. T. Kamtekar, T. Cazati, G. Williams, M. R. Bryce, A. P. Monkman,
ChemPhysChem 2009, 10, 2096-2104.[31] M. Anni, M. E. Caruso, S. Lattante, R. Cingolani, J. Chem. Phys. 2006, 124,134707.
[32] S. B. Lee, I. C. Kim, C. A. Miller, S. Torquato, Phys. Rev. B 1989, 39, 11833.[33] M. R. Riley, F. J. Muzzio, H. M. Buettner, S. C. Reyes, Phys. Rev. E 1994, 49,
3500.[34] M. R. Riley, H. M. Buettner, F. J. Muzzio, S. C. Reyes, Biophys J 1995, 68, 1716-
1726.[35] J. A. Anta, Energy Environ. Sci. 2009, 2, 387.[36] X. Yang, J. Loos, S. C. Veenstra, W. J. H. Verhees, M. M. Wienk, J. M. Kroon, M.
A. J. Michels, R. A. J. Janssen, Nano Lett. 2005, 5 , 579-583.
[37] J. Peet, J. Y. Kim, N. E. Coates, W. L. Ma, D. Moses, A. J. Heeger, G. C. Bazan, Nat Mater 2007, 6, 497-500.
[38] D. Di Nuzzo, A. Aguirre, M. Shahid, V. S. Gevaerts, S. C. J. Meskers, R. A. J.Janssen, Adv. Mater. 2010, 22, 4321-4324.
[39] M. Morana, H. Azimi, G. Dennler, H.-J. Egelhaaf, M. Scharber, K. Forberich, J.Hauch, R. Gaudiana, D. Waller, Z. Zhu, K. Hingerl, S. S. van Bavel, J. Loos, C. J.Brabec, Adv. Funct. Mater. 2010, 20, 1180-1188.
[40] M. C. Scharber, M. Koppe, J. Gao, F. Cordella, M. A. Loi, P. Denk, M. Morana,H.-J. Egelhaaf, K. Forberich, G. Dennler, R. Gaudiana, D. Waller, Z. Zhu, X. Shi,C. J. Brabec, Adv. Mater. 2010, 22, 367-370.
[41] M. Morana, M. Wegscheider, A. Bonanni, N. Kopidakis, S. Shaheen, M.
Scharber, Z. Zhu, D. Waller, R. Gaudiana, C. Brabec, Adv. Funct. Mater. 2008,18, 1757-1766.[42] M. Reyes-Reyes, K. Kim, D. L. Carroll, Appl. Phys. Lett. 2005, 87 , 083506.[43] D. E. Markov, C. Tanase, P. W. M. Blom, J. Wildeman, Phys. Rev. B 2005, 72,
045217-6.[44] M. Matsumoto, T. Nishimura, ACM Trans. Model. Comput. Simul. 1998, 8, 3–
30.[45] “Pseudo random number generators,” can be found under
http://www.agner.org/random/, n.d. [46] T. J. Prosa, M. J. Winokur, J. Moulton, P. Smith, A. J. Heeger, Macromolecules
1992, 25 , 4364-4372.
[47] J. Mårdalen, E. J. Samuelsen, O. R. Gautun, P. H. Carlsen, Solid StateCommunications 1991, 77 , 337-339.
[48] C. W. T. Bulle-Lieuwma, W. J. H. van Gennip, J. K. J. van Duren, P. Jonkheijm,R. A. J. Janssen, J. W. Niemantsverdriet, Applied Surface Science 2003, 203-204, 547-550.

8/10/2019 olex thesis.pdf
http://slidepdf.com/reader/full/olex-thesispdf 60/114

8/10/2019 olex thesis.pdf
http://slidepdf.com/reader/full/olex-thesispdf 61/114
61
Chapter 4
Effect of Thermal Annealing onExciton Diffusion
In this chapter we show that the method we have developed for measuring the singlet
exciton diffusion length in blends with [6,6]-phenyl-C61-butyric acid methyl ester
(PCBM) can be applied not only to polymeric materials, but also to small molecule
organic semiconductors. Small organic molecules have a large potential for molecular
re-organization upon thermal annealing. Here we show that the exciton diffusion
length is decreased upon annealing from 9 to 3 nm in a thin film of a
diketopyrrolopyrrole derivative. Such a variation is attributed to exciton
delocalization effects in the crystalline domains that are formed during the annealing
process as well as to the exciton quenching at grain boundaries.*
*O.V. Mikhnenko, J. Lin, Y. Shu, J. E. Anthony,
P. W. M. Blom, T.-Q. Nguyen, M. A. Loi, Submitted for publication

8/10/2019 olex thesis.pdf
http://slidepdf.com/reader/full/olex-thesispdf 62/114
Effect of Thermal Annealing on Exciton Diffusion
62
4.1 Introduction
An interpenetrating network of electron donating and electron accepting materials –
a bulk heterojunction – is an efficient structure to be used as active layer of thin film
solar cells.[1,2] Thermal annealing is often applied to bulk heterojunctions in order to
improve their morphology for more efficient charge extraction.[3–7] Typically
annealing enhances the phase separation of donor and acceptor materials andpromotes the formation of polycrystalline phases resulting in higher charge carrier
mobility. The power conversion efficiency of annealed solar cells is sometimes
increased by orders of magnitude as compared to untreated devices.[7] Despite the
strong interest for the exciton diffusion processes in as-cast films, [8] thermally
annealed thin films only received little attention in the literature. Several experiments
show that the exciton diffusion length is longer in phases with stronger molecular
interactions.[9–16] Since thermal annealing usually improves the local crystallinity of
phase separated domains, the exciton diffusion length is expected to be longer in
annealed films.
Here we show that in contrast to expectations, the exciton diffusion length
decreases upon annealing from 9 to 3 nm in C6PT2-DPP (for full name and chemical
structure see Figure 4.1). C6PT2-DPP is a small molecule organic semiconductor that
belongs to the family of diketopyrrolopyrrole derivatives.[7,17–23] Compared to
polymers, small molecules have numerous advantages including easier synthetic
procedures, higher purity, monodispersity, and higher possibility of supramolecular
organization. Therefore small molecules are potentially suited for devices that require
high charge carrier mobilities.[24,25] Currently the power conversion efficiency of
Figure 4.1: Chemical structures of 2,5-dihexyl-3,6-bis[4-(2,2’-bithiophene-5-
yl)phenyl]pyrrolo[3,4-c]pyrrole-1,4-dione (C6PT2-DPP), [6,6]-phenyl-C61-butyric acid
methyl ester (PCBM) and 2,3-dicyano-6,13-bis-(triisopropylsilylethynyl)pentacene
(diCN-TIPS-Pn).

8/10/2019 olex thesis.pdf
http://slidepdf.com/reader/full/olex-thesispdf 63/114
Chapter 4
63
solution processed solar cells based on small molecules up to 6.7% (Ref. [7,26–32]),
approaching the efficiencies of polymer-based devices.[33]
4.2 Effect of Annealing on Crystallinity and
Photophysical Properties
Figure 4.2 shows the x-ray diffraction pattern of thin film of C6PT2-DPP before and
after thermal annealing at 75 ºC. Before annealing there are no features in the
diffraction pattern, indicating the isotropic amorphous structure of the film. After
annealing at 80 ºC a strong peak is appearing at 6.3º due to the emergence of a
polycrystalline arrangement.
Figure 4.3a presents the photoluminescence (PL) spectra of C6PT2-DPP in
chloroform solution and in film before and after annealing. The PL spectrum
undergoes a gradual red shift going from solution to as-cast thin films; followed by a
further red shift as a result of annealing. Such a red shift is due to intermolecular
interactions in the thin film, which are enhanced upon annealing-induced
crystallization. Excitons undergo delocalization among adjacent molecules in thin
films resulting in the observed red shift. The delocalization is most pronounced in the
annealed films due to the polycrystalline ordering (Figure 4.2). [34–37]
Thermal annealing has also a strong effect on the PL decay time of the C6PT2-
DPP films. Figure 4.3b illustrates that the PL decay time of the annealed C6PT2-DPP
film is significantly shorter than that of the as-cast film. For data analysis we describe
PL decays in thin films of C6PT2-DPP with a bi-exponential function:
Figure 4.2: X-ray diffraction pattern of pristine C6PT2-DPP film before and after thermal
annealing at 75 ºC.

8/10/2019 olex thesis.pdf
http://slidepdf.com/reader/full/olex-thesispdf 64/114
Effect of Thermal Annealing on Exciton Diffusion
64
Table I. Bi-exponential decay constants of as cast and annealed films of C6PT2-DPP. The
decays were normalized to the value at time zero such that1 2 1a a+ = . The integral over
time is given by 1 1 2 2a aτ τ + , see Eq. (4.1).
1a 1τ (ns) 2a 2τ (ns) Integral(ns)
As-cast film 0.765 2.514 0.235 0.248 1.981
Annealed film 0.820 1.094 0.180 0.149 0.923
1 2/ /
1 2( ) t t
PL t a e a eτ τ − −
= + . (4.1)
The values of 1a , 2a , 1τ , and 2τ of both as-cast and annealed films of C6PT2-DPP arelisted in Table I for reference. There are several reasons that may be responsible for
the faster PL decay in the annealed films. The enhanced delocalization of excitons in
polycrystalline films may lead to an increase in the efficiency of exciton dissociation
to non-emissive species – such as free charges – resulting in shorter PL decay
times.[34–39] Lunt et al. showed that photoluminescence can be quenched at the
boundaries of the polycrystalline domains,[40] which also may lead to shorter PL decay
times.
Figure 4.3: (a) Photoluminescence spectra of C6PT2-DPP in chloroform solution, and
thin film before and after annealing. The data were normalized to the maximum intensity
value. (b) PL decays of as-cast and annealed pristine C6PT2-DPP films. The instrument
response function (IRF) to 100 fs laser pulse is also presented. Normalization was made
to the value at time zero.

8/10/2019 olex thesis.pdf
http://slidepdf.com/reader/full/olex-thesispdf 65/114
Chapter 4
65
4.3 Exciton Diffusion Measurements
To measure the exciton diffusion length in C6PT2-DPP we apply the method that was
described in detail in Chapter 3. We model the PL decays of C6PT2-DPP:PCBM blends with various PCBM concentrations using Monte Carlo simulation. This simulation
takes as inputs the concentration of PCBM molecules, the morphology of the blend,
the parameters of the bi-exponential PL decay in the pristine film, and the only fitting
parameter – the exciton diffusion coefficient. As output we get a simulated PL decay,
which is then compared to the experimentally measured data.
At the beginning of a simulation run, non-interacting excitons – balls of 1 nm in
diameter – are randomly placed into the simulation box of 50×50×50 nm, which
corresponds to the input morphology of the blend C6PT2-DPP:PCBM. Typical
morphology is the homogeneous random distribution of non-overlapping PCBMmolecules that are modeled as balls of 0.5 nm radius.[41] Periodic boundary conditions
are imposed to the simulation box to mimic an infinitely large medium. Excitons are
moved in a random 3D direction by the fixed distance sδ during each iteration time
t δ . According to the Einstein theory of random walks the exciton diffusion
coefficient D is related to sδ and t δ as:2
6
s D
t
δ
δ = . (4.2)
Figure 4.4: PL decays of C6PT2-DPP thin film and blend with 0.82wt% PCBM before
(left) and after annealing (right). PL decays were normalized to the value at time zero.
The result of the fitting of the PL decays of the blend with Monte Carlo simulation is also
presented.

8/10/2019 olex thesis.pdf
http://slidepdf.com/reader/full/olex-thesispdf 66/114
Effect of Thermal Annealing on Exciton Diffusion
66
An exciton is considered to decay radiatively at time it , which is defined at the
beginning of the simulation run in order to reflect the bi-exponential PL decay in the
pristine film:
ln( )i k i
t wτ = − , (4.3)
1
1 2
1;i
aif then k
a a ρ
< =
+ 2otherwise k = , (4.4)
where iw and i are independent random numbers between 0 and 1; index k
distinguishes between the components of the bi-exponential decay. If an exciton
touches a PCBM molecule before time it then it is considered to be quenched and
does not undergo radiative recombination. At least 2×10⁵ excitons are modeled
during each simulation run. The modeled PL decay is the number of radiatively
decayed excitons versus time. The simulation is repeated with adjusted excitonhopping distance sδ until the modeled PL decay coincides with the experimentally
measured one for the specific concentration of PCBM molecules in the modeled
sample.
Figure 4.4 shows an example of the fitting of the experimentally measured PL
decays before and after annealing at 80 ºC of the C6PT2-DPP:PCBM blend. The PCBM
concentration in this specific sample was 6.5×1018 cm-3 that corresponds to 0.82 wt%
or the PCBM volume fraction of 0.3%. The fitting results in an exciton diffusion
coefficient of 1×10⁻⁴ cm2/s and 2.5×10⁻⁵ cm2/s, which correspond to an exciton
diffusion length of 8.7 nm and 2.8 nm for the as-cast and annealed samples,respectively. The 3D exciton diffusion length is calculated using the following
expression:
3 D
L Dτ = , (4.5)
where τ is the average PL decay time of the pristine film of C 6PT2-DPP (see Eq. 4.1
and Ref. [42]):2 2
1 1 2 2
1 1 2 2
a
a
τ α τ τ
τ α τ
+=
+. (4.6)
The exciton diffusion coefficients and diffusion lengths were extracted for each
sample resulting in the average values of (1.1±0.1)×10 -4 and (2.5±0.4)×10-5 cm2/s;
8.8±0.3 and 2.8±0.2 nm for the as-cast and annealed samples, respectively. The error
is the standard deviation of the mean value. To compare samples with different PCBM
concentrations we introduce the relative quenching efficiency:
1 blend
reference
dt PLQ
dt PL= −
, (4.7)
where blend PL andreference PL are normalized to the value at time zero PL decays of the
blend and pristine C6PT2-DPP film, respectively.

8/10/2019 olex thesis.pdf
http://slidepdf.com/reader/full/olex-thesispdf 67/114
Chapter 4
67
Figure 4.5 shows the dependence of the relative quenching efficiency on the
PCBM concentration in the as-cast and annealed blends. The solid lines in Figure 4.5
are calculated by setting in the simulation the extracted average values of the exciton
diffusion coefficients. The simulated curve accurately describes the relative quenching
efficiency of as-cast films in all the concentration range using a single value of the
diffusion coefficient. Consequently, we conclude that the PCBM molecules do not
form phase separated domains in the as-cast blends. Deviation from the experimental
data is expected at higher concentrations of PCBM if clusters were formed (see
Chapter 3).
The relative quenching efficiency of annealed blends is also accurately described
by the simulated curve in Figure 4.5. Only at PCBM concentration of 3.8×1019 cm-3 the
modeled curve deviates from the experimental data point, suggesting the formation of
small clusters of PCBM molecules at that concentration.
4.4 Using Different Exciton Quenching Molecule
Upon annealing we found a significant decrease of the exciton diffusion length from 9
to 3 nm in C6PT2-DPP. When modeling the PL decays we assumed that PCBM forms
an intimate mixture with C6PT2-DPP. This assumption should be additionally verified
because thermal annealing could induce phase separation in the blend. In order to
check if such a phase separation indeed occurred we compare PCBM:C6PT2-DPP
blends with diCN-TIPS-Pn:C6PT2-DPP blends. diCN-TIPS-Pn is an efficient exciton
quencher that has quite different chemical structure as compared to PCBM.[43]
Figure 4.5: Dependence of the relative quenching efficiency on the PCBM content in as-
cast (circles) and annealed (triangles) samples. The lines are the result of the Monte Carlo
simulation, see text.

8/10/2019 olex thesis.pdf
http://slidepdf.com/reader/full/olex-thesispdf 68/114
Effect of Thermal Annealing on Exciton Diffusion
68
First we quantify the exciton quenching efficiency of diCN-TIPS-Pn in the blends
with C6PT2-DPP by modeling the PL decays of as-cast films. For simplicity, the
molecular shape of diCN-TIPS-Pn is approximated in our simulations as an isotropic
ball. An exciton is considered to be quenched upon contact with the surface of this
ball. The measured PL decays are modeled by setting the exciton diffusion coefficient
to the value that was previously found using PCBM:C6PT2-DPP blends, and varying
only the exciton quenching radius of diCN-TIPS-Pn. In this way we found a value for
the exciton quenching radius of 0.81±0.03 nm. The error is the standard deviation of
mean value among 5 samples with different concentrations of diCN-TIPS-Pn.
Interestingly, the quenching radius of diCN-TIPS-Pn is larger than the quenching
radius of fullerenes – o.5 nm – this is possibly due to the Förster energy transfer from
C6PT2-DPP to diCN-TIPS-Pn.
Figure 4.6 shows the dependence of the relative quenching efficiency on the
concentration of quenching molecules in diCN-TIPS-Pn:C6PT2-DPP blends before(circles) and after (triangles) annealing. The solid line was calculated by setting the
exciton diffusion coefficient to 1.1×10⁻⁴ cm2/s and the quenching radius of diCN-TIPS-
Pn to 0.81 nm. This simulated curve excellently fits the experimental data confirming
that (i) we accurately determined the quenching radius of diCN-TIPS-Pn and (ii)
there are no phase separated domains in the as-cast blends.
The dashed line in Figure 4.6 was back-calculated using the exciton diffusion
coefficient of 2.5×10⁻⁵ cm2/s, which was extracted in the annealed PCBM:C6PT2-DPP
blends; and the quenching radius of 0.81 nm that we determined for as-cast diCN-
TIPS-Pn containing blends. This curve predicts the experimental data points of the
Figure 4.6: Relative quenching efficiency versus quencher concentration in diCN-TIPS-
Pn:C6PT2-DPP blends in as cast (circles) and annealed (triangles) samples. The lines are
modeled with Monte Carlo simulation by setting the quenching radius of diCN-TIPS-Pn
to 0.81 nm, see text.

8/10/2019 olex thesis.pdf
http://slidepdf.com/reader/full/olex-thesispdf 69/114
Chapter 4
69
annealed blends (triangles) remarkably well in the whole range of studied
concentrations.
The measured relative quenching efficiency in PCBM and diCN-TIPS-Pn
containing blends can be described with a single diffusion coefficient indicating thatthe morphology of PCBM and diCN-TIPS-Pn containing blends are the same. It is
unlikely that both PCBM and diCN-TIPS-Pn form phase separate domains of the
same size because these acceptor molecules have very different chemical structure
and thus different intermolecular interactions. Therefore we conclude that both
PCBM and diCN-TIPS-Pn indeed form an intimate mixture with C6PT2-DPP in the
annealed films and show that we correctly assumed the blend morphology when
modeling the PL decays. Thus the extracted value of 2.5×10⁻⁵ cm2/s is an accurate
exciton diffusion coefficient for the annealed films of C6PT2-DPP.
4.5 Discussion
Generally, enhanced intermolecular interactions such as in molecular crystals were
shown to result in longer exciton diffusion length than in the amorphous phases of
various materials.[9–14,16] Lunt et al. showed that the exciton diffusion length in
3,4,9,10-perylenetetracarboxylic dianhydride (PTCDA) increases from 6 to 20 nm
with increasing the grain size of molecular crystals in a poly-crystalline thin film.[40]
The exciton diffusion length in PTCDA appeared to be limited by defects at grain
boundaries, which showed efficient exciton quenching. Other studies show thatenhanced delocalization of excitons leads to higher probability of exciton dissociation
to non-emissive species such as free charges.[34–39] Consequently, PL decay time
becomes shorter upon exciton delocalization. In this case stronger intermolecular
interactions due to a higher degree of crystalline ordering[34] and/or higher local
density of the material[35–39] may limit the exciton diffusion length.
In our experiments we found that the exciton diffusion length in the annealed
polycrystalline films of C6PT2-DPP is much shorter than in the as-cast amorphous
material. Significant red shift of PL spectrum suggests that excitons are more
delocalized in the annealed films. Such delocalization may be responsible for thereduction of the PL decay time upon annealing[34–38] (Figure 4.3) leading to shorter
exciton diffusion length. Moreover, the measured exciton diffusion coefficient is
about five times smaller in the annealed films resulting in further decrease of the
exciton diffusion length.
It is important to note that in our model we considered the annealed
polycrystalline films as a continuous medium. In reality the boundaries of
polycrystalline domains may contribute to the exciton scattering and even
quenching.[40] Therefore the measured exciton diffusion coefficient in the annealed
films is the effective value within complex polycrystalline morphology. The exciton
8/10/2019 olex thesis.pdf
http://slidepdf.com/reader/full/olex-thesispdf 70/114
Effect of Thermal Annealing on Exciton Diffusion
70
diffusion coefficient within a single crystalline domain may be different, for instance
higher than the value reported here. Nevertheless our result is useful for modeling the
operation of bulk heterojunction solar cells.
Despite the fact that exciton diffusion length is relatively short in the annealedfilms of C6PT2-DPP, the power conversion efficiency of bulk heterojunction solar cells
based on this material and a C70 fullerene derivative is as high as 1.1%. [18] This
efficiency has been achieved upon annealing of the active layer, while as-cast devices
showed poorer performance (0.89%). Thus it appears that there is no a simple direct
correlation between the exciton diffusion length and the final performances of C6PT2-
DPP:PC70BM bulk heterojunction solar cell. Thermal annealing induces significant
improvements on the blend morphology and charge mobility in C6PT2-DPP films.[18]
These improvements presumably compensate the reduction of the exciton diffusion
length resulting in higher performance of the annealed devices.
Finally, the reduction of the exciton diffusion length upon annealing may be
compensated by the effect of exciton delocalization, which promotes generation of
free charges. Wang et al. showed that measured exciton diffusion length of 3.5 nm in
poly(3-hexylthiophene) (P3HT) cannot explain high performance of bulk
heterojunction solar cell based on that polymer.[44] Exciton delocalization in the range
of 4.8-9 nm is needed to describe the experimental data in Ref. [44].
4.6 Conclusions
We have accurately measured the exciton diffusion coefficients and diffusion lengths
of (1.1±0.1)×10-4 and (2.5±0.4)×10-5 cm2/s; 8.8±0.3 and 2.8±0.2 nm in as-cast and
annealed thin films of C6PT2-DPP. The exciton diffusion appears to be limited in the
annealed samples presumably due to the delocalization effects and exciton quenching
on the grain boundaries of the polycrystalline film. It appears that there is no a simple
direct correlation between the measured exciton diffusion length and the
performance of bulk heterojunction solar cells that are based on the studied material.
Thermal annealing leads to simultaneous increase of the solar cell performance and
decrease of the exciton diffusion length in C6PT2-DPP.
4.7 Methods
C6PT2-DPP was synthesized in group of Prof. Thuc-Quyen Nguyen, diCN-TIPS
pentacene was provided by Prof. John Anthony, PCBM was purchased from Solenne
BV. No additional purification steps have been applied to any of the materials used.
X-ray diffraction patterns were measured with a X’Pert Phillips Material Research
Diffractometer using Cu K α radiation with emission wavelength of λ = 1.54 Å. Thin
films were spin-coated from chloroform in a glove box under nitrogen atmosphere

8/10/2019 olex thesis.pdf
http://slidepdf.com/reader/full/olex-thesispdf 71/114
Chapter 4
71
and encapsulated with a clean glass prior to optical measurements. Thermal
annealing of the encapsulated films was performed on a hotplate at 80 ºC for 10
minutes. The thicknesses of all thin films were about 100 nm, as measured with
Dektak profilometer.
For photoluminescence measurements samples were excited at 380 nm with
frequency doubled 100 fs laser pulses of a Ti-sapphire laser. The cw-spectra were
collected with a Hamamatsu CCD detector. Time resolved photoluminescence was
measured with a Hamamatsu streak camera. PL decays of diCN-TIPS-Pn:C6PT2-DPP
blends where spectrally integrated from 620 to 660 nm in order to exclude emission
of diCN-TIPS-Pn that is centered at 730 nm. PL decays of PCBM:C6PT2-DPP were
integrated within the whole emission spectrum.
A density of 1.2 g/cm3 was estimated from the crystal structure of C6PT2-DPP and
was used to calculate the concentration of exciton quenching molecules. Thermalannealing may influence the material density due to molecular reorganization.
However, the resulting values of exciton diffusion length depend only weakly on the
material density. For example, for the annealed films the modeled exciton diffusion
length is changed only by approximately 0.2 nm per 0.1 g/cm3. The software for
Monte Carlo simulation relies on Mersenne-twister algorithm of pseudo random
number generation.[45,46]

8/10/2019 olex thesis.pdf
http://slidepdf.com/reader/full/olex-thesispdf 72/114
Effect of Thermal Annealing on Exciton Diffusion
72
4.8 References
[1] G. Yu, J. Gao, J. C. Hummelen, F. Wudl, A. J. Heeger, Science 1995, 270, 1789 -1791.[2] S. E. Shaheen, C. J. Brabec, N. S. Sariciftci, F. Padinger, T. Fromherz, J. C.
Hummelen, Appl. Phys. Lett. 2001, 78, 841-843.[3] V. D. Mihailetchi, H. X. Xie, B. de Boer, L. J. A. Koster, P. W. M. Blom, Adv.
Funct. Mater. 2006, 16, 699-708.[4] M. Reyes-Reyes, K. Kim, D. L. Carroll, Appl. Phys. Lett. 2005, 87 , 083506.[5] X. Yang, J. Loos, S. C. Veenstra, W. J. H. Verhees, M. M. Wienk, J. M. Kroon, M.
A. J. Michels, R. A. J. Janssen, Nano Lett. 2005, 5 , 579-583.[6] M. Morana, H. Azimi, G. Dennler, H.-J. Egelhaaf, M. Scharber, K. Forberich, J.
Hauch, R. Gaudiana, D. Waller, Z. Zhu, K. Hingerl, S. S. van Bavel, J. Loos, C. J.
Brabec, Adv. Funct. Mater. 2010, 20, 1180-1188.[7] B. Walker, A. B. Tamayo, X.-D. Dang, P. Zalar, J. H. Seo, A. Garcia, M.Tantiwiwat, T.-Q. Nguyen, Adv. Funct. Mater. 2009, 19, 3063-3069.
[8] P. Peumans, A. Yakimov, S. R. Forrest, J. Appl. Phys. 2003, 93, 3693-3723.[9] S.-B. Rim, R. F. Fink, J. C. Scho neboom, P. Erk, P. Peumans, Appl. Phys. Lett.
2007, 91, 173504.[10] L. D. A. Siebbeles, A. Huijser, T. J. Savenije, J. Mater. Chem. 2009, 19, 6067.[11] Y. Terao, H. Sasabe, C. Adachi, Appl. Phys. Lett. 2007, 90, 103515.[12] H. Marciniak, X.-Q. Li, F. Wu rthner, S. Lochbrunner, J. Phys. Chem. A 2011,
115 , 648-654.[13] V. Bulovic, S. R. Forrest, Chem. Phys. Lett. 1995, 238, 88-92.
[14] J. E. Kroeze, R. B. M. Koehorst, T. J. Savenije, Adv. Funct. Mater. 2004, 14,992-998.
[15] H. Najafov, B. Lee, Q. Zhou, L. C. Feldman, V. Podzorov, Nat. Mater. 2010, 9,938-943.
[16] G. Wei, R. R. Lunt, K. Sun, S. Wang, M. E. Thompson, S. R. Forrest, Nano Lett. 2010, 10, 3555-3559.
[17] A. B. Tamayo, B. Walker, T.-Q. Nguyen, J. Phys. Chem. C 2008, 112, 11545-11551.
[18] J. Lin, C. Kim, A. B. Tamayo, T.-Q. Nguyen, in preparation 2011.[19] B. Walker, C. Kim, T.-Q. Nguyen, Chem. Mater. 2011, 23, 470-482.[20] B. Walker, A. Tamayo, D. T. Duong, X. Dang, C. Kim, J. Granstrom, T. Nguyen,
Adv. Energy Mater. 2011, 1, 221-229.[21] A. B. Tamayo, M. Tantiwiwat, B. Walker, T.-Q. Nguyen, J. Phys. Chem. C 2008,
112, 15543-15552.[22] A. B. Tamayo, X.-D. Dang, B. Walker, J. Seo, T. Kent, T.-Q. Nguyen, Appl. Phys.
Lett. 2009, 94, 103301.[23] C. Kim, J. Sherman, A. Tamayo, B. Walker, S. Parkin, G. Wu, T.-Q. Nguyen,
submitted to Chem. Mater. 2011.[24] B. P. Rand, J. Genoe, P. Heremans, J. Poortmans, Prog. Photovoltaics Res.
Appl. 2007, 15 , 659-676.[25] M. T. Lloyd, J. E. Anthony, G. G. Malliaras, Mater. Today 2007, 10, 34-41.
[26] Y. Sun, G. C. Welch, W. L. Leong, C. J. Takacs, G. C. Bazan, A. J. Heeger, Nat. Mater. 2011.

8/10/2019 olex thesis.pdf
http://slidepdf.com/reader/full/olex-thesispdf 73/114
Chapter 4
73
[27] N. M. Kronenberg, V. Steinmann, H. Bürckstümmer, J. Hwang, D. Hertel, F. Würthner, K. Meerholz, Adv. Mater. 2010, 22, 4193-4197.
[28] R. Fitzner, E. Reinold, A. Mishra, E. Mena‐Osteritz, H. Ziehlke, C. Körner, K.Leo, M. Riede, M. Weil, O. Tsaryova, A. Weiß, C. Uhrich, M. Pfeiffer, P. Bäuerle, Adv. Funct. Mater. 2011, 21, 897-910.
[29] G. Wei, S. Wang, K. Sun, M. E. Thompson, S. R. Forrest, Adv. Energy Mater. 2011, 1, 184-187.
[30] Y. Liu, X. Wan, F. Wang, J. Zhou, G. Long, J. Tian, Y. Chen, Adv. Mater. 2011,DOI 10.1002/adma.201102790.
[31] M. Hirade, C. Adachi, Appl. Phys. Lett. 2011, 99, 153302.[32] Y. Liu, X. Wan, F. Wang, J. Zhou, G. Long, J. Tian, J. You, Y. Yang, Y. Chen, Adv.
Energy Mater. 2011, 1, 771-775.[33] M. A. Green, K. Emery, Y. Hishikawa, W. Warta, Prog. Photovolt: Res. Appl.
2011, 19, 84-92.[34] A. Ruini, M. J. Caldas, G. Bussi, E. Molinari, Phys. Rev. Lett. 2002, 88, 206403.
[35] M. A. Loi, A. Mura, G. Bongiovanni, Q. Cai, C. Martin, H. R. Chandrasekhar, M.Chandrasekhar, W. Graupner, F. Garnier, Phys. Rev. Lett. 2001, 86, 732.[36] R. K. Tikhoplav, B. C. Hess, Synth. Met. 1999, 101, 236-237.[37] T.-Q. Nguyen, B. J. Schwartz, R. D. Schaller, J. C. Johnson, L. F. Lee, L. H.
Haber, R. J. Saykally, J. Phys. Chem. B 2001, 105 , 5153-5160.[38] B. C. Hess, G. S. Kanner, Z. Vardeny, Phys. Rev. B 1993, 47 , 1407.[39] O. V. Mikhnenko, F. Cordella, A. B. Sieval, J. C. Hummelen, P. W. M. Blom, M.
A. Loi, J. Phys. Chem. B 2009, 113, 9104-9109.[40] R. R. Lunt, J. B. Benziger, S. R. Forrest, Adv. Mater. 2010, 22, 1233-1236.[41] M. T. Rispens, A. Meetsma, R. Rittberger, C. J. Brabec, N. S. Sariciftci, J. C.
Hummelen, Chem. Commun. 2003, 2116.
[42] D. E. Markov, J. C. Hummelen, P. W. M. Blom, A. B. Sieval, Phys. Rev. B 2005,72, 045216-5.
[43] Y.-F. Lim, Y. Shu, S. R. Parkin, J. E. Anthony, G. G. Malliaras, J. Mater. Chem. 2009, 19, 3049.
[44] H. Wang, H.-Y. Wang, B.-R. Gao, L. Wang, Z.-Y. Yang, X.-B. Du, Q.-D. Chen, J.-F. Song, H.-B. Sun, Nanoscale 2011, 3, 2280.
[45] M. Matsumoto, T. Nishimura, ACM Trans. Model. Comput. Simul. 1998, 8, 3–30.
[46] “Pseudo random number generators,” can be found underhttp://www.agner.org/random/, n.d.

8/10/2019 olex thesis.pdf
http://slidepdf.com/reader/full/olex-thesispdf 74/114

8/10/2019 olex thesis.pdf
http://slidepdf.com/reader/full/olex-thesispdf 75/114
75
Chapter 5
Sensitive Triplet ExcitonDetection
We developed a sensitive spectroscopic method to probe triplet concentration in thin
films of polyfluorene (PF) at room temperature. The energy of photoexcited triplet
excitons is transferred to the guest metal-organic complex, meso-tetratolylporphyrin-
Pd (PdTPP), and detected as phosphorescent emission. The phosphorescence
intensity of PdTPP-PF blends is proportional to the independently measured triplet
concentration using photoinduced absorption experiments. The high sensitivity of
this method allows room temperature detection of triplet excitons in spin-coated
polymer films as thin as 10 nm. We found that the triplet lifetime is independent on
PdTPP concentration and therefore this method is nearly non-perturbing for the
triplet population.*
*O. V. Mikhnenko, P. W. M. Blom, M. A. Loi,
Phys. Chem. Chem. Phys. 2011, 13, 14453-14456

8/10/2019 olex thesis.pdf
http://slidepdf.com/reader/full/olex-thesispdf 76/114
Sensitive Triplet Exciton Detection
76
5.1 Introduction
To design highly efficient optoelectronic devices, a thorough understanding of the
physics of triplet excitons in organic semiconductors is required. According to spinstatistics, 75% of all electron-hole pairs form triplet excitons in an organic light
emitting diode (OLED). Since organic materials consist of rather light atoms with
weak spin-orbit interactions, the radiative transitions of triplets – phosphorescence –
is usually inefficient. To extract the energy of triplet excitons as light output, the
triplets should be manipulated toward phosphorescent emitting systems[1–4] or
extracted as delayed fluorescence.[5] Recently, it been pointed out that also in solar
cells the transformation of singlet to triplet excitons can significantly enhance the
power conversion efficiency [6–9] Furthermore, the reverse to triplet-triplet
annihilation process, singlet fission, shows great potential for further optimization of
solar cells.[10,11] The physical processes that influence the device performances
include diffusion, triplet-triplet annihilation, singlet fission, and triplet-polaron
interactions. Experimental approaches to study these processes relay on the detection
of triplet excitons. In particular, it is very important to detect triplet excitons at low
densities, below the triplet-triplet annihilation threshold, to access the intrinsic
properties of triplets such as triplet exciton diffusion.
However, detection of low triplet concentrations is very challenging at room
temperature in ultrathin films using the conventional methods such as
phosphorescence spectroscopy or photoinduced absorption. At room temperature
triplet lifetime is usually one order of magnitude shorter than at liquid nitrogen
temperatures.[1,12–15] Consequently both phosphorescence and photoinduced
absorption signals are difficult to detect. Furthermore, the phosphorescence intensity
and absorption of the triplet excited state are proportional to the film thickness.
Generally, if the sample thickness is of the order of 100 nm, which is a typical active
layer thickness for OLEDs and organic solar cells, the application of these methods at
room temperature requires high laser intensities and high triplet densities, usually
well above the triplet-triplet annihilation threshold. Thus it is important to develop
alternative sensitive methods to detect low concentrations of triplet excitons in device
configurations.
Doping organic semiconductors with metal-organic complexes can allow the
phosphorescent detection of the triplet excitons. A triplet that is initially generated in
the organic semiconductor can be transferred to the dopant complex.[16–21] Owing to
high atomic number of the metal, such as Palladium, Iridium etc., the spin-orbit
coupling of the complex is relatively large enabling the efficient radiative
recombination of the transferred triplet exciton. However, the triplet harvesting by
metal-organic complexes is capable to strongly perturb[22] the triplet population of
the host material and influence processes such as triplet-triplet annihilation.[3]

8/10/2019 olex thesis.pdf
http://slidepdf.com/reader/full/olex-thesispdf 77/114
Chapter 5
77
Here we present a nearly non-perturbing sensitive detection of low triplet
densities in ultrathin films of a conjugated polymer at room temperature. We have
chosen poly(9,9-di-n-octylfluorene) (PFO) as a model polymer with high potential for
applications in optoelectronic devices such as light emitting diodes and lasers.[23] We
show that the Palladium-coordinated porphyrin, meso-tetratolylporphyrin-Pd
(PdTPP), can be used as non-perturbing phosphorescent sensor of triplet excitons in
PFO. This porphyrin molecule is photochemically stable, has sharp absorption bands,
long phosphorescence decay time and appropriate energy level alignment with PFO.
5.2 Increase of Phosphorescence Intensity
Figure 5.1 shows the photoluminescence/phosphorescence spectrum of PdTPP film
deposited by vacuum sublimation on top of a spin-coated layer of PMMA. The PdTPP
thickness was controlled by the quartz thickness monitor during the sublimation and was set to 1 nm. The PMMA is a wide band gap material and plays the role of an inert
flat substrate. The excitation wavelength of 466 nm was detuned from the absorption
maxima of PdTPP. Three weak peaks at 620 nm, 670 nm and 700 nm are resolved in
the emission spectrum of PdTPP. Only the peak at 700 nm is attributed to
phosphorescence with a decay time of the order of a millisecond; the other peaks
appear to be the prompt photoluminescence of PdTPP. It is important to note that the
intensity of phosphorescent emission was as weak as that of photoluminescence also
when PdTPP was deposited on clean quartz substrates regardless of the film
thickness, which was varied in a wide range up to 1 µm.
Figure 5.1: Absorption spectra of PFO (dotted) and PdTPP (dashed). Photoluminescence
spectra of two layer heterostructures PFO-PdTPP and PMMA-PdTPP are plotted as solid
lines. The excitation wavelength at 466 nm is marked with the arrow.

8/10/2019 olex thesis.pdf
http://slidepdf.com/reader/full/olex-thesispdf 78/114
Sensitive Triplet Exciton Detection
78
The PL spectrum of PdTPP film, sublimed under the same conditions on top of a
10 nm thick spin-coated PFO film, is also plotted in Figure 5.1. Remarkably, the
phosphorescent intensity of the PdTPP layer is one order of magnitude higher when
deposited on top of PFO as compared to PMMA-PdTPP heterostructure. The increase
in phosphorescent intensity indicates that PFO acts as an antenna to collect optical
excitations for PdTPP. Below we will show that the enhanced phosphorescence ofPdTPP is mainly due to optically generated triplet excitons in PFO layer that are
transferred to PdTPP.
5.3 Photoinduced Absorption
Figure 5.2 shows the photoinduced absorption spectrum of a 2.5 µm thick drop-
casted PFO film. The spectrum was acquired at room temperature and consists of a
distinct peak at ~1.45 eV with a shoulder on the higher energy side. The detected
feature is typical[12,24] for the T1-Tn transition in PFO and its intensity isproportional to the product of the sample thickness, the concentration and the
absorption cross-section of the triplet excited states.[1] The triplet exciton
concentration is proportional to their lifetime that is relatively short at room
temperature (0.1 µs), as compared with liquid nitrogen temperatures (1-7 µs,
Ref. [12]). Consequently thick PFO film and high laser excitation power (500
mW/mm2) are necessary to record the photoinduced absorption spectrum.
It is noteworthy that the laser excitation at 466 nm is able to generate triplet
excitons in ample concentration to have triplet-triplet annihilation in PFO. The
corresponding photon energy of 2.66 eV is just above is just above the triplet energy
Figure 5.2: Photoinduced absorption spectrum of PFO thin film.

8/10/2019 olex thesis.pdf
http://slidepdf.com/reader/full/olex-thesispdf 79/114
Chapter 5
79
of 2.3 eV.[1,13,25] On the other hand, the polymer’s optical gap is about 3-3.2 eV. The
mechanism of triplet exciton generation under such conditions can be understood
from considerations of the density of states (DOS). Due to the disordered nature of
the polymer, excitonic density of states is rather broad and can be described with a
Gaussian distribution. Singlet excitons can be generated at the low energy tail of the
DOS in our experiments. Those excitons can undergo intersystem crossing togenerate triplets.
Figure 5.3 illustrates the dependence of the T1-Tn transition peak intensity on
the incident power density. At low excitation densities the triplet peak increases
linearly with the incident laser power. Above ~100 mW/mm2 its intensity scales as
square root of the supplied power. On the log-log graph these two regimes appear as
branches with slopes 1 and 0.5, respectively.
The non-linear dependence of the triplet peak intensity on the incident power
density is determined by the triplet-triplet annihilation (TTA) phenomenon.[1,26–31]
The probability that two triplet excitons meet each other during their lifetime issignificant when their concentration is high. Once brought together two triplets (T* )
can undergo annihilation, which results in one singlet excited state ( S* ) and one
singlet ground state ( S ):
* * *T T S S + → + . (5.1)
The TTA process introduces an additional decay path for triplet excitons that is
responsible[14] for the slope of 0.5 on the log-log plot in Figure 5.3.
Figure 5.3: Dependence of the maximum of the T1-Tn transition on the incident power
density in PFO; sample was excited at 466 nm.

8/10/2019 olex thesis.pdf
http://slidepdf.com/reader/full/olex-thesispdf 80/114
Sensitive Triplet Exciton Detection
80
5.4 Dependence on Excitation Power
Figure 5.4 shows the dependences of the phosphorescent emission intensity of
PdTPP at 700 nm under different power excitation in various sample configurations.
All the data were first normalized to their maximum value and then displaced
vertically for clarity. The upper five curves correspond to drop-casted samples of
PdTPP blended with PFO in concentrations ranging from 0.05 wt% (top) to 60 wt%.
The two lowest curves with slope 0.9 correspond to PdTPP blended into PMMA
(pentagons) and PS (squares) with concentration of 0.03 wt% and 0.1 wt%,respectively.
PFO acts differently as host material for PdTPP in comparison to PMMA or PS. A
small amount of PdTPP blended into PMMA or PS reveals nearly linear dependence
of the phosphorescent intensity on the incident power in the whole studied power
range. On log-log scale these dependences appear with a slope of ~0.9 (Figure 5.4). In
contrast, similar concentrations of PdTPP blended with PFO show two distinct
regimes on the log-log plot, with slopes of 1 and 0.5 respectively. It is important to
note that the photoluminescence intensity of the PdTPP measured at 620 nm
Figure 5.4: The dependence of the phosphorescence intensity at 700 nm on the incident
power density of PdTPP blended in PFO with the following concentrations, from top to
bottom: 0.05 wt% (hexagons), 0.5 wt% (diamonds), 5 wt% (triangles), 25 wt% (triangles)
and 60 wt% (circles). Laser excitation was at 466 nm. The data were first normalized to
the value at the maximum incident power of 1000 mW/mm2 and then displaced vertically
for clarity. The two dependencies with slope 0.9 correspond to PdTPP imbedded in inert
matrix of PMMA (pentagons) and PS blend (squares).

8/10/2019 olex thesis.pdf
http://slidepdf.com/reader/full/olex-thesispdf 81/114
Chapter 5
81
depends linearly on the incident power density in each blend, as does the PFO
emission above 550 nm in the PdTPP-PFO sample (not shown here).
The comparison of Figures 5.3 and 5.4 reveals that the phosphorescence
intensity of PdTPP-PFO blends is proportional to the intensity of the independentlymeasured triplet T1-Tn PIA band, which is proportional to the triplet concentration.
In this way we demonstrate that PdTPP acts as a sensor of triplet excitons in PFO.
The non-linearity of the phosphorescence intensity at high incident power densities is
then governed by the triplet-triplet annihilation process within the PFO matrix.
Triplet energy transfer is possible from PFO to PdTPP since the triplet level of PdTPP
(1.8 eV) is below that of PFO (2.3 eV), the back transfer is energetically unfavorable.
5.5 Discussion
To understand the impact of the PdTPP guest molecules on the triplet lifetime of PFO,
blends of various PdTPP concentrations have been examined. Samples with PdTPP
concentration of 25 wt% and lower show identical non-linearity at high excitation
powers, which is represented by the slope of 0.5 on the log-log scale (Figure 5.4). Only
the sample with concentration of 60 wt% deviates from the general trend and
resembles the dependency of the porphyrins in the inert matrix.
Figure 5.4 demonstrates that the threshold laser power at which the dependence
changes from linear to non-linear regime is identical in wide range of concentrations
from 0.05 to 25 wt%. This threshold power corresponds to the triplet density [ ]thT ,above which the TTA is efficient. Furthermore [ ]
thT is determined by the triplet
lifetime τ , see Eq. (1.10) and Ref. [1]:2[ ] 1
thT τ ∝ . (5.2)
[ ]thT is independent on the amount of PdTPP, consequently also is τ . Thus
doping PFO with PdTPP does not lead to the reduction of the triplet lifetime. In this
respect PdTPP does not perturb the triplet population in PFO. Our findings are in
agreement with studies reporting that the triplet lifetime in PFO is insensitive to the
presence of Pt-coordinated porphyrins, which have similar phosphorescence decay
time to PdTPP.[23,24]
The non-perturbing triplet detection can be further understood by comparing the
lifetimes of the excited states. The phosphorescence decay time of PdTPP is 0.9 ms, as
we measured in PFO matrix. The triplet lifetime of PFO is estimated from the
dependence of the intensity of the PIA band on the modulation frequency and fitted
with the equation
2
1/
1 (2 )T T
f πτ −∆ ∝
+
, (5.3)

8/10/2019 olex thesis.pdf
http://slidepdf.com/reader/full/olex-thesispdf 82/114
Sensitive Triplet Exciton Detection
82
where f is the chopper frequency and τ is the triplet lifetime. At room temperature
with excitation density of 500 mW/mm2 it is equal to ~0.1 ms, which is one order of
magnitude smaller than that of the phosphorescence decay time of PdTPP. Thus
under continuous wave excitation it takes at least 10 lifetimes/generations of triplets
in PFO between possible energy transfer events to a PdTPP molecule. Consequently
the triplet’s population is not perturbed by the presence of PdTPP.
Triplet excitons can be easily detected by PdTPP under experimental conditions
that are particularly challenging for photoinduced absorption measurements, namely
ultrathin films, room temperature and low excitation powers. The phosphorescence
spectrum of the PdTPP-PFO heterostructure in Figure 5.1, shows a strong emission at
700 nm, which we accordingly assign to detected triplets in the 10 nm thick PFO layer
under excitation of 50 mW/mm2, that is well below the triplet-triplet annihilation
threshold. Thus the proposed detection method is applicable to study triplet-triplet
annihilation and other diffusion related processes in configurations appealing for
practical applications.
5.6 Conclusions
In summary, we showed highly sensitive triplet detection in ultrathin films of
polyfluorene under low excitation densities and at room temperature. Under these
conditions conventional method of triplet exciton detection, photoinduced
absorption, is extremely challenging. Because the triplet lifetime in PFO is constantupon blending with PdTPP, the detection is nearly non-perturbing for the
continuously generated triplet population. The developed method can be applied to
study important processes for lightening and solar cells in organic semiconductors
such as triplet-triplet annihilation, fission of singlet excitons, and triplet diffusion.
5.7 Methods
Poly(9,9-di-n-octylfluorene) (PFO) was synthesized by the Netherlands Organization
for Applied Scientific Research (TNO); meso-tetratolylporphyrin-Pd (PdTPP) waspurchased from Porphyrin Systems; poly(methyl methacrylate) (PMMA) and
polystyrene (PS) were acquired from Aldrich. The materials have been used without
further purification. All sample fabrication steps including preparation of solutions,
filtering, drop-casting and spin-coating were done under nitrogen atmosphere in a
glove box. Drop-casting technique has been used to prepare PdTPP blends with PFO,
PMMA and PS as well as to prepare ~1-2 µm PFO film for photoinduced absorption
experiments. 10 nm films of PFO and PMMA have been spin-coated at 2000 rpm. The
sublimation of PdTPP was performed in high vacuum with pressure lower than 2×10⁻⁷
mbar, at a deposition rate of 0.04 Å/s. Samples for spectroscopic measurements were
8/10/2019 olex thesis.pdf
http://slidepdf.com/reader/full/olex-thesispdf 83/114
Chapter 5
83
mounted in an optical cryostat and kept under vacuum of 5×10⁻⁵ mbar. Absorption
spectra were measured by a Perkin-Elmer spectrometer under ambient conditions.
Polymer thickness was measured by Dektak profilometer and atomic force
microscope.
The set-up for photoinduced absorption (PIA) experiments consists of an Argon
laser operating at 466 nm, a Tungsten lamp, a monochromator and a low noise
Silicon photodetector. A mechanical chopper was used to modulate the pump laser.
The signal was further amplified using a phase sensitive detector. The dependence of
the triplet PIA band intensity on the modulation frequency was measured with a
Hamamatsu photomultiplier tube (PMT) loaded with a small resistance to ensure fast
response in the modulation range of 40-2000 Hz.
The photoluminescence/phosphorescence spectra were recorded by the PMT in
combination with a monochromator. As for PIA experiments the laser excitation at466 nm was modulated by a mechanical chopper and the signal was enhanced by a
lock-in amplifier. The phosphorescence decay time of PdTPP was measured with PMT
directly linked to a digital oscilloscope.
The laser power was controlled by a circular variable neutral density filter and a
power meter, which was connected with a computer to record the light intensity
directly during the measurements. Each power dependence measurement has been
swept from the highest to the lowest excitation power, followed by the back scan from
the lowest to the highest. The back scan did not show notable degradation of the
signal in all reported experiments. The incident power density was determined by
dividing the total laser intensity over the circular area of the Gaussian beam waist
radius. The beam waist was measured using pin holes of various sizes and found to be
about 55 µm for the used experimental set up.

8/10/2019 olex thesis.pdf
http://slidepdf.com/reader/full/olex-thesispdf 84/114
Sensitive Triplet Exciton Detection
84
5.8 References
[1] A. Köhler, H. Bässler, Mater. Sci. Eng., R 2009, 66, 71-109.[2] S. Reineke, F. Lindner, G. Schwartz, N. Seidler, K. Walzer, B. Lussem, K. Leo, Nature 2009, 459, 234-238.
[3] G. Schwartz, S. Reineke, T. C. Rosenow, K. Walzer, K. Higley, Adv. Funct. Mater. 2009, 19, 1319-1333.
[4] Y. Sun, N. C. Giebink, H. Kanno, B. Ma, M. E. Thompson, S. R. Forrest, Nature 2006, 440, 908-912.
[5] D. Y. Kondakov, T. D. Pawlik, T. K. Hatwar, J. P. Spindler, J. Appl. Phys. 2009,106, 124510-7.
[6] W. A. Luhman, R. J. Holmes, Appl. Phys. Lett. 2009, 94, 153304-3.[7] B. P. Rand, S. Schols, D. Cheyns, H. Gommans, C. Girotto, J. Genoe, P.
Heremans, J. Poortmans, Org. Electron. 2009, 10, 1015-1019.[8] S. T. Roberts, C. W. Schlenker, V. Barlier, R. E. McAnally, Y. Zhang, J. N.Mastron, M. E. Thompson, S. E. Bradforth, J. Phys. Chem. Lett. 2011, 2, 48-54.
[9] C.-L. Lee, I.-W. Hwang, C. C. Byeon, B. H. Kim, N. C. Greenham, Adv. Funct. Mater. 2010, 20, 2945-2950.
[10] J. C. Johnson, A. J. Nozik, J. Michl, J. Am. Chem. Soc. 2010, 132, 16302-16303.[11] A. Rao, M. W. B. Wilson, J. M. Hodgkiss, S. Albert-Seifried, H. Ba ssler, R. H.
Friend, J. Am. Chem. Soc. 2010, 132, 12698-12703.[12] A. J. Cadby, P. A. Lane, H. Mellor, S. J. Martin, M. Grell, C. Giebeler, D. D. C.
Bradley, M. Wohlgenannt, C. An, Z. V. Vardeny, Phys. Rev. B 2000, 62, 15604.[13] C. Rothe, A. P. Monkman, Phys. Rev. B 2003, 68, 075208.
[14] V. Jankus, C. Winscom, A. P. Monkman, J. Phys.: Condens. Matter 2010, 22,185802.
[15] R. Österbacka, M. Wohlgenannt, D. Chinn, Z. V. Vardeny, Phys. Rev. B 1999,60, R11253.
[16] V. Cleave, G. Yahioglu, P. L. Barny, R. H. Friend, N. Tessler, Adv. Mater. 1999,11, 285-288.
[17] V. Cleave, G. Yahioglu, P. Le Barny, D. H. Hwang, A. B. Holmes, R. H. Friend, N.Tessler, Adv. Mater. 2001, 13, 44-47.
[18] N. C. Giebink, Y. Sun, S. R. Forrest, Org. Electron. 2006, 7 , 375-386.[19] D. L. Dexter, J. Chem. Phys. 1953, 21, 836.[20] N. Tian, Y. V. Aulin, D. Lenkeit, S. Pelz, O. V. Mikhnenko, P. W. M. Blom, M. A.
Loi, E. Holder, Dalton Trans. 2010, 39, 8613.[21] J. Gao, H. You, J. Fang, D. Ma, L. Wang, X. Jing, F. Wang, Synth. Met. 2005,
155 , 168-171.[22] J. Kalinowski, W. Stampor, M. Cocchi, D. Virgili, V. Fattori, P. Di Marco, Chem.
Phys. 2004, 297 , 39-48.[23] S. A. Chen, H. H. Lu, C. W. Huang, Adv. Polym. Sci. 2008, 212, 49–84.[24] A. Monkman, C. Rothe, S. King, F. Dias, in Polyfluorenes, Springer Berlin /
Heidelberg, 2008, pp. 187-225.[25] A. P. Monkman, H. D. Burrows, L. J. Hartwell, L. E. Horsburgh, I. Hamblett, S.
Navaratnam, Phys. Rev. Lett. 2001, 86, 1358.
[26] C. E. Swenberg, J. Chem. Phys. 1969, 51, 1753.

8/10/2019 olex thesis.pdf
http://slidepdf.com/reader/full/olex-thesispdf 85/114
Chapter 5
85
[27] R. G. Kepler, J. C. Caris, P. Avakian, E. Abramson, Phys. Rev. Lett. 1963, 10,400-402.
[28] A. Suna, Phys. Rev. B 1970, 1, 1716-1739.[29] V. Dyakonov, G. Rösler, M. Schwoerer, E. L. Frankevich, Phys. Rev. B 1997, 56,
3852-3862.[30] J. Partee, E. L. Frankevich, B. Uhlhorn, J. Shinar, Y. Ding, T. J. Barton, Phys. Rev. Lett. 1999, 82, 3673-3676.
[31] R. E. Merrifield, Pure Appl. Chem. 1971, 27 , 481-498.

8/10/2019 olex thesis.pdf
http://slidepdf.com/reader/full/olex-thesispdf 86/114

8/10/2019 olex thesis.pdf
http://slidepdf.com/reader/full/olex-thesispdf 87/114
87
Chapter 6
Direct Measurement of the
Triplet Exciton Diffusion Length
We present a new method to measure the triplet exciton diffusion length in organic
semiconductors. N,N′-di-[(1-naphthyl)-N,N′-diphenyl]-1,1′-biphenyl)-4,4′-diamine
(NPD) has been used as a model system. Triplet excitons are injected into a thin filmof NPD by a phosphorescent thin film, which is optically excited and forms a sharp
interface with the NPD layer. The penetration profile of the triplet excitons density is
recorded by measuring the emission intensity of another phosphorescent material
(detector), which is doped into the NPD film at variable distances from the injecting
interface. From the obtained triplet penetration profile we extracted a triplet exciton
diffusion length of 87±2.7 nm. For excitation power densities >1 mW/mm2 triplet-
triplet annihilation processes can significantly limit the triplet penetration depth into
organic semiconductor.*
*O.V. Mikhnenko, R. Ruiter, P.W.M. Blom, M. A. Loi,submitted for publication

8/10/2019 olex thesis.pdf
http://slidepdf.com/reader/full/olex-thesispdf 88/114
Direct Measurement of the Triplet Exciton Diffusion Length
88
6.1 Introduction
Both singlet and triplet excitons undergo incoherent hopping that can be described in
terms of diffusion. Singlet exciton diffusion is due to electromagnetic dipole-dipoleinteractions according to Förster theory.[1] The hopping of triplet excitons between
organic molecules requires spatial overlap of the molecular orbitals since the actual
exchange of electrons is needed. The theory describing this process was formalized by
Dexter.[2] Due to the long triplet lifetime, the average triplet diffusion distance is
expected to be longer than that of singlet excitons. In organic solar cells long diffusion
distances are beneficial to reach the interface where excitons dissociate into free
charges that can be extracted as photocurrent.[3–13] For efficient LEDs short singlet
and long triplet diffusion lengths are needed to enable selective harvesting of triplet
excitons by phosphorescent dopants at certain distance from the electron-hole
recombination region.[14–19] Thus, it is important to measure and control the exciton
diffusion length in order to design efficient optoelectronic devices.
In many organic semiconductors the singlet exciton diffusion length is of the
order of 10 nm,[20–23] while the triplet diffusion length has been reported in a wide
range from 10 to 5000 nm.[7,9,11,12,23–39] The triplet diffusion length can be
measured in a multilayer LED, in which electron-hole recombination is spatially
confined within an interfacial region of a few nanometers thickness. Triplets are then
detected at a variable distance from this electron-hole recombination region using a
phosphorescent dopant. With this method triplet diffusion lengths varying in between
10 to 140 nm are obtained in common organic semiconductors.[24–30] Triplet-
polaron interactions are neglected in the modeling and it is difficult to evaluate the
effect of triplet-triplet annihilation on the resulting values.[19] Other methods include
photocurrent modeling,[8,9,31] remote triplet detection in bi-layer structures,[32,33]
variation of exciton profile due to the light penetration depth,[23,34] triplet
quenching,[35] etc. In all these methods the effect of triplet-triplet annihilation is
often neglected.
Even for the same materials quite different triplet diffusion lengths have been
published. For instance, in N,N ′-di-[(1-naphthyl)-N,N ′-diphenyl]-1,1′-biphenyl)-4,4′-
diamine (NPD) values of 12 and 87 nm have been measured (Ref. [9] and this paper);
in N,N ′-di-1-naphthalenyl-N,N ′-diphenyl-[1,1′:4′,1″:4″,1‴ -quaterphenyl]-4,4‴ -diamine
(4P-NPD) of 11 and 54 nm (Ref. [25] and [27]); in 4,4′-bis(N-carbazolyl)biphenyl
(CBP) of 16, 25 and 250 nm (Ref [26], [32] and [31]). Thus the large spread of values
for the triplet exciton diffusion length can not only be justified with the different
nature of the molecules studied but also with the different measurement technique
employed.
Here we developed a new direct method to accurately measure triplet exciton
diffusion lengths in organic semiconductors. Triplets are injected into an organic thin
film by a phosphorescent material, which is excited by a laser. Triplets are detected as

8/10/2019 olex thesis.pdf
http://slidepdf.com/reader/full/olex-thesispdf 89/114
Chapter 6
89
emission from a phosphorescent dopant-detector that is implemented into the
organic film at variable distance from the triplet injecting interface. In this way the
triplet penetration profile into the thin film of organic semiconductor is recorded anddata are modeled using a 1D diffusion equation. Modeling of the experimental data
yields a triplet diffusion length of 86.8±2.7 nm for the prototypical semiconductor
NPD. Furthermore, we demonstrate that triplet-triplet annihilation can significantly
reduce the triplet penetration depth down to 24 nm and thus may be responsible for
the variations of the reported values of diffusion length in the literature.
6.2 Sample Structure
Figure 6.1 schematically illustrates the sample structure that we use to measure the
triplet exciton diffusion length. An NPD layer of variable thickness L is sandwiched
between small amounts of phosphorescent molecules FIrPic and PdTPP; for full
names and chemical structures we refer to Figure 6.2. This 3 layer heterostructure is
placed on top of a 50 nm NPD layer that was deposited on a quartz substrate.
Accordingly, the NPD-substrate interface does not influence the triplet population in
the vicinity of the PdTPP layer. Both phosphorescent materials are sublimed by
setting the thickness to 0.4 nm in the vacuum deposition system. The top layer of
FIrPic was applied to only half of the sample area using a shadow mask. We will refer
Figure 6.1: Sample structure for triplet exciton diffusion length measurements.
Figure 6.2: Chemical structures of Iridium(III)bis(2-(4,6-difluorephenyl)pyridinato-
N,C2) (FIrPic), N,N′-di-[(1-naphthyl)-N,N′-diphenyl]-1,1′-biphenyl)-4,4′-diamine
(NPD), and meso-tetratolylporphyrin-Pd (PdTPP).

8/10/2019 olex thesis.pdf
http://slidepdf.com/reader/full/olex-thesispdf 90/114
Direct Measurement of the Triplet Exciton Diffusion Length
90
Figure 6.3: (a) Atomic force microgram of surface of neat NPD film. (b) 0.4 nm layer of
FIrPic deposited on top of NPD.
to the two halves of a sample as “ FIrPic” and “ Reference” sides, indicating whether
that side has the FIrPic layer or not.
Figure 6.3a shows topography and phase images of NPD that where acquired
by an atomic force microscope operating in the tapping mode. Figure 6.3b shows the
surface of the 0.4 nm layer of FIrPic deposited on top of the NPD layer. These images
demonstrate that deposited FIrPic does not form a closed layer, but instead smallislands of ~1 nm in height and about few tens of nanometers wide. It is important to
note that the 0.4 nm thick layer of PdTPP has identical morphology when deposited
on NPD.
Figure 6.4 shows the triplet energy levels of FIrPic (Ref. [40]), NPD (Ref. [27])
and PdTPP (deduced from the phosphoresce spectrum). The triplet energy level of
NPD is in between that of FIrPic and PdTPP. Therefore it is energetically favorable
that triplet excitons get transferred from FIrPic to NPD and subsequently from NPD
to PdTPP. As a result optically excited triplets in the FIrPic can be injected into the
NPD layer with thickness L , followed by their diffusion through this layer toward the

8/10/2019 olex thesis.pdf
http://slidepdf.com/reader/full/olex-thesispdf 91/114
Chapter 6
91
Figure 6.4: Energy levels of triplet excited states.
Figure 6.5: (a) Solid lines are photoluminescence spectra of Reference and FIrPic sides
of a typical sample used for triplet exciton diffusion measurements. The arithmetical
difference between these spectra is also presented. (b) Typical dependence of the
phosphorescence emission of PdTPP (detected at 700 nm) depending on the sample
spatial position. The average intensities of 0 I and 1 I correspond to the Reference and
FIrPic sides of the sample, respectively.
PdTPP layer, where they are transferred to PdTPP leading to phosphorescent
emission.
6.3 Injection of Triplet Excitons
The PL spectra of the Reference and FIrPic sides of a typical sample are presented in
Figure 6.5a. Both spectra feature emission of PdTPP that is identified as
pronounced prompt photoluminescence at 620 nm and strong phosphorescence at
~700 and at ~800 nm. The emission at shorter wavelengths is associated with the
photoluminescence of NPD. The phosphorescence of the FIrPic layer is too weak to be
detected with these measurements. The phosphorescence emission at ~700 nm of the
FIrPic side appears to be considerably stronger than that of the Reference side of the

8/10/2019 olex thesis.pdf
http://slidepdf.com/reader/full/olex-thesispdf 92/114
Direct Measurement of the Triplet Exciton Diffusion Length
92
sample. The arithmetical difference between these spectra reveals a peak at ~700 nm.
The noisy signal at above 750 nm is due to the limitation of the sensitivity range of the
photomultiplier tube.
The phosphorescence intensity measured at 700 nm of the Reference and FIrPic
sides of a typical sample is shown in Figure 6.5b. This spatially resolved data were
recorded by scanning through the sample in the direction that is normal to the FIrPic
– no FIrPic boundary. The average intensities of 0 I and 1 I correspond to the
Reference and FIrPic sides of the sample, respectively. The constancy of this signal
demonstrates the homogeneity of the sample. Generally the light outcoupling
efficiency of PdTPP emission depends on the NPD layer thickness L . Therefore in
order to compare different samples it is convenient to consider the normalized
intensity variation:
1 0
0
I I
i I
−
∆ = . (6.1)
Figure 6.6 shows the dependence of i∆ on the NPD thickness L . At an excitation
power density of 1 mW/mm2 i∆ shows a monoexponential decrease with NPD
thickness, while at higher excitation densities the dependence is more complex.
We attribute the increase of the emission intensity i∆ to the triplet excitons,
which are injected into NPD by FIrPic, diffuse through the layer of thickness L , and
are then detected by PdTPP. This increase of intensity cannot be due to the emission
of FIrPic, because the two spectra are energetically well separated. Moreover, the
small amount of applied FIrPic molecules cannot significantly modify the light
Figure 6.6: Normalized variation of the phosphorescence intensity at 700 nm ( i∆ ) vs.
NPD layer thickness L . Samples were excited at 466 nm; various excitation power
densities are presented. The dashed lines serve as guides to the eye; the solid line is a fit
with equation (6.4).

8/10/2019 olex thesis.pdf
http://slidepdf.com/reader/full/olex-thesispdf 93/114
Chapter 6
93
outcoupling efficiency or optical interference effects because the refractive indices of
NPD and FIrPic are similar and FIrPic form islands of few nanometers that are much
smaller than the emission wavelength. Additionally the intensity increase at 700 nm
depends on the NPD thickness L
that is consistent with the diffusion of triplet
excitons through the NPD layer.
6.4 Detection of Triplet Excitons
In order to accurately model the process of triplet diffusion in our samples it is
important to understand how PdTPP molecules influence the triplet density. In the
previous chapter we have studied in detail the detection of triplet excitons using
PdTPP as phosphorescent dopant in a material with a band gap similar to NPD. [41]
According to the energy gap law, materials of similar band gaps are expected to have asimilar triplet lifetime, which is about 0.1 ms for compounds such as NPD at room
temperature.[41–44] The phosphorescence decay time of PdTPP is 0.9 ms (Ref. [41]),
thus it takes at least 10 generations of triplet excitons between possible energy
transfer events to a PdTPP molecule under continuous wave excitation. Therefore we
and others[45,46] did not detect reduction of triplet lifetime in the host material when
doping with PdTPP and similar metal-coordinated porphyrins. Moreover, in our
samples PdTPP does not even form a closed layer ensuring a minimal impact on the
triplet population in NPD. In this respect PdTPP can be regarded as triplet detector
that does not perturb the density of triplet excitons in the material under
investigation.
Because PdTPP behaves as a non-perturbing triplet detector, triplet-triplet
annihilation (TTA) can be observed by detecting the phosphorescence of PdTPP. TTA
is the bimolecular recombination of two triplet excitons ( 1T ) that yields singlet
ground ( 0S ) and singlet excited ( 1S ) states:
1 1 0 1T T S S + → + . (6.2)
The efficiency of TTA is only significant if the probability that two triplet excitons
meet each other during their lifetime is high. This probability becomes considerable
when the triplet density overcomes a certain value. Since the TTA introduces anadditional decay path for triplets, their density scales as square root of the generation
rate at high excitation powers; while at low triplet generation rates the TTA is
inefficient and the scaling is linear.[14,47–52]
Figure 6.7 shows the dependence of the PdTPP phosphorescence emission
intensity on the excitation power density (circles). In this case the 0.4 nm PdTPP
layer was sandwiched between two 50 nm thick layers of NPD. The dependence
shows slopes of 1 and 0.54 on the log-log scale at low and high excitation densities,
respectively. In contrast, the prompt photoluminescence of NPD scales linearly within
the whole studied range of the excitation densities (triangles). As a further check we

8/10/2019 olex thesis.pdf
http://slidepdf.com/reader/full/olex-thesispdf 94/114
Direct Measurement of the Triplet Exciton Diffusion Length
94
measured the phosphorescence emission of PdTPP molecules in the inert matrix of
polystyrene and also this sample shows a nearly linear dependence on the excitation
power (squares in Figure 6.7). Thus the sublinear growth with the scaling exponent of
0.54 measured at high excitation power is specific to the PdTPP-NPD heterojunction.
In our previous work we associated such square root dependence to the detection[41]
of triplet excitons under TTA conditions. Consequently the phosphorescence emission
of PdTPP is mainly determined by the triplet excitons, which were created via
intersystem crossing in NPD layers and transferred to PdTPP.
6.5 Modeling the Triplet Penetration Profile
At the excitation power density of 1 mW/mm2 the phosphorescence intensity at 700
nm is in the linear regime (Figure 6.7). Thus the TTA process is not efficient at this
excitation power and diffusion of triplets that are injected by FIrPic can be modeled by a linear differential equation. Due to the sample symmetry, the density n of
injected triplet excitons depends only on one spatial coordinate L that is the distance
from the FIrPic-NPD interface:2
2
n n n D
t L τ
∂ ∂= −
∂ ∂, (6.3)
where n i∝ ∆ , D is the diffusion coefficient, and τ is the triplet lifetime. A
continuous wave laser excitation can be described as a constant triplet generation rate
G at the FIrPic-NPD interface (0, )n t G= . Then the thickness profile of the triplet
Figure 6.7: The dependence of the emission intensity on the incident power density in a
NPD-PdTPP-NPD heterostructure at 700 nm (circles) and at 550 nm (triangles); in
PdTPP-polystyrene blend at 700 nm (squares). Laser excitation was at 466 nm.

8/10/2019 olex thesis.pdf
http://slidepdf.com/reader/full/olex-thesispdf 95/114
Chapter 6
95
penetration into NPD layer is the steady state solution of equation (6.3) and can be
easily found by setting / 0n t ∂ ∂ = :/
( ) e D L Ln L G
−= , (6.4)
where D L Dτ = is the exciton diffusion length – the only fitting parameter. The
solid line in Figure 6.6 is the fitting with Equation (6.4) that yields to the exciton
diffusion length of 86.8±2.7 nm; the error is the standard error of the fitting
parameter. The triplet exciton diffusion coefficient D can be estimated by setting
0.1τ = ms resulting in the value of 7.5×10⁻⁷ cm2/s.
6.6 Discussion
Under intense laser excitation TTA becomes significant (see Figure 6.7) and theprofile of triplet penetration cannot be described with equation (6.4). In order to
compare the different profiles in Figure 6.6 we define the penetration depth λ as the
distance from the FIrPic-NPD interface at which the concentration of injected triplets
is attenuated by a value of 1e− . λ systematically decreases from 87 nm to 67; 39 and
24 nm when the excitation power densities is increased from 1 mW/mm2 to 10; 100
and 1000 mW/mm2 in accordance with TTA.[32] Thus it is important to make sure
that TTA is absent or it is taken into account in the measurement of triplet exciton
diffusion length, because the penetration length λ can be mistakenly interpreted as
the diffusion length D
L . Presumably, this may be the reason of the large spread in
D L values that were reported in the literature for the same materials; in those
experiments the effect of TTA was usually neglected.[9,25–27,31]
The proposed sample structure with distinct triplet injector and detector layers
can be further developed to explore the spin degree of freedom of triplet excitons. In
particular the influence of the magnetic field on the triplet diffusion length and
triplet-triplet annihilation can be observed. The magnetic field may significantly
decrease the efficiency of the triplet-triplet annihilation and consequently increase
the triplet penetration depth at high excitation densities. New types of devices may
emerge by using the spins of triplet excitons.
6.7 Conclusions
We presented a new direct method to accurately measure triplet exciton diffusion
lengths in organic semiconductors. A triplet exciton diffusion length of 86.8±2.7 nm
was extracted for NPD. Our method can be applied to a wide selection of materials
that are relevant for applications as OLEDs and solar cells. We have also shown that
process of triplet-triplet annihilation can significantly reduce the penetration depth of
8/10/2019 olex thesis.pdf
http://slidepdf.com/reader/full/olex-thesispdf 96/114
Direct Measurement of the Triplet Exciton Diffusion Length
96
triplet excitons, being detrimental for the eventual use of triplet excitons in
optoelectronic devices.
6.8 Methods
NPD, FIrPic and PdTPP were purchased from Sigma-Aldrich, American Dye Source
and Porphyrin Systems, respectively. The materials were used without further
purification. Multilayer heterostructures were prepared on quartz substrates by
thermal sublimation in high vacuum of less than 2×10⁻⁷ mbar. The deposition rates of
NPD and the metal-organic complexes were kept at ~1 Å/s and 0.04 Å/s, respectively.
The film thickness was monitored during growth with a quartz microbalance,
thickness and surface roughness were controlled after deposition by atomic force
microscopy. The root mean square roughnesses of quartz substrates and depositedfilms were less than 1 nm on an area of 100 µm2. The samples were handled and
stored in a nitrogen atmosphere.
The set-up for photoluminescence measurements consisted of an Argon ion laser
operating at 466 nm, a monochromator and a photomultiplier tube. The signal was
further amplified with a phase sensitive detector. The samples were mounted in a
cryostat and kept under dynamic vacuum at a pressure of 5×10⁻⁵ mbar or less, at room
temperature. The sample position was varied by shifting the cryostat relative to the
optical path using a micrometer actuator. The dependence of the phosphorescence
emission on the incident power density was measured using a circular variableneutral density filter and a power meter, which was connected with a computer to
record the light intensity directly during the measurements. The Argon laser was
detuned from the absorption bands of each material. For instance, the absorption
coefficient of NPD is only 2.17×10⁻³ nm-1 at the excitation wavelength of 466 nm.
Consequently, variations of the exciton density due to optical absorption can be safely
neglected in the studied NPD thickness range up to 120 nm. Absorption spectra were
measured by a Perkin-Elmer spectrometer under ambient conditions.

8/10/2019 olex thesis.pdf
http://slidepdf.com/reader/full/olex-thesispdf 97/114
Chapter 6
97
6.9 References
[1] G. D. Scholes, Annu. Rev. Phys. Chem. 2003, 54, 57-87.[2] D. L. Dexter, J. Chem. Phys. 1953, 21, 836.[3] S. T. Roberts, C. W. Schlenker, V. Barlier, R. E. McAnally, Y. Zhang, J. N.
Mastron, M. E. Thompson, S. E. Bradforth, J. Phys. Chem. Lett. 2011, 2, 48-54.[4] J. C. Johnson, A. J. Nozik, J. Michl, J. Am. Chem. Soc. 2010, 132, 16302-16303.[5] C.-L. Lee, I.-W. Hwang, C. C. Byeon, B. H. Kim, N. C. Greenham, Adv. Funct.
Mater. 2010, 20, 2945-2950.[6] A. Rao, M. W. B. Wilson, J. M. Hodgkiss, S. Albert-Seifried, H. Ba ssler, R. H.
Friend, J. Am. Chem. Soc. 2010, 132, 12698-12703.[7] B. P. Rand, C. Girotto, A. Mityashin, A. Hadipour, J. Genoe, P. Heremans, Appl.
Phys. Lett. 2009, 95 , 173304-3.
[8] B. P. Rand, S. Schols, D. Cheyns, H. Gommans, C. Girotto, J. Genoe, P.Heremans, J. Poortmans, Org. Electron. 2009, 10, 1015-1019.[9] W. A. Luhman, R. J. Holmes, Appl. Phys. Lett. 2009, 94, 153304-3.[10] M. Arif, K. Yang, L. Li, P. Yu, S. Guha, S. Gangopadhyay, M. Forster, U. Scherf,
Appl. Phys. Lett. 2009, 94, 063307-3.[11] Y. Shao, Y. Yang, Adv. Mater. 2005, 17 , 2841-2844.[12] J. E. Kroeze, R. B. M. Koehorst, T. J. Savenije, Adv. Funct. Mater. 2004, 14,
992-998.[13] A. Köhler, H. F. Wittmann, R. H. Friend, M. S. Khan, J. Lewis, Synth. Met.
1994, 67 , 245-249.[14] A. Köhler, H. Bässler, Mater. Sci. Eng., R 2009, 66, 71-109.
[15] H. Kanno, Y. Sun, S. R. Forrest, Appl. Phys. Lett. 2006, 89, 143516-3.[16] Y. Sun, N. C. Giebink, H. Kanno, B. Ma, M. E. Thompson, S. R. Forrest, Nature
2006, 440, 908-912.[17] S. Reineke, F. Lindner, G. Schwartz, N. Seidler, K. Walzer, B. Lussem, K. Leo,
Nature 2009, 459, 234-238.[18] D. E. Markov, P. W. M. Blom, Appl. Phys. Lett. 2005, 87 , 233511-3.[19] N. C. Giebink, S. R. Forrest, Phys. Rev. B 2008, 77 , 235215-9.[20] P. Peumans, A. Yakimov, S. R. Forrest, J. Appl. Phys. 2003, 93, 3693-3723.[21] O. V. Mikhnenko, F. Cordella, A. B. Sieval, J. C. Hummelen, P. W. M. Blom, M.
A. Loi, J. Phys. Chem. B 2008, 112, 11601-11604.
[22] P. E. Shaw, A. Ruseckas, I. D. W. Samuel, Adv. Mater. 2008, 20, 3516-3520.[23] R. R. Lunt, N. C. Giebink, A. A. Belak, J. B. Benziger, S. R. Forrest, J. Appl. Phys. 2009, 105 , 053711-7.
[24] W. Zhang, J. Yu, W. Wen, Y. Jiang, J. Lumin. 2011, 131, 1260-1263.[25] J. Wünsche, S. Reineke, B. Lüssem, K. Leo, Phys. Rev. B 2010, 81, 245201.[26] M. Lebental, H. Choukri, S. Chenais, S. Forget, A. Siove, B. Geffroy, E. Tutis,
Phys. Rev. B 2009, 79, 165318-13.[27] G. Schwartz, S. Reineke, T. C. Rosenow, K. Walzer, K. Higley, Adv. Funct. Mater.
2009, 19, 1319-1333.[28] M. A. Baldo, S. R. Forrest, Phys. Rev. B 2000, 62, 10958.[29] M. A. Baldo, D. F. O’Brien, M. E. Thompson, S. R. Forrest, Phys. Rev. B 1999,
60, 14422.

8/10/2019 olex thesis.pdf
http://slidepdf.com/reader/full/olex-thesispdf 98/114
Direct Measurement of the Triplet Exciton Diffusion Length
98
[30] C. Wu, P. I. Djurovich, M. E. Thompson, Adv. Funct. Mater. 2009, 19, 3157-3164.
[31] N. Matsusue, S. Ikame, Y. Suzuki, H. Naito, J. Appl. Phys. 2005, 97 , 123512-5.[32] N. C. Giebink, Y. Sun, S. R. Forrest, Org. Electron. 2006, 7 , 375-386.
[33] T. Fushimi, A. Oda, H. Ohkita, S. Ito, J. Phys. Chem. B 2004, 108, 18897-18902.[34] H. Najafov, B. Lee, Q. Zhou, L. C. Feldman, V. Podzorov, Nat. Mater. 2010, 9,
938-943.[35] M. Samiullah, D. Moghe, U. Scherf, S. Guha, Phys. Rev. B 2010, 82, 205211.[36] Y. Luo, H. Aziz, J. Appl. Phys. 2010, 107 , 094510.[37] E. B. Namdas, A. Ruseckas, I. D. W. Samuel, S.-C. Lo, P. L. Burn, Appl. Phys.
Lett. 2005, 86, 091104-3.[38] J. E. Kroeze, T. J. Savenije, L. P. Candeias, J. M. Warman, L. D. A. Siebbeles, Sol.
Energy Mater. Sol. Cells 2005, 85 , 189-203.[39] M. A. Baldo, C. Adachi, S. R. Forrest, Phys. Rev. B 2000, 62, 10967.[40] Q. Wang, J. Ding, D. Ma, Y. Cheng, L. Wang, X. Jing, F. Wang, Adv. Funct.
Mater. 2009, 19, 84-95.[41] O. V. Mikhnenko, P. W. M. Blom, M. A. Loi, Phys. Chem. Chem. Phys. 2011, 13,
14453-14456.[42] J. S. Wilson, A. Kohler, R. H. Friend, M. K. Al-Suti, M. R. A. Al-Mandhary, M. S.
Khan, P. R. Raithby, J. Chem. Phys. 2000, 113, 7627-7634.[43] C.-L. Lee, X. Yang, N. C. Greenham, Phys. Rev. B 2007, 76, 245201.[44] J. Kalinowski, W. Stampor, M. Cocchi, D. Virgili, V. Fattori, P. Di Marco, Chem.
Phys. 2004, 297 , 39-48.[45] D. F. O’Brien, C. Giebeler, R. B. Fletcher, A. J. Cadby, L. C. Palilis, D. G. Lidzey,
P. A. Lane, D. D. C. Bradley, W. Blau, Synth. Met. 2001, 116, 379-383.[46] P. A. Lane, L. C. Palilis, D. F. O’Brien, C. Giebeler, A. J. Cadby, D. G. Lidzey, A. J.
Campbell, W. Blau, D. D. C. Bradley, Phys. Rev. B 2001, 63, 235206.[47] R. G. Kepler, J. C. Caris, P. Avakian, E. Abramson, Phys. Rev. Lett. 1963, 10,
400-402.[48] C. E. Swenberg, J. Chem. Phys. 1969, 51, 1753.[49] A. Suna, Phys. Rev. B 1970, 1, 1716-1739.[50] R. E. Merrifield, Pure Appl. Chem. 1971, 27 , 481-498.[51] V. Dyakonov, G. Rösler, M. Schwoerer, E. L. Frankevich, Phys. Rev. B 1997, 56,
3852-3862.[52] J. Partee, E. L. Frankevich, B. Uhlhorn, J. Shinar, Y. Ding, T. J. Barton, Phys.
Rev. Lett. 1999, 82, 3673-3676.

8/10/2019 olex thesis.pdf
http://slidepdf.com/reader/full/olex-thesispdf 99/114
99
SummaryOrganic semiconductors open the door to new applications in electronics and
optoelectronics where low costs, light weight, and biocompatibility are more
important than durability and high performance. For instance, organic light-emitting
diodes and solar cells can be integrated into clothing, newspapers, windows, etc. The
working principle of these devices relies on the creation and recombination of
excitons – nanometer-sized and electrically neutral quasiparticles that carry useful
energy. Excitons in organic semiconductors can be viewed as strongly bound pairs of
positive and negative elementary charges. In organic solar cells, the energy of
absorbed light is transported by excitons to a specially designed interface, where they
decompose into positive and negative charges leading to the generation of electricalcurrent. Therefore, the motion of excitons – exciton diffusion – is a very important
process. In particular, it is crucial to know how far excitons can diffuse for the design
of solar cells. This thesis focuses on exciton diffusion in organic semiconductors and
on related phenomena. The main achievements that are described here are twofold.
(i) We have developed two new methods to measure the exciton diffusion parameters
and (ii) we have used these tools to improve our understanding of excitonic processes
in organic semiconductors.
Chapter 2 shows that excitons can be quenched in the “skin layer” of solution-
processed polymer films. Such a “skin layer” is formed at the atmosphere-polymerinterface as the solvent evaporates during spin-coating. This effect should be carefully
taken into account in the measurement of the singlet exciton diffusion length using
methods such as fluorescence quenching in bilayers. Exciton quenching in the “skin
layer” is an additional complication in this conventional approach to study exciton
diffusion. Therefore, in order to systematically study exciton diffusion in various
materials, it is reasonable to seek more convenient methods.
A new method to obtain singlet exciton diffusion parameters is described in
detail in Chapter 3. This method is based on modeling of the experimentally
determined photoluminescence decays in blends of organic semiconductors withexciton quenching molecules. Our approach has numerous advantages compared to
previous methods, including reliability and simplicity of execution. To illustrate the
versatility of this method, we report the measurements of exciton diffusion
parameters in several materials including three polymers and one small-molecule
compound. In Chapter 4 we show that our method can be easily applied to study the
effect of thermal annealing – and similar treatments – on the exciton diffusion
length. Thus, this tool enables us to conduct systematic studies, potentially allowing
us to understand which physical parameters and structural features influence the
exciton diffusion process.

8/10/2019 olex thesis.pdf
http://slidepdf.com/reader/full/olex-thesispdf 100/114
Summary
100
Using the new method, we measured the exciton diffusion lengths for the first
time in two narrow bandgap polymers, see Chapter 3. We show that a substitution
of a carbon atom with a silicon atom in the polymeric backbone leads to a twofold
reduction of the exciton diffusion coefficient, while the exciton diffusion length
remains the same. Moreover, we show in Chapter 4 that, in contrast to expectations,
both exciton diffusion length and coefficient decrease upon thermal annealing of a
thin film of a small-molecule organic semiconductor. Conversely, the performance of
bulk heterojunction solar cells that are based on this material is significantly
improved after the same thermal treatment. Therefore, we conclude that there is no
straightforward correlation between the performance of bulk heterojunction solar
cells and exciton diffusion length.
A reliable method to detect triplet excitons is necessary to measure their
diffusion length. In Chapter 5 we describe a highly sensitive detection method that
is suitable for studying dynamics of triplet excitons. We blend a phosphorescent
dopant, a Pd-coordinated porphyrin, with an organic semiconductor and demonstrate
that the intensity of its phosphorescent emission is proportional to the triplet density
in the host material. Although the detection mechanism relies on transferring the
energy of triplet excitons to the porphyrin molecules, we demonstrate that the
presence of the Pd-coordinated porphyrin does not reduce the average lifetime of
triplet excitons in the host semiconductor. In this respect, the population of triplet
excitons is not perturbed by the Pd-coordinated porphyrin. The capability of our
method to detect a low triplet density in ultrathin films at room temperature is a
feature that distinguishes our approach from standard techniques of triplet detection,such as photoinduced absorption.
Chapter 6 presents a new method to directly probe triplet diffusion in a
prototypical organic semiconductor. We design a multilayer heterostructure that
features designated triplet-injector and triplet-detector layers separated by an organic
semiconductor layer of certain thickness. Upon optical excitation, triplet excitons
diffuse through the organic semiconductor from the injector to detector layer. By
varying the thickness of the organic semiconductor layer, we are able to record a
triplet penetration profile, which directly yields the triplet diffusion length. In
literature there are several papers that report different triplet exciton diffusionlengths in the range of 10-250 nm for the same materials. We show that triplet-triplet
annihilation can significantly limit the spatial extent of the triplet exciton diffusion.
This effect presumably is responsible for the large spread of the reported values of
triplet exciton diffusion lengths in the mentioned studies.
Manipulation of triplet excitons may create possibilities for spin-based devices
that operate with electrically neutral spins. Diffusion of triplet excitons may then
serve as the transport mechanism for spins. Our multilayer structure with triplet
injector and detector layers can be helpful to further study excitonic spin.

8/10/2019 olex thesis.pdf
http://slidepdf.com/reader/full/olex-thesispdf 101/114
101
SamenvattingOrganische halfgeleiders openen de deur naar nieuwe toepassingen in de
elektronica en optoelektronica waarin lage kosten, een laag gewicht en
biocompatibiliteit belangrijker zijn dan duurzaamheid en hoge prestaties.
Bijvoorbeeld kunnen organische lichtuitstralende diodes en zonnecellen worden
geïntegreerd in kleding, kranten, ramen etc. Het grondbeginsel van operatie van deze
schakelingen berust op de creatie en recombinatie van excitonen – nanometersgrote
en elektrisch neutrale quasideeltjes die nuttige energie dragen. Excitonen in
organische halfgeleiders kunnen worden gezien als sterk gebonden paren van
positieve en negatieve elementaire ladingen. In organische zonnecellen wordt de
energie van het geabsorbeerde licht door excitonen getransporteerd naar een speciaalontworpen grensvlak, waar ze uiteenvallen in positieve en negatieve ladingen, die tot
generatie van een elektrische stroom leiden. Daarom is de beweging van excitonen –
excitondiffusie – een belangrijk proces. In het bijzonder is het cruciaal om te weten
hoe ver excitonen kunnen diffunderen bij het ontwerpen van zonnecellen. Dit
proefschrift richt zich op excitondiffusie in organische halfgeleiders en op
gerelateerde verschijnselen. De voornaamste behaalde resultaten die hier worden
beschreven zijn tweeledig. (i) We hebben twee nieuwe methodes ontwikkeld om de
excitondiffusieparameters te meten (ii) we hebben deze middelen gebruikt om onze
kennis over excitonische processen in organische halfgeleiders te verbeteren.Hoofdstuk 2 laat zien dat excitonen kunnen worden uitgedoofd in de
“huidlaag” van uit oplossing vervaardigde polymere dunne lagen. Zo een “huidlaag”
wordt gevormd aan het atmosfeer-polymeer grensvlak gedurende het verdampen van
het oplosmiddel tijdens het spincoaten. Met dit effect dient zorgvuldig rekening te
worden gehouden wanneer de diffusielengte van het singlet exciton wordt gemeten
doormiddel van bijvoorbeeld fluorescentie-uitdoving in bilagen. Uitdoving van
excitonen in de “huidlaag” is een bijkomend probleem in deze gebruikelijke aanpak
om excitondiffusie te bestuderen. Daarom is het redelijk om andere, meer geschikte
methodes te zoeken om systematisch excitondiffusie in verschillende materialen te bestuderen.
Een nieuwe meetmethode om de parameters van singlet-excitondiffusie te
verkrijgen wordt in detail beschreven in Hoofdstuk 3. Deze methode is gebaseerd
op het modeleren van het experimenteel vastgestelde fotoluminescentieverval in
mengsels van organische halfgeleiders en excitonuitdovende moleculen. Onze
benadering heeft talrijke voordelen ten opzichte van eerder ontwikkelde methodes,
zoals betrouwbaarheid en eenvoud van uitvoering. Om de veelzijdigheid van deze
techniek te illustreren, rapporteren we hier metingen van excitondiffusieparameters
in verscheidene materialen, waaronder drie polymeren en een klein molecuul. In

8/10/2019 olex thesis.pdf
http://slidepdf.com/reader/full/olex-thesispdf 102/114
Samenvatting
102
Hoofdstuk 4 laten we zien dat onze methode eenvoudig kan worden toegepast om
het effect van het verhitten van de laag – en vergelijkbare behandelingen – op de
excitondiffusielengte te bestuderen. Dientengevolge stelt deze techniek ons in staat
om systematische studies uit te voeren, die in de toekomst kunnen leiden tot begrip
over welke fysische parameters en structurele eigenschappen het
excitondiffusieproces beïnvloeden.
Gebruikmakend van deze nieuwe methode hebben we voor de eerste keer de
excitondiffusielengte gemeten in twee polymeren met een smalle energiebandkloof,
zie Hoofdstuk 3. We laten zien dat vervanging van een koolstofatoom door een
siliciumatoom in de polymeerketen leidt tot een halvering van de
excitondiffusiecoëfficiënt, terwijl de excitondiffusielengte gelijk blijft. Bovendien laten
we in Hoofdstuk 4 zien dat, in tegenstelling tot de verwachting, zowel de
excitondiffusielengte als -coëfficiënt kleiner worden als gevolg van het verhitten van
een dunne laag van een klein-molecuul organische halfgeleider. Daarentegen nemen
de prestaties van bulk heterojunctie zonnecellen gebaseerd op dit materiaal toe
wanneer ze zijn blootgesteld aan dezelfde thermische behandeling. Derhalve
concluderen wij dat er geen rechtlijnig verband is tussen de prestaties van bulk
heterojunctie zonnecellen en de excitondiffusielengte.
Een betrouwbare methode om triplet excitonen te detecteren is noodzakelijk om
hun diffusielengte te meten. In Hoofdstuk 5 beschrijven we een zeer gevoelige
detectiemethode die geschikt is om de dynamica van triplet excitonen te bestuderen.
We mengen een fosforescerend molecuul, een Pd-gecoördineerde porfyrine, in een
organische halfgeleider en tonen aan dat de intensiteit van de fosforescerende emissie
evenredig is met de tripletdichtheid in het gastheermateriaal. Hoewel het
detectiemechanisme berust op energieoverdracht van de triplet excitonen naar de
porfyrine moleculen, laten we zien dat de aanwezigheid van Pd-gecoördineerde
porfyrines de gemiddelde levensduur van triplet excitonen in de halfgeleider niet
reduceert. In dat opzicht wordt de populatie van triplet excitonen niet verstoord door
de Pd-gecoördineerde porfyrine. Het vermogen van onze methode om een lage
tripletdichtheid in ultradunne lagen op kamertemperatuur te kunnen detecteren is
een eigenschap die onze benadering onderscheidt van standaardtechnieken voor
tripletdetectie, zoals fotogeïnduceerde absorptie.
Hoofdstuk 6 toont een nieuwe methode om direct tripletdiffusie te meten in
een prototypische organische halfgeleider. We ontwerpen een
multilaagsheterostructuur met aangewezen tripletinjectie- en tripletdetectielagen,
gescheiden door een organische halfgeleiderlaag van een zekere dikte. Na optische
excitatie diffunderen triplet excitonen door de organische halfgeleider van de injectie-
naar de detectielaag. Door de dikte van de organische halfgeleiderlaag te variëren zijn
we in staat om het tripletpenetratieprofiel vast te leggen, welke direct de
tripletdiffusielengte oplevert. In de literatuur zijn er verscheidene artikelen te vinden
die verschillende triplet-excitondiffusielengtes rapporteren over een bereik van 10-

8/10/2019 olex thesis.pdf
http://slidepdf.com/reader/full/olex-thesispdf 103/114
Samenvatting
103
250 nm voor dezelfde materialen. We laten zien dat triplet-triplet annihilatie het
ruimtelijke bereik van triplet-excitondiffusie significant kan beperken. Dit effect is
vermoedelijk verantwoordelijk voor de grote spreiding in de gerapporteerde waardes
van triplet-excitondiffusie in de genoemde studies.
Manipulatie van triplet excitonen kan mogelijkheden scheppen voor
spingebaseerde schakelingen die functioneren met elektrisch neutrale spins. Diffusie
van triplet excitonen zou dan kunnen dienen als het transportmechanisme voor spins.
Onze multilaagsstructuur met tripletinjectie- en tripletdetectielagen kunnen
bruikbaar zijn om excitonische spin nader te bestuderen.
Translated to Dutch by Gert-Jan Wetzelaer

8/10/2019 olex thesis.pdf
http://slidepdf.com/reader/full/olex-thesispdf 104/114

8/10/2019 olex thesis.pdf
http://slidepdf.com/reader/full/olex-thesispdf 105/114
105
Curriculum Vitae
Oleksandr Mikhnenko
February 24, 1984 Born in Brusyliv, Ukraine
1997-2000 Ukrainian Lyceum of Physics and Mathematics of
Taras Shevchenko National University of Kyiv
2000-2004 BSc in Applied Physics, cum laude
Taras Shevchenko National University of Kyiv
2004-2006 MSc in Applied Physics, cum laude
Taras Shevchenko National University of Kyiv
“Quantum Theory of Diffraction”
2005-2007 MSc in Nanoscience (Physics)
University of Groningen
“Low Temperature Study of The Exciton Diffusion in
Conjugated Polymers”
2007-2012 PhD in Physics
University of Groningen
“Dynamics of Singlet and Triplet Excitons in Organic
Semiconductors”
Awards
2011 Poster Prize at MRS meeting in San Francisco
2011 Poster Prize at Workshop "Materials for energy",
the Netherlands
2008 Poster Prize by Dutch Polymer Institute
2003 "Volunteer of the Year”, the city of Kyiv

8/10/2019 olex thesis.pdf
http://slidepdf.com/reader/full/olex-thesispdf 106/114
106
List of Publications
9. Direct Measurement of the Triplet Exciton Diffusion Length in Organic
Semiconductors.
O. V. Mikhnenko, R. Ruiter, P. W. M. Blom, M. A. Loi, submitted 2011.
8. Exciton Diffusion Length in Narrow Band Gap Polymers.
O. V. Mikhnenko, H. Azimi, M. Scharber, M. Morana, P. W. M. Blom, M. A. Loi,
submitted 2011.
7. Effect of Thermal Annealing on Exciton Diffusion in a Diketopyrrolopyrrole
Derivative.
O. V. Mikhnenko, J. Lin, Shu, Y., J. E. Anthony, P. W. M. Blom, T.-Q. Nguyen, M.
A. Loi, submitted. 2011.
6. Exploring the origin of the temperature dependent behavior of PbS nanocrystal
thin films and solar cells.
K. Szendrei, M. Speirs, W. Gomulya, D. Jarzab, M. Manca, O. V. Mikhnenko, M. Yarema, B. J. Kooi, W. Heiss, M. A. Loi, Advanced Functional Materials, 2011,
accepted.
5. Sensitive Triplet Exciton Detection in Polyfluorene Using Pd-coordinated
Porphyrin.
O. V. Mikhnenko, P. W. M. Blom, M. A. Loi, Phys. Chem. Chem. Phys. 2011, 13,
14453-14456.
4. Cyclometalated Red Iridium(iii) Complexes Containing Carbazolyl-Acetylacetonate
Ligands: Efficiency Enhancement in Polymer LED Devices.
N. Tian, Y. V. Aulin, D. Lenkeit, S. Pelz, O. V. Mikhnenko, P. W. M. Blom, M. A.
Loi, E. Holder, Dalton Trans. 2010, 39, 8613.
3. Exciton Quenching Close to Polymer− Vacuum Interface of Spin-Coated Films of
Poly(p-phenylenevinylene) Derivative.
O. V. Mikhnenko, F. Cordella, A. B. Sieval, J. C. Hummelen, P. W. M. Blom, M. A.
Loi, J. Phys. Chem. B 2009, 113, 9104-9109.

8/10/2019 olex thesis.pdf
http://slidepdf.com/reader/full/olex-thesispdf 107/114
List of Publications
107
2. Solution-Processable Near-IR Photodetectors Based on Electron Transfer from PbS
Nanocrystals to Fullerene Derivatives.K. Szendrei, F. Cordella, M. V. Kovalenko, M. Böberl, G. Hesser, M. Yarema, D.
Jarzab, O. V. Mikhnenko, A. Gocalinska, M. Saba, F. Quochi, A. Mura, G.
Bongiovanni, P. W. M. Blom, W. Heiss, M. A. Loi, Adv. Mater. 2009, 21, 683-687.
1. Temperature Dependence of Exciton Diffusion in Conjugated Polymers.
O. V. Mikhnenko, F. Cordella, A. B. Sieval, J. C. Hummelen, P. W. M. Blom, M. A.
Loi, J. Phys. Chem. B 2008, 112, 11601-11604.

8/10/2019 olex thesis.pdf
http://slidepdf.com/reader/full/olex-thesispdf 108/114

8/10/2019 olex thesis.pdf
http://slidepdf.com/reader/full/olex-thesispdf 109/114
109
AcknowledgmentsGreat! This is the single word that describes my overall experience in Groningen.
I feel like I matured a lot both personally and professionally during last few years. In
that I am in debt to many people. It is my great pleasure to mention them here.
Maria Antonietta Loi, you introduced me to the world of spectroscopy and taught
how to build an optical setup from scratch. In this way I learned from you invaluable
experience how to set up a new optical lab. You did not like when I referred to you as
“boss” in private conversations, because you put an effort to build our professional
relationship as equal colleagues. I value that highly. I appreciate your guidance and
the great amount of freedom that you granted me in the scientific research. Thank
you for your patience with me.Paul Blom, your lectures back in 2006 helped to make up my mind to start
research in the field of organic semiconductors. I was greatly impressed by your style
of teaching. I admire your abilities to bring pieces of puzzle together and see the big
picture. Although you have permanently moved to Eindhoven to take a high level
position in the Holst Center, you actively participated in many major decisions of my
project. I am grateful for sharing with me your knowledge and experience. You
certainly made an imprint on my approach for the scientific research.
Also I would like to thank Bert de Boer, who helped me a lot around the lab just
when I started. Bert, your will be always remembered as a great colleague andsupervisor.
I would like to express my gratitude to the members of the reading committee
Vladimir Dyakonov, Peter Bobbert, and Kees Hummelen. Thank you very much for
you time and effort in evaluating this thesis. Your valuable comments undoubtedly
helped to improve the quality of my writing.
I am thankful to Dutch Polymer Institute (DPI) for providing funding for my
PhD project. I enjoyed spending time with DPI community during the progress report
meetings at various locations in the Netherlands. In particular, I am thankful to Frans
de Schryver, John van Haare, Peter Bobbert, Rene Jansen, Reinder Coehoorn, andMarco Carvelli for their inputs into my research.
Renate Hekkema, you are the best secretary in the whole world! Your special
calming charm transforms the bureaucratic procedures into pleasant encounters. We
worked closely on organizing the group retreat at Texel, which was codenamed as a
“workweek”. I really enjoyed planning that event with you and I learned quite some
tips in dealing with people. I appreciate time talking with you about all kinds of things
during numerous coffee breaks and social activities. Thank you!
Frans van der Horst, thank you very much for your great help in the lab. You
always found ways to bend the rules and get things done just when we needed them.

8/10/2019 olex thesis.pdf
http://slidepdf.com/reader/full/olex-thesispdf 110/114
Acknowledgments
110
Your sense of humor is unforgettable. You redefined the line between appropriate and
inappropriate in your own way. I feel privileged to work with you just before your
retirement, as you never hesitated to share the experience that you have collected
through the years.
I would like to give thanks to our clean-room master, Jan Harkema. In the lab
you are always extremely helpful and fast. It is a pleasure to step by your office and
learn about your incredible adventures as a traveler, a motorcyclist, a sailor, an ice-
skater or an actor. You are probably the most active person I’ve ever met. You always
took an important part in organizing social events. Thank you!
Arjen Kamp joined our group only at my last year of PhD and I enjoyed a lot his
company, sense of humor and sweet directness. Arjen, it is very easy to get things
going with you. I wish we could work more together. In addition I would like to thank
to Ben Hesp for helping around with optical setups, Jurrian Wildeman for advices inchemistry labs, Johan Holstein for keeping the NanoLab cleanroom in great shape,
and Reinder Gooijaarts for the technical support around his labs.
During my PhD training, I was lucky to have multiple collaborations with great
people. Alex Sieval and Kees Hummelen provided cross-linkable fullerenes that
opened great possibilities in studding exciton diffusion in organic semiconductors.
Kees, you are more than a collaborator, you are a teacher to me. I consider you
lectures on organic electronics as one of the best I have ever attended. I admire your
ability to look deep into the problem and put serious questions in a playful manner.
Your great scientific talks inspired me to work on my own presentation skills.
I am grateful to Elisabeth Holder for providing highly performing
phosphorescent molecules. Our collaboration is very special for me, as it was the first
joint work that I initiated myself and delegated most of the work to a master student
Yaroslav. It brought me great experience that resulted in a nice publication. I am also
grateful to Markus Scharber and his co-workers from Konarka for providing narrow-
bandgap polymers.
One of the highlights of my road trip in California 2011 was a visit to University
of California in Santa Barbara, where I met charming Thuc-Quyen Nguyen. Quyen, I
was impressed by your openness and clear thinking. We immediately found a way tocollaborate. Thank you for sending Jason Lin to Groningen with materials that were
synthesized in your group. You even offered me a post-doc position in your group,
which I am happy to accept. My feeling is that I will have a very fruitful experience in
your group.
Jason Lin, you were in Groningen only one month, and I consider that time as
the most productive month throughout my whole PhD. We managed to measure
exciton diffusion parameters in your materials with astonishing efficiency – one
material per day. I still keep telling people that story about the front wheel of your
bike, which was first stolen and then reappearing in the parking lot in front of

8/10/2019 olex thesis.pdf
http://slidepdf.com/reader/full/olex-thesispdf 111/114
Acknowledgments
111
University. We made a great team and I am happy to continue working with you in
Santa Barbara. Thank you. I would like also to thank Mananya Tantiwiwat for
measuring the x-ray diffraction pattern that was used in this thesis.
We started collaboration with Martijn Kuik after this thesis was mostly ready.Thank you very much for explaining me the details of charge transport in organic
semiconductors. It is a great fun not only to write a paper with you, but also spending
time together during coffee breaks and at parties. Thank you!
I am grateful to talented students, that I was lucky to supervise. Nynke Vlietstra,
Yaroslav Aulin, and Roald Ruiter, thank you very much for your contributions to my
research projects. I enjoyed working with you guys. I believe that you will have a
bright future independently of your choice of career path. In addition, very recently, I
had a pleasure to work with Niels van der Kaap, who helped preparing samples for
exciton diffusion length measurements. Niels, I am sure you will have great time as aPhD student in Groningen.
It was a pure pleasure to work in an international and open environment in the
University of Groningen. I received many work- and life-related advices from senior
colleagues. In particular I would like to thank Viktor Malyshev, Ton Schoot
Uiterkamp, Petra Rudolf, Ryan Chiechi, Viktor Krashnikov, Jan Anton Koster, Dago
de Leeuw, and Antoine van Oijen. Our short encounters made long-lasting imprints
on me. Thank you!
It was a great fun to share the office with Dorota Jarzab. We started to work with
Maria at about the same time. You found a great Italian boyfriend, Filippo, and it wasfun to observe you transforming into an Italian person. I wish you success in future.
Jia Gao, your unique combination of pure honesty and directness makes your
points in conversations particularly interesting. Our endless discussions absolutely
helped to shape my decision making tree on future career. Thank you very much for
your help in the optical lab. I wish you good luck in Princeton and I am sure you will
reach all your goals.
Krisztina Szendrei brought a great tradition to our group. Kriszti, you started to
bring chocolates each time you were coming back from a work trip or a vacation, and
then others picked up that habit. You also treated us with great home baked cookies.It was also a pleasure to work with you in the lab. Thank you!
I would like to thank Artem Bakulin, with whom I spent a lot of time playing
ping-pong, sailing, and talking about everything. We had a great fun driving around
San Francisco after a conference.
Special thanks are addressed to Gert-Jan Wetzelaer for translating the summary
of this thesis to Dutch and for the great fun we had at all the parties. In addition I am
thankful to Jessica Sicard for proofreading parts of this thesis.
I would like to thank Hennie Valkenier for organizing the ice-skating events,
helping me a lot with chemistry-related questions, and numerous conversations we

8/10/2019 olex thesis.pdf
http://slidepdf.com/reader/full/olex-thesispdf 112/114
Acknowledgments
112
had about all kinds of things. I was truly amazed by your decision to spend one year
as a science teacher at a charity hospital in Africa.
I would like to thank Marianna Manca, who introduced a cute chaos to our
group. Your open and shining personality positively enriched my everyday life. Thank you very much for always being cheerful and understanding. I am very happy that you
became my officemate and agreed to be my paranymph.
Marian Otter, we studied together as master students, we were teaching
assistants for the solid state Physics course, and we even lived in the same house for a
while. We always had a great time regardless of what we did. I am amazed by your
positivity and ability to have everything done. You always managed to make enough
of free time for a quality party. I am so happy that you agreed to be my paranymph.
I am particularly thankful to Fabrizio Cordella for teaching me spectroscopy,
basic Italian, and cooking pasta; Simone Fabiano for being such a cool and funnycolleague; Claudia Piliego for helping me finding contacts in California; Ilias
Katsouras for nice photography trips; Deepak Prusty for helping around chemistry
lab; Afshin Hadipour for great tips around the cleanroom; Hylke Akkerman for
switching conversation to English during the coffee breaks; Johan Brondijk for geeky
talks; Herman Nicolai for being a party master; Yuan Zhang for inviting me to Santa
Barbara; Paul de Bruyn for sharing his music recordings; and Maksym Sladkov for
letting me know about the opportunities of Master programs in Groningen.
In addition I would like to thank nearby working colleagues who created a great
and friendly atmosphere in the lab: Anne-Marije Andringa, Kamal Asadi, SartriaBisri, Irina Craciun, Vlad Derenskyi, Davide Fracasso, Andre Hof, Fatemeh
Gholamrezaie, Widianta Gomulya, Auke Kronemeijer, Martijn Lenes, Mingtao Lu,
Francesco Maddalena, Date Moet, Jolt Oostra, Parisa Pourhossein, Mark-Jan
Spijkman, and Wenqiang Zou.
I am grateful for the quality time that we spent with friends outside the work:
Antohin and Adrianka for being such a nice and positive people; Rudolph Wierda and
Jessica Sicard for nice dinners; Giuseppe and Parisa for great adventures within the
Couch Surfing community; Eva Magnuskova and Arnaud Maurer for teaching me a
lot about Dutch culture, and Jacob and Marija Wubs for being the best landlords.Many thanks are addressed to the Russian-speaking community in Groningen
that helped me to make a smooth transition to the Dutch way of living. I am thankful
to Alina Veligura and Csaba Jozsa, Sasha Fedorov and Natalya Dudkina, Carlijn
Ubbens, Monika Lubomska, Dima Fishman, Maksym Sladkov, Ihor Shekarev, Dmitry
Mazurenko, Andriy Kovalchuk, Ira Samarska, Sergii Denega and Katya Naumova,
Sasha Zozulya, Dima Makogon, Oleg Antoniuk, Kedrov family, Vladimir Markov, Olya
Kalmykowa, Zhanna, Pavlo Gordiichuk, Sergii Yandyuk, Alex Nesterov, Alex
Polyakov, Oleksii Ivashenko, and Vlad Pavelyev.

8/10/2019 olex thesis.pdf
http://slidepdf.com/reader/full/olex-thesispdf 113/114

8/10/2019 olex thesis.pdf
http://slidepdf.com/reader/full/olex-thesispdf 114/114
Acknowledgments
Preceding three paragraphs are translated into Ukrainian in the following.
Хочу висловити подяку моїм родичам, зокрема дякую за постійну
підтримку моєму братові Міші та його родині, тестю Анатолію, тещі Любі, та моєму шурину Славіку .
Я у великому боргу перед моїми батьками Зоєю та Віктором, які вклали
кращі роки свого життя в мою освіту . Дорогі Мамо і Батьку , коли я навчався в
молодших класах, Ви витратили незліченну кількість годин навчаючи мене
розв' язувати математичні та хімічні задачі. Ваші зусилля створили міцну основу
знань, які допомогли мені поступити в найкращу спеціалізовану школу у віці 13
років. На той час, у 90-х роках, Ви боролися з надзвичайно тривалими
затримками зарплатні, щоб забезпечити мою подальшу освіту . Ви завжди
підтримували і довіряли мені. Від щирого серця я хотів би висловити мою подяку . Моя формальна освіта закінчується цією дисертацією, яку я присвячую
Вам.
Я хочу також подякувати моїй коханій дружині Оксані, чия постійна
підтримка допомогла мені написати цю дисертацію. Оксано, твої чудові
ілюстрації знайшли собі місце на моїх постерах, презентаціях та прикрасили
обкладинку цієї книги. Неймовірно, наскільки ми з тобою різні та водночас
схожі. Між нами існує майже магічний зв' язок, який синхронізує наш особистий
розвиток. Більше того, наші нескінченні дискусії про продаж векторної графіки
онлайн надихнули мене на створення Монте Карло симуляції, котра стала основою для двох розділів цієї книги. Я вдячний за твою допомогу , підтримку
та за те, що ти навчила мене завжди бачити позитивну сторону світу . Нам з
тобою завжди хочеться проводити час разом. Я люблю тебе.
Нарешті, я хотів би вибачитись перед тими, кого я забув згадати на цих
сторінках. Стільки людей допомагали мені за роки аспірантури, що зараз
неможливо скласти повний список. Дякую за Ваше розуміння.