oligopoly chapter 10. in this chapter… 10.1. revisit market structure and market power what...
Post on 22-Dec-2015
214 views
TRANSCRIPT

Oligopoly
Chapter 10
In This Chapter…
10.1. Revisit Market Structure and Market Power
• What determines how much market power a firm has?
10.2. Profit Maximization Under Oligopoly (Kinked Demand Curve and Sticky Prices)
• How do firms set prices and outputs?
10.3. Coordination, Problems and the Government• What problems oligopolists have in
maintaining price and output levels?
10.1. Revisiting Market Structure
and Market Power
Market Structure and Market PowerWe classify firms into specific market
structures based on the number and relative size of firms in an industry.
– Market structure – The number and relative size of firms in an industry.
Most firms possess some market power.

Degrees of Power
In imperfect competition, individual firms have some power in a particular product market.
Oligopoly is a market in which a few firms produce all or most of the market supply of a particular good or service.
Degrees of Power
Oligopoly is a market in which a few firms produce all or most of the market supply of a particular good or service.
Examples:– Sports Shoes– Cereals Producer– Auto Manufacturers
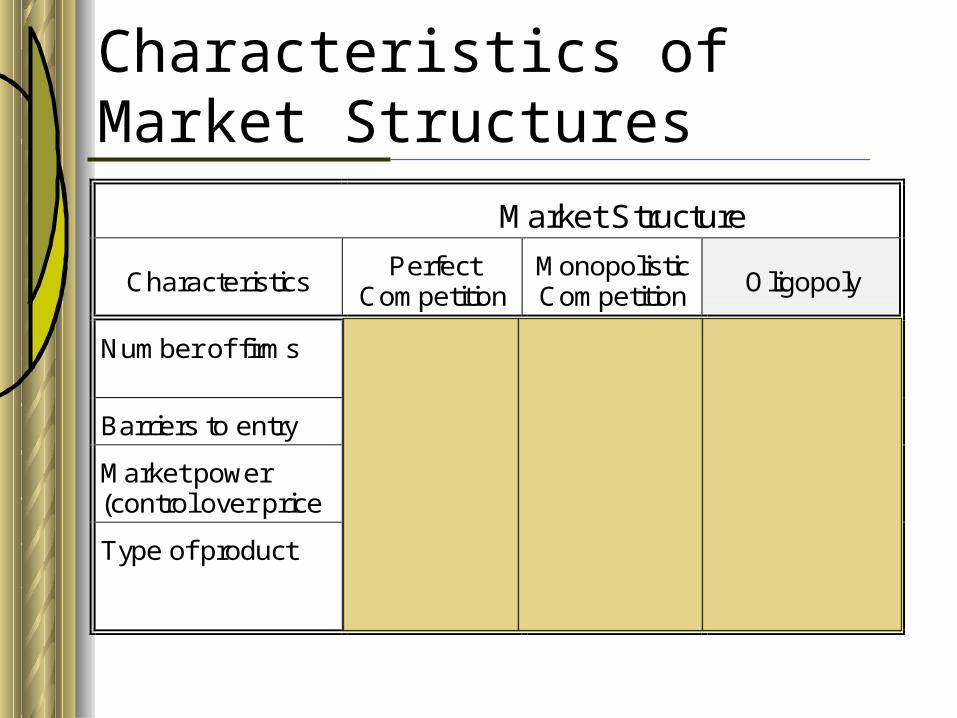
Characteristics of Market Structures
Market Structure
CharacteristicsPerfect
CompetitionMonopolisticCompetition Oligopoly
Number of firms Very largenumber
Many Few
Barriers to entry None Low High
Market power(control over price
None Some Substantial
Type of product Standardized Differentiated Standardizedordifferentiated
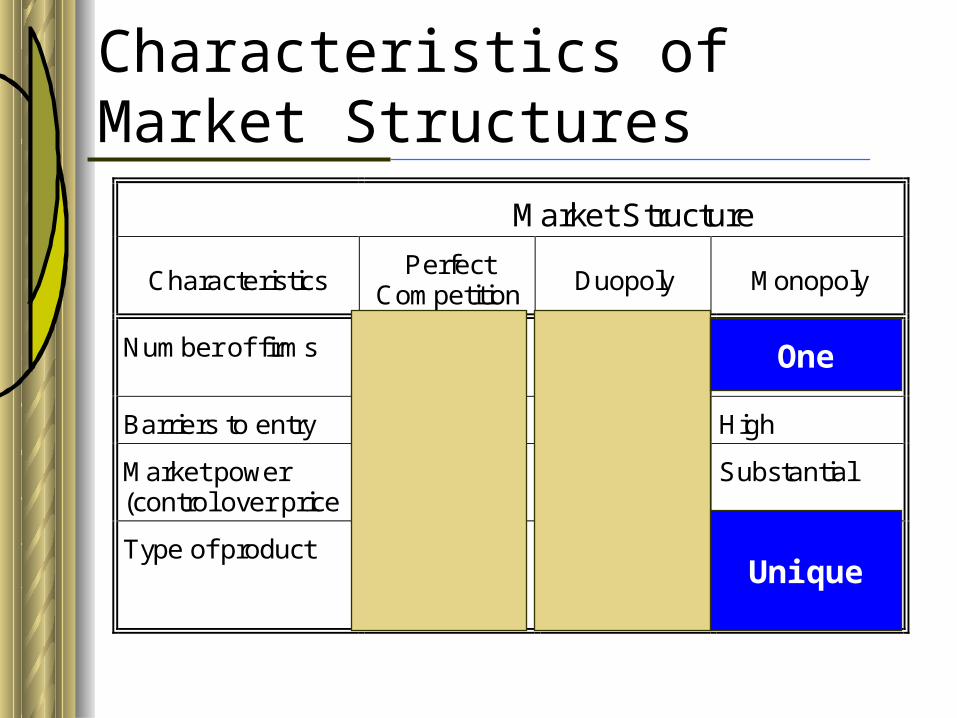
Characteristics of Market Structures
Market Structure
CharacteristicsPerfect
Competition Duopoly Monopoly
Number of firms Very largenumber
Two One
Barriers to entry None High High
Market power(control over price
None Substantial Substantial
Type of product Standardized Standardizedordifferentiated
UniqueUnique
One

Determinants of Market Power
Market power of a firm is a function of:
• The Number of producers• The Size of each firm• The Barriers to entry• The Availability of substitute goods
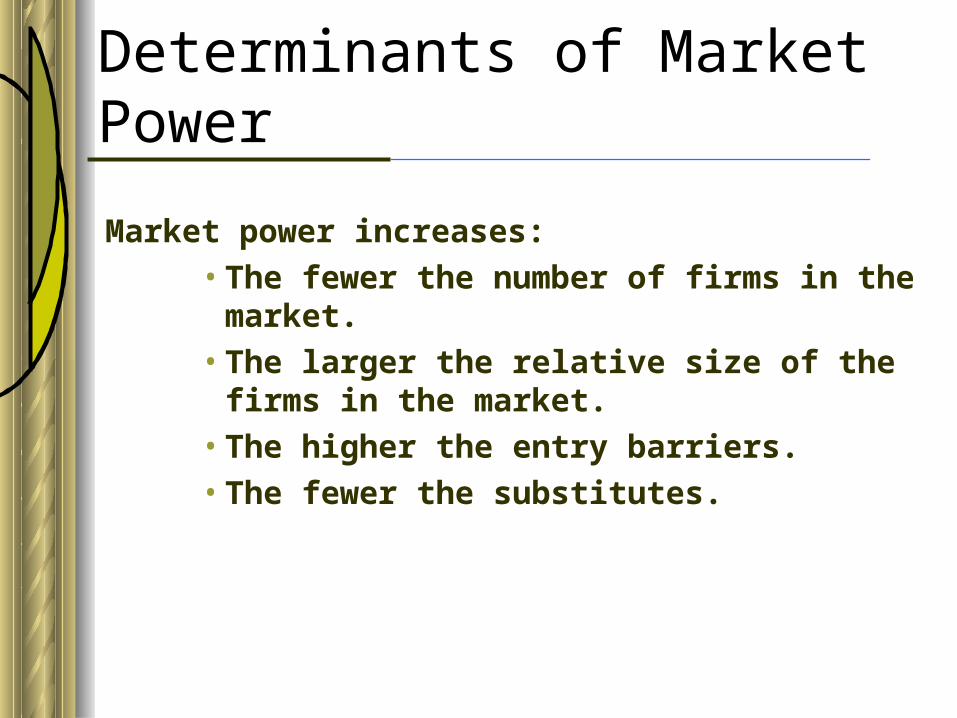
Determinants of Market Power
Market power increases:•The fewer the number of firms in the
market.•The larger the relative size of the
firms in the market.•The higher the entry barriers.•The fewer the substitutes.

Determinants of Market Power
Barriers to entry determine to what extent the market is a contestable market.
– Contestable market – An imperfectly competitive industry subject to potential entry if prices or profits increase.

Measuring Market Power
The standard measure of market power is the concentration ratio.
It relates the size of firms to the size of the market. – What proportion of the market supply is
concentrated in the hands a few firms?

Concentration RatioConcentration Ratio:
– is the proportion of total industry output produced by the largest firms (usually the four largest).
•Market power isn’t necessarily associated with firm size.
•….because a small firm could possess a lot of power in a relatively small market.
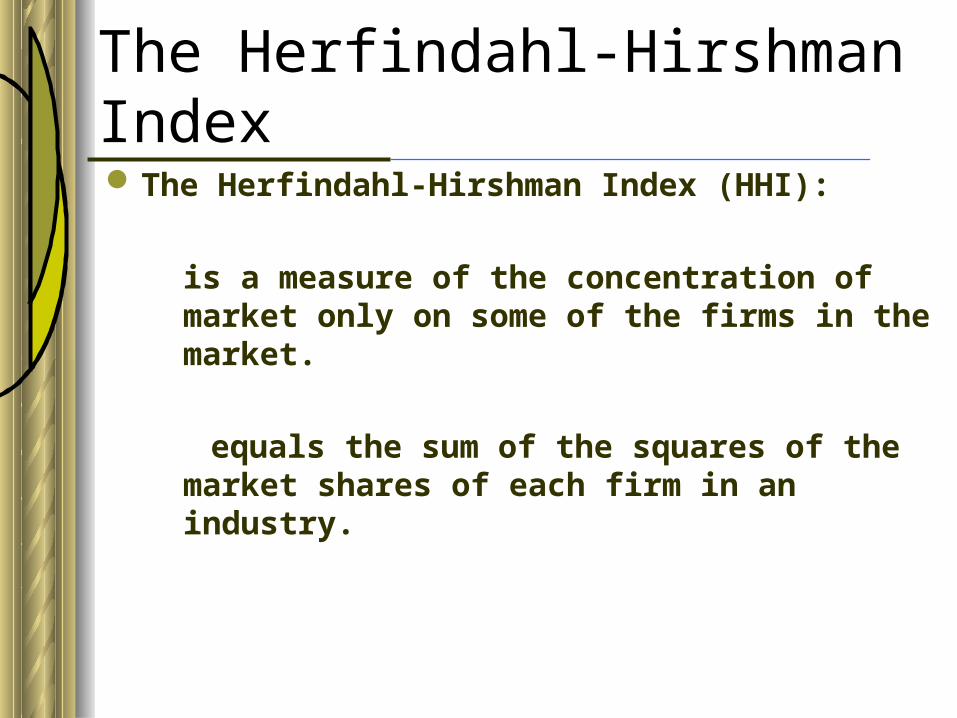
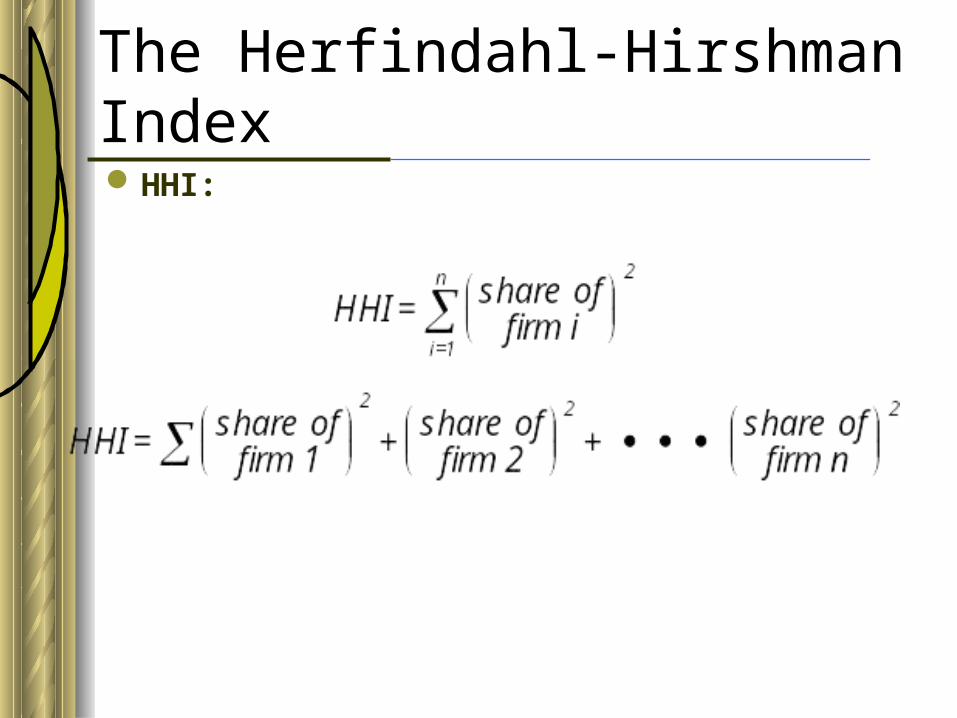
The Herfindahl-Hirshman Index
The Herfindahl-Hirshman Index (HHI):
is a measure of the concentration of market only on some of the firms in the market.
equals the sum of the squares of the market shares of each firm in an industry.
The Herfindahl-Hirshman Index
HHI:

Measurement Problems
HHI doesn’t tell it all
Concentration ratios do not convey the extent to which market power may be concentrated in a local market.
That is, many smaller firms acting in unison can achieve market power.
Summary Note
Oligopoly is a market in which a few firms supply significant amount of the market supply
…and thus can have market power ( the ability to alter prices/outputs) to maximize profits

10.2: Profit Maximization Under Oligopoly (Price and Output Decisions under Oligopoly)
Kinked Demand Curve and
Sticky Prices
Oligopoly Behavior
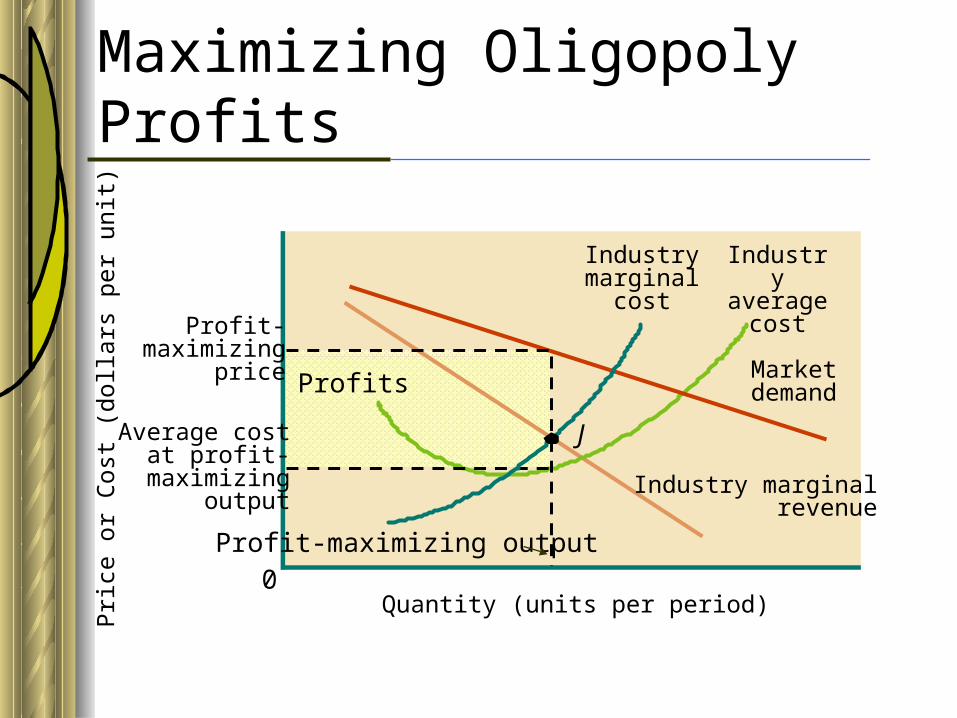
Like all other markets, under Oligopoly as well, the Profit Maximizing Output is the level of output at which MR=MC
Pri
ce o
r C
ost
(dolla
rs p
er
unit
)
Quantity (units per period)0
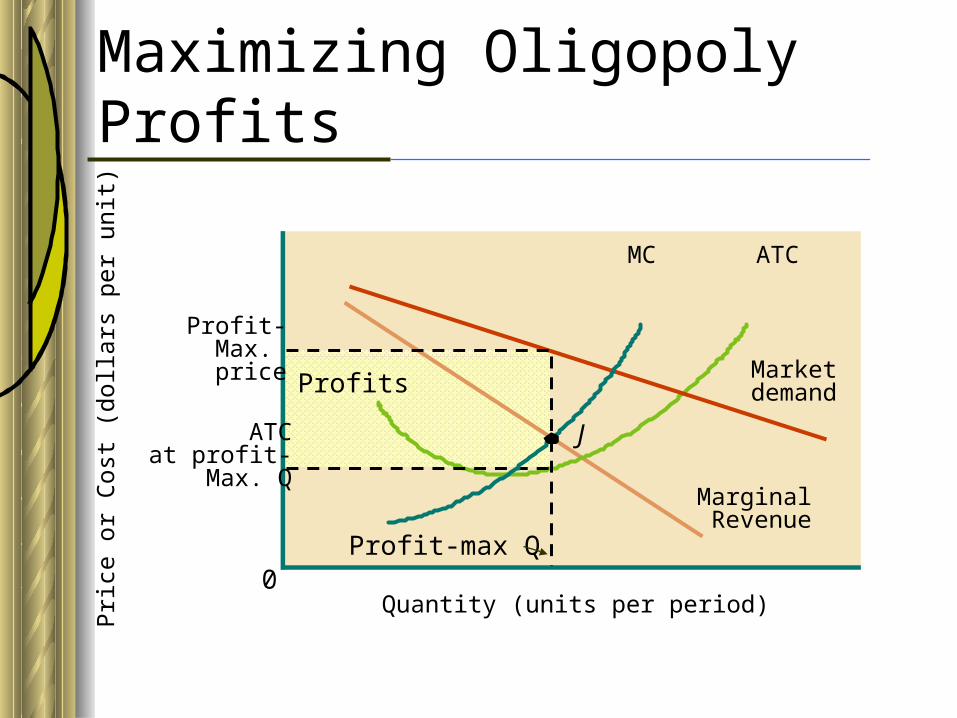
Maximizing Oligopoly Profits
MC ATC
Marketdemand
MarginalRevenue
Profits
J
Profit-Max. price
ATCat profit-
Max. Q
Profit-max Q
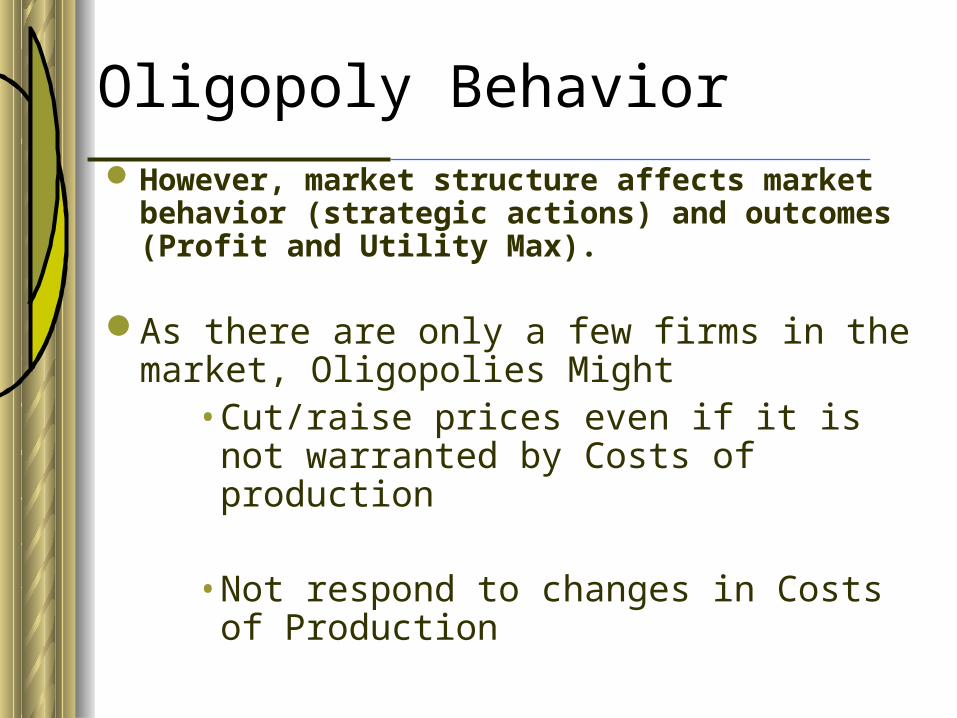
Oligopoly BehaviorHowever, market structure affects market
behavior (strategic actions) and outcomes (Profit and Utility Max).
As there are only a few firms in the market, Oligopolies Might
•Cut/raise prices even if it is not warranted by Costs of production
•Not respond to changes in Costs of Production
Oligopoly Behavior
Assume that the computer market has three oligopolists:
– Universal Electronics – World Computers – International Semiconductor
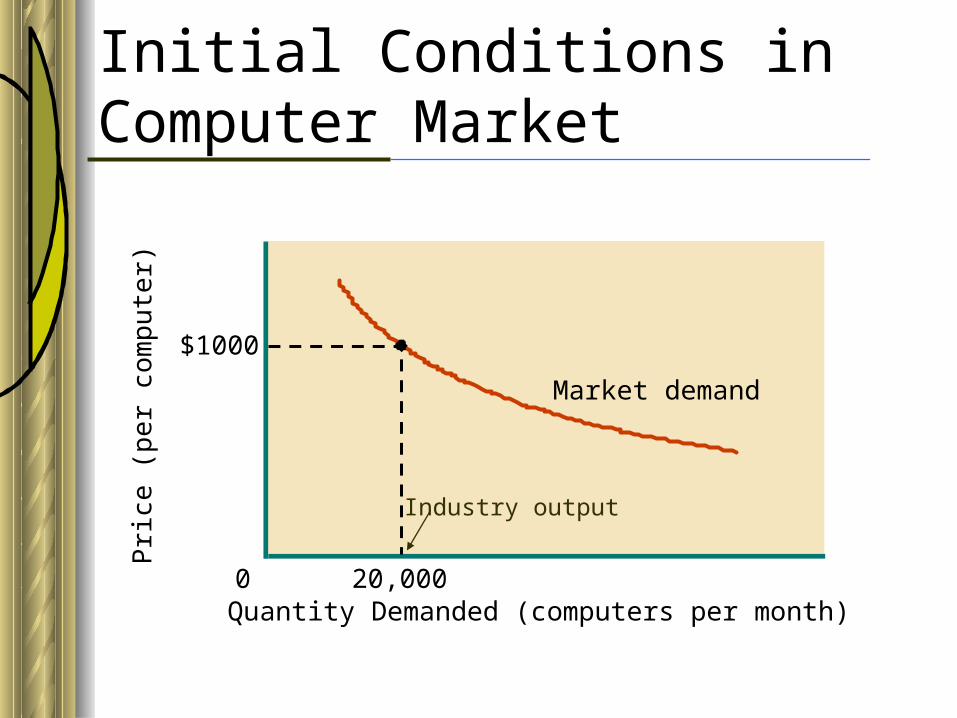
Initial Conditions in Computer Market
20,0000
$1000
Market demand
Quantity Demanded (computers per month)
Pri
ce (
per
com
pu
ter)
Industry output

Initial Equilibrium
Market share - The percentage of total market output produced by a single firm.
Consider that the data in the following table describes each firms market share
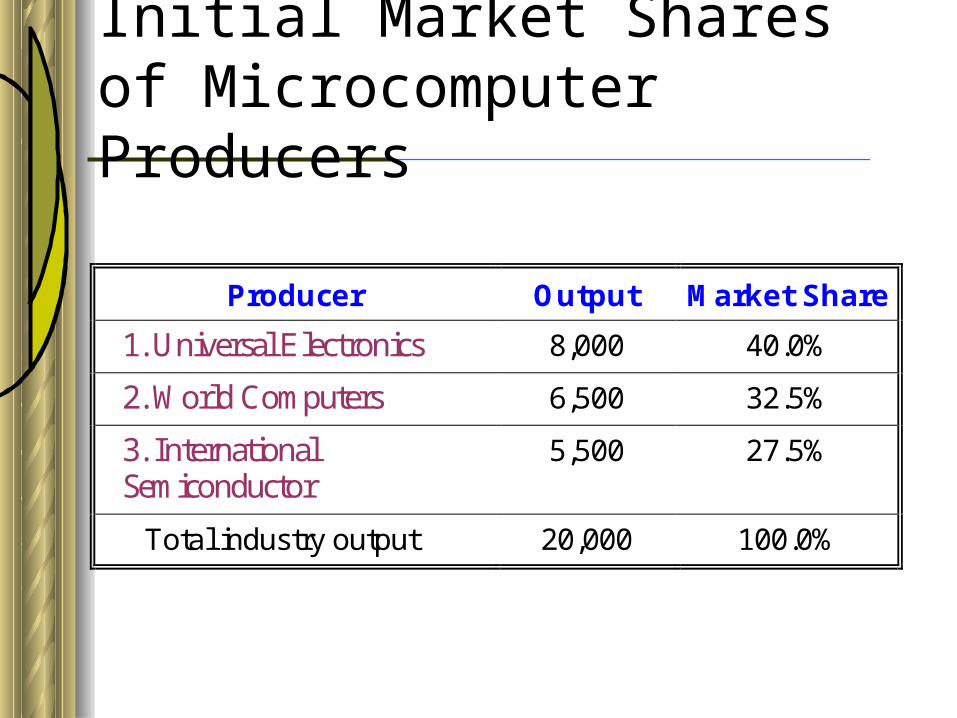
Initial Market Shares of Microcomputer Producers
Producer Output Market Share
1. Universal Electronics 8,000 40.0%
2. World Computers 6,500 32.5%
3. International Semiconductor
5,500 27.5%
Total industry output 20,000 100.0%
Pri
ce o
r C
ost
(dolla
rs p
er
unit
)
Quantity (units per period)0
Maximizing Oligopoly Profits
Industrymarginal
cost
Industry average
cost
Marketdemand
Industry marginalrevenue
Profits
J
Profit-maximizing
price
Average costat profit-
maximizingoutput
Profit-maximizing output

Battle for Market Shares
Given the above graph:– Will the profit be equally shared among
the three markets?
– If so, which producer will have higher share of the profit?
– What would those with the lower profit share do?
– How?
Increased Sales at Reduced Prices
It is possible that lowering price may expand total market sales and increase the sales of an individual firm without affecting the sales of its competitors.
There is no way that a firm can do so without causing alarms to go off in the industry.– There are few firms in the market, and
they closely follow each other’s action

Increased Sales at Reduced Prices
In an oligopoly, increased sales on the part of one firm will be noticed immediately by the other firms.
…because increase in the market share of one oligopolist necessarily reduces the shares of the remaining oligopolists
Retaliation
Oligopolists respond to aggressive marketing by competitors by either of the following methods.
1. Non-Price Competition– Step up marketing efforts
2. Price Competition– Cut prices on their product(s).
Retaliation—Non-Price
One way oligopolists market their products is through product differentiation.
– Product differentiation – Features that make one product appear different from competing products in the same market.
– This Could be Virtual (Artificial) or Real

Retaliation-Prices
Price War
However, an attempt by one oligopolist to increase its market share by cutting prices may lead to a general reduction in the market price….
!• This is why oligopolists always want to avoid price competition and thus pursue
nonprice competition.

Rivals’ Response to Price Reductions/IncreasesA typical characteristic of oligopoly is thus
the presence of close interdependence in the activities and decisions of firms in the market.
The presence of such close interdependence imposes limitations on price and output decisions of Oligopoly firms

Rivals’ Response to Price Reductions/Increases
The degree to which sales increase when the price is reduced by one Oligopolist thus depend on the response of the rival oligopolists.
We expect Oligopolists to match any price reductions by the rival oligopolist.
However, rival Oligopolists may not match a price increase ….why?– …..in order to gain market share.

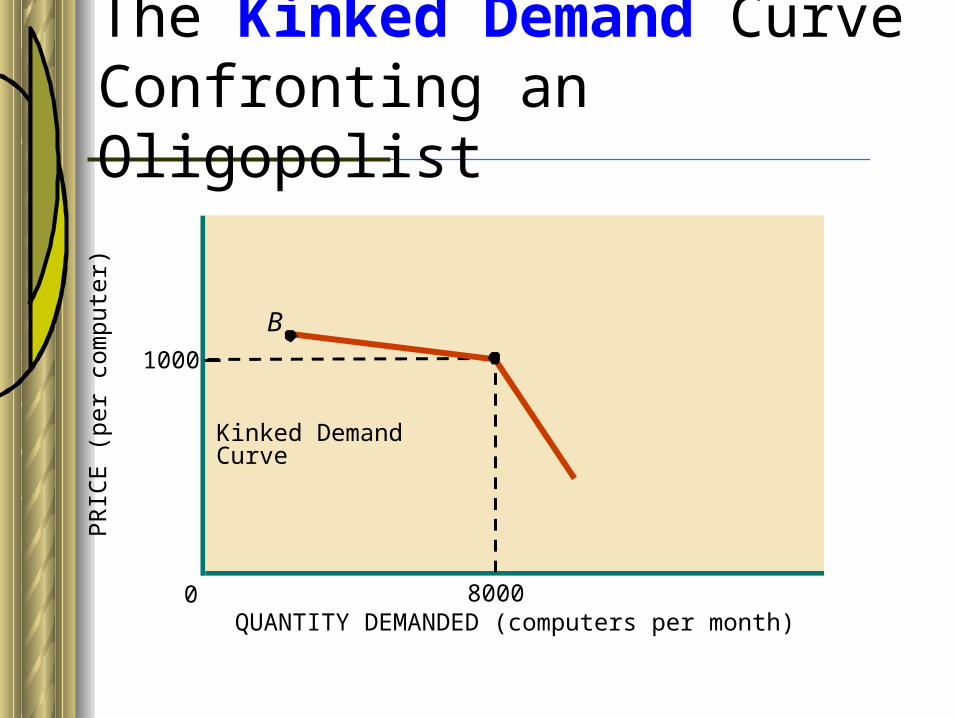
The Kinked Demand Curve Confronting an Oligopolist
The shape of the demand curve facing an oligopolist thus depends on how its rivals responded to a change in the price of its own output.
The demand curve will be kinked if rival oligopolists match price reductions but not price increases.

Pri
ce o
r C
ost
(dolla
rs p
er
unit
)
Quantity (units per period)0
Recall:The Starting Point
Industrymarginal
cost
Industry average
cost
Marketdemand
Industry marginalrevenue
Profits
J
Profit-maximizing
price
Average costat profit-
maximizingoutput
Profit-maximizing output

1000
PR
ICE (
per
com
pute
r)
QUANTITY DEMANDED (computers per month)0
The Demand Curve Confronting an Oligopolist….
Demand curve facing oligopolist if rivals match price changes
Demand curvefacing oligopolist ifrivals don't matchprice changes
Demand curve facing oligopolist if rivals match price cuts but not price hikes
MA
CD
B$1100
900
8000
1000
PR
ICE
(pe
r co
mpu
ter)
QUANTITY DEMANDED (computers per month)0
The Kinked Demand Curve Confronting an Oligopolist
Kinked Demand Curve
B
8000
Game Theory Oligopoly Price and Output Decisions are thus strategic!
Game theory is the study of decision making in situations where strategic interaction (moves and countermoves) between rivals occurs.
Each oligopolist considers the potential responses of rivals when formulating price or output strategies.
The payoff to an oligopolist’s price cut/increase depends on how its rivals respond.
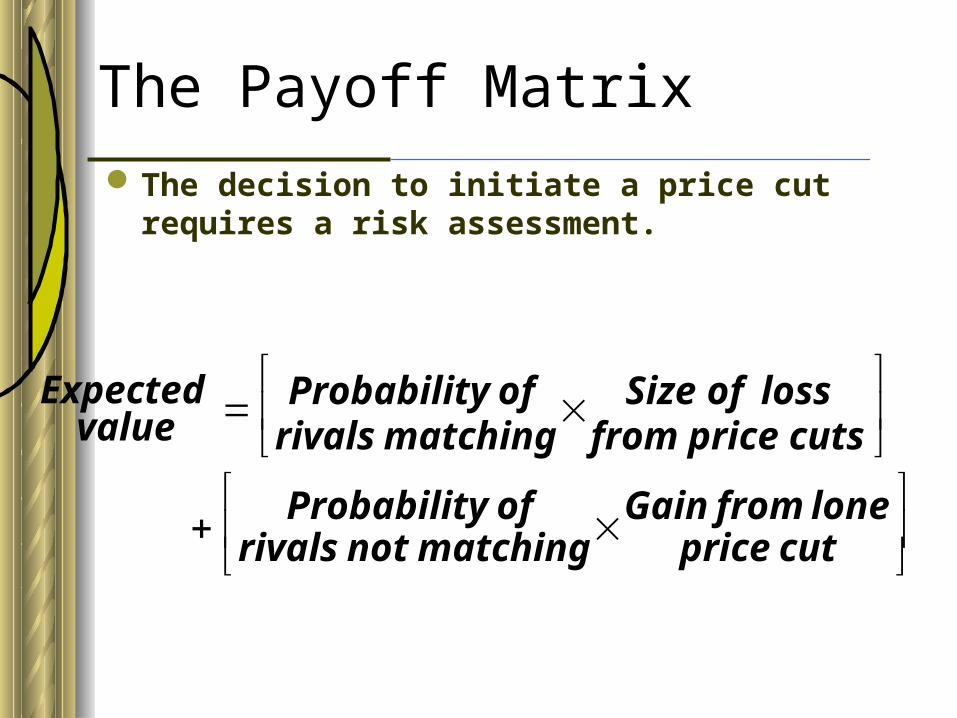
The Payoff Matrix
The decision to initiate a price cut requires a risk assessment.
cutsprice from loss ofSize
matchingrivals of Probability
valueExpected
cutprice lonefrom Gain
matching notrivals of Probability

Oligopoly Payoff Matrix
Rivals’ Actions
Universal’s Options Reduce Price Don’t Reduce Price
Reduce price Small loss for everyone
Huge gain for Universal; rivals lose
Don’t reduce price Huge loss for Universal; rivals gain
No change

Oligopoly vs. Competition
Thus oligopolists would want to coordinate their behavior in a way that maximizes industry profits.
– There is a Motive for Coordination
An oligopoly will want to behave like a monopoly, choosing a rate of industry output that maximizes total industry profit
Price and Output To maximize industry profit, the firms in
an oligopoly must agree:
1. on a monopoly price and maintain it,2. by limiting production and allocating
market shares.
• Cartel:• is a group of firms with an explicit
agreement to fix prices and output shares in a particular market.
• Example: OPEC

Sticky Prices
Prices in oligopoly industries tend to be stable.
Like all producers, oligopolists want to maximize profits by producing where MR = MC.
Sticky Prices
The kinked demand curve is really a composite of two separate demand curves.
• Creates a gap in an oligopolist’s marginal revenue (MR) curve.
– Marginal revenue – The change in total revenue that results from a one-unit increase in the quantity sold.

Sticky Prices
As a result, modest shifts of the cost curve will have no impact on the production decision of an oligopolists.
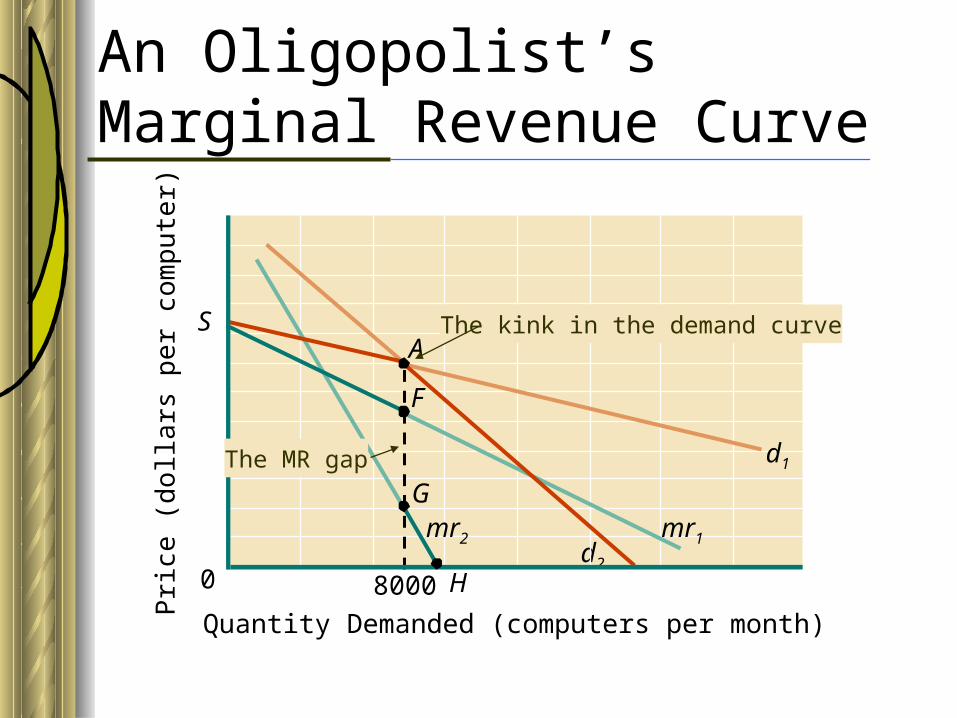
An Oligopolist’s Marginal Revenue Curve
A
G
Hd2
S
0 8000
Pri
ce (
dolla
rs p
er
com
pu
ter)
Quantity Demanded (computers per month)
mr2 mr1
d1
F
The kink in the demand curve
The MR gap
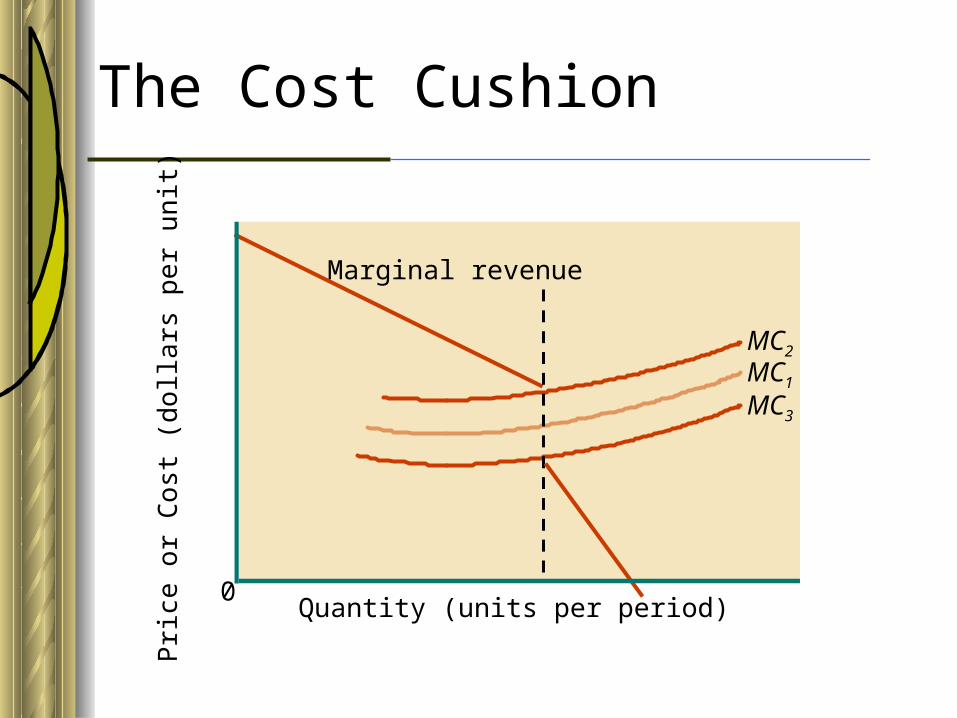
The Cost CushionPri
ce o
r C
ost
(d
olla
rs p
er
un
it)
MC2
MC1
MC3
Marginal revenue
0Quantity (units per period)
10.3. Coordination, Problems and the Government
– What problems oligopolists have in maintaining price and output levels?
Some Problems
There is an inherent conflict in the joint and individual interests of oligopolists.
– Each oligopolist wants the industry profits to be maximized.
– Each oligopolist also wants to maximize it’s own market share.
Coordination Problems
To avoid self-destructive behavior, each oligopolist must coordinate production decisions so that:
– Industry output and price are maintained at profit-maximizing levels.
– Each oligopolistic firm is content with its market share.

Price Fixing---Collusion
The most explicit form of coordination among oligopolists is called price fixing.
Price fixing is an explicit agreement among producers regarding the price(s) at which a good is to be sold.
Such an action is however, illegal (stifling competition)
Examples of Price Fixing
Electric Generators - In 1961, General Electric and Westinghouse were convicted of fixing prices on electrical generators.– They were charged again in 1972 for
continued price fixing.
School Milk – Between 1988 and 1991, the U.S. Justice Department filed charges against 50 companies for fixing the price of milk sold to public schools in 16 states.

Examples of Price Fixing
Vitamins – Seven firms from four nations were accused of fixing global prices on bulk vitamins from 1990 - 1998.
Baby Formula – Two makers of baby formula agreed to pay $5 million in 1992 to settle Florida charges that they had fixed prices on baby formula.
Cola – The Coca-Cola Bottling Co. of North Carolina agreed to pay a fine and give consumers discount coupons to settle charges of conspiring to fix soft-drink prices from 1982 to 1985.

Examples of Price FixingMusic CDs – In 2001, the FTC charged AOL-
Time Warner and Universal Music with fixing prices on the “Three Tenors” CD.
Laser Eye Surgery – The FTC charged VISX and Summit Technology with price-fixing that raised the price of surgery by $500 per eye.
Memory chips – In 2004, prosecutors claimed the world’s largest memory-chip (DRAM) makers (Samsung, Micron, and Infineon) fixed prices in the $16 billion-a-year market

Allocation of Market Shares
One way to allocate market share is a cartel agreement.
• A cartel is a group of firms with an explicit agreement to fix prices and output shares in a particular market.
Price Leadership
Price leadership is an oligopolistic pricing pattern that allows one firm to establish the market price for all firms in the industry.
Allocation of Market Shares
An oligopolist may resort to predatory pricing when market shares are not being divided in a satisfactory manner.
– Predatory pricing - temporary price reductions designed to alter market shares or drive out competition.

The Role of the Government

Antitrust Enforcement
Market failure is an imperfection in the market mechanism that prevents optimal outcomes.
Market power contributes to market failure when it leads to resource misallocations or greater inequity.
Antitrust law is government intervention designed to alter market structure or prevent abuse of market power.
Industry Behavior
There are several problems with the behavioral approach to antitrust law:
– Limited government resources.– Public apathy.– Difficulty of proving collusion.

Industry Structure
Public efforts to alter market structure have been less frequent than efforts to alter market behavior.
Objections to Antitrust
Some argue that we shouldn’t punish those who achieved monopolies through hard work and innovation.
Noncompetitive behavior, not industry structure, should be the only concern of antitrust.
The Herfindahl-Hirshman Index
For policy purposes, the Justice Department decided it would draw the line at a value of 1,800.

Contestability
If entry barriers were low enough, even a highly concentrated industry might be compelled to behave more competitively.
Behavioral Guidelines: Cost SavingsThe FTC now also looks to see if a proposed
merger will allow for greater efficiencies and lower costs.