on the cost of delayed currency fixing announcements · 2017-06-12 · on the cost of delayed...
TRANSCRIPT

On the Cost of Delayed Currency Fixing
Announcements∗
Christoph Becker
MathFinance AG
GERMANY
Uwe Wystup
HfB - Business School of Finance and Management
Sonnemannstrasse 9 - 11
60314 Frankfurt am Main
GERMANY
http://www.mathfinance.de
June 8 2005
Abstract
In Foreign Exchange Markets vanilla and barrier options are tradedfrequently. The market standard is a cutoff time of 10:00 a.m. in NewYork for the strike of vanillas and a knock-out event based on a continu-ously observed barrier in the inter bank market. However, many clients,particularly from Italy, prefer the cutoff and knock-out event to be basedon the fixing published by the European Central Bank on the Reuters PageECB37. These barrier options are called discretely monitored barrier op-tions. While these options can be priced in several models by varioustechniques, the ECB source of the fixing causes two problems. First ofall, it is not tradable, and secondly it is published with a delay of about 10- 20 minutes. We examine here the effect of these problems on the hedgeof those options and consequently suggest a cost based on the additionaluncertainty encountered.
∗We would like to thank Michael Braun, Ansua Dutta-Wystup, Thomas Heidorn, WolfgangSchmidt and Dagmar Wicht for their help and comments
1

2 Becker, C. and Wystup, U.
1 Introduction
1.1 The Currency Fixing of the European Central Bank
The European Central Bank (ECB) sets currency fixings every working day inFrankfurt at 2:15 p.m. Frankfurt time. The actual procedure of this fixing isdone by observing the spot rates in the inter bank market, in which the ECB alsoparticipates. Traders of the ECB in various locations get together to decide onhow to set the fixing. The quantity quoted is not a bid price or an offer price theECB or anybody else necessarily trades at, but is rather used for statistical andofficial means, for instance tax computation or economic research. An exampleof the ECB37 REUTERS screen is presented in Figure 1.
Figure 1: Reuters screen ECB37 of 21 February 2005 showing the fixings of all cur-rencies against EUR
Corporate treasures often prefer an independent source for currency exchangerates that provides a reference rate for their underlying under consideration.This way they are not bound to their own bank that might move the quotedcut-off rate in favor of their own position. The key features to stress are thefollowing.
1. The ECB fixing is not tradable.
2. The ECB fixing is published with a delay of 10-20 minutes.
On the Cost of Delayed Currency Fixing Announcements 3
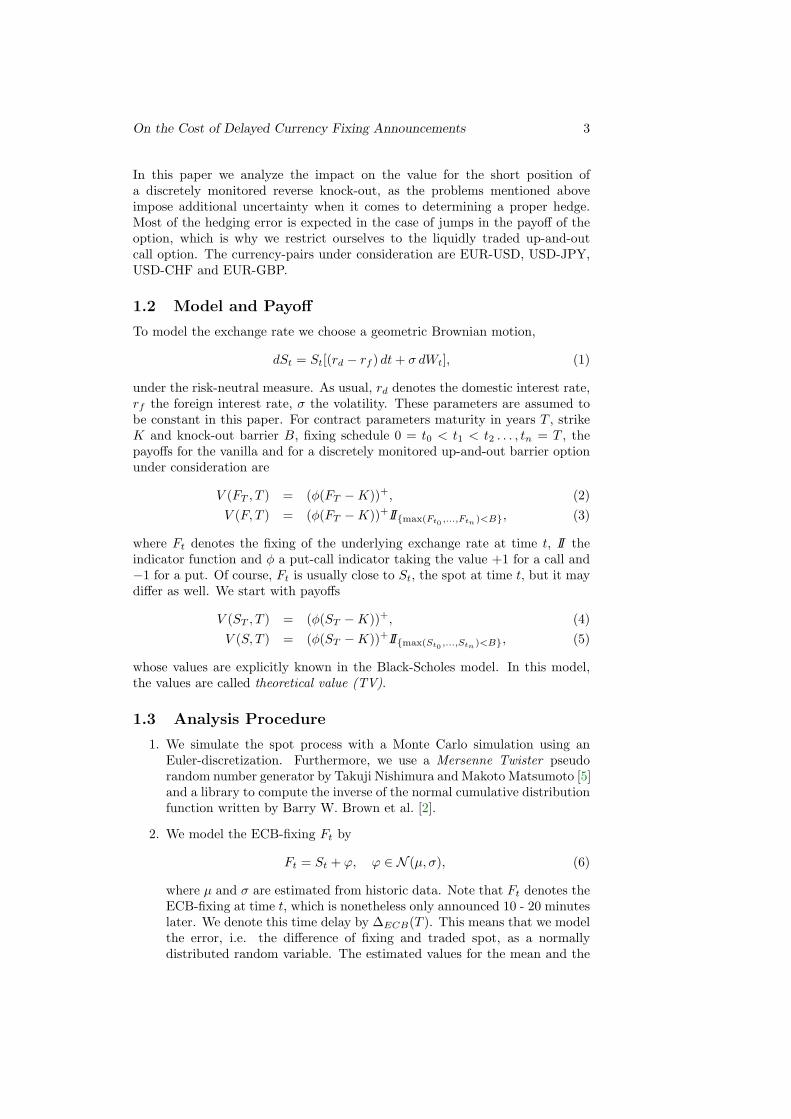
In this paper we analyze the impact on the value for the short position ofa discretely monitored reverse knock-out, as the problems mentioned aboveimpose additional uncertainty when it comes to determining a proper hedge.Most of the hedging error is expected in the case of jumps in the payoff of theoption, which is why we restrict ourselves to the liquidly traded up-and-outcall option. The currency-pairs under consideration are EUR-USD, USD-JPY,USD-CHF and EUR-GBP.
1.2 Model and Payoff
To model the exchange rate we choose a geometric Brownian motion,
dSt = St[(rd − rf ) dt + σ dWt], (1)
under the risk-neutral measure. As usual, rd denotes the domestic interest rate,rf the foreign interest rate, σ the volatility. These parameters are assumed tobe constant in this paper. For contract parameters maturity in years T , strikeK and knock-out barrier B, fixing schedule 0 = t0 < t1 < t2 . . . , tn = T , thepayoffs for the vanilla and for a discretely monitored up-and-out barrier optionunder consideration are
V (FT , T ) = (φ(FT −K))+, (2)V (F, T ) = (φ(FT −K))+II{max(Ft0 ,...,Ftn )<B}, (3)
where Ft denotes the fixing of the underlying exchange rate at time t, II theindicator function and φ a put-call indicator taking the value +1 for a call and−1 for a put. Of course, Ft is usually close to St, the spot at time t, but it maydiffer as well. We start with payoffs
V (ST , T ) = (φ(ST −K))+, (4)V (S, T ) = (φ(ST −K))+II{max(St0 ,...,Stn )<B}, (5)
whose values are explicitly known in the Black-Scholes model. In this model,the values are called theoretical value (TV).
1.3 Analysis Procedure
1. We simulate the spot process with a Monte Carlo simulation using anEuler-discretization. Furthermore, we use a Mersenne Twister pseudorandom number generator by Takuji Nishimura and Makoto Matsumoto [5]and a library to compute the inverse of the normal cumulative distributionfunction written by Barry W. Brown et al. [2].
2. We model the ECB-fixing Ft by
Ft = St + ϕ, ϕ ∈ N (µ, σ), (6)
where µ and σ are estimated from historic data. Note that Ft denotes theECB-fixing at time t, which is nonetheless only announced 10 - 20 minuteslater. We denote this time delay by ∆ECB(T ). This means that we modelthe error, i.e. the difference of fixing and traded spot, as a normallydistributed random variable. The estimated values for the mean and the

4 Becker, C. and Wystup, U.
standard-deviation of the quantity Spot - ECB Fixing from historic timeseries are listed in Table 1. For the cross rates, where EUR is not one ofthe currencies, we take the respective ratios of fixings against EUR, e.g.for the USD/JPY fixing we divide the EUR/JPY fixing by the EUR/USDfixing, which is also common market practise in trade confirmations.
Currency pair Expected value Standard deviation Time horizon
EUR / USD -3.125E-6 0.0001264 23.6 - 08.8.04
USD / YEN -4.883E-3 0.0134583 22.6 - 26.8.04
USD / CHF -1.424E-5 0.0001677 11.5 - 26.8.04
EUR / GBP -1.33E-5 0.00009017 04.5 - 26.8.04
Table 1: Estimated values for mean and standard-deviations of the quantitySpot - ECB-fixing from historic time series. The time series were provided byCommerzbank AG
3. We evaluate the payoffs for barrier options for each path and run thesimulations with the appropriate delta hedge quantities to hold. Then wecompute for each path the error encountered due the fixing being differentfrom the spot, and then average over all paths.
4. We do this for various currency pairs, parameter scenarios, varying therates, volatilities, maturities, barriers and strikes. We expect a significantimpact particularly for reverse knock-out barrier options due to the jumpof the payoff and hence the large delta hedge quantity.
2 Error Estimation
Note that since we expect the resulting errors to be fairly small, we introduce abid/offer-spread δ for the spot, which is of the size of 2 basis points in the interbank market. We consider the following options in detail.
2.1 European Style up-and-out Call
To determine the possible hedging error we propose the following to be appro-priate. Note that the error is measured for a nominal of 1 unit of the underlying.We consider three cases.
1. Let ST ≤ K. In this case, the seller who is short the option decides notto hedge as the option is probably out of the money, i.e. delta = 0. Ifthe option turns out to be in the money, i.e. FT > K, the holder of theshort position faces a P&L of K − (S(T + ∆ECB(T )) + δ) (units of thebase currency).
2. Let ST > K and ST < B. Hence, one assumes that the option is in themoney and delta is 1. If now FT ≤ K or FT ≥ B, there is a P&L ofS(T + ∆ECB(T ))− (S(T ) + δ).

On the Cost of Delayed Currency Fixing Announcements 5
3. Let ST ≥ B and FT < B. Here we have a P&L of K−(S(T +∆ECB(T ))+δ). Note that other than in the first case, this P&L is of order K −B dueto the jump in the payoff.
2.2 Discretely Monitored up-and-out Call
We consider a time to maturity of one year with 250 knock-out-events, i.e., thepossible knock out occurs every working day at 2:15 p.m. Frankfurt time, whenthe ECB fixes the reference rate of the underlying currency pair. We proposethe following error determination to be appropriate. First of all, we adopt theprocedure above for the maturity time. In addition, we consider every knock-out-event and examine the following cases.
1. Let St < B and Ft ≥ B. At time t the trader holds ∆(St) shares of stockin the delta hedge. He does not unwind the hedge at time t, as the spot isbelow the barrier. Only after the fixing announcement, it turns out thatthe hedge needs to be unwound, so he does this with delay and encountersa P&L of
∆(St) · (St+∆ECB(T ) − St), (7)
where ∆(St) denotes the theoretical delta of the option under consider-ation, if the spot is at St. To see this, it is important to note, that thetheoretical delta is negative if the underlying is near the barrier B. In thisway, the seller of the option has been short the underlying at time t andmust buy it in t+∆ECB(T ) minutes to close out the hedge. Therefore, hemakes profit if the underlying is cheaper in t+∆ECB(T ), which is reflectedin our formula. We shall elaborate later how to compute the theoreticaldelta, but we would like to point out that whenever we need a spot priceat time t to calculate such a delta or to compute the value of a hedge, werefer to S as the tradable instrument instead of the contractually specifiedunderlying F in order to account for the ECB fixing being non-tradable.
2. Let St ≥ B and Ft < B. Here the seller of the option closed out thehedge at time t, though she shouldn’t have done so, and in t + ∆ECB(T )she needs to build a new hedge. Note again that the theoretical delta isnegative. This means that at time t the seller bought the underlying withthe according theoretical delta-quantity, and in t + ∆ECB(T ) she goesshort the underlying with the appropriate new delta-quantity. The profitand loss (P&L) is calculated via
P&L = ∆(St) · (St + δ)−∆(St+∆ECB(T )) · St+∆ECB(T ) (8)
The other cases do not lead to errors due to an unexpected fixing announcement.Of course, delta hedging an option in the Black-Scholes model can lead to errors,because of hedge adjustments at discrete times and and because of model riskin general, see, e.g. [1].

6 Becker, C. and Wystup, U.
2.3 Calculating the Delta-Hedge Quantity
The valuation of continuously monitored barrier options has been treated, e.g.,in [3]. In order to compute the theoretical delta for the discretely monitored up-and-out call, for which no closed-form solution is known, in acceptable time andprecision, we refer to an approximation proposed by Per Horfelt in [4], whichworks in the following way. Assume the value of the spot is observed at timesiT/n, i = 0, . . . , n, and the payoff of the discretely monitored up-and-out call isgiven by Equation (5). We define the value and abbreviations
θ±∆=
rd − rf ± σ2/2σ
√T , (9)
c∆=
ln(K/S0)σ√
T, (10)
d∆=
ln(B/S0)σ√
T, (11)
β∆= −ζ(1/2)/
√(2π) ≈ 0.5826, (12)
where ζ denotes the Riemann zeta function. We define the function
F+(a, b; θ) ∆= N (a− θ)− e2bθN (a− 2b− θ) (13)
and obtain for the value of the discretely monitored up-and-out call
V (S0, 0) ≈ S0e−rf T
[F+(d, d + β/
√n; θ+)− F+(c, d + β/
√n; θ+)
](14)
−Ke−rdT[F+(d, d + β/
√n; θ−)− F+(c, d + β/
√n; θ−)
].
Using this approximation for the value, we take a finite difference approach forthe computation of the theoretical delta,
∆ = VS(S, t) ≈ V (S + ε, t)− V (S − ε, t)2ε
. (15)
3 Analysis of EUR-USD
Considering the simulations for a maturity T of one year, huge hedging errorscan obviously only occur near the barrier. The influence of the strike is com-paratively small, as we discussed in the error determination procedure above.In this way we chose the values listed in Table 2 to remain constant and onlyto vary the barrier.Using Monte Carlo simulations with one million paths we show the average ofthe profit and loss with 99.9% confidence bands and how the probability of amishedge depends on the position of the barrier in Figure 2. It appears thatthe additional costs for the short position are negligible. We also learn that themishedge is larger for a barrier in a typical traded distance from the spot, i.e.not too close and not too far.In Figure 3 we plot the barrier against the ratio Hedging Error / TV of the up-and-out call and the ECB-fixing as underlying. This relationship is an importantmessage for the risk-averse trader. For a one-year reverse knock-out call we seean average relative hedge error below 5% of TV if the barrier is at least 4 big

On the Cost of Delayed Currency Fixing Announcements 7
Spot 1.2100
Strike 1.1800
Trading days 250
Domestic interest rate 2.17% (USD)
Foreign interest rate 2.27% (EUR)
Volatility 10.4%
Time to maturity 1 year
Notional 1,000,000 EUR
Table 2: EUR-USD testing parameters
Hedge error with 99.9% - confidence interval
-20
-18
-16
-14
-12
-10
-8
-6
-4
-2
01.22 1.24 1.26 1.28 1.3 1.32 1.34 1.36 1.38 1.4 1.42 1.44 1.46
barrier
error
error in USDconfidence band
Probability of mishedging
0.00%
2.00%
4.00%
6.00%
8.00%
10.00%
12.00%
14.00%
1.22 1.24 1.26 1.28 1.3 1.32 1.34 1.36 1.38 1.4 1.42 1.44 1.46barrier
pro
bab
ility
Figure 2: Additional average hedge costs and probability of a mishedge for the shortposition of a discretely monitored up-and-out call in EUR-USD
Rel. hedge error with 99.9% bands
-120.00%
-100.00%
-80.00%
-60.00%
-40.00%
-20.00%
0.00%
1.22
1.24
1.26
1.28 1.3 1.3
21.3
41.3
61.3
8 1.4 1.42
1.44
1.46
barrier
pro
bab
ility
errorconfidence band
Rel. hedge error with 99.9% bands
-4.50%
-4.00%
-3.50%
-3.00%
-2.50%
-2.00%
-1.50%
-1.00%
-0.50%
0.00%1.25 1.27 1.29 1.31 1.33 1.35 1.37 1.39 1.41 1.43 1.45
barrier
pro
bab
ility
errorconfidence band
Figure 3: Hedging Error /TV for a discretely monitored up-and-out call in EUR-USD
figures away from the spot. Traders usually ask for a risk premium of 10 basispoints.

8 Becker, C. and Wystup, U.
Finally, we would like to point out that the average loss is not the full storyas an average is very sensitive to outliers. Therefore, we present in Figure 4the distribution of the maximal profits and losses, both in absolute as well asin relative numbers. The actual numbers are presented in Table 3. We havefound other parameter scenarios to behave similarly. The crucial quantity isthe intrinsic value at the knock-out barrier. The higher this value, the moredangerous the trade. In particular we do not exhibit the results for the vanillaas there is hardly anything to see. Varying rates and volatilities do not yieldany noticeably different results.
-300000
-250000
-200000
-150000
-100000
-50000
0
50000
P & L
1.22 1.25 1.28 1.31 1.34 1.37 1.4 1.43 1.46barrier
Extremal P & L for the short position
max downside errormax. upside error
Relative P & L
-45000%
-40000%
-35000%
-30000%
-25000%
-20000%
-15000%
-10000%
-5000%
0%
5000%1.2
41.2
61.2
81.3 1.3
21.3
41.3
61.3
81.4 1.4
21.4
41.4
6
barrier
P &
L in
US
D
max downside errormax upside error
Figure 4: Absolute and relative maximum profit and loss distribution for a discretelymonitored up-and-out call in EUR-USD. The upside error is the unexpected gain atrader will face. The downside error is his unexpected loss. On average the loss seemssmall, but the maximum loss can be extremely high. The effect is particularly dramaticfor knock-out calls with a large intrinsic value at the barrier as shown in the left handside. The right hand side shows the maximum gain and loss relative to the TV. Ofcourse, the further the barrier is away from the spot, the smaller the chance of hedgingerror occurring.
barrier 1.2500 <1k$ <2k$ <3k$ <39k$ <40k$ <41k$ <42k$ <43k$
upside error 951744 20 1 0 0 0 0 0
downside error 48008 54 2 5 59 85 21 1
barrier 1.3000 <1k$ < 2k$ < 3k$ <89k$ < 90k$ <91k$ <92k$
upside error 974340 20 1 0 0 0 0
downside error 25475 43 0 2 40 59 20
barrier 1.4100 <1k$ <2k$ <3k$ <199k$ <200k$ <201k$ <202k$ <203k$
upside error 994854 78 0 0 0 0 0 0
downside error 4825 194 3 1 19 17 8 1
Table 3: EUR-USD distribution of absolute errors in USD. The figures are thenumber of occurrences out of 1 million. For instance, for the barrier at 1.2500,there are 54 occurrences out of 1 million, where the trader faces a loss between1000 and 2000 $.
As the analysis of the other currency pairs is of similar nature, we list it in theappendix and continue with the conclusion.

On the Cost of Delayed Currency Fixing Announcements 9
4 Conclusion
We have seen that even though a trader can be in a time interval where he doesnot know what delta hedge he should hold for an option due to the delay ofthe fixing announcement, the loss encountered is with probability 99.9% withinless than 5% of the TV for usual choices of barriers and strikes and the liquidcurrency pairs, in which complex barrier options such as a discretely monitoredup-and-out call are traded. However, the maximum loss quantity in case of ahedging error can be rather substantial. So in order to take this into account, itappears generally sufficient to charge a maximum of 10% of the TV to cover thepotential loss with probability 99.9%. This work shows that the extra premiumof 10 basis points per unit of the notional of the underlying, which traders argueis needed when the underlying is the ECB-fixing instead of the spot, is justifiedand well in line with our results. However, charging 10 basis points extra maybe easy to implement, but is not really precise as we have seen, since the errordepends heavily on the distance of the barrier from the spot.Of course the level of complexity of the model can be elaborated further arbi-trarily, but using a geometric Brownian motion and a Monte Carlo simulationappears sufficient. The relative errors are small enough not to pursue any furtherinvestigation concerning this problem.
10 Becker, C. and Wystup, U.
5 Appendix
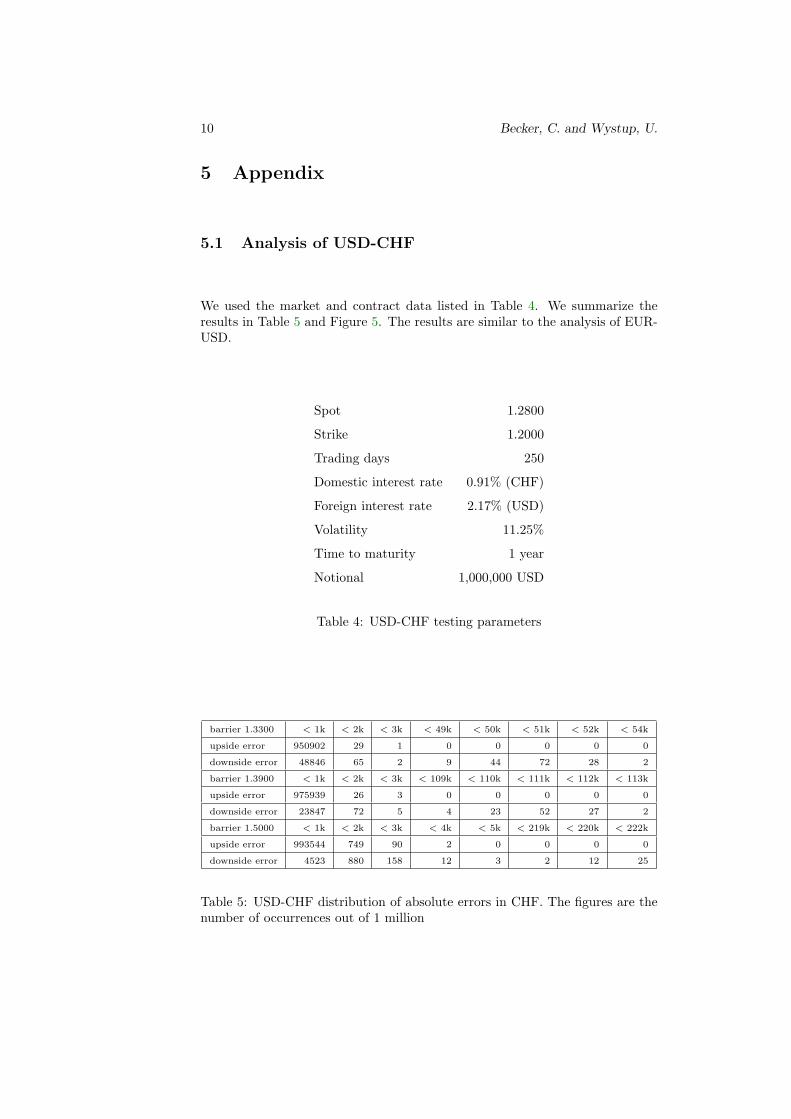
5.1 Analysis of USD-CHF
We used the market and contract data listed in Table 4. We summarize theresults in Table 5 and Figure 5. The results are similar to the analysis of EUR-USD.
Spot 1.2800
Strike 1.2000
Trading days 250
Domestic interest rate 0.91% (CHF)
Foreign interest rate 2.17% (USD)
Volatility 11.25%
Time to maturity 1 year
Notional 1,000,000 USD
Table 4: USD-CHF testing parameters
barrier 1.3300 < 1k < 2k < 3k < 49k < 50k < 51k < 52k < 54k
upside error 950902 29 1 0 0 0 0 0
downside error 48846 65 2 9 44 72 28 2
barrier 1.3900 < 1k < 2k < 3k < 109k < 110k < 111k < 112k < 113k
upside error 975939 26 3 0 0 0 0 0
downside error 23847 72 5 4 23 52 27 2
barrier 1.5000 < 1k < 2k < 3k < 4k < 5k < 219k < 220k < 222k
upside error 993544 749 90 2 0 0 0 0
downside error 4523 880 158 12 3 2 12 25
Table 5: USD-CHF distribution of absolute errors in CHF. The figures are thenumber of occurrences out of 1 million

On the Cost of Delayed Currency Fixing Announcements 11
Hedge error with 99,9% confidence intervall
-25
-20
-15
-10
-5
0
1.29
1.31
1.33
1.35
1.37
1.39
1.41
1.43
1.45
1.47
1.49
barrier
hed
ge
erro
r in
CH
F
hedge errorconfidence intervall
Probability to mishedge
0.00%
2.00%
4.00%
6.00%
8.00%
10.00%
12.00%
14.00%
16.00%
1.29 1.3 1.3
11.3
21.3
31.3
41.3
51.3
61.3
71.3
81.3
9 1.4 1.41
1.42
1.43
1.44
1.45
1.46
1.47
1.48
1.49 1.5
barrier
pro
bab
ility
relative hedge error
-160.00%
-140.00%
-120.00%
-100.00%
-80.00%
-60.00%
-40.00%
-20.00%
0.00%
1.29
1.31
1.33
1.35
1.37
1.39
1.41
1.43
1.45
1.47
1.49
barrier
erro
r/T
V
rel errorconfidence intervall
relative hedge error
-14.00%
-12.00%
-10.00%
-8.00%
-6.00%
-4.00%
-2.00%
0.00%
1.31
1.33
1.35
1.37
1.39
1.41
1.43
1.45
1.47
1.49
barrier
erro
r/T
V
rel errorconfidence intervall
Extremal P & L for the short position
-250000
-200000
-150000
-100000
-50000
0
50000
1.29
1.31
1.33
1.35
1.37
1.39
1.41
1.43
1.45
1.47
1.49
barrier
P &
L
upside errordownside error
Extremal relative P & L
-60000%
-50000%
-40000%
-30000%
-20000%
-10000%
0%
10000%1.3
11.3
31.3
51.3
71.3
91.4
11.4
31.4
51.4
71.4
9
barrier
rel.
P &
L in
CH
F
max rel upside errormax rel downside err
Figure 5: Analysis of the discretely monitored up-and-out call in USD-CHF

12 Becker, C. and Wystup, U.
5.2 Analysis of USD-JPY
We used the market and contract data listed in Table 6. Again the analysislooks very much like the EUR-USD case. We summarize the results in Table 7and Figure 6.
Spot 110.00
Strike 100.00
Trading days 250
Domestic interest rate 0.03% (JPY)
Foreign interest rate 2.17% (USD)
Volatility 9.15%
Time to maturity 1 year
Notional 1,000,000 USD
Table 6: USD-JPY testing parameters
barrier 133.00 < 10k <20k < 30k < 40k < 50k < 60k < 70k
upside error 949563 957 29 34 18 20 19
downside error 47623 1260 32 25 23 23 21
barrier 133.00 < 80k < 155k < 175k more
upside error 21 39 3 0
downside error 13 34 0 234
Table 7: USD-JPY distribution of absolute errors in JPY. The figures are thenumber of occurrences out of 1 million
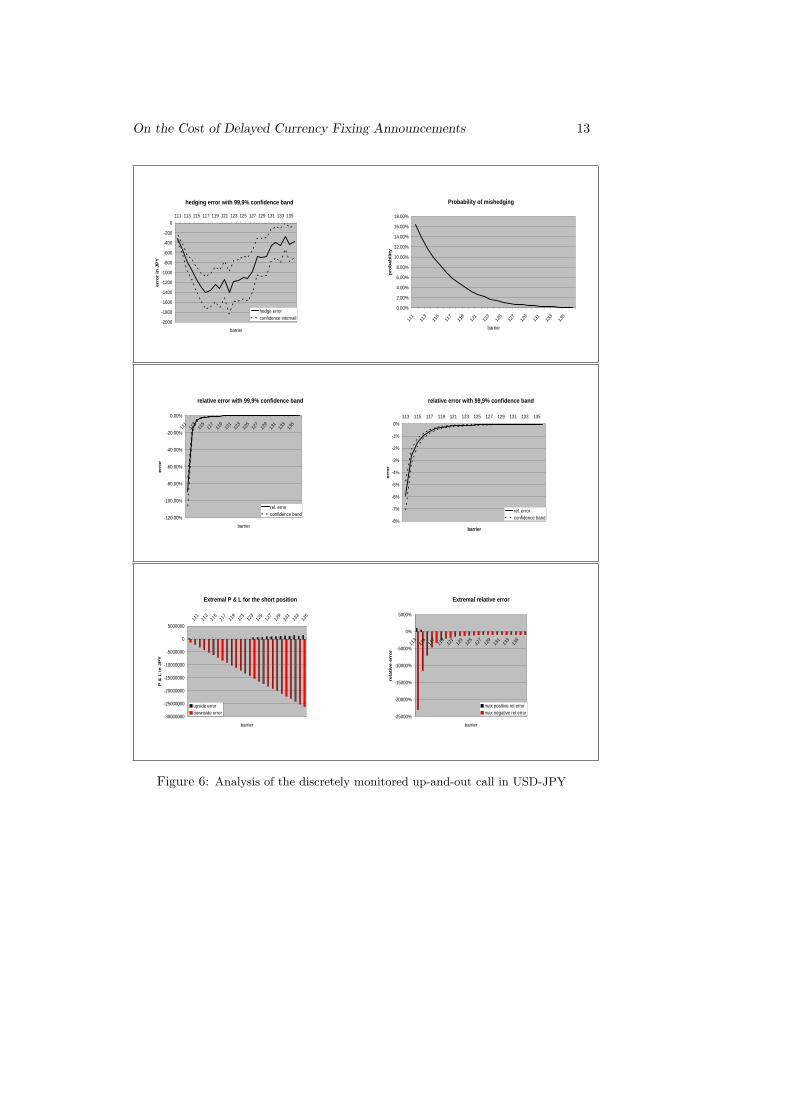
On the Cost of Delayed Currency Fixing Announcements 13
hedging error with 99,9% confidence band
-2000
-1800
-1600
-1400
-1200
-1000
-800
-600
-400
-200
0111 113 115 117 119 121 123 125 127 129 131 133 135
barrier
erro
r in
JP
Y
hedge errorconfidence intervall
Probability of mishedging
0.00%
2.00%
4.00%
6.00%
8.00%
10.00%
12.00%
14.00%
16.00%
18.00%
111
113
115
117
119
121
123
125
127
129
131
133
135
barrier
pro
bab
ility
relative error with 99,9% confidence band
-120.00%
-100.00%
-80.00%
-60.00%
-40.00%
-20.00%
0.00%
111
113
115
117
119
121
123
125
127
129
131
133
135
barrier
erro
r
rel. errorconfidence band
relative error with 99,9% confidence band
-8%
-7%
-6%
-5%
-4%
-3%
-2%
-1%
0%113 115 117 119 121 123 125 127 129 131 133 135
barrier
erro
r
rel. errorconfidence band
Extremal P & L for the short position
-30000000
-25000000
-20000000
-15000000
-10000000
-5000000
0
500000011
111
311
511
711
912
112
312
512
712
913
113
313
5
barrier
P &
L in
JP
Y
upside errordownside error
Extremal relative error
-25000%
-20000%
-15000%
-10000%
-5000%
0%
5000%
113
115
117
119
121
123
125
127
129
131
133
135
barrier
rela
tive
err
or
max positive rel errormax negative rel error
Figure 6: Analysis of the discretely monitored up-and-out call in USD-JPY

14 Becker, C. and Wystup, U.
5.3 Analysis of EUR-GBP
To compare we take now EUR-GBP as a currency pair without the USD. Weused the market and contract data listed in Table 8. Again, we observe the usualpicture, i.e., a similar hedging error curvature as in EUR-USD. We summarizethe results in Table 9 and Figure 7.
Spot 0.6700
Strike 0.6700
Trading days 250
Domestic interest rate 5.17% (GBP)
Foreign interest rate 2.27% (EUR)
Volatility 7.65%
Time to maturity 1 year
Notional 1,000,000 EUR
Table 8: EUR-GBP testing parameters
barrier 0.7100 < 1k < 2k < 4k0 < 41k < 42k
upside error 950005 0 0 0 0
downside error 49711 3 59 220 2
barrier 0.7400 < 1k < 2k < 7k0 < 71k < 72k
upside error 978884 139 0 0 0
downside error 20493 273 48 162 1
barrier 0.7800 < 1k < 2k < 3k < 4k < 5k
upside error 994032 678 122 11 2
downside error 4001 860 183 27 2
barrier 0.7800 < 109k < 11k0 < 111k < 112k < 114k
upside error 0 0 0 0 0
downside error 1 15 63 2 1
Table 9: EUR-GBP distribution of absolute errors in GBP. The figures are thenumber of occurrences out of 1 million

On the Cost of Delayed Currency Fixing Announcements 15
Hedge error with 99,9% confidence band
-25
-20
-15
-10
-5
0
50.6
80.7 0.7
20.7
40.7
60.7
80.8 0.8
20.8
40.8
60.8
80.9 0.9
2
barrier
erro
r in
GB
P
hedge errorconfidence band
probability of mishedging
0.00%
2.00%
4.00%
6.00%
8.00%
10.00%
12.00%
14.00%
16.00%
18.00%
20.00%
0.68 0.7 0.7
20.7
40.7
60.7
8 0.8 0.82
0.84
0.86
0.88 0.9 0.9
2
barrier
prob
abili
ty
probability
rel hedge error with 99,9% confidence band
-30.00%
-25.00%
-20.00%
-15.00%
-10.00%
-5.00%
0.00%
5.00%
0.68 0.7 0.7
20.7
40.7
60.7
8 0.8 0.82
0.84
0.86
0.88 0.9 0.9
2
barrier
erro
r
rel hedge errorconfidence band
rel hedge error with 99,9% confidence band
-1.80%
-1.60%
-1.40%
-1.20%
-1.00%
-0.80%
-0.60%
-0.40%
-0.20%
0.00%
0.20%0.7 0.7
20.7
40.7
60.7
80.8 0.8
20.8
40.8
60.8
80.9 0.9
2
barrier
erro
r
rel hedge errorconfidence band
Extremal P & L for the short position
-250000
-200000
-150000
-100000
-50000
0
500000.6
80.7 0.7
20.7
40.7
60.7
80.8 0.8
20.8
40.8
60.8
80.9 0.9
2
barrier
P &
L
upside errordownside error
Relative P & L
-2500%
-2000%
-1500%
-1000%
-500%
0%
500%0.7
10.7
30.7
50.7
70.7
90.8
10.8
30.8
50.8
70.8
90.9
1
barrier
P &
L in
GB
P
max upside errormax downside error
Figure 7: Analysis of the discretely monitored up-and-out call in EUR-GBP
16 Becker, C. and Wystup, U.
References
[1] Anagnou-Basioudis, I. and Hodges, S. (2004) Derivatives Hedging andVolatility Errors. Warwick University Working Paper.
[2] Brown, B., Lovato, J. and Russell, K. (2004). CDFLIB- C++ - library, http://www.csit.fsu.edu/~burkardt/cpp_src/dcdflib/dcdflib.html
[3] Fusai G. and Recchioni, C. (2003). Numerical Valuation of Discrete Bar-rier Options Warwick University Working Paper.
[4] Horfelt, P. (2003). Extension of the corrected barrier approximation byBroadie, Glasserman, and Kou. Finance and Stochastics, 7, 231-243.
[5] Matsumoto, M. (2004). Homepage of Makoto Matsumoto on the serverof the university of Hiroshima: http://www.math.sci.hiroshima-u.ac.jp/~m-mat/eindex.html