on the cusp of change
TRANSCRIPT
MAY 2017
Manuel Orozco and Julia Yansura Inter-American Dialogue
On the Cusp of Change: Migrants’ use of the internet for remittance transfers
and financial access
© 2017 Inter-American Dialogue 2
Introduction This study presents the findings of a migrant survey conducted in November 2016 about remittances, new technologies, and financial access among Latin American migrants in the United States. The survey is part of the Inter-American Dialogue’s ongoing research about migrant remittance transfers and issues of economic inclusion in the United States. The findings continue to support the importance of financial access through competition, internet-based technology applications as payment vehicles, and their link to a broad range of financial services. Central to market competition and financial access are technologies that make payment systems more efficient and compliant. Specifically, while financial access enables people to handle their financial demands, the tools for access include the use of a wide arrange of services, the accessibility to a wide range of banking and non-banking financial institutions, compliance with rules enforcing financial practices, and technological innovation that provides usable payment instruments. Among the key findings of the study,
• For the most part, migrants continue to remit the same amounts of money and at the same frequency;
• More than 75% of migrants are satisfied or very satisfied with their current remittance service provider (RSP);
• Five and a half percent of migrants are using online transfers, an increase from 0.4% in 2006;
• Twenty-four percent of migrants have deposited their remittance into a bank account on the receiving end;
• Nine percent of migrants have used mobile or internet transfers at one point, and two thirds of these respondents continue to use online or mobile sending methods;
• Forty-two percent would like to switch from cash-to-cash methods into electronic-funded account systems (31% using their bank accounts);
• Forty-four percent of migrants who have a bank account in their home country have sent a remittance to be directly deposited to a bank account;
• Sixty-nine percent of migrants have bank accounts in the United States, a substantial increase from mid-2000 when this figure was only 30%;
• More than half of migrants with bank accounts also use non-banking financial services;
• More than one in ten migrants are what we would call financially underserved; that is to say, they do not have bank accounts, nor do they use alternative financial services from nonbanking financial institutions (NBFIs).
These findings reflect major changes over time. In our 2004 All in the Family taskforce report, one of the recommendations from the members was “reducing barriers to innovations in technology and organization,” and “focusing policy and advocacy efforts on getting remittance senders and recipients—indeed, all citizens and residents—to open and use bank accounts.”1 As of today, competition has expanded, and more migrants have been able to open bank accounts. Because the world is not static, there are new challenges, however, that migrants face with regards to sending money home, including furthering the adoption of advanced payment technologies.
1 All in the family taskforce report, pg 9.
© 2017 Inter-American Dialogue 3
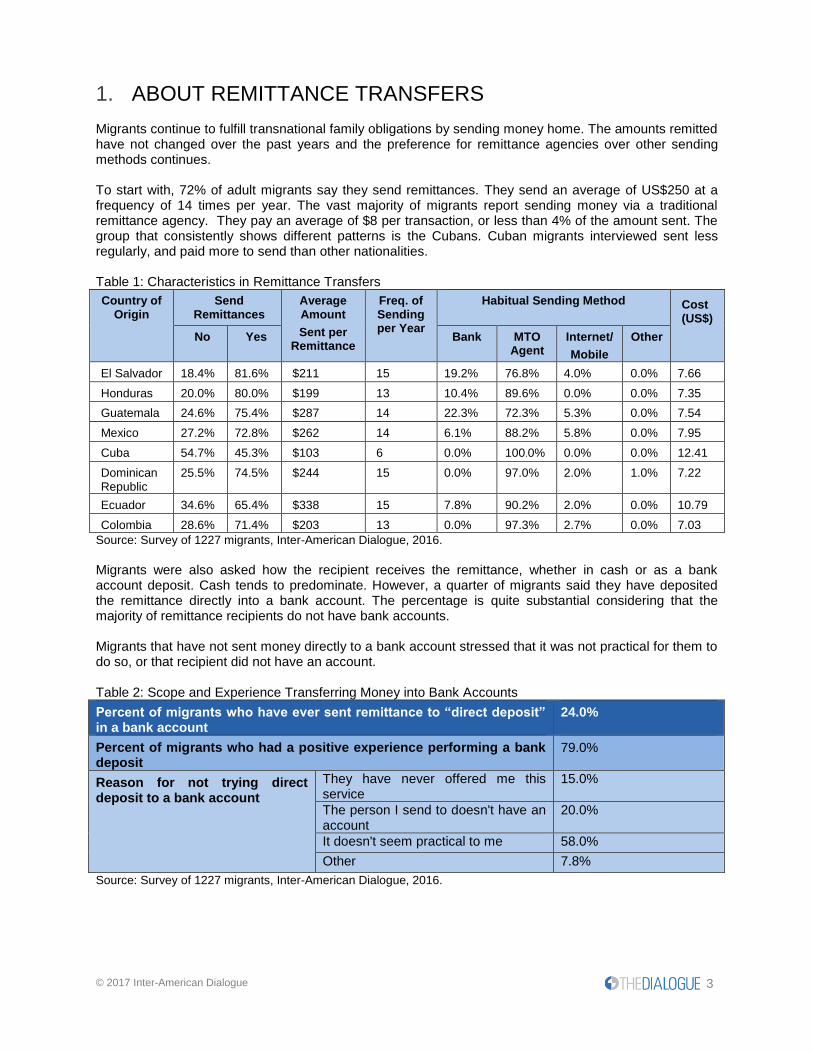
1. ABOUT REMITTANCE TRANSFERS Migrants continue to fulfill transnational family obligations by sending money home. The amounts remitted have not changed over the past years and the preference for remittance agencies over other sending methods continues. To start with, 72% of adult migrants say they send remittances. They send an average of US$250 at a frequency of 14 times per year. The vast majority of migrants report sending money via a traditional remittance agency. They pay an average of $8 per transaction, or less than 4% of the amount sent. The group that consistently shows different patterns is the Cubans. Cuban migrants interviewed sent less regularly, and paid more to send than other nationalities. Table 1: Characteristics in Remittance Transfers
Country of Origin
Send Remittances
Average Amount
Sent per Remittance
Freq. of Sending per Year
Habitual Sending Method Cost (US$)
No Yes Bank MTO Agent
Internet/
Mobile
Other
El Salvador 18.4% 81.6% $211 15 19.2% 76.8% 4.0% 0.0% 7.66
Honduras 20.0% 80.0% $199 13 10.4% 89.6% 0.0% 0.0% 7.35
Guatemala 24.6% 75.4% $287 14 22.3% 72.3% 5.3% 0.0% 7.54
Mexico 27.2% 72.8% $262 14 6.1% 88.2% 5.8% 0.0% 7.95
Cuba 54.7% 45.3% $103 6 0.0% 100.0% 0.0% 0.0% 12.41
Dominican Republic
25.5% 74.5% $244 15 0.0% 97.0% 2.0% 1.0% 7.22
Ecuador 34.6% 65.4% $338 15 7.8% 90.2% 2.0% 0.0% 10.79
Colombia 28.6% 71.4% $203 13 0.0% 97.3% 2.7% 0.0% 7.03
Source: Survey of 1227 migrants, Inter-American Dialogue, 2016.
Migrants were also asked how the recipient receives the remittance, whether in cash or as a bank account deposit. Cash tends to predominate. However, a quarter of migrants said they have deposited the remittance directly into a bank account. The percentage is quite substantial considering that the majority of remittance recipients do not have bank accounts. Migrants that have not sent money directly to a bank account stressed that it was not practical for them to do so, or that recipient did not have an account. Table 2: Scope and Experience Transferring Money into Bank Accounts
Percent of migrants who have ever sent remittance to “direct deposit” in a bank account
24.0%
Percent of migrants who had a positive experience performing a bank deposit
79.0%
Reason for not trying direct deposit to a bank account
They have never offered me this service
15.0%
The person I send to doesn't have an account
20.0%
It doesn't seem practical to me 58.0%
Other 7.8%
Source: Survey of 1227 migrants, Inter-American Dialogue, 2016.
© 2017 Inter-American Dialogue 4
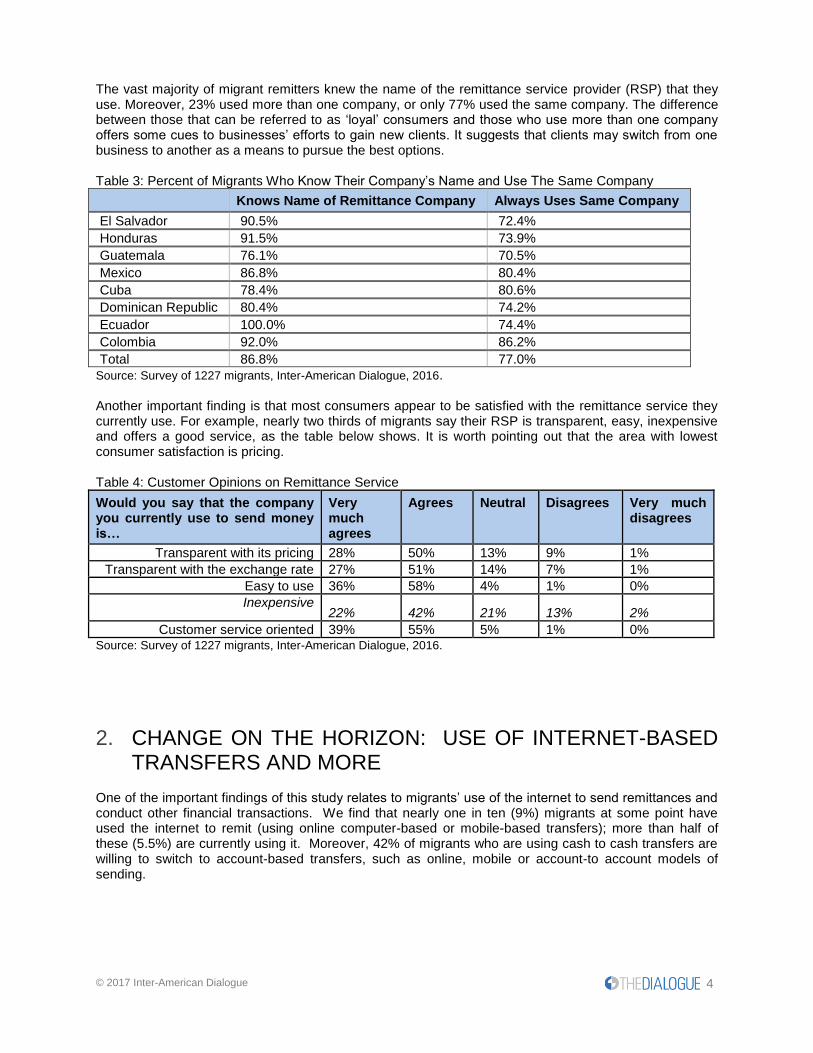
The vast majority of migrant remitters knew the name of the remittance service provider (RSP) that they use. Moreover, 23% used more than one company, or only 77% used the same company. The difference between those that can be referred to as ‘loyal’ consumers and those who use more than one company offers some cues to businesses’ efforts to gain new clients. It suggests that clients may switch from one business to another as a means to pursue the best options. Table 3: Percent of Migrants Who Know Their Company’s Name and Use The Same Company
Knows Name of Remittance Company Always Uses Same Company
El Salvador 90.5% 72.4%
Honduras 91.5% 73.9%
Guatemala 76.1% 70.5%
Mexico 86.8% 80.4%
Cuba 78.4% 80.6%
Dominican Republic 80.4% 74.2%
Ecuador 100.0% 74.4%
Colombia 92.0% 86.2%
Total 86.8% 77.0%
Source: Survey of 1227 migrants, Inter-American Dialogue, 2016. Another important finding is that most consumers appear to be satisfied with the remittance service they currently use. For example, nearly two thirds of migrants say their RSP is transparent, easy, inexpensive and offers a good service, as the table below shows. It is worth pointing out that the area with lowest consumer satisfaction is pricing.
Table 4: Customer Opinions on Remittance Service
Would you say that the company you currently use to send money is…
Very much agrees
Agrees Neutral Disagrees Very much disagrees
Transparent with its pricing 28% 50% 13% 9% 1%
Transparent with the exchange rate 27% 51% 14% 7% 1%
Easy to use 36% 58% 4% 1% 0%
Inexpensive 22% 42% 21% 13% 2%
Customer service oriented 39% 55% 5% 1% 0% Source: Survey of 1227 migrants, Inter-American Dialogue, 2016.
2. CHANGE ON THE HORIZON: USE OF INTERNET-BASED
TRANSFERS AND MORE One of the important findings of this study relates to migrants’ use of the internet to send remittances and conduct other financial transactions. We find that nearly one in ten (9%) migrants at some point have used the internet to remit (using online computer-based or mobile-based transfers); more than half of these (5.5%) are currently using it. Moreover, 42% of migrants who are using cash to cash transfers are willing to switch to account-based transfers, such as online, mobile or account-to account models of sending.
© 2017 Inter-American Dialogue 5
USING THE INTERNET TO SEND MONEY
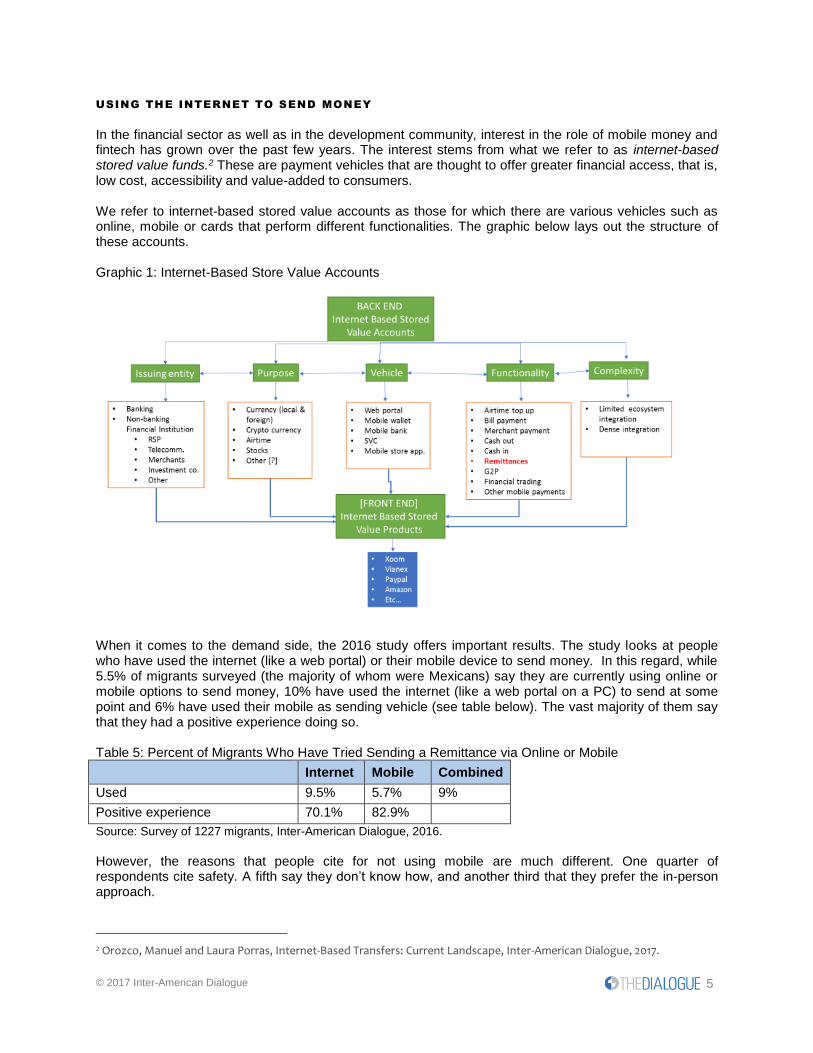
In the financial sector as well as in the development community, interest in the role of mobile money and fintech has grown over the past few years. The interest stems from what we refer to as internet-based stored value funds.2 These are payment vehicles that are thought to offer greater financial access, that is, low cost, accessibility and value-added to consumers. We refer to internet-based stored value accounts as those for which there are various vehicles such as online, mobile or cards that perform different functionalities. The graphic below lays out the structure of these accounts. Graphic 1: Internet-Based Store Value Accounts
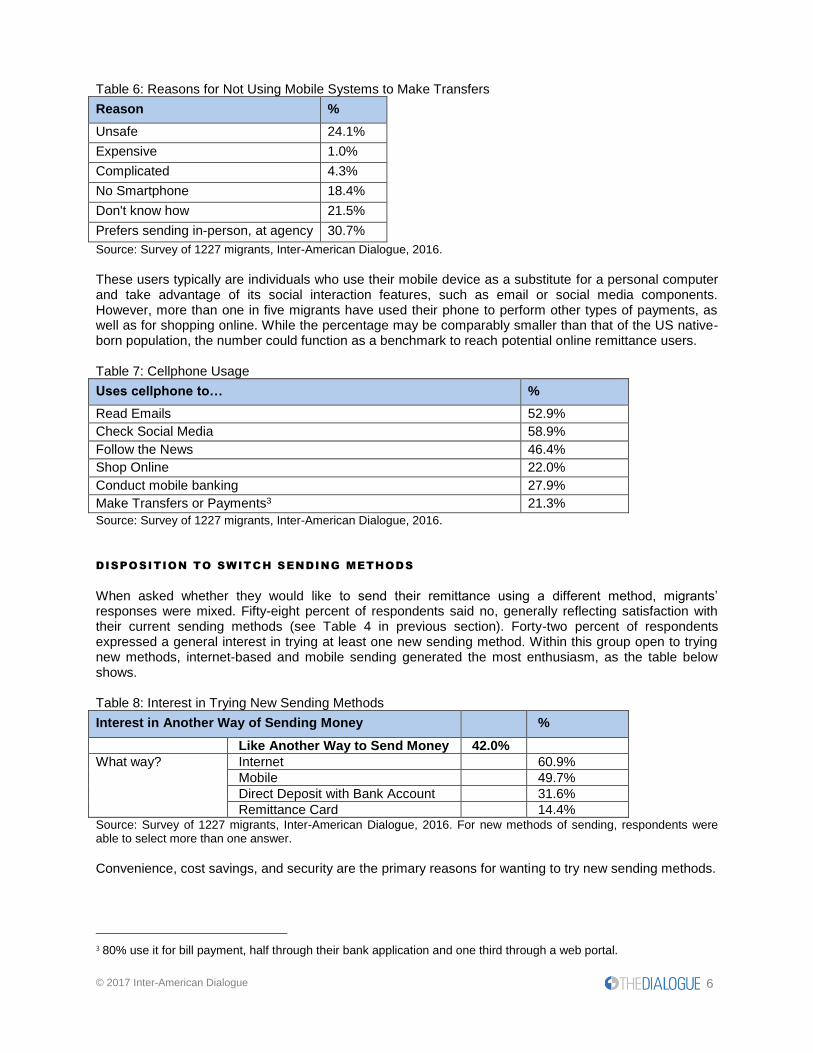
When it comes to the demand side, the 2016 study offers important results. The study looks at people who have used the internet (like a web portal) or their mobile device to send money. In this regard, while 5.5% of migrants surveyed (the majority of whom were Mexicans) say they are currently using online or mobile options to send money, 10% have used the internet (like a web portal on a PC) to send at some point and 6% have used their mobile as sending vehicle (see table below). The vast majority of them say that they had a positive experience doing so. Table 5: Percent of Migrants Who Have Tried Sending a Remittance via Online or Mobile
Internet Mobile Combined
Used 9.5% 5.7% 9%
Positive experience 70.1% 82.9%
Source: Survey of 1227 migrants, Inter-American Dialogue, 2016.
However, the reasons that people cite for not using mobile are much different. One quarter of respondents cite safety. A fifth say they don’t know how, and another third that they prefer the in-person approach.
2 Orozco, Manuel and Laura Porras, Internet-Based Transfers: Current Landscape, Inter-American Dialogue, 2017.
© 2017 Inter-American Dialogue 6
Table 6: Reasons for Not Using Mobile Systems to Make Transfers
Reason %
Unsafe 24.1%
Expensive 1.0%
Complicated 4.3%
No Smartphone 18.4%
Don't know how 21.5%
Prefers sending in-person, at agency 30.7%
Source: Survey of 1227 migrants, Inter-American Dialogue, 2016.
These users typically are individuals who use their mobile device as a substitute for a personal computer and take advantage of its social interaction features, such as email or social media components. However, more than one in five migrants have used their phone to perform other types of payments, as well as for shopping online. While the percentage may be comparably smaller than that of the US native-born population, the number could function as a benchmark to reach potential online remittance users. Table 7: Cellphone Usage
Uses cellphone to… %
Read Emails 52.9%
Check Social Media 58.9%
Follow the News 46.4%
Shop Online 22.0%
Conduct mobile banking 27.9%
Make Transfers or Payments3 21.3%
Source: Survey of 1227 migrants, Inter-American Dialogue, 2016.
DISPOSITION TO SWITCH SENDING METHODS
When asked whether they would like to send their remittance using a different method, migrants’ responses were mixed. Fifty-eight percent of respondents said no, generally reflecting satisfaction with their current sending methods (see Table 4 in previous section). Forty-two percent of respondents expressed a general interest in trying at least one new sending method. Within this group open to trying new methods, internet-based and mobile sending generated the most enthusiasm, as the table below shows. Table 8: Interest in Trying New Sending Methods
Interest in Another Way of Sending Money %
Like Another Way to Send Money 42.0%
What way? Internet 60.9%
Mobile 49.7%
Direct Deposit with Bank Account 31.6%
Remittance Card 14.4% Source: Survey of 1227 migrants, Inter-American Dialogue, 2016. For new methods of sending, respondents were able to select more than one answer.
Convenience, cost savings, and security are the primary reasons for wanting to try new sending methods.
3 80% use it for bill payment, half through their bank application and one third through a web portal.
© 2017 Inter-American Dialogue 7
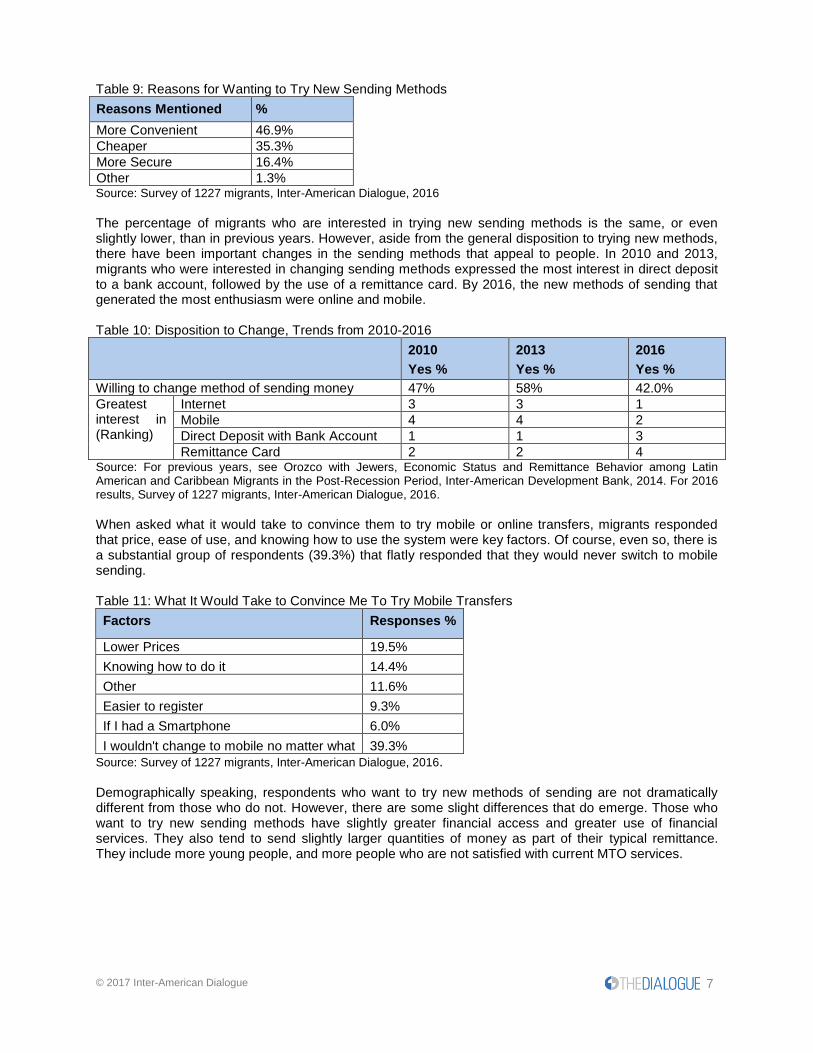
Table 9: Reasons for Wanting to Try New Sending Methods
Reasons Mentioned %
More Convenient 46.9%
Cheaper 35.3%
More Secure 16.4%
Other 1.3% Source: Survey of 1227 migrants, Inter-American Dialogue, 2016
The percentage of migrants who are interested in trying new sending methods is the same, or even slightly lower, than in previous years. However, aside from the general disposition to trying new methods, there have been important changes in the sending methods that appeal to people. In 2010 and 2013, migrants who were interested in changing sending methods expressed the most interest in direct deposit to a bank account, followed by the use of a remittance card. By 2016, the new methods of sending that generated the most enthusiasm were online and mobile. Table 10: Disposition to Change, Trends from 2010-2016
2010
Yes %
2013
Yes %
2016
Yes %
Willing to change method of sending money 47% 58% 42.0%
Greatest interest in (Ranking)
Internet 3 3 1
Mobile 4 4 2
Direct Deposit with Bank Account 1 1 3
Remittance Card 2 2 4 Source: For previous years, see Orozco with Jewers, Economic Status and Remittance Behavior among Latin American and Caribbean Migrants in the Post-Recession Period, Inter-American Development Bank, 2014. For 2016 results, Survey of 1227 migrants, Inter-American Dialogue, 2016.
When asked what it would take to convince them to try mobile or online transfers, migrants responded that price, ease of use, and knowing how to use the system were key factors. Of course, even so, there is a substantial group of respondents (39.3%) that flatly responded that they would never switch to mobile sending. Table 11: What It Would Take to Convince Me To Try Mobile Transfers
Factors Responses %
Lower Prices 19.5%
Knowing how to do it 14.4%
Other 11.6%
Easier to register 9.3%
If I had a Smartphone 6.0%
I wouldn't change to mobile no matter what 39.3%
Source: Survey of 1227 migrants, Inter-American Dialogue, 2016. Demographically speaking, respondents who want to try new methods of sending are not dramatically different from those who do not. However, there are some slight differences that do emerge. Those who want to try new sending methods have slightly greater financial access and greater use of financial services. They also tend to send slightly larger quantities of money as part of their typical remittance. They include more young people, and more people who are not satisfied with current MTO services.
© 2017 Inter-American Dialogue 8
ONLINE REMITTANCES: DIFFERENCES BETWEEN CURRENT USERS AND POTENTIAL
USERS
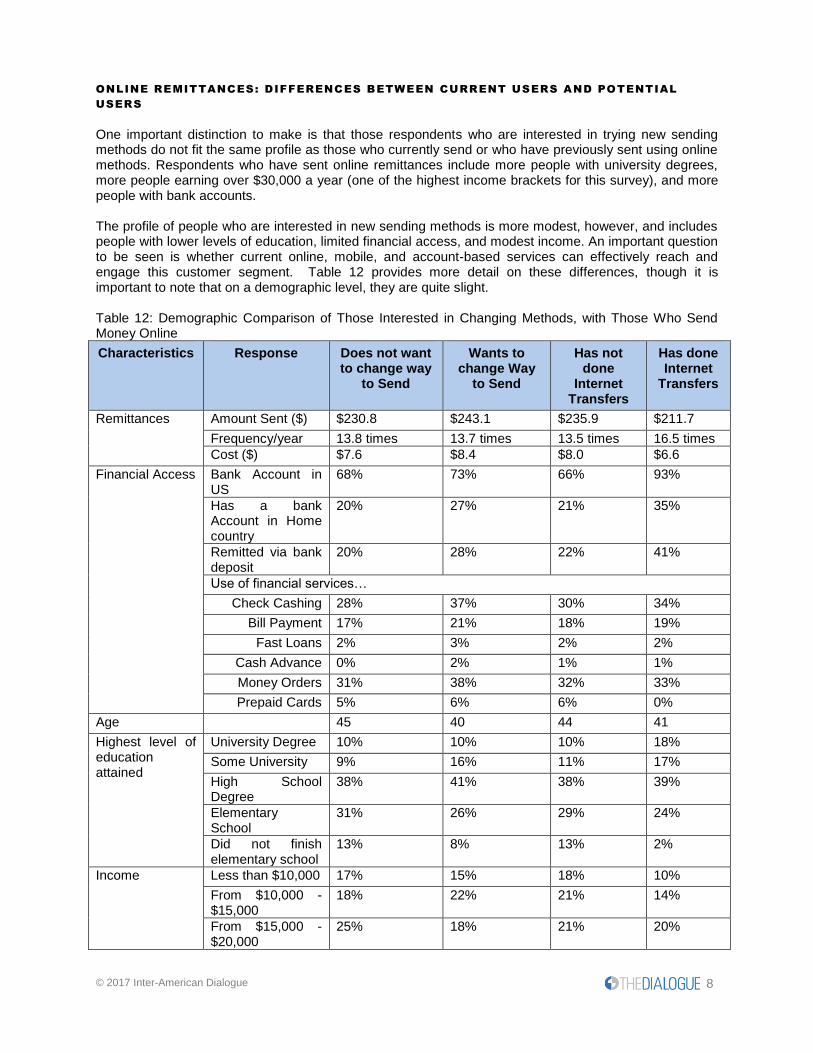
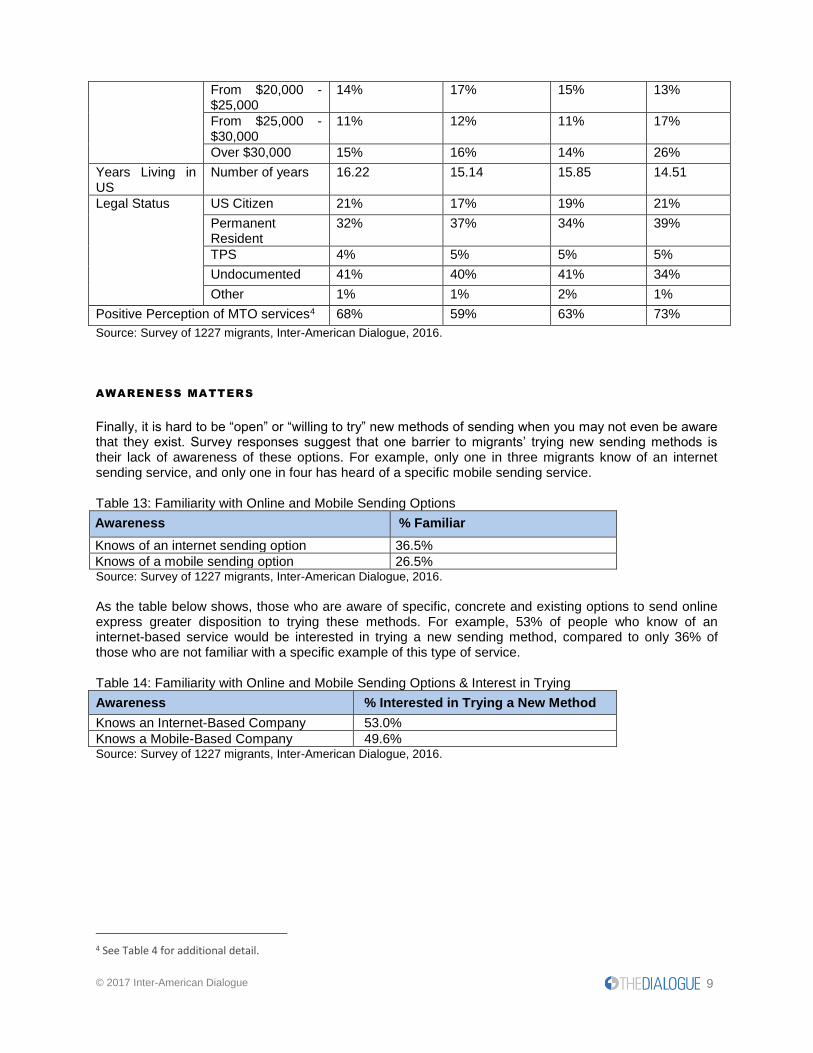
One important distinction to make is that those respondents who are interested in trying new sending methods do not fit the same profile as those who currently send or who have previously sent using online methods. Respondents who have sent online remittances include more people with university degrees, more people earning over $30,000 a year (one of the highest income brackets for this survey), and more people with bank accounts. The profile of people who are interested in new sending methods is more modest, however, and includes people with lower levels of education, limited financial access, and modest income. An important question to be seen is whether current online, mobile, and account-based services can effectively reach and engage this customer segment. Table 12 provides more detail on these differences, though it is important to note that on a demographic level, they are quite slight. Table 12: Demographic Comparison of Those Interested in Changing Methods, with Those Who Send Money Online
Characteristics Response Does not want to change way
to Send
Wants to change Way
to Send
Has not done
Internet Transfers
Has done Internet
Transfers
Remittances Amount Sent ($) $230.8 $243.1 $235.9 $211.7
Frequency/year 13.8 times 13.7 times 13.5 times 16.5 times
Cost ($) $7.6 $8.4 $8.0 $6.6
Financial Access Bank Account in US
68% 73% 66% 93%
Has a bank Account in Home country
20% 27% 21% 35%
Remitted via bank deposit
20% 28% 22% 41%
Use of financial services…
Check Cashing 28% 37% 30% 34%
Bill Payment 17% 21% 18% 19%
Fast Loans 2% 3% 2% 2%
Cash Advance 0% 2% 1% 1%
Money Orders 31% 38% 32% 33%
Prepaid Cards 5% 6% 6% 0%
Age 45 40 44 41
Highest level of education attained
University Degree 10% 10% 10% 18%
Some University 9% 16% 11% 17%
High School Degree
38% 41% 38% 39%
Elementary School
31% 26% 29% 24%
Did not finish elementary school
13% 8% 13% 2%
Income Less than $10,000 17% 15% 18% 10%
From $10,000 - $15,000
18% 22% 21% 14%
From $15,000 - $20,000
25% 18% 21% 20%
© 2017 Inter-American Dialogue 9
From $20,000 - $25,000
14% 17% 15% 13%
From $25,000 - $30,000
11% 12% 11% 17%
Over $30,000 15% 16% 14% 26%
Years Living in US
Number of years 16.22 15.14 15.85 14.51
Legal Status US Citizen 21% 17% 19% 21%
Permanent Resident
32% 37% 34% 39%
TPS 4% 5% 5% 5%
Undocumented 41% 40% 41% 34%
Other 1% 1% 2% 1%
Positive Perception of MTO services4 68% 59% 63% 73%
Source: Survey of 1227 migrants, Inter-American Dialogue, 2016. AWARENESS MATTERS
Finally, it is hard to be “open” or “willing to try” new methods of sending when you may not even be aware that they exist. Survey responses suggest that one barrier to migrants’ trying new sending methods is their lack of awareness of these options. For example, only one in three migrants know of an internet sending service, and only one in four has heard of a specific mobile sending service. Table 13: Familiarity with Online and Mobile Sending Options
Awareness % Familiar
Knows of an internet sending option 36.5%
Knows of a mobile sending option 26.5% Source: Survey of 1227 migrants, Inter-American Dialogue, 2016.
As the table below shows, those who are aware of specific, concrete and existing options to send online express greater disposition to trying these methods. For example, 53% of people who know of an internet-based service would be interested in trying a new sending method, compared to only 36% of those who are not familiar with a specific example of this type of service. Table 14: Familiarity with Online and Mobile Sending Options & Interest in Trying
Awareness % Interested in Trying a New Method
Knows an Internet-Based Company 53.0%
Knows a Mobile-Based Company 49.6% Source: Survey of 1227 migrants, Inter-American Dialogue, 2016.
4 See Table 4 for additional detail.
© 2017 Inter-American Dialogue 10
3. BANKING AND FINANCIAL SERVICES Among the findings from this study include the extent to which migrants can access banking and other financial services. Nearly one in four migrants have a bank account in their home country, and two thirds have bank accounts in the United States. Moreover, more than half of migrants, regardless of bank account ownership, use at least two non-banking financial services, including money orders and check cashing. Finally, we find that more than one in ten migrants are truly underserved in the sense that they do not have a bank account nor use non-banking financial services. BANK ACCOUNTS AT HOME
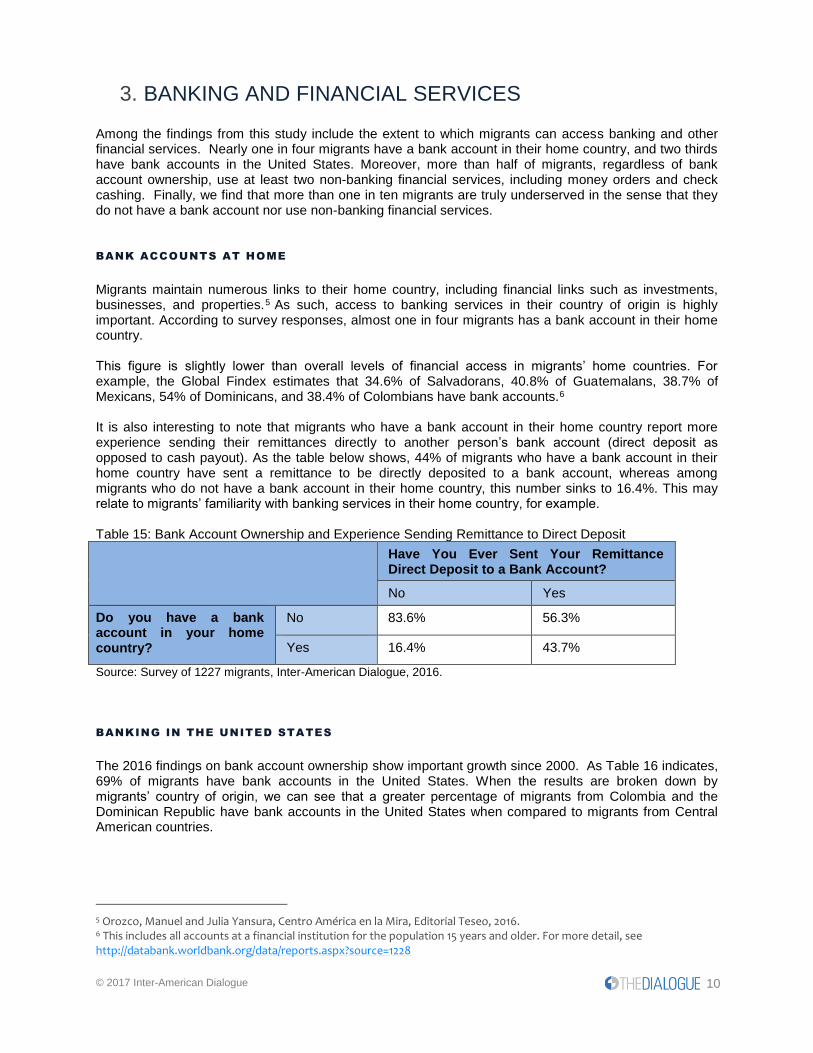
Migrants maintain numerous links to their home country, including financial links such as investments, businesses, and properties.5 As such, access to banking services in their country of origin is highly important. According to survey responses, almost one in four migrants has a bank account in their home country. This figure is slightly lower than overall levels of financial access in migrants’ home countries. For example, the Global Findex estimates that 34.6% of Salvadorans, 40.8% of Guatemalans, 38.7% of Mexicans, 54% of Dominicans, and 38.4% of Colombians have bank accounts.6 It is also interesting to note that migrants who have a bank account in their home country report more experience sending their remittances directly to another person’s bank account (direct deposit as opposed to cash payout). As the table below shows, 44% of migrants who have a bank account in their home country have sent a remittance to be directly deposited to a bank account, whereas among migrants who do not have a bank account in their home country, this number sinks to 16.4%. This may relate to migrants’ familiarity with banking services in their home country, for example. Table 15: Bank Account Ownership and Experience Sending Remittance to Direct Deposit
Have You Ever Sent Your Remittance Direct Deposit to a Bank Account?
No Yes
Do you have a bank account in your home country?
No 83.6% 56.3%
Yes 16.4% 43.7%
Source: Survey of 1227 migrants, Inter-American Dialogue, 2016.
BANKING IN THE UNITED STATES
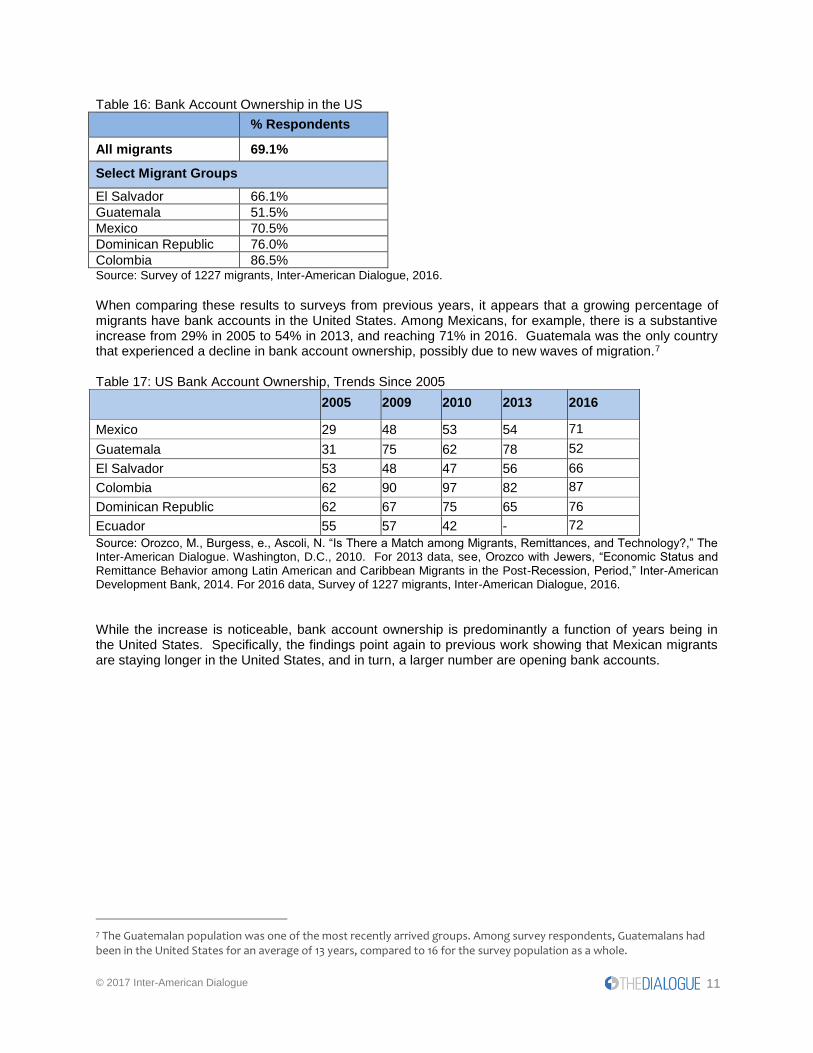
The 2016 findings on bank account ownership show important growth since 2000. As Table 16 indicates, 69% of migrants have bank accounts in the United States. When the results are broken down by migrants’ country of origin, we can see that a greater percentage of migrants from Colombia and the Dominican Republic have bank accounts in the United States when compared to migrants from Central American countries.
5 Orozco, Manuel and Julia Yansura, Centro América en la Mira, Editorial Teseo, 2016. 6 This includes all accounts at a financial institution for the population 15 years and older. For more detail, see http://databank.worldbank.org/data/reports.aspx?source=1228
© 2017 Inter-American Dialogue 11
Table 16: Bank Account Ownership in the US
% Respondents
All migrants 69.1%
Select Migrant Groups
El Salvador 66.1%
Guatemala 51.5%
Mexico 70.5%
Dominican Republic 76.0%
Colombia 86.5% Source: Survey of 1227 migrants, Inter-American Dialogue, 2016.
When comparing these results to surveys from previous years, it appears that a growing percentage of migrants have bank accounts in the United States. Among Mexicans, for example, there is a substantive increase from 29% in 2005 to 54% in 2013, and reaching 71% in 2016. Guatemala was the only country that experienced a decline in bank account ownership, possibly due to new waves of migration.7 Table 17: US Bank Account Ownership, Trends Since 2005
2005 2009 2010 2013 2016
Mexico 29 48 53 54 71
Guatemala 31 75 62 78 52
El Salvador 53 48 47 56 66
Colombia 62 90 97 82 87
Dominican Republic 62 67 75 65 76
Ecuador 55 57 42 - 72
Source: Orozco, M., Burgess, e., Ascoli, N. “Is There a Match among Migrants, Remittances, and Technology?,” The Inter-American Dialogue. Washington, D.C., 2010. For 2013 data, see, Orozco with Jewers, “Economic Status and Remittance Behavior among Latin American and Caribbean Migrants in the Post-Recession, Period,” Inter-American Development Bank, 2014. For 2016 data, Survey of 1227 migrants, Inter-American Dialogue, 2016.
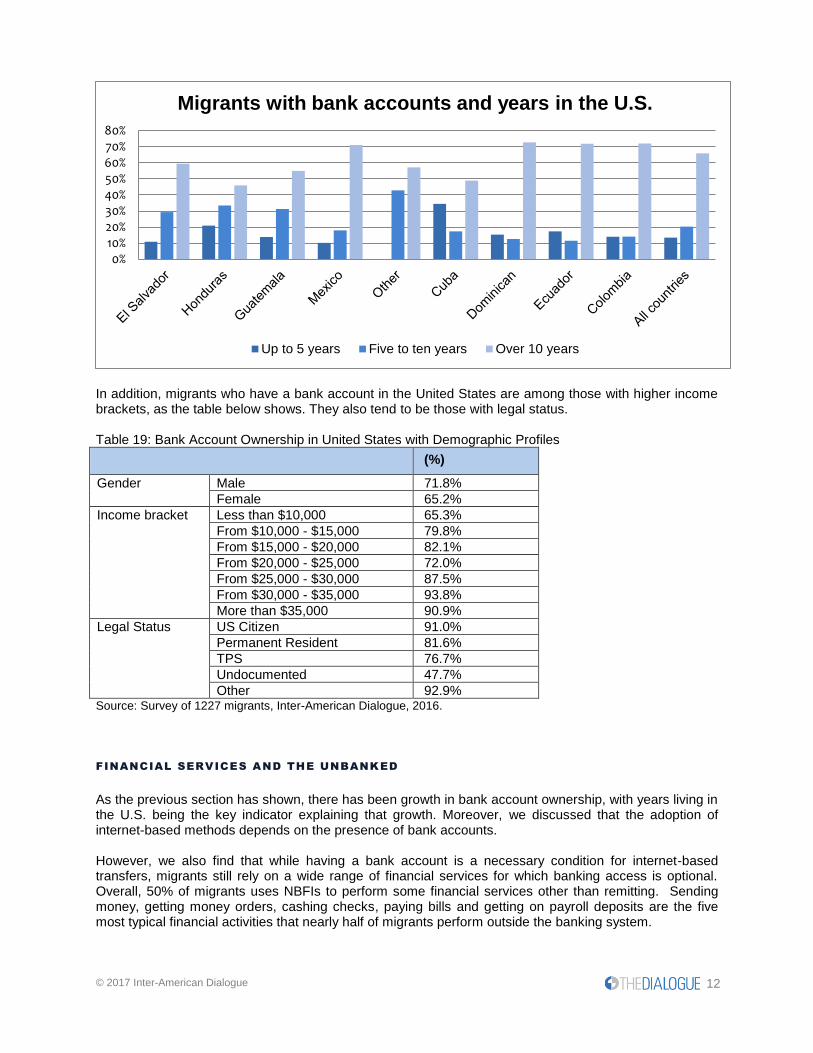
While the increase is noticeable, bank account ownership is predominantly a function of years being in the United States. Specifically, the findings point again to previous work showing that Mexican migrants are staying longer in the United States, and in turn, a larger number are opening bank accounts.
7 The Guatemalan population was one of the most recently arrived groups. Among survey respondents, Guatemalans had been in the United States for an average of 13 years, compared to 16 for the survey population as a whole.
© 2017 Inter-American Dialogue 12
In addition, migrants who have a bank account in the United States are among those with higher income brackets, as the table below shows. They also tend to be those with legal status. Table 19: Bank Account Ownership in United States with Demographic Profiles
(%)
Gender Male 71.8%
Female 65.2%
Income bracket Less than $10,000 65.3%
From $10,000 - $15,000 79.8%
From $15,000 - $20,000 82.1%
From $20,000 - $25,000 72.0%
From $25,000 - $30,000 87.5%
From $30,000 - $35,000 93.8%
More than $35,000 90.9%
Legal Status US Citizen 91.0%
Permanent Resident 81.6%
TPS 76.7%
Undocumented 47.7%
Other 92.9% Source: Survey of 1227 migrants, Inter-American Dialogue, 2016.
FINANCIAL SERVICES AND THE UNBANKED
As the previous section has shown, there has been growth in bank account ownership, with years living in the U.S. being the key indicator explaining that growth. Moreover, we discussed that the adoption of internet-based methods depends on the presence of bank accounts. However, we also find that while having a bank account is a necessary condition for internet-based transfers, migrants still rely on a wide range of financial services for which banking access is optional. Overall, 50% of migrants uses NBFIs to perform some financial services other than remitting. Sending money, getting money orders, cashing checks, paying bills and getting on payroll deposits are the five most typical financial activities that nearly half of migrants perform outside the banking system.
0%10%20%30%40%50%60%70%80%
Migrants with bank accounts and years in the U.S.
Up to 5 years Five to ten years Over 10 years
© 2017 Inter-American Dialogue 13
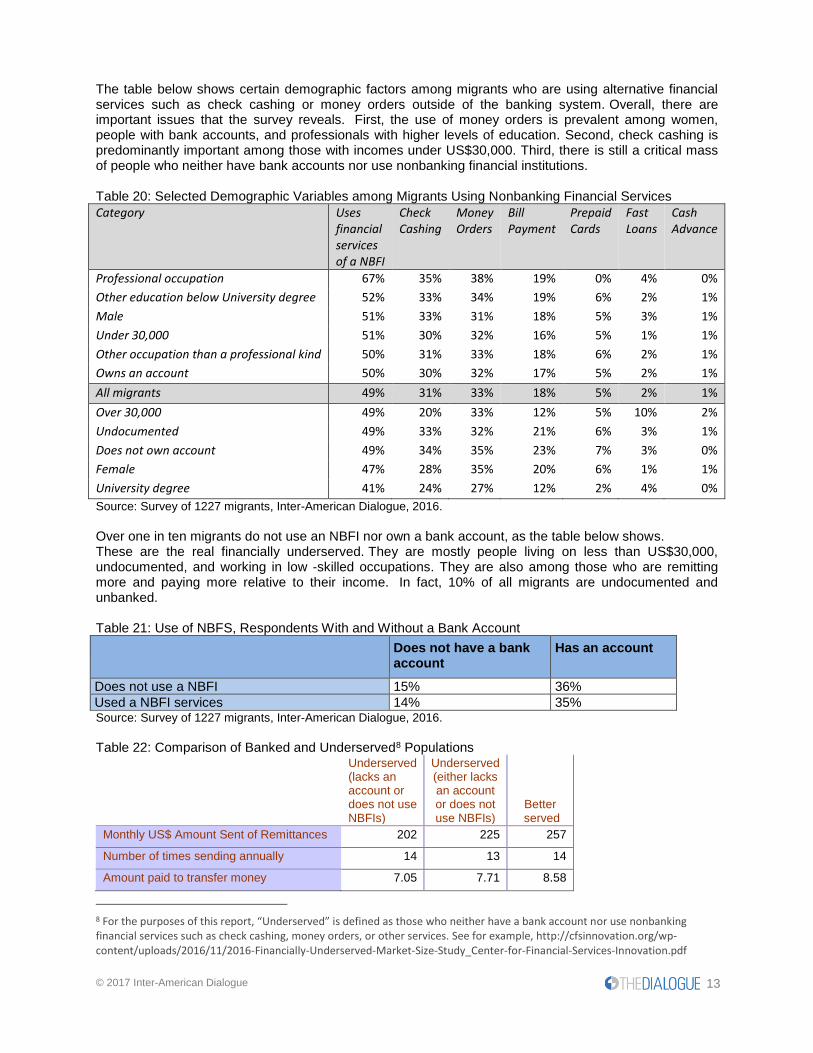
The table below shows certain demographic factors among migrants who are using alternative financial services such as check cashing or money orders outside of the banking system. Overall, there are important issues that the survey reveals. First, the use of money orders is prevalent among women, people with bank accounts, and professionals with higher levels of education. Second, check cashing is predominantly important among those with incomes under US$30,000. Third, there is still a critical mass of people who neither have bank accounts nor use nonbanking financial institutions. Table 20: Selected Demographic Variables among Migrants Using Nonbanking Financial Services
Category Uses financial services of a NBFI
Check Cashing
Money Orders
Bill Payment
Prepaid Cards
Fast Loans
Cash Advance
Professional occupation 67% 35% 38% 19% 0% 4% 0%
Other education below University degree 52% 33% 34% 19% 6% 2% 1%
Male 51% 33% 31% 18% 5% 3% 1%
Under 30,000 51% 30% 32% 16% 5% 1% 1%
Other occupation than a professional kind 50% 31% 33% 18% 6% 2% 1%
Owns an account 50% 30% 32% 17% 5% 2% 1%
All migrants 49% 31% 33% 18% 5% 2% 1%
Over 30,000 49% 20% 33% 12% 5% 10% 2%
Undocumented 49% 33% 32% 21% 6% 3% 1%
Does not own account 49% 34% 35% 23% 7% 3% 0%
Female 47% 28% 35% 20% 6% 1% 1%
University degree 41% 24% 27% 12% 2% 4% 0%
Source: Survey of 1227 migrants, Inter-American Dialogue, 2016.
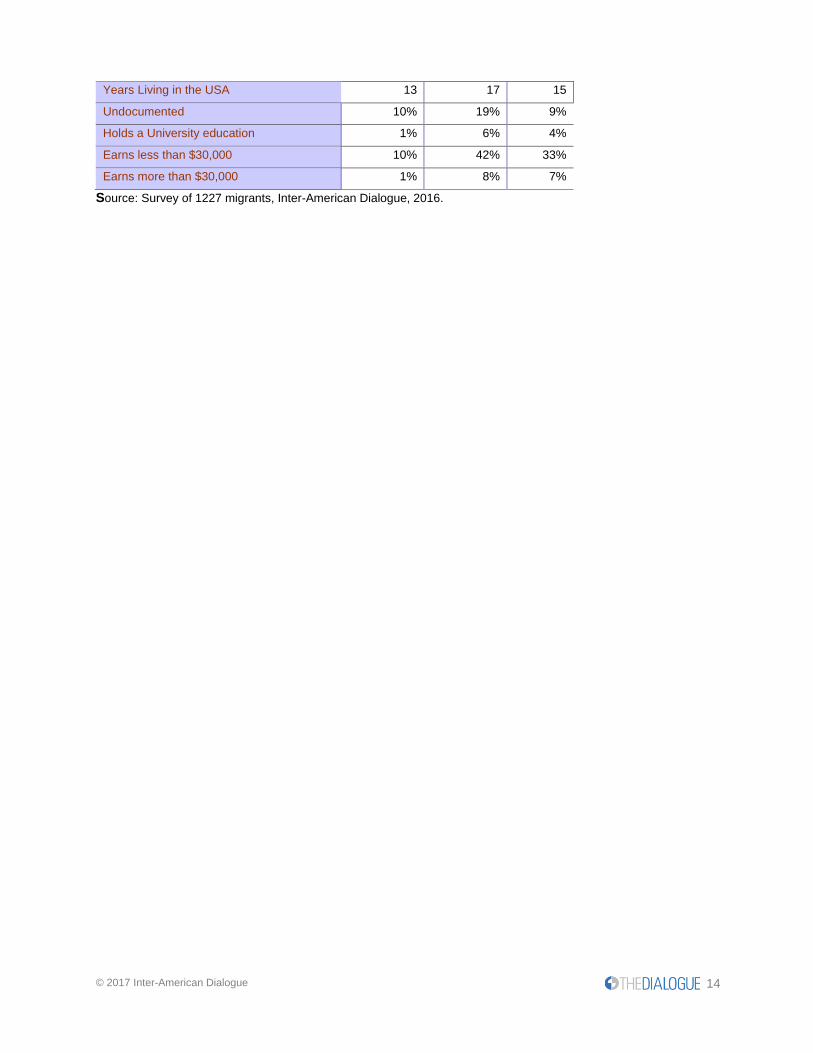
Over one in ten migrants do not use an NBFI nor own a bank account, as the table below shows. These are the real financially underserved. They are mostly people living on less than US$30,000, undocumented, and working in low -skilled occupations. They are also among those who are remitting more and paying more relative to their income. In fact, 10% of all migrants are undocumented and unbanked. Table 21: Use of NBFS, Respondents With and Without a Bank Account
Does not have a bank account
Has an account
Does not use a NBFI 15% 36%
Used a NBFI services 14% 35% Source: Survey of 1227 migrants, Inter-American Dialogue, 2016. Table 22: Comparison of Banked and Underserved8 Populations
Underserved (lacks an account or does not use NBFIs)
Underserved (either lacks an account or does not use NBFIs)
Better served
Monthly US$ Amount Sent of Remittances 202 225 257
Number of times sending annually 14 13 14
Amount paid to transfer money 7.05 7.71 8.58
8 For the purposes of this report, “Underserved” is defined as those who neither have a bank account nor use nonbanking financial services such as check cashing, money orders, or other services. See for example, http://cfsinnovation.org/wp-content/uploads/2016/11/2016-Financially-Underserved-Market-Size-Study_Center-for-Financial-Services-Innovation.pdf
© 2017 Inter-American Dialogue 14
Years Living in the USA 13 17 15
Undocumented 10% 19% 9%
Holds a University education 1% 6% 4%
Earns less than $30,000 10% 42% 33%
Earns more than $30,000 1% 8% 7%
Source: Survey of 1227 migrants, Inter-American Dialogue, 2016.
© 2017 Inter-American Dialogue 15
Appendix – Methodological Note
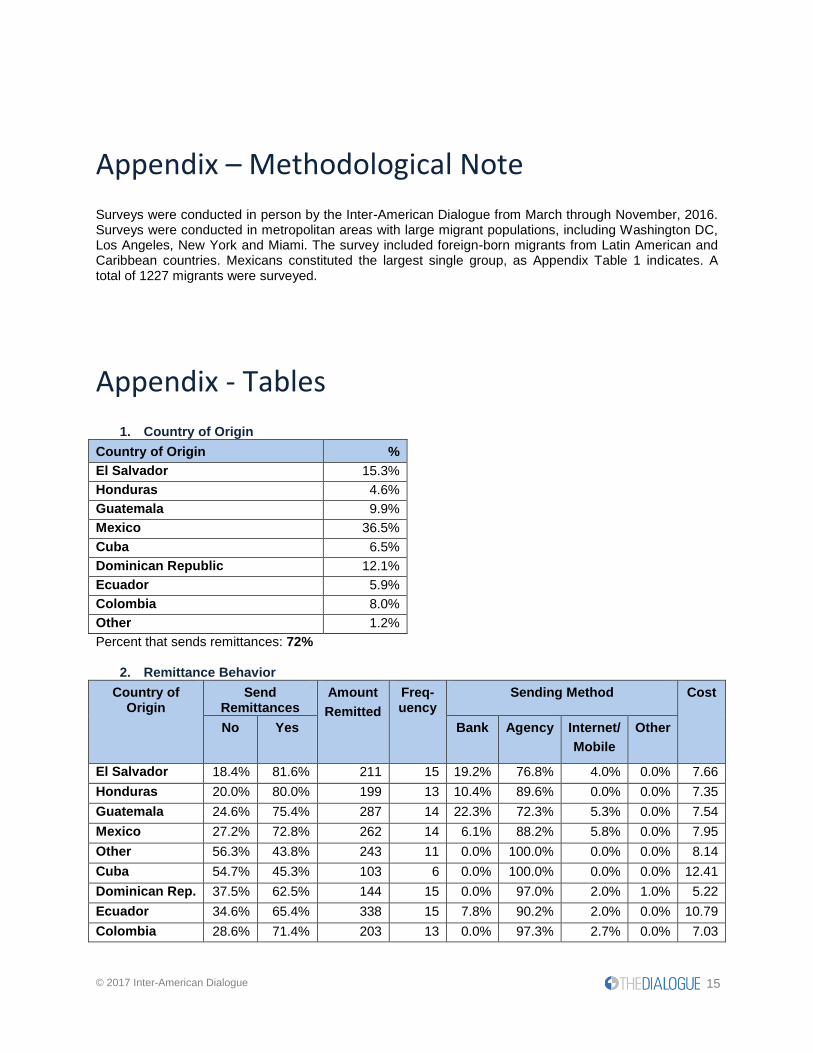
Surveys were conducted in person by the Inter-American Dialogue from March through November, 2016. Surveys were conducted in metropolitan areas with large migrant populations, including Washington DC, Los Angeles, New York and Miami. The survey included foreign-born migrants from Latin American and Caribbean countries. Mexicans constituted the largest single group, as Appendix Table 1 indicates. A total of 1227 migrants were surveyed.
Appendix - Tables
1. Country of Origin
Country of Origin %
El Salvador 15.3%
Honduras 4.6%
Guatemala 9.9%
Mexico 36.5%
Cuba 6.5%
Dominican Republic 12.1%
Ecuador 5.9%
Colombia 8.0%
Other 1.2%
Percent that sends remittances: 72%
2. Remittance Behavior
Country of Origin
Send Remittances
Amount
Remitted
Freq-uency
Sending Method Cost
No Yes Bank Agency Internet/
Mobile
Other
El Salvador 18.4% 81.6% 211 15 19.2% 76.8% 4.0% 0.0% 7.66
Honduras 20.0% 80.0% 199 13 10.4% 89.6% 0.0% 0.0% 7.35
Guatemala 24.6% 75.4% 287 14 22.3% 72.3% 5.3% 0.0% 7.54
Mexico 27.2% 72.8% 262 14 6.1% 88.2% 5.8% 0.0% 7.95
Other 56.3% 43.8% 243 11 0.0% 100.0% 0.0% 0.0% 8.14
Cuba 54.7% 45.3% 103 6 0.0% 100.0% 0.0% 0.0% 12.41
Dominican Rep. 37.5% 62.5% 144 15 0.0% 97.0% 2.0% 1.0% 5.22
Ecuador 34.6% 65.4% 338 15 7.8% 90.2% 2.0% 0.0% 10.79
Colombia 28.6% 71.4% 203 13 0.0% 97.3% 2.7% 0.0% 7.03
© 2017 Inter-American Dialogue 16
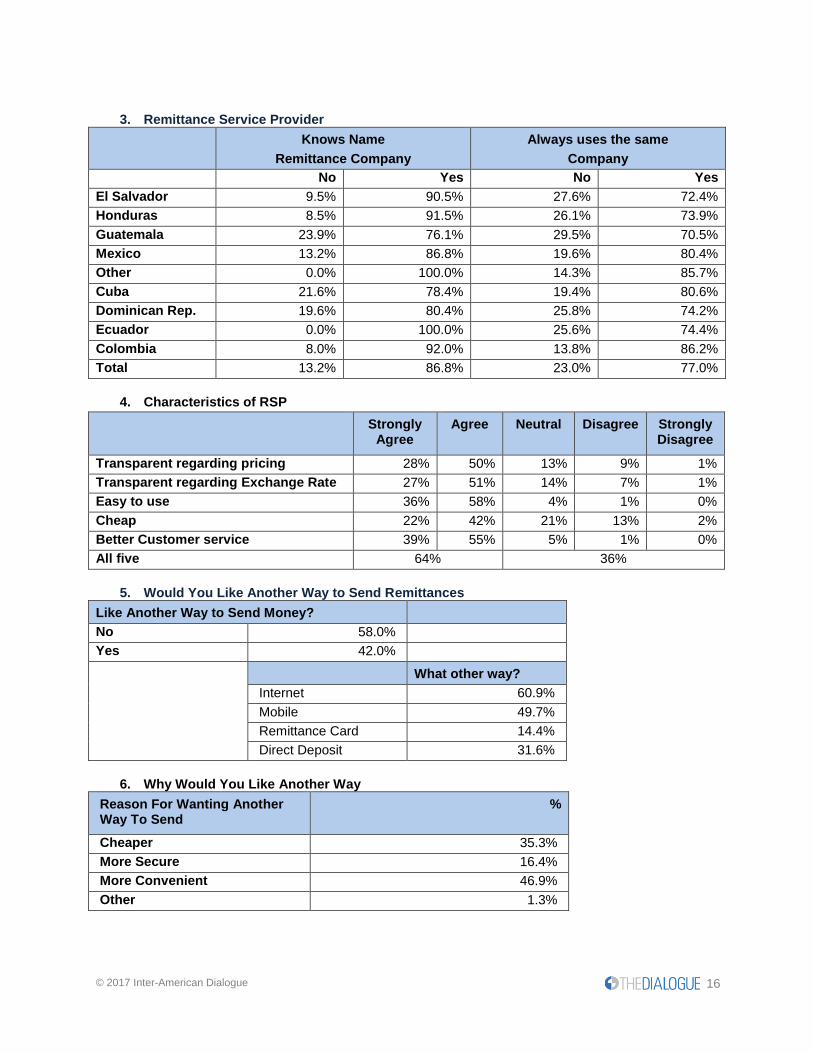
3. Remittance Service Provider
Knows Name
Remittance Company
Always uses the same
Company
No Yes No Yes
El Salvador 9.5% 90.5% 27.6% 72.4%
Honduras 8.5% 91.5% 26.1% 73.9%
Guatemala 23.9% 76.1% 29.5% 70.5%
Mexico 13.2% 86.8% 19.6% 80.4%
Other 0.0% 100.0% 14.3% 85.7%
Cuba 21.6% 78.4% 19.4% 80.6%
Dominican Rep. 19.6% 80.4% 25.8% 74.2%
Ecuador 0.0% 100.0% 25.6% 74.4%
Colombia 8.0% 92.0% 13.8% 86.2%
Total 13.2% 86.8% 23.0% 77.0%
4. Characteristics of RSP
Strongly Agree
Agree Neutral Disagree Strongly Disagree
Transparent regarding pricing 28% 50% 13% 9% 1%
Transparent regarding Exchange Rate 27% 51% 14% 7% 1%
Easy to use 36% 58% 4% 1% 0%
Cheap 22% 42% 21% 13% 2%
Better Customer service 39% 55% 5% 1% 0%
All five 64% 36%
5. Would You Like Another Way to Send Remittances
Like Another Way to Send Money?
No 58.0%
Yes 42.0%
What other way?
Internet 60.9%
Mobile 49.7%
Remittance Card 14.4%
Direct Deposit 31.6%
6. Why Would You Like Another Way
Reason For Wanting Another Way To Send
%
Cheaper 35.3%
More Secure 16.4%
More Convenient 46.9%
Other 1.3%
© 2017 Inter-American Dialogue 17
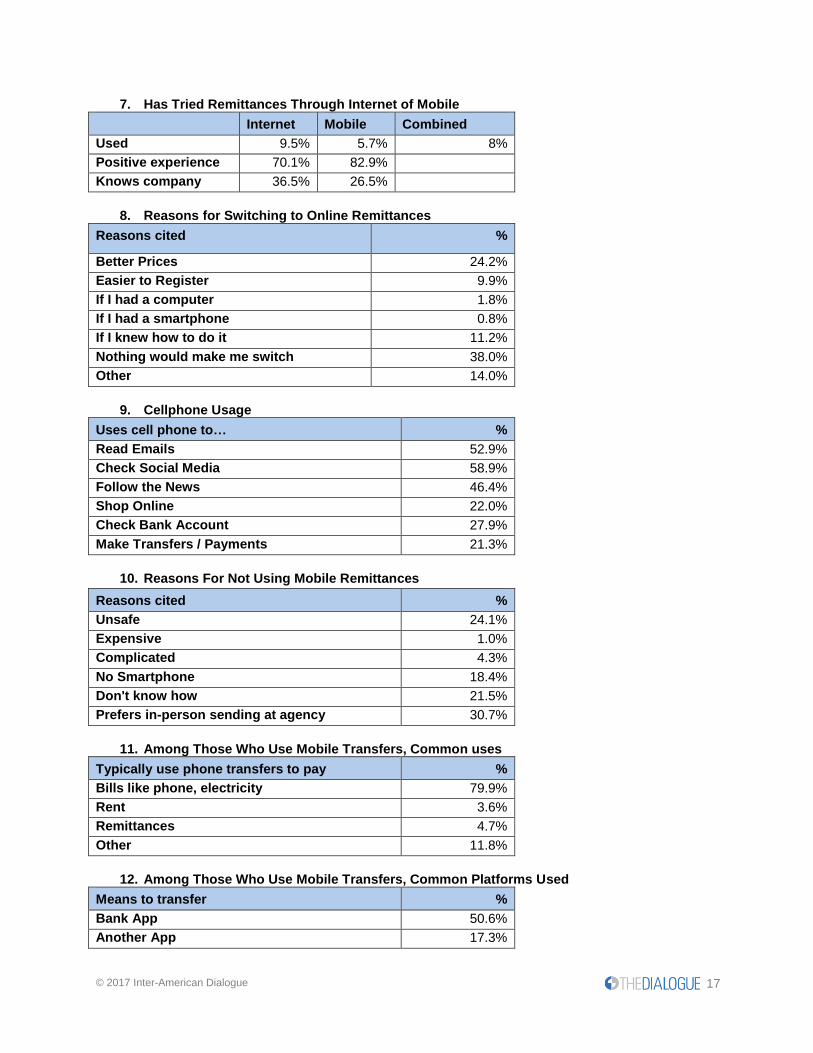
7. Has Tried Remittances Through Internet of Mobile
Internet Mobile Combined
Used 9.5% 5.7% 8%
Positive experience 70.1% 82.9%
Knows company 36.5% 26.5%
8. Reasons for Switching to Online Remittances
Reasons cited %
Better Prices 24.2%
Easier to Register 9.9%
If I had a computer 1.8%
If I had a smartphone 0.8%
If I knew how to do it 11.2%
Nothing would make me switch 38.0%
Other 14.0%
9. Cellphone Usage
Uses cell phone to… %
Read Emails 52.9%
Check Social Media 58.9%
Follow the News 46.4%
Shop Online 22.0%
Check Bank Account 27.9%
Make Transfers / Payments 21.3%
10. Reasons For Not Using Mobile Remittances
Reasons cited %
Unsafe 24.1%
Expensive 1.0%
Complicated 4.3%
No Smartphone 18.4%
Don't know how 21.5%
Prefers in-person sending at agency 30.7%
11. Among Those Who Use Mobile Transfers, Common uses
Typically use phone transfers to pay %
Bills like phone, electricity 79.9%
Rent 3.6%
Remittances 4.7%
Other 11.8%
12. Among Those Who Use Mobile Transfers, Common Platforms Used
Means to transfer %
Bank App 50.6%
Another App 17.3%
© 2017 Inter-American Dialogue 18
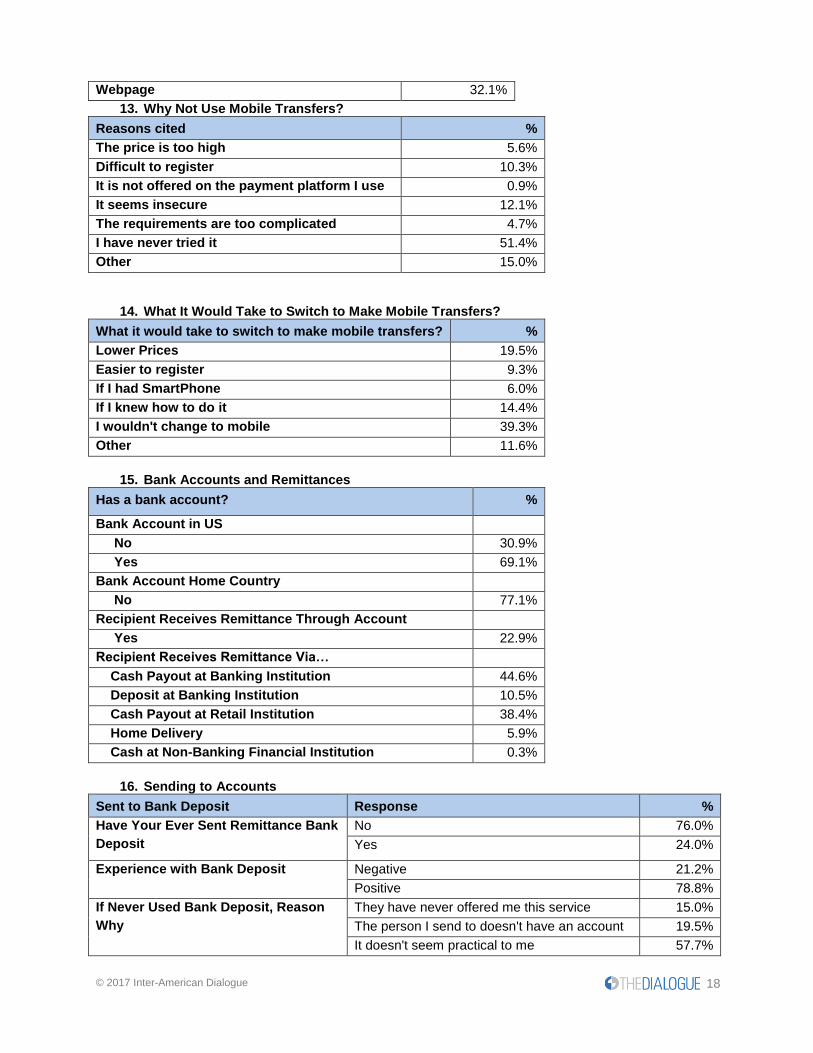
Webpage 32.1%
13. Why Not Use Mobile Transfers?
Reasons cited %
The price is too high 5.6%
Difficult to register 10.3%
It is not offered on the payment platform I use 0.9%
It seems insecure 12.1%
The requirements are too complicated 4.7%
I have never tried it 51.4%
Other 15.0%
14. What It Would Take to Switch to Make Mobile Transfers?
What it would take to switch to make mobile transfers? %
Lower Prices 19.5%
Easier to register 9.3%
If I had SmartPhone 6.0%
If I knew how to do it 14.4%
I wouldn't change to mobile 39.3%
Other 11.6%
15. Bank Accounts and Remittances
Has a bank account? %
Bank Account in US
No 30.9%
Yes 69.1%
Bank Account Home Country
No 77.1%
Recipient Receives Remittance Through Account
Yes 22.9%
Recipient Receives Remittance Via…
Cash Payout at Banking Institution 44.6%
Deposit at Banking Institution 10.5%
Cash Payout at Retail Institution 38.4%
Home Delivery 5.9%
Cash at Non-Banking Financial Institution 0.3%
16. Sending to Accounts
Sent to Bank Deposit Response %
Have Your Ever Sent Remittance Bank
Deposit
No 76.0%
Yes 24.0%
Experience with Bank Deposit
Negative 21.2%
Positive 78.8%
If Never Used Bank Deposit, Reason
Why
They have never offered me this service 15.0%
The person I send to doesn't have an account 19.5%
It doesn't seem practical to me 57.7%
© 2017 Inter-American Dialogue 19
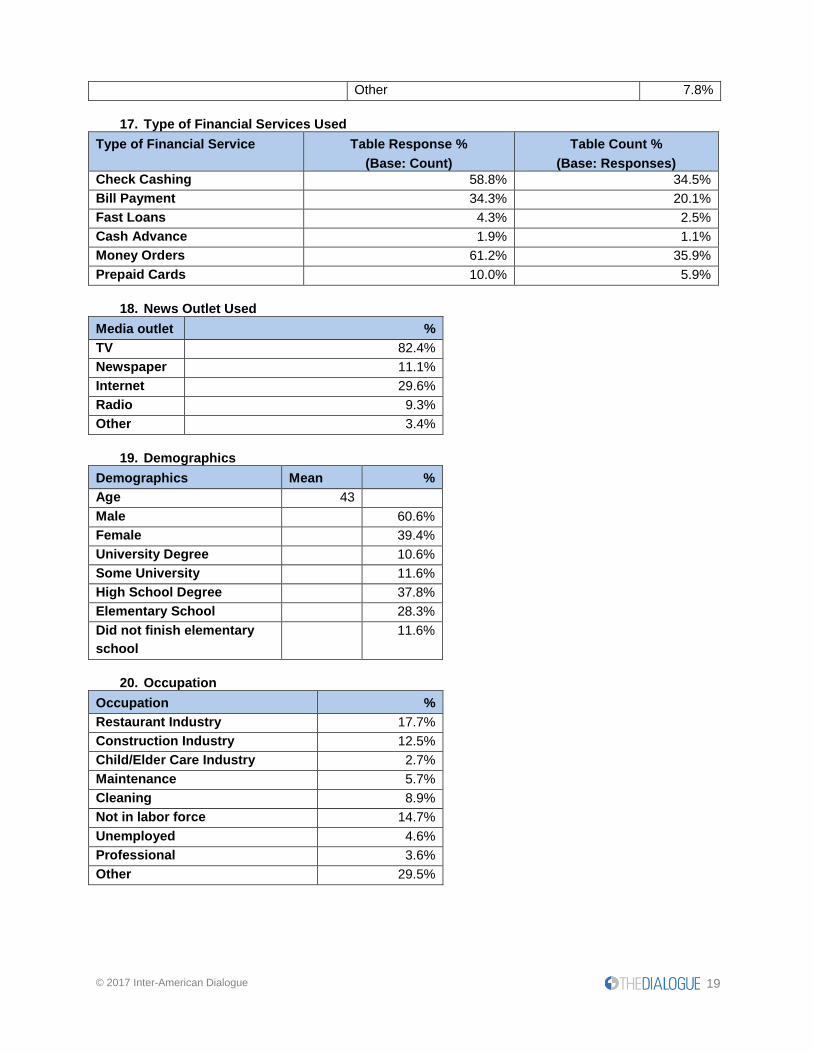
Other 7.8%
17. Type of Financial Services Used
Type of Financial Service Table Response %
(Base: Count)
Table Count %
(Base: Responses)
Check Cashing 58.8% 34.5%
Bill Payment 34.3% 20.1%
Fast Loans 4.3% 2.5%
Cash Advance 1.9% 1.1%
Money Orders 61.2% 35.9%
Prepaid Cards 10.0% 5.9%
18. News Outlet Used
Media outlet %
TV 82.4%
Newspaper 11.1%
Internet 29.6%
Radio 9.3%
Other 3.4%
19. Demographics
Demographics Mean %
Age 43
Male 60.6%
Female 39.4%
University Degree 10.6%
Some University 11.6%
High School Degree 37.8%
Elementary School 28.3%
Did not finish elementary
school
11.6%
20. Occupation
Occupation %
Restaurant Industry 17.7%
Construction Industry 12.5%
Child/Elder Care Industry 2.7%
Maintenance 5.7%
Cleaning 8.9%
Not in labor force 14.7%
Unemployed 4.6%
Professional 3.6%
Other 29.5%
© 2017 Inter-American Dialogue 20
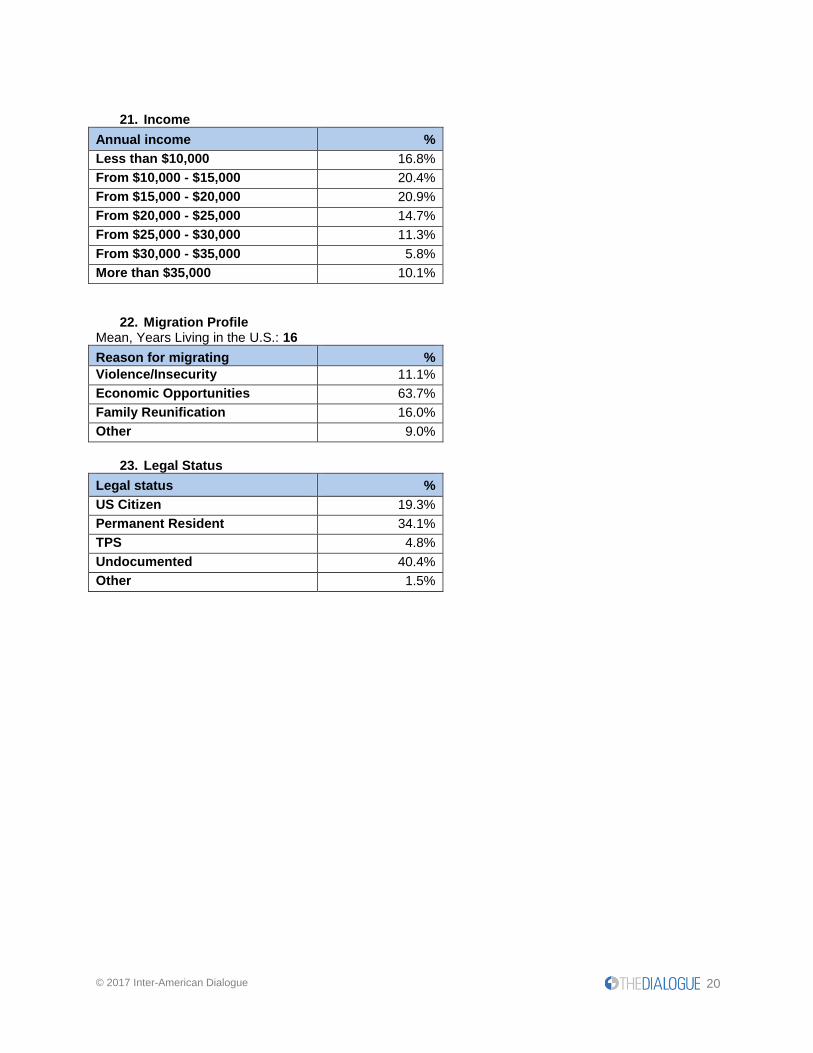
21. Income
Annual income %
Less than $10,000 16.8%
From $10,000 - $15,000 20.4%
From $15,000 - $20,000 20.9%
From $20,000 - $25,000 14.7%
From $25,000 - $30,000 11.3%
From $30,000 - $35,000 5.8%
More than $35,000 10.1%
22. Migration Profile Mean, Years Living in the U.S.: 16
Reason for migrating %
Violence/Insecurity 11.1%
Economic Opportunities 63.7%
Family Reunification 16.0%
Other 9.0%
23. Legal Status
Legal status %
US Citizen 19.3%
Permanent Resident 34.1%
TPS 4.8%
Undocumented 40.4%
Other 1.5%
© 2017 Inter-American Dialogue 21
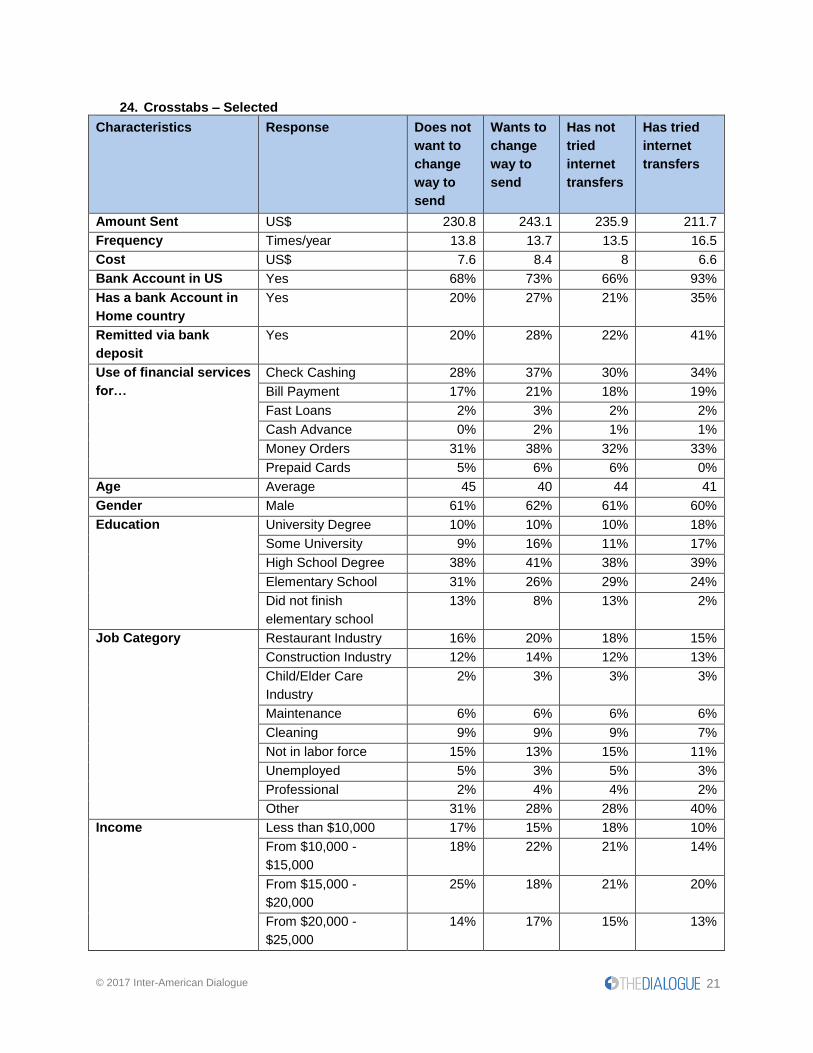
24. Crosstabs – Selected
Characteristics Response Does not
want to
change
way to
send
Wants to
change
way to
send
Has not
tried
internet
transfers
Has tried
internet
transfers
Amount Sent US$ 230.8 243.1 235.9 211.7
Frequency Times/year 13.8 13.7 13.5 16.5
Cost US$ 7.6 8.4 8 6.6
Bank Account in US Yes 68% 73% 66% 93%
Has a bank Account in
Home country
Yes 20% 27% 21% 35%
Remitted via bank
deposit
Yes 20% 28% 22% 41%
Use of financial services
for…
Check Cashing 28% 37% 30% 34%
Bill Payment 17% 21% 18% 19%
Fast Loans 2% 3% 2% 2%
Cash Advance 0% 2% 1% 1%
Money Orders 31% 38% 32% 33%
Prepaid Cards 5% 6% 6% 0%
Age Average 45 40 44 41
Gender Male 61% 62% 61% 60%
Education
University Degree 10% 10% 10% 18%
Some University 9% 16% 11% 17%
High School Degree 38% 41% 38% 39%
Elementary School 31% 26% 29% 24%
Did not finish
elementary school
13% 8% 13% 2%
Job Category
Restaurant Industry 16% 20% 18% 15%
Construction Industry 12% 14% 12% 13%
Child/Elder Care
Industry
2% 3% 3% 3%
Maintenance 6% 6% 6% 6%
Cleaning 9% 9% 9% 7%
Not in labor force 15% 13% 15% 11%
Unemployed 5% 3% 5% 3%
Professional 2% 4% 4% 2%
Other 31% 28% 28% 40%
Income
Less than $10,000 17% 15% 18% 10%
From $10,000 -
$15,000
18% 22% 21% 14%
From $15,000 -
$20,000
25% 18% 21% 20%
From $20,000 -
$25,000
14% 17% 15% 13%
© 2017 Inter-American Dialogue 22
From $25,000 -
$30,000
11% 12% 11% 17%
Over $30,000 15% 16% 14% 26%
Years Living in USA Average 16.22 15.14 15.85 14.51
Reason for Immigrating
Violence/Insecurity 10% 11% 11% 9%
Economic
Opportunities
65% 64% 64% 63%
Family Reunification 16% 17% 15% 22%
Other 10% 8% 9% 6%
Legal Status
US Citizen 21% 17% 19% 21%
Permanent Resident 32% 37% 34% 39%
TPS 4% 5% 5% 5%
Undocumented 41% 40% 41% 34%
Other 1% 1% 2% 1%
Assessment of MTO
services
Positive 68% 59% 63% 73%
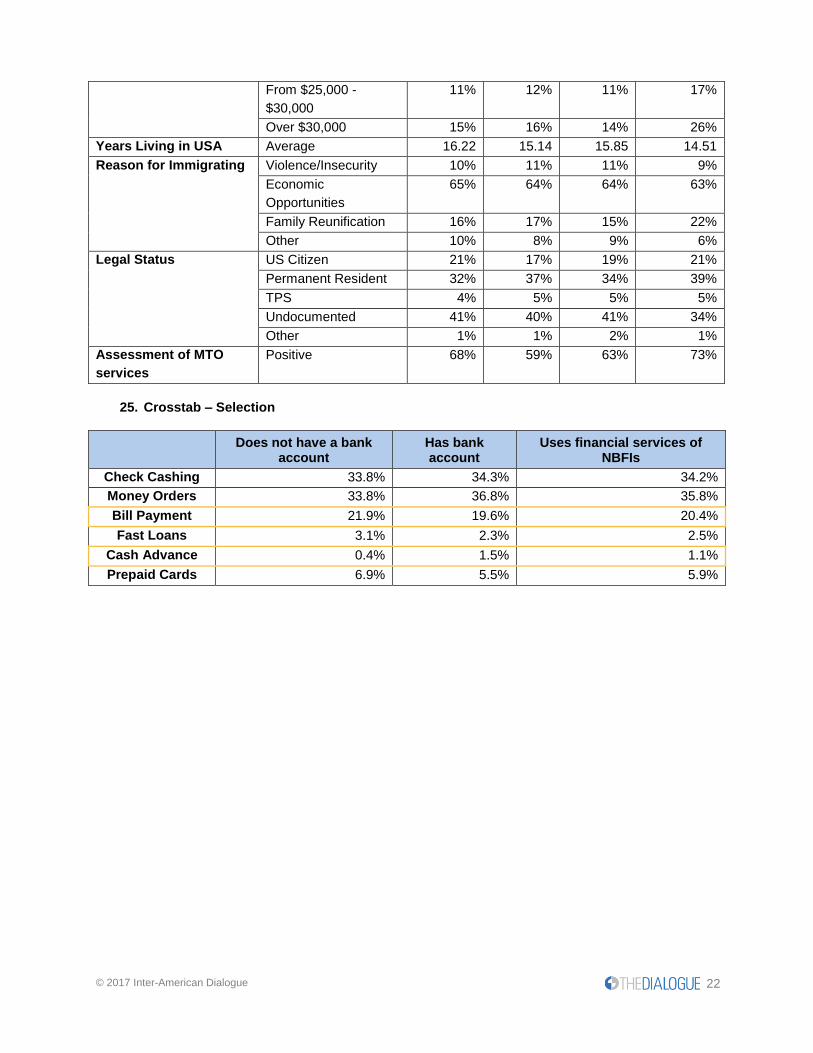
25. Crosstab – Selection
Does not have a bank account
Has bank account
Uses financial services of NBFIs
Check Cashing 33.8% 34.3% 34.2%
Money Orders 33.8% 36.8% 35.8%
Bill Payment 21.9% 19.6% 20.4%
Fast Loans 3.1% 2.3% 2.5%
Cash Advance 0.4% 1.5% 1.1%
Prepaid Cards 6.9% 5.5% 5.9%