online appendix for: stretch goals and the distribution of organizational...
TRANSCRIPT

ONLINE APPENDIX
1
Online Appendix for:
Stretch Goals and the Distribution of Organizational Performance
Table of Contents A1. Additional Description of the People Express Simulation Microworld A2. Screenshot of People Express Microworld graphical user interface A3. Table of assigned stretch (moderate) goal levels & incentive payments for Study 2 A4. Willingness to Take Risk Measure A5. Goal Commitment Measure
A1. Additional Description of the People Express Simulation Microworld
The exogenously assigned stretch goals for cumulative net income require decision makers to grow
the People Express business. Growing the simulated airline from startup to a profitable major carrier
involves numerous trade-offs. For example, offering a no-frill service can lower costs and enable the
airline to be profitable with very low fares. Low fares increase competitiveness and lead to demand
growth. However, it takes time to hire and train employees who can provide high quality service,
including reservations, check-in, boarding and de-boarding, baggage handling, and in-flight services.
Rapid growth can cause staff shortages and skill dilution, eroding service quality, competitive
advantage and demand. In addition, staff and skill shortfalls increase the workload, leading to long
hours, fatigue and burnout, increasing employee turnover, increasing working hours for the remaining
employees, and the time they must spend recruiting and training new employees in a set of vicious
cycles. Declining service quality further boosts employee turnover and undermines the airline’s
reputation, eroding demand and financial performance, with potentially irreversible outcomes.
Limiting fleet and staff growth to avoid triggering these vicious cycles, however, can lead to
crowding and congestion causing delays, bumped passengers, and service problems. These problems
erode demand and threaten the survival of the airline. Further, if decision makers do succeed in
growing the business, competitors respond by cutting their fares to protect their market share. If
customer service is high, the simulated airline can survive. However, if rapid growth has eroded

ONLINE APPENDIX
2
service quality so that low fares are the only remaining source of competitive advantage, competitor
fare cuts can be fatal.
Despite the realistic complexity of the simulated airline there are strategies that result in profitable
growth. Consistent with the simulation, the majority of low-cost, no-frills airlines have failed in the
US and in Europe (see Button 2012). A few have survived (e.g., RyanAir, Spirit) and even fewer have
profitably achieved scale (e.g., Southwest Airlines).
As shown in A2, the graphical user interface includes a number of reports and graphs that are
available throughout the simulation to help participants make decisions. Although decision makers
receive outcome feedback after each quarter (from the reports and graphs), it is important to note that
this information does not tell them if they will achieve the goal for profit because the short run impact
of decisions may, and often does, differ from the long run impact. For example, buying additional
aircraft and hiring the people to staff them may lower profit in the short run. However, by expanding
the route network and reducing crowding, they may expand the potential market and improve service
quality, thereby increasing profitability in the future.

ONLINE APPENDIX
3
A2. Screenshot of People Express Microworld graphical user interface

ONLINE APPENDIX
4
A3. Table of assigned stretch (moderate) goal levels & incentive payments for Study 2
Note: The assigned stretch goals are the first number in column 2 and the moderate goals are in parentheses.
Goal Manipulation in Study 2
Participants in Study 2 received a memorandum that included Table A3 showing their annual goals
for cumulative net income (i.e., profit) for years 3 through 10 of the simulation. No goal is assigned
through year 2 because startups such as that represented in the simulation often initially lose money
before becoming profitable. The table provides participants with a combination of short- and long-
term goals rather than a long-term goal alone (as was the case in Study 1). The goals consist of targets
for cumulative net income in each year of the simulation that, if achieved, will attain the long-term
goal for final cumulative net income. Combining short- and long-term goals increases performance on
complex tasks compared with providing long-term goals alone (Latham and Seijts 1999). Also, short-
term goals such as annual profit targets are common in many organizations.
The goal levels for both the moderate and stretch goal conditions were increased for Study 2 after
pilot testing revealed that combining short- and long-term goals provided decision makers with more
information about potential strategies in the simulation, leading to better performance. The average
compound growth rate of cumulative profit in the stretch (moderate) goal condition is 47%/year
(29%/year).
Although challenging, the stretch goal levels are well below what is achievable. To ensure the
goal levels were attainable, we examined the performance of numerous benchmark strategies for
managing the simulated firm. The benchmark strategies consist of simple decision rules for fleet
By the end of Cumulative Net Income
Goal ($ million) Your Actual Cumulative Net Income ($ million)
Payment for achieving target
Year 1 Qtr 4 No annual goal No Payment Year 2 Qtr 4
Year 3 Qtr 4 31.5 (18.8) $2.00 Year 4 Qtr 4 56.6 (27.7) $2.00 Year 5 Qtr 4 99.2 (39.2) $2.00 Year 6 Qtr 4 171.6 (54.4) $2.00 Year 7 Qtr 4 269.3 (72.0) $2.00 Year 8 Qtr 4 401.3 (92.4) $2.00 Year 9 Qtr 4 579.5 (116.0) $2.00 Year 10 Qtr 4 820.0 (143.5) $6.00

ONLINE APPENDIX
5
acquisition, hiring, pricing, etc. The benchmark rules are not optimal, but constitute behaviorally
realistic, boundedly rational heuristics such as ‘hire enough people to replace employee attrition plus a
certain number for each new aircraft acquired.’ A plausible benchmark decision rule generates
cumulative profit 265% higher than the stretch goal for year 10.
A4. Willingness to Take Risk Measure
Prior to each simulation round, participants completed an online survey to assess their willingness to
take risk in making decisions to manage their simulated airline. There was a short explanation for
participants to read first, followed by six questions. Participants answered each question using a
continuous slider bar to select a response along an 11-point Likert scale anchored by 0 = “No Risk”
and 10 = “Extreme Risk.” Each participant’s willingness to take risk score is the average across the
six items. The text explaining the survey is below followed by response scale and the six questions.
---------------------
People often see some risk in situations that contain uncertainty about what the outcome or
consequences will be and for which there is the possibility of ‘bad’ consequences. However, riskiness
is a very personal notion, and we are interested in your assessment of how much risk you plan to take
in making decisions in the simulation.
For your upcoming simulation round, think about how much risk you will take in your decisions
(0 = No Risk, 10 = Extreme Risk).
0 2 4 6 8 10
No Risk Moderate Risk Extreme Risk
1. How much risk will you take in your aircraft purchasing decisions? 2. How much risk will you take in your fare decisions? 3. How much risk will you take in your decisions about the fraction of revenue to spend on
marketing? 4. How much risk will you take in your decisions about hiring employees? 5. How much risk will you take in your decisions about target service scope? 6. How much risk will you take overall across the complete set of decisions?
ONLINE APPENDIX
6
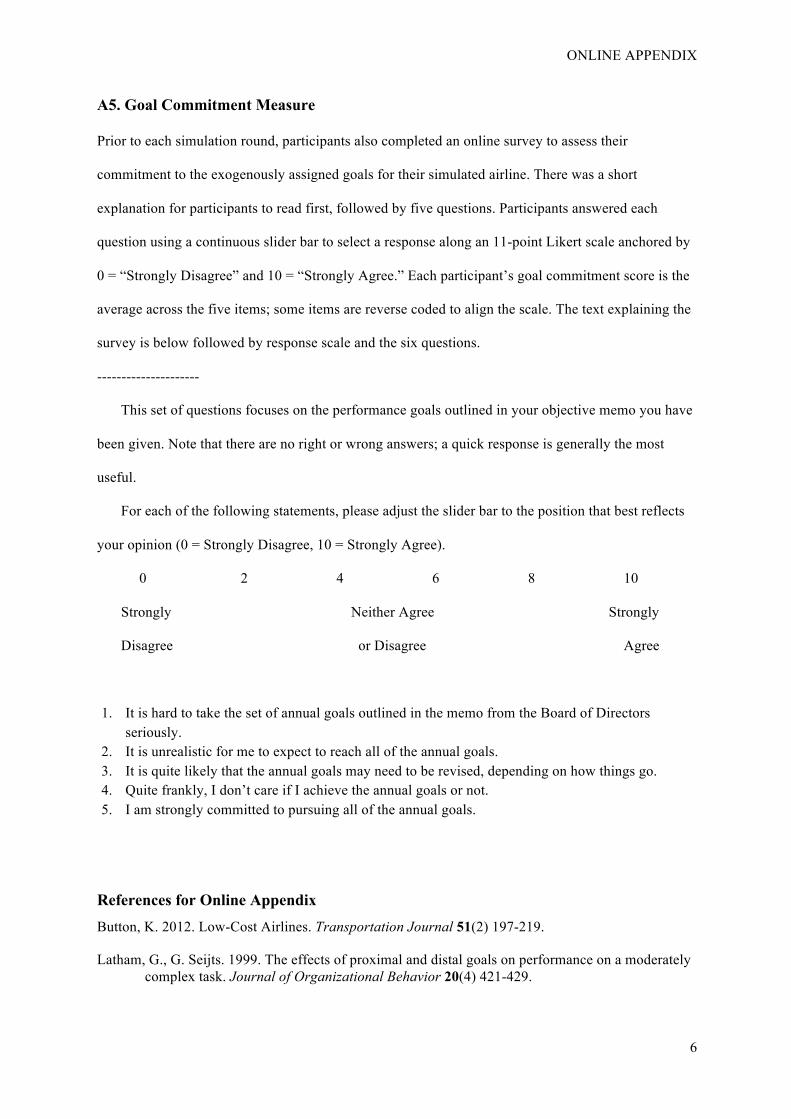
A5. Goal Commitment Measure
Prior to each simulation round, participants also completed an online survey to assess their
commitment to the exogenously assigned goals for their simulated airline. There was a short
explanation for participants to read first, followed by five questions. Participants answered each
question using a continuous slider bar to select a response along an 11-point Likert scale anchored by
0 = “Strongly Disagree” and 10 = “Strongly Agree.” Each participant’s goal commitment score is the
average across the five items; some items are reverse coded to align the scale. The text explaining the
survey is below followed by response scale and the six questions.
---------------------
This set of questions focuses on the performance goals outlined in your objective memo you have
been given. Note that there are no right or wrong answers; a quick response is generally the most
useful.
For each of the following statements, please adjust the slider bar to the position that best reflects
your opinion (0 = Strongly Disagree, 10 = Strongly Agree).
0 2 4 6 8 10
Strongly Neither Agree Strongly
Disagree or Disagree Agree
1. It is hard to take the set of annual goals outlined in the memo from the Board of Directors seriously.
2. It is unrealistic for me to expect to reach all of the annual goals. 3. It is quite likely that the annual goals may need to be revised, depending on how things go. 4. Quite frankly, I don’t care if I achieve the annual goals or not. 5. I am strongly committed to pursuing all of the annual goals.
References for Online Appendix Button, K. 2012. Low-Cost Airlines. Transportation Journal 51(2) 197-219.
Latham, G., G. Seijts. 1999. The effects of proximal and distal goals on performance on a moderately complex task. Journal of Organizational Behavior 20(4) 421-429.