online supplement 3 - thorax · given the variability in thorax shape and the position of lungs...
TRANSCRIPT

Chest electrical impedance tomography examination, data analysis,
terminology, clinical use and recommendations: consensus statement of
the TRanslational EIT developmeNt stuDy group
Inéz Frerichs, Marcelo B. P. Amato, Anton H. van Kaam, David G. Tingay, Zhanqi Zhao,
Bartłomiej Grychtol, Marc Bodenstein, Hervé Gagnon, Stephan H. Böhm, Eckhard Teschner,
Ola Stenqvist, Tommaso Mauri, Vinicius Torsani, Luigi Camporota, Andreas Schibler, Gerhard
K. Wolf, Diederik Gommers, Steffen Leonhardt, Andy Adler, TREND study group
ONLINE SUPPLEMENT 3
EIT waveforms and regions-of-interest

EIT wa
This ele
raw EIT
The mo
phenom
wavefor
wavefor
and EIT
Figure
EOS 3
Abbrevi
of-inter
ventilat
EIT wa
An EIT
generat
global o
impeda
or aver
from th
origins
spontan
aveforms
ectronic onli
T images an
ost commo
mena are ex
rms. Finally
rms. Figure
T data analy
E3.1. Seq
(gray back
iations: EOS
est; CoV, c
tion delay; R
aveforms
T waveform
ted online o
or regional
nce change
rages of rel
e smallest “
EIT wavefo
(Figure E3
neous venti
s and regi
ine supplem
nd how they
n regions o
xplained, fo
y, we addre
e E3.1 show
ysis and the
uence of p
kground) d
S, electroni
center of ve
R, right; L, l
m is a sequ
or offline, f
. The glob
es of all ima
ative imped
“ROI”, a sin
orms consi
3.2). Period
ilation and
ons-of-in
ment (EOS 3
y are affect
of interest
llowed by t
ess the issu
ws the sequ
e place of th
rocesses in
describes th
c online su
entilation; U
left.
uence of i
from a time
al impedan
age pixels,
dance chan
ngle image p
st of differ
dic (or qua
cardiac ac
nterest
3) describes
ted by the m
(ROI) used
the filtering
ues of nois
uences of al
his EOS in t
nvolved in E
he EIT wav
upplement;
U/L, upper-
mpedance
e series of
nce wavefo
while regio
ges within
pixel.
rent period
asiperiodic)
ction, as w
s how EIT w
main physio
d to quant
procedures
e and othe
ll processes
he sequenc
EIT chest ex
veforms an
tdEIT, time
-to-lower ve
change va
raw EIT im
rm is base
onal impeda
defined RO
dic and non
signals ar
well as inter
waveforms a
ological proc
titatively an
s useful for
er interferen
s involved in
ce.
xamination
nd regions
e-difference
entilation ra
alues as a
mages. EIT
d on the s
ance wavefo
OIs. Pixel w
n-periodic s
e related t
rferences fr
are generat
cesses in th
nalyze EIT
the analysi
nces impact
n EIT exam
and data a
of interest
e EIT; ROI,
atio; RVD,
function o
waveforms
sum or ave
forms are th
waveforms o
signals of
to mechan
rom some
2
ted from
he chest.
regional
is of EIT
ting EIT
minations
analysis.
t (ROI).
region-
regional
of time,
s can be
erage of
he sums
originate
multiple
ical and
medical
devices
may be
from in
baseline
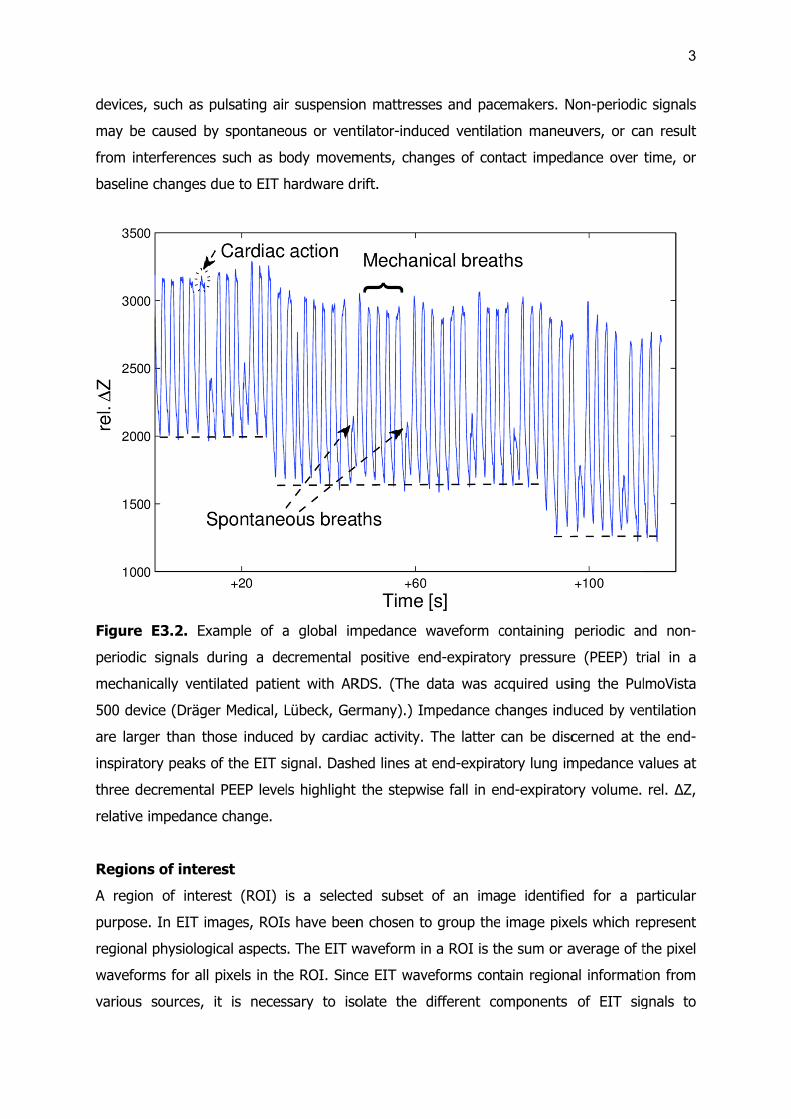
Figure
periodic
mechan
500 dev
are larg
inspirat
three d
relative
Region
A regio
purpose
regiona
wavefor
various
, such as p
e caused by
terferences
e changes d
E3.2. Exa
c signals d
nically venti
vice (Dräge
ger than th
tory peaks o
ecremental
impedance
ns of intere
on of intere
e. In EIT im
al physiologi
rms for all
sources,
pulsating air
y spontaneo
s such as b
due to EIT h
ample of a
uring a de
ilated patie
er Medical, L
ose induce
of the EIT s
PEEP level
e change.
est
est (ROI)
mages, ROIs
ical aspects
pixels in th
it is neces
r suspensio
ous or vent
body movem
hardware dr
a global im
ecremental
ent with AR
Lübeck, Ger
d by cardia
signal. Dash
ls highlight
is a selecte
s have been
s. The EIT w
e ROI. Sinc
ssary to iso
on mattresse
tilator-induc
ments, chan
rift.
mpedance w
positive en
RDS. (The d
rmany).) Im
ac activity.
hed lines at
the stepwi
ed subset
n chosen to
waveform in
ce EIT wave
olate the d
es and pac
ced ventilat
nges of con
waveform c
nd-expirator
data was a
mpedance c
The latter
end-expira
se fall in en
of an ima
o group the
n a ROI is th
eforms cont
different co
emakers. N
tion maneu
ntact imped
containing
ry pressure
cquired usi
changes ind
can be disc
tory lung im
nd-expirato
ge identifie
image pixe
he sum or a
tain regiona
omponents
Non-periodic
uvers, or ca
dance over
periodic an
e (PEEP) tr
ing the Pul
duced by ve
cerned at t
mpedance v
ory volume.
ed for a p
els which re
average of t
al informati
of EIT sig
3
c signals
an result
time, or
nd non-
rial in a
lmoVista
entilation
the end-
values at
rel. ΔZ,
articular
epresent
the pixel
on from
gnals to
4
quantitatively analyze the images using relevant EIT measures (EOS 5). By the definition of
the ROI, image pixels are chosen to reflect the regional changes associated with relevant
physiological or pathological effects. The other approach to isolate regional information from
the images is filtering, discussed in the section “Frequency filtering” later in this EOS.
In the most common case, ROIs are defined to assess regional ventilation. For
example, ROIs of horizontal layers are appropriate for monitoring ventilation-related
pathology which affects both lungs equally, and for assessing dependent vs. non-dependent
lung behavior. ROIs that separate the left and right lungs are suitable for monitoring
pathology likely to affect each lung differently. ROIs can also be defined to assess cardiac-
related impedance changes. The anatomical location of breathing and heart beat-related
impedance changes has been validated to correspond to the correct anatomical locations,
when using anatomically accurate reconstruction algorithms (1).
Geometrical ROIs
The simplest ROIs are defined geometrically as equal horizontal and/or vertical divisions of
the image region, as illustrated in figure E3.3 (top row). Such regions are defined by
horizontal and vertical slices which divide the image region into equally sized rectangles.
In cases where the physiology of interest is distributed in the anteroposterior
direction, ROIs divide the image region with horizontal divisions. The minimum is a division
into two regions, the anterior and the posterior (i.e., the upper and the lower in supine
subjects). This approach has been used to calculate the ratio of anterior-to-posterior (i.e.,
upper-to-lower ventilation ratio) (2, 3), a measure originally called the "impedance ratio" (4)
(see also EOS 5). The image region may be further divided into smaller ROIs if necessary
(5-7). The maximum number of horizontal ROIs is the image resolution, where each
horizontal ROI is a pixel height (typically 32 pixels for most common reconstruction
algorithms) (8-10). This maximum vertical resolution increases the sensitivity of EIT data
analysis for ventilation distribution monitoring (11). In figure E3.3, a division into two regions
and into a larger numbers of regions is shown.
A further division of ROIs is to consider the left/right division between image regions
(3, 12). Another common type of ROIs is generated by dividing the image regions into four
quadrants (13).
There are a few drawbacks of horizontal ROIs defined on the global image. First,
given the variability in thorax shape and the position of lungs within it, it is common that the
most dependent ROIs contain only a small or no lung region. This is especially likely in
obese patients where there is a larger layer of tissue surrounding the lungs. In this case, no
5
ventilation signal will be present in these dependent ROIs. The low signals in dependent
ROIs can also be caused by lung collapse in these regions. One way to address this issue is
to define the geometrical ROIs not within the whole image but only in a ROI representing
the lungs (see the section “Lung ROIs” below). In this case, the lung ROI is first detected,
and then horizontal or vertical geometrical divisions are identified in that region (14). In
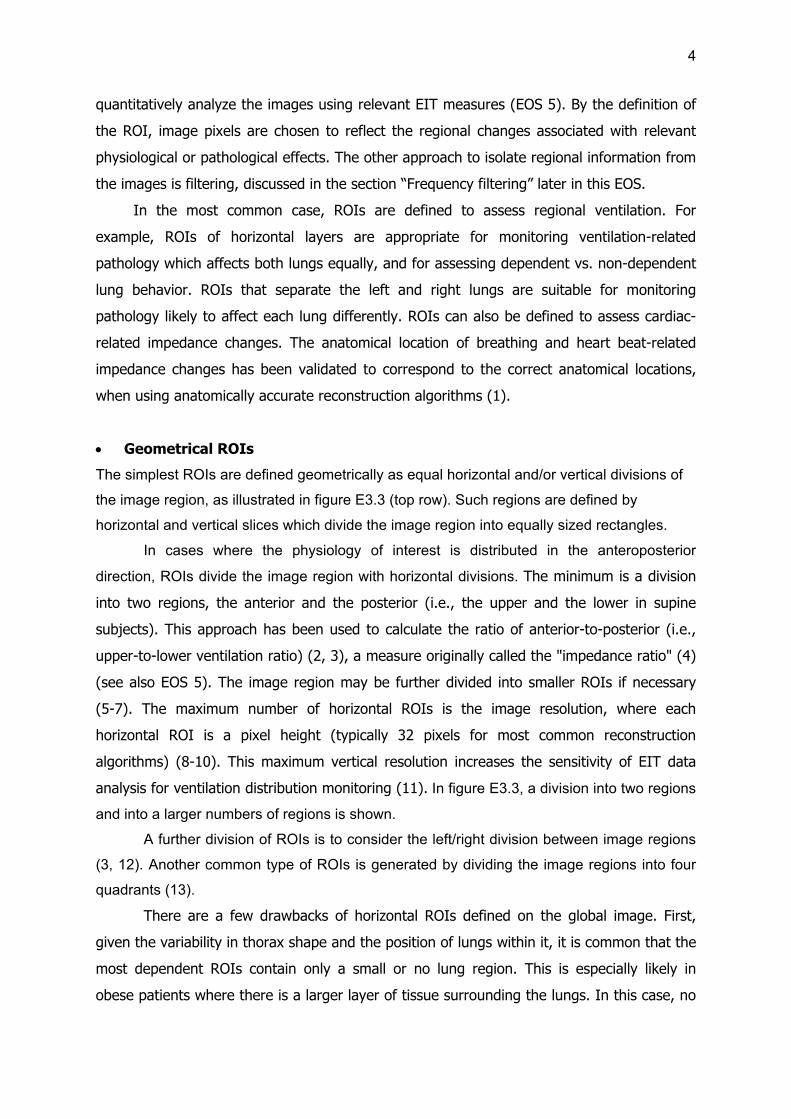
Figure E3.3, the top row shows the global image region and its subdivisions, while the
bottom row shows subdivisions of the lung ROI.
Figure E3.3. Different types of ROIs used to characterize the distribution of ventilation. The
top row shows ROIs for the global image, while the bottom row illustrates ROIs for the
division of the lung region only. From left to right: 1) global region, 2) anterior (upper) and
posterior (lower) regions, 3) image quadrants (anterior right, anterior left, posterior right,
posterior left), 4) multiple layers (six illustrated), and 5) multiple layers with left/right
division. (Areas with oblique lines are contained within the respective ROIs.)
Lung ROIs
As discussed above, some EIT image analysis methods require the identification of the lung
regions (14-19). Most of the lung ROI identification methods identify lungs as regions with
large values in functional EIT images (see also EOS 4). In these methods, the lung is the
region in which fEIT image values are above a threshold, defined as a fraction of the
maximum image value. Use of a smaller threshold increases the ROI size. It makes the
identification of lung regions more complete, however, some nearby non-lung regions are
detected as well. A larger threshold has the opposite effect. It better rejects the non-lung
regions, but it is less able to detect all lung regions. Pulletz et al. and Becher et al. analyzed
the influence of threshold settings for this purpose (11, 20). The definition of the ROI using
a threshold of 20–35% of the maximum pixel values was recommended. Higher threshold
values have been shown to obscure the differences in the degree of ventilation homogeneity

6
between ARDS patients and patients with healthy lungs (20). The impact of the type of
functional images used to generate the lung ROIs on the quantitative analysis of ventilation
distribution was also examined (21). Dynamic determination of threshold values is also
possible (22). However, there is no optimal threshold value that can separate lung regions
from other thoracic tissues.
Figure E3.4. EIT examination of an anesthetized supine patient ventilated at different end-
expiratory pressure (PEEP) values using the PulmoVista 500 device (Dräger Medical, Lübeck,
Germany). The two tidal images (top right) show the ventilation distribution at PEEP of 5
and 15 cmH2O, the differential image (top left) highlights the loss (orange) and gain (blue)
in regional ventilation between these two time points (cursor 1 and cursor 2). The lung ROIs
identified from the two tidal images are plotted as blue (PEEP 5 cmH2O) and red (PEEP
15 cmH2O) lung contours at the right top edge of the figure. Note that the ventral and
dorsal boundaries at PEEP 5 are positioned above the corresponding PEEP 15 boundaries.
A further issue that needs to be taken into account when lung ROI is defined is that
the ventilation distribution depends on the ventilator setting, for instance the end-expiratory
pressure (PEEP). At low PEEP, ventilation occurs mainly in non-dependent regions, and at

7
high PEEP levels, ventilation shifts toward dependent regions (Figure E3.4). Thus, to
approximate the total lung area, it is useful to combine the regions identified at low and at
high PEEP. However, this solution is still unable to identify collapsed lung regions. To
identify such non-ventilated lung tissue, some other approaches have been developed.
Mirroring the lung areas from one side to the other will include collapsed regions which are
present in one lung but not the other (23). Since perfusion may still be present in collapsed
lung tissue, ROI definitions from the EIT perfusion signal may be added to the ventilation-
defined lung ROI (24). Given that lung size in healthy adults depends on the height (25) and
weight, (26) built a database of lung sizes and locations in EIT images from CT images and
correlated them with height and weight measurements. Using this database, it is possible to
estimate the lung ROI and thorax shape in an image from a patient’s height and weight.
The heart region is more difficult to identify than the lungs because the cardiac-
related signals are smaller, and there are cardiac-frequency contributions throughout the
image. This means that a simple frequency filter will identify a larger region than the heart.
Several more sophisticated techniques have been proposed (1, 16, 23, 27, 28). ROIs have
been identified with ECG gating (29, 30) or principal component analysis (24, 31), and
separate the heart area and the perfused lung tissue region. A common approach used by
many of these techniques is an initial identification of the lung ROI, and then the use of this
region to exclude areas which would otherwise be identified by cardiac-frequency filtering.
Examples of ROIs and associated waveforms
Three typical ROI definitions for regional lung ventilation and their associated waveforms are
illustrated in figure E3.5. In this example, a linear regression functional EIT image (fEIT) is
shown, where colors are normalized to the maximum image value. Two divisions of the
global fEIT image are shown. Figure E3.5 (left) shows four quadrants. Figure E3.5 (right)
shows four anteroposterior layers with equal height. A lung ROI is shown (Figure E3.5,
middle). Here the lung region is defined as those pixels with values above a threshold of
20% of the maximum.

Figure
healthy
Goe-MF
quadran
anterop
normali
changes
impeda
EIT sca
Ava
Modern
systems
frames
means
that ea
reductio
at high
E3.5. Com
volunteer
F II device
nts, lung
posterior lay
zed to 100%
s within th
nce change
an rate
ailable sca
n medical E
s offer muc
per second
that transie
ach measur
on in the si
scan rates
mmonly use
during pulm
(CareFusio
regions w
yers with e
%. Regiona
he correspo
es.
n rates fro
EIT equipm
ch faster rat
d (32). Inc
ent phenom
rement mu
gnal quality
also results
ed regions
monary fun
on, Höchbe
ith a thre
equal heigh
al impedanc
onding ROI
om typical
ent offers
tes, includin
creasing the
mena can b
ust be mad
y. For applic
s in large da
of interest
ction testin
erg, Germa
eshold of
hts. The g
ce waveform
Is during
l EIT equip
a scan rat
ng an indust
e scan rate
be better re
de more q
cations of p
ata files.
t (ROIs) de
ng. (The raw
any).) ROIs
20% of m
lobal imped
ms and perc
the forced
pment
te from 10
trial system
e increases
esolved. Sin
uickly, high
prolonged m
efined in an
w data was
s from left
maximum i
dance wave
centages re
maneuver
-50 scans
m with a fram
the tempo
nce a highe
her rates m
monitoring,
n fEIT ima
s acquired w
to right a
mage valu
eform (left
epresent imp
r. rel. ΔZ,
per second
me rate up
oral resoluti
er scan rate
may also c
recording E
8
age of a
with the
are four
ue, four
top) is
pedance
relative
d. Some
to 1000
ion, and
e means
cause a
EIT data

Sca
The EIT
analyze
minute
accordin
second
related
features
classica
(measu
required
Figure
PulmoV
pig dur
and EIT
represe
change
frequen
because
lungs m
These e
We rec
an rate req
T scan rate
ed. Respirat
(~0.67 Hz)
ng to the
should be
signals. In
s in the ca
al sampling
rements in
d sampling
E3.6. Glo
Vista 500 EI
ring high-fre
T scan rat
ent the card
.
Thus, in pra
ncy details o
e lung ven
may have slo
effects incre
commend a
quirements
e requireme
tory frequen
). Assuming
Nyquist–Sh
sufficient fo
n practice,
ardiac activi
theory is no
an EIT sc
rate to avo
bal impeda
IT device (D
equency os
te 40 Hz. S
diac-related
actice, high
of these EIT
tilation and
ow and fas
ease the sca
a scan rat
s for typica
ents depend
ncy in adult
g a heart r
hannon sam
or the samp
such as sc
ity within e
ot directly a
an are mad
id aliasing (
ance wavefo
Dräger Med
scillatory ve
Slower per
signal (the
her scan rat
T signals. T
d heart act
t compartm
an rate requ
e above 1
al monitor
d on the fre
ts and child
rate lower t
mpling theo
pling and s
can rate is
each beat,
applicable, s
de sequent
(34).
form (left)
dical, Lübec
entilation. T
riodic imped
e heart rate
tes are reco
The respirat
tion are no
ments (35) a
uirements fo
10 Hz for
ring tasks
equency of
dren is usua
than 180 be
orem, a sc
separation o
far too lo
which shou
since EIT sa
tially (33)).
and fEIT im
ck, German
The oscillato
dance chan
was 1.3 Hz
ommended,
ory and hea
t strictly pe
and thus be
or respirato
analyzing v
the signal
ally lower th
eats per m
an rate ab
of the respir
w. First, th
uld be reso
amples both
The effect
mage (right
y) in an a
ory ventilat
nges in the
z). rel. ΔZ,
in order to
art rate ma
eriodic. Add
e ventilated
ory and card
ventilation-
componen
han 40 brea
inute (3 Hz
bove 6 fram
ratory and
here are im
olved. Furth
h in space a
t is to incre
t) acquired
anesthetized
tion rate w
e global w
relative imp
capture th
ay vary dram
ditionally, d
d inhomoge
diac-related
related imp
9
ts to be
aths per
z), then,
mes per
cardiac-
mportant
hermore,
and time
ease the
d by the
d supine
as 9 Hz
aveform
pedance
e higher
matically
diseased
neously.
signals.
pedance
10
changes and 25 Hz for cardiac-related impedance changes. For high frequency oscillatory
ventilation, which contributes much higher frequency signals, the scan rate of EIT should
correspondingly larger (Figure E3.6). High scan rates are also needed for the assessment of
rapid gas volume changes at high air-flow rates (35-41).
Frequency filtering
Definition and application
Cardiac action and ventilation occur at different rates in humans, and their EIT signals
components can thus be discriminated using frequency filtering (29, 42, 43). The breathing
rate (12 -16 breaths/min in a spontaneously breathing adult) is typically much lower than
cardiac rate (60 – 90 beats/min). It is therefore possible to design a digital filter to separate
the ventilation and cardiac activity components provided by EIT. In the simplest case, a low-
pass filter (which lets low-frequency components of a signal “pass” through while removing
higher frequencies) identifies the ventilation signal while a high-pass filter with an opposite
effect identifies cardiac-related information. In practice, however, a band-pass filter (which
lets a range of frequencies pass while removing higher and lower frequencies) is used. It
removes some low-frequency disturbances (e.g. baseline drift related to hardware or drying
of the electrode gel) as well as high-frequency error sources (e.g. other interfering electrical
equipment). The band-pass filters can be generated by defining the expected normal
frequency ranges for breathing and cardiac activity. Other band-pass filters are designed
centered around a single frequency with an appropriate bandwidth. The center frequency of
the filter may be obtained directly from the ventilator or ECG monitor, from a human
operator analyzing the signal spectrum or from an automated algorithm that identifies the
highest peaks from the frequency spectrum (corresponding to the first harmonics) in the
frequency ranges expected for ventilation or cardiac activity.
Digital filtering can be performed in two ways. The raw EIT data can be filtered, and
then reconstructed, or the pixel waveforms in a sequence of raw EIT images can be filtered.
The results of both of these operations are identical when the reconstruction algorithm is
linear, which is the case for most of the commonly used reconstruction algorithms for chest
imaging. The digital filters can be implemented either in the time or frequency domains. The
design of digital filters is beyond the scope of this document, but many textbooks and
software toolboxes are available to assist in their design. In the design of digital filters, there
are several issues, such aliasing and the effects of scan time and non-periodic signals, that
can contribute undesired effects. They are discussed in the following paragraphs.

11
Other techniques such as ECG-gated EIT acquisition (17) and principal component
analysis (PCA) (24) have been proposed to circumvent some of the limitations observed with
frequency filtering. Some papers combine one of these two techniques with frequency
filtering to achieve better separation of the ventilation and cardiac activities (24). ECG-gating
can be performed at the hardware level where a series of EIT measurements are
automatically triggered whenever a QRS complex is detected in the patient’s ECG. When the
ECG is acquired simultaneously and synchronized with the EIT measurements, ECG-gating
can also be performed by post processing the acquired EIT data to identifying those EIT
frames where a QRS complex was synchronously detected in the ECG. Ensemble averaging
can then be performed on ECG-gated EIT measurements to improve the signal-to-noise ratio
(SNR) of the cardiac-related information from the EIT measurement. The same gating
process can also be performed using the ventilator trigger instead of the QRS complex in
order to increase the SNR of the ventilation-related information.
Aliasing
The most important signal processing issue to consider when using digital frequency filtering
is aliasing. Aliasing is a signal artefact in which content at one frequency in the original data
is represented at a different frequency in the filter output. It occurs when the sampling
frequency is not high enough for the frequency content of the signal. According to the
Nyquist-Shannon sampling theorem, aliasing occurs when the sampling rate is less than
twice the maximum frequency component of the signal. One special worry is that frequency
components near the sampling frequency can appear via aliasing as low frequency artefacts
in the image. As mentioned, EIT has a mix of spatial and temporal aliasing which is more
complicated than that described by the Nyquist-Shannon theory (33, 34). Extra care should
be taken when the heart rate is an exact multiple of the ventilation rate (or the vice versa,
with high-frequency ventilation) which could occur for instance if ventilation occurs in
neonates at e.g. 40 breaths/min and a heart rate of 120 beats/min. The cardiac frequency
would then be contaminated with the third harmonic of the ventilation making it impossible
to discriminate between them with frequency filtering alone.
Inadequate sample time
Unlike the sampling frequency, a parameter that is sometimes neglected in design of data
acquisition is the duration of sample acquisition, or sample time (T ). In cases where data
are acquired only for a very short sample time, it is impossible to discriminate between close
adjacent frequencies, and they will appear superposed in the spectrum. The frequency

12
resolution, or the difference between adjacent frequency bins, is given by the inverse of the
sample time, 1/T. The frequency resolution is also the lowest frequency difference that is
distinguishable in the signal. For example, if 30 seconds of EIT data are acquired, it will not
be possible to distinguish frequencies which differ by 1/30 s (2 per minute), making
ventilation frequencies of 6 and 8 breaths per minute appear identical.
Non-periodic changes
Frequency filtering works well in simple cases where the respiratory and heart rates are well
separated and do not vary during the whole acquisition time (in the signal processing
literature, this is referred to as a “stationary” signal). A mechanically ventilated patient with
a constant tidal volume (VT) and breathing rate can be considered a stationary EIT signal
source, assuming the heart rate was also relatively constant over the period of time. During
spontaneous breathing, the breathing rate can greatly vary and including pauses in
breathing (e.g. sleep apnea). The heart rate might also vary, especially if the subject is
performing tasks which include exercise. In such cases, an adaptive filtering strategy would
be recommended, in which filters adapt over time to best match the frequencies of the heart
and breathing activity.
Other (patho-)physiological events that may be visible in EIT data, such as dynamic
hyperinflation, produce non-periodic changes of impedance that might be missed if high-
pass frequency filtering alone is used, since it typically removes very slow changes. This is
true also of changes in ventilator settings, such as PEEP or VT. Slow changes of the EIT
signal can also occur due to hardware electronic drift, drying of the electrode gel or patient
movement (resulting in posture or electrode position changes). Although these slow
impedance changes are often not clinically relevant, it might be difficult in some cases to
distinguish them from those occurring from physiological events such as the onset of
atelectasis or pulmonary edema.
Description of expected waveforms
Ventilation-related changes in EIT waveforms
The shape of EIT waveforms is altered by any frequency filtering applied to the signals.
Commercially available EIT devices often set filters automatically to enhance visualization of
ventilation waveform (i.e., by low-pass filtering).
In the case of a completely passive mechanically ventilated patient, ventilation
impedance-time waveforms usually present a stable end-expiratory level. After an

impeda
corresp
value ty
tidal im
mode),
observa
hand, d
regiona
regiona
Figure
PulmoV
(blue) a
global E
and ma
level ca
can incr
the sha
similar t
cases, s
informa
nce increas
onding to e
ypically reac
There is a
mpedance ch
the shape
ation time w
during pres
al impedanc
al respiratory
E3.7. EIT
Vista 500 d
and volume
EIT wavefor
For sponta
agnitude of
an vary ove
rease or de
ape of eac
to that in c
several min
ation.
se during
end–inspirat
ches the pre
close corre
hanges. If V
and dimen
would be e
ssure-contro
ce wavefor
y system co
waveform
evice (Dräg
e (red) signa
rm. Paw, air
neously bre
f the ventil
er time, and
ecrease end
h deflection
controlled ve
nutes of obs
inspiration,
tion. The w
evious end-
elation betw
VT does not
nsion of eac
enough to o
olled ventil
ms could y
ompliance a
of a passiv
ger Medica
als obtained
rway pressu
eathing pat
ation EIT w
d variations
d-inspiratory
n of the g
entilation, t
servation m
the ventil
waveform fa
-expiratory
ween global
t change ov
ch ventilatio
obtain clini
ation, chan
yield clinica
and/or airwa
ve mechanic
l, Lübeck,
d from the
ure; rel. ΔZ,
ients (Figur
waveform.
s of respirat
y lung volum
global and
time interva
might be nee
lation wave
alls at end-e
level (Figur
and region
ver time (e.g
on wavefor
cally releva
nges in the
al informat
ay resistanc
cally ventila
Germany).
ventilator d
, relative im
re E3.8), th
The baseli
tory rate an
me and, co
regional im
als and peak
eded to obt
eform reach
expiration, a
e E3.7).
nal VT and g
g., during a
rm will be s
ant informa
e peak val
ion on cha
ce.
ated patient
Left: Airw
during the e
mpedance ch
here is varia
ne end-exp
nd respirato
nsequently,
mpedance w
k values are
tain stable a
hes a peak
and the imp
global and
a volume-co
stable, and
ation. On th
ues of glo
anges of g
t acquired w
way pressur
examination
hange.
ability in th
piratory imp
ory muscle
, impedanc
waveforms
e irregular.
and compre
13
k value,
pedance
regional
ontrolled
a small
he other
obal and
lobal or
with the
e (Paw)
n. Right:
e shape
pedance
activity,
e. While
appears
In such
ehensive
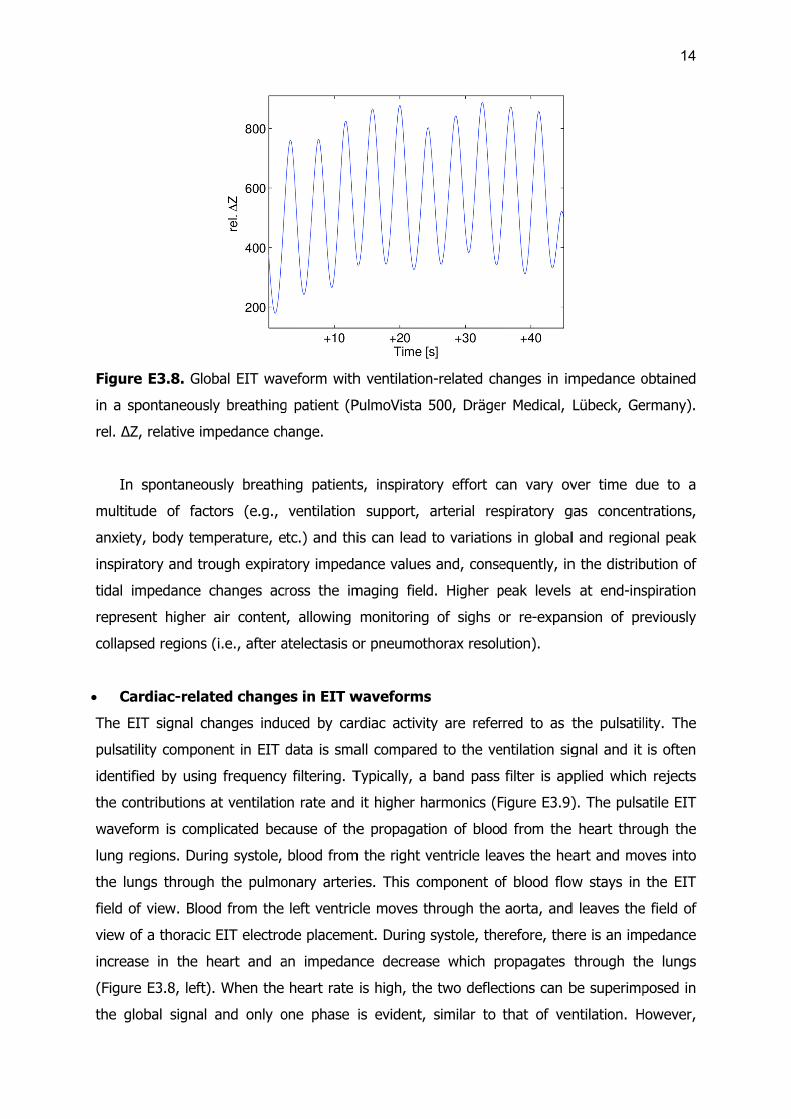
Figure
in a spo
rel. ΔZ,
In s
multitud
anxiety,
inspirat
tidal im
represe
collapse
Car
The EIT
pulsatili
identifie
the con
wavefor
lung reg
the lun
field of
view of
increase
(Figure
the glo
E3.8. Glob
ontaneously
relative im
spontaneou
de of facto
, body tem
tory and tro
mpedance c
ent higher a
ed regions (
rdiac-relat
T signal ch
ity compone
ed by using
ntributions a
rm is comp
gions. Durin
gs through
view. Blood
a thoracic
e in the h
E3.8, left).
obal signal
bal EIT wav
y breathing
pedance ch
usly breathi
ors (e.g.,
perature, e
ough expirat
changes acr
air content
(i.e., after a
ted change
anges indu
ent in EIT d
g frequency
at ventilatio
plicated bec
ng systole,
the pulmo
d from the
EIT electro
eart and a
When the
and only o
veform with
g patient (P
hange.
ing patients
ventilation
tc.) and thi
tory impeda
ross the im
t, allowing
atelectasis o
es in EIT w
uced by car
data is sma
y filtering. T
on rate and
cause of the
blood from
onary arteri
left ventric
de placeme
an impedan
heart rate
one phase
h ventilation
PulmoVista
s, inspirato
support,
is can lead
ance values
maging field
monitoring
or pneumoth
waveforms
rdiac activit
all compare
Typically, a
it higher ha
e propagat
m the right v
es. This co
cle moves t
ent. During
nce decreas
is high, the
is evident,
n-related ch
500, Dräge
ory effort c
arterial res
to variation
s and, conse
d. Higher p
of sighs o
horax resolu
s
ty are refer
ed to the ve
band pass
armonics (F
ion of bloo
ventricle lea
omponent o
hrough the
systole, the
se which p
e two deflec
similar to
hanges in im
r Medical,
can vary ov
spiratory g
ns in global
equently, in
peak levels
or re-expan
ution).
rred to as t
entilation sig
filter is ap
Figure E3.9)
d from the
aves the he
of blood flow
aorta, and
erefore, the
propagates
ctions can b
that of ven
mpedance o
Lübeck, Ge
ver time d
gas concen
l and region
n the distrib
at end-ins
nsion of pr
the pulsatil
gnal and it
pplied which
). The pulsa
heart thro
eart and mo
w stays in
d leaves the
ere is an imp
through th
be superimp
ntilation. H
14
obtained
ermany).
ue to a
trations,
nal peak
bution of
spiration
reviously
lity. The
is often
h rejects
atile EIT
ough the
oves into
the EIT
e field of
pedance
he lungs
posed in
However,

regiona
right).
Figure
heart a
single p
lung re
relative
(Dräger
Orig
While t
sources
volume
constan
change
extreme
an arte
extreme
changes
the lun
affects
inducing
good co
Using f
regions
al waveform
E3.9. Puls
nd pulmon
pixel in the
egion. There
impedance
r Medical, L
gin of puls
he major c
s affecting t
changes a
nt blood flo
(and thus
e, blood vol
rial blood c
e difference
s and is no
gs does ha
the impeda
g red blood
orrelation b
frequency f
in the thor
m analysis c
satile EIT w
ary perfusio
heart regio
e is a phas
e change. (
übeck, Germ
satility in t
ontribution
these signa
and not dire
ow or flow
no pulsatilit
lume oscilla
lot) would g
es illustrate
ot a direct m
ave a majo
ance distrib
d cell alignm
etween the
filtering an
rax (1).
can separat
aveforms. L
on-related s
on. Right: re
se shift bet
(The EIT d
many).)
the EIT sig
to the puls
ls (44). Pul
ectly to the
in a comp
ty) as volum
ation in a ve
give an imp
e that pulsa
measure of
or contribut
bution by cy
ment with
e pulsatile im
d ROI ana
te these tw
Left: global
signals. Mid
egional imp
tween the
ata was ac
gnal
satile EIT s
lsatile impe
e blood flow
pletely rigid
me in the v
essel closed
pedance cha
atile impeda
lung perfus
tion from p
yclic expan
the blood f
mpedance w
alysis, Ferra
wo wavefor
relative im
ddle: region
pedance wav
two latter
cquired usin
signal is blo
edance chan
w. For exa
d vessel, th
vessel would
d by an occl
ange over t
ance origina
sion. Howev
perfusion, s
sion of pul
flow. Sever
waveform a
ario et al d
rms (Figure
pedance wa
nal impedan
veform of a
regional w
ng the Pulm
ood perfusio
nges are pro
mple, in th
here would
d be consta
usion (e.g.,
ime in abse
ates in regi
ver, the EIT
since blood
monary blo
ral in vivo s
nd perfusio
discriminate
e E3.9, mid
waveform co
nce wavefo
a single pixe
waveforms.
moVista 500
on, there ar
roportional t
he extreme
be no imp
ant. In the o
, in the pres
ence of flow
ional blood
T pulsatile s
flow in th
ood vessels
studies cou
on (16, 28,
ed heart a
15
ddle and
ombining
orm of a
el in the
rel. ΔZ,
0 device
re many
to blood
case of
pedance
opposite
sence of
w. These
volume
signal in
he lungs
and by
uld show
45, 46).
nd lung

16
Common artifacts in EIT waveforms
While EIT signals contain much useful physiological information, there are many sources of
artifacts which can corrupt the EIT waveforms. Artefacts can originate in the raw EIT data,
or from the signal processing, where, for example, inappropriate filtering might cause
superimposition of waveforms from different origins. A number of effects (such as body
movement and posture change) can alter baseline end-expiratory impedance. As waveforms
are usually calculated as relative changes to baseline, this will alter the magnitude and
shape of the ventilation impedance waveforms.
Changes in electrode-skin contact impedance influence the calculated waveforms. The
electrode-skin impedance is affected by the contact force, drying of the gel or contact fluid
and other factors. EIT system vendors provide a measure of electrode-skin contact
impedance as a measure of signal quality.
Possible interference with other medical devices must be taken into account in
monitoring of intensive care patients, where electrical “noise” is produced by many other
devices in the ICU. An overview of most common interferences encountered during EIT
examinations in the ICU like pulsation therapy with air suspension mattresses, continuous
cardiac output monitoring and impedance pneumography has been provided by Frerichs et
al. along with the recommendations on EIT data analysis under these circumstances (47).
Other devices emitting electromagnetic signals may potentially interfere with EIT
measurements. However, overall, modern EIT devices are capable of generating high-quality
data in the majority of experimental and clinical settings.
Document preparation
The first draft of this online document was prepared by Z. Zhao with collaboration of H.
Gagnon, O. Stenqvist, T. Mauri, I. Frerichs and A. Adler. It was reviewed and approved by
all other authors and collaborators.

17
References
1. Ferrario D, Grychtol B, Adler A, Sola J, Bohm SH, Bodenstein M. Toward
morphological thoracic eit: Major signal sources correspond to respective organ locations in
CT. IEEE Trans Biomed Eng 2012;59:3000-3008.
2. Rossi Fde S, Yagui AC, Haddad LB, Deutsch AD, Rebello CM. Electrical impedance
tomography to evaluate air distribution prior to extubation in very-low-birth-weight infants: A
feasibility study. Clinics (Sao Paulo) 2013;68:345-350.
3. Schramel J, Nagel C, Auer U, Palm F, Aurich C, Moens Y. Distribution of ventilation
in pregnant shetland ponies measured by electrical impedance tomography. Respir Physiol
Neurobiol 2012;180:258-262.
4. Kunst PW, Vazquez de Anda G, Bohm SH, Faes TJ, Lachmann B, Postmus PE, de
Vries PM. Monitoring of recruitment and derecruitment by electrical impedance tomography
in a model of acute lung injury. Crit Care Med 2000;28:3891-3895.
5. Odenstedt H, Lindgren S, Olegard C, Erlandsson K, Lethvall S, Aneman A, Stenqvist
O, Lundin S. Slow moderate pressure recruitment maneuver minimizes negative circulatory
and lung mechanic side effects: Evaluation of recruitment maneuvers using electric
impedance tomography. Intensive Care Med 2005;31:1706-1714.
6. Meier T, Luepschen H, Karsten J, Leibecke T, Grossherr M, Gehring H, Leonhardt S.
Assessment of regional lung recruitment and derecruitment during a PEEP trial based on
electrical impedance tomography. Intensive Care Med 2008;34:543-550.
7. Victorino JA, Borges JB, Okamoto VN, Matos GF, Tucci MR, Caramez MP, Tanaka
H, Sipmann FS, Santos DC, Barbas CS, Carvalho CR, Amato MB. Imbalances in regional
lung ventilation: A validation study on electrical impedance tomography. Am J Respir Crit
Care Med 2004;169:791-800.
8. Frerichs I, Dargaville PA, van Genderingen H, Morel DR, Rimensberger PC. Lung
volume recruitment after surfactant administration modifies spatial distribution of ventilation.
Am J Respir Crit Care Med 2006;174:772-779.
9. Zick G, Elke G, Becher T, Schadler D, Pulletz S, Freitag-Wolf S, Weiler N, Frerichs I.
Effect of PEEP and tidal volume on ventilation distribution and end-expiratory lung volume: A
prospective experimental animal and pilot clinical study. PLoS One 2013;8:e72675.
10. Tingay DG, Wallace MJ, Bhatia R, Schmolzer GM, Zahra VA, Dolan MJ, Hooper SB,
Davis PG. Surfactant before the first inflation at birth improves spatial distribution of
ventilation and reduces lung injury in preterm lambs. J Appl Physiol 2014;116:251-258.
11. Pulletz S, van Genderingen HR, Schmitz G, Zick G, Schadler D, Scholz J, Weiler N,
Frerichs I. Comparison of different methods to define regions of interest for evaluation of
regional lung ventilation by EIT. Physiol Meas 2006;27:S115-127.
18
12. Frerichs I, Hahn G, Hellige G. Gravity-dependent phenomena in lung ventilation
determined by functional EIT. Physiol Meas 1996;17 Suppl 4A:A149-157.
13. Muders T, Luepschen H, Zinserling J, Greschus S, Fimmers R, Guenther U,
Buchwald M, Grigutsch D, Leonhardt S, Putensen C, Wrigge H. Tidal recruitment assessed
by electrical impedance tomography and computed tomography in a porcine model of lung
injury. Crit Care Med 2012;40:903-911.
14. Frerichs I, Dargaville PA, Rimensberger PC. Regional respiratory inflation and
deflation pressure-volume curves determined by electrical impedance tomography. Physiol
Meas 2013;34:567-577.
15. Elke G, Fuld MK, Halaweish AF, Grychtol B, Weiler N, Hoffman EA, Frerichs I.
Quantification of ventilation distribution in regional lung injury by electrical impedance
tomography and xenon computed tomography. Physiol Meas 2013;34:1303-1318.
16. Schibler A, Pham TM, Moray AA, Stocker C. Ventilation and cardiac related
impedance changes in children undergoing corrective open heart surgery. Physiol Meas
2013;34:1319-1327.
17. Vonk Noordegraaf A, Kunst PW, Janse A, Marcus JT, Postmus PE, Faes TJ, de
Vries PM. Pulmonary perfusion measured by means of electrical impedance tomography.
Physiol Meas 1998;19:263-273.
18. Zhao Z, Moller K, Steinmann D, Frerichs I, Guttmann J. Evaluation of an electrical
impedance tomography-based global inhomogeneity index for pulmonary ventilation
distribution. Intensive Care Med 2009;35:1900-1906.
19. Becher TH, Bui S, Zick G, Blaser D, Schadler D, Weiler N, Frerichs I. Assessment of
respiratory system compliance with electrical impedance tomography using a positive end-
expiratory pressure wave maneuver during pressure support ventilation: A pilot clinical
study. Crit Care 2014;18:679.
20. Becher T, Vogt B, Kott M, Schadler D, Weiler N, Frerichs I. Functional regions of
interest in electrical impedance tomography: A secondary analysis of two clinical studies.
PLoS One 2016;11:e0152267.
21. Pulletz S, Elke G, Zick G, Schadler D, Scholz J, Weiler N, Frerichs I. Performance of
electrical impedance tomography in detecting regional tidal volumes during one-lung
ventilation. Acta Anaesthesiol Scand 2008;52:1131-1139.
22. Gomez-Laberge C, Arnold JH, Wolf GK. A unified approach for EIT imaging of
regional overdistension and atelectasis in acute lung injury. IEEE Trans Med Imaging
2012;31:834-842.
23. Zhao Z, Steinmann D, Muller-Zivkovic D, Martin J, Frerichs I, Guttmann J, Moller K. A
lung area estimation method for analysis of ventilation inhomogeneity based on electrical
impedance tomography. J Xray Sci Technol 2010;18:171-182.

19
24. Deibele JM, Luepschen H, Leonhardt S. Dynamic separation of pulmonary and
cardiac changes in electrical impedance tomography. Physiol Meas 2008;29:S1-14.
25. Crapo RO, Morris AH, Clayton PD, Nixon CR. Lung volumes in healthy nonsmoking
adults. Bull Eur Physiopathol Respir 1982;18:419-425.
26. Woitzik C, Grychtol B, Ferrario D, Böhm S, Robitaille N, Adler A, Alzen G. A priori
Informationen für die elektrische Impedanztomografie (EIT) aus CT-daten des Thorax –
Erhebung und Bearbeitung anthropometrischer Daten und Konturanalysen unter besonderer
Berücksichtigung von pädiatrischen Patienten. Fortschr Rontgenstr 2013;185:V28.
27. Fagerberg A, Stenqvist O, Aneman A. Monitoring pulmonary perfusion by electrical
impedance tomography: An evaluation in a pig model. Acta Anaesthesiol Scand
2009;53:152-158.
28. Frerichs I, Pulletz S, Elke G, Reifferscheid F, Schadler D, Scholz J, Weiler N.
Assessment of changes in distribution of lung perfusion by electrical impedance tomography.
Respiration 2009;77:282-291.
29. Leathard AD, Brown BH, Campbell J, Zhang F, Morice AH, Tayler D. A comparison
of ventilatory and cardiac related changes in EIT images of normal human lungs and of
lungs with pulmonary emboli. Physiol Meas 1994;15 Suppl 2a:A137-146.
30. Smit HJ, Vonk-Noordegraaf A, Marcus JT, van der Weijden S, Postmus PE, de Vries
PM, Boonstra A. Pulmonary vascular responses to hypoxia and hyperoxia in healthy
volunteers and COPD patients measured by electrical impedance tomography. Chest
2003;123:1803-1809.
31. Hahn G, Dittmar J, Just A, Quintel M, Hellige G. Different approaches for quantifying
ventilation distribution and lung tissue properties by functional EIT. Physiol Meas
2010;31:S73-84.
32. Wilkinson AJ, Randall EW, Cilliers JJ, Durrett DR, Naidoo T, Long T. A 1000-
measurement frames/second ERT data capture system with real-time visualization. IEEE
Sens J 2005;5:300-307.
33. Yerworth R, Bayford R. The effect of serial data collection on the accuracy of
electrical impedance tomography images. Physiol Meas 2013;34:659-669.
34. Gagnon H, Grychtol B, Adler A. A comparison framework for temporal image
reconstructions in electrical impedance tomography. Physiol Meas 2015;36:1093-1107.
35. Pulletz S, Kott M, Elke G, Schadler D, Vogt B, Weiler N, Frerichs I. Dynamics of
regional lung aeration determined by electrical impedance tomography in patients with acute
respiratory distress syndrome. Multidiscip Respir Med 2012;7:44.
36. Bodenstein M, Boehme S, Bierschock S, Vogt A, David M, Markstaller K.
Determination of respiratory gas flow by electrical impedance tomography in an animal
model of mechanical ventilation. BMC Pulm Med 2014;14:73.

20
37. Vogt B, Pulletz S, Elke G, Zhao Z, Zabel P, Weiler N, Frerichs I. Spatial and temporal
heterogeneity of regional lung ventilation determined by electrical impedance tomography
during pulmonary function testing. J Appl Physiol 2012;113:1154-1161.
38. Zhao Z, Muller-Lisse U, Frerichs I, Fischer R, Moller K. Regional airway obstruction
in cystic fibrosis determined by electrical impedance tomography in comparison with high
resolution CT. Physiol Meas 2013;34:N107-114.
39. Zhao Z, Fischer R, Frerichs I, Muller-Lisse U, Moller K. Regional ventilation in cystic
fibrosis measured by electrical impedance tomography. J Cyst Fibros 2012;11:412-418.
40. Frerichs I, Zhao Z, Becher T, Zabel P, Weiler N, Vogt B. Regional lung function
determined by electrical impedance tomography during bronchodilator reversibility testing in
patients with asthma. Physiol Meas 2016;37:698-712.
41. Vogt B, Zhao Z, Zabel P, Weiler N, Frerichs I. Regional lung response to
bronchodilator reversibility testing determined by electrical impedance tomography in chronic
obstructive pulmonary disease. Am J Physiol Lung Cell Mol Physiol 2016;311:L8-L19.
42. Zadehkoochak M, Blott BH, Hames TK, George RF. Pulmonary perfusion and
ventricular ejection imaging by frequency domain filtering of EIT (electrical impedance
tomography) images. Clin Phys Physiol Meas 1992;13 Suppl A:191-196.
43. Smallwood RH, Hampshire AR, Brown BH, Primhak RA, Marven S, Nopp P. A
comparison of neonatal and adult lung impedances derived from EIT images. Physiol Meas
1999;20:401-413.
44. Braun F, Proença M, Rapin M, Alba X, Lekadir K, Lemay M, Sola J, Frangi AF,
Thiran JP. 4D heart model helps unveiling contributors to cardiac EIT signal. In: Sola J,
Braun F, Adler A, editors. 16th International Conference on Biomedical Applications of
Electrical Impedance Tomography. Neuchatel; 2015. p. 107.
45. Nguyen DT, Jin C, Thiagalingam A, McEwan AL. A review on electrical impedance
tomography for pulmonary perfusion imaging. Physiol Meas 2012;33:695-706.
46. Fagerberg A, Sondergaard S, Karason S, Aneman A. Electrical impedence
tomography and heterogeneity of pulmonary perfusion and ventilation in porcine acute lung
injury. Acta Anaesthesiol Scand 2009;53:1300-1309.
47. Frerichs I, Pulletz S, Elke G, Gawelczyk B, Frerichs A, Weiler N. Patient
examinations using electrical impedance tomography-sources of interference in the intensive
care unit. Physiol Meas 2011;32:L1-L10.