operating capital budget plans
TRANSCRIPT

THE UNIVERSITY OF NEW MEXICO
OPERATING & CAPITAL
BUDGET PLANS
2017-2018

CONSOLIDATED BUDGET

UNIVERSITY OF NEW MEXICO FY 2017-2018 OPERATING AND CAPITAL BUDGET PLANS
This is a summary of the University of New Mexico’s FY 2017-2018 Operating and Capital Budget Plans. The budget plans for the entire University, including Operating Budgets for the Main Campus; Health Sciences Center (HSC) Academic Enterprise and Hospitals; the Gallup, Los Alamos, Taos, and Valencia Branch Campuses; as well as the Capital Budget for the entire University are consolidated and summarized. The primary purpose of this presentation is to establish the planned expenditure levels for the various programs and activities of the University. The Board of Regents is required to establish these limits prior to approval of the budget plan by the Higher Education Department (HED) and the State of New Mexico Department of Finance and Administration (DFA) Budget Division.
The budget plans are the University’s best estimate of the level of financial activity for the University during FY 2018 (July 1, 2017 through June 30, 2018). During the course of the upcoming fiscal year, budget revisions will be presented to the Regents for consideration when the level of activity in any of the program areas is projected to exceed the level being authorized in the original budget.
Regarding UNM’s overall state appropriation, it decreased approximately 5.9% since the beginning of FY 2017. The 2017 Legislature 60 day session convened in January 2017. The legislature passed House Bill 2 (HB2) but the Governor vetoed the entire higher education appropriation along with the legislature appropriation. Governor Martinez called for a special session on May 24, 2017. House Bill 1 (HB1) was passed and signed by the Governor. House Bill 1 (HB1) included approximately a .9% cut in state appropriations for UNM. This .9% cut is in addition to the mid-year Fall 2016 Special Session reduction of 5% in FY 2017.
In terms of overall consolidated revenues and expenditures, the University of New Mexico’s estimated budget grew from $2.858 billion in FY 2017 to $2.911 billion in FY 2018, or approximately 1.9%. This increase is primarily due to growth in the UNM Health System’s budget. The following sections of the Operating and Capital Budget Plans book has detailed information regarding the overall changes to the budget for Main Campus, Health Sciences Center, Branch Campuses, and Capital components.
3

Summary of All CampusesRevenues, Transfers and Net Balances
2016-17 2017-18
Total Budget Total Budget % Change
STATE GOVERNMENT APPROPRIATIONS-OPERATING 317,609,671 298,655,375 -6.0%
FEDERAL GOVERNMENT APPROPRIATIONS 0 0 0.0%
STATE BONDS 13,359,429 22,157,988 65.9%
Local Government AppropriationsMil Levy - Hospital 99,659,000 98,276,636 -1.4%
Mil Levy - Branches 7,857,527 8,591,542 9.3%
Local Bonds 0 0 0.0%
Total LOCAL GOVERNMENT APPROPRIATIONS 107,516,527 106,868,178 -0.6%
Grants/ContractsFederal Government Contracts/Grants 246,790,772 255,148,340 3.4%
State Government Contracts/Grants 100,989,545 92,282,457 -8.6%
Local Government Contracts/Grants 2,733,306 2,682,163 -1.9%
Total GRANTS/CONTRACTS 350,513,623 350,112,960 -0.1%
Tuition & FeesTuition and Mandatory Fees 202,261,489 206,739,533 2.2%
Miscellaneous Student Fees 17,356,353 16,429,646 -5.3%
Total TUITION & FEES 219,617,842 223,169,179 1.6%
Sales & ServicesPatient Care 1,189,048,000 1,233,644,599 3.8%
Sales & Services 383,555,669 391,866,077 2.2%
Total SALES & SERVICES 1,572,603,669 1,625,510,676 3.4%
PrivatePrivate Contracts/Grants 43,063,278 47,455,607 10.2%
Private Gifts 0 31,100
Total PRIVATE 43,063,278 47,486,707 10.3%
OtherEndowments 4,186,829 3,956,870 -5.5%
Indirect Cost Recovery (F&A) 44,438,009 44,861,175 1.0%
State Land and Permanent Fund 8,840,000 9,640,000 9.0%
Other 110,422,805 102,694,554 -7.0%
Total OTHER 167,887,643 161,152,599 -4.0%
TOTAL REVENUE 2,792,171,682 2,835,113,662 1.5%
Transfers 9,966,394 10,177,824 2.1%
Net Balance 55,430,081 66,102,469 19.3%
REVENUE NET OF TRANSFERS/BALANCES 2,857,568,157 2,911,393,955 1.9%
4

State Approp - Operating298,655,375
10.26%
Grants/Contracts350,112,960
12.03%
Local Govt Approp106,868,178
3.67%
State Bonds22,157,988
0.76%
Tuition & Fees223,169,179
7.67%Sales, Services & Patient Care1,625,510,676
55.83%
Private47,486,707
1.63%
Other 171,330,423
5.88%
Use of Balance66,102,469
2.27%
UNM Consolidated Revenues
Total Revenues $2,911,393,955
2017-18 Budget
An Increase of 1.9% over 2016-17
5

Summary of All Campuses
Total Expenditures
Original Budget 2016-17 Original Budget 2017-18
Unrestricted Restricted Total Unrestricted Restricted Total % Change
Current Funds
UNM Main Campus $558,391,026 $176,846,226 $735,237,252 512,857,453 176,846,226 689,703,679 -6.2%
UNM HSC Academic Enterprise 501,238,361 115,381,968 616,620,329 508,431,640 127,354,129 635,785,769 3.1%
UNM Gallup 18,509,877 1,811,209 20,321,086 17,229,093 1,813,481 19,042,574 -6.3%
UNM Los Alamos 4,507,456 1,037,157 5,544,613 4,482,564 1,037,157 5,519,721 -0.4%
UNM Valencia 11,441,571 2,402,265 13,843,836 11,009,769 3,475,634 14,485,403 4.6%
UNM Taos 8,422,374 3,397,218 11,819,592 8,297,546 3,166,090 11,463,636 -3.0%
Current Funds subtotal 1,102,510,665 300,876,043 1,403,386,708 1,062,308,065 313,692,717 1,376,000,782 -2.0%
Plant Funds
UNM Debt Service 35,884,877 35,884,877 38,056,603 38,056,603 6.1%
All Other 79,063,572 79,063,572 105,940,598 105,940,598 34.0%
Plant Funds subtotal 114,948,449 0 114,948,449 143,997,201 0 143,997,201 25.3%
Total excluding UNM Health System 1,217,459,114 300,876,043 1,518,335,157 1,206,305,266 313,692,717 1,519,997,983 0.1%
UNM Health System
UNM Health System 1,305,621,131 1,305,621,131 1,357,320,053 1,357,320,053 4.0%
UNM Hospital Capital 33,611,869 33,611,869 34,075,919 34,075,919 1.4%
UNM Health System subtotal 1,339,233,000 1,339,233,000 1,391,395,972 1,391,395,972 3.9%
GRAND TOTAL 2,556,692,114 300,876,043 2,857,568,157 2,597,701,238 313,692,717 2,911,393,955 1.9%
6

UNM Main Campus689,703,679
23.69%
UNM HSC Academic Enterprise635,785,769
21.84%
UNM Branches50,511,334
1.73%
UNM Plant Funds143,997,201
4.95%
UNM Health System1,391,395,972
47.79%
UNM Consolidated Expenditures2017-18 Budget
Total Expenditures $2,911,393,955
An Increase of 1.9% over 2016-17
7

MAIN CAMPUS

MAIN CAMPUS OVERVIEW
In terms of overall FY 2018 Main Campus Current Fund Revenues including the use of reserves, there is an overall decrease of approximately $16.5 million, or 1.9%, over the FY 2017 budget. This decrease is mainly attributed to a reduction in state appropriations, a decrease in the budgeting of unrestricted reserves, changes in state lottery scholarship revenues and decreases in auxiliary, athletic and other revenues.
State appropriations for Main Campus decreased by $11,489,500 or approximately5.9% for FY 2017-2018. This includes the mid-year Fall 2016 FY 2017 Special Session reduction of 5% and the FY 2018 Special Session HB1 reduction of approximately .9%. Similar to last year’s legislative session, there was no compensation increase for faculty or staff and no changes to the employee retirement plan. Of special interest is the further reduction in state support, from $201 million in FY 2016 to $185 million in FY 2018, the result of which can be summarized by the fact that state appropriations for operations now comprise 22.14% of the Main Campus budget as opposed to 24.0% in FY 2016.
Tuition and fee rates were approved by the Board of Regents on May 24, 2017. Unrestricted tuition and fee revenues are relatively flat despite the $18 per credit hour increase for all upper division, a 4% across the board increase for graduate students, and an $18 per credit hour for graduate programs that do not have differential tuition. The reason they are flat is because conservative tuition and fee projections were used due to changes in state lottery scholarship funding and its impact on enrollment. In addition, the Regents approved a 7.3% increase in mandatory student fees to fund the 2017 UNM Bond Issue which goes towards the new Physics and Astronomy Interdisciplinary Sciences Building (PAIS), Biology Annex renovation, Art Annex renovation, Student Health and Counseling (SHAC) renovation, and Smith Plaza renovations.
Another significant revenue driver for the FY 2018 Main Campus I&G budget is the continued infusion of $2.433M in Health Sciences Center funds. This commitment began in FY 2017 and is projected to cease in FY 2019. The use of these funds and the additional $1M use of reserves allows the Main Campus to bridge fund critical instructional programs. In FY 2019, $3.4M in permanent revenues streams will need to be identified to replace these non-recurring revenues.
In regard to capital revenues, state and local bonds are up just over $8.8M due to the GOB funding cycle. The 2016 GOB’s were not voted on until the middle of FY 2017. Hence, they were included in the budget for FY 2018.
9

In terms of overall FY 2018 Main Campus Current Fund Expenditures, there is an overall decrease of approximately $16.5 million, or 1.9%, over the FY 2017 budget.This is primarily due to the state appropriation reduction, decreased state lottery scholarship expenditures, the on-going hiring review process, cost containment strategies, workforce reductions/attrition, decrease in auxiliary and athletic spending, and a decrease in overall unrestricted use of reserves.
The I&G unrestricted expenditures decreased by $23M, or 6.9%, primarily due to the state appropriation reduction of $11M, cost containment strategies of $2.6M, hiring review process, workforce/attrition reductions of $1.9M, and a decrease in the use of reserves of $7.2M.
In regard to capital expenditures, the increase corresponds to the increase in state and local bonds related to the GOB cycle and the increase in capital projects related to the 2016 and 2017 UNM bond issues. Debt service expenditures increased due to the 2017 UNM bond issue.
10

Summary of Legislative Appropriations
-5% -1%HB2 Total 2016 Special Session Final 2017 Special Session HB1 Total % Change
Program FY 2016-17 SB9 5% Reduction FY 2016-17 HB1 FY 2017-18 FY17 to FY18
Instruction and General 186,759,600 (9,338,000) 177,421,600 (1,598,400) 175,823,200 -5.9%African American Student Services 70,900 (3,500) 67,400 (600) 66,800 -5.8%Degree Mapping Program 73,200 (3,700) 69,500 (700) 68,800 -6.0%Disabled Student Services 187,200 (9,400) 177,800 (1,700) 176,100 -5.9%Hispanic Student Center 154,300 (7,700) 146,600 (1,500) 145,100 -6.0%Minority Graduate Recruitment 115,700 (5,800) 109,900 (1,100) 108,800 -6.0%Native American Studies Intervention 347,800 (17,500) 330,300 (3,300) 327,000 -6.0%Pre-College Science and Math Program 194,600 (9,700) 184,900 (1,900) 183,000 -6.0%Center for Regional Studies (SW Research Ctr) 964,250 (48,200) 916,050 (9,200) 906,850 -6.0%Manufacturing Engineering 548,200 (27,400) 520,800 (5,300) 515,500 -6.0%Morrissey Hall 46,400 (2,300) 44,100 (500) 43,600 -6.0%Resource Geographic Information System 64,700 (3,200) 61,500 (700) 60,800 -6.0%Utton Transboundary Resource Center 337,900 (16,900) 321,000 (3,300) 317,700 -6.0%Bureau of Business Research (Census) 375,300 (18,800) 356,500 (3,500) 353,000 -5.9%College Prep Mentoring/School of Law 117,900 (6,000) 111,900 (1,200) 110,700 -6.1%College Preparatory Mentoring 167,300 (8,300) 159,000 (1,600) 157,400 -5.9%Corrine Wolfe Law Center/Child Abuse Training 167,700 (8,400) 159,300 (1,600) 157,700 -6.0%ENLACE 62,500 (3,100) 59,400 (600) 58,800 -5.9%Family Development Program 554,800 (27,700) 527,100 (5,300) 521,800 -5.9%Ibero - American Education 47,600 (2,400) 45,200 (500) 44,700 -6.1%Judicial Selection 22,400 (1,100) 21,300 (300) 21,000 -6.3%KNME-TV 1,148,600 (57,400) 1,091,200 (11,000) 1,080,200 -6.0%Land Grant Studies Program 128,600 (6,400) 122,200 (1,300) 120,900 -6.0%N M Historical Review 46,800 (2,300) 44,500 (500) 44,000 -6.0%Southwest Indian Law Clinic 202,600 (10,100) 192,500 (2,000) 190,500 -6.0%Spanish Colonial Research Center (SW Research Ctr) 145,150 (7,300) 137,850 (1,400) 136,450 -6.0%Spanish Resource Center 40,800 (2,000) 38,800 (400) 38,400 -5.9%Substance Abuse Program 72,400 (3,600) 68,800 (700) 68,100 -5.9%Wildlife Law Education 94,000 (4,700) 89,300 (900) 88,400 -6.0%Intercollegiate Athletics 2,782,900 (139,100) 2,643,800 (26,500) 2,617,300 -6.0%Total in Main Campus Current Funds $196,042,100 ($9,802,000) $186,240,100 ($1,687,500) $184,552,600 -5.9%
THE UNIVERSITY OF NEW MEXICO
MAIN CAMPUS
FY 2017-18 OPERATING BUDGET PLAN
11

State Approp - Operating184,552,600
22.14%
Grants/Contracts191,886,664
23.02%
State Bonds22,157,988
2.66%
Tuition & Fees196,575,096
23.58%
Sales & Services76,374,816
9.16%
Private26,836,357
3.22%
Other71,877,723
8.62%
Use of Balance63,439,636
7.61%
UNM Main Campus Revenues2017-18 Budget
A Decrease of 1.9% over 2016-17
Total Revenues $833,700,880
12

Instruction & General316,398,896
37.95%
Student Social10,144,096
1.22%
Research93,606,339
11.23%
Public Service52,712,258
6.32%
Internal Service/Auxiliaries55,140,142
6.61%
Student Aid128,172,464
15.37%
Athletics33,529,484
4.02%
Plant Fund143,997,201
17.27%
UNM Main Campus Expenditures
2017-18 Budget
A Decrease of 1.9% over 2016-17
Total Expenditures $833,700,880
13

FY 2017
Original
FY 2018
Original
% Change
FY 17 to FY 18
RevenuesState Appropriations 196,042 184,553 -5.9%Tuition and Fees 193,923 196,575 1.4%Federal Appropriations/Grants/Contracts 202,022 191,887 -5.0%Private Gifts and Contracts/Grants 26,288 26,836 2.1%State and Local Bonds 13,359 22,158 65.9%Sales, Services and Other Revenues 154,531 148,252 -4.1%
Total Revenues 786,165 770,261 -2.0%
ExpensesFaculty Salaries 100,479 99,132 -1.3%GA/TA/RA/PA Salaries 27,592 28,323 2.6%Staff/Student/Other Salaries 202,396 193,412 -4.4%Fringe Benefits 113,183 110,786 -2.1%
Total Labor Expenses 443,650 431,653 -2.7%
Other Expenses 291,587 258,051 -11.5%
Capital Projects and Maintenance 79,064 105,940 34.0%
Debt Service 35,885 38,057 6.1%
Total Expenses 850,186 833,701 -1.9%
Net Margin (64,021) (63,440) -0.9%
Main Campus
FY 18 Original Budget Comparative Analysis (In Thousands)
14

Unrestricted, $512,857,453 ,
61.5%
Restricted, $176,846,226 ,
21.2%
Capital, $143,997,201 ,
17.3%
FY18 MAIN CAMPUS BUDGET
Total Budget: 833,700,880
15
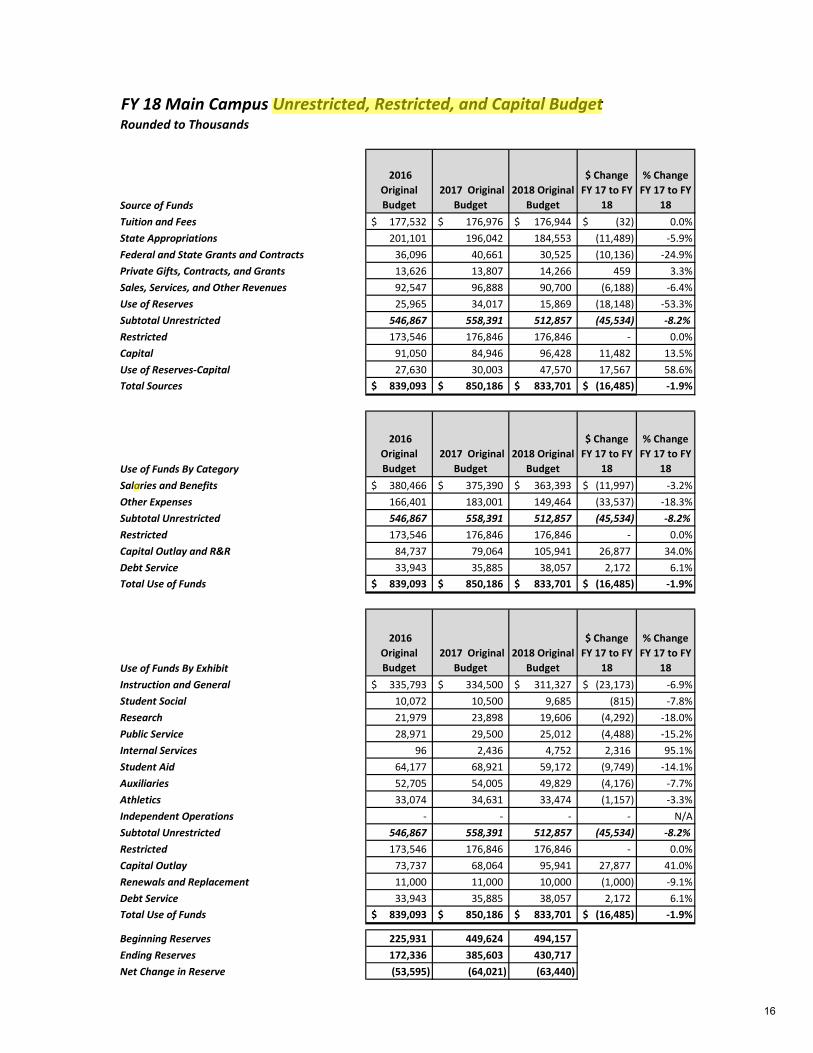
FY 18 Main Campus Unrestricted, Restricted, and Capital BudgetRounded to Thousands
Source of Funds
2016
Original
Budget
2017 Original
Budget
2018 Original
Budget
$ Change
FY 17 to FY
18
% Change
FY 17 to FY
18
Tuition and Fees 177,532$ 176,976$ 176,944$ (32)$ 0.0%
State Appropriations 201,101 196,042 184,553 (11,489) -5.9%
Federal and State Grants and Contracts 36,096 40,661 30,525 (10,136) -24.9%
Private Gifts, Contracts, and Grants 13,626 13,807 14,266 459 3.3%
Sales, Services, and Other Revenues 92,547 96,888 90,700 (6,188) -6.4%
Use of Reserves 25,965 34,017 15,869 (18,148) -53.3%
Subtotal Unrestricted 546,867 558,391 512,857 (45,534) -8.2%
Restricted 173,546 176,846 176,846 - 0.0%
Capital 91,050 84,946 96,428 11,482 13.5%
Use of Reserves-Capital 27,630 30,003 47,570 17,567 58.6%
Total Sources 839,093$ 850,186$ 833,701$ (16,485)$ -1.9%
Use of Funds By Category
2016
Original
Budget
2017 Original
Budget
2018 Original
Budget
$ Change
FY 17 to FY
18
% Change
FY 17 to FY
18
Salaries and Benefits 380,466$ 375,390$ 363,393$ (11,997)$ -3.2%
Other Expenses 166,401 183,001 149,464 (33,537) -18.3%
Subtotal Unrestricted 546,867 558,391 512,857 (45,534) -8.2%
Restricted 173,546 176,846 176,846 - 0.0%
Capital Outlay and R&R 84,737 79,064 105,941 26,877 34.0%
Debt Service 33,943 35,885 38,057 2,172 6.1%
Total Use of Funds 839,093$ 850,186$ 833,701$ (16,485)$ -1.9%
Use of Funds By Exhibit
2016
Original
Budget
2017 Original
Budget
2018 Original
Budget
$ Change
FY 17 to FY
18
% Change
FY 17 to FY
18
Instruction and General 335,793$ 334,500$ 311,327$ (23,173)$ -6.9%
Student Social 10,072 10,500 9,685 (815) -7.8%
Research 21,979 23,898 19,606 (4,292) -18.0%
Public Service 28,971 29,500 25,012 (4,488) -15.2%
Internal Services 96 2,436 4,752 2,316 95.1%
Student Aid 64,177 68,921 59,172 (9,749) -14.1%
Auxiliaries 52,705 54,005 49,829 (4,176) -7.7%
Athletics 33,074 34,631 33,474 (1,157) -3.3%
Independent Operations - - - - N/A
Subtotal Unrestricted 546,867 558,391 512,857 (45,534) -8.2%
Restricted 173,546 176,846 176,846 - 0.0%
Capital Outlay 73,737 68,064 95,941 27,877 41.0%
Renewals and Replacement 11,000 11,000 10,000 (1,000) -9.1%
Debt Service 33,943 35,885 38,057 2,172 6.1%
Total Use of Funds 839,093$ 850,186$ 833,701$ (16,485)$ -1.9%
Beginning Reserves 225,931 449,624 494,157
Ending Reserves 172,336 385,603 430,717
Net Change in Reserve (53,595) (64,021) (63,440)
16

Main Campus
Current Fund Revenues
2016-17 2017-18
Unrestricted Restricted Unrestricted Restricted
Instruction and GeneralTuition 142,653,192 0 143,671,427 0
Student Fees 13,960,986 0 12,860,302 0
State Government Appropriations -Operating 187,965,800 0 176,957,600 0
State Government Contracts/Grants 0 1,182,500 0 1,182,500
Federal Government Appropriations 0 0 0 0
Federal Government Contracts/Grants 180,000 3,339,000 180,000 3,339,000
Local Government Contracts/Grants 0 50,000 0 50,000
Private Contracts/Grants 0 100,000 0 100,000
Endowments 0 0 0 0
State Land and Permanent Fund 8,800,000 0 9,600,000 0
Indirect Cost Recovery (F&A) 20,200,000 0 20,250,000 0
Land, Bldg & Equip Rent 0 0 0 0
Sales & Services 2,569,179 0 346,035 0
Other 4,127,851 0 4,098,788 0
Total I & G Revenue 380,457,008 4,671,500 367,964,152 4,671,500
Transfers (From) To I&GBuilding Renewal (9,767,405) 0 (9,767,405) 0
Student Social Cultural 144,076 0 220,802 0
Research (17,856,643) 0 (17,862,568) 0
Public Service 90,500 0 464,232 0
Student Aid (12,056,435) 0 (11,946,202) 0
Auxiliaries/Internal Svc/Athletics 2,585,289 0 (3,803,967) 0
Plant Fund Cap Outlay/Debt Svc (3,228,310) 0 (1,359,976) 0
HSC/Valencia I&G (16,256,257) 0 (15,731,861) 0
Unrestricted/Restricted Transfers (820,000) 400,000 (820,000) 400,000
Endowments 1,147,537 0 1,087,920 0
Total I&G Transfers (56,017,648) 400,000 (59,519,025) 400,000
Net Balance 10,060,542 0 2,882,269 0
NET I & G Revenue 334,499,902 5,071,500 311,327,396 5,071,500
Student Social/CulturalMandatory Student Fees 8,034,437 0 8,082,736 0
State Government Appropriations -Operating 0 0 0 0
State Government Contracts/Grants 0 204,000 0 204,000
Federal Government Contracts/Grants 0 255,000 0 255,000
Private Contracts/Grants 0 0 0 0
Sales & Services 1,328,457 0 955,166 0
Other 106,502 0 118,525 0
Transfers 405,670 0 441,884 0
Net Balance 624,934 0 86,785 0
Total Student Social/Cultural 10,500,000 459,000 9,685,096 459,000
ResearchMandatory Student Fees 0 0 0 0
State Government Appropriations -Operating 1,961,450 0 1,844,450 0
State Government Contracts/Grants 0 1,500,000 0 1,500,000
Federal Government Contracts/Grants 0 64,500,000 0 64,500,000
Local Government Contracts/Grants 0 1,000,000 0 1,000,000
Private Contracts/Grants 50,000 5,200,000 1,200 5,200,000
Sales & Services 125,950 0 65,749 0
Other 862,600 0 400,950 0
Transfers 13,666,997 1,800,000 15,601,216 1,800,000
Net Balance 7,231,448 0 1,692,774 0
Total Research 23,898,445 74,000,000 19,606,339 74,000,000
17

Main Campus
Current Fund Revenues
Continued2016-17 2017-18
Unrestricted Restricted Unrestricted Restricted
Public ServiceMandatory Student Fees 1,026,942 0 1,106,438 0
State Government Appropriations -Operating 3,331,950 0 3,133,250 0
State Government Contracts/Grants 6,000 7,500,000 0 7,500,000
Federal Government Appropriations 0 0 0 0
Federal Government Contracts/Grants 0 12,900,000 50,000 12,900,000
Local Government Contracts/Grants 0 1,615,000 0 1,615,000
Private Contracts/Grants 9,543,331 5,000,000 9,289,474 5,000,000
Endowments 0 0 0 0
Sales & Services 9,751,768 0 7,802,367 0
Other 4,817,695 0 4,424,075 0
Transfers (3,328,080) 685,000 (2,888,345) 685,000
Net Balance 4,350,394 0 2,094,999 0
Total Public Service 29,500,000 27,700,000 25,012,258 27,700,000
Internal ServiceStudent Fees 0 0 80,500 0
State Government Contracts/Grants 0 106,838 0 106,838
Federal Government Contracts/Grants 0 96,662 0 96,662
Sales & Services 9,862,162 0 8,197,721 0
Other 1,662,789 0 1,411,575 0
Transfers (11,925,743) 0 (5,801,057) 0
Net Balance 2,837,186 0 863,051 0
Total Internal Service 2,436,394 203,500 4,751,790 203,500
Student AidState Government Contracts/Grants 40,474,628 3,700,000 30,295,438 3,700,000
Federal Government Appropriations 0 0 0 0
Federal Government Contracts/Grants 0 63,000,000 0 63,000,000
Local Government Contracts/Grants 0 0 0 0
Private Contracts/Grants 4,071,912 2,300,000 4,930,683 2,300,000
Endowments 0 0 0 0
Other 87,838 0 0 0
Transfers 16,204,947 0 16,419,086 0
Net Balance 8,081,189 0 7,527,257 0
Total Student Aid 68,920,514 69,000,000 59,172,464 69,000,000
Auxiliary ServicesMandatory Student Fees 7,205,531 0 7,142,196 0
State Government Contracts/Grants 0 203,500 0 203,500
Federal Government Contracts/Grants 0 152,625 0 152,625
Sales & Services 51,981,468 0 48,496,777 0
Other 1,131,962 0 1,166,680 0
Transfer from I & G (7,146,331) 0 (7,699,970) 0
Net Balance 832,423 0 723,044 0
Total Auxiliary Service 54,005,053 356,125 49,828,727 356,125
AthleticsMandatory Student Fees 4,000,000 0 4,000,000 0
State Government Appropriations -Operating 2,782,900 0 2,617,300 0
State Government Contracts/Grants 0 25,500 0 25,500
Federal Government Contracts/Grants 0 30,601 0 30,601
Private Contracts/Grants 23,000 0 15,000 0
Sales & Services 10,874,868 0 10,511,001 0
Other 16,889,922 0 16,080,125 0
Transfers 60,028 0 249,957 0
Net Balance 0 0 0 0
Total Athletics 34,630,718 56,101 33,473,383 56,101
Total Current Funds 558,391,026 176,846,226 512,857,453 176,846,226
18

Main Campus
Current Fund Expenditures
2016-17 2017-18
Unrestricted Restricted Unrestricted Restricted
Instruction and General
Instruction 190,353,185 3,634,000 176,047,478 3,634,000
Academic Support 41,881,444 675,000 39,616,141 675,000
Student Services 20,001,627 490,000 18,842,817 490,000
Institutional Support 46,180,021 250,000 42,623,609 250,000
Operations & Maintenance 36,083,625 22,500 34,197,351 22,500
Total 334,499,902 5,071,500 311,327,396 5,071,500
Activities other than I & G
Student Social & Cultural 10,500,000 459,000 9,685,096 459,000
Research 23,898,445 74,000,000 19,606,339 74,000,000
Public Service 29,500,000 27,700,000 25,012,258 27,700,000
Internal Service 2,436,394 203,500 4,751,790 203,500
Student Aid 68,920,514 69,000,000 59,172,464 69,000,000
Auxiliary Services 54,005,053 356,125 49,828,727 356,125
Athletics 34,630,718 56,101 33,473,383 56,101
Total 223,891,124 171,774,726 201,530,057 171,774,726
Total Current Fund Expense 558,391,026 176,846,226 512,857,453 176,846,226
19

Amount % Amount % Amount % Amount % Amount % Amount %
Instruction & General 308,878,382 36.29% 325,874,320 35.73% 330,439,018 39.67% 335,793,192 40.02% 334,499,902 39.34% 311,327,396 37.34%
Student Social & Cultural 8,453,637 0.99% 8,707,246 0.95% 8,829,331 1.06% 10,072,313 1.20% 10,500,000 1.24% 9,685,096 1.16%
Research 23,592,067 2.77% 23,500,000 2.58% 26,950,578 3.24% 21,979,083 2.62% 23,898,445 2.81% 19,606,339 2.35%
Public Service 28,238,000 3.32% 28,238,000 3.10% 26,456,787 3.18% 28,971,064 3.45% 29,500,000 3.47% 25,012,258 3.00%
Internal Services 2,248,025 0.26% 1,875,466 0.21% 939,254 0.11% 95,400 0.01% 2,436,394 0.29% 4,751,790 0.57%
Student Aid 59,095,752 6.94% 61,000,000 6.69% 61,495,374 7.38% 64,176,585 7.65% 68,920,514 8.11% 59,172,464 7.10%
Auxiliaries 56,221,491 6.61% 58,377,979 6.40% 53,366,330 6.41% 52,704,644 6.28% 54,005,053 6.35% 49,828,727 5.98%
Athletics 33,721,190 3.96% 34,000,000 3.73% 31,615,645 3.80% 33,074,208 3.94% 34,630,718 4.07% 33,473,383 4.02%
Restricted 184,719,776 21.70% 187,419,776 20.55% 172,546,226 20.71% 173,546,226 20.68% 176,846,226 20.80% 176,846,226 21.21%
Capital 146,004,496 17.15% 182,991,129 20.07% 120,422,092 14.46% 118,680,021 14.14% 114,948,449 13.52% 143,997,201 17.27%
Total 851,172,816 100.00% 911,983,916 100.00% 833,060,635 100.00% 839,092,736 100.00% 850,185,701 100.00% 833,700,880 100.00%
Funds
Original Budget
FY 2013 FY 2014 FY 2015 FY 2016 FY 2017 FY 2018
0
50
100
150
200
250
300
350
400
FY 2013 FY 2014 FY 2015 FY 2016 FY 2017 FY 2018
Mill
ion
s
Main Campus Budgeted Uses of Current Unrestricted and Restricted Funds
Instruction & General
Student Social &CulturalResearch
Public Service
Internal Services
Student Aid
Auxiliaries
Athletics
Restricted
Capital
20

MAIN CAMPUS UNRESTRICTED
21
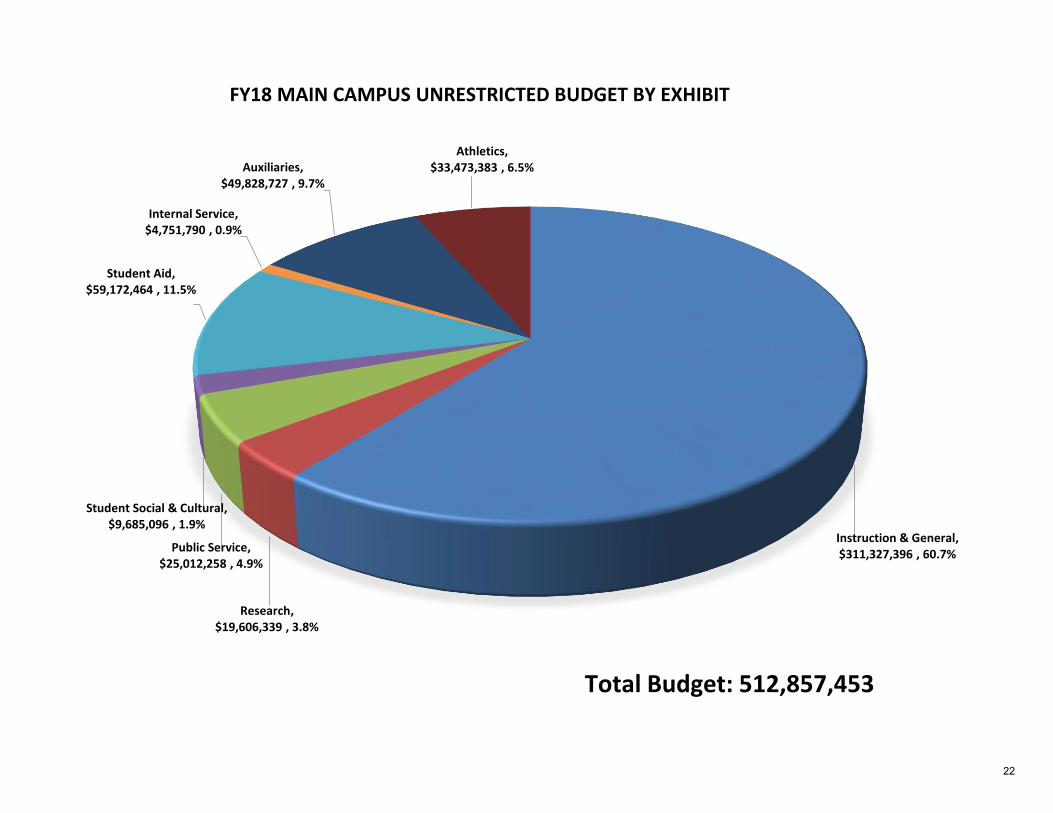
Instruction & General, $311,327,396 , 60.7%
Research, $19,606,339 , 3.8%
Public Service, $25,012,258 , 4.9%
Student Social & Cultural, $9,685,096 , 1.9%
Student Aid, $59,172,464 , 11.5%
Internal Service, $4,751,790 , 0.9%
Auxiliaries, $49,828,727 , 9.7%
Athletics, $33,473,383 , 6.5%
FY18 MAIN CAMPUS UNRESTRICTED BUDGET BY EXHIBIT
Total Budget: 512,857,453
22

Presidents, $8,579,708 , 1.7%
Academic Affairs , $302,495,006 , 59.0%
EVP for Administration, $201,782,739 , 39.3%
FY18 MAIN CAMPUS UNRESTRICTED BUDGET BY EVP UNIT
Total Budget: $ 512,857,453
23

President's Office, $1,934,818 , 22.6%
Internal Audit , $824,922 , 9.6%
Communication & Marketing, $2,357,918 , 27.5%
University Counsel , $1,179,108 , 13.7%
Office of Equal Opportunity, $688,775 , 8.0%
Alumni Relations, $745,894 , 8.7%
Compliance Office, $275,800 , 3.2%
Foundation, $572,473 , 6.7%
FY18 MAIN CAMPUS PRESIDENT'S UNITS-UNRESTRICTED BUDGET
Total Budget: 8,579,708
24

Financial Services, 12,209,267 , 6.1%
Must Funds (Pooled Fringes and Insurances),
50,125,783 , 24.8%
Board of Regents, 140,235 , 0.1%
Office of Planning, Budget & Analysis, 711,889 , 0.4%
EVP for Administration Office, 438,504 , 0.2% UNM Policy Office,
161,646 , 0.1%
Safety & Risk Services , 4,911,994 , 2.4% Police Department,
2,935,160 , 1.5%
Government & Community Relations, 789,309 , 0.4%
Human Resources, 2,680,682 , 1.3%
Information Technologies, 19,179,062 , 9.5% Athletics,
36,073,907 , 17.9%
Institutional Support Services, 71,425,301 , 35.4%
FY18 MAIN CAMPUS EVP FOR ADMINISTRATION UNRESTRICTED BUDGET
Total Budget: $ 201,782,739
25

Anderson Schools of Management, 15,546,034 ,
5.1%
College of Arts & Sciences , 70,156,265 , 23.2%
VP for Equity & Inclusion, 1,078,581 , 0.4%
Vice President for Research, 12,749,628 , 4.2%
College of Education , 15,419,804 , 5.1%
College of Fine Arts , 15,319,930 , 5.1%
College of Univ Lbry & Learning Sci, 15,196,415 , 5.0%
Continuing Education , 3,329,540 , 1.1%
School of Public Administration, 1,449,930 , 0.5%
Extended University ,
4,039,934 , 1.3%
Honors College, 1,634,666 , 0.5%
Provost Administrative Units, 20,816,727 , 6.9%
School of Architecture & Planning, 4,696,019 , 1.6%
School of Engineering , 20,913,332 , 6.9%
School of Law, 13,088,945 , 4.3%
University College , 2,105,487 , 0.7%
UNM West , 312,919 , 0.1%
VP Division of Enrollment Mgmt, 59,288,106 , 19.6%
HSC and Branches, 228,354 , 0.1%
Student Affairs, 25,124,390 , 8.3%
FY18 MAIN CAMPUS ACADEMIC AFFAIRS UNRESTRICTED BUDGET
Total Budget: $ 302,495,006
26

MAIN CAMPUS Unrestricted
I&G

Academic Affairs, $188,387,624 , 60.5%
President, $8,251,538 , 2.7%
EVP for Administration, $30,463,378 , 9.8%
PPD & Other Support Operations, $14,496,544 , 4.7%
Pooled Utilities, $17,243,200 , 5.5%
Pooled Must Funds (Fringes and Insurances), $52,485,112 , 16.9%
FY18 MAIN CAMPUS UNRESTRICTED INSTRUCTION AND GENERAL BUDGET
Total I&G Budget: $ 311,327,396
28

President's Office, $1,927,843 , 23.4%
Internal Audit , $824,922 , 10.0%
Communication & Marketing, $2,354,718 , 28.5%
University Counsel , $1,029,108 , 12.5%
Office of Equal Opportunity, $688,775 , 8.3%
Alumni Relations, $638,892 , 7.7%
Compliance Office, $275,800 , 3.3%
Foundation, $511,480 , 6.2%
FY18 MAIN CAMPUS PRESIDENT'S UNITS-UNRESTRICTED INSTRUCTION AND GENERAL BUDGET
Total I&G Budget: 8,251,538
29

Anderson Schools of Management, 13,528,579 ,
7.2%
College of Arts & Sciences , 63,989,147 , 34.0%
VP for Equity & Inclusion, 729,337 , 0.4%
Vice President for Research, 83,254 , 0.0%College of Education ,
14,450,782 , 7.7%
College of Fine Arts , 13,131,171 , 7.0%
College of Univ Lbry & Learning Sci, 14,755,261 , 7.8%
Continuing Education , 2,943,040 , 1.6%
School of Public Administration, 1,333,726 , 0.7%
Extended University ,
4,037,904 , 2.1%
Honors College, 1,450,168 , 0.8%
Provost Administrative Units, 12,664,010 , 6.7%
School of Architecture & Planning, 4,275,555 , 2.3%
School of Engineering , 16,907,384 , 9.0%
School of Law, 9,059,184 , 4.8%
University College , 2,094,365 , 1.1%
UNM West , 312,919 , 0.2%
VP Division of Enrollment Mgmt, 6,281,155 , 3.3%
VP HSC Administration, 183,000 , 0.1%
Student Affairs, 6,177,683 , 3.3%
FY18 MAIN CAMPUS ACADEMIC AFFAIRS UNRESTRICTED INSTRUCTION ANDGENERAL BUDGET
Total I&G Budget: $ 188,387,624
30
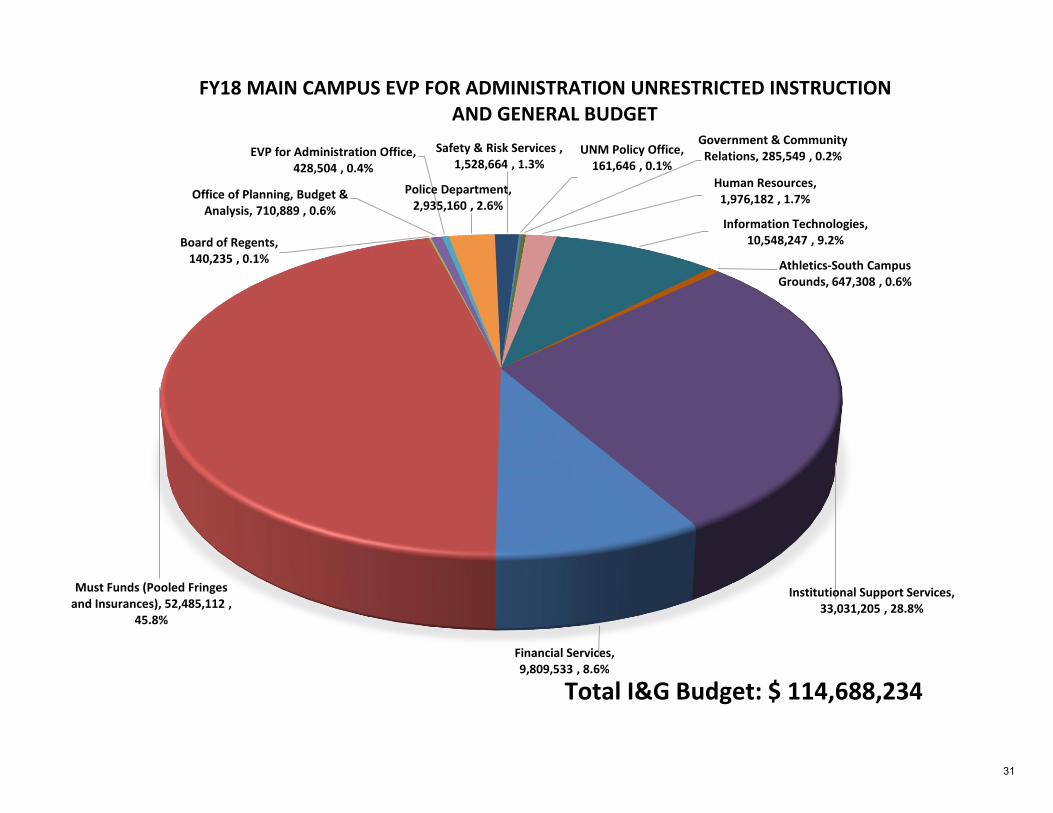
Financial Services, 9,809,533 , 8.6%
Must Funds (Pooled Fringes and Insurances), 52,485,112 ,
45.8%
Board of Regents, 140,235 , 0.1%
Office of Planning, Budget & Analysis, 710,889 , 0.6%
EVP for Administration Office, 428,504 , 0.4%
Police Department, 2,935,160 , 2.6%
Safety & Risk Services , 1,528,664 , 1.3%
UNM Policy Office, 161,646 , 0.1%
Government & Community Relations, 285,549 , 0.2%
Human Resources, 1,976,182 , 1.7%
Information Technologies, 10,548,247 , 9.2%
Athletics-South Campus Grounds, 647,308 , 0.6%
Institutional Support Services, 33,031,205 , 28.8%
FY18 MAIN CAMPUS EVP FOR ADMINISTRATION UNRESTRICTED INSTRUCTION AND GENERAL BUDGET
Total I&G Budget: $ 114,688,234
31

Harwood Foundation, $101,302 , 0.3%
Sevilleta Field Station, $81,180 , 0.2%
Recreational Services, $463,370 , 1.4%
Insurance, $1,329,190 , 3.9%
Fringes, $482,565 , 1.4%
Athletics-South Campus Grounds, $647,308 , 1.9%
Surplus Property, $133,846 , 0.4%
PPD Pooled Utilities, $17,243,200 , 50.4%
PPD Operation, $13,715,390 , 40.1%
FY18 MAIN CAMPUS OPERATION & MAINTENANCE OF PLANT UNRESTRICTED INSTRUCTION AND GENERAL BUDGET, EXHIBIT 14
Total I&G Budget: $ 34,197,351
32

Amount % Amount % Amount % Amount % Amount % Amount %
Instruction 170,247,151 55.12% 185,270,821 56.85% 187,445,742 56.73% 189,056,216 56.30% 190,353,185 56.91% 176,047,478 56.55%
Academic Support 37,392,677 12.11% 40,371,887 12.39% 42,341,400 12.81% 42,120,604 12.54% 41,881,444 12.52% 39,616,141 12.72%
Student Services 17,884,211 5.79% 18,653,232 5.72% 19,746,757 5.98% 20,072,656 5.98% 20,001,627 5.98% 18,842,817 6.05%
Institution Support 42,410,913 13.73% 41,856,082 12.84% 43,451,920 13.15% 46,198,114 13.76% 46,180,021 13.81% 42,623,609 13.69%
Operations & Maintenance 40,943,430 13.26% 39,722,298 12.19% 37,453,199 11.33% 38,345,602 11.42% 36,083,625 10.79% 34,197,351 10.98%
Total 308,878,382 100.00% 325,874,320 100.00% 330,439,018 100.00% 335,793,192 100.00% 334,499,902 100.00% 311,327,396 100.00%
Funds
Original Budget
FY 2013 FY 2014 FY 2015 FY 2016 FY 2017 FY 2018
0
20
40
60
80
100
120
140
160
180
200
FY 2013 FY 2014 FY 2015 FY 2016 FY 2017 FY 2018
Mill
ion
s
Main Campus Budgeted Uses of Unrestricted Instruction & General Funds
Instruction
Academic Support
Student Services
Institution Support
Operations &Maintenance
33

Pooled, $283,257,474, 91%
Non-Pooled, $28,069,922, 9%
FY 18 Main Campus Unrestricted I&G Budget
Pooled Non-Pooled
Total$311,327,396
34
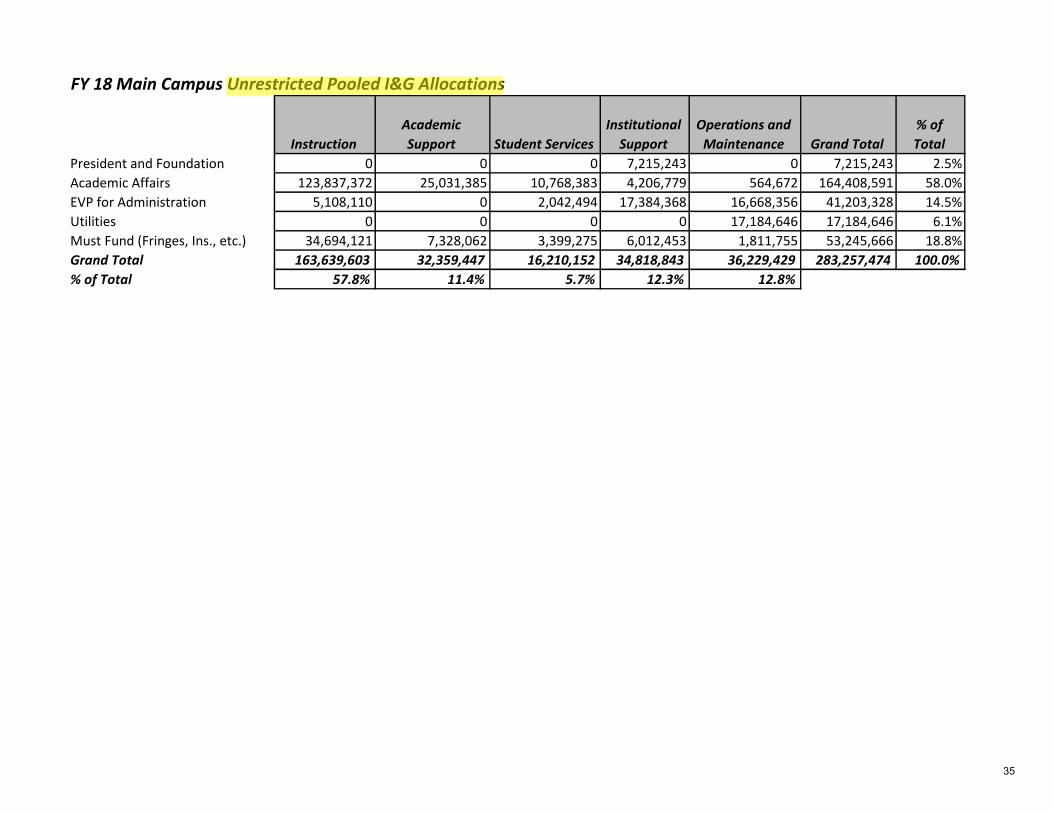
FY 18 Main Campus Unrestricted Pooled I&G Allocations
Instruction
Academic
Support Student Services
Institutional
Support
Operations and
Maintenance Grand Total
% of
Total
President and Foundation 0 0 0 7,215,243 0 7,215,243 2.5%
Academic Affairs 123,837,372 25,031,385 10,768,383 4,206,779 564,672 164,408,591 58.0%
EVP for Administration 5,108,110 0 2,042,494 17,384,368 16,668,356 41,203,328 14.5%
Utilities 0 0 0 0 17,184,646 17,184,646 6.1%
Must Fund (Fringes, Ins., etc.) 34,694,121 7,328,062 3,399,275 6,012,453 1,811,755 53,245,666 18.8%
Grand Total 163,639,603 32,359,447 16,210,152 34,818,843 36,229,429 283,257,474 100.0%
% of Total 57.8% 11.4% 5.7% 12.3% 12.8%
35
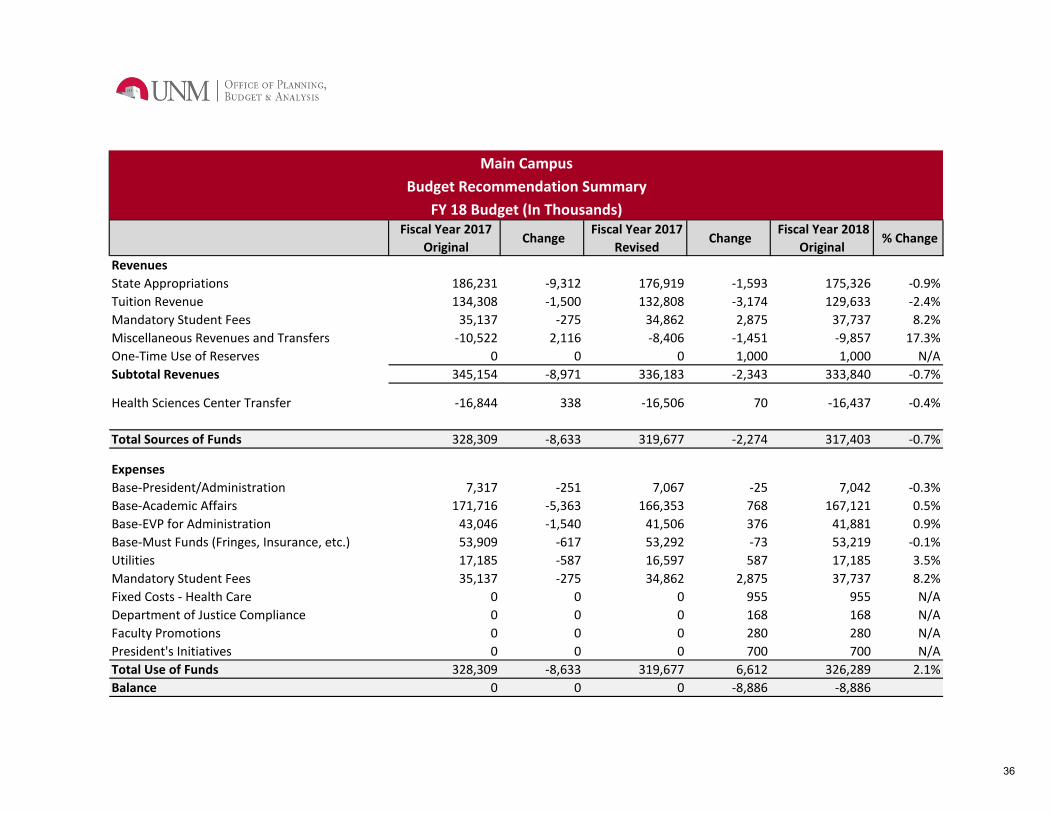
Fiscal Year 2017
Original Change
Fiscal Year 2017
Revised Change
Fiscal Year 2018
Original % Change
Revenues
State Appropriations 186,231 -9,312 176,919 -1,593 175,326 -0.9%
Tuition Revenue 134,308 -1,500 132,808 -3,174 129,633 -2.4%
Mandatory Student Fees 35,137 -275 34,862 2,875 37,737 8.2%
Miscellaneous Revenues and Transfers -10,522 2,116 -8,406 -1,451 -9,857 17.3%
One-Time Use of Reserves 0 0 0 1,000 1,000 N/A
Subtotal Revenues 345,154 -8,971 336,183 -2,343 333,840 -0.7%
Health Sciences Center Transfer -16,844 338 -16,506 70 -16,437 -0.4%
Total Sources of Funds 328,309 -8,633 319,677 -2,274 317,403 -0.7%
Expenses
Base-President/Administration 7,317 -251 7,067 -25 7,042 -0.3%
Base-Academic Affairs 171,716 -5,363 166,353 768 167,121 0.5%
Base-EVP for Administration 43,046 -1,540 41,506 376 41,881 0.9%
Base-Must Funds (Fringes, Insurance, etc.) 53,909 -617 53,292 -73 53,219 -0.1%
Utilities 17,185 -587 16,597 587 17,185 3.5%
Mandatory Student Fees 35,137 -275 34,862 2,875 37,737 8.2%
Fixed Costs - Health Care 0 0 0 955 955 N/A
Department of Justice Compliance 0 0 0 168 168 N/A
Faculty Promotions 0 0 0 280 280 N/A
President's Initiatives 0 0 0 700 700 N/A
Total Use of Funds 328,309 -8,633 319,677 6,612 326,289 2.1%
Balance 0 0 0 -8,886 -8,886
FY 18 Budget (In Thousands)
Main Campus
Budget Recommendation Summary
36

FY18 EXAMPLE OF SUBCOMMITTEE RECOMMENDATIONS (in thousands)
Proposed Final Committee/Subcommittee Fund Type
Revenue Enhancements - Recurring
Tuition Options (Model Changes):
Current Tuition Model + $23 per Credit Hour for All Upper Division +5% Tuition Increase for
Graduate Students +$23 per Graduate Credit Hour for Hours That Currently Do Not Have a
Differential (80% of $7M) 5,589 0 Tuition and Fee
Current Tuition Model + $18 per Credit Hour for All Upper Division +4% Tuition Increase for
Graduate Students +$18 per Graduate Credit Hour for Hours That Currently Do Not Have a
Differential (80% of $5.5M) 0 4,417 Tuition and Fee
Total Revenue Enhancements 5,589 4,417
Expense/Cost Reductions - Recurring
Food and Business Meals 551 551 Cost Reallocation I&G Only
Travel and Per Diem (25% of I&G Total) 640 640 Cost Reallocation I&G Only
Administrative Overhead - Public Service 200 200 Cost Reallocation
Administrative Overhead on Research and Public Service Projects (RPSPs) 5% 252 252
Cost Reallocation and
Budget Development
UNM Cellular Options (Basic Phone Plan or Reimbursement up to $40) 79 79 Cost Reallocation All UNM
50% Reduction of Sick Leave Sell Back - I&G 25% of total (estimated). Full Elimination in FY19. 100 100 All UNM
Reduction in Foundation Allocation 128 128 Budget Development I&G Only
Alumni Relations 213 213 I&G Only
Graduated Leave Accrual - Version 2: No savings until FY 19 0 0 Budget Leadership Team All UNM
Dispute Resolution and Faculty Ombudsman - Move to Misc. Fringe 238 238 Cost Reallocation I&G Only
Upper Administration Salary and Workforce Reductions 200 200
Total Expense/Cost Reductions 2,600 2,600
Workforce Reduction Options - Recurring
Reorganization/Attrition (estimated)* 696 1,868
Total Workforce Options 696 1,868
Potential Resources and Cost Savings to Offset Projected Shortfall 8,886 8,886
FY 18 Projected Shortfall -8,886 -8,886
Net Total 0 0
Notes:
* Regular Faculty Average for 1 FTE: $82,000. Regular Staff Average for 1 FTE: $50,000. Regular staff includes exempt, non-exempt and administrator positions.
FY18 Budget Scenario_5 25 17_Summit Final37

Fiscal Year
2017 Original Change
Fiscal Year
2018 Original % Change
FY 17 to FY 18
Revenues
State Appropriations 186,231 -10,905 175,326 -6%
Tuition Revenue 134,308 847 135,155 1%
Mandatory Student Fees 35,137 2,600 37,737 7%
Miscellaneous Revenues/Transfers -27,366 143 -27,223 -1%
Total Sources of Funds 328,309 -7,315 320,994 -2%
Expenses
Expenditure Base 293,172 -12,185 280,987 -4%
SFRB Funding Priorities 35,137 2,600 37,737 7%
Fixed Cost Increases 0 955 955 N/A
Department of Justice Compliance 0 168 168 N/A
Faculty Promotions 0 280 280 N/A
President's Initiatives 0 700 700 N/A
GA/TA Tuition Waivers - Tuition Increase 0 167 167 N/A
Total Use of Funds 328,309 -7,315 320,994 -2%
Note: FY18 expenditure base reduction is offset by a $1M use of reserves.
Main Campus
Budget Recommendation Summary
FY 18 Original Budget ( In Thousands)
38

MAIN CAMPUS I&G BUDGET SCENARIO
REQUESTS AND NEW INITIATIVES
$955,000 – UNM Health Care: Projected premium increase associated with the University Self-Insurance Plan. Employer Share 4.6% increase. $700,000 – President’s Initiatives: Discretionary funding for various Presidential initiatives. $168,000 – Department of Justice Compliance: Funding will be used to support staff hires in the Office of Equal Opportunity to accommodate the increased workload and newly required activities as a result of UNM's agreement with the Department of Justice. Funding is also allocated to the Compliance Office to support training, reporting, and data analysis related to sexual misconduct across campus. $280,000 – Faculty Promotions: Funding will be used for faculty and lecturer promotions. When a faculty member is promoted from Assistant/Associate/Professor, it is guaranteed in their contract they will receive a promotional increase to their base salary. When lecturers are promoted to Senior or Principal they also receive an increase to their base salary. $2,600,000 (rounded) – Mandatory Student Fees: The Budget Leadership Team (BLT) and the Student Fee Review Board (SFRB) recommendations held fees relatively flat in FY 2018 and reallocated funding between units. The BLT and SFRB recommendation cut Athletics by $120,000. The total fee increase included in the FY 2018 budget is primarily to support the debt service related to the UNM Series 2017 bond issue. In addition, the budget approved by the Regents restored the $120,000 funding for Athletics by shaving all other units by .93%.
39

FY 2016 Original
Budget
FY 2017 Original
Budget
FY 2018 Original
Budget
Fica 11,154,000 11,200,551 11,443,231 Retirement 22,072,587 21,856,870 21,057,666 Group Insurance 14,589,000 15,463,003 16,015,394 Unemployment Compensation 265,000 221,703 235,501 Workers Compensation 217,000 171,598 185,239 Other Staff Benefits 6,475,000 6,019,745 5,965,977 Accrued Annual Leave 193,000 103,656 65,000 Catastrophic Leave 74,000 62,000 29,000 Contingency/Other/Cost Share 36,753 200,000 161,787 Total 55,076,340 55,299,126 55,158,795
Main Campus I&G Pooled Fringe Benefits
40

-
5,000,000
10,000,000
15,000,000
20,000,000
25,000,000
FY 2016 Original Budget FY 2017 Original Budget FY 2018 Original Budget
11,154,000 11,200,551 11,443,231
22,072,587 21,856,870 21,057,666
14,589,000 15,463,003 16,015,394
Main Campus I&G Pooled Fringe Benefits
Fica Retirement Group Insurance
41

Fiscal YearI&G State
Appropriation
Pooled
TuitionTotal
Total
Dollar Change
Total
% Change
% State
Appropriation
%
Tuition
Annual Tuition
Dollar Change
Tuition Only
% Change
2008-2009 194,525,100 85,874,927 280,400,027 N/A N/A 69% 31% N/A N/A
2009-2010 187,263,600 96,969,415 284,233,015 3,832,988 1.4% 66% 34% $190 5.0%
2010-2011 174,407,200 109,989,219 284,396,419 163,404 0.1% 61% 39% $340 8.5%
2011-2012 159,741,900 122,307,430 282,049,330 (2,347,089) -0.8% 57% 43% $304 7.0%
2012-2013 173,006,700 126,369,208 299,375,908 17,326,578 6.1% 58% 42% $174 3.8%
2013-2014 180,404,500 133,971,255 314,375,755 14,999,847 5.0% 57% 43% $181 3.8%
2014-2015 189,147,900 134,007,480 323,155,380 8,779,625 2.8% 59% 41% $0 0.0%
2015-2016 191,264,000 136,035,226 327,299,226 4,143,846 1.3% 58% 42% $150 3.0%
2016-2017 186,759,600 134,307,726 321,067,326 (6,231,900) -1.9% 58% 42% $129 2.5%
2017-2018 175,823,200 135,154,797 310,977,997 (10,089,329) -3.1% 57% 43% $0 0.0%
2009 to 2018 (18,701,900) 49,279,870 30,577,970 30,577,970 10.9% -10% 57% $1,469 38.5%
Notes:
* State Appropriation and tuition includes Extended University component.
* Tuition dollar and percent changes are calculated on base tuition for undergraduation resident students at the blocked rate.
The University of New Mexico - Main Campus
I&G State Appropriations and Pooled Tuition
Fiscal Year 2009 - 2018
42

UNM HSC ALL COMPONENTS

GENERALOBSERVATIONS
ChangeinInstruction&GeneralFunding
ChangesintheInstructionandGeneral(I&G)budgetfromFY2017toFY2018are
summarized in Table II. I&G revenue, transfers and use of balance increased by $1.9
million. Net reductions in state appropriations fromFY 2017 post‐rescission to FY 2018
total$838thousand.OtherrevenuechangesimpactingHSCI&Ginclude a $300thousand
increase in F acilities andAdministration ( F&A ) cost recovery.
TheincreaseinHSCI&GexpendituresareprimarilyrelatedtoDomeniciIIIutilities,
operationsandmaintenance.Inaddition,generalutilitiesandbenefitscostsareincreasing.
StateAppropriations
TheFY2018stateappropriationsfortheHealthSciencesCenter(HSC)are1percent
lower than FY 2017 post rescission appropriations, as shown in Table I. FY 2018 state
appropriations are about 6 percent below the original FY 2017 budget, prior to 2017
rescissions.TheHSCreceivesacombinationofGeneralFund(GF)andTobaccoSettlement
Fund (TSF) appropriations. TotalTSFfundingremainedflatwithFY2017at$2.9million.
The Supplemental General Appropriations Bill (House Bill 1 passed during the 2017
SpecialSession)distributedtheTSFasfollows:
a. HealthSciencesCenterI&G,$581.5thousand;
b. SpecialtyEducationinPediatrics,$250thousand;
c. SpecialtyEducationinTrauma,$250thousand;
d. Genomics,Biocomputing,EnvironmentalHealth,$937.4thousand;
e. PediatricOncology,$250thousand;and
f. PoisonandDrugInformationCenter,$590.2thousand
TraumafundingappropriationshavebeeneliminatedforFY2018.Fiscalyear2017
fundingwasapproximately$562thousand.
44

TuitionandFees‐I&G
ThefollowingchangeswereapprovedbytheUNMRegentsforFY2018:
a. Tuitionincreases:
1. Studentstakingupperdivisionclasseswillpayanadditional$18percredithour;
2. Graduatestudentswillpaya4percentincreaseintuitionandanadditional$18per
credithourdifferentialforgraduateprogramsthatdonotalreadychargeatuition
differential.
3. DepartmentofEmergencyMedicalServices(EMS)isimplementinganewtuition
differentialof$60percredithour.
b. Allstudentswillpayanadditional$100persemesterinstudentfees.
TableIIshowsthatHSCisprojecting$28.8millionintuitionforthe2018budget.
MainCampuswill retain$2.4millionofHSCtuition.
Formula‐I&G
MainCampuswilltransfer$9.8millionofHSCgeneratedformulatoHSC.
MainCampustoHSC/HSCtoMainCampusTransfers‐AllFunds
Main Campus will transfer to the HSC $20.7million for I&G andother support.
TheHSCwill transfer to theMainCampus $5.6million (Table II, lines 17, 18,& 20) for
institutionalsupportfunctionsincludingUNMPolice,Planning & Campus Development,
Safety & Risk Services, Information Technologies, Government& Community Relations,
andMailing Systems. The transfer to Main also includes support for theUNM Academic
FreedomandTenureCommittee,LoboRESPECTAdvocacyCenterandFacultySenate.
Inaddition,theHSCdirectlyfundsthefollowingMainCampusoperatedunits(note
the following amounts do not include fringe benefits): $594 thousand for Human
Resources;$1.5millionfortheOfficeofUniversityCounsel;$176.5thousandforFacilities
Planning;$3.2millionforPhysicalPlant;and$4millionforUtilities.
45

FacultyandStaffSalaries
The Board of Regents did not approve and the Legislature did not appropriate
compensationincreasesforFY2018.
UNMHospitals
TheattachedpresentationforUNMHospitalsrepresentsthefollowingentities:UNM
Hospital,UNMCarrieTingleyHospital,UNMPsychiatricCenter,UNMChildren’sPsychiatric
Center, UNMAddiction and SubstanceAbuse Program (ASAP), and the Young Children’s
HealthCenter.
TheUNMHospitalsbudgetreflectsanetmarginof$4.1thousandforFY2018.UNM
Hospitalsisprojectinginpatientdischargestoincreaseby1percent,surgicalcasevolumeto
increaseby5percentandclinicvisitstoincreaseby6percent.UNMH’srecentadditionof
home health services and other relationships for post‐acute care capabilities alongwith
otherpatientflowinitiativesshouldincreasepatientthroughputandallowforanincrease
inadmissions.Theincreaseinclinicvisitsisbasedontheopeningofthewomen’sservices
clinicaswellasincreasedcapacityinprimarycareandspecialtyclinics.Thebudgetednet
revenuesincludethefinancialimpactforthepatientvolumeincreases.Netrevenuesalso
reflect a decrease inMedicaredisproportionate share reimbursement asprovidedunder
thePatientProtectionandAffordableCareAct(PPACA).
Salaries, benefits,medical supplies and other expenses are in linewith projected
volumesandannualinflation.TheUniversityCliniciansProgram(UCP)includesincreases
for support of additional medical staff positions in Pathology, Anesthesia, Dermatology,
Emergency Services, Internal Medicine, Family and Community Medicine and Surgery.
Housestaff includes increases for Pediatric Emergency Medicine, Otolaryngology, Plastic
SurgeryandObstetrics.
46

UNMSandovalRegionalMedicalCenter
TheUNMSRMCFY2018budgetreflectscontinuedgrowthinmanyareasincluding
a10percentincreaseinacuteinpatientadmissions,a17percentincreaseinsurgicalcases
andan11percentincreaseinclinicvisits.
The UNM SRMC FY 2018 budget reflects a net margin of $1.9 thousand. Net
revenuesreflecttheimpactofincreasedclinicalvolumes.TheSandovalCountyMilLevyis
eliminatedeffectiveFY2018.FundingforFY2017wasapproximately$6million.Salaries,
benefits,medical suppliesandother costsare in linewithprojectedvolumesandannual
inflation.
UNMMedicalGroup
The UNM Medical Group (UNMMG) budget reflects the revenues and expenses
associatedwith the facultyphysicians in theSchoolofMedicineaswell asactivityat the
UNMMedicalGroupclinics.TotalrevenuesforFY2018arebudgetedtobe$229.4million,
representing an increase of $11.2million, or 5.1 percent, above the FY 2017 projection.
Thisincreaseisprimarilydrivenbyvolumeincreasesof5.5percentforprovideractivityat
UNMHospitalsanditsclinics,UNMCancerCenter,UNMSandovalRegionalMedicalCenter
andUNMMedicalGroupclinics.
The UNMMedical Group expenses consist of three major components, including
costs of physician services, costs to operate theUNMMedical Group clinics, and general
overheadcosts. Costsofphysicianservicesarebudgetedtobe$166.6millioninFY2018
and clinic operating costs are budgeted at $27 million. The remaining costs, primarily
consistingofoverheadandhealthsystemcosts,arebudgetedtobe$31.6million.
TheFY2018budgetednetmarginfortheUNMMedicalGroup,afteradjustingfor
restrictedanddesignatedreserves,is$26thousand.
47

PostSpecial
Original Session OriginalFY2016‐17 FY2016‐17 FY2017‐18 %Change* Notes
HSCInstruction&General 61,898,000$ $58,857,200 58,282,600$ ‐1% Totalsincludes$581,500I>SF;$250,000TraumaSpecialtyEducationTSF;and$250,000PediatricSpecialtyEducationTSF.
CancerCenter 2,625,800 2,494,500 2,469,500 ‐1%
CarrieTingleyHospital 5,198,100 4,938,200 4,888,800 ‐1%
CenterforNativeAmericanHealth 268,000 254,600 252,000 ‐1%
Children'sPsychiatricCenter 7,115,600 6,759,800 6,692,200 ‐1%
CONNursingShortage/Expansion 1,076,400 1,022,600 1,012,300 ‐1%
937,200 937,200 937,400 0% TSFappropriation.
HepatitisC,ProjectECHO 2,091,700 1,987,100 2,017,200 1% TheLegislatureappliedtheacrosstheboardFY175%rescissionandFY181%cutandthenappropriated$50,000newrecurringforFY18
97,300 92,400 91,400 ‐1%
NewbornIntensiveCareUnit 3,268,800 3,105,400 3,074,300 ‐1%
OfficeoftheMedicalInvestigator 5,005,000 4,754,800 4,707,200 ‐1%
PediatricOncology 1,521,800 1,458,200 1,446,100 ‐1% Totalincludes$250,000ofTSF.
PoisonandDrugInfoCenter 2,138,700 2,061,300 2,046,400 ‐1% Totalincludes$590,200TSF.
GraduateNursingEducation 1,610,500 1,530,000 1,514,700 ‐1%
InternalMedicineResidencies 1,042,500 990,400 980,400 ‐1%
PsychiatryResidencies 393,600 373,900 370,100 ‐1%
GeneralSurgery/FamilyMedicineResidencies 327,300 310,900 307,700 ‐1%
TotalOperatingAppropriations 96,616,300$ 91,928,500$ 91,090,300$ ‐1%
Notes:GF=GeneralFund;TSF=TobaccoSettlementFund
1.
2. FY2017TotalTobaccoSettlementFunds=$2,859,100
3. FY2018TotalTobaccoSettlementFunds=$2,859,100
*The2016LegislaturecutGFappropriationsby5%acrosstheboardinaspecialsessionandthe2017LegislaturecutGFappropriationsanother1%acrosstheboard.ProjectECHOwasappropriatedanadditional$50,000afterthe1%cut.
Program
Genomics,Biocomputing,Environmental
NativeAmericanSuicidePreventionProgram
THEUNIVERSITYOFNEWMEXICOHEALTHSCIENCESCENTER
FY2017&FY2018OPERATINGBUDGETS
SUMMARYOFRECURRINGLEGISLATIVEAPPROPRIATIONS(ExcludesTransfersfromMainCampus)
TABLEI
48

UNMHSCCampusBudgetDevelopment,UnrestrictedI&GFiscalYear2018Summary(inthousands)
SourcesofFunds: FY17Original Changes FY17Revised Changes FY18OriginalStateI&GGeneralFund:
1 StateAppropriationI&GPooledBase 66,216 ‐1,631 64,585 ‐3,175 61,410 12 HSCStateAppropriationChange:GeneralFund5%RescissionFY17;1%cutFY18 ‐1,631 ‐1,544 ‐3,175 2,575 ‐600 23 SubtotalStateI&GGeneralFund 64,585 ‐3,176 61,410 ‐600 60,810 3Tuition:
4 MD,Differentials,Online 14,882 ‐394 14,488 733 15,221 45 Baseamountgeneratedper2014MOU/Baseamountper2016MOU(FY16Tuition) 9,089 2,067 11,156 0 11,156 56 ProjectedIncrementalTuitionFY13‐FY17(AmountretainedbyMain) 2,433 ‐58 2,375 0 2,375 67 Adjustment:EMSDifferential$60percredithour 0 0 191 191 78 SubtotalTuition 26,404 1,615 28,019 924 28,943 8StudentFees:
9 StartingBase 2,565 60 2,626 85 2,711 910 SubtotalCourse 2,565 60 2,626 85 2,711 10
NetTransfersTo/FromHealthSciencesCenterTransfersandMainCampus:11 HealthSciencesCenterFormulaTransferfromMain 17,973 ‐9,171 8,802 978 9,781 1112 HealthSciencesCenterTuitionTransferfromMain 0 11,156 11,156 0 11,156 1213 HSCTuitionTrue‐up 313 0 313 ‐313 0 1314 HSCTuitionPrioryeartuitionincrease(enrollmentgrowth) 826 0 826 ‐826 0 1415 HSCTuitionrateincrease 221 0 221 ‐221 0 1516 FY175%rescission;FY18formula ‐452 12 ‐440 244 ‐196 1617 HealthSciencesCenterI>ransferstoMain ‐3,444 84 ‐3,360 55 ‐3,305 1718 FY175%rescission;FY181%cut 84 53 137 ‐79 59 1819 ReverseTuitiontransferfromMainrecognizedasHSCTuition ‐9,089 ‐2,067 ‐11,156 0 ‐11,156 1920 HealthSciencesCenterTuitionreturnedtoMainCampusperagreement3/17/2016 ‐2,433 58 ‐2,375 0 ‐2,375 2021 SubtotalTransferstoHealthSciencesCenterfromI&GBase 4,000 125 4,125 ‐162 3,963 21
Miscellaneous22 RCMAssessment‐InstitutionalSupport 26,014 ‐4,216 21,798 ‐4,253 17,545 2223 F&ARevenues 24,000 0 24,000 300 24,300 2324 F&ATransferstoResearch ‐24,000 0 ‐24,000 ‐300 ‐24,300 2425 OtherSelfSupportingRevenues 3,912 65 3,976 141 4,117 2526 TransfertoPlant ‐444 ‐2,059 ‐2,503 2,059 ‐444 2627 TransferstoI&GSupportedRPSPs ‐4,500 138 ‐4,361 4,361 0 27
(LocumTenens,IntegMed,Telehealth,YCHC,IRHJ,HealthyNeighborhoodsABQ,etc.)28 TransfersfromRPSPsforOverhead/AdminOverheadRecoveredfromRPSPs 1,435 ‐72 1,364 ‐11 1,353 2829 TransferstoStudentAid(StateScholarships) ‐193 ‐41 ‐234 41 ‐193 2930 TransfersforCostShare ‐149 4 ‐146 3031 One‐TimeUseofReserves 0 780 780 ‐432 347 3132 SubtotalMiscellaneous 26,224 ‐5,405 20,669 1,910 22,579 32
33 TotalSourcesofFunds: 123,778 ‐6,780 116,849 2,156 119,005 33
UsesofFunds: FY17Original Changes FY17Revised Changes FY18OriginalI&GExpenditureBudget:
34 ExpenditureBase 88,211 ‐6,354 81,857 5,221 87,078 34FixedCosts:
35 HealthCare 7,176 ‐963 6,213 ‐464 5,749 3536 Utilities 3,891 752 4,644 577 5,221 3637 Property&LiabilityInsurance 1,974 222 2,196 32 2,228 3738 PooledFringeBenefits 17,840 ‐645 17,195 ‐428 16,768 38
FundingPriorities:FY17Priorities
39 InstituteforResilience 106 0 106 ‐106 3940 CollegeofPopulationHealth 1,672 0 1,672 ‐1,672 4041 LoboRESPECTAdvocacyCenter 52 ‐3 49 ‐49 4142 UNMWest 291 0 291 ‐291 42
FY18Priorities43 DomeniciIII,Utilities,O&M 471 471 4344 Netrecurringsalaryandbenefitssavings ‐531 ‐531 4445 Netrecurringnon‐salaryreallocations ‐689 ‐689 4546 SubtotalI&GExpenditures 121,213 ‐6,989 114,224 2,071 116,294 46
CourseFees:47 ExpenditureBase 2,565 60 2,626 85 2,711 4748 SubtotalMandatoryStudentFeeAllocationsandRequests 2,565 60 2,626 85 2,711 48
49 TotalUsesofFunds 123,778 ‐6,929 116,849 2,156 119,005 4950 Balance 0 0 0 0 0 50
ProposedCurrent
Current Proposed
49

Unrestricted Restricted Unrestricted RestrictedInstructionandGeneral
Tuition 14,881,718 15,411,453StudentFees 2,469,447 2,634,413StateAppropriations‐Operating 64,584,900 60,809,600StateGovernmentContracts/Grants 45,000 155,000FederalGovernmentContracts/Grants 3,053,170 2,752,870LocalGovernmentContracts/Grants 55,707 75,000PrivateContracts/Grants 809,575 968,595IndirectCostRecovery(F&A) 24,000,000 24,300,000Sales&Services 116,000 116,000Other 16,052,998 5,537,093TotalI&GRevenue 122,105,063 3,963,452 108,808,559 3,951,465
Transfers(From)ToI&GResearch (9,753,129) (8,825,288)PublicService (3,935,914) 6,637 4,478,727 5,357InternalServices (191,568) (211,568)StudentAid (193,400) (193,400)StudentSocial&Cultural 0PlantFundCapOutlay/DebtSvc. (444,300) (444,300)Main 15,639,177 14,999,931Unrestricted/RestrictedTransfers (150,329) 150,329 (145,825) 145,825IndependentOperations 702,838 0TotalI>ransfers 1,673,375 156,966 9,658,277 151,182
NetBalance 0 347,452
NetI&GRevenue 123,778,438 4,120,418 118,814,288 4,102,647
StudentSocial&CulturalStateApprop‐OperatingStateC&GFederalC&GLocalC&GPrivateC&G 0 0FundRaisingActivities 12,133 7,920S&S 3,000 4,500Other 21,060 14,942Transfers 1,640 264NetBalance 34,051 8,812TotalStudentSocial&Cultural 71,884 0 36,438 0
ResearchStateApprop‐Operating 10,128,071 9,338,075StateC&G 1,106,130 632,314FederalC&G 59,775,438 70,505,121LocalC&G 1,762 162PrivateC&G 7,560,704 7,875,059S&S 399,221 159,400 541,160 0Other 1,110,653 820,952 1,115,950 1,207,842Transfers 12,780,613 1,968,341 13,702,863 2,943,585NetBalance 960,396 712,806TotalResearch 25,378,954 71,392,727 25,410,854 83,164,083
HealthSciencesCenterCurrentFundRevenue
2016‐17 2017‐18
50

Unrestricted Restricted Unrestricted Restricted
HealthSciencesCenterCurrentFundRevenue
2016‐17 2017‐18
HSCCurrentFundRevenueContinued
PublicServiceStateApprop‐Operating 9,058,000 8,568,400StateC&G 12,688,501 13,842,134FederalC&G 3,587,362 18,757,467 3,098,986 17,421,836LocalC&G 0 66,544 0 17,001PrivateC&G 2,300,562 5,532,460 3,654,751 6,027,118S&S 289,557,992 308,615,021Other 3,753,790 57,750 5,357,930 0Transfers (213,096) 42,680 (15,672,303) 0NetBalance (6,788,038) (1,551,296)TotalPublicService 301,256,572 37,145,402 312,071,489 37,308,089
InternalServicesS&S 14,838 13,209Transfers 542,924 564,724NetBalance 0 7,036TotalInternalService 557,762 0 584,969 0
StudentAidStateC&G 7,209 11,108FederalC&GPrivateC&G 438,301 12,864 518,397Endowments 1,856,283 2,277,911 1,707,065 2,249,805Transfers 2,378,447 2,303,761NetBalance 460,339 574,091TotalStudentAid 4,695,069 2,723,421 4,597,781 2,779,310
IndependentOperationsStateApprop‐Operating 17,318,700 16,288,200StateC&G 30,173,059 30,922,446FederalC&G 8,413,114 7,125,000LocalC&G 13,028 11,253PrivateC&G 350,000 1,777,161Endowments 844,575 811,303S&S 23,190,317 25,006,896Other 150,362 265,047Transfers (1,738,505) (1,194,810)NetBalance 6,101,533 5,209,212TotalIndependentOperations 84,816,183 0 86,221,708 0
TotalCurrentFunds 540,554,862 115,381,968 547,737,527 127,354,129
51

UNMHSCAllComponents‐ RevenuesFY2018Budget
(Inthousands)
TotalBudgetedRevenues$2,027,1121.7%IncreaseoverFY2017Budget
Note:IncludesUNMHSCAcademicEnterpriseandUNMHealthSystem
I&G/State,$95,460,4.71%
Tuition&Fees,$18,046,0.89%
Grants/Contracts,Facilities&Administrative,$171,320,8.45%
OtherRevenue/Allocations/Transfers,
$95,300,4.70%
CommercialInsurance,$336,426,16.60%
Medicare,$295,613,14.58%
Medicaid,$503,023,24.81%
OtherPatientCareRevenue,$413,648,20.41%
MilLevy,$98,277,4.85%
52

Unrestricted Restricted Unrestricted Restricted
InstructionandGeneral
Instruction 79,145,315 4,016,713 74,048,616 3,937,347AcademicSupport 9,406,741 18,196 9,134,883 44,300StudentServices 7,667,668 75,509 7,397,611 111,000InstitutionalSupport 18,880,309 10,000 18,325,137 10,000Operations&Maintenance 8,678,405 9,908,041
Total 123,778,438 4,120,418 118,814,288 4,102,647
ActivitiesotherthanI&G
StudentSocial&Cultural 71,884 36,438Research 25,378,954 71,392,727 25,410,854 83,164,083PublicService 301,256,572 37,145,402 312,071,489 37,308,089InternalService 557,762 584,969StudentAid 4,695,069 2,723,421 4,597,781 2,779,310IndependentOperations 84,816,183 86,221,708
Total 416,776,424 111,261,550 428,923,239 123,251,482
TotalCurrentFundExpense 540,554,862 115,381,968 547,737,527 127,354,129
HealthSciencesCenterCurrentFundExpenditures
2016‐17 2017‐18
53

UNMHSCAllComponents‐ ExpendituresFY2018Budget
(Inthousands)
TotalBudgetedExpenditures$2,027,1822.4%IncreaseoverFY2017Budget
Note:IncludesUNMHSCAcademicEnterpriseandUNMHealthSystem
SchoolofMedicine, $508,826,25.10% Nursing, $15,717,0.78%
Pharmacy, $17,848,0.88%
PopulationHealth,$2,491,0.12%
HSCResearch,$22,617,1.12%
HSCAdministration,$68,287,3.37%
UNMHospitals, $1,077,505,53.15%
SandovalRegionalMC,$84,522,4.17%
UNMMedicalGroup,$229,369,11.31%
54

1
UNMHSCAcademicEnterpriseComparativeAnalysis:PriorYear‐ CurrentYear‐ NextYear
(Inthousands)
FY2016Actuals
FY2017Revised Budget
FY2018Budget
PercentChange2017‐18
Revenues $582,504 $608,846 $623,225 2.4%
Expenses 574,458 617,217 635,786 3.0%
Transfers–(Capital/Recruitment/Startup/Scholarships) (5,420) 5,097 12,457
NetMargin $2,626 ($3,274) ($104)
55

UNMHospitalsComparativeAnalysis:PriorYear‐ CurrentYear‐ NextYear
(Inthousands)
FY2016Actuals
FY2017Revised Budget
FY2018Budget
PercentChange2017‐18
Revenues $1,009,461 $1,039,162 $1,077,509 3.7%
Expenses 1,001,268 1,038,962 1,077,505 3.7%
NetMarginbeforeNon‐RecurringItems $8,193 $200 $4
CapitalInitiatives/ HealthInsurance– OPEB 6,811 0 0
NetMargin $15,004 $200 $4
56

UNMMedicalGroupComparativeAnalysis:PriorYear‐ CurrentYear‐ NextYear
(Inthousands)
FY2016Actuals
FY2017Revised Budget
FY2018Budget
PercentChange2017‐18
Revenues $206,230 $218,105 $229,396 5.2%
Expenses 204,877 216,232 225,246 4.2%
NetMarginbeforeNon‐RecurringItems $1,352 $1,873 $4,150
Meaningful UseRevenue/UseofUNMMGReserves (526) 3,221 (4,123)
NetMargin $826 $5,094 $27
57

UNMSandovalRegionalMedicalCenterComparativeAnalysis:PriorYear‐ CurrentYear‐ NextYear
(Inthousands)
FY2016Actuals
FY2017Revised Budget
FY2018Budget
PercentChange2017‐18
Revenues $85,300 $84,847 $84,525 ‐0.4%
Expenses 85,296 84,846 84,522 ‐0.4%
NetMarginbeforeNon‐RecurringItems $4 $1 $3
CapitalInitiatives/ Meaningful UseRevenue ‐ ‐ ‐
NetMargin $4 $1 $3
58
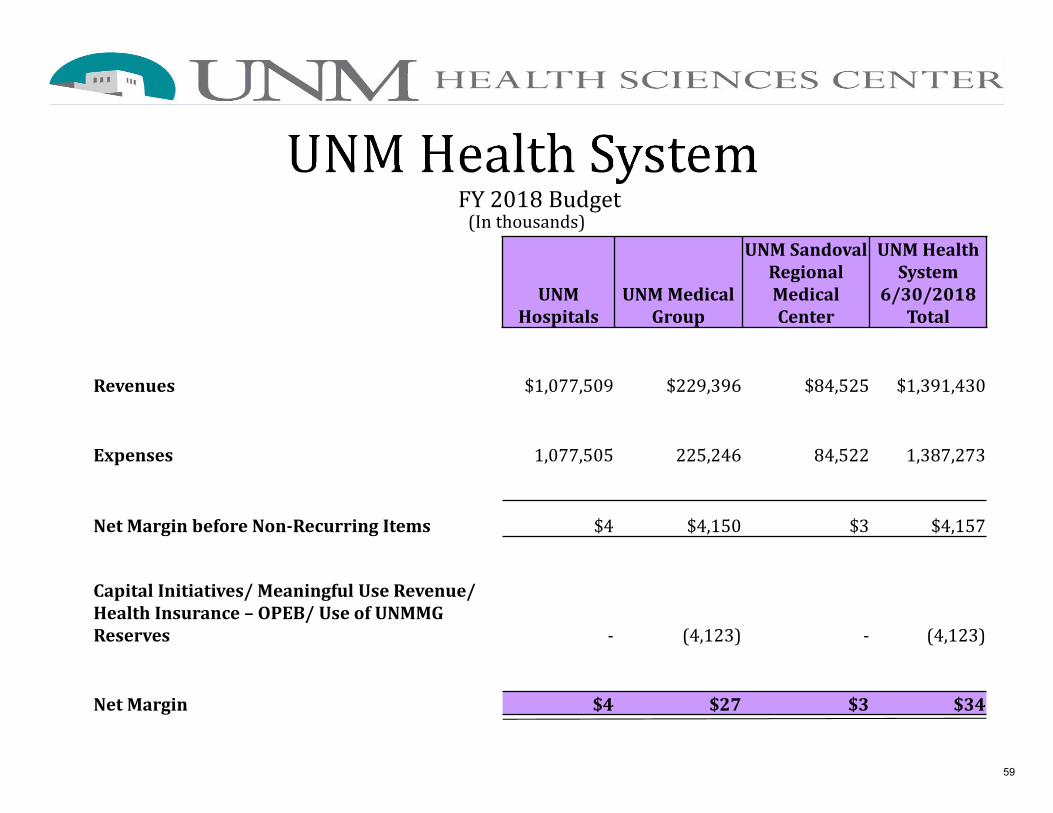
5
UNMHealthSystemFY2018Budget(Inthousands)
UNMHospitals
UNMMedicalGroup
UNMSandovalRegionalMedicalCenter
UNMHealthSystem
6/30/2018Total
Revenues $1,077,509 $229,396 $84,525 $1,391,430
Expenses 1,077,505 225,246 84,522 1,387,273
NetMarginbeforeNon‐RecurringItems $4 $4,150 $3 $4,157
CapitalInitiatives/ Meaningful UseRevenue/HealthInsurance– OPEB/UseofUNMMGReserves ‐ (4,123) ‐ (4,123)
NetMargin $4 $27 $3 $34
59

BRANCH CAMPUSES

THE UNIVERSITY OF NEW MEXICO
BRANCH CAMPUSES
FY 2017-2018 OPERATING BUDGET PLANS
GENERAL OVERVIEW Resident tuition increases are 3.80% at Los Alamos, and 4.20% at Valencia. Gallup and Taos Resident tuition remain unchanged. Fees for Gallup, Los Alamos, Taos, and Valencia remain unchanged. SUMMARY OF LEGISLATIVE GENERAL FUND APPROPRIATIONS % Change Original Revised from FY 17 FY 2016-17 FY 2016-17 FY 2017-18 Original Gallup Branch Instruction and General $9,302,800 $8,841,700 $8,599,200 - 7.6% Subtotal-Gallup $9,302,800 $8,841,700 $8,599,200 - 7.6% Los Alamos Branch Instruction and General $1,840,700 $1,749,300 $1,710,400 - 7.1% Subtotal-Los Alamos $1,840,700 $1,749,300 $1,710,400 - 7.1% Taos Branch Instruction and General $3,707,900 $3,522,500 $3,497,900 - 5.7% Subtotal-Taos $3,707,900 $3,522,500 $3,497,900 - 5.7% Valencia Branch Instruction and General $5,626,200 $5,345,000 $5,291,000 - 6.0% Subtotal-Valencia $5,626,200 $5,345,000 $5,291,000 - 6.0% TOTALS $20,477,600 $19,458,500 $19,098,500 - 6.7%
61

Branches
Current Fund Revenues
2016-17 2017-18
Unrestricted Restricted Unrestricted Restricted
Instruction and GeneralTuition 7,154,837 0 7,216,586 0
Student Fees 925,920 0 934,931 0
State Government Appropriations -Operating 20,477,600 0 19,098,500 0
State Government Contracts/Grants 2,500 401,294 5,000 421,254
Federal Government Appropriations 0 0 0 0
Federal Government Contracts/Grants 0 2,594,052 0 2,149,228
Local Government Appropriations 7,801,820 0 8,516,542 0
Indirect Cost Recovery (F&A) 238,009 0 311,175 0
Land, Bldg & Equip Rent 40,000 0 40,000 0
Sales & Services 105,000 0 100,830 0
Other 178,040 0 8,225 0
Total I & G Revenue 36,923,726 2,995,346 36,231,789 2,570,482
Transfers (From) To I&GBuilding Renewal (582,711) 0 (635,619) 0
Public Service (40,000) 0 0 0
Student Aid (364,010) 0 (364,010) 0
Auxiliaries 52,500 0 40,000 0
Plant Fund Cap Outlay/Debt Svc (1,404,830) 0 (151,922) 0
Main Campus I&G 0 0 0 0
Total I&G Transfers (2,339,051) 0 (1,111,551) 0
Net Balance 3,588,018 0 2,482,749 0
NET I & G Revenue 38,172,693 2,995,346 37,602,987 2,570,482
Student Social/CulturalMandatory Student Fees 230,000 0 232,500 0
Sales & Services 1,670 0 3,670 0
Other 6,730 0 3,730 0
Transfers (40,000) 0 (40,000) 0
Net Balance 300 0 300 0
Total Student Social/Cultural 198,700 0 200,200 0
ResearchFederal Government Contracts/Grants 0 306,128 0 1,502,272
Other 0 0 0 0
Total Research 0 306,128 0 1,502,272
Public ServiceMandatory Student Fees 10,000 0 10,000 0
State Government Contracts/Grants 0 1,889,222 0 1,632,561
Federal Government Appropriations 0 0 0 0
Federal Government Contracts/Grants 0 3,457,153 0 3,787,047
Private Contracts/Grants 26,400 0 88,085 0
Endowments 52,635 0 0 0
Sales & Services 241,300 0 241,300 0
Other 145,798 0 145,798 0
Transfers 40,000 0 0 0
Net Balance 124,067 0 96,547 0
Total Public Service 640,200 5,346,375 581,730 5,419,608
62
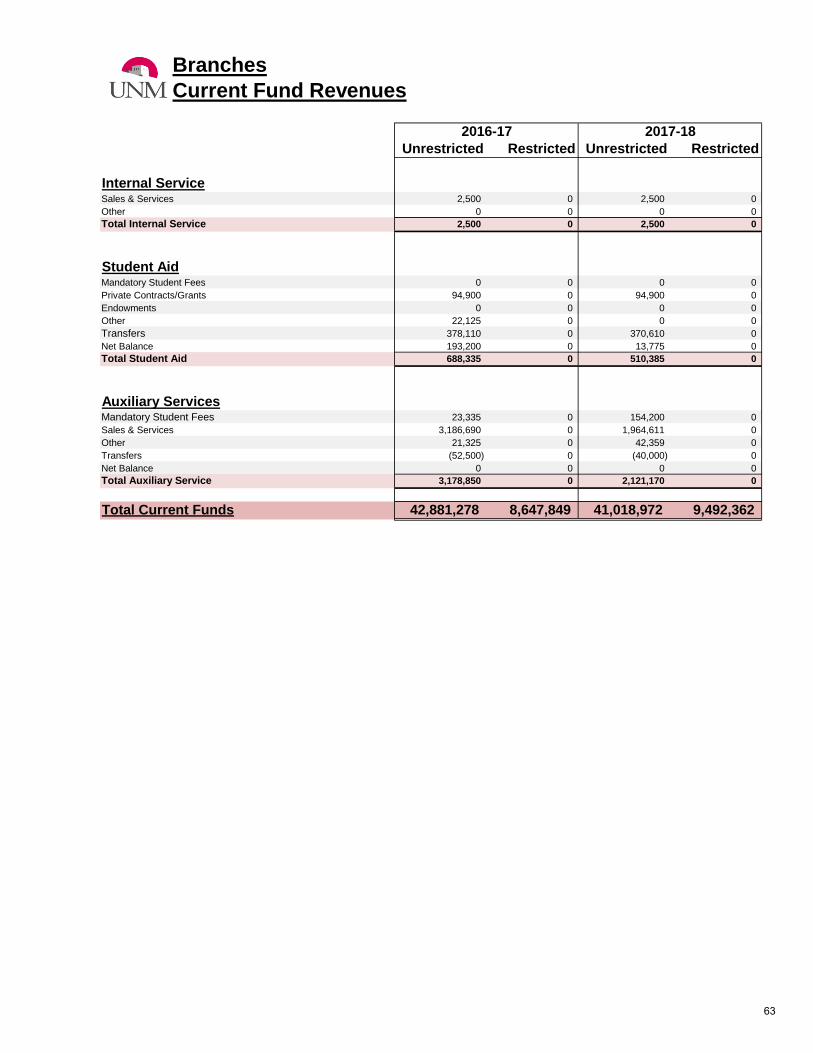
Branches
Current Fund Revenues
2016-17 2017-18
Unrestricted Restricted Unrestricted Restricted
Internal ServiceSales & Services 2,500 0 2,500 0
Other 0 0 0 0
Total Internal Service 2,500 0 2,500 0
Student AidMandatory Student Fees 0 0 0 0
Private Contracts/Grants 94,900 0 94,900 0
Endowments 0 0 0 0
Other 22,125 0 0 0
Transfers 378,110 0 370,610 0
Net Balance 193,200 0 13,775 0
Total Student Aid 688,335 0 510,385 0
Auxiliary ServicesMandatory Student Fees 23,335 0 154,200 0
Sales & Services 3,186,690 0 1,964,611 0
Other 21,325 0 42,359 0
Transfers (52,500) 0 (40,000) 0
Net Balance 0 0 0 0
Total Auxiliary Service 3,178,850 0 2,121,170 0
Total Current Funds 42,881,278 8,647,849 41,018,972 9,492,362
63

State Approp - Operating19,098,500
37.81%
Grants/Contracts9,497,362 18.80%
Local Govt Approp8,516,542 16.86%
Tuition & Fees8,548,217 16.92%
Sales & Services2,312,911
4.58%
Private214,085 0.42%
Other(269,654)-0.53%
Use of Balance2,593,371
5.13%
UNM Branches Revenues2017-18 Budget
Total Revenues $50,511,334
A Decrease of 2.0% over 2016-17
64

Branches
Current Fund Expenditures
2016-17 2017-18
Unrestricted Restricted Unrestricted Restricted
Instruction and General
Instruction 16,921,341 2,686,706 16,802,408 2,261,842
0 0 0 0
Academic Support 4,288,186 72,342 4,057,437 72,342
0 0 0 0
Student Services 3,705,858 75,070 3,809,580 75,070
0 0 0 0
Institutional Support 8,150,653 126,263 8,162,680 126,263
0 0 0 0
Operations & Maintenance 5,040,655 34,965 4,770,882 34,965
Total 38,106,693 2,995,346 37,602,987 2,570,482
Activities other than I & G
Student Social & Cultural 198,700 0 200,200 0
Research 0 306,128 0 1,502,272
Public Service 706,200 5,346,375 581,730 5,419,608
Internal Service 2,500 0 2,500 0
Student Aid 688,335 0 510,385 0
Auxiliary Services 3,178,850 0 2,121,170 0
Total 4,774,585 5,652,503 3,415,985 6,921,880
Total Current Fund Expense 42,881,278 8,647,849 41,018,972 9,492,362
65

Instruction & General40,173,469
79.53%
Student Social200,200 0.40%
Research1,502,272
2.97%
Public Service6,001,338 11.88%
Internal Service/Auxiliaries2,123,670
4.20%
Student Aid510,385 1.01%
UNM Branches Expenditures
A Decrease of 2.0% over 2016-17
Total Expenditures $50,511,334
2017-18 Budget
66

Gallup Campus
Current Fund Revenues
2016-17 2017-18
Unrestricted Restricted Unrestricted Restricted
Instruction and GeneralTuition 3,064,673 0 3,208,743 0
Student Fees 420,350 0 424,350 0
State Government Appropriations -Operating 9,302,800 0 8,599,200 0
State Government Contracts/Grants 0 285,000 0 285,000
Federal Government Contracts/Grants 0 657,000 0 657,000
Local Government Contracts/Grants 0 0 0 0
Local Government Appropriations 2,575,000 0 2,480,000 0
Indirect Cost Recovery (F&A) 42,500 0 57,500 0
Land, Bldg & Equip Rent 40,000 0 40,000 0
Sales & Services 105,000 0 59,540 0
Other 60,000 0 70,000 0
Total I & G Revenue 15,610,323 942,000 14,939,333 942,000
Transfers (From) To I&GBuilding Renewal (502,683) 0 (502,683) 0
Public Service (40,000) 0 0 0
Student Aid (100,000) 0 (100,000) 0
Auxiliaries 0 40,000 0
Plant Fund Cap Outlay/Debt Svc (1,260,652) 0 (60,652) 0
Total I&G Transfers (1,903,335) 0 (623,335) 0
Net Balance 2,514,333 0 1,301,335 0
NET I & G Revenue 16,221,321 942,000 15,617,333 942,000
Student Social/CulturalMandatory Student Fees 85,000 0 85,000 0
Sales & Services 0 2,000 0
Other 3,000 0 0 0
Total Student Social/Cultural 88,000 0 87,000 0
ResearchFederal Government Contracts/Grants 0 0 0 2,272
Other 0 0 0 0
Total Research 0 0 0 2,272
Public ServiceState Government Contracts/Grants 0 180,000 0 180,000
Federal Government Contracts/Grants 0 689,209 0 689,209
Private Contracts/Grants 15,100 0 13,250 0
Transfers 40,000 0 0 0
Net Balance 105,300 0 0 0
Total Public Service 160,400 869,209 13,250 869,209
Internal ServiceSales & Services 0 0 0 0
Other 0 0 0 0
Total Internal Service 0 0 0 0
Student AidPrivate Contracts/Grants 0 0 0 0
Transfers 100,000 0 100,000 0
Net Balance 142,500 0 0 0
Total Student Aid 242,500 0 100,000 0
Auxiliary ServicesMandatory Student Fees 0 0 129,000 0
Sales & Services 1,797,656 0 1,321,860 0
Other 0 0 650 0
Transfers 0 0 (40,000) 0
Net Balance 0 0 0 0
Total Auxiliary Service 1,797,656 0 1,411,510 0
Total Current Funds 18,509,877 1,811,209 17,229,093 1,813,48167

State Approp - Operating8,599,200 45.16%
Grants/Contracts1,813,481
9.52%
Local Govt Approp2,480,000 13.02%
Tuition & Fees3,847,093 20.20%
Sales & Services1,383,400
7.26%
Private13,250 0.07%
Other(395,185)-2.08%
Use of Balance1,301,335
6.85%
UNM Gallup Revenues
2017-18 Budget
Total Revenues $19,042,574
A Decrease of 6.3% over 2016-17
68

Gallup Campus
Current Fund Expenditures
2016-17 2017-18
Unrestricted Restricted Unrestricted Restricted
Instruction and General
Instruction 7,688,830 942,000 7,611,219 942,000
Academic Support 1,886,395 0 1,492,171 0
Student Services 1,302,399 0 1,340,718 0
Institutional Support 3,105,947 0 3,052,682 0
Operations & Maintenance 2,237,750 0 2,120,543 0
Total 16,221,321 942,000 15,617,333 942,000
Activities other than I & G
Student Social & Cultural 88,000 0 87,000 0
Research 0 0 0 2,272
Public Service 160,400 869,209 13,250 869,209
Internal Service 0 0 0 0
Student Aid 242,500 0 100,000 0
Auxiliary Services 1,797,656 0 1,411,510 0
Total 2,288,556 869,209 1,611,760 871,481
Total Current Fund Expense 18,509,877 1,811,209 17,229,093 1,813,481
69

Instruction & General16,559,333
86.96%
Student Social87,000 0.46%
Research2,272
0.01%
Public Service882,459 4.63%
Internal Service/Auxiliaries1,411,510
7.41%
Student Aid100,000 0.53%
UNM Gallup Expenditures2017-18 Budget
A Decrease of 6.3% over 2016-17
Total Expenditures $19,042,574
70
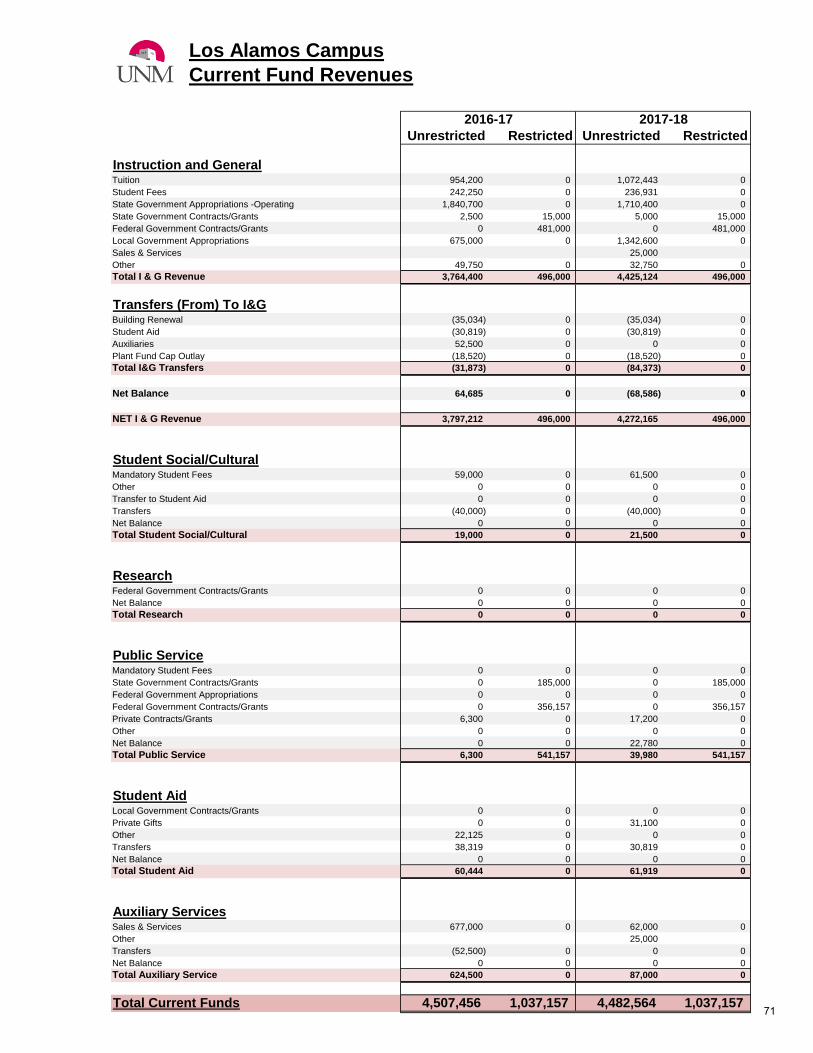
Los Alamos Campus
Current Fund Revenues
2016-17 2017-18
Unrestricted Restricted Unrestricted Restricted
Instruction and GeneralTuition 954,200 0 1,072,443 0
Student Fees 242,250 0 236,931 0
State Government Appropriations -Operating 1,840,700 0 1,710,400 0
State Government Contracts/Grants 2,500 15,000 5,000 15,000
Federal Government Contracts/Grants 0 481,000 0 481,000
Local Government Appropriations 675,000 0 1,342,600 0
Sales & Services 25,000
Other 49,750 0 32,750 0
Total I & G Revenue 3,764,400 496,000 4,425,124 496,000
Transfers (From) To I&GBuilding Renewal (35,034) 0 (35,034) 0
Student Aid (30,819) 0 (30,819) 0
Auxiliaries 52,500 0 0 0
Plant Fund Cap Outlay (18,520) 0 (18,520) 0
Total I&G Transfers (31,873) 0 (84,373) 0
Net Balance 64,685 0 (68,586) 0
NET I & G Revenue 3,797,212 496,000 4,272,165 496,000
Student Social/CulturalMandatory Student Fees 59,000 0 61,500 0
Other 0 0 0 0
Transfer to Student Aid 0 0 0 0
Transfers (40,000) 0 (40,000) 0
Net Balance 0 0 0 0
Total Student Social/Cultural 19,000 0 21,500 0
ResearchFederal Government Contracts/Grants 0 0 0 0
Net Balance 0 0 0 0
Total Research 0 0 0 0
Public ServiceMandatory Student Fees 0 0 0 0
State Government Contracts/Grants 0 185,000 0 185,000
Federal Government Appropriations 0 0 0 0
Federal Government Contracts/Grants 0 356,157 0 356,157
Private Contracts/Grants 6,300 0 17,200 0
Other 0 0 0 0
Net Balance 0 0 22,780 0
Total Public Service 6,300 541,157 39,980 541,157
Student AidLocal Government Contracts/Grants 0 0 0 0
Private Gifts 0 0 31,100 0
Other 22,125 0 0 0
Transfers 38,319 0 30,819 0
Net Balance 0 0 0 0
Total Student Aid 60,444 0 61,919 0
Auxiliary ServicesSales & Services 677,000 0 62,000 0
Other 25,000
Transfers (52,500) 0 0 0
Net Balance 0 0 0 0
Total Auxiliary Service 624,500 0 87,000 0
Total Current Funds 4,507,456 1,037,157 4,482,564 1,037,15771

State Approp - Operating1,710,400 30.99%
Grants/Contracts1,042,157 18.88%
Local Govt Approp1,342,600 24.32%
Tuition & Fees1,370,874 24.84%
Sales & Services87,000 1.58%
Private48,300 0.88%
Other(35,804)-0.65%
Use of Balance(45,806)-0.83%
UNM Los Alamos Revenues2017-18 Budget
Total Revenues $5,519,721
A Decrease of 0.4% over 2016-17
72

Los Alamos Campus
Current Fund Expenditures
2016-17 2017-18
Unrestricted Restricted Unrestricted Restricted
Instruction and General
Instruction 1,519,466 459,500 1,709,849 459,500
Academic Support 607,686 10,500 782,615 10,500
Student Services 381,301 12,500 472,228 12,500
Institutional Support 843,981 13,500 930,645 13,500
Operations & Maintenance 378,778 0 376,828 0
Total 3,731,212 496,000 4,272,165 496,000
Activities other than I & G
Student Social & Cultural 19,000 0 21,500 0
Research 0 0 0 0
Public Service 72,300 541,157 39,980 541,157
Internal Service 0 0 0 0
Student Aid 60,444 0 61,919 0
Auxiliary Services 624,500 0 87,000 0
Total 776,244 541,157 210,399 541,157
Total Current Fund Expense 4,507,456 1,037,157 4,482,564 1,037,157
73

Instruction & General4,768,165 86.38%
Student Social21,500 0.39%
Public Service581,137 10.53%
Internal Service/Auxiliaries87,000 1.58%
Student Aid61,919 1.12%
UNM Los Alamos Expenditures2017-18 Budget
A Decrease of 0.4% over 2016-17
Total Expenditures $5,519,721
74

Valencia Campus
Current Fund Revenues
2016-17 2017-18
Unrestricted Restricted Unrestricted Restricted
Instruction and GeneralTuition 1,946,784 0 1,824,035 0
Student Fees 96,225 0 96,555 0
State Government Appropriations -Operating 5,626,200 0 5,291,000 0
State Government Contracts/Grants 0 101,294 0 101,294
Federal Government Contracts/Grants 0 597,804 0 172,940
Local Government Appropriations 2,658,490 0 2,736,100 0
Indirect Cost Recovery (F&A) 65,509 0 168,675 0
Sales & Services 6,290 0
Other 38,290 0 32,000 0
Total I & G Revenue 10,431,498 699,098 10,154,655 274,234
Transfers (From) To I&GBuilding Renewal 0 0 (52,908) 0
Student Aid (154,046) 0 (154,046) 0
Plant Fund Cap Outlay/Debt Svc (95,521) 0 (42,613) 0
Main 0 0 0 0
Total I&G Transfers (249,567) 0 (249,567) 0
Net Balance 9,000 0 0 0
NET I & G Revenue 10,190,931 699,098 9,905,088 274,234
Student Social/CulturalMandatory Student Fees 26,000 0 26,000 0
Sales & Services 1,670 0 1,670 0
Other 3,730 0 3,730 0
Net Balance 300 0 300 0
Total Student Social/Cultural 31,700 0 31,700 0
ResearchFederal Government Contracts/Grants 0 0 0 1,425,000
Total Research 0 0 0 1,425,000
Public ServiceState Government Contracts/Grants 0 677,961 0 421,300
Federal Government Contracts/Grants 0 1,025,206 0 1,355,100
Private Contracts/Grants 0 0 52,635 0
Endowments 52,635 0 0 0
Sales & Services 6,300 0 6,300 0
Other 145,798 0 145,798 0
Transfers 0 0 0 0
Net Balance 18,767 0 18,767 0
Total Public Service 223,500 1,703,167 223,500 1,776,400
Internal ServiceSales & Services 2,500 0 2,500 0
Net Balance
Total Internal Service 2,500 0 2,500 0
Student Aid
Mandatory Student Fees 0 0 0 0
Private Contracts/Grants 94,900 0 94,900 0
Endowments 0 0 0 0
Transfers 155,646 0 155,646 0
Net Balance 50,700 0 13,775 0
Total Student Aid 301,246 0 264,321 0
Auxiliary ServicesMandatory Student Fees 23,335 0 25,200 0
Sales & Services 647,034 0 540,751 0
Other 21,325 0 16,709 0
Net Balance 0 0 0 0
Total Auxiliary Service 691,694 0 582,660 0
Total Current Funds 11,441,571 2,402,265 11,009,769 3,475,634
75

State Approp - Operating5,291,000 36.53%
Grants/Contracts3,475,634 23.99%
Local Govt Approp2,736,100 18.89%
Tuition & Fees1,971,790 13.61%
Sales & Services557,511 3.85%
Private147,535 1.02%
Other272,991 1.88%
Use of Balance32,842 0.23%
UNM Valencia Revenues2017-18 Budget
Total Revenues $14,485,403
An Increase of 4.6% over 2016-17
76

Valencia Campus
Current Fund Expenditures
2016-17 2017-18
Unrestricted Restricted Unrestricted Restricted
Instruction and General
Instruction 4,491,681 473,648 4,356,059 48,784
Academic Support 1,259,822 42,830 1,249,571 42,830
Student Services 1,274,420 49,030 1,202,662 49,030
Institutional Support 1,949,805 98,625 1,886,676 98,625
Operations & Maintenance 1,215,203 34,965 1,210,120 34,965
Total 10,190,931 699,098 9,905,088 274,234
Activities other than I & G
Student Social & Cultural 31,700 0 31,700 0
Research 0 0 0 1,425,000
Public Service 223,500 1,703,167 223,500 1,776,400
Internal Service 2,500 0 2,500 0
Student Aid 301,246 0 264,321 0
Auxiliary Services 691,694 0 582,660 0
Total 1,250,640 1,703,167 1,104,681 3,201,400
Total Current Fund Expense 11,441,571 2,402,265 11,009,769 3,475,634
77

Instruction & General10,179,322
70.27%
Student Social31,700 0.22%
Research 1,425,000
9.84%
Public Service1,999,900 13.81%
Internal Service/Auxiliaries585,160 4.04%
Student Aid264,321 1.82%
UNM Valencia Expenditures2017-18 Budget
An Increase of 4.6% over 2016-17
Total Expenditures $14,485,403
78

Taos Campus
Current Fund Revenues
2016-17 2017-18
Unrestricted Restricted Unrestricted Restricted
Instruction and GeneralTuition 1,189,180 0 1,111,365 0
Student Fees 167,095 0 177,095 0
State Government Appropriations -Operating 3,707,900 0 3,497,900 0
State Government Contracts/Grants 0 0 0 19,960
Federal Government Appropriations 0 0 0 0
Federal Government Contracts/Grants 0 858,248 0 838,288
Local Government Contracts/Grants 0 0 0 0
Local Government Appropriations 1,893,330 0 1,957,842 0
Indirect Cost Recovery (F&A) 130,000 0 85,000 0
Sales & Services 0 0 10,000 0
Other 30,000 0 (126,525) 0
Total I & G Revenue 7,117,505 858,248 6,712,677 858,248
Transfers (From) To I&GBuilding Renewal (44,994) 0 (44,994) 0
Student Aid (79,145) 0 (79,145) 0
Plant Fund Cap Outlay/Debt Svc (30,137) 0 (30,137) 0
Main Campus I&G 0 0 0 0
Total I&G Transfers (154,276) 0 (154,276) 0
Net Balance 1,000,000 0 1,250,000 0
NET I & G Revenue 7,963,229 858,248 7,808,401 858,248
Student Social/CulturalMandatory Student Fees 60,000 0 60,000 0
Other 0 0 0 0
Total Student Social/Cultural 60,000 0 60,000 0
ResearchFederal Government Contracts/Grants 0 306,128 0 75,000
Net Balance 0 0 0 0
Total Research 0 306,128 0 75,000
Public ServiceMandatory Student Fees 10,000 0 10,000 0
State Government Contracts/Grants 0 846,261 0 846,261
Federal Government Contracts/Grants 0 1,386,581 0 1,386,581
Local Government Contracts/Grants 0 0 0 0
Private Contracts/Grants 5,000 0 5,000 0
Sales & Services 235,000 0 235,000 0
Net Balance 0 0 55,000 0
Total Public Service 250,000 2,232,842 305,000 2,232,842
Student AidTransfers 84,145 0 84,145 0
Net Balance 0 0 0 0
Total Student Aid 84,145 0 84,145 0
Auxiliary ServicesSales & Services 65,000 0 40,000 0
Net Balance 0 0 0 0
Total Auxiliary Service 65,000 0 40,000 0
Total Current Funds 8,422,374 3,397,218 8,297,546 3,166,090
79

State Approp - Operating3,497,900 30.51%
Grants/Contracts3,166,090 27.62%
Local Govt Approp1,957,842 17.08%
Tuition & Fees1,358,460 11.85%
Sales & Services285,000 2.49%
Private5,000
0.04%
Other(111,656)-0.97%
Use of Balance1,305,000 11.38%
UNM Taos Revenues
2017-18 Budget
Total Revenues $11,463,636
A Decrease of 3.0% over 2016-17
80

Taos Campus
Current Fund Expenditures
2016-17 2017-18
Unrestricted Restricted Unrestricted Restricted
Instruction and General
Instruction 3,221,364 811,558 3,125,281 811,558
Academic Support 534,283 19,012 533,080 19,012
Student Services 747,738 13,540 793,972 13,540
Institutional Support 2,250,920 14,138 2,292,677 14,138
Operations & Maintenance 1,208,924 0 1,063,391 0
Total 7,963,229 858,248 7,808,401 858,248
Activities other than I & G
Student Social & Cultural 60,000 0 60,000 0
Research 0 306,128 0 75,000
Public Service 250,000 2,232,842 305,000 2,232,842
Internal Service 0 0 0 0
Student Aid 84,145 0 84,145 0
Auxiliary Services 65,000 0 40,000 0
Total 459,145 2,538,970 489,145 2,307,842
Total Current Fund Expense 8,422,374 3,397,218 8,297,546 3,166,090
81
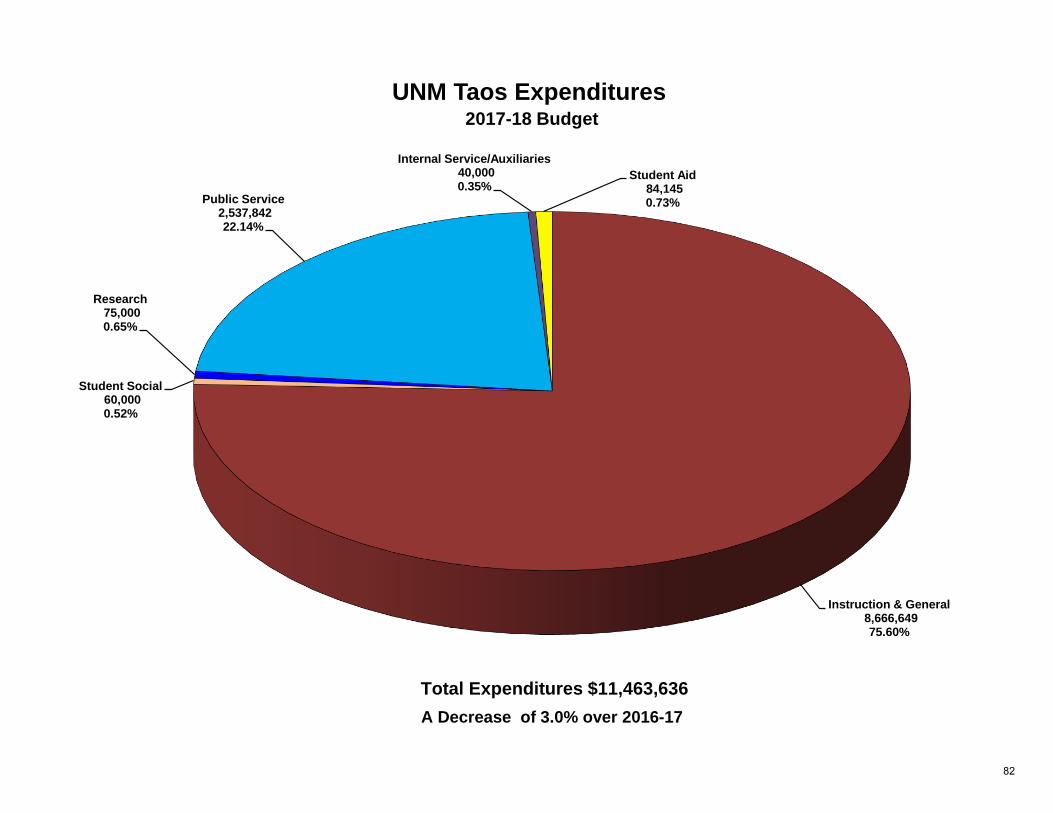
Instruction & General8,666,649 75.60%
Student Social60,000 0.52%
Research75,000 0.65%
Public Service2,537,842 22.14%
Internal Service/Auxiliaries40,000 0.35%
Student Aid84,145 0.73%
UNM Taos Expenditures2017-18 Budget
A Decrease of 3.0% over 2016-17
Total Expenditures $11,463,636
82

CAPITAL BUDGET

FY 2017-2018
CAPITAL FUND BUDGET PLANS
THE UNIVERSITY OF NEW MEXICO
Maintenance and upkeep of the physical facilities of the University of New Mexico campuses are important investments which support the quality of programs and services offered by the institution. Listed on the following pages are the capital budget allocations to capital improvement projects and other activities for FY 2017-2018 that are supported from various sources of funds. The capital budget plan is divided into five sections:
I. Building Renewal & Replacement (BR&R): Capital improvement projects for academic and administrative facilities funded from the Instruction and General (I&G) funding formula allocation.
II. Equipment Renewal & Replacement (ER&R): Funds used to maintain
and/or replace equipment for academic and administrative units generated from the I&G funding formula allocation.
III. Discretionary Capital Improvements: Projects supported from
investment income that are not typically eligible for I&G capital funds.
IV. Projects Supported from State Funds: The 2017 Legislature did not approve funding for capital projects from Severance Tax Bonds for the University.
V. Branch Campus Renewal & Replacement Budget and Minor Capital Outlay Plans: Each campus allocates funds from its I&G appropriation for repair and renewal of instructional facilities and to maintain and/or replace equipment for academic and administrative units.
I. BUILDING RENEWAL AND REPLACEMENT (BR&R) PROJECTS
For FY 2017-2018, a total of $9,767,405 will be transferred from Main Campus I&G to Minor Capital to fund renewal and replacement projects. The base amount transferred was determined by the funding formula.
84

The projects listed below address: (1) facility maintenance deficiencies; (2) improvements in spaces dedicated to academic and administrative programs; (3) improvements in the safety, security, and appearance of the campus environment; and (4) preventive maintenance programs for facilities and infrastructure support systems. The projects and allocations are as follows: Project Allocations: Physical Plant Department:
ADA Accessibility $ 50,000 Building Renewal (Exterior and Interior) 955,300 Electrical Lighting 50,000 ESCO Projects Contingency 410,900 HVAC Renewal 699,100 Life Safety Compliance 127,700 Mechanical Renewal 367,000 Roof Renewal 1,174,000 Street and Sidewalk Renewal 1,718,000 Utility Distribution Renewal 110,000
Academic Affairs:
Classroom Renewal Projects $ 300,000 ASM Elevator 150,000 College of Fine Arts Security 150,000 Johnson Center - Code Compliance 88,800 Provost’s Special Initiative Fund 50,000 Space Consolidation 200,000 Johnson Center - Renewal 25,000
Information Technology:
Fire Alarm Renewal $ 200,000 Telecommunications Infrastructure & Renewal 188,000
Office of Real Estate: Science and Tech Park (STP) Renewal $ 100,000
Safety and Risk Services: Asbestos Surveys and Abatement $ 25,000
Fire Extinguisher Replacement and Renewal 35,000 Fire Sprinklers Renewal and Alarm Inspection 470,000 Indoor Air Quality Sampling 55,000
Administration:
Debt Service - Fine Arts Center $ 638,600 Emergency Reserve Fund 1,430,005
TOTAL $ 9,767,405
85

II. EQUIPMENT RENEWAL & REPLACEMENT (ER&R) FUNDS
For FY 2017-2018, a total of $2,075,000(1) will be available for the replacement and/or maintenance of equipment in academic and administrative units. Campus Wireless Connectivity $ 500,000 Computer Lab Equipment 100,000 Johnson Center Equipment 25,000 Library Books/Periodical and Equipment 250,000 Retained in I&G for Equipment 1,200,000
TOTAL $ 2,075,000 (1) Amount includes use of prior year reserves
III. DISCRETIONARY CAPITAL IMPROVEMENT FUNDS
In addition to the I&G Renewal and Replacement formula funds, and those funds appropriated by the Legislature for specific capital projects, the University has committed income earned on investment of capital fund balances for minor capital renewal projects not eligible for BR&R funding. The projected income from these funds and allocations is as follows: A. Source of Funds for FY 2017-2018: Capital Investment Income $ 300,000 TOTAL $ 300,000
B. Use of Funds for FY 2017-2018: DH Lawrence Ranch $ 55,000 Harwood Museum Renewal 75,000 Hodgin Hall and Alumni Chapel Renewal 10,000 Emergency Reserve Fund 160,000 TOTAL $ 300,000
IV. PROJECTS SUPPORTED FROM STATE FUNDS Severance Tax Bonds (STB) Projects: No Funds were appropriated to UNM
86
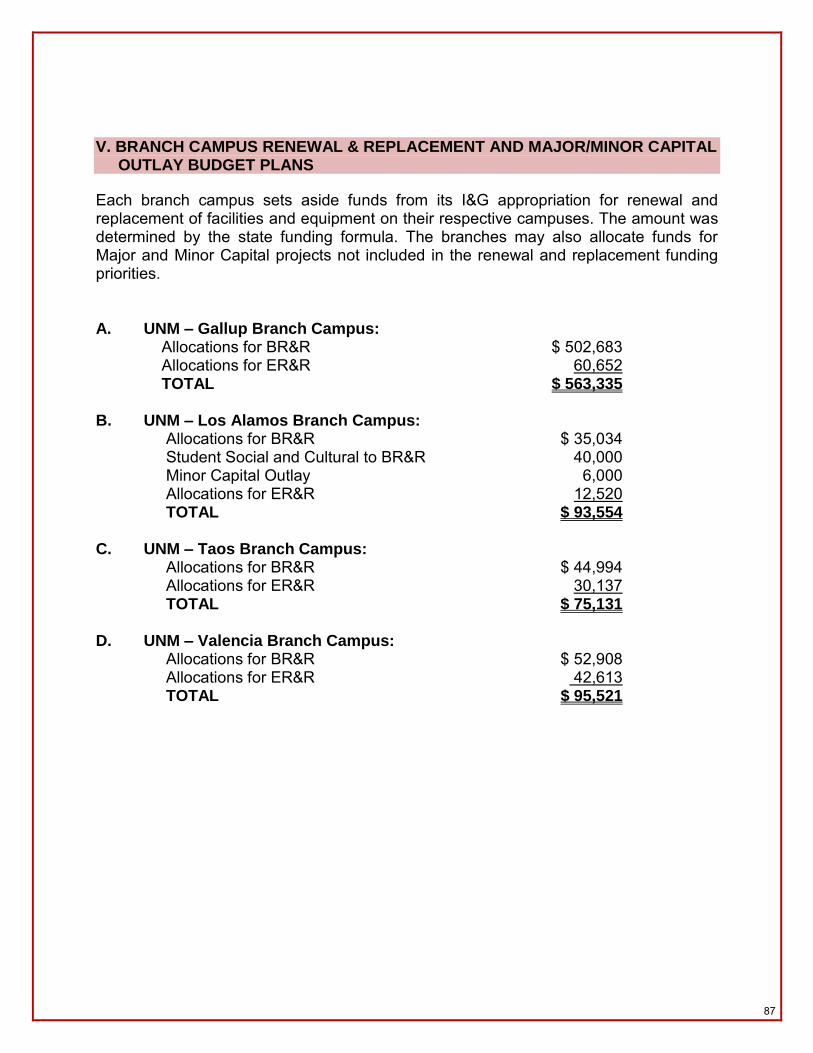
V. BRANCH CAMPUS RENEWAL & REPLACEMENT AND MAJOR/MINOR CAPITAL OUTLAY BUDGET PLANS Each branch campus sets aside funds from its I&G appropriation for renewal and replacement of facilities and equipment on their respective campuses. The amount was determined by the state funding formula. The branches may also allocate funds for Major and Minor Capital projects not included in the renewal and replacement funding priorities.
A. UNM – Gallup Branch Campus:
Allocations for BR&R $ 502,683 Allocations for ER&R 60,652 TOTAL $ 563,335
B. UNM – Los Alamos Branch Campus: Allocations for BR&R $ 35,034 Student Social and Cultural to BR&R 40,000 Minor Capital Outlay 6,000 Allocations for ER&R 12,520 TOTAL $ 93,554
C. UNM – Taos Branch Campus: Allocations for BR&R $ 44,994 Allocations for ER&R 30,137 TOTAL $ 75,131
D. UNM – Valencia Branch Campus: Allocations for BR&R $ 52,908 Allocations for ER&R 42,613 TOTAL $ 95,521
87

UNM Plant Funds
Revenues and Transfers
2016-17 2017-18
Original Budget Original Budget
Major Capital OutlayFederal Government Contracts/GrantsState Bonds 12,409,429 21,207,988Institutional and Local Bonds 0Interest on Balances & Other Revenue 50,000 635,000Transfers 10,573 4,150,000Net Balance 28,341,672 44,422,872Total Major Capital Outlay 40,811,674 70,415,860
Minor Capital Outlay - RestrictedState Government Appropriations -CapitalState Bonds 950,000 950,000Institutional Bonds 0 0Transfer 100,000 100,000Net Balance 201,898 974,738Total Minor Restricted 1,251,898 2,024,738
Minor Capital Outlay - UnrestrictedOther 14,600,000 14,600,000Transfer from Main I & G 3,000,000 1,131,666Transfer from Student Social Cultural 75,000 0Transfer from Research 1,500,000 0Transfer from HSC & Branches 735,523 663,066Transfer from Auxiliaries 1,000,000 1,335,514Transfer from Internal Services 9,674,536 10,143,630Transfer from Public Service 1,300,000 0Transfer from Athletics 153,000 0Transfer Major Capital Outlay (1,000,000) (1,000,000)Transfer Debt Service (6,266,240) (6,331,926)Transfer Renewal & Replacement 500,000 500,000Transfer Restricted Minor (100,000) (100,000)Net Balance 828,181 2,558,050Total Minor Unrestricted 26,000,000 23,500,000
Debt ServiceTuition and Mandatory Fees 17,041,497 19,631,497Lease Income 1,946,005 1,686,483Other 330,000 230,000Transfer from I & G 228,310 228,310Transfer from Research 289,279 289,279Transfer from Public Service 2,429,458 2,445,757Transfer from Internal Service 1,365,516 1,365,327Transfer from Auxiliary Services 4,304,311 4,237,727Transfer from Athletics 55,160 55,731Transfer from Capital Outlay 6,266,240 6,331,926Transfer from Renewal & Replacements 538,600 538,600Transfer from HSC 2,405,196 2,397,745Net Balance (1,314,695) (1,381,779)Total Debt Service 35,884,877 38,056,603
88

UNM Plant Funds
Revenues and Transfers
Continued
2016-17 2017-18
Original Budget Original Budget
Renewal & ReplacementOther 300,000 250,000Transfer from I & G Main Campus 9,767,405 9,767,405Transfer to Debt Service (538,600) (538,600)Transfer from Branches I & G 635,619 635,619Transfer from Student Social & Cultural (Los Alamos) 40,000 40,000Transfer to Minor Capital Outlay (1,150,000) (1,150,000)Net Balance 1,945,576 995,576Total Renewal & Replacement 11,000,000 10,000,000
GRAND TOTAL REVENUES/TRANSFERS 114,948,449 143,997,201
89

State Bonds22,157,988
15.39%
Tuition & Fees19,631,497
13.63%
Other17,401,483
12.08%
Transfers37,236,776
25.86%
Use of Balance47,569,457
33.03%
UNM Plant Funds Revenues and Transfers2017-2018 Budget
Total Revenues $143,997,201
An Increase of 25.3% over 2016-17
Minor Restricted
90

UNM Plant Funds
Expenditures
2016-17 2017-18
Original Budget Original Budget
Major Capital Outlay4th Street Clinic 25,000 0Anderson School of Management 8,305,782 8,714,463Anthropology - HVAC Replacement 596,913 0Cancer Center - Buildout 5,369,706 0Chemistry Renovation Phase I 13,522 0Ceria Cryogenics 0 49,000Domenici - Health Education - Phase III 5,000,000 12,811,269Eubank- Clinic 2,807,470 0Exchange Project 66,751 0Farris Engineering Renovation 9,675,422 11,199,707Gallup - Gurley Hall Renovation 1,200,000 0Gallup - Lions Hall Renovation 0 900,000Gallup - Physical Plant Building 0 500,000Gallup- Water ands Sewer Upgrades 294,563 0Gas Compresor 0 586,292Gas Turbine Replacement 0 1,800,000Johnson Center Renovation 1,000,000 11,959,638La Posada Renovation 0 2,650,000Los Alamos- EMS Classroom 325,000 0Neurosurgery Expansion 0 1,289,600Physics and Astronomy, Interdisciplinary Science 1,000,000 7,500,000Smith Plaza Renovation 1,750,000 2,665,052Storm Drainage 0 398,890Various Construction Projects/Improvements 1,476,876 4,139,770Valencia- Air Handler replacement 0 1,060,000Valencia- Electrical Mechanical Improvements 0 325,000Valencia- Fire Alrm Notification 0 30,000Valencia- Infrastructure Upgrades 304,543 1,377,882Taos - Health Carrer Training Center 650,126 0Zollinger Library Renovation 950,000 459,297Total Major Capital Outlay 40,811,674 70,415,860
91

UNM Plant Funds
Expenditures
Continued
2016-17 2017-18
Original Budget Original Budget
Minor Capital Outlay - RestrictedVarious 1,251,898 2,024,738Total Minor Restricted 1,251,898 2,024,738
Minor Capital Outlay - UnrestrictedEquipment/Library Acquisitions 8,000,000 8,000,000Building Acquisition & Repairs 15,000,000 12,500,000Computer Development & Other 3,000,000 3,000,000Total Minor Unrestricted 26,000,000 23,500,000
Renewal and ReplacementBuilding Renewal/Replacement 11,000,000 10,000,000Total Renewal and Replacement 11,000,000 10,000,000
Debt ServiceRetirement of Principal 16,177,969 17,166,923Retirement of Interest/Arbitrage rebate 18,206,908 19,889,680Service Charges & Fees 1,000,000 1,000,000Issuance Cost/Other 500,000 0Total Debt Service 35,884,877 38,056,603
GRAND TOTAL EXPENDITURES 114,948,449 143,997,201
92

Major70,415,860
48.90%
Minor Unrestricted23,500,000
16.32%
Minor Restricted2,024,738
1.41%
Debt Service38,056,603
26.43%
Renewal & Replacement10,000,000
6.94%
UNM Plant Funds Expenditures2017-2018 Budget
Total Expenditures $143,997,201
An Increase of 25.3% over 2016-17
93

APPENDICES

APPENDIX I
AVERAGE FACULTY/STAFF COMPENSATION HISTORY
FISCAL YEAR FACULTY STAFF
LEGISLATIVE FUNDING
SALARIES & BENEFITS
2017-18 0% 0% 0%
2016-17 0% 0% 0%
2015-16 0% 0% 0%
2014-15 3% + 0.75% ERB 2.5% + 0.75% ERB1.5% comp funded at the General Fund rate of I&G salaries, 60.2%.ERB 0.75% Increase also funded at 60.2%
2013-14 3% + 2.25% ERB 1% + 2.25% ERB1% comp funded at the General Fund rate of I&G salaries, 59.85%.ERB 1.5% Swap Reversal at 100% + .75% Increase at 62.43%
2012-13 1.75% ERB 1.75% ERB Reverse Swap-EmployeeERB Contribution 1.75%
2011-12 -1.75% ERB -1.75% ERB Increase of EmployeeERB Contribution 1.75%
2010-11 0% 0% 0%
2009-10 0% 0% 0%
2008-09 3.0% + .75% ERB 2.0% + .75% ERB; Staff < $30,000 @ 5.0% 2.0% + .75% ERBand $9.00/hr. min., TA @10%
2007-08 5.0% + .75% ERB 5.0% + .75% ERB 5.0% + .75% ERB
2006-07 4.25% + .75 ERB 4.25% + .75 ERB 4.5% + .75% ERB
2005-06 3.25% + .75 ERB 3.25% + .75 ERB 2% + .75% ERB
2004-05 5% 5% 2%
2003-04 3% $350 flat amount to offset cost of living plus an 3% Faculty;2.5%Staffaverage of 2% which may range from 0% to 5%
2002-03 Same as staff $300 for staff earning < $25,000 to offset the incr. 0.0% cost of health insurance & the cost-of-living; an incr.to a minimum wage of $7.00/hr.
2001-02 6.5% 6.5% 7.0% Faculty;6.5%Staff
2000-01 3.5% 3.5% 3.0%
1999-00 4.5% 4.5% 5% Faculty;4%Staff
1998-99 5.5% Average of 4% merit; 1.5% institutional funds 4.5%
1997-98 0% 0% 0%
1996-97 2% 2% 2%
95

APPENDIX I
AVERAGE FACULTY/STAFF COMPENSATION HISTORY
FISCAL YEAR FACULTY STAFF
LEGISLATIVE FUNDING
SALARIES & BENEFITS
1995-96 3% 3% 1.5% of salary + $375 3%
1994-95 7% 7% 4.5%
1993-94 4% 4% $865 for salaries $20,000 or less 3%
1992-93 2.2% 1.8% 2.2% on salaries;1.2% on FB
1991-92 5% 2.5% -0-
1990-91 7% 5% 2.83% (1)
1989-90 6% 5.5% <$20K 5% >$20K 3.5%
1988-89 7% 5% 4.18% (3)
1987-88 2.5% 2.5% 2.88%
1986-87 5% 5% 5%
1985-86 2% 2% 2%
1984-85 7% 8.2% to $15K 7.2% to $25K 6.2% >$30K 7.3%7.7% to $20K 6.7% to $30K
1983-84 0 0 0
1982-83 7.5% (2) 9.5% to $16K 8.5% to $30K 7.5% > $40K 10%9% to $25K 8% to $40K
1981-82 9% 9% 10%
1980-81 12% 12.25% Gr. 1-10 12.5% Gr. 16-20 12%12.75% Gr. 11-15 11% > Gr. 20
1979-80 7% 7-8% 7% > Gr. 20 7%
1978-79 7% 7% 7%
(1) In addition to a 2.83% salary increase is a separate fringe benefit increase of 6.23% for 1990-91. The Legislative increase for all prior years applies to salaries and fringe benefits combined.(2) Although the Legislature provided for 10% salary and fringe benefit increases, there were numerous factors adversely affecting total I&G funding, most significant of which was the Legislature taking credit for $4.8 million of land and permanent fund revenue against the I&G appropriation, thus reducing the amount of funds.(3) Beginning in FY 1988-89, the Legislative salary and fringe benefits increases are supplemented by increases in tuition as established by the Regents.(4) FY 10 Legislative ERB swap of 1.08% reduction plus .67% ERB funding for I&G.(5) FY 12 Legislative ERB Swap - reduced the general fund by 1.75% for ERB/employees increased contributions by 1.75%.
96

12 Hours 15 Hours 12 Hours 15 Hours
7.30% 11.75% $101.28 $195.60
Requestors of Student Fees
Original Revised Increase Increase
(Decrease) (Decrease)
A B C B + C D B + D
Student Activity Fees
Student Health and Counseling 4,578,571 4,542,737 135,834 4,678,571 92,306 4,635,043New Mexico Union 2,358,960 2,340,498 18,462 2,358,960 (3,485) 2,337,013UNM Childrens Campus 378,764 375,800 2,964 378,764 (560) 375,240Center of Academic Support (CAPS) 332,965 330,359 22,606 352,965 19,322 349,681UNM Public Events (Popejoy) 180,000 178,591 (13,591) 165,000 (15,126) 163,465Recreational Services 837,704 831,148 6,556 837,704 (1,238) 829,910Student Govt. Accounting Office 179,808 178,401 21,407 199,808 19,548 197,949Global Education Office 49,116 48,732 384 49,116 (73) 48,659LGBTQ Resource Center 131,759 130,728 5,281 136,009 4,016 134,744Women's Center 107,000 106,163 837 107,000 (159) 106,004Career Services 32,858 32,601 257 32,858 (49) 32,552KUNM 62,222 61,735 487 62,222 (92) 61,643Community Learning & Public Service 112,000 111,123 877 112,000 (165) 110,958American Indian Student Services 95,750 95,001 749 95,750 (142) 94,859Project for NM GS of Color 50,160 49,767 (39,767) 10,000 (39,860) 9,907Music Bands 73,000 72,429 571 73,000 (108) 72,321Theatre and Dance 31,651 31,403 (4,285) 27,118 (4,537) 26,866El Centro De La Raza 174,369 173,004 1,365 174,369 (257) 172,747African American Student Svc AASS 91,768 91,050 (4,282) 86,768 (5,089) 85,961CASAA/COSAP 19,234 19,083 (138) 18,945 (314) 18,769Student Activity Center 31,120 30,876 244 31,120 (46) 30,830College Assistant Migrant Program 35,000 34,726 274 35,000 (52) 34,674College Enrichment Program 25,000 24,804 196 25,000 (37) 24,767Graduate Resource Center 90,000 89,296 704 90,000 (133) 89,163Medicine Bow - HSC Campus 9,646 9,571 (9,571) 0 (9,571) 0Parking & Transportation Services 0 0 50,000 50,000 49,535 49,535Subtotal - Student Activity Fees 10,068,425 9,989,626 198,421 10,188,047 103,634 10,093,260
Graduate Allocation Fund (GAF)
GPSA Graduate Scholarship Fund 46,760 46,394 366 46,760 366 46,760GPSA Student Research Grant 89,134 88,436 698 89,134 698 89,134
ASUNM/GPSA
ASUNM - Accounting office 40,162 39,848 314 40,162 314 40,162ASUNM 850,000 843,347 6,653 850,000 6,653 850,000GPSA 300,950 298,594 2,356 300,950 2,356 300,950
Debt Service/Other
Debt Service-ERP Project Fee 2,352,180 2,333,770 18,410 2,352,180 18,410 2,352,180Debt Service-Facility Fee 14,689,317 14,574,350 3,114,967 17,689,317 2,704,967 17,279,317Univ Library Acquisitions 800,000 793,739 16,261 810,000 8,725 802,464IT Initiatives 1,900,000 1,885,130 14,870 1,900,000 (2,807) 1,882,323Athletics 4,000,000 3,968,694 (88,694) 3,880,000 31,306 4,000,000Subtotal - GAF/Debt/ASUNM/GPSA 25,068,503 24,872,302 3,086,201 27,958,503 2,770,988 27,643,290
Total - MC/HSC Current Funds 35,136,928 34,861,928 3,284,622 38,146,550 2,874,622 37,736,550
SFRB - One Time Funding
LoboRESPECT 0 0 40,000 40,000 40,000 40,000ENLACE - Division of Equity and Inclusion 0 0 95,000 95,000 95,000 95,000Libraries 75,000 75,000 (60,000) 15,000 (60,000) 15,000Information Technologies 20,000 20,000 (20,000) 0 (20,000) 0LGBTQ Resource Center 7,500 7,500 (2,500) 5,000 (2,500) 5,000Parking & Transportation Services 50,000 50,000 (50,000) 0 (50,000) 0Center of Academic Support (CAPS) 37,500 37,500 (37,500) 0 (37,500) 0Community Learning & Public Service 19,201 19,201 (19,201) 0 (19,201) 0SFRB Website 0 0 2,000 2,000 2,000 2,000Medicine Bow 17,000 17,000 (17,000) 0 (17,000) 0Green Fund, Office Sustainability 0 0 17,788 17,788 17,788 17,788Total - MC/HSC SFRB One Time Funding 226,201 226,201 (51,413) 174,788 (51,413) 174,788
Grand Total - Main Campus/HSC 35,363,129 35,088,129 3,233,209 38,321,338 2,823,209 37,911,338
FY 2016-17
Budget
FY 2017-18
Regents
Final
FY 2017-18
Budget
SFRB
Recommendation
Budget
FY 2017-18 STUDENT FEES
MAIN CAMPUS
% Increase Dollar Increase
Undergraduate Resident Annual Cost
APPENDIX II
97
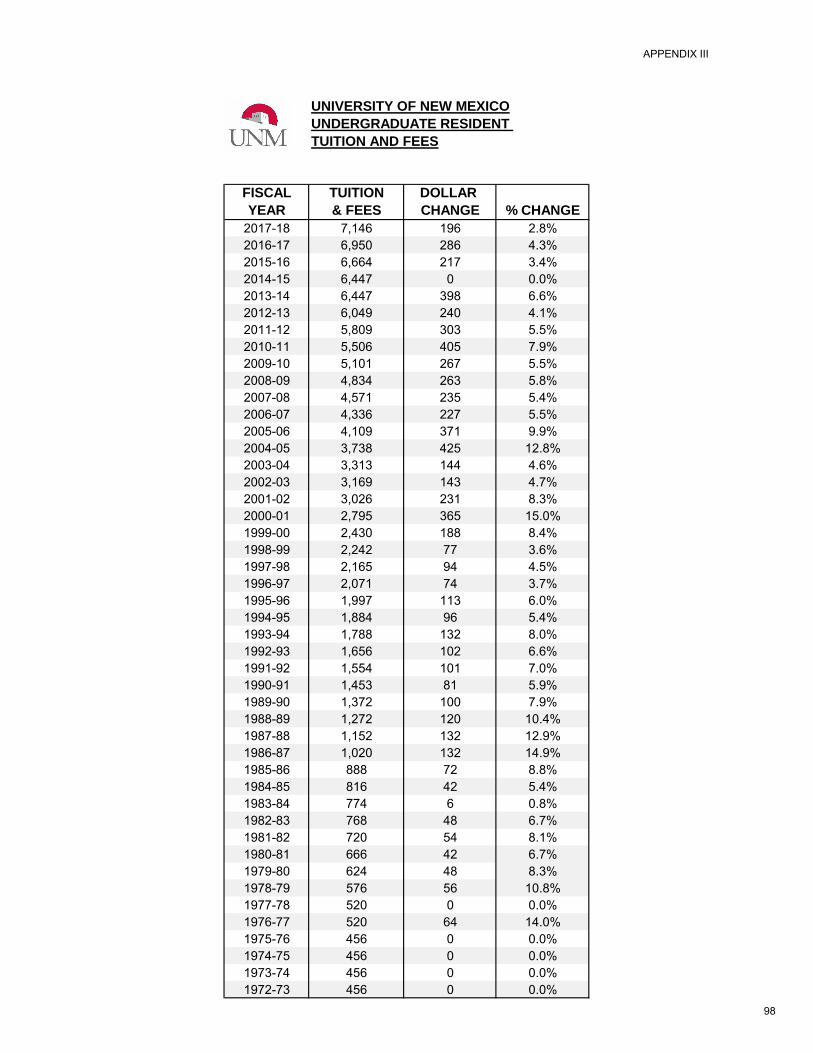
APPENDIX III
UNIVERSITY OF NEW MEXICO
UNDERGRADUATE RESIDENT
TUITION AND FEES
FISCAL TUITION DOLLAR
YEAR & FEES CHANGE % CHANGE
2017-18 7,146 196 2.8%2016-17 6,950 286 4.3%2015-16 6,664 217 3.4%2014-15 6,447 0 0.0%2013-14 6,447 398 6.6%2012-13 6,049 240 4.1%2011-12 5,809 303 5.5%2010-11 5,506 405 7.9%2009-10 5,101 267 5.5%2008-09 4,834 263 5.8%2007-08 4,571 235 5.4%2006-07 4,336 227 5.5%2005-06 4,109 371 9.9%2004-05 3,738 425 12.8%2003-04 3,313 144 4.6%2002-03 3,169 143 4.7%2001-02 3,026 231 8.3%2000-01 2,795 365 15.0%1999-00 2,430 188 8.4%1998-99 2,242 77 3.6%1997-98 2,165 94 4.5%1996-97 2,071 74 3.7%1995-96 1,997 113 6.0%1994-95 1,884 96 5.4%1993-94 1,788 132 8.0%1992-93 1,656 102 6.6%1991-92 1,554 101 7.0%1990-91 1,453 81 5.9%1989-90 1,372 100 7.9%1988-89 1,272 120 10.4%1987-88 1,152 132 12.9%1986-87 1,020 132 14.9%1985-86 888 72 8.8%1984-85 816 42 5.4%1983-84 774 6 0.8%1982-83 768 48 6.7%1981-82 720 54 8.1%1980-81 666 42 6.7%1979-80 624 48 8.3%1978-79 576 56 10.8%1977-78 520 0 0.0%1976-77 520 64 14.0%1975-76 456 0 0.0%1974-75 456 0 0.0%1973-74 456 0 0.0%1972-73 456 0 0.0%
98

APPENDIX IV
Summary of Main Campus
Tuition Credit Changes
Fiscal Year Tuition Credit
2017-2018 0.0%2016-2017 0.0%2015-2016 0.0%2014-2015 0.0%2013-2014 0.0%2012-2013 0.0%2011-2012 3.1%2010-2011 5.0%2009-2010 2.5%2008-2009 2.0%2007-2008 0.0%2006-2007 3.0%2005-2006 4.5%2004-2005 4.0%2003-2004 4.0%2002-2003 3.0%2001-2002 5.0%2000-2001 4.0%1999-2000 4.0%1998-1999 0.0%1997-1998 0.0%1996-1997 3.0%1995-1996 3.0%1994-1995 3.3%1993-1994 5.0%1992-1993 5.0%
0.0%
0.5%
1.0%
1.5%
2.0%
2.5%
3.0%
3.5%
4.0%
4.5%
5.0%
20
17
-20
18
20
16
-20
17
20
15
-20
16
20
14
-20
15
20
13
-20
14
20
12
-20
13
20
11
-20
12
20
10
-20
11
20
09
-20
10
20
08
-20
09
20
07
-20
08
20
06
-20
07
20
05
-20
06
20
04
-20
05
20
03
-20
04
20
02
-20
03
20
01
-20
02
20
00
-20
01
19
99
-20
00
19
98
-19
99
19
97
-19
98
19
96
-19
97
19
95
-19
96
19
94
-19
95
19
93
-19
94
19
92
-19
93
Fiscal Year
Tuit
ion
Cre
dit
99

GLOSSARY OF TERMS
Instruction & General (I&G):
The components of Instruction & General (I&G) include the following five exhibits in accordance with the New Mexico Commission on Higher Education, Financial Reporting Manual for Public Institutions in New Mexico (http://budgetoffice/HEDFinancialReporting_Exhibits.pdf):
Exhibit 10 – Expenditures for Instruction: This includes activities that are part of the Institution’s instructional program. Examples of Expenditures for Instruction include:
General Academic Instruction Faculty & Instructional Support Staff Salaries Special Session Instruction Community Education GA/TA/RA Salaries and Waivers
Exhibit 11 – Academic Support: This category should include funds expended primarily to provide support services for the Institution’s missions. Examples in Academic Support include:
Libraries Museums & Galleries Audio-Visual Services Academic Administration & Personnel Development Course & Curriculum Development Deans’ Offices
Exhibit 12 – Student Services: The subcategories included here are the ones that relate directly to services provided to the students by the Institution. Examples of Student Services include:
Dean of Students Supplementary Educational Services Counseling & Career Guidance College Enrichment Ethnic Student Services Financial Aid Administration Student Admissions & Records
100

Exhibit 13 – Institutional Support: This includes expenditures for activities whose primary purpose is to provide operational support for the day-to-day functioning of the Institution, excluding expenditures for Physical Plant operations. Examples of Institutional Support include:
Executive Management Fiscal Operations General Administrative Services Logistical Services Community Relations Divisions/Departments such as the President, University Counsel,
Accounting, Budget, HR, Auditing, and Board of Regents Administrative Salaries
Exhibit 14 – Operation and Maintenance of Plant: This category includes all expenditures related to the operation and maintenance of the Physical Plant. Examples of Operation and Maintenance of Plant include:
Custodial Operation Crafts/Trades Grounds Utilities
Non-Instruction & General (I&G):
Non-Instruction & General (I&G) includes the following exhibits in accordance with the New Mexico Commission on Higher Education, Financial Reporting Manual for Public Institutions in New Mexico (http://budgetoffice/HEDFinancialReporting_Exhibits.pdf):
Exhibit 15 – Student Social and Cultural Development Activities: This includes all funds expended for activities whose primary purpose is to contribute to students’ emotional and physical well-being and to their intellectual, cultural, and social development outside the context of the formal instruction program. Activities included here are student government, student publications, entertainment series, student organizations, and others.
Exhibit 16 – Research: This includes all activities organized specifically to produce research outcomes. Accounts included in this function are General Research, Energy Research, Bureau of Engineering Research, Institute for Applied Research, Contract Archeology, Department of Research, College and Department F&A accounts, State Appropriations for Research Projects (RPSPs), and others.
101

Exhibit 17 – Public Service: This includes all activities established primarily to provide non-instructional services for individuals and groups external to the Institution. Accounts included in this function are KNME-TV, Institute of Public Law, University Press, Poison Control Center, Donor-Designated Departmental Non-endowed spending accounts, State appropriations for Public Service Projects (RPSPs) and others.
Exhibit 18 – Internal Service Department: This function includes activities which provide services mainly to internal institutional departments for a specific amount charged. Accounts included in this function are the IT, Physical Plant Department, Surplus Property, Bookstore Supply Operation, Copy Center, and others.
Exhibit 19 – Student Aid, Grants, and Stipends: This function includes all financial assistance provided to students in the form of outright grants, trainee stipends, and prizes, either awarded by and/or administered through the Institution. Included in this function would be tuition and fee waivers and remissions, and all gifts and prizes to students that are outright grants.
Exhibit 20 – Auxiliary Enterprises: These are entities that exist to furnish a service to students, faculty or staff and that charge a fee directly for the cost of the service. Auxiliary Enterprises are managed as essentially self-supporting operations. Examples of Auxiliary Enterprises include the Bookstore, Golf Course, Concessions, Dining Halls, Residence Halls, Student Union, Student Health Center, Parking Services, and others.
Exhibit 21 – Intercollegiate Athletics: The entire athletic function is reported within this category.
Exhibit 22 – Independent Operations: These include all operations that are independent of or unrelated to the primary programs of the Institution. Examples of this are the Office of the Medical Investigator, House staff, Medical Residents and others.
Restricted: Restricted funds are limited by external donors or agencies to specific purposes.
Private Donations (UNM Foundations) Contracts & Grants (Federal, State, Local)
102

Plant Funds: Major and Minor Capital Projects Institutional Bond Debt Service Building Renewal & Replacement (BR&R) upgrades and replacement of
existing building facilities used for I&G purposes. Equipment Renewal & Replacement (ER&R) replacement and upgrade of
existing equipment and computers used for I&G purposes.
103