opportunities for energy savings in the residential and commercial sectors with high-efficiency
TRANSCRIPT
Opportunities forEnergy Savings inthe Residential andCommercial Sectorswith High-EfficiencyElectric Motors
Final Report
Prepared for:
U.S. Department of EnergyContract No. DE-AC01-90CE23821
December 1, 1999
Arthur D. Little, Inc.955 L’Enfant Plaza, SW, Suite 8600Washington, DC20024-2119
Reference 35495-14

Acknowledgements
The authors would like to acknowledge the valuable support provided by others inthe preparation of this report. Dr. James Brodrick of D&R International providedday-to-day oversight of this assignment, helping to shape the approach, execution,and documentation. He also reviewed and critiqued multiple draft versions of the report.Mr. John D. Ryan of the U.S. Department of Energy sponsored this assignment andprovided overall strategic guidance.

i
TABLE OF CONTENTS
LIST OF TABLES.................................................................................................................................... III
LIST OF FIGURES ...................................................................................................................................V
ACRONYMS ............................................................................................................................................ VI
EXECUTIVE SUMMARY.....................................................................................................................VII
� Introduction .................................................................................................................... vii� Study Objectives ...................................................................................................... viii� Summary of Findings ............................................................................................... viii� Energy-Saving Technology..................................................................................... xvii� Market Barriers........................................................................................................ xvii� Opportunities.......................................................................................................... xviii
1 INTRODUCTION ......................................................................................................................... 1-1
� 1.1 Study Objectives ....................................................................................... 1-1� 1.2 Background ............................................................................................... 1-1� 1.3 Work Plan and Approach .......................................................................... 1-3
2 MOTOR TECHNOLOGY OVERVIEW .................................................................................... 2-1
� 2.1 Conventional Motor Technologies............................................................ 2-12.1.1 Three-Phase Squirrel-Cage Induction Motors .................................................................. 2-12.1.2 Single-Phase Squirrel-Cage Induction Motors ................................................................. 2-8
2.1.2.1 Refrigerator Application of the Single-Phase SCIM ................................................................. 2-102.1.3 Shaded-Pole Induction Motors........................................................................................ 2-122.1.4 Universal AC/DC Motors ................................................................................................ 2-122.1.5 Two-Speed Motors........................................................................................................... 2-13
� 2.2 Variable-Speed Drive and Motor Technologies...................................... 2-142.2.1 Efficiency Issues and Opportunities With Variable-Speed Drives .................................. 2-182.2.2 ECPMs ............................................................................................................................ 2-192.2.3 SCIMs With Variable-Speed Drive.................................................................................. 2-212.2.4 SRMs ............................................................................................................................... 2-23
� 2.3 Variable-Speed Motor/Drive Costs—Refrigerator Compressor MotorExample 2-26
� 2.4 Variable-Speed Motor/Drive Costs—Fan and Small-Pump Motors....... 2-27� 2.5 Current Research in Electric Motors for Commercial Applications ....... 2-29
2.5.1 Program Options............................................................................................................. 2-31
3 MOTOR POPULATIONS, ENERGY USAGE, AND SAVINGS POTENTIAL IN THERESIDENTIAL SECTOR.............................................................................................................3-1
� 3.1 Residential-Sector Motor Population and Energy Usage.......................... 3-2� 3.2 Residential-Sector Motor Energy Savings Potential ............................... 3-11
3.2.1 Domestic Refrigerators and Freezers.............................................................................. 3-15

ii
3.2.1.1 Impact of NAECA Standards .................................................................................................... 3-173.2.1.2 Compressor Motor..................................................................................................................... 3-173.2.1.3 Evaporator Fan Motor ............................................................................................................... 3-183.2.1.4 Condenser Fan Motor................................................................................................................ 3-18
3.2.2 Central Air Conditioners and Heat Pumps ..................................................................... 3-183.2.2.1 Single-Speed Compressor Motor............................................................................................... 3-203.2.2.2 Variable-Speed Compressor Motor ........................................................................................... 3-213.2.2.3 Condenser Fan Motor. ............................................................................................................... 3-22
3.2.3 Indoor Air Blowers in Forced Draft Heating and Air Conditioning Systems ................. 3-223.2.3.1 Variable-Speed Motor/Blower .................................................................................................. 3-24
3.2.4 Room Air Conditioners.................................................................................................... 3-263.2.4.1 Compressor Motor..................................................................................................................... 3-273.2.4.2 Fan/Blower Motor ..................................................................................................................... 3-283.2.4.3 Efficiency Improvement and Energy Savings Potential ............................................................ 3-28
3.2.5 Clothes Washers .............................................................................................................. 3-29
4 MOTOR POPULATIONS, ENERGY USAGE, AND SAVINGS POTENTIAL IN THECOMMERCIAL SECTOR........................................................................................................... 4-1
� 4.1 Commercial-Sector Motor Population and Energy Usage ........................ 4-2� 4.2 Commercial-Sector Motor Energy Savings Potential ............................... 4-5
4.2.1 Air Conditioning Compressors.......................................................................................... 4-84.2.2 Space Conditioning Thermal Distribution ...................................................................... 4-10
4.2.2.1 Air Distribution ......................................................................................................................... 4-124.2.2.2 Hydronic Hot and Chilled Water Circulation/Distribution........................................................ 4-154.2.2.3 Cooling Water Circulation ........................................................................................................ 4-184.2.2.4 Heat Rejection to Ambient Air .................................................................................................. 4-20
4.2.3 Commercial Refrigeration............................................................................................... 4-224.2.3.1 Central Systems......................................................................................................................... 4-264.2.3.2 Beverage Merchandisers and Reach-In Equipment ................................................................... 4-274.2.3.3 Ice Machines.............................................................................................................................. 4-304.2.3.4 Refrigerated Vending Machines................................................................................................ 4-314.2.3.5 Walk-In Coolers and Freezers ................................................................................................... 4-32
4.2.4 Miscellaneous Commercial-Sector Motor Applications.................................................. 4-34
5 MARKET BARRIERS TO INCREASED USE OF HIGH-EFFICIENCY MOTORS ........... 5-1
� 5.1 Residential ................................................................................................. 5-1� 5.2 Commercial Refrigeration......................................................................... 5-2� 5.3 Air Conditioning Compressors/Commercial HVAC ................................ 5-3� 5.4 HVAC Thermal Distribution/Adjustable-Speed Drives............................ 5-4
6 BIBLIOGRAPHY.......................................................................................................................... 6-1

iii
List of Tables
TABLE 2-1: PRICE-EFFICIENCY–PAYBACK COMPARISON OF STANDARD AND HIGH-EFFICIENCY GENERAL
PURPOSE THREE-PHASE MOTORS (OPEN DRIP-PROOF).....................................................................................2-6TABLE 2-2: PRICE-EFFICIENCY¾PAYBACK COMPARISON OF STANDARD AND HIGH-EFFICIENCY GENERAL
PURPOSE THREE-PHASE MOTORS (TEFC) ........................................................................................................2-7TABLE 2-3: SHADED POLE, PSC, AND ECPM REFRIGERATOR FAN MOTOR EFFICIENCY AND OEM COST..............2-28TABLE 2-4: INVOLVEMENT IN MOTOR RESEARCH FOR COMMERCIAL AND RESIDENTIAL APPLICATIONS................2-30TABLE 3-1: MAJOR RESIDENTIAL-SECTOR ELECTRIC MOTOR APPLICATIONS¾INSTALLED BASE ............................3-7TABLE 3-2: MAJOR RESIDENTIAL-SECTOR ELECTRIC MOTOR APPLICATIONS¾CURRENT PRODUCTION...................3-8TABLE 3-3: MISCELLANEOUS RESIDENTIAL-SECTOR ELECTRIC MOTOR APPLICATIONS............................................3-9TABLE 3-4: RESIDENTIAL-SECTOR ELECTRIC MOTORS USED WITH ELECTRIC RESISTANCE HEATING
DEVICES..........................................................................................................................................................3-10TABLE 3-5: POTENTIAL RESIDENTIAL-SECTOR ENERGY SAVINGS THROUGH INCREASED MOTOR
EFFICIENCY.....................................................................................................................................................3-13TABLE 3-6: POTENTIAL RESIDENTIAL-SECTOR ENERGY SAVINGS THROUGH VARIABLE-SPEED MOTORS...............3-14TABLE 3-7: POTENTIAL FOR ENERGY SAVINGS THROUGH INCREASED EFFICIENCY AND VARIABLE-SPEED
REFRIGERATOR/FREEZER MOTORS (BASE SITE MOTOR ENERGY1= 113 X 109
KWH/YR) ................................3-16TABLE 3-8: COST-EFFECTIVENESS OF EFFICIENT MOTOR OPTIONS FOR
REFRIGERATOR/FREEZERS¾ESTIMATED PAYBACK FOR AVERAGE USER AT AN AVERAGE
ELECTRICITY RATE ($0.08/KWH) ...................................................................................................................3-16TABLE 3-9: POTENTIAL FOR ENERGY SAVINGS THROUGH INCREASED-EFFICIENCY CENTRAL AIR
CONDITIONER AND HEAT PUMP MOTORS (BASE SITE MOTOR ENERGY1 = 180 X 109
KWH/YR, NOT
INCLUDING THE INDOOR AIR BLOWER) ............................................................................................................3-20TABLE 3-10: COST-EFFECTIVENESS OF EFFICIENT MOTOR OPTIONS FOR CENTRAL AIR CONDITIONERS AND
HEAT PUMPS¾ESTIMATED PAYBACK FOR AVERAGE USER AT AVERAGE ELECTRICITY RATE
(0.08/KWH).....................................................................................................................................................3-20TABLE 3-11: POTENTIAL FOR ENERGY SAVINGS THROUGH INCREASED-EFFICIENCY INDOOR BLOWER
MOTORS (BASE SITE MOTOR ENERGY1 = 61 X 109
KWH/YR) ..........................................................................3-23TABLE 3-12: COST-EFFECTIVENESS OF EFFICIENT MOTOR OPTIONS FOR INDOOR BLOWERS¾ESTIMATED
PAYBACK FOR AVERAGE USER AT AVERAGE ELECTRICITY RATE (0.08/KWH) ..............................................3-24TABLE 3-13: POTENTIAL FOR ENERGY SAVINGS THROUGH INCREASED-EFFICIENCY ROOM AIR
CONDITIONER MOTORS (BASE SITE MOTOR ENERGY1 = 29 X 109
KWH/YR) ...................................................3-28TABLE 3-14: COST-EFFECTIVENESS OF EFFICIENT MOTOR OPTIONS FOR ROOM AIR
CONDITIONERS¾ESTIMATED PAYBACK FOR AVERAGE USER AT AVERAGE ELECTRICITY RATE
($0.08/KWH)...................................................................................................................................................3-29TABLE 4-1: 1995 COMMERCIAL AIR CONDITIONING EQUIPMENT COMPRESSOR MOTOR CHARACTERISTICS.............4-8TABLE 4-2: POTENTIAL ENERGY SAVINGS WITH INCREMENTALLY HIGHER-EFFICIENCY COMMERCIAL AIR
CONDITIONING COMPRESSOR DRIVE MOTORS..................................................................................................4-9TABLE 4-3: MOTORS IN COMMERCIAL-SECTOR INTERIOR AIR DISTRIBUTION (SPACE COOLING AND SPACE
HEATING¾1995) ............................................................................................................................................4-13TABLE 4-4: POTENTIAL ENERGY SAVINGS WITH INCREMENTALLY HIGHER-EFFICIENCY INTERIOR AIR
DISTRIBUTION BLOWER DRIVE MOTORS¾COMMERCIAL BUILDINGS ............................................................4-13TABLE 4-5: MOTORS IN COMMERCIAL-SECTOR HYDRONIC THERMAL DISTRIBUTION (1995)..................................4-16TABLE 4-6: POTENTIAL ENERGY SAVINGS WITH INCREMENTALLY HIGHER-EFFICIENCY DRIVE MOTORS
FOR HYDRONIC CIRCULATION PUMPS IN COMMERCIAL BUILDINGS................................................................4-16TABLE 4-7: COOLING WATER CIRCULATION PUMP MOTORS IN THE COMMERCIAL SECTOR (1995) ........................4-18

iv
TABLE 4-8: POTENTIAL ENERGY SAVINGS WITH INCREMENTALLY HIGHER-EFFICIENCY COOLING WATER
PUMP DRIVE MOTORS.....................................................................................................................................4-19TABLE 4-9: MOTORS IN COMMERCIAL-SECTOR AIR CONDITIONING HEAT REJECTION (1995) ................................4-20TABLE 4-10: POTENTIAL ENERGY SAVINGS WITH INCREMENTALLY HIGHER-EFFICIENCY FAN OR BLOWER
DRIVE MOTORS FOR HEAT REJECTION TO AMBIENT AIR¾COMMERCIAL BUILDINGS....................................4-21TABLE 4-11: COMMERCIAL REFRIGERATION COMPRESSOR AND FAN MOTOR ENERGY CONSUMPTION...................4-24TABLE 4-12: COMMERCIAL REFRIGERATION COMPRESSOR AND FAN MOTOR ENERGY SAVINGS ............................4-25TABLE 4-13: ECONOMIC ANALYSIS: SUPERMARKETS..............................................................................................4-27TABLE 4-14: EVAPORATOR FAN MOTOR SIZES AND OEM COSTS IN A TYPICAL SUPERMARKET.............................4-27TABLE 4-15: ECONOMIC ANALYSIS: BEVERAGE MERCHANDISER............................................................................4-28TABLE 4-16: ECONOMIC ANALYSIS: REACH-IN FREEZERS.......................................................................................4-29TABLE 4-17: ECONOMIC ANALYSIS: REACH-IN REFRIGERATORS.............................................................................4-30TABLE 4-18: ECONOMIC ANALYSIS: ICE MACHINES ................................................................................................4-31TABLE 4-19: ECONOMIC ANALYSIS: REFRIGERATED VENDING MACHINES..............................................................4-32TABLE 4-20: ECONOMIC ANALYSIS: WALK -IN COOLERS........................................................................................4-33TABLE 4-21: ECONOMIC ANALYSIS: WALK -IN FREEZERS........................................................................................4-33
v
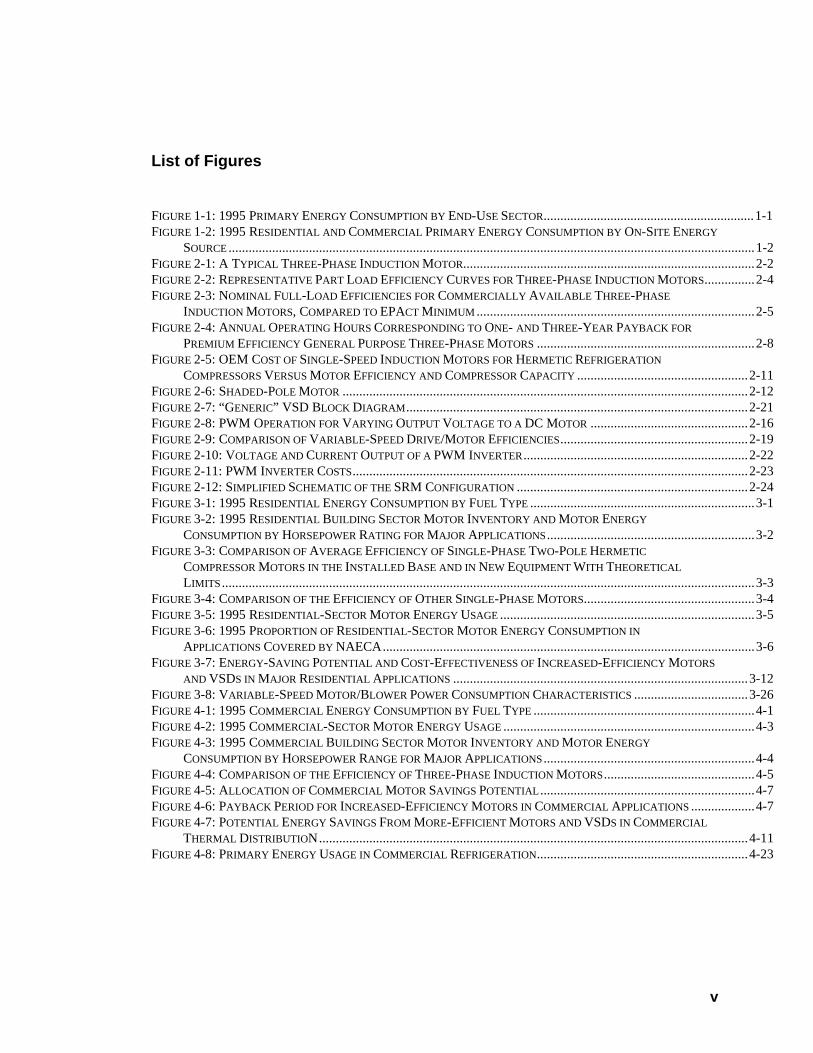
List of Figures
FIGURE 1-1: 1995 PRIMARY ENERGY CONSUMPTION BY END-USE SECTOR...............................................................1-1FIGURE 1-2: 1995 RESIDENTIAL AND COMMERCIAL PRIMARY ENERGY CONSUMPTION BY ON-SITE ENERGY
SOURCE.............................................................................................................................................................1-2FIGURE 2-1: A TYPICAL THREE-PHASE INDUCTION MOTOR.......................................................................................2-2FIGURE 2-2: REPRESENTATIVE PART LOAD EFFICIENCY CURVES FOR THREE-PHASE INDUCTION MOTORS...............2-4FIGURE 2-3: NOMINAL FULL-LOAD EFFICIENCIES FOR COMMERCIALLY AVAILABLE THREE-PHASE
INDUCTION MOTORS, COMPARED TO EPACT MINIMUM ...................................................................................2-5FIGURE 2-4: ANNUAL OPERATING HOURS CORRESPONDING TO ONE- AND THREE-YEAR PAYBACK FOR
PREMIUM EFFICIENCY GENERAL PURPOSE THREE-PHASE MOTORS.................................................................2-8FIGURE 2-5: OEM COST OF SINGLE-SPEED INDUCTION MOTORS FOR HERMETIC REFRIGERATION
COMPRESSORS VERSUS MOTOR EFFICIENCY AND COMPRESSOR CAPACITY ...................................................2-11FIGURE 2-6: SHADED-POLE MOTOR.........................................................................................................................2-12FIGURE 2-7: “GENERIC” VSD BLOCK DIAGRAM ......................................................................................................2-21FIGURE 2-8: PWM OPERATION FOR VARYING OUTPUT VOLTAGE TO A DC MOTOR...............................................2-16FIGURE 2-9: COMPARISON OF VARIABLE-SPEED DRIVE/MOTOR EFFICIENCIES........................................................2-19FIGURE 2-10: VOLTAGE AND CURRENT OUTPUT OF A PWM INVERTER...................................................................2-22FIGURE 2-11: PWM INVERTER COSTS......................................................................................................................2-23FIGURE 2-12: SIMPLIFIED SCHEMATIC OF THE SRM CONFIGURATION.....................................................................2-24FIGURE 3-1: 1995 RESIDENTIAL ENERGY CONSUMPTION BY FUEL TYPE...................................................................3-1FIGURE 3-2: 1995 RESIDENTIAL BUILDING SECTOR MOTOR INVENTORY AND MOTOR ENERGY
CONSUMPTION BY HORSEPOWER RATING FOR MAJOR APPLICATIONS..............................................................3-2FIGURE 3-3: COMPARISON OF AVERAGE EFFICIENCY OF SINGLE-PHASE TWO-POLE HERMETIC
COMPRESSOR MOTORS IN THE INSTALLED BASE AND IN NEW EQUIPMENT WITH THEORETICAL
LIMITS ...............................................................................................................................................................3-3FIGURE 3-4: COMPARISON OF THE EFFICIENCY OF OTHER SINGLE-PHASE MOTORS...................................................3-4FIGURE 3-5: 1995 RESIDENTIAL-SECTOR MOTOR ENERGY USAGE............................................................................3-5FIGURE 3-6: 1995 PROPORTION OF RESIDENTIAL-SECTOR MOTOR ENERGY CONSUMPTION IN
APPLICATIONS COVERED BY NAECA...............................................................................................................3-6FIGURE 3-7: ENERGY-SAVING POTENTIAL AND COST-EFFECTIVENESS OF INCREASED-EFFICIENCY MOTORS
AND VSDS IN MAJOR RESIDENTIAL APPLICATIONS........................................................................................3-12FIGURE 3-8: VARIABLE-SPEED MOTOR/BLOWER POWER CONSUMPTION CHARACTERISTICS..................................3-26FIGURE 4-1: 1995 COMMERCIAL ENERGY CONSUMPTION BY FUEL TYPE..................................................................4-1FIGURE 4-2: 1995 COMMERCIAL-SECTOR MOTOR ENERGY USAGE...........................................................................4-3FIGURE 4-3: 1995 COMMERCIAL BUILDING SECTOR MOTOR INVENTORY AND MOTOR ENERGY
CONSUMPTION BY HORSEPOWER RANGE FOR MAJOR APPLICATIONS...............................................................4-4FIGURE 4-4: COMPARISON OF THE EFFICIENCY OF THREE-PHASE INDUCTION MOTORS.............................................4-5FIGURE 4-5: ALLOCATION OF COMMERCIAL MOTOR SAVINGS POTENTIAL ................................................................4-7FIGURE 4-6: PAYBACK PERIOD FOR INCREASED-EFFICIENCY MOTORS IN COMMERCIAL APPLICATIONS...................4-7FIGURE 4-7: POTENTIAL ENERGY SAVINGS FROM MORE-EFFICIENT MOTORS AND VSDS IN COMMERCIAL
THERMAL DISTRIBUTION................................................................................................................................4-11FIGURE 4-8: PRIMARY ENERGY USAGE IN COMMERCIAL REFRIGERATION...............................................................4-23
vi
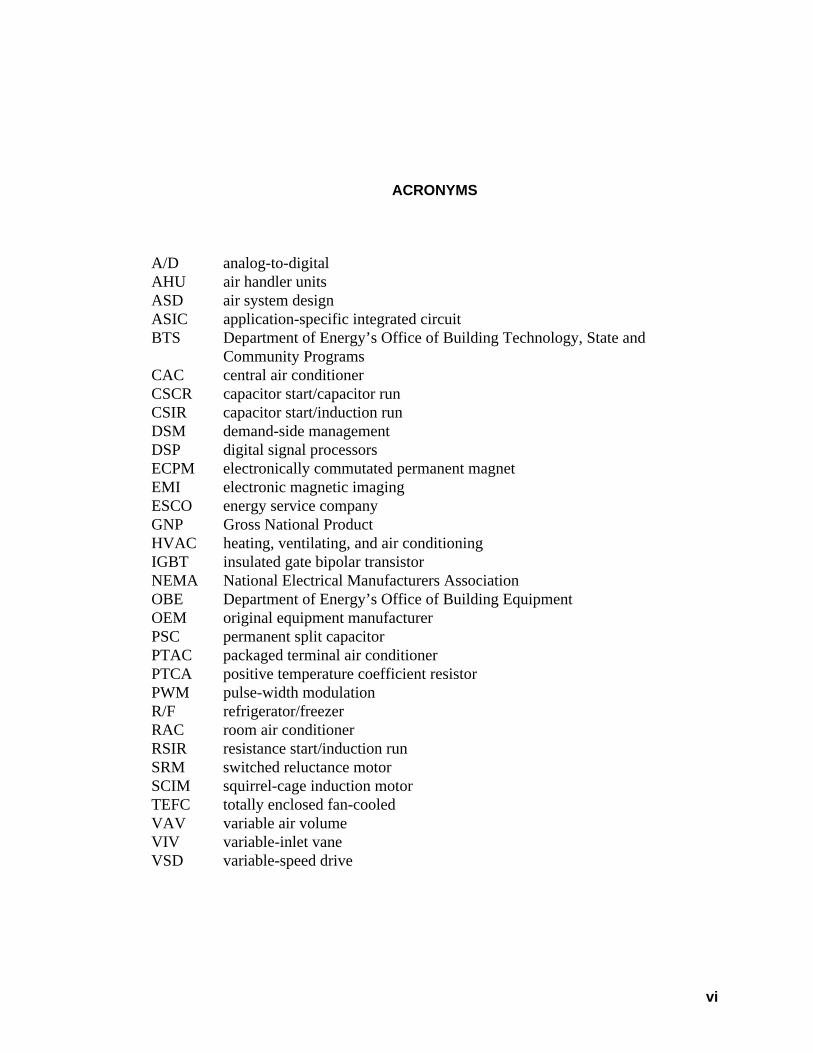
ACRONYMS
A/D analog-to-digitalAHU air handler unitsASD air system designASIC application-specific integrated circuitBTS Department of Energy’s Office of Building Technology, State and
Community ProgramsCAC central air conditionerCSCR capacitor start/capacitor runCSIR capacitor start/induction runDSM demand-side managementDSP digital signal processorsECPM electronically commutated permanent magnetEMI electronic magnetic imagingESCO energy service companyGNP Gross National ProductHVAC heating, ventilating, and air conditioningIGBT insulated gate bipolar transistorNEMA National Electrical Manufacturers AssociationOBE Department of Energy’s Office of Building EquipmentOEM original equipment manufacturerPSC permanent split capacitorPTAC packaged terminal air conditionerPTCA positive temperature coefficient resistorPWM pulse-width modulationR/F refrigerator/freezerRAC room air conditionerRSIR resistance start/induction runSRM switched reluctance motorSCIM squirrel-cage induction motorTEFC totally enclosed fan-cooledVAV variable air volumeVIV variable-inlet vaneVSD variable-speed drive

vii
Executive Summary
Introduction
The U.S. consumed approximately 90 quadrillion Btus (quads) of primary energy in1995. Of this energy, residential and commercial buildings consumed roughly one-third�32.8 quads. The Energy Information Administration forecasts that, if unimpeded,annual energy consumption in residential and commercial buildings will increase to41 quads by the year 2020.
Figure ES-1: 1995 Primary Energy Consumption by End-Use Sector
Source: AEO 1998
The Department of Energy’s Office of Building Technology, State and CommunityPrograms (BTS) supports various cost-effective programs aimed at limiting the use ofnonrenewable energy in buildings. To accomplish these tasks, BTS is concentrating onimproving the efficiency of energy use and expanding the role of renewable energyin buildings. A specific BTS objective is to maintain energy consumption fromnonrenewable sources at the current level of 32.7 quads, while accommodating andsupporting the predicted growth in population, GNP, and standard of living. BTS mustaccomplish this objective by managing the costs of the system improvements.
Residential20%
Transportation27%
Industrial37%
Commercial16%
Total 90.9
(Primary energy consumption forutility electric energy generationallocated to each end-use sector)
viii
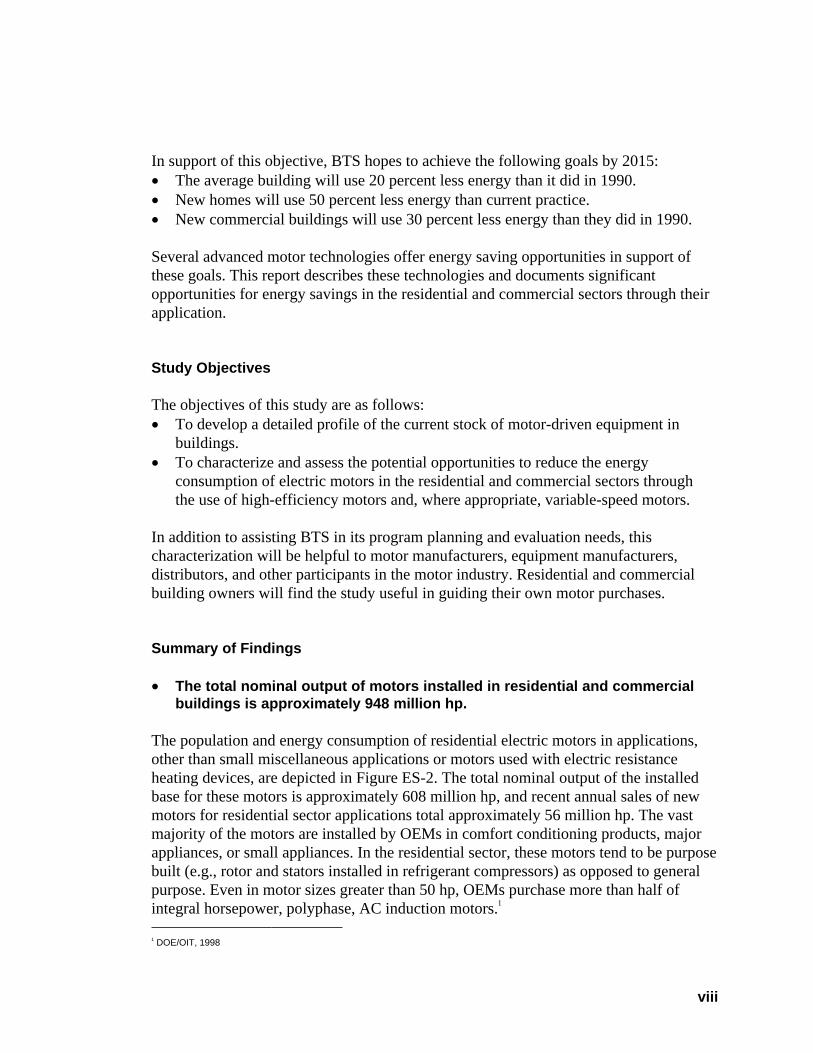
In support of this objective, BTS hopes to achieve the following goals by 2015:� The average building will use 20 percent less energy than it did in 1990.� New homes will use 50 percent less energy than current practice.� New commercial buildings will use 30 percent less energy than they did in 1990.
Several advanced motor technologies offer energy saving opportunities in support ofthese goals. This report describes these technologies and documents significantopportunities for energy savings in the residential and commercial sectors through theirapplication.
Study Objectives
The objectives of this study are as follows:� To develop a detailed profile of the current stock of motor-driven equipment in
buildings.� To characterize and assess the potential opportunities to reduce the energy
consumption of electric motors in the residential and commercial sectors throughthe use of high-efficiency motors and, where appropriate, variable-speed motors.
In addition to assisting BTS in its program planning and evaluation needs, thischaracterization will be helpful to motor manufacturers, equipment manufacturers,distributors, and other participants in the motor industry. Residential and commercialbuilding owners will find the study useful in guiding their own motor purchases.
Summary of Findings
� The total nominal output of motors installed in residential and commercialbuildings is approximately 948 million hp.
The population and energy consumption of residential electric motors in applications,other than small miscellaneous applications or motors used with electric resistanceheating devices, are depicted in Figure ES-2. The total nominal output of the installedbase for these motors is approximately 608 million hp, and recent annual sales of newmotors for residential sector applications total approximately 56 million hp. The vastmajority of the motors are installed by OEMs in comfort conditioning products, majorappliances, or small appliances. In the residential sector, these motors tend to be purposebuilt (e.g., rotor and stators installed in refrigerant compressors) as opposed to generalpurpose. Even in motor sizes greater than 50 hp, OEMs purchase more than half ofintegral horsepower, polyphase, AC induction motors.1
1 DOE/OIT, 1998

ix
The use of motors in the residential sector is quite diverse. Motors range from thesmaller motors in the 1/4 to 1/2 hp range typically used in equipment such asrefrigerator/freezer compressors, central a/c condenser fans, clothes washers anddishwasher pumps to the 2 to 5 hp motors typically used in equipment such as centrala/c compressors and heat pump compressors. The smallest motors in the < 1/10 hp rangeare typically used in equipment such as clothes dryer drum rotation and convection ovenrotation motors.
Figure ES-2: 1995 Motor Inventory and Motor Energy Consumption by Horsepower Rating for MajorApplications—Residential Building Sector
<1/10 hp 1/10 - 1/4 hp 1/4 - 1/2 hp 1/2 - 1 hp 1 - 2 hp 2 - 5 hp
Motor Horsepower Range (hp)
Inst
alle
d B
ase
of M
otor
s (M
M)
Energy (kW
h X 10^9)
Inventory Total(864 million)
Annual Energy Consumption (1)Total (409 X 10^9 kWh)
Source: Table 3-1Total does not include 34 x 109 kWh/year energy consumption from “Miscellaneous” sources as outlined in Table 3-3.
x
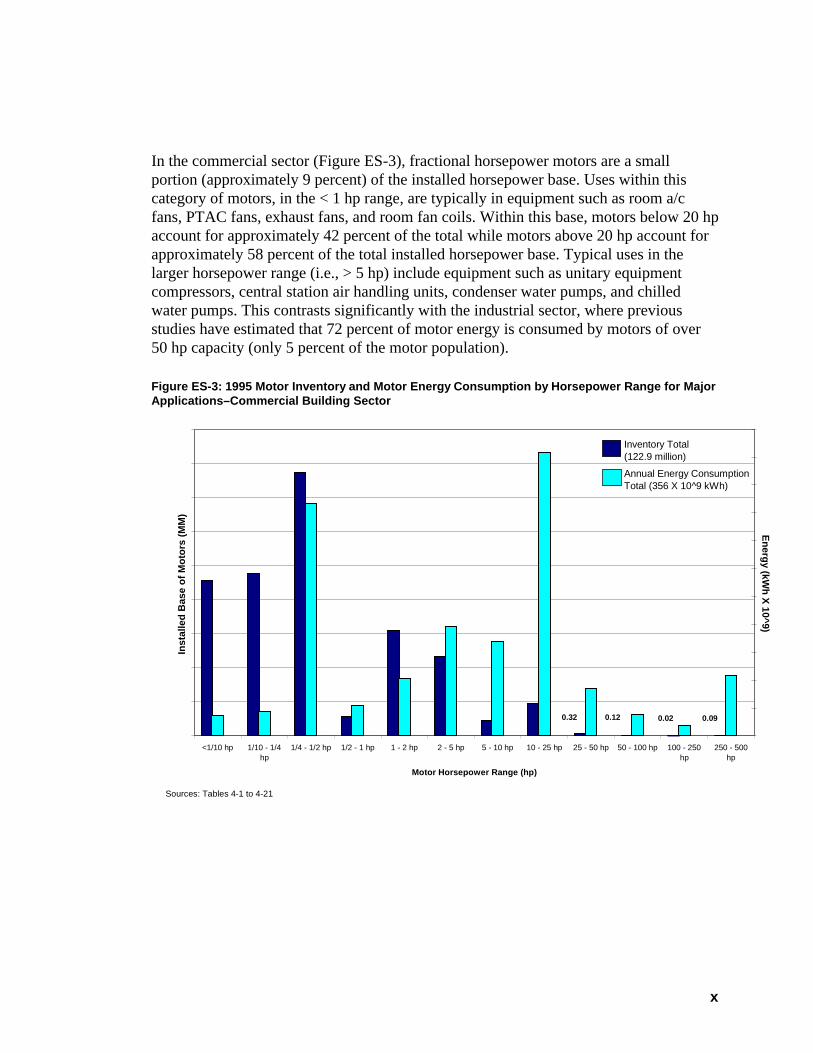
In the commercial sector (Figure ES-3), fractional horsepower motors are a smallportion (approximately 9 percent) of the installed horsepower base. Uses within thiscategory of motors, in the < 1 hp range, are typically in equipment such as room a/cfans, PTAC fans, exhaust fans, and room fan coils. Within this base, motors below 20 hpaccount for approximately 42 percent of the total while motors above 20 hp account forapproximately 58 percent of the total installed horsepower base. Typical uses in thelarger horsepower range (i.e., > 5 hp) include equipment such as unitary equipmentcompressors, central station air handling units, condenser water pumps, and chilledwater pumps. This contrasts significantly with the industrial sector, where previousstudies have estimated that 72 percent of motor energy is consumed by motors of over50 hp capacity (only 5 percent of the motor population).
Figure ES-3: 1995 Motor Inventory and Motor Energy Consumption by Horsepower Range for MajorApplications–Commercial Building Sector
<1/10 hp 1/10 - 1/4hp
1/4 - 1/2 hp 1/2 - 1 hp 1 - 2 hp 2 - 5 hp 5 - 10 hp 10 - 25 hp 25 - 50 hp 50 - 100 hp 100 - 250hp
250 - 500hp
Motor Horsepower Range (hp)
Inst
alle
d B
ase
of M
otor
s (M
M)
Energy (kW
h X 10^9)
0.090.32 0.020.12
Sources: Tables 4-1 to 4-21
Inventory Total(122.9 million)
Annual Energy ConsumptionTotal (356 X 10^9 kWh)
xi
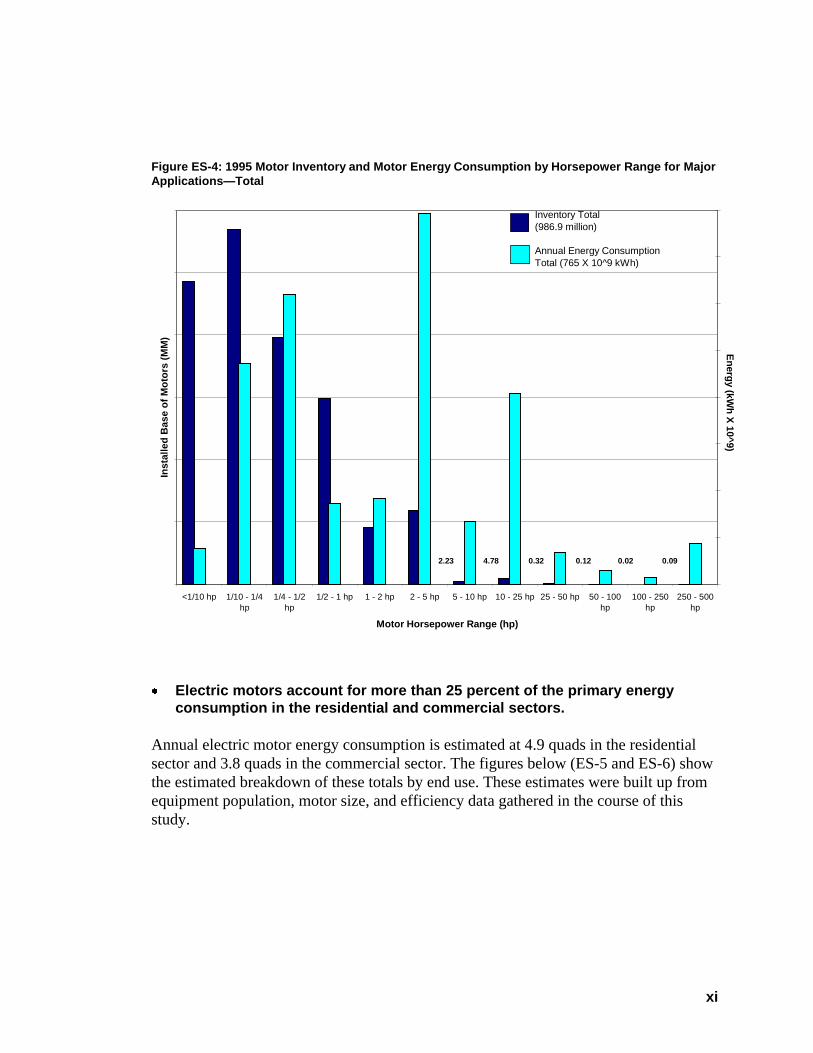
Figure ES-4: 1995 Motor Inventory and Motor Energy Consumption by Horsepower Range for MajorApplications—Total
<1/10 hp 1/10 - 1/4hp
1/4 - 1/2hp
1/2 - 1 hp 1 - 2 hp 2 - 5 hp 5 - 10 hp 10 - 25 hp 25 - 50 hp 50 - 100hp
100 - 250hp
250 - 500hp
Motor Horsepower Range (hp)
Inst
alle
d B
ase
of M
otor
s (M
M) E
nergy (kWh X
10^9)
Inventory Total(986.9 million)
Annual Energy ConsumptionTotal (765 X 10^9 kWh)
2.23 4.78 0.090.32 0.020.12
· Electric motors account for more than 25 percent of the primary energyconsumption in the residential and commercial sectors.
Annual electric motor energy consumption is estimated at 4.9 quads in the residentialsector and 3.8 quads in the commercial sector. The figures below (ES-5 and ES-6) showthe estimated breakdown of these totals by end use. These estimates were built up fromequipment population, motor size, and efficiency data gathered in the course of thisstudy.
xii
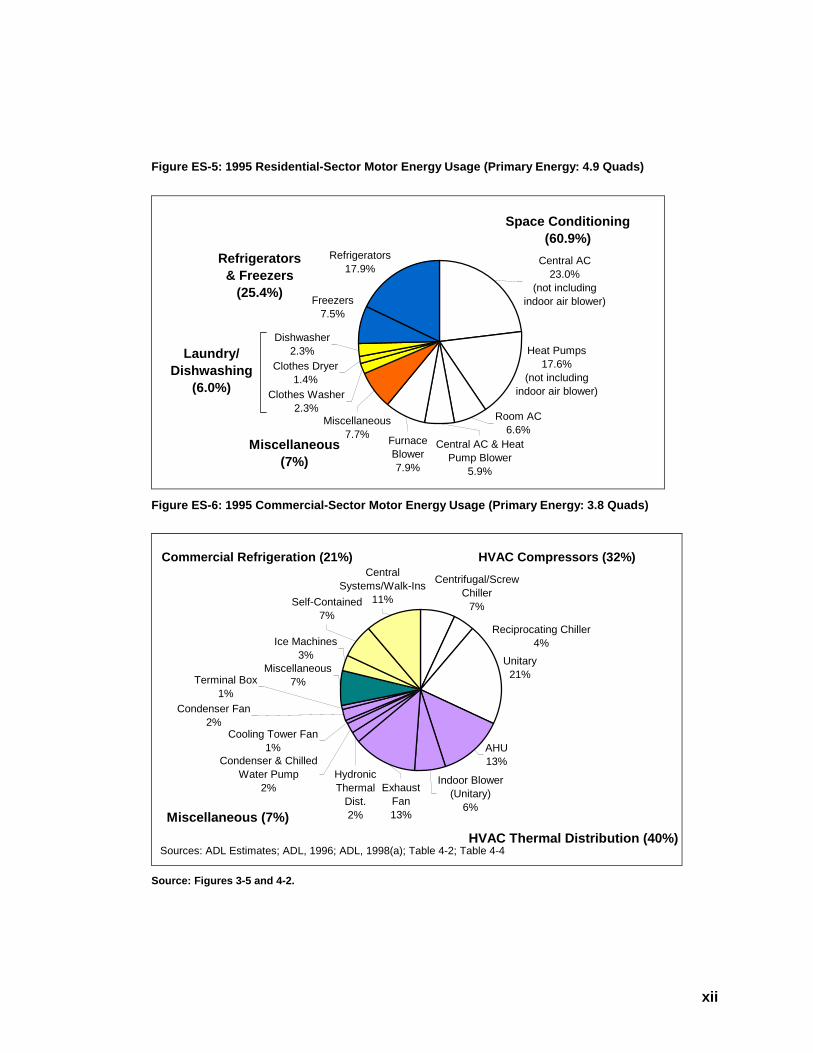
Figure ES-5: 1995 Residential-Sector Motor Energy Usage (Primary Energy: 4.9 Quads)
Central AC23.0%
(not including indoor air blower)
Refrigerators17.9%
Heat Pumps17.6%
(not including indoor air blower)
Room AC6.6%
Central AC & Heat Pump Blower
5.9%
Furnace Blower7.9%
Miscellaneous7.7%
Clothes Washer2.3%
Clothes Dryer1.4%
Dishwasher2.3%
Freezers7.5%
Space Conditioning(60.9%)
Refrigerators & Freezers
(25.4%)
Laundry/ Dishwashing
(6.0%)
Miscellaneous (7%)
Figure ES-6: 1995 Commercial-Sector Motor Energy Usage (Primary Energy: 3.8 Quads)
Central Systems/Walk-Ins
11%
AHU13%
Unitary21%
Reciprocating Chiller4%
Centrifugal/Screw Chiller
7%
Indoor Blower (Unitary)
6%
Exhaust Fan13%
Hydronic Thermal
Dist.2%
Condenser & Chilled Water Pump
2%
Miscellaneous7%Terminal Box
1%Condenser Fan
2%
Ice Machines3%
Cooling Tower Fan1%
Self-Contained7%
Commercial Refrigeration (21%)
HVAC Thermal Distribution (40%)
HVAC Compressors (32%)
Sources: ADL Estimates; ADL, 1996; ADL, 1998(a); Table 4-2; Table 4-4
Miscellaneous (7%)
Source: Figures 3-5 and 4-2.
xiii
In the residential sector, heating, ventilating, and air conditioning (HVAC) applicationsdominate�accounting for almost 61 percent of motor energy use. Refrigerator andfreezer motor energy comprises one-quarter of the energy use. Smaller residential usesof motor energy (kitchen and laundry appliances) and so-called “miscellaneous” uses arealso captured in this study.
Electric motor applications consume more than 25 percent of the commercial-sectorprimary energy and approximately 36 percent of the commercial-sector primary electricenergy. On-site electric energy consumption of commercial-sector electric motors in1995 was approximately 345 billion kWh; the corresponding primary energyconsumption being 3.8 quads.
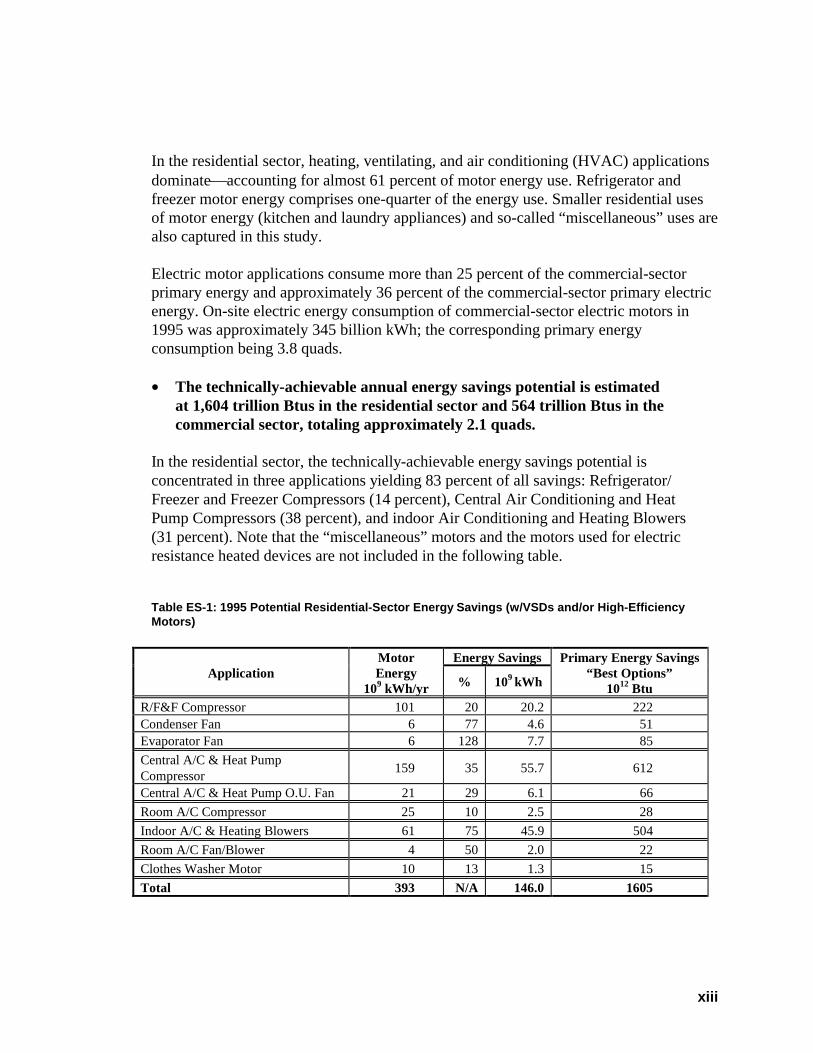
� The technically-achievable annual energy savings potential is estimatedat 1,604 trillion Btus in the residential sector and 564 trillion Btus in thecommercial sector, totaling approximately 2.1 quads.
In the residential sector, the technically-achievable energy savings potential isconcentrated in three applications yielding 83 percent of all savings: Refrigerator/Freezer and Freezer Compressors (14 percent), Central Air Conditioning and HeatPump Compressors (38 percent), and indoor Air Conditioning and Heating Blowers(31 percent). Note that the “miscellaneous” motors and the motors used for electricresistance heated devices are not included in the following table.
Table ES-1: 1995 Potential Residential-Sector Energy Savings (w/VSDs and/or High-EfficiencyMotors)
Energy SavingsApplication
MotorEnergy
109 kWh/yr % 109 kWh
Primary Energy Savings“Best Options”
1012 BtuR/F&F Compressor 101 20 20.2 222Condenser Fan 6 77 4.6 51Evaporator Fan 6 128 7.7 85
Central A/C & Heat PumpCompressor
159 35 55.7 612
Central A/C & Heat Pump O.U. Fan 21 29 6.1 66
Room A/C Compressor 25 10 2.5 28
Indoor A/C & Heating Blowers 61 75 45.9 504
Room A/C Fan/Blower 4 50 2.0 22
Clothes Washer Motor 10 13 1.3 15
Total 393 N/A 146.0 1605

xiv
In the commercial sector, the technically achievable energy savings potential isconcentrated in four applications yielding approximately 88 percent of all savings:Thermal Distribution—Air Distribution (46 percent), Commercial Refrigeration—Self-Contained Unitary (20 percent), Commercial Refrigeration—Central Systems/Walk Ins(12 percent) and HVAC Compressors—Unitary (10 percent).
Table ES-2: 1995 Potential Commercial-Sector Energy Savings (w/VSDs and/or High-EfficiencyMotors)
Energy SavingsApplication
MotorEnergy
109 kWh/yr % 109 kWh
Primary Energy Savings“Best Options”
1012 Btu
Thermal DistributionHot/Chilled Water 9.1 22 2.0 22Cooling Water 2.4 42 1.0 11Air Distribution 115.4 20 22.8 250.9Heat Rejection 8.1 12 1.0 11
HVAC CompressorsUnitary 75.2 7 5.1 55.1Reciprocating Chillers 13.2 6 0.8 8.8Screw/Centrif. Chillers 25.2 4 1.0 11.0
Commercial RefrigerationCentral Systems/Walk-ins1 36.5 14 6.4 70.3Self Contained Unitary2 23.4 36 10.2 112.2Ice Machines 9.2 12 1.1 12.1
Total 3433 15 51.4 564
� Total potential savings for measures with a five-year or shorter payback isestimated at 1.1 quads per year.
Although this technically-achievable potential is useful as a bound on possible savings,a helpful measure of potential savings in the nearer term is the total energy savings formotor energy conservation measures having an estimated simple payback of five yearsor less. As shown in the figure below, when these figures are provided, the savingspotentials for the two sectors appear more balanced.
1 Includes “Small Grocery” and “Supermarket” from Table 4-12.2 Contains all applications under “Self-Contained” equipment type in Table 4-12 including “Vending Machines”.3 25.4 x 10⁹ kWh/yr motor energy consumption is included from the “Miscellaneous” category of Figure 4-2.

xv
Figure ES-7: Energy Savings for Measures With Payback of Five Years or Less (1995)
Total Potential Savings of 1.1 Quads/Year
Commercial - HVAC Compressor
Savings3%
Commercial - Thermal Distribution
Savings26%
Commercial - Refrigeration
Savings18%
Residential - Space Conditioning
Savings53%
Total Commercial Savings526.5 TBtu
Total Residential Savings588.6 TBtu
Assumptions: As documented in Sections 3 and 4, with an estimate of 85 percent of space conditioning thermal distributionsavings (Section 4.2.2) through variable-speed drives being of 5 years payback or less.Sources: Tables 3-5, 3-6, 4-2 through 4-21, Figure 4-7
� Motor energy savings from the application of variable-speed drives, on amotor-by-motor comparison, often exceed savings from higher-efficiencymotors.
New motor technologies, powerful in their versatility, are available in large part due tothe decreasing cost and growing sophistication of electronics for motor drive systems,including variable-speed drives (VSDs). Also, higher-efficiency motors are availableusing technology that has long been commercially available but at higher first costs.Thus, two paths exist to improve the efficiency of motor use:� Use of higher-efficiency induction motors or higher-efficiency motors of other
configurations� Use of motors (of any configuration) using multiple speeds or variable-speed drives
to achieve higher efficiency and other benefits
In the residential sector, variable-speed technology doubles the motor energy savingsfrom 23 x 109 kWh/year to 46 x 109 kWh/year, as shown in the following table.Application of the most appropriate measure for each motor technology increases thetotal five-year payback savings to 54 x 109 kWh/year.

xvi
Table ES-3: Energy Savings From More-Efficient Motors and Variable-Speed Motors ¾¾1995(109kWh/yr)
RESIDENTIAL Efficient MotorSavings
Variable-Speed MotorSavings
Combined “BestOptions” Motor
SavingsEnergy Consumption 389 350 389Technical Potential 45 126 146Five-Year Payback 23 46 54
COMMERCIAL Efficient MotorSavings
Variable-Speed MotorSavings
Combined “BestOptions” Motor
SavingsEnergy Consumption 343 343 343Technical Potential 42 32 51Five-Year Payback 40 32 48
Sources: Tables 3-5, 3-6, 4-2 through 4-21, Figure 4-7
In contrast, the commercial sector has a slightly higher savings potential due to high-efficiency motors (42 x 109 kWh/year) versus the savings potential due to variable-speeddrives (32 x 109 kWh/year). One possible reason for this anomaly is the fact that chillermanufacturers are not currently using VSDs on the majority of their compressorequipment. For the most part, load variability in an HVAC system is handled by loadingand unloading the chiller compressor with a load-limiting system. Variable-speed drivesare typically not used on the compressor. It is expected that as the cost of VSDs declinesand their acceptability and dependability increase chiller manufacturers will use themmore often on their equipment.
� The magnitude of energy consumption and potential motor energy savings inresidential and commercial buildings approximate those of the industrialsector.
A recent study prepared for the Department of Energy in support of the Motor ChallengeProgram reported industrial motor energy consumption at 747 billion kWh or 8.2 quadsprimary energy. Based on a detailed analysis of the industrial motor systems inventory,the study estimates that application of all cost-effective system measures (three-yearsimple payback) would yield annual energy savings of 72 to 107 billion kWh (.8 to1.18 quads). These measures include the application of VSD and other processimprovements.

xvii
Figure ES-8: Comparison of Energy Consumption and Savings by Motors in the Buildingand Industrial Sectors
Energy Savings: For industry, motor and system savings with a three-year or less payback. For buildings, motor and VSDmeasures only with a payback of five years or less.
Energy-Saving Technology
From this report it is evident that significant energy-saving opportunities exist in severalareas. Among the most promising:� Variable-speed compressors/variable-speed fans for home refrigerators� Variable-capacity compressors/variable-speed indoor blowers for residential furnace
fans and small commercial air conditioning� Efficient evaporator fans in commercial refrigeration equipment� Variable-speed blowers in commercial space conditioning air-handling equipment� Reduction of parasitic and other losses in commercial building thermal distribution
systems�hydronic circulating pumps, cooling water pumps, and heat rejection fans,as well as conditioned air handling
Market Barriers
Achieving this savings potential will require addressing significant market barriers.The motor and variable-speed drive markets have numerous stakeholders with manydifferent, sometimes conflicting, interests. Interested parties include building occupants,motor and drive manufacturers, OEMs, appliance manufacturers, equipment distributors,trade associations, electric utilities, certification organizations, research centers,government agencies, engineering firms and construction companies. The exact role
0123456789
1 0
E n e rg y C o n s u m p t io n(Q u a d s )
E n e rg y S a v in g s(Q u a d s )
In d u s try
B u ild in g s
1 9 9 5 B a s e Y e a r

xviii
and relative importance of each stakeholder can vary significantly across markets andeven within markets. Similarly the importance and precise nature of market barriersvaries by sector (residential or commercial) and motor application (appliances, HVACequipment, refrigeration, thermal distribution systems). For instance:
� In residential appliances, the primary barrier to the use of incrementally more-expensive, higher-efficiency components is the combined effect of typicalconsumer appliance purchase-decision priorities and the stringentlycompetitive pricing faced by manufacturers, distributors, and retailers.
� In residential applications, variable-speed motors have not yet proven verycost-effective.
� For commercial refrigeration applications, it is useful to distinguish betweenend-users that pay their own energy costs and those who do not. For example,most vending machines are owned by bottling companies who do not payutility bills in the buildings where the units are located. By contrast,supermarkets are responsible for their own energy bills.
� One of the main issues influencing the acceptance of VSDs in the design phaseof commercial building is the lack of trained and experienced consultingengineers with the knowledge necessary to design these systems.
Opportunities
There are many opportunities for energy savings in the residential and commercialsectors using high-efficiency electric motors. Many applications are already promising interms of costs, availability, efficiency, and energy-savings benefits. However, some ofthe more efficient of the identified technologies are commercially available, but lack thecritical production level necessary to be economically viable. Because new technologiesoften involve a relatively high risk-to-reward ratio for manufacturers, market forcesalone may not ensure that these technologies will be available to end-users. In manyareas there is a clear role for DOE. For example, DOE initiatives could include thefollowing:� DOE could provide assistance to private industry, universities, or non-government
agencies that undertake motor research activities, to encourage the development ofnew motor technologies.
� Working with motor manufacturers, DOE could urge OEMs to integrate efficientmotors and VSD technology in their HVAC or refrigeration products.

xix
� BTS could establish a Motor Challenge for Buildings to stimulate informationexchange between residential- and commercial-appliance manufacturers,applications designers, and commercial end-users.
� DOE could endorse training initiatives for small motors and their application, inpartnership with trade associations.
These are but a few of the potential measures open to DOE and motor-efficiencystakeholders. The findings and detailed analysis in this study will be helpful to BTSin its program planning in support of motor manufacturers, equipment manufacturers,distributors, and other participants in the motor industry.

1-1
1 Introduction
1.1 Study Objectives
The objectives of this study are:� To develop a detailed profile of the current stock of motor-driven equipment in
buildings� To characterize and assess the potential opportunities to reduce the energy
consumption of electric motors in the residential and commercial sectors through theuse of high-efficiency motors and, where appropriate, variable-speed motors
1.2 Background
As indicated in Figure 1-1, the residential and commercial sectors accounted for nearly33 quads, or 36 percent, of the total U.S. primary energy consumption in 1995. Electricmotors consume a significant fraction of electricity consumed in the residential andcommercial sectors, as shown in Figure 1-2, accounting for approximately 8.7 quads(primary energy) in these two sectors. Within the past several years, several studies haveexamined the opportunity for saving electric motor input energy (throughout the U.S.economy, including the industrial, residential, and commercial sectors).
Figure 1-1: 1995 Primary Energy Consumption by End-Use Sector
Source: AEO 1998
Commercial16%
Residential20%
Transportation27%
Industrial37%
Total 90.9 Quads
(Primary energy consumption forutility electric energy generationallocated to each end-use sector)

1-2
Figure 1-2: 1995 Residential and Commercial Primary Energy Consumption by On-Site EnergySource
(Primary energy consumption for utility electric energy generation allocated to each end usesector)
Sources: AEO 1998, Electric Motors Consumption from this Report
These studies, which have generally concluded that large energy savings could berealized, include the following:• Electric Motors–Markets, Trends and Applications, EPRI TR-100423, June 1992.• Energy-Efficient Motor Systems–A Handbook on Technology Programs, and
Policy Opportunities, published in 1991 by the American Council for an Energy-Efficient Economy (ACEEE).
• The State of the Art: Drivepower, a Competitek Report published by the RockyMountain Institute, April 1989.
• Technology Assessment: Adjustable-Speed Motors and Motor Drives (Residentialand Commercial Sectors), Lawrence Berkeley Laboratory, LBL-25080, March1988.
These documents provide a useful overview of the overall motor populations and theirenergy usage and describe a wide range of technology options. However, they have thesignificant limitation that the residential and commercial sector motor installed base andcurrent production is not broken down by the application area. Consequently, the energysaving potential based on in-use vs. potential efficiency, power level, annual operatinghours, and the cost-effectiveness of efficiency upgrades cannot be accurately assessed. Itis necessary to quantify the available opportunities for electric energy savings usinghigh-efficiency electric motors and adjustable-speed drives in the residential and
Other Electrical
Loads36%
On-Site Fossil Fuel
37%
Electric Motors27%
Residential Consumption(18.4 Quads)
4.9 Quad
Other Electrical
Loads46%
Electric Motors26%
On-Site Fossil Fuel
28%
Commercial Consumption(14.4 Quads)
3.8 Quad

1-3
commercial sectors. It is also important to assess the installed base and current sales bymajor applications. This would help the Office of Building Equipment (OBE) decide onappropriate action. This study develops estimates of energy use and potential energysavings by motor application in the residential and commercial sectors. It also evaluatesthe cost-effectiveness of the potential energy savings and identifies various motortechnology options. An assessment of present efficiency standards (e.g., NAECA,EPAct, and ASHRAE Std. 90.1) is conducted to determine the long-range effects on theindustry. Market barriers to the use of cost-effective, high-efficiency options are alsoidentified to help formulate programmatic options.
The prior studies have viewed the question of energy savings potential for motors fromthe point of view of the complete system. In addition to the efficiency characteristics ofthe motor, they considered the power quality of the input electricity and the efficiency ofthe driven device or process. This is a valid and useful way to view the energy savingsopportunities. Unfortunately, this increases the scope of the problem from one of motortechnology and performance characteristics to an examination of the technology of awide range of other types of equipment. The OBE has already been systematicallyexamining the energy savings opportunities at the system level for the major residentialand commercial-sector energy consumers. Therefore, the scope of this study is confinedto the opportunities to save energy through motor efficiency improvement only. Thereare two primary dimensions to this examination:
• Substitution of a higher-efficiency, but otherwise identically performing, motor fora lower-efficiency motor currently in use.
• The use of variable-speed drives for varying loads such as pumps and blowers; Thevariable speed can take advantage of the favorable part load speed-output-efficiencycharacteristics (e.g., the third power of speed law for blowers) to force air or liquidsthrough a system of fixed flow resistances.
1.3 Work Plan and Approach
This assessment of the opportunity to improve motor efficiency has three tasks:• Task 1: Basic Data Collection• Task 2: Technology-Improvement Opportunities• Task 3: Market-Penetration Barriers
The first two tasks provide an assessment of the current market situation for residentialand commercial electric motors, examining sales of both conventional and high-efficiency motors and their current prices. Given the low market penetration of somehigh-efficiency options, the cost structure is examined to identify the opportunities for
1-4
reduction of installed cost through the economies of scale associated with massproduction, design modification, or technology development.
The last task describes various barriers to the increase in utilization of high-efficiencyoptions. It examines the hurdles that are present by segmenting the market into smallersubsections. Each subsection has different reasons for not using the high-efficiencyoption. Some are market-driven, others are company-driven. Overall, this task identifiesmany difficulties to overcome if the high-efficiency options are to become prevalentwithin the market.
This report documents the results of the above tasks and provides an overview of theU.S. market for residential and commercial motors, covering both conventionaltechnologies and commercially available high-efficiency options. It focuses onincreasing the use of improved motor technology. It covers many high-efficiency motortechnologies that are currently commercially available, including:• High-efficiency single-phase and three-phase induction motors• Variable-speed drives
- Inverter-driven induction- Electronically commutated permanent magnet rotor DC motors
A basic description of each conventional and high-efficiency technology is providedalong with current sales and cost information. The economic attractiveness of the high-efficiency options is examined for a representative range of electric utility rates; at bothcurrent price and installation cost levels, and estimated mass-production costs.
Task 1: Basic Data CollectionThis task included an application-by-application (“bottom-up”) assessment of motorpopulation and energy consumption, and potential motor-energy savings (whileaccounting for current economic incentives).
Key issues addressed were:
• Characterization of the existing population and current sales distribution, motortypes (e.g., shaded pole, permanent split capacitor), power and efficiency ranges,and duty cycle (annual operating hours) of motors used for major residential- andcommercial-sector end uses.
• Characterization of the energy consumption of the existing motor population.
• Identification of the highest-efficiency motors currently available and the associatedcost premium for the end user; Simple paybacks due to energy cost savings wereestimated for each application.
1-5
• Identification of applications where significant seasonal energy savings could berealized using a variable-speed motor drive.
• Identification of non-commercialized technologies with potential for higherefficiency or lower cost premiums.
• Estimation of the potential national energy savings attainable for each majorresidential/commercial-sector application and identification of the priorityapplications and horsepower size range.
• Identification of applications whose motor efficiency is currently driven or will bedriven in the future by energy-efficiency legislation (e.g., NAECA, EPAct).
In each application with a significant energy savings potential, the margin for efficiencyimprovement of the currently installed base was examined for a normal replacementcycle by upgrading the efficiency level of current production and sales levels. In someinstances, the feasibility of accelerated efficiency upgrades through early retrofit wasalso examined.
Task 2: Technology-Improvement OpportunitiesThe emphasis of this task was on technologies that are in the development or earlycommercial stages. Opportunities were evaluated to improve motor technology byconsidering the potential for efficiency improvement and/or cost reduction. Potentiallyimportant technology areas include developmental motor technologies (e.g., switchedreluctance), early commercial technologies (e.g., permanent magnet rotor, electronicallycommuted DC motors) and adjustable-speed drive electronics technologies, that canreduce cost or improve the overall performance (e.g., vector control). For eachtechnology, the applicable speed and power range was identified and development needswere identified. For each major motor application, the overall energy savings potentialof the best current technologies and new technologies were calculated and summarized.
Task 3: Market-Penetration BarriersThis task identified the barriers to the use of high-efficiency motors and/or motor drivesystems for applications. These barriers can be purely economic, institutional, ortechnological. An example of an economic barrier is an inadequate return or a paybackthat is too long on the additional cost of the high-efficiency motors. With the businessconcentration being on increasing the firm value to the stockholders, any research orequipment purchases must have a quick and attractive turnaround on the moneyinvested. An institutional or corporate barrier exists when there are split responsibilitieswithin an organization for equipment purchase and energy costs. This leads to aconcentration on the first cost of the equipment rather than the first cost and operationof the equipment. The high-efficiency motors are overlooked in favor of low-cost
1-6
alternatives. The final barrier identified is purely technical. There is a need for sensorand control technology to take advantage of VSDS within applications. As thedevelopment of newer and more accurate digital and computer controls commences forthe motor application field, they will create expanded opportunities for VSD use.
2-1
2 Motor Technology Overview
This section provides a brief description of the motor technologies commonly used inthe residential or commercial sectors and of advanced motor technologies that might beapplied to gain efficiency in either sector. While the treatment of each technology maynot be comprehensive, the basic principles of operation and efficiency characteristics arereviewed at length.
2.1 Conventional Motor Technologies
Single-speed induction motors are currently in use in most of the motor applications inthe residential and commercial sectors and constitute a sizeable majority of the motorpopulation. Induction motors are a popular choice for many other miscellaneousapplications as well (with total motor-energy consumption a small part of the sectortotals). Some examples include the use of a brush-type universal AC/DC motor invacuum cleaners, some power hand tools, and other applications requiring a low dutycycle.
An electric motor converts electrical energy into mechanical energy. Consequently, theselection of a motor for a particular application should involve analysis of many factorsrelevant to the particular process. Issues such as starting torque and acceleration, speed,load, duty cycle, service conditions, and power factor may override consideration of asimple efficiency versus initial cost analysis.
2.1.1 Three-Phase Squirrel-Cage Induction Motors
Three-phase squirrel-cage induction motors (SCIMs) are used as the prime mover forthe majority of commercial- (and industrial-) sector motor applications requiring overa few horsepower, and in many smaller motors, as well. They are readily available intwo-, four-, or six-pole configurations (corresponding to speeds of 3,500; 1,750; or1,150 rpm; respectively). Configurations with more pole pairs and slower speeds arealso available. Figure 2-1 illustrates an integral horsepower, three-phase, SCIM in atotally enclosed fan-cooled (TEFC) housing. As may be seen in this illustration, air isdirected over the ribbed exterior of the housing body by a shrouded external cooling fan.
2-2
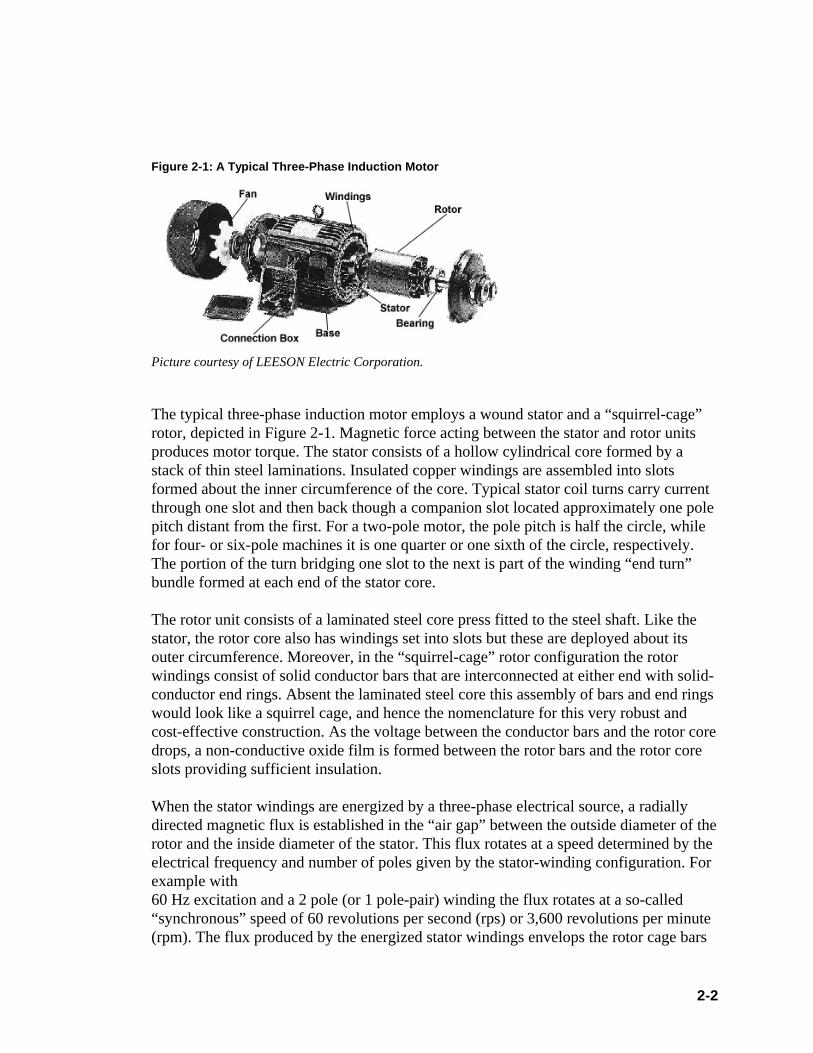
Figure 2-1: A Typical Three-Phase Induction Motor
Picture courtesy of LEESON Electric Corporation.
The typical three-phase induction motor employs a wound stator and a “squirrel-cage”rotor, depicted in Figure 2-1. Magnetic force acting between the stator and rotor unitsproduces motor torque. The stator consists of a hollow cylindrical core formed by astack of thin steel laminations. Insulated copper windings are assembled into slotsformed about the inner circumference of the core. Typical stator coil turns carry currentthrough one slot and then back though a companion slot located approximately one polepitch distant from the first. For a two-pole motor, the pole pitch is half the circle, whilefor four- or six-pole machines it is one quarter or one sixth of the circle, respectively.The portion of the turn bridging one slot to the next is part of the winding “end turn”bundle formed at each end of the stator core.
The rotor unit consists of a laminated steel core press fitted to the steel shaft. Like thestator, the rotor core also has windings set into slots but these are deployed about itsouter circumference. Moreover, in the “squirrel-cage” rotor configuration the rotorwindings consist of solid conductor bars that are interconnected at either end with solid-conductor end rings. Absent the laminated steel core this assembly of bars and end ringswould look like a squirrel cage, and hence the nomenclature for this very robust andcost-effective construction. As the voltage between the conductor bars and the rotor coredrops, a non-conductive oxide film is formed between the rotor bars and the rotor coreslots providing sufficient insulation.
When the stator windings are energized by a three-phase electrical source, a radiallydirected magnetic flux is established in the “air gap” between the outside diameter of therotor and the inside diameter of the stator. This flux rotates at a speed determined by theelectrical frequency and number of poles given by the stator-winding configuration. Forexample with60 Hz excitation and a 2 pole (or 1 pole-pair) winding the flux rotates at a so-called“synchronous” speed of 60 revolutions per second (rps) or 3,600 revolutions per minute(rpm). The flux produced by the energized stator windings envelops the rotor cage bars

2-3
and due to its motion induces current to flow in these conductors. The interaction of therotating stator flux and the rotor bar currents develops motor drive torque.
Important characteristics of the three-phase SCIM are simplicity and ruggedness,inherently high starting torque (without the start-assisting devices required for single-phase motors), and the potential to achieve high-efficiency. The torque-speed-efficiencycurves shown in Figure 2-2 depict important aspects of induction motor performance forseveral power levels. Salient performance characteristics associated with these curvesare as follows:
� At synchronous speed (3,600 rpm/pole-pairs) the torque output is zero. As the drivendevice applies increasing load (torque), the motor speed falls gradually. Slip is thedifference between synchronous speed and actual operating speed, typicallyexpressed as a percentage of the synchronous speed.
� Rated power output generally occurs at 1 to 3 percent slip within limits based on thecontinuous power and heat dissipation level consistent with the motor designtemperature rise limit.
� The maximum torque output, referred to as the breakdown torque, usually occursbetween 10 and 20 percent values of the slip. At this torque level, the motor is highlyoverloaded and cannot sustain operation beyond a few minutes (or less).
� The efficiency peak of larger (e.g., > 1 hp) three-phase induction motors is fairlybroad, so that over a range of 40 to 125 percent of the full load, the motor efficiencyis within a few percentage points of its peak efficiency.
� Generally, the full load efficiency of motors increases as the motor horsepowerrating increases.

2-4
Figure 2-2: Representative Part Load Efficiency Curves for Three-Phase Induction Motors
Reprinted from “Energy Management Guide For Selection and Use of Fixed Frequency Medium ACSquirrel-Cage Polyphase Induction Motors”, NEMA Standards Publication #MG-10, by permission ofthe National Electrical Manufacturers Association.© 1994 by National Electrical Manufacturers Association
The motor design factors that influence efficiency include: 1) the quality of theelectromagnetic steel alloy used in the laminations; 2) the thickness of the laminations(both affecting the magnitude of the hysteresis and eddy-current losses in the steel core)and 3) the cross section size for the copper conductors (affecting electric resistancelosses). One can refer to [Slemon] for an in-depth treatment of motor designconsiderations. In simple terms, to increase the efficiency of a motor at a givenhorsepower rating, additional wire copper and more, and possibly higher grade, steellamination material must be used, with physical limits being reached short of 100percent efficiency. Figure 2-3 is a plot of the full-load efficiency vs. the nominalhorsepower of three-phase, 230/460 volt, 4 pole, 1,750 + rpm, totally enclosed fancooled (TEFC) motors.
2-5
Figure 2-3: Nominal Full-Load Efficiencies for Commercially Available Three-Phase InductionMotors, Compared to EPAct Minimum
60
65
70
75
80
85
90
95
100
1.0 1.5 2.0 3.0 5.0 7.5 10.0 15.0 20.0 25.0 30.0 40.0 50.0 100.0 200.0 400.0
Rated Motor Horsep ower (hp)
Ful
l Loa
d E
ffici
ency
(%
)
Best Commercially Available
EPAct Minimum
Worst Commercially Available
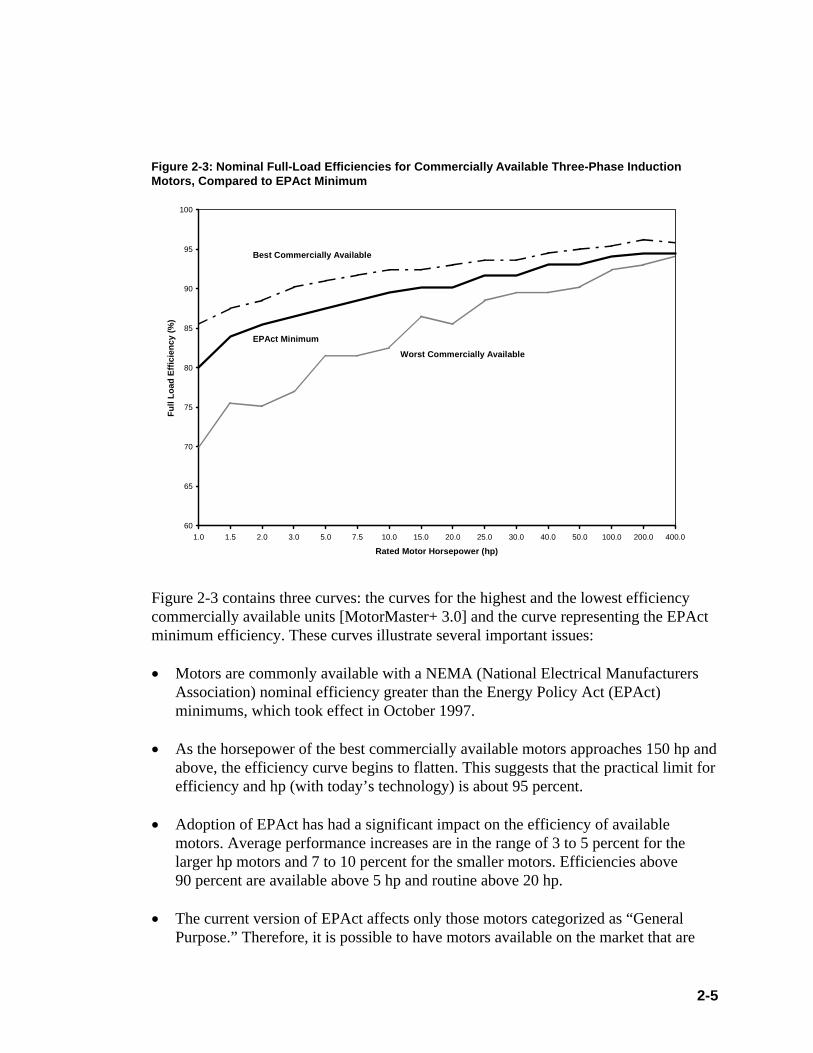
Figure 2-3 contains three curves: the curves for the highest and the lowest efficiencycommercially available units [MotorMaster+ 3.0] and the curve representing the EPActminimum efficiency. These curves illustrate several important issues: � Motors are commonly available with a NEMA (National Electrical Manufacturers
Association) nominal efficiency greater than the Energy Policy Act (EPAct)minimums, which took effect in October 1997.
� As the horsepower of the best commercially available motors approaches 150 hp andabove, the efficiency curve begins to flatten. This suggests that the practical limit forefficiency and hp (with today’s technology) is about 95 percent.
� Adoption of EPAct has had a significant impact on the efficiency of availablemotors. Average performance increases are in the range of 3 to 5 percent for thelarger hp motors and 7 to 10 percent for the smaller motors. Efficiencies above90 percent are available above 5 hp and routine above 20 hp.
� The current version of EPAct affects only those motors categorized as “GeneralPurpose.” Therefore, it is possible to have motors available on the market that are

2-6
below the EPAct minimum, as indicated by the bottom curve. This curve iscomposed of motors classified as “Special Duty.”
Tables 2-1 and 2-2 (for open drip proof and totally enclosed fan-cooled motors,respectively) list the nominal full load efficiency and wholesale prices for a line of“standard” and “premium” efficiency motors. The difference in price and the number offull-load equivalent annual operating hours needed (for one and three year paybackscenarios) are calculated. Figure 2-4 plots the operating hours calculated in Tables 2-1and 2-2 with corresponding polynomial trendlines. The trendline plots indicate that theleast operating hours required for a given payback period occurs between 10 and 100 hp.Below this level, the cost per horsepower is relatively high; above this level, thedifference in efficiency between “standard and premium” is small and the cost perhorsepower tends to increase. Over the 10 to 100 hp range, the incremental cost of thepremium efficiency motor is a good investment, even for applications having onlymodest levels of annual operating hours. However, for replacing an existing standardefficiency motor with a premium efficiency motor, the payback period is 3 to 6 timeslonger and significantly reduces the number of attractive candidates for an “unforced”premium-efficiency motor retrofit.
Table 2-1: Price-Efficiency–Payback Comparison of Standard and High-Efficiency General PurposeThree-Phase Motors (Open Drip-Proof)
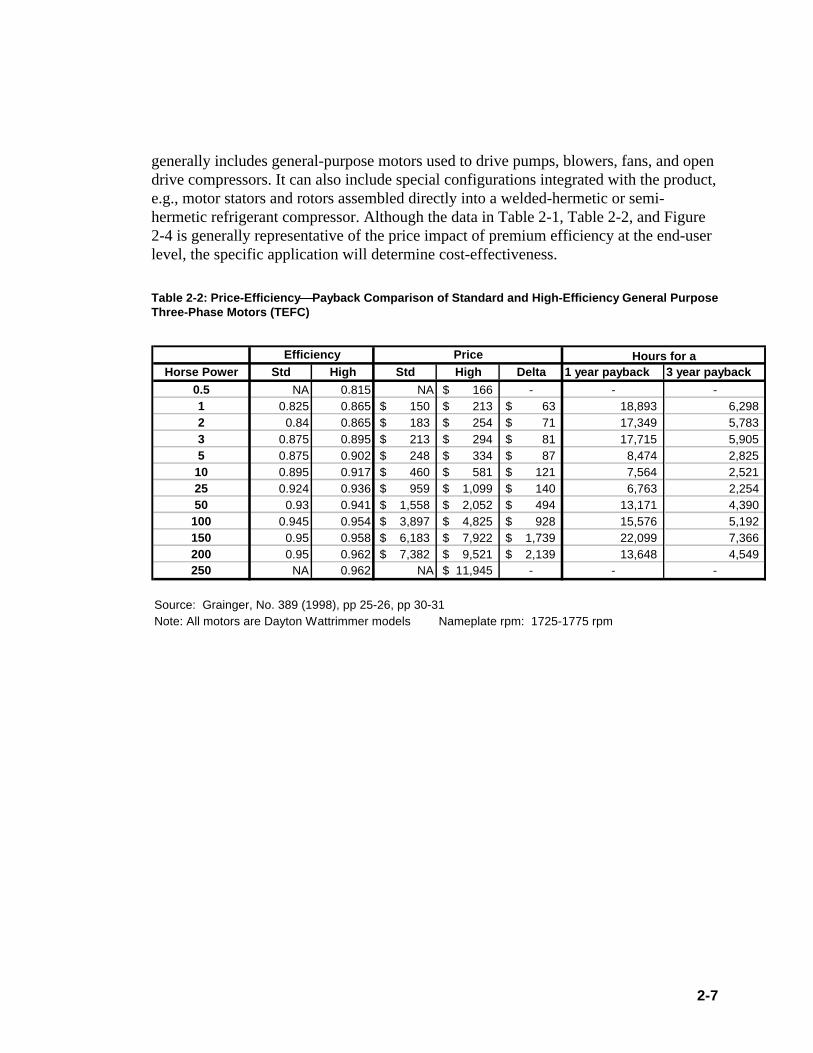
The preceding statement applies directly to general-purpose motors purchased at typicalcommercial wholesale prices, in small quantities. The motors in the commercial sectorthat consume most of the motor energy�refrigerant compressors, air handlers, andrefrigeration or air conditioning auxiliaries�are purchased on an OEM basis. This mix
Efficiency Price Annual Operating Hours for aHorse Power Std High Std High Delta 1 year payback 3 year payback
1 0.825 0.855 145$ 160$ 15$ 5,988 19962 0.84 0.865 169$ 184$ 16$ 3,835 12783 0.865 0.902 186$ 200$ 14$ 1,619 5405 0.875 0.895 207$ 258$ 51$ 6,692 2231
10 0.895 0.917 359$ 452$ 93$ 5,813 193825 0.917 0.941 772$ 852$ 81$ 1,940 64750 0.93 0.945 1,319$ 1,437$ 118$ 2,317 772
100 0.941 0.958 2,444$ 3,268$ 824$ 7,322 2441150 0.95 0.962 4,184$ 5,057$ 873$ 7,427 2476200 0.95 0.962 5,287$ 6,660$ 1,373$ 8,761 2920250 0.954 0.962 7,100$ 10,358$ 3,258$ 25,050 8350
Source: Grainger, No. 389 (1998), p 23, pp 27-28Note: All motors are Dayton Wattrimmer models Nameplate rpm: 1725-1775 rpm
Assumed Cost of Power: $0.08/kWh
2-7
generally includes general-purpose motors used to drive pumps, blowers, fans, and opendrive compressors. It can also include special configurations integrated with the product,e.g., motor stators and rotors assembled directly into a welded-hermetic or semi-hermetic refrigerant compressor. Although the data in Table 2-1, Table 2-2, and Figure2-4 is generally representative of the price impact of premium efficiency at the end-userlevel, the specific application will determine cost-effectiveness.
Table 2-2: Price-Efficiency ¾¾Payback Comparison of Standard and High-Efficiency General PurposeThree-Phase Motors (TEFC)
Efficiency PriceHorse Power Std High Std High Delta 1 year payback 3 year payback
0.5 NA 0.815 NA 166$ - - -1 0.825 0.865 150$ 213$ 63$ 18,893 6,298 2 0.84 0.865 183$ 254$ 71$ 17,349 5,783 3 0.875 0.895 213$ 294$ 81$ 17,715 5,905 5 0.875 0.902 248$ 334$ 87$ 8,474 2,825
10 0.895 0.917 460$ 581$ 121$ 7,564 2,521 25 0.924 0.936 959$ 1,099$ 140$ 6,763 2,254 50 0.93 0.941 1,558$ 2,052$ 494$ 13,171 4,390
100 0.945 0.954 3,897$ 4,825$ 928$ 15,576 5,192 150 0.95 0.958 6,183$ 7,922$ 1,739$ 22,099 7,366 200 0.95 0.962 7,382$ 9,521$ 2,139$ 13,648 4,549 250 NA 0.962 NA 11,945$ - - -
Source: Grainger, No. 389 (1998), pp 25-26, pp 30-31Note: All motors are Dayton Wattrimmer models Nameplate rpm: 1725-1775 rpm
Hours for a

2-8
Figure 2-4: Annual Operating Hours Corresponding to One- and Three-Year Payback for PremiumEfficiency General Purpose Three-Phase Motors
2.1.2 Single-Phase Squirrel-Cage Induction Motors
Single-phase, 60 Hz, alternating current is generally available for all residential andcommercial buildings, typically at voltages of 115 VAC and 208 VAC or 230 VAC.Typically, 115 VAC circuits are used to power motors up to 2 hp and 208/230 VACcircuits power motors up to 5 hp. Larger power outputs are seldom required inresidential applications. As discussed earlier, three-phase power is typically available in commercial buildings to operate motors above 5 hp and many motors whose output is 5 hp or less. The basic principal of operation of a single-phase SCIM is similar to a three-phaseinduction motor. A rotating magnetic field is easily established with three-phase
-
1,000
2,000
3,000
4,000
5,000
6,000
7,000
8,000
9,000
10,000
1 10 100 1000
Nominal Motor Power Rating (hp)
Pay
back
of "
Pre
miu
m E
ffici
ency
" M
inim
um A
nnua
l F
ull L
oad
Ope
ratin
g H
ours
for
1- o
r 3-
Yea
rs
Open Drip-Proof 1-Year Payback Open Drip-Proof 3-Year PaybackTEFC 1-Year Payback TEFC 3-Year PaybackPoly. (TEFC 1-Year Payback) Poly. (Open Drip-Proof 1-Year Payback)Poly. (TEFC 3-Year Payback) Poly. (Open Drip-Proof 3-Year Payback)
Note: The minimum annual full load operating hours required for a 1-year payback for a 1, 2, 3, 50, 100 and 200 hp TEFC 3-phase motor exceeded 8,760 hours (maximum hours in a year).

2-9
excitation of motor windings as described in the preceding subsection. It may be shownthat in a single-phase induction motor two counter-rotating fields are produced whichdevelop equal and opposite rotor torque components when the motor is at standstill.However, if means are provided to urge rotation in one direction or the other, net torquewill be developed to sustain the rotation and drive the attached load. It is of interest tonote that while the electromagnetic torque acting on the rotor of a three-phase motor isrelatively smooth and free from pulsating disturbances this is not the case in the single-phase motor. In this instance, the torque may pulsate from zero to a maximum value attwice the power line frequency—e.g., 120 Hz. In most applications, this is of littleconsequence as the inertia of the motor and the driven load act to smooth out the torquepulsations. Efficiencies of single-phase motors are approximately 10 percent less thanthree-phase units. The basic construction of the single-phase induction motor includes a rotor and stator;each built up of a stack of electromagnetic grade steel laminations as previouslydescribed for the three-phase motor. The “squirrel-cage” rotor has a series of aluminumbars cast lengthwise into the rotor laminations. These bars are connected with ringslocated at each end of the stack. The stator laminations contain a series of slots for thewindings that are aluminum or copper wire. Two sets of windings are provided, at a 90°-phase difference. The “main” or “run” winding operates directly from line current, andstays always energized as long as the motor is running. Single phase motors are categorized according to the way the “start,” “secondary,” or“auxiliary” winding is utilized for starting the motor and then running it at normalspeed. The following are widely used single-phase motor categories: � The Split-Phase or Resistance Start/Induction Run (RSIR) Motor�This
configuration is the lowest cost. The start winding has a higher resistance-to-reactance ratio than the main winding achieved by using a relatively small diameterwire. This reduces both the amount and the cost of the copper in the start windingand the space taken up in the stator slots by this winding.
� The Capacitor Start/Induction Run (CSIR) Motor�This configuration is a low-
efficiency motor that provides higher starting torque than the RSIR motor. � The Permanent Split Capacitor (PSC) Motor�This configuration has a high
potential efficiency, depending on the design. It could take one of two forms:� No start assist beyond the run capacitor, which leads to a weak starting torque� With resistance start assist device�a typical start assist device being a positive
temperature coefficient resistor (PTCR)
2-10
� The Capacitor Start/Capacitor Run (CSCR) Motor�This is an efficient runconfiguration with a large capacitance at start-up providing a large starting torque.The start capacitance is typically three to five times the size of the run capacitor, butcan be packaged compactly because continuous operation (and the resulting heatdissipation) is not a consideration.
RSIR and CSIR motors use the secondary winding for starting only, the capacitor startversion providing higher starting torque. The secondary winding uses a much smallerdiameter wire energized for a limited time without overheating and automaticallydisconnected after start up by a centrifugal switch. The RSIR motor is very low in cost,but is inherently limited to an 8 to 10 percent lower efficiency than PSC motors. In PSCand CSCR motors, the secondary winding continues operating when the motor isrunning. The capacitor in series with this winding shifts the phase of the input voltageapproximately 90°, so the two windings together create a rotating magnetic field. Thebenefits achieved by PSC and CSCR motors are the suppression of torque pulsationsand the improved utilization of both the windings and the iron in the motor. Thesebenefits increase the efficiency and the power factor of the motor, but at an added costassociated with the capacitor. Motor efficiencies are improved by:� Using additional material (increasing the stator and rotor lamination stack length and
increasing the winding conductor cross-section�by using larger diameter wire orincreasing the number of parallel strands comprising a conductor)
� Using low-loss steel for the laminations� Using thinner laminations
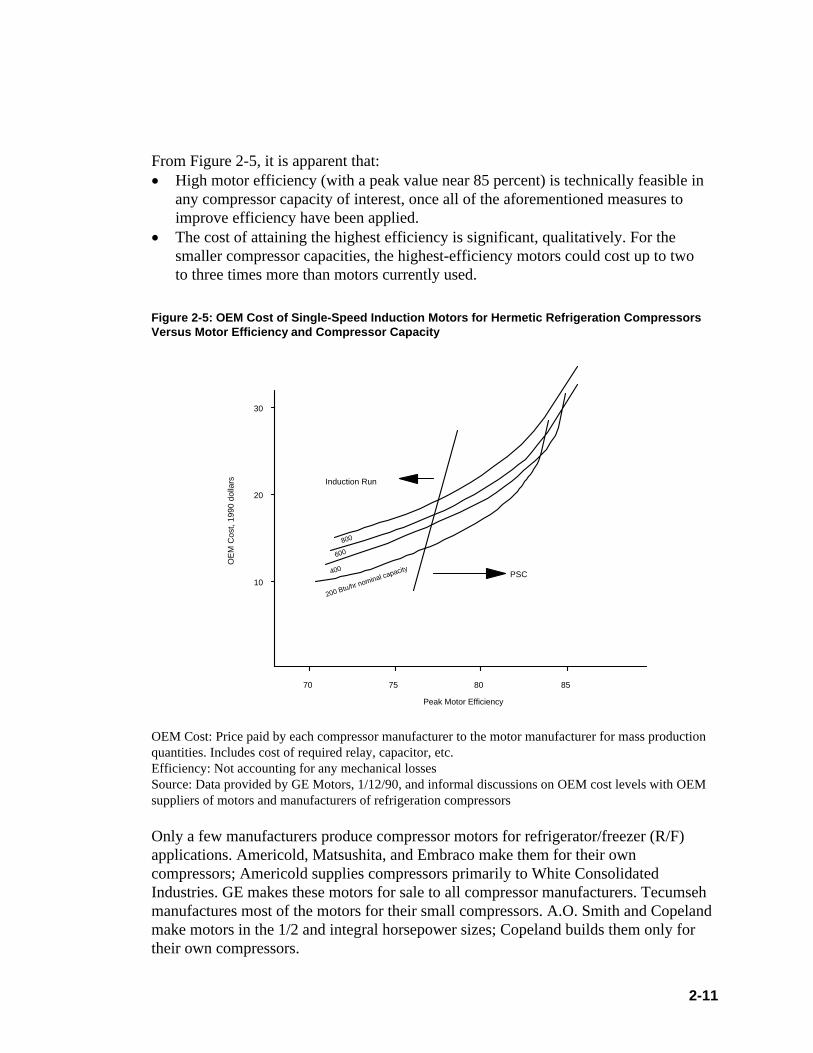
2.1.2.1 Refrigerator Application of the Single-Phase SCIMs The compressors used in domestically produced and marketed domestic refrigeratorsand freezers in the United States are powered using two-pole AC SCIMs that operate onnormal household line power, i.e., 115 VAC, 60 HZ, 1 phase. These motors run atconstant speeds of approximately 3,500 rpm. In addition to running the compressor overthe normal range of loads, the motor must provide an adequate starting torque, sincesmall, single cylinder compressors are difficult to start. Figure 2-5 plots the estimated cost per motor of single-speed induction motors vs.efficiency for motors sized for compressors having nominal capacities between 200 and800 Btu/hr. The costs are based on the OEM price paid to the motor supplier by thecompressor manufacturer for production level quantities of the motors. For the smallermotors, the maximum physically attainable efficiency is lower than that for the largermotors, and consequently, the cost-efficiency curves cross over.
2-11
From Figure 2-5, it is apparent that:� High motor efficiency (with a peak value near 85 percent) is technically feasible in
any compressor capacity of interest, once all of the aforementioned measures toimprove efficiency have been applied.
� The cost of attaining the highest efficiency is significant, qualitatively. For thesmaller compressor capacities, the highest-efficiency motors could cost up to twoto three times more than motors currently used.
Figure 2-5: OEM Cost of Single-Speed Induction Motors for Hermetic Refrigeration CompressorsVersus Motor Efficiency and Compressor Capacity
70 75 80 85
10
20
30
OE
M C
ost,
1990
dol
lars
Peak Motor Efficiency
PSC
200 Btu/hr nominal capacity400
600
800
Induction Run
OEM Cost: Price paid by each compressor manufacturer to the motor manufacturer for mass productionquantities. Includes cost of required relay, capacitor, etc. Efficiency: Not accounting for any mechanical losses Source: Data provided by GE Motors, 1/12/90, and informal discussions on OEM cost levels with OEMsuppliers of motors and manufacturers of refrigeration compressors
Only a few manufacturers produce compressor motors for refrigerator/freezer (R/F)applications. Americold, Matsushita, and Embraco make them for their owncompressors; Americold supplies compressors primarily to White ConsolidatedIndustries. GE makes these motors for sale to all compressor manufacturers. Tecumsehmanufactures most of the motors for their small compressors. A.O. Smith and Copelandmake motors in the 1/2 and integral horsepower sizes; Copeland builds them only fortheir own compressors.

2-12
2.1.3 Shaded-Pole Induction Motors
Shaded-pole induction motors contain a rotor similar to the conventional inductionmotor. The shaded-pole motor has a portion of its main pole area circled by a short-circuited copper ring called a shading ring. Induced currents in the shading coil cause aphase lag between the flux in the shaded portion of the pole and the flux in the non-shaded area, producing a rotating field which enables starting. These motors aretypically used in fractional horsepower sizes, primarily in very small (< 1/10 hp) sizesand have a particularly poor efficiency (10 to 35 percent). Major appliance applicationsinclude refrigerator fans and air conditioning condenser fans. Other applications includewindow fans as well as myriad other applications. In residential-sector applianceapplications (discussed in Section 3.1), the implementation of NAECA standards hasmotivated the replacement of shaded-pole motors with higher-efficiency PSC motors orwith electronically commutated permanent magnet motors, discussed in Section 2.2.2.
Figure 2-6: Shaded-Pole Motor
2.1.4 Universal AC/DC Motors
A universal AC/DC motor is essentially a brush type DC motor with a wound fieldand a wound armature. They are commonly used for application speeds higher than3,500 rpm (2-pole induction motor speed). The major application is for vacuum cleanerblowers, which generally operate between 15,000 and 20,000 rpm. Other applicationsinclude power hand tools, where motor speeds greater than 3,500 rpm are needed ordesirable due to the increased power density. Note that universal AC/DC motors requireno auxiliary windings, capacitors, or relays to control them. High-efficiency brushless DC motors could also provide the high speeds required inthese applications, but only at a significantly increased motor cost as well as additional

2-13
cost for the power electronic circuitry required for their operation. Brush-type permanentmagnet motors are a better choice for battery powered cordless power tools. Like theuniversal motor, these motors offer high speed and high power densities in aninexpensive package. The peak efficiency of brush-type permanent magnet motors tendsto be in the 60 to 70 percent range. The duty cycle of universal motor driven appliances tends to be low. They account foran insignificant fraction of motor energy consumption in both the residential andcommercial sector.
2.1.5 Two-Speed Motors
Two-speed induction motors provide a method for potentially improving refrigeration,air conditioning/heat pump, and air-distribution system performance. The performanceincreases because frequent on/off cycles at full power can be replaced with long periodsof half-speed operation, which leads to reduced evaporator and condenser coil loading.There are two basic designs used to achieve two-speed motor operation; the firstemploys a so-called consequent pole winding and the other provides the motor withseparate sets of two-pole and four-pole windings. The consequent pole arrangement issimpler, more compact, and has a lower cost, but also has an inherently lower half-speedefficiency for a fractional horsepower motor. As an example, the performance and cost characteristics of a two-speed motor used foran 800 Btu/hr refrigerator/freezer compressor and efficiency-optimized for low speedare:� 80 percent efficiency at full-speed� 70 percent efficiency at half-speed� Cost close to that for a maximum efficiency single-speed motor (Figure 2-5,
Table 2-3) These efficiency values represent the estimated highest levels attainable for this type ofmotor, with an output needed to operate an 800 Btu/hr compressor. There are no two-speed motors currently in production for this application. Cost and efficiency estimatesare based on presales preliminary design studies of a major supplier, and are subject toconsiderably more uncertainty than the corresponding cost-efficiency curves in Figure2-5 for single-speed motors. Two-speed motors are not available from many U.S. motor manufacturers in the abovesize range. The technology exists to build two-speed motors, but there is not a largeenough market for them now. Fans and pumps in integral horsepower sizes typically usetwo-speed motors. Some residential central air conditioning applications in the

2-14
1.5 to 5 hp range and larger use two-speed compressors, including Bristol (produces thetwo-speed compressor), Copeland (produces the two-speed compressor), Lennox,Goodman (Janitrol), and Carrier. 2.2 Variable-Speed Drive and Motor Technologies Electronically variable speed drives (VSDs) allow motors to operate over a continuouslyvariable speed range, and the maximum speed is not limited to 3,500–3,600 rpm limitfor a two-pole, 60 Hz induction motor. The variable-speed drive is an electronic unit thatconverts fixed frequency�fixed voltage input power to adjustable voltage andfrequency output power, which enables the associated motor to run at a variable speed.VSDs are designed to accommodate various input power formats—e.g., 115 VAC, 60Hz, single phase or 208, 230 or 460 VAC, three-phase. In the context of refrigeration,air conditioning/heat pump, and air distribution applications, potential benefits ofvariable-speed motor capability include the following:� Continuous and close load following to achieve minimal deviation from temperature
set point� Rapid ramp up from a temperature set-back or ramp-down to a set-back� Reduced heat exchanger loading enabling use of smaller, lower-cost units� Attainment of motor speeds greater than 3,600 rpm, thereby allowing reduced
equipment size and cost� Reduced on/off cycling losses� Reduced average air and fluid moving power Variable-speed drives are either being commercially produced, or are currently underdevelopment, for the following motor categories potentially applicable to residential orcommercial equipment:� Three-phase SCIMs� Electronically commutated permanent magnet rotor motors (ECPMs)� Switched reluctance motors (SRMs) The basic electronic hardware configuration of variable-speed drives used to operateeach of these motor classes is very similar. Figure 2-7 is a simplified block diagramdepicting the generic functions of a typical variable-speed drive for any motor type.After passing through an EMI filter (to minimize coupling of internally generated radiofrequency noise to the input AC line), the input AC is rectified and filtered to DC form.Output power transistors (typically “Insulated Gate Bipolar Transistors,” or IGBTs)modulate the DC power by switching ON and OFF with controlled frequency and dutycycle. This modulation provides the motor windings with an excitation waveformappropriate for the particular type of motor. In general, to drive any of the three motor

2-15
types over a wide speed range requires varying the motor input voltage and frequency ina coordinated fashion.
Figure 2-7: “Generic” VSD Block Diagram
EMI Filter RectifierTransistor/
Diode
Power
Bridge
ControlCircuits (1-2% Loss)
Motor
(2% Loss) (Minimum 2% Loss)
115 VAC115VAC
FilterCapacitor
DC
Source: GE Motors, 1990; Toshiba (a), (b); Lloyd, 1982
Modulation of the DC supply power for induction motors produces an output voltagehaving a sinusoidal waveform. SRMs and typical ECPMs are excited by quasi-rectangular voltage waveforms while high performance ECPMs used in industrial servoapplications may require sinusoidal excitation. The use of a pulse width modulation(PWM) technique produces this voltage modulation. Figure 2-8 illustrates the operationof PWM to vary the amplitude of a quasi-rectangular input voltage to an ECPM or SRMduring a typical half cycle of the excitation waveform. The output transistors areswitched ON and OFF at a much higher frequency than that of the required windingexcitation waveform. The output voltage applied to the winding is varied from 0 to theDC supply voltage by changing the length of the ON time of the output transistors fromzero to the full period of the high frequency PWM square wave. The inductance of themotor winding stores energy in excess of the average DC voltage during the pulse ONtime, and releases the energy during the pulse OFF time to maintain a continuouscurrent flow. During the OFF period of the high frequency PWM square wave, thewinding current is carried by “freewheeling” diodes which bypass the power transistors.
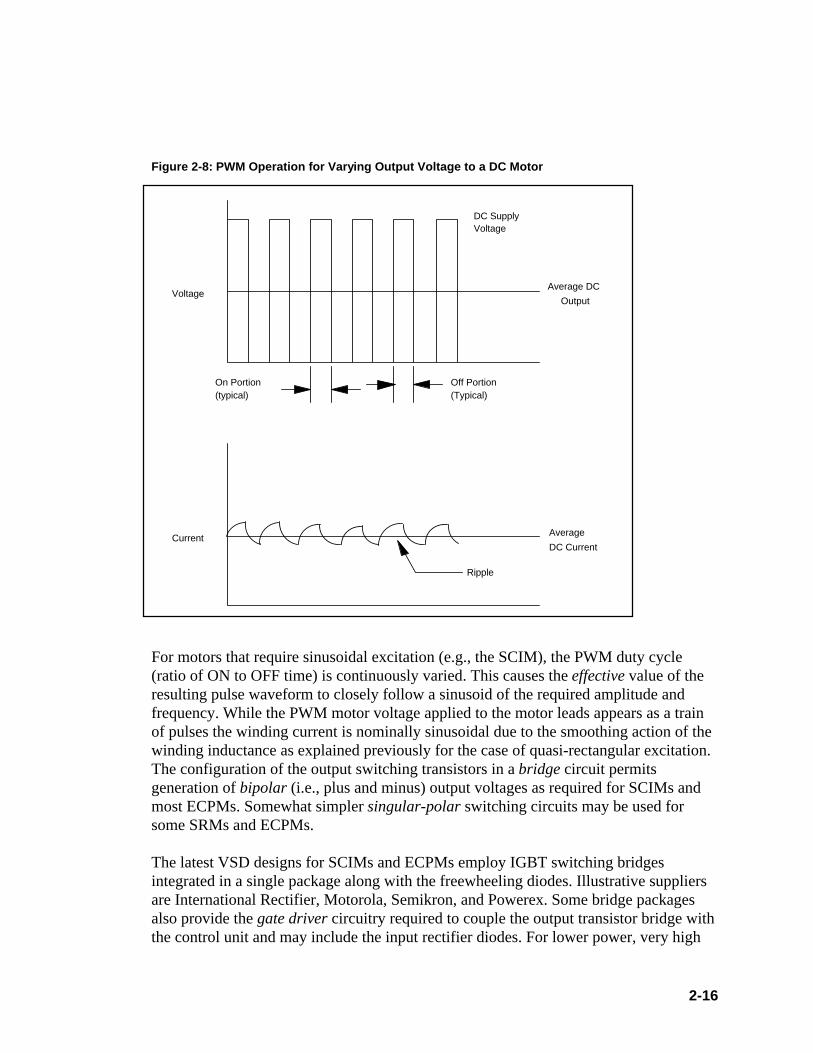
2-16
Figure 2-8: PWM Operation for Varying Output Voltage to a DC Motor
Off Portion(Typical)
On Portion(typical)
VoltageAverage DC
Output
DC SupplyVoltage
CurrentAverage
DC Current
Ripple
For motors that require sinusoidal excitation (e.g., the SCIM), the PWM duty cycle(ratio of ON to OFF time) is continuously varied. This causes the effective value of theresulting pulse waveform to closely follow a sinusoid of the required amplitude andfrequency. While the PWM motor voltage applied to the motor leads appears as a trainof pulses the winding current is nominally sinusoidal due to the smoothing action of thewinding inductance as explained previously for the case of quasi-rectangular excitation.The configuration of the output switching transistors in a bridge circuit permitsgeneration of bipolar (i.e., plus and minus) output voltages as required for SCIMs andmost ECPMs. Somewhat simpler singular-polar switching circuits may be used forsome SRMs and ECPMs. The latest VSD designs for SCIMs and ECPMs employ IGBT switching bridgesintegrated in a single package along with the freewheeling diodes. Illustrative suppliersare International Rectifier, Motorola, Semikron, and Powerex. Some bridge packagesalso provide the gate driver circuitry required to couple the output transistor bridge withthe control unit and may include the input rectifier diodes. For lower power, very high
2-17
volume requirements (e.g., fan motors) control circuitry may also be integrated with thebridge and gate driver package as a one chip “solution.” Highly integrated IGBT bridgeand driver packages are available even at 100 hp and higher levels from suppliers suchas Semikron and Powerex. Some units include built in protection circuitry as well ascurrent and voltage sensors. While SRMs are beginning to find high-volume appliance applications, such as theEmerson Electric motor for the new front loading Maytag washing machine, multi-IGBT packages optimally configured for SRMs are not being advertised in the tradeliterature at this time. However, vendors may be supplying these on an OEM basis.Hewlett Packard computer plotters use “application-specific integrated circuit” (ASIC)drivers for relatively small SRMs. Control of the power transistor switching bridge is now being implemented almostexclusively by digital means. The high speed processing capabilities of digital signalprocessors (DSP) widely used for communications applications are being used forhighly cost-effective implementation of sophisticated motor control policies whichavoid the need for feedback sensors and minimize motor cost. DSP control will alsopermit cost-effective implementation of actively controlled input rectifier circuits whichcan reduce input current harmonic distortion–a matter of growing concern as the use ofvariable-speed drives becomes more wide spread. Analog Devices and TexasInstruments for example have introduced low cost DSPs with on-board PWM outputcircuits that specifically target high volume, embedded motor drive applications such asdomestic appliances. Analog Devices’ motor control DSPs also feature on-chip multi-channel analog-to-digital (A/D) converters to further reduce the cost of assembling anembedded motor controller. In cost sensitive embedded motor drive applications theDSP may also support system control functions such as fault detection/protection,operator input/output (e.g., set temperature setpoint and report current temperature) orouter loop control (e.g., control of compressor speed according to operating conditionsand setpoint). There is a variety of other techniques for changing motor speeds, such as electrically orelectronically, that are currently in use or under development. Those in use are generallyfor specialized industrial applications, usually at power levels greater than 25 hp. Thethree variable-speed drive/motor combinations covered in this section representtechnologies that have been developed, or are undergoing development for mass marketapplications and have the best potential for low cost production. As the number of variable-speed drives in service increases, regulations are likely tocome about requiring means to suppress power line harmonic currents drawn by theinput rectifier section in addition to higher frequency EMI filtering. This type ofregulation is already in place in Europe for electronic motor drives drawing more than

2-18
200 watts from the AC line. Harmonic current suppression adds components and cost tothe variable-speed drive, and may slightly degrade efficiency. Subsections 2.2.2 to 2.2.4 present brief descriptions of the operating principle of each ofthe different motor types with a variable-speed drive, and also include a brief summaryof the current commercial status for each of the three VSD-motor technologies.
2.2.1 Efficiency Issues and Opportunities With Variable-Speed Drives
The overall efficiency of a variable-speed motor and drive (shaft power output dividedby the AC line electric power input) is the product of the electronic drive efficiency andthe motor efficiency. Electronic efficiencies for the three types of variable-speed driveare nearly identical, because the configuration of the power electronics (EMI filter -rectifier - filter - output transistor/diode bridge) is essentially the same for each. Theefficiency decreases with decreasing output voltage (and motor speed) and, to a lesserextent, with decreased load (torque) and output current. For fractional horsepower motors, the inherent efficiency of the three motor types(three-phase SCIM, ECPM, and SRM) are offset from each other by small increments: � ECPMs have the highest efficiency, approaching a 95 percent level (for the motor
only), because the permanent magnet rotor supplies the field, incurring no electricresistance losses. ECPMs incur only minor ripple loss from PWM operation atintermediate input voltages and speeds.
� SCIMs are approximately five percentage points lower in efficiency than ECPMs.
The PWM waveform causes an additional 3 to 5 percent efficiency degradation at areasonably high PWM frequency (10 kHz) and a 5 to 10 percent degradation at a lowPWM frequency (1 to 2 kHz) due to the higher harmonics of the pulsed waveform.
SRM efficiencies fall in between the other two types, but may require higher qualitysteel core laminations, smaller air gaps and consequently tighter manufacturingtolerances and possibly higher quality bearings. The SRM drive may have requirementsthat are more demanding on the timing of excitation waveforms. Figure 2-9 plots overall motor/drive efficiency vs. motor speed for each of the threebasic motor types (applicable to motors between 1/10 and 1/3 hp output).
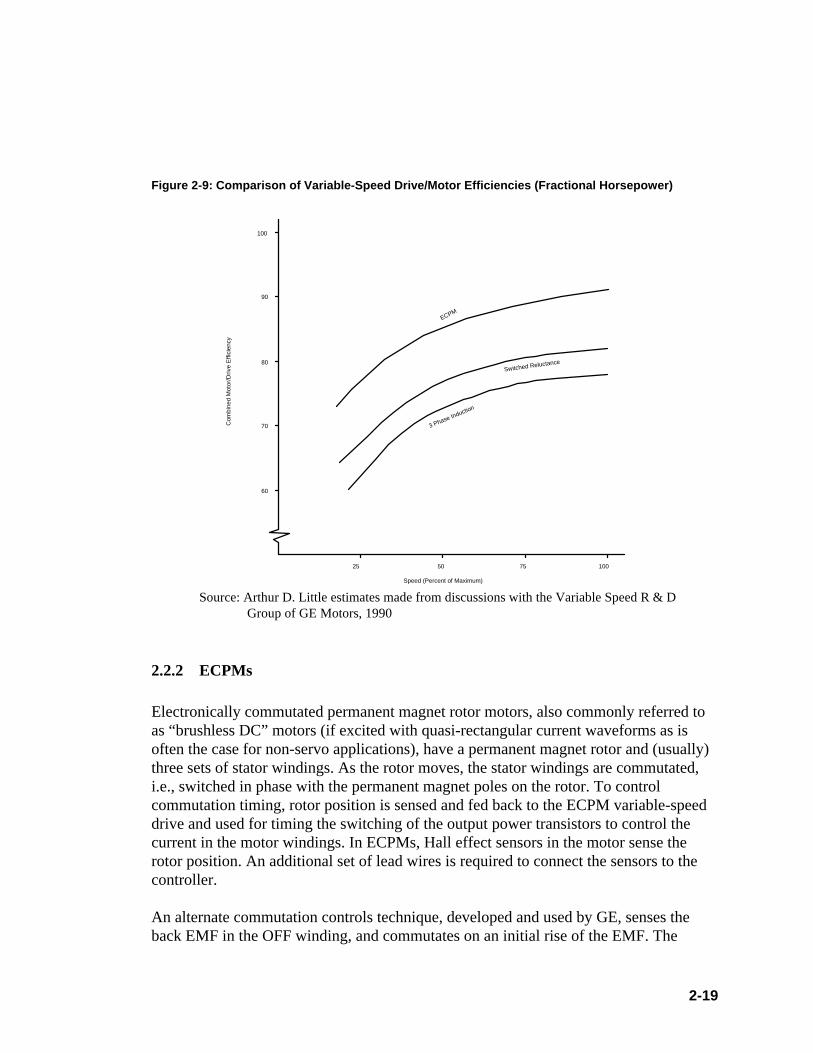
2-19
Figure 2-9: Comparison of Variable-Speed Drive/Motor Efficiencies (Fractional Horsepower)
25 50 75 100
60
70
80
90
100
3 Phase Induction
Switched Reluctance
ECPM
Speed (Percent of Maximum)
Com
bine
d M
otor
/Driv
e E
ffici
ency
Source: Arthur D. Little estimates made from discussions with the Variable Speed R & D Group of GE Motors, 1990
2.2.2 ECPMs
Electronically commutated permanent magnet rotor motors, also commonly referred toas “brushless DC” motors (if excited with quasi-rectangular current waveforms as isoften the case for non-servo applications), have a permanent magnet rotor and (usually)three sets of stator windings. As the rotor moves, the stator windings are commutated,i.e., switched in phase with the permanent magnet poles on the rotor. To controlcommutation timing, rotor position is sensed and fed back to the ECPM variable-speeddrive and used for timing the switching of the output power transistors to control thecurrent in the motor windings. In ECPMs, Hall effect sensors in the motor sense therotor position. An additional set of lead wires is required to connect the sensors to thecontroller. An alternate commutation controls technique, developed and used by GE, senses theback EMF in the OFF winding, and commutates on an initial rise of the EMF. The

2-20
advantages of this technique are twofold. First, they include the obvious cost savingsassociated with eliminating Hall effect sensors and lead wires. Second, for hermeticcompressors, the reduction in the number of wires to three power conductors that mustpenetrate the hermetic shell of the compressor reduces cost and improves reliability. Theeconomic and reliability advantages of a “sensorless” VSD have motivated thecontinuous improvement of this technology by many university investigators andmanufacturers for ECPM, SCIM, and SRM applications. Moreover, the recentavailability of low-cost VSD-specific DSP chips by Analog Devices, Texas Instrumentsand others has facilitated cost-effective implementation of ever more sophisticated andcapable sensorless control algorithms. The basic operational characteristic of the ECPM is similar to a conventional brush-typepermanent magnet DC motor (speed proportional to the DC supply voltage, and torqueproportional to the current). To provide for variable-speed operation, the ECPMcontroller must vary the effective DC supply voltage to the motor, as well as providingfor correctly timed commutation. Pulse width modulation is a cost-effective andefficient means of varying the DC voltage supplied to the motor (Figure 2-8), becausethe high speed PWM switching is accomplished by the same output transistors used forcommutation. The effect of the high speed PWM switching on the motor is a low-levelripple in the DC voltage and current to the motor. This results in a modest increase injoule heating (I2R) losses in the stator windings, decreasing the motor efficiency byabout one percent. The high efficiency of ECPMs is due to two basic attributes of the motor:� The permanent magnet rotor supplies the field, requiring no input power, unlike the
induction motors and wound field type DC motors.� The placement of the windings on the stator allows room for more winding wire
cross section, and the consequent achievement of a lower I2R copper loss than in atypical brush type DC motor.
Permanent magnet materials widely used for ECPM rotors include:� Ferrite� Neodymium-Iron-Boron (NdFeB)
Ferrite magnets are relatively low in magnetic field strength and cost. NdFeB magnetsprovide much stronger fields, allowing more power output for a given motor frame sizeand efficiency requirement. The cost of NdFeB magnets, however, is considerablyhigher, so that currently the least costly motor uses a ferrite rotor. OEMs are the primary supply source for ECPMs in the market. The most attractiveapplications are small HVAC and refrigeration equipment fans, with powerrequirements less than 1 hp. The smallest size offered by GE includes a 4W-shaftoutput, used typically for domestic refrigerator/freezers. Small sizes are the best
2-21
justification for the cost premium of the motor where commercially availablealternatives have a rather low efficiency. The cost of the electronicpower supply/controllers (i.e., VSD) becomes prohibitive for larger motor sizes. Fanapplications are particularly attractive to the OEM because product engineering costs aresmall (e.g., compared with compressor applications). ECPMs in fractional hp arecurrently being developed for “drop-in” use for fan applications.
2.2.3 SCIMs With Variable-Speed Drive
Essentially, conventional three-phase SCIMs operate in a variable-speed mode ifvariable frequency and variable voltage power energize them. Motor speed willnominally vary directly with power frequency and typically, the applied voltageamplitude is adjusted to follow the frequency variation. This mode of operation isreferred to as “constant volts per Hz” and is widely used in applications such asvariable-speed fan or pump drives which do not require rapid control of speed or shaftposition control. In more demanding applications such as machine tool motion control,more sophisticated frequency and voltage control policies are employed. The generic variable-speed drive previously discussed and depicted in Figure 2-7 issuitable for use with an SCIM. However, the SCIM requires excitation by sinusoidalvoltages rather than quasi-rectangular ones suitable for the brushless DC motor versionof the ECPM. As explained previously, SCIM excitation voltages, which have aneffective sinusoidal form, are synthesized from the DC supply of the VSD byappropriate PWM control of the output switching transistors. A VSD configured forproduction of sinusoidal output voltages is often referred to as a “PWM inverter” orsimply an “inverter.” Compared to ECPMs, PWM inverter-driven, fractional horsepower, SCIMs areinherently limited to efficiencies that are 5 to 10 percentage points lower. There areseveral major reasons for this: � SCIM efficiency is a few percentage points below the ECPM, due to the reasons
discussed in 2.2.1. � The SCIM excitation voltage produced by the PWM inverter is not truly sinusoidal
but rather consists of a train of variable width, constant amplitude pulses, whichhave an effective value approximating that of a sine wave. This approximationresults in some degradation of motor efficiency, because of the ripples andharmonics associated with PWM variable-width pulses.

2-22
� PWM switching frequency is not precisely synchronized with the timing of theoutput waveform. This results in some output waveform asymmetry, which increasesits harmonic content.
The net result is a lower motor efficiency, by 3 to 5 percent for high PWM frequency(e.g., 10 kHz), and by 5 to 10 percent for low PWM frequency (e.g., 2 kHz).
Figure 2-10: Voltage and Current Output of a PWM Inverter (approximate PWM frequency: 1.1 kHz)
Source: Toshiba product literature
The efficiency loss is partially offset due to a small advantage in SCIM cost over that ofan equivalent which, in turn, is attributable to the difference in materials cost between asquirrel cage rotor and a permanent magnet rotor. PWM inverters are widely used in the United States for three-phase motor speed controlin industrial applications, primarily in integral horsepower and larger output sizes.Larger motors that use inverters in the 5 to 50 hp range are primarily of interest forvariable air volume applications within the air handler. Figure 2-11 summarizes thevarious costs of both single- and three-phase PWM inverters based on horsepower andvoltage. This figure suggests that as the motor size increases, the cost for variable-speed

2-23
control also increases. As of 1996, U.S. sales of variable-speed drives for inductionmotors were only about 100,000 units per year (5 percent of AC industrial motor sales),but were increasing at an average annual rate of 35 percent (based on value) since 19881.
Figure 2-11: PWM Inverter Costs
$0.00
$500.00
$1,000.00
$1,500.00
$2,000.00
$2,500.00
0.25 0.5 1 2 3 5 7
Horsepower
Cos
t ($)
Single Phase (230 VAC)
Three Phase (230 VAC)
Three Phase (460 VAC)
Source: Grainger, 1998-1999, Catalog No. 389
2.2.4 SRMs
The SRM concept is quite old and has been reported to predate that of any otherelectrical motor type. However, the inferior performance of the early switched, as wellas non-switched, reluctance motors did not permit them to compete with other motoralternatives. Modern SRM drive systems (i.e., SRM + VSD) represent a relatively newtechnology, enabled by advances in power and control electronics technology.Advanced software tools are responsible for the success of modern SRM designs. Thesetools facilitate adjustment of the highly non-linear SRM magnetic circuit as well asexciting current waveform and timing to optimize torque production for designsbounded by dimensional and efficiency constraints. As shown in Figure 2-12, the motorconsists of a rotor and stator, each with a different number of discrete, equally spacedpoles. The rotor construction includes a stack of thin steel laminations provided withindividual pole protrusions located on the inner diameter as shown in the Figure. Incontrast to the SCIM motor, the SRM motor contains no conductor bar nor induced 1 DOE, 1996; page 22.

2-24
current in the rotor, and no rotor magnets are required. The stator construction includes astack of thin steel laminations with individual poles that are fitted with wound coils. Anencoder in the motor housing senses the rotor position and pulses of current are appliedto the stator poles to match the rotor angle.
Figure 2-12: Simplified Schematic of an SRM Configuration
A
BC
A
BC
Rotation
At rotor position and rotation direction shown: • Winding A has just been switched off • Winding B is off • Winding C was just switched on
As indicated in the Figure, the timing of the pulses is such that each stator poleenergizes as each rotor pole approaches and de-energizes as the rotor pole achieves fullalignment. The “generic” drive of Figure 2-7 is applicable, with PWM used tosynthesize the quasi-rectangular winding excitation waveforms required for optimaloperation of the SRM. SRMs have several unique attributes that are potentially advantageous, depending on theapplication: � They have very high low-speed torque.

2-25
� The rotor uses no conductor bars or permanent magnets, and hence the potentialmotor cost is lower.
� The stator coils can be automatically and precisely wound on bobbin forms and thenfitted over the core pole protrusions (relative to “scramble” or “random” wound coilsfitted to small ECPMs or SCIMs, stator coils manufactured and installed in thisfashion have the advantage of high “fill factor,” minimal turn-to-turn voltage stress,and robust insulation from the core steel).
� Overall motor + drive system efficiency can approach that of the ECPM. However, to realize higher efficiencies, a very precise timing of the energizing and de-energizing of the stator pole windings is required. In addition, the use of very-low-loss(high-cost) lamination materials is needed, limiting the potential cost benefits. Otherbarriers that the SRM must overcome to displace ECPM and SCIM alternatives are:� Requirement for greater manufacturing precision, since the SRM typically requires
a smaller mechanical gap between the rotor and stator� Requirement for a better class of bearings to accommodate reliable operation with
a relatively small mechanical clearance gap� Manufacturing economy for SCIMs attained over an experience period of more than
90 years� More challenging design due to highly non-linear magnetic circuit operation and
requirements for precise timing of excitation waveforms� Relatively high level of acoustic noise generated by magneto-strictive forces acting
on the laminations as well as aerodynamic interaction of the salient rotor and statorpoles
High torque features do not represent the same degree of advantage for compressormotor applications that they do for vehicle traction drives or direct drives of washingmachine agitators for example.
Modern SRM technology was developed at Leeds and Nottingham Universities inEngland and licensed by Switched Reluctance Drives, Ltd. in Leeds, England. Onenoteworthy high volume application in the United States is the SRM VSD manufacturedby Emerson Electric for an advanced, direct-drive front loading domestic washingmachine. Another is a smaller SRM, manufactured by Warner Electric, used as a cruisecontrol servomotor in Ford products. Hewlett Packard also has been using largenumbers of SRMs in computer plotters. Emerson Electric reported that it would soonlaunch a line of integral horsepower SRM VSDs for industrial applications.
SRMs are being investigated for use in electric vehicles for traction drives, whereadvantageous SRM characteristics are high torque at low speed for good acceleration

2-26
and good efficiency at higher speed and low torque cruising conditions. The potentialfor lower cost than ECPM and SCIM VSD solutions is another important advantage fortraction drives. In general, SRM VSD technology has great potential but is at an earlierstage of development and commercialization than ECPM and SCIM alternatives.
2.3 Variable-Speed Motor/Drive Costs—Refrigerator Compressor MotorExample
This subsection addresses prospective mass-production costs of application-specific,“embedded” variable-speed drives using a refrigerator compressor as an illustrativeexample.
Estimates of eventual mass production costs for application-specific, embedded,variable-speed drives are subject to considerable uncertainty. Currently, there arerelatively few instances of U.S. mass production of such drives and therefore, anabsence of OEM sales data upon which to base cost estimates. In general, OEM pricesand manufacturing costs are commercially sensitive information which manufacturersare reluctant to disclose. General Electric is marketing variable speed, electronicallycommutated motors, targeting mass market applications - appliances, air conditioning,and automotive—representing total motor/drive system sales approaching 50,000 unitsannually. Applications range from 5 hp heat pump compressor drive motors to one halfhp indoor air blower motors for central air conditioning systems. The latter (packagedone half hp, 1,200 rpm motor and drive) is being sold to OEM customers forapproximately $125 each, with exact prices depending on production volume andspecific commercial arrangements (GE Motors, 1990). In Japan, PWM inverters aremass produced for small “mini-split” heat pump applications, reportedly at invertermanufacturing costs of $25/hp (at average rated motor power outputs of about 1.5 hp)(Greenberg, 1988 p. 7). Others place the direct material cost, based on large volumepurchases, of the complete inverter for the Japanese, mini-split heat pumps atapproximately $70/hp (GE Motors, 1990). With assembly costs, overhead, and profitmargin added in, the full OEM pricing would be in the range of $100 to $125/hp.
It can be expected that the ultimate mass production OEM cost of a one-quarterhorsepower motor rotor and stator plus a drive on a printed circuit board will cost wellunder $100. The cost of the three-phase motor rotor and stator subassemblies will beclose to the cost of premium efficiency single-phase induction motors, in the range of$25, varying with output in the same fashion as induction motors. The OEM cost of thevariable-speed drive (either SCIM or ECPM drive with PWM speed control) is expectedto fall to $25 and $40, respectively, after several years of mass production.
The cost of the VSD could be offset, to some extent, by operating the motor andcompressor at higher speeds, up to approximately 6,000 to 7,000 rpm, at its nominal

2-27
capacity. Operating speeds of this magnitude are common for the variable-speed rotarycompressors used in mini-split, room sized air conditioning systems, and should becompatible with smaller compressors used for refrigerator/freezer (R/F) units. Thisrange of operating speed has also been demonstrated in R/F capacity reciprocatingcompressors, on a laboratory project basis (GE, 1990). These higher speeds are clearlyfeasible although issues related to the normal range of compressor design optimizationand durability need to be addressed before commercial production.
The resulting reduction in compressor displacement and motor size would allow somereduction in the cost of these components, of approximately $5 to $10 at the OEM level.The variable-speed drive and motor replace the standard induction motor, whose OEMcost is about $15. The total offsetting cost reductions lie in the range of $20 - $25. Thenet increase in OEM component cost to the R/F manufacturer associated with theVSD/motors, in mass production, can be expected to be approximately $25 - $30.
In addition to motor and VSD costs, total applied costs will include the cost of therefrigerator temperature controller and a control algorithm. The temperature controller’sfunction is to determine the required compressor speed and generate a speed controlsignal to the motor drive based on cabinet interior temperatures. These componentsreplace the mechanical thermostats used in current refrigerators. For high-volumeproduction, the costs are comparable with no net effect on the manufacturing cost orretail price of an R/F.
2.4 Variable-Speed Motor/Drive Costs—Fan and Small-Pump Motors
Appliance fans, furnace blowers, and small pumps have been typically powered by“sub-fractional” horsepower shaded-pole and permanent split capacitor (PSC) single-phase induction motors of relatively low efficiency. ECPMs of various forms offermore-efficient drive solutions when used as fixed-speed replacements for shaded-poleand PSC motors. Taking advantage of the variable-speed capability of ECPMs increasesthe system efficiency further. The efficiency and cost of shaded-pole, PSC, and ECPMrefrigerator fan motors are presented in Table 2-3.
As may be seen in Table 2-3, the efficiency of small shaded-pole motors is very poorand the cost premium for improvement is substantial. Innovators have been seekingmore cost-effective means to achieve higher efficiency in these small motors.

2-28
Table 2-3: Shaded Pole, PSC, and ECPM Refrigerator Fan Motor Efficiency and OEM Cost
Shaded Pole PSC ECPM
Shaft Pwr Output Pwr Input Pwr EffOEM Cost Unit Cost Input Pwr Eff OEM Cost Unit Cost Input Pwr Eff
OEM Cost Unit Cost
(w) (hp) (w) (%) ($) ($/shaft-W) (w) (%) ($) ($/shaft-W) (w) (%) ($) ($/shaft-W)
6 0.01 40 15 7 $1.17 15 40 25 $4.17 9 71 35 $5.839 0.01 53 17 10 $1.11 21 43 28 $3.11 13 72 40 $4.4415 0.02 75 20 15 $1.00 33 45 33 $2.20 21 73 42 $2.8020 0.03 90 22 20 $1.00 42 48 35 $1.75 27 74 45 $2.2525 0.03 110 23 25 $1.00 51 49 37 $1.48 33 76 48 $1.9237 0.05 na na 30 $0.81 70 53 40 $1.08 49 76 52 $1.4150 0.07 90 56 43 $0.86 65 77 54 $1.08125 0.17 202 62 51 $0.41 155 81 64 $0.51249 0.33 370 67 57 $0.23 304 82 71 $0.29
373 0.50 530 70 60 $0.16 450 83 75 $0.20
Source: ADL, 1996
One such motor design employs the simple stator core and windings of the shaded poleunit but eliminates the shading ring. The laminated induction rotor with its die castaluminum conductor cage replaced by a simple molded or extruded ferrite magnetsleeve and shaft assembly. This permanent magnet AC single-phase motor will self-startbut the direction of rotation is dependent upon the initial position of the rotor. Somemanufacturers of small pumps have successfully used such a motor with a pump that iseffective for either direction of rotation. This mode of operation is limited however tosizes for which the ratio of motor torque to total motor plus load inertia is greater than acritical value. The viable size range is extended somewhat by employing rotor magnetmaterial with a higher energy product such as bonded neodymium iron boron.
Others have developed means to reliably start a permanent magnet single phase ACmotor in one direction for fans and other applications. For example, Advanced MotionControls, Princeton WI, has developed a custom single chip electronic driver circuit tooperate a permanent magnet single phase AC fan motor in an appliance manufactured byWhirlpool Corporation. The driver provides for reliable unidirectional starting as well asvariable-speed operation. The advantage of this solution over existing ECPMs is asimpler and less costly motor construction.
Innovative three phase, brushless DC permanent magnet motor designs are also directedat reducing the cost of high-efficiency, variable-speed ECPMs for appliance and otherhigh volume applications. For example, Wellington Electric of Torrington, Connecticutis developing and currently manufacturing permanent magnet, brushless, DC motorswith stator windings automatically formed on a molded plastic frame. This “iron-less”construction avoids the cost of a laminated core. Core losses due to eddy current andhysteresis effects are also avoided but torque and power capabilities are compromisedbecause winding flux linkage is not as strong as in conventional iron cored machines.

2-29
Moreover, absence of an iron core hampers the transport and dissipation of stator copperlosses. Notwithstanding these potential limitations, motors of this type are findingcommercial use for blowers and other applications. Wellington manufactures motorswith no iron in conventional “radial flux” and “axial flux” configurations. The axialfield design may be preferred because it uses only one low cost, ferrite magnet withmulti-pole magnetization.
2.5 Current Research in Electric Motors for Commercial Applications
Various groups undertake research in motors for residential and commercialapplications. Motor manufacturers do their own research, contract research to privatefirms, and support industry consortia and university research programs. Governmentalso supports cooperative research efforts and individual programs, but to a lesserextent. Additionally, a great deal of research from other fields has applications to motortechnology.
Research topics vary across research groups, but there are a few common drivers. First,induction motors are technically mature. Research expenditures therefore facediminishing returns. There are also added incentives for new technologies to capturemarket share from a mature technology. Second, substantial advances in other fields areexpanding the potential applications for stepper motors and variable-speed control ofinduction motors. These include digital signal processing (DSP), power electronics,magnetic materials, and mathematical modeling. Applying these advances to motortechnology has potentially high returns and is attracting a great deal of research activity.
Since induction motor technology is mature, most research focuses on reducing costsand increasing productivity rather than improving performance. Computer models toassist motor designers, new winding methods, and new steels are examples of typicalresearch topics. Most motor manufacturers conduct this research internally, or contractout under proprietary arrangements.
Variable-speed control of induction motors is one area that continues to attract a greatdeal of research effort. Although also considered technically mature by virtue of theirhistory in industrial process control, there is a large potential market in smaller industrialmotors, and in fans, compressors, and appliance motors in the residential andcommercial sectors. Furthermore, given the dominance of induction motors, there areretrofit opportunities. Since traditional methods of modulating induction motor speed orvarying process rates can be extremely energy inefficient, end users have a financialincentive to switch to variable-speed drives. The attractive market draws private fundingdevoted to reducing costs and size and expanding applications. Universities andconsortia are also researching ways to ameliorate the harmful effects of drive harmonicson power grids.

2-30
The same types of advances in power electronics and DSP are driving development ofbrushless DC motors such as ECPM. Advances in magnetic materials continue tosupport development of less costly, better performing, permanent magnet motors. ManyDC motors are potentially less costly to manufacture than AC induction motors andhave potentially higher electrical efficiencies because rotor slip is not present. Theperformance characteristics of a DC motor are determined as much by its controller asthey are by its physical design. Research is underway in all circles to apply faster, morerobust DSP controllers and new control strategies to motor applications traditionallyserved by induction motors, including the major residential and commercial applicationsin HVAC and refrigeration. DC motors are traditionally used in applications whereposition control, speed control, and small size are important. Energy efficiency, in thesecases, is not considered. There are some challenges in optimizing motor design andcontrol for applications where consumers value speed control and energy efficiency. Thelarge potential market is drawing significant private research into DC motor modeling,design, and control to overcome these challenges. Because electronics continue toimprove rapidly, DC motors have the potential to become a disruptive technology bypromising both lower cost and better performance than induction motors. In fact, themarket for DC motors may not be limited to applications now served by electric motors.The high torque, low speed capabilities of some advanced VSD motors have thepotential to replace gearboxes and even internal combustion engines in someapplications. The combination of decreasing risk and high return is attracting internalindustry funding as well as support of consortia and university research.
Table 2-4: Involvement in Motor Research for Commercial and Residential Applications
Inte
rnal
cor
pora
tere
sear
ch
Indu
stry
con
sort
ia
Indu
stry
spo
nsor
edun
iver
sity
pro
gram
s
Inde
pend
ent c
ontr
act
rese
arch
Gov
ernm
ent
spon
sore
d
Oth
er in
dust
ries
Induction motorspeed controlMotor modelingAC motor designDC motor controlDC motor designMagnetic materialsSteels
Significant
Moderate
Small
Involvement level

2-31
2.5.1 Program Options
Markets trends, resulting largely from advances in control and power electronics, areopening the residential and commercial sectors toward DC motors and variable-speedcontrollers for induction motors. The large potential returns ensure ongoing privateresearch in an effort to capture markets traditionally served by induction motors alone.Since one of the primary benefits of introducing these technologies into the residentialand commercial sectors is energy savings, the outlook is good for reducing the energyconsumption by fractional horsepower electric motors. Private research funding is highbecause of market incentives, and the resulting improvement in energy efficiency alignsitself with the Department’s goals.

3-1
3 Motor Populations, Energy Usage, and Savings Potential in the ResidentialSector
As shown in Figure 3-1, electric energy consumption in the residential sector accountsfor over half of total sector, primary energy consumption. Electric motors consumeabout 43 percent of the total electric energy consumed in the residential sector. Themajor applications of electric motors in the residential sector and their energy use arediscussed in this section.
Figure 3-1: 1995 Residential Energy Consumption by Fuel Type
EnergyConsumption
Category
Quads Percent
Primary Electric1 11.44 62.1%
Electric Motors2 4.9 26.6%
Other Electrical Uses2 6.54 35.5%
Distillate Fuels 0.89 4.6%
Liquefied Petroleum Gas 0.40 2.2%
Kerosene 0.07 0.4%
Natural Gas 4.98 27.2%
Coal 0.05 0.3%
Renewable Energy 0.59 3.0%
Total 18.42 100%
Sources: AEO 1998. Electric to primary energy conversion: 1 kWh = 11,005 Btu1 Includes generation, transmission, and distribution losses2 Both components of the Primary Electric component
Primary Electric62.1%
(1) Components
Distillate Fuels4.6%
LiquefiedPetroleum Gas
2.2%
Kerosene0.4%
Natural Gas27.2%
Coal0.3%
RenewableEnergy3.0%
Total 18.42 Quads
Electric Motors(1)26.6%
Other Electrical Uses (1)35.5%
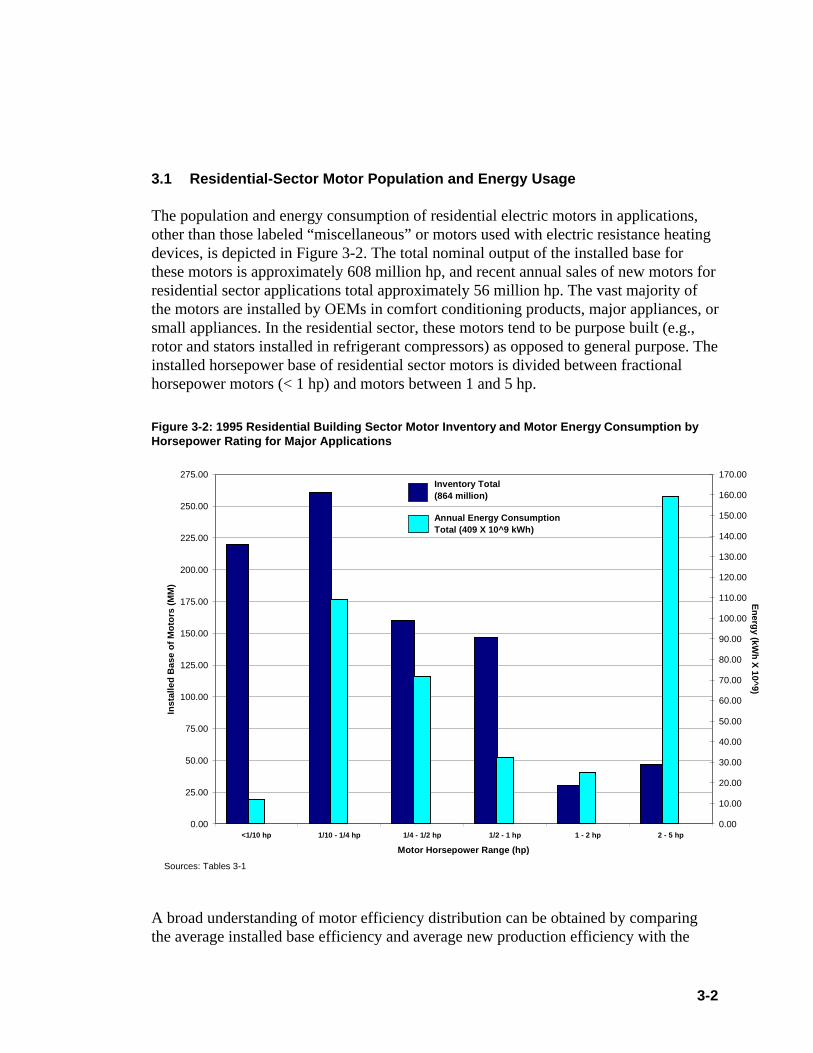
3-2
3.1 Residential-Sector Motor Population and Energy Usage
The population and energy consumption of residential electric motors in applications,other than those labeled “miscellaneous” or motors used with electric resistance heatingdevices, is depicted in Figure 3-2. The total nominal output of the installed base forthese motors is approximately 608 million hp, and recent annual sales of new motors forresidential sector applications total approximately 56 million hp. The vast majority ofthe motors are installed by OEMs in comfort conditioning products, major appliances, orsmall appliances. In the residential sector, these motors tend to be purpose built (e.g.,rotor and stators installed in refrigerant compressors) as opposed to general purpose. Theinstalled horsepower base of residential sector motors is divided between fractionalhorsepower motors (< 1 hp) and motors between 1 and 5 hp.
Figure 3-2: 1995 Residential Building Sector Motor Inventory and Motor Energy Consumption byHorsepower Rating for Major Applications
0.00
25.00
50.00
75.00
100.00
125.00
150.00
175.00
200.00
225.00
250.00
275.00
<1/10 hp 1/10 - 1/4 hp 1/4 - 1/2 hp 1/2 - 1 hp 1 - 2 hp 2 - 5 hp
Motor Horsepower Range (hp)
Inst
alle
d B
ase
of M
otor
s (M
M)
0.00
10.00
20.00
30.00
40.00
50.00
60.00
70.00
80.00
90.00
100.00
110.00
120.00
130.00
140.00
150.00
160.00
170.00
Energy (kW
h X 10^9)
Sources: Tables 3-1
Inventory Total(864 million)
Annual Energy ConsumptionTotal (409 X 10^9 kWh)
A broad understanding of motor efficiency distribution can be obtained by comparingthe average installed base efficiency and average new production efficiency with the

3-3
practical limits of both induction and ECPM motors to determine the unrealizedefficiency gains. Figures 3-3 and 3-4 plot these efficiency levels. In the output rangesof residential size motors up to 5 hp, the average new production efficiency level issignificantly higher than the average installed base. This is due to the strong influence ofNAECA standards, which have been in effect since 1990, along with revised, tightenedstandard levels taking effect for many other appliance categories. New motors over1/2 hp for residential applications are specified at efficiencies that lie within a fewpercentage points of the practical limits for induction motors. Higher-efficiency,permanent magnet, rotor motors (e.g., ECPM) are being used in increasing quantities.With two-thirds of the new motor sales resulting from replacement, and with typicalresidential appliance lifetimes of 10 to 15 years, the motor efficiency level of theinstalled base is increasing.
Figure 3-3: Comparison of Average Efficiency of Single Phase Two-Pole Hermetic CompressorMotors in the Installed Base and in New Equipment With Theoretical Limits (Electromechanicalefficiency only)
0.1 0.2 0.3 0.5 1 2 3 550
60
70
80
90
100
Source: ADL Estimates
Motor Power Range (Horsepower)
Practical Limits ECPM
Practical Limits Induction
Average New Production
Average Installed Base
Effi
cien
cy (
%)

3-4
Figure 3-4: Comparison of the Efficiency of Other Single-Phase Motors
As indicated in Figure 3-1, motors used in residential applications account for slightlyless than half of the overall residential electric energy consumption. Residential motoron-site electric energy consumption in 1995 was approximately 445 billion kWh; thecorresponding primary energy consumption at the electric power plant beingapproximately 4.9 quads1, or 26.6 percent of the total residential primary energyconsumption. Motors are used for a variety of purposes in residential sector applications.Examples include space conditioning (refrigerant compressors in air conditioners andheat pumps, fans, and blowers), major appliances (refrigerators, freezers, clotheswashers, dishwashers), small appliances (vacuum cleaners, floor polishers, foodprocessors, hair dryers), power tools (drills, saws, sanders, etc.), and other applications(e.g., tape drives in audio and video cassette recorders, clocks, garage door openers,sump pumps, water well pumps). The energy consumption at the national level for a 1Conversion is: 11,005 Btu of power plant fuel consumption per site kWh of electric energy, based on DOE/EIA, AEO 1998 data for 1995.
0.005 0.01 0.02 0.05 0.1 0.2 0.5 10
10
20
30
40
50
60
70
80
90
100
Practical Limits ECPM
Practical Limits Induction
Average New Production
Average Installed Base
Motor Power Range (hp)
Effi
cien
cy (
%)

3-5
particular motor application depends on the number in use, the power output, theefficiency, and the number of operating hours.
Figure 3-5 breaks down the residential motor energy consumption by application. Themost significant applications are refrigerators, freezers, air conditioner and heat pumpcompressors and fans, and HVAC indoor air blowers (gas furnaces, central A/C, andheat pumps). These applications together account for more than 90 percent of totalresidential motor energy consumption. Percentages shown in the figure summarize theinformation found in Tables 3-1 through 3-3. This information is built from engineeringestimates and the references noted. Each of these applications is covered in detail in thesubsections that follow.
Figure 3-5: 1995 Residential-Sector Motor Energy Usage (Primary Energy: 4.9 Quads)
Central AC23.0%
(not including indoor air blower)
Refrigerators17.9%
Heat Pumps17.6%
(not including indoor air blower)
Room AC6.6%
Central AC & Heat Pump Blower
5.9%
Furnace Blower7.9%
Miscellaneous7.7%
Clothes Washer2.3%
Clothes Dryer1.4%
Dishwasher2.3%
Freezers7.5%
Space Conditioning(60.9%)
Refrigerators and Freezers
(25.4%)
Laundry/ Dishwashing
(6.0%)
Miscellaneous 7%
Source: Tables 3-1, 3-2, and 3-3Conversion: 1kWh = 11,005 Btu
In the residential sector, motor efficiencies are strongly influenced by the minimumappliance, energy efficiency standards established under the National Appliance EnergyConservation Act (NAECA). Figure 3-6, based on similar residential motor, primaryenergy consumption data as Figure 3-5, is shaded to indicate whether the NAECAefficiency standards cover the particular motor application. More than 84 percent of theresidential motor energy consumption occurs in appliances covered by NAECA, whilethe remaining 16 percent is in applications outside NAECA. NAECA standards havehad a profound effect on the efficiencies of the motors used in most of these appliances.

3-6
The incremental cost of increasing motor efficiency is modest, so that increasing themotor efficiency has proven to be one of the most cost-effective ways to increase overallappliance efficiencies to meet the standards. As discussed below, as the NAECAstandards took effect in the early 90s, dramatic increases occurred in motor efficiencies.In three of the NAECA covered appliances, standards have been a less powerful driverof motor efficiency. In clothes washers and dryers, the motor consumes only a small partof the total energy input compared to the heat input for water and air heating,respectively. The motor energy savings have little effect on the rated efficiency. The gasfurnace test procedure does not include the indoor air blower power in the efficiencymeasurement. However, indoor air blowers integral to A/C and heat pump systems arecovered in the standard.
Figure 3-6: 1995 Proportion of Residential-Sector Motor Energy Consumption in ApplicationsCovered by NAECA
Freezers7.5%
Dishwasher2.3%
Clothes Dryer1.4%
Clothes Washer2.3%
Misc.7.7%
Furnace Blower7.9%
Central AC & Heat Pump Blower
5.9%
Room AC6.6%
Heat Pumps17.6%
Refrigerators17.9%
Central AC23.0%
Covered by NAECA(84.4%)
Source: Tables 3-1, 3-2, and 3-3Conversion: 1kWh = 11,005 Btu
(not including indoorair blower)
(not including indoorair blower)
The original purchaser of the majority of the motors used in the residential sector isusually an OEM�the manufacturer of an appliance, an air conditioning or heatingsystem, or other residential product. Large portions of these motors are supplied tothe OEM as low-cost rotor and stator pairs integrated into the product, particularlyin refrigerant compressors. These applications account for approximately two-thirds

3-7
of the residential-sector motor energy consumption. The remaining OEM motors arecommonly packaged in standard, purpose build configurations. Relatively few general-purpose motors are used in residential applications. Large power tools is one of theexamples.
Table 3-1 summarizes the major residential-sector motor applications in terms of currentinventory, power output range, efficiency, and energy consumption. Table 3-2summarizes the annual unit sales and efficiency characteristics of the motors currentlybeing used in these applications, and estimates the hypothetical annual consumption ifthe total installed base were operating at the current efficiency levels. ComparingTables 3-1 and 3-2, it is readily apparent that motor efficiency levels have increasedsignificantly, as discussed above. The motor applications summarized in Tables 3-1 and3-2 account for about 95 percent of residential-sector motor energy and are the primaryfocus of this study. These electric motor applications are addressed, in detail, in latersections.
Table 3-1: Major Residential-Sector Electric Motor Applications ¾¾Installed Base
Typical Motor - Current Installed Base
ApplicationQuantity
(MM)Horsepower
RangeEfficiency
Range (%)1OperatingHr/year
Consumption109 kWh/yr 2
R/F Compressor 1173 1/8 - 1/3 60 - 80 3,000 68R/F Condenser Fan 1173 < 1/100 10 - 30 3,000 6R/F Evaporator Fan 1173 < 1/100 10 - 30 3,000 6Freezer Compressor 424 1/8 - 1/3 60 - 80 3,000 33Central A/C Compressor 363 2 - 5 70 - 90 1,000 90Central A/C Condenser Fan 363 1/4 - 1/2 40 - 60 1,000 12Heat Pump Compressor 113 2 - 5 70 - 90 2,000 - 4,000 69Heat Pump O.U. Fan 113 1/4 - 1/2 40 - 60 2,000 - 4,000 9Indoor Cooling Blower 475 1/3 - 1 50 - 65 1,000 19Indoor Heating Blower 675,6 1/3 - 1 50 - 65 1,000 - 2,000 42Room A/C Compressor 305 1/2 - 2 70 - 90 500 25Room A/C Fan/Blower 305 1/8 - 1/2 50 - 60 500 4Clothes Washer 793 1/2 50 - 60 2006 10Clothes Dryer Drum Rotation 824 1/10 50 500 6Dishwasher Pump 567 1/2 60 - 70 3006 10Miscellaneous (Table 3-3) N/A N/A N/A N/A 34Total N/A N/A N/A N/A 443
1 Efficiency numbers used in this table may be somewhat lower than numbers cited for individual motors elsewhere in thisdocument, to account for aging, oversizing and other losses in actual installations
2 Site electric energy - 90 billion kWh on-site is equivalent to about 1 quad of primary energy3 DOE, 1998; data for 19974 USCB, 1995(a)5 USCB, 1995(b)6 Of indoor heating blowers installed, approximately 56 million are furnace blowers, the remainder heat pump blowers7 ADL, 1998; data for 1997

3-8
Table 3-2 : Major Residential-Sector Electric Motor Applications ¾¾Current Production
Typical Motor - Current Production and Potential Consumption
ApplicationAnnualUnits(MM)
HorsepowerRange
EfficiencyRange (%)
OperatingHr/year
PotentialConsumption
at CurrentEfficiency1
109 kWh/yrR/F Compressor 10.32 1/8 - 1/3 70 - 82 3,000 65R/F Condenser Fan 92 < 1/100 10 - 30 3,000 3R/F Evaporator Fan 92 < 1/100 10 - 65 3,000 1Freezer Compressor 2.12 1/8 - 1/3 70 - 82 3,000 32Central A/C Compressor 53,4 2 - 5 85 - 90 1,000 87Central A/C Condenser Fan 53,4 1/6 - 1/3 40 - 60 1,000 9Heat Pump Compressor -4 2 - 5 85 - 90 2000 - 4000 67Heat Pump Outside Fan -4 1/6 - 1/3 40 - 60 2000 - 4000 6Indoor Cooling Blower 75,6 1/3 - 1 50 - 80 1000 16Indoor Heating Blower -5,6 1/3 - 1 50 - 80 1000 - 2000 36Room A/C Compressor 4.8 1/2 - 2 80 - 90 500 24Room A/C Fan/Blower 4.8 1/8 - 1/3 50 - 70 500 4Clothes Washer 7.62 1/2 50 - 60 200 9Clothes Dryer Drum Rotation 5.92 1/10 50 500 6Dishwasher Pump 5.12 1/2 60 - 70 300 10Miscellaneous (Table 3-3) N/A N/A N/A N/A 34Total N/A N/A N/A N/A 409
1 Site electric energy, if the electric motors in the entire installed base noted in Table 3-1, operated at current new equipment,motor efficiency levels. These numbers generally correspond to the higher-efficiency induction motor options detailed inTables 3-7 through 3-14
2 Appliance, April 19983 Appliance, April 1998; data for 19954 Sales figures for central A/C units include heat pumps5 Appliance Web site, “www.appliance.com,” estimate based on partial year data6 Sales figures for heating and cooling blowers are combined under cooling blowers
Motors are used in many other residential products, but usually at a combination of lowpower, short operating hours, and/or small market penetration so that the energyconsumption is relatively low. Table 3-3 shows a number of these miscellaneousresidential motor applications which account for the estimated miscellaneous annualenergy consumption representing 7.7 percent of residential energy use, or 0.38 quads ofprimary energy. This estimate, built up from estimates of individual end uses, agreesfavorably with the 1998 DOE/LBL estimate of total (including non-motor)miscellaneous use of 0.68 quads.1 The estimates of consumption for individualapplications are in general agreement with figures from one or both of the 1 LBNL, 1998
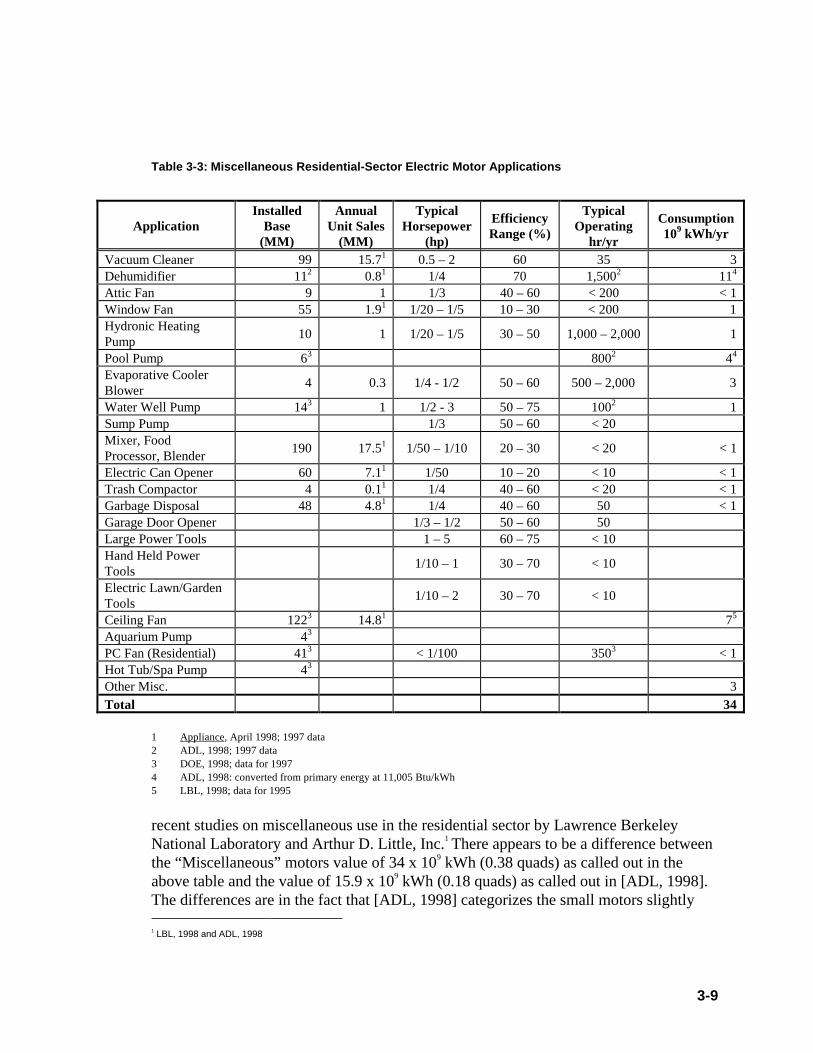
3-9
Table 3-3: Miscellaneous Residential-Sector Electric Motor Applications
ApplicationInstalled
Base(MM)
AnnualUnit Sales
(MM)
TypicalHorsepower
(hp)
EfficiencyRange (%)
TypicalOperating
hr/yr
Consumption109 kWh/yr
Vacuum Cleaner 99 15.71 0.5 – 2 60 35 3Dehumidifier 112 0.81 1/4 70 1,5002 114
Attic Fan 9 1 1/3 40 – 60 < 200 < 1Window Fan 55 1.91 1/20 – 1/5 10 – 30 < 200 1Hydronic HeatingPump
10 1 1/20 – 1/5 30 – 50 1,000 – 2,000 1
Pool Pump 63 8002 44
Evaporative CoolerBlower
4 0.3 1/4 - 1/2 50 – 60 500 – 2,000 3
Water Well Pump 143 1 1/2 - 3 50 – 75 1002 1Sump Pump 1/3 50 – 60 < 20Mixer, FoodProcessor, Blender
190 17.51 1/50 – 1/10 20 – 30 < 20 < 1
Electric Can Opener 60 7.11 1/50 10 – 20 < 10 < 1Trash Compactor 4 0.11 1/4 40 – 60 < 20 < 1Garbage Disposal 48 4.81 1/4 40 – 60 50 < 1Garage Door Opener 1/3 – 1/2 50 – 60 50Large Power Tools 1 – 5 60 – 75 < 10Hand Held PowerTools
1/10 – 1 30 – 70 < 10
Electric Lawn/GardenTools
1/10 – 2 30 – 70 < 10
Ceiling Fan 1223 14.81 75
Aquarium Pump 43
PC Fan (Residential) 413 < 1/100 3503 < 1Hot Tub/Spa Pump 43
Other Misc. 3Total 34
1 Appliance, April 1998; 1997 data2 ADL, 1998; 1997 data3 DOE, 1998; data for 19974 ADL, 1998: converted from primary energy at 11,005 Btu/kWh5 LBL, 1998; data for 1995
recent studies on miscellaneous use in the residential sector by Lawrence BerkeleyNational Laboratory and Arthur D. Little, Inc.1
There appears to be a difference betweenthe “Miscellaneous” motors value of 34 x 109 kWh (0.38 quads) as called out in theabove table and the value of 15.9 x 10⁹ kWh (0.18 quads) as called out in [ADL, 1998].The differences are in the fact that [ADL, 1998] categorizes the small motors slightly 1 LBL, 1998 and ADL, 1998

3-10
differently. The motors for the dehumidifier, window fans, evaporative cooler, andceiling fans are categorized in the Space Cooling section of [ADL, 1998] while thisreport categorizes them in the miscellaneous motors category in Table 3-3. Also, thegarage opener is grouped in the Electronics section of [ADL, 1998]. If the values forthese 5 motor groups are added to the value for the “miscellaneous” motors category of[ADL, 1998], the new total then becomes 0.37 quads. This value and the 0.38 quads ofthis report are within approximately 3 percent of each other.
While many of the motors in miscellaneous uses are low in efficiency and not coveredby EPAct or NAECA standards, the combination of short operating hours and lowpower levels results in a relatively low level of energy consumption. In addition to theresidential motors itemized in Table 3-3, hundreds of millions of small motors, typically1/1000 to 1/100 hp, are used in various applications. These applications include coolingelectronic equipment (e.g., personal computers, microwave ovens), tape transports inVCRs and audio tape recorders, electric toothbrushes, electric carving knives andelectric shavers. This diverse group of motor-powered appliances provides greatconvenience to people, while consuming negligible energy.
Table 3-4 summarizes residential motor applications in electric resistance heatingdevices such as space heaters and hair dryers. Because the motor losses add to the heatoutput of the electric resistance-heating element, there is no incentive to improve theefficiency of these motors. While there is no direct incentive to improve the efficiencyof a blower used solely to distribute electric resistance heated air, most electric furnaceinstallations also include central air conditioning. Therefore, the overall systemefficiency does depend on the blower efficiency.
Table 3-4: Residential-Sector Electric Motors Used With Electric Resistance Heating Devices
Application Installed Base(MM)
Annual Unit Sales(MM)
Typical MotorHorsepower
Indoor Electric ResistanceFurnace Air Blower
111 0.42 1/3 – 3/4
Clothes Dryer Drum Rotation 60 4.53 1/6Convection Oven 5 0.5 1/6Hair Dryers ~100 20.83 1/100Space Heaters (Fan-Forced) 25 33 1/1001 DOE, 19982 Appliance Web site, “www.appliance.com,” estimate based on partial year data3 Appliance, April 1998; data for 1997

3-11
3.2 Residential-Sector Motor Energy Savings Potential
From the preceding section, about 87 percent of the residential-sector motor energyconsumption is concentrated in refrigeration and space conditioning applications.Therefore, the emphasis in analysis of energy savings potential is on these twoapplications.
In this section, the residential-sector energy savings potential and cost-effectiveness areevaluated for:� Incrementally increasing the motor efficiency� Application of adjustable-speed drives, where appropriate
The opportunities to save energy are evaluated in terms of their energy-saving potentialand cost-effectiveness at current cost levels, as well as the potential to improve cost-effectiveness.
Figure 3-7 illustrates the overall potential for residential energy savings at various levelsfor the major applications that are analyzed in this chapter. When measuresincorporating the use of both variable-speed drives and high-efficiency motors areconsidered, using the best option from summary tables 3-5 and 3-6, total savingspotential is about 1.6 quadrillion Btus of primary energy. The energy savings potentialfor those residential measures with a payback of five years or less is about 594 trillionBtus. End uses for increased efficiency motors that are not included in this savingsfigure are room A/C fans/blowers, clothes dryer-drum rotation, dishwasher pumps, andmiscellaneous applications. From Table 3-5 for increased efficiency motors, on a totaluse of 389x109 kWh, there is a technical potential for savings of 45x109 kWh. Whensubjected to economic evaluation, energy conservation options with payback periodsless than five years yield potential savings of 23x109 kWh. Other non-economic barriersmay further reduce this figure. Use of variable-speed drives doubles this latter savingsestimate.
Tables 3-5 and 3-6 break out the savings for specific end uses. Table 3-5 summarizes theincremental efficiency gain over the efficiency of the installed base. This gain could beobtained by using the best practical (constant speed) motor technology and the estimatedenergy savings if the installed base were operating at the higher efficiencies. Thenumbers are generated from the figures and calculations presented in Tables 3-7 through3-14. Incremental potentials add up to annual primary energy savings of about 0.5 quad(again, based on upgrading of the entire installed base from current motor efficiencylevels to practical limits). Table 3-6 shows similar metrics for cases in which variable-speed technologies are implemented. Two factors should be noted:

3-12
� The use of several of these options, e.g., ECPM evaporator fans for refrigerators andfreezers, is increasing rapidly under pressure of current and/or future NAECAstandards. All of the end uses listed fall under NAECA standards, with the exceptionof indoor furnace blowers.
� Most of the options are at best only marginally cost-effective, with the exception ofindoor blowers. Indoor furnace blowers stand out as an opportunity, as they are notpresently covered by NAECA and have the potential for high-efficiency retrofit withlow payback.
Figure 3-7: Energy-Saving Potential and Cost-Effectiveness of Increased-Efficiency Motors andVSDs in Major Residential Applications
Source: Tables 3-5 and 3-6
MotorEnergyUse(109kWh/yr)
TechnicalFactors
EconomicFactors
Payback <5 year
Non-EconomicBarriers
389 45 23 <23
350 126 46 <46
Increased-Efficiency
Motors
Variable-Speed
Drivers
EnergySavings
(109kWh/yr)
Total Technical Savings Potential of about 146 x 10 9 kWh (1.6 quads)
393 146 54<54Best
Option
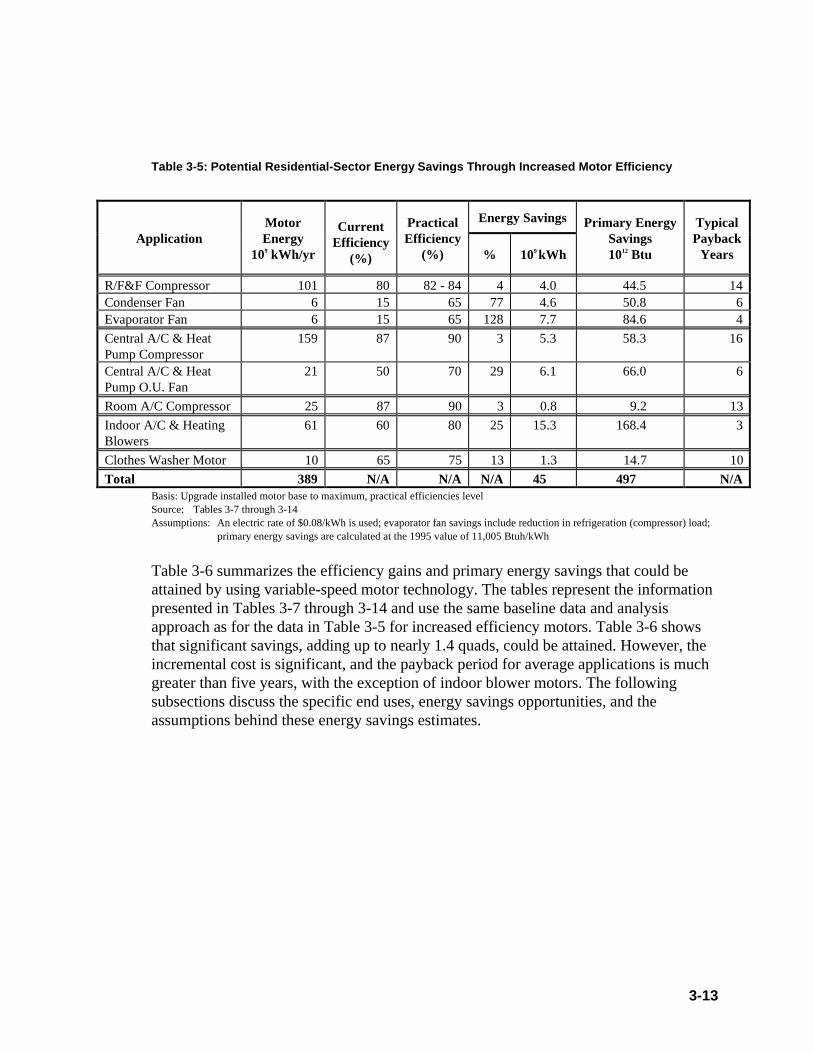
3-13
Table 3-5: Potential Residential-Sector Energy Savings Through Increased Motor Efficiency
Energy Savings
ApplicationMotorEnergy
109 kWh/yr
CurrentEfficiency
(%)
PracticalEfficiency
(%) % 109 kWh
Primary EnergySavings1012 Btu
TypicalPayback
Years
R/F&F Compressor 101 80 82 - 84 4 4.0 44.5 14Condenser Fan 6 15 65 77 4.6 50.8 6Evaporator Fan 6 15 65 128 7.7 84.6 4
Central A/C & HeatPump Compressor
159 87 90 3 5.3 58.3 16
Central A/C & HeatPump O.U. Fan
21 50 70 29 6.1 66.0 6
Room A/C Compressor 25 87 90 3 0.8 9.2 13
Indoor A/C & HeatingBlowers
61 60 80 25 15.3 168.4 3
Clothes Washer Motor 10 65 75 13 1.3 14.7 10
Total 389 N/A N/A N/A 45 497 N/ABasis: Upgrade installed motor base to maximum, practical efficiencies levelSource: Tables 3-7 through 3-14Assumptions: An electric rate of $0.08/kWh is used; evaporator fan savings include reduction in refrigeration (compressor) load;
primary energy savings are calculated at the 1995 value of 11,005 Btuh/kWh
Table 3-6 summarizes the efficiency gains and primary energy savings that could beattained by using variable-speed motor technology. The tables represent the informationpresented in Tables 3-7 through 3-14 and use the same baseline data and analysisapproach as for the data in Table 3-5 for increased efficiency motors. Table 3-6 showsthat significant savings, adding up to nearly 1.4 quads, could be attained. However, theincremental cost is significant, and the payback period for average applications is muchgreater than five years, with the exception of indoor blower motors. The followingsubsections discuss the specific end uses, energy savings opportunities, and theassumptions behind these energy savings estimates.
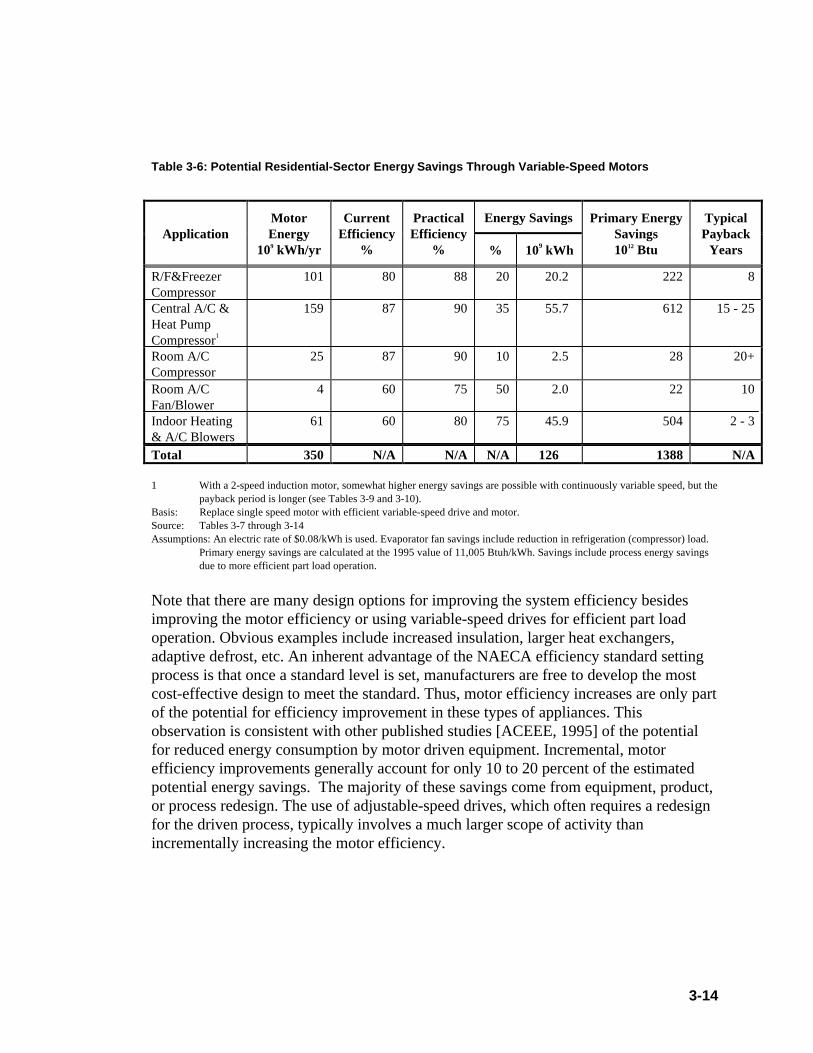
3-14
Table 3-6: Potential Residential-Sector Energy Savings Through Variable-Speed Motors
Energy SavingsApplication
MotorEnergy
109 kWh/yr
CurrentEfficiency
%
PracticalEfficiency
% % 109 kWh
Primary EnergySavings1012 Btu
TypicalPayback
Years
R/F&FreezerCompressor
101 80 88 20 20.2 222 8
Central A/C &Heat PumpCompressor1
159 87 90 35 55.7 612 15 - 25
Room A/CCompressor
25 87 90 10 2.5 28 20+
Room A/CFan/Blower
4 60 75 50 2.0 22 10
Indoor Heating& A/C Blowers
61 60 80 75 45.9 504 2 - 3
Total 350 N/A N/A N/A 126 1388 N/A
1 With a 2-speed induction motor, somewhat higher energy savings are possible with continuously variable speed, but thepayback period is longer (see Tables 3-9 and 3-10).
Basis: Replace single speed motor with efficient variable-speed drive and motor.Source: Tables 3-7 through 3-14Assumptions: An electric rate of $0.08/kWh is used. Evaporator fan savings include reduction in refrigeration (compressor) load.
Primary energy savings are calculated at the 1995 value of 11,005 Btuh/kWh. Savings include process energy savingsdue to more efficient part load operation.
Note that there are many design options for improving the system efficiency besidesimproving the motor efficiency or using variable-speed drives for efficient part loadoperation. Obvious examples include increased insulation, larger heat exchangers,adaptive defrost, etc. An inherent advantage of the NAECA efficiency standard settingprocess is that once a standard level is set, manufacturers are free to develop the mostcost-effective design to meet the standard. Thus, motor efficiency increases are only partof the potential for efficiency improvement in these types of appliances. Thisobservation is consistent with other published studies [ACEEE, 1995] of the potentialfor reduced energy consumption by motor driven equipment. Incremental, motorefficiency improvements generally account for only 10 to 20 percent of the estimatedpotential energy savings. The majority of these savings come from equipment, product,or process redesign. The use of adjustable-speed drives, which often requires a redesignfor the driven process, typically involves a much larger scope of activity thanincrementally increasing the motor efficiency.
3-15
3.2.1 Domestic Refrigerators and Freezers
Conventional domestic refrigerators and freezers can include up to three motors. Thelargest (typically 1/8 to 1/3 hp) motor drives the refrigerant compressor, which is neededin all refrigerators and freezers. The other two, much smaller motors (with shaft poweroutputs of a few watts) drive fans and force air over the condenser and evaporator. Themajority of frost-free refrigerators and freezers use a forced draft evaporator andcondenser. However, many manual defrost refrigerator/freezers, chest freezers andsmall, under-counter type refrigerators use a natural convection (sometimes referred toas a “static”) condenser and/or evaporator, and, therefore do not use the additional fanmotors.
From Table 3-6, variable-speed ECPMs used to power refrigerators and freezercompressors combined with ECPM driven condenser and evaporator fans have thepotential to reduce primary energy consumption by 222 x 1012 BTUs annually. At currentretail costs, the combined measures have a payback of eight years. When only the fansare evaluated, the payback is reduced to five years.
NAECA will increase the likelihood that refrigerator manufacturers will rely on efficientmotor technologies to meet the more stringent requirements. A great deal of researchand development expertise has been expended in the area of high-efficiency evaporatorfan motors. The emphasis is not only on radical departures from conventional motortechnologies however. Careful examination of the motor system, including the fan bladehas increased efficiency without adding significantly to cost. Cost-effectiveopportunities remain for system improvement in meeting standards. As the productionincreases for ECPM fan motors, the cost premiums can be expected to fall. In 2001,allowable refrigerator and freezer energy consumption will be reduced by an average ofabout 25 percent from current levels. This is likely to result in some use of variable-speed compressors, with the resulting sales volume also leading to gradual reductions incost.
Table 3-7 estimates the potential efficiency improvements and energy savings that couldbe attained compared to the installed base through incrementally higher motorefficiencies or variable-speed, based on the discussion that follows below. Table 3-8estimates the payback for each of the options in Table 3-7, for the average applicationand average residential electric rates.

3-16
Table 3-7: Potential for Energy Savings Through Increased Efficiency and Variable-SpeedRefrigerator/Freezer Motors (Base Site Motor Energy 1= 113 x 109 kWh/yr)
Estimated Annual Energy Savings2
On-siteMotor
(Base Energy,109 kWh/yr)
CurrentMotor
Efficiency(%)
Efficient MotorOption
PossibleEfficiency
(%) Percent (%) 109 kWhPrimary1012 Btu
Higher-EfficiencyInduction Motor
82 - 84 4 4.0 45
Fixed-SpeedECPM
88 9 9.2 101Compressor
(101)80
Variable-SpeedECPM3 88 20 20.2 222
High-EfficiencyPSC Motor
30 50 3.0 33Condenser Fan(6)
15ECPM 65 77 4.6 51
Higher-EfficiencyPSC Motor
30 834 5.0 55Evaporator
Fan(6)
15ECPM 65 1284 7.7 85
1 Base Site Motor Energy -- the estimated annual motor site electric energy consumption for this application, based on theefficiency of all motors in the installed base (Table 3-1).
2 Energy savings based on application of efficient motor option to the entire installed base, compared to base energy3 In conjunction with a variable-speed ECPM evaporator fan4 Energy savings include reduced compressor energy due to reduced refrigeration load @1.5 COP
Table 3-8: Cost-Effectiveness of Efficient Motor Options for Refrigerator/Freezers ¾¾EstimatedPayback for Average User at an Average Electricity Rate ($0.08/kWh)
Energy SavingsMotor
AverageUEC1
kWh/yr
Efficient MotorOption Percent (%) $/yr
AdditionalRetailCost, $
SimplePayback,
Years
Higher-EfficiencyInduction Motor
4 1.80 25 14
Constant-SpeedECPM
9 4.10 60 15Compressor 570
Variable-SpeedECPM
20 9.102 75 8
Higher-EfficiencyPSC Motor
50 2.00 10 5Condenser Fan 50
ECPM 77 3.10 20 6Higher-Efficiency
PSC83 3.30 10 3
EvaporatorFan
50ECPM 128 5.10 20 4
1 Unit Energy Consumption per year, based on Table 3-1 and engineering estimates2 Used with a variable-speed ECPM evaporator fan, included in the “additional retail cost”

3-17
3.2.1.1 Impact of NAECA StandardsEfficiency standards for refrigerators and freezers under NAECA went into effect in1990. The 1990 standard was replaced by a more stringent, revised standard in 1993that, on the average, lowered the allowable energy consumption of refrigerator/freezersby approximately 25 percent. A further revision of the standard will take effect in 2001and is projected to reduce allowable energy consumption by a further 25 percent. Thesestandards are very stringent. In the late 1970s, the average 18 cubic foot top-mountrefrigerator/freezer consumed approximately 2,000 kWh/year under standard DOE testconditions. The allowable energy consumption of this average 18 cubic foot top-mountunit under the current standard (1993) is approximately 670 kWh/year, about one-thirdof previous levels and approximately equivalent to a continuously powered 75W lightbulb. This reduction in energy consumption was achieved through various designchanges. The reduction of energy consumption to the 1,000 kWh/year level allowed inthe 1990 standard, was largely achieved through cabinet design changes, especially thesubstitution of polyurethane foam insulation for fiberglass. Further reductions of energyconsumption to the 1993 standard level have relied heavily on motor efficiencyimprovements.
3.2.1.2 Compressor MotorIn domestic refrigerators and freezers, a 115 VAC, single-phase, two-pole inductionmotor always drives the refrigerant compressor. The installed base includes severalbasic variants (e.g., RSIR, CSIR, and RSCR) but as a result of the NAECA standards, innew compressors, the vast majority of the compressor motors are one of the higherefficiency capacitor run types. In anticipation of the more stringent 2001 standards,manufacturers are already beginning to assess the higher-efficiency, higher-cost ECPMmotor, configured either as a high-efficiency constant-speed motor, or as a variable-speed motor.
Americold has worked with GE Motors to develop an ECPM motor driven compressor,in both single speed and variable-speed versions. The single speed compressor has anEER approaching 6.0 Btu/Wh, compared to 5.6 Btu/Wh in an otherwise equivalent,induction motor driven high-efficiency model, with the difference in efficiency beingattributable solely to the motor efficiency. Variable-speed models are capable of runningat speeds down to half the design speed.
The use of a variable-speed ECPM driven compressor in combination with variable-speed ECPM evaporator and condenser fan motors was examined in [EPA, 1993a].Energy savings of approximately 25 percent were estimated. An incremental retail priceof $75 was assumed in the present analysis. This somewhat optimistic figure is based onincremental OEM cost of $30 for the compressor, $15 for the ECPM fans, marked up to$75 at retail. The resulting payback period is about eight years, even under thisoptimistic scenario of the retail price impact. Additional benefits of variable speed

3-18
include very quiet, steady-state operation and rapid pulldown when warm food is placedinto the cabinet.
3.2.1.3 Evaporator Fan MotorIncreases in evaporator fan motor efficiency result in a “double” increase in refrigeratorefficiency, because the fan and motor are located within the refrigerated cabinet and theelectric energy input adds to the refrigeration load. Thus, not only does increasing theefficiency of this motor directly reduce the fan power, but compressor power is reducedas well, by virtue of the reduced refrigeration load. At current typical refrigerationsystem COP levels of approximately 1.5, compressor energy is reduced by an additionaltwo-thirds of any reduction in the evaporator fan energy use.
Until recently, shaded pole motors, with efficiencies between 10 and 15 percent andpower draw of about 15, were commonly used. The 1993 NAECA standard has resultedin widespread use of higher (20 to 30 percent) efficiency PSC motors, reducing the inputpower below 10W. The highest efficiency evaporator fan motor is an ECPM motor,whose efficiency is typically 65 percent and typical power input is 6W. The OEM costpremiums over shaded pole for PSC and ECPM motors are approximately $5 and $10,respectively (typical OEM prices for shaded pole, PSC, and ECPM fan motors are $5,$10, and $15, respectively). Despite the significant cost premium, ECPM evaporator fanmotors are under serious consideration as the more stringent 2001 NAECA standardsapproach closer.
3.2.1.4 Condenser Fan MotorCondenser fan motors in the installed base are generally low cost, low efficiency shadedpole induction motors, with efficiencies of approximately 10 percent. Typical powerconsumption is approximately 15W. Again, under the pressure of NAECA standards,higher-efficiency (20 to 30 percent) PSC motors are being used, reducing the powerconsumption to below 10W. ECPM fan motors that are more efficient could be used aswell, but the effective savings are only half that obtained with evaporator fan motorseven with the additional effect that it has on the refrigeration load. From the data inTable 3-8, the typical payback period for the investment in an ECPM motor (over a PSCmotor) in the condenser fan is 10 years.
3.2.2 Central Air Conditioners and Heat Pumps
Central air conditioners and heat pumps generally include two major sections:
� An outdoor unit containing the compressor, the condenser (or heat pump outdoorcoil, which operates as the evaporator in heating mode) and the condenser fan

3-19
� An indoor unit containing the evaporator (or heat pump indoor coil, which operatesas the condenser in heating mode) and the indoor air blower
The majority of central air conditioners are split systems with only 10 percent beingsingle package units. Both sections of the single packaged unit are located outdoorswith ducts running to and from the indoor conditioned space. The outdoor fan isoperating when there is a requirement for heating or cooling within the conditionedspace. The indoor blower distributes cooled or heated air throughout the interiordepending on the need. The heat sources include a heat pump cycle, electric resistanceheat, a gas or oil furnace, or a hot water heating coil. In addition, a significantpercentage of warm air furnaces are installed without central air conditioning. Becausethe indoor blowers and their drive motors are similar regardless of the exact combinationof heating or cooling devices, they are both discussed separately from the systems theyserve in the next section.
The technically feasible primary energy savings from efficient motors and VSDs forcentral system compressors is over 600 x 1012 BTU annually (Table 3-6). The majorityof these savings are obtained with a variable capacity compressor (two-speed, dualcompressor, or continuously variable speed) combined with a variable-speed indoorblower motor. At current costs for this option, the payback exceeds 15 years. Of themeasures identified, the use of higher-efficiency PSC motors in the indoor fan offersthe best payback at three years.
In general, other incremental increases in motor efficiency beyond the levels in commonuse will not result in significant energy savings nor be particularly cost-effective, withpayback periods typically greater than 10 years. The same applies to substituting thehigher-efficiency technology as part of the design of new equipment. Only theincremental cost of the higher-efficiency motor technology, more than the cost ofcommonly used technology, is considered in the payback calculation.
Finally, there is no real opportunity to cost-effectively retrofit more efficient motors intoexisting residential equipment. Many motors are closely integrated with the equipment,particularly hermetic compressor motors within sealed refrigeration systems. Even formotors that can indeed be replaced, total installed costs are prohibitive compared to thevalue of the energy savings. A variable-speed indoor blower motor, in another example,cannot be added to a fixed capacity system.
Table 3-9 summarizes the potential energy savings in air conditioning/heat pumpcompressors and outdoor unit fans, using incrementally higher-efficiency motors orvariable-speed drives. Table 3-10 estimates the cost-effectiveness of these options. Thetables are followed by a discussion of the technologies.

3-20
Table 3-9: Potential for Energy Savings Through Increased-Efficiency Central Air Conditioner andHeat Pump Motors (Base Site Motor Energy 1 = 180 x 109 kWh/yr, not including the indoor airblower)
Estimated Annual Energy Savings2
On-siteMotor
(Base Energy,109 kWh/yr)
CurrentMotor
EfficiencyPercent
Efficient MotorOption
PossibleEfficiency
(%)Percent
(%)109 kWh
Primary1012 Btu
Higher-EfficiencyInduction Motor
90 3 5.3 58
2-Speed Motor 85 303 47.7 525Compressor
(159)87
Variable-SpeedECPM
90 353 55.7 612
High-EfficiencyPSC Motor
70 29 6.1 66O.U. Fan
(21)50
ECPM 80 38 7.9 87
1 Base Site Motor Energy -- the estimated annual motor site electric energy consumption for this application, based on theefficiency of all motors in the installed base (Table 3-1).
2 Energy savings based on application of efficient motor option to the entire installed base, compared to base energy3 Used in conjunction with a variable-speed indoor blower motor. Includes savings due to variable capacity operation.
Table 3-10: Cost-Effectiveness of Efficient Motor Options for Central Air Conditioners and HeatPumps¾¾Estimated Payback for Average User at Average Electricity Rate (0.08/kWh)
Energy SavingsMotor
AverageUEC1
kWh/yr
Efficient MotorOption Percent
(%)$/yr
AdditionalRetailCost, $
SimplePayback,
Years
Higher-EfficiencyInduction Motor
3 4.80 60 12
2-Speed Motor 302 48 500 – 1,000 10 - 20Compressor
(159)2,000
Variable-SpeedECPM
352 56 1,000 – 1,500 15 - 25
Higher-EfficiencyPSC Motor
29 3.50 20 6O.U. Fan(21)
150ECPM 38 4.60 50 11
1 Note that UEC (ADL estimate) varies with climate and other site-specific variables. In areas with a long cooling season,larger savings and shorter payback periods result.
2 Used with a variable-speed indoor blower motor, included in the “additional retail cost”.
3.2.2.1 Single-Speed Compressor MotorWelded hermetic compressors are used in virtually all residential air conditioners andheat pumps. The efficiency level of compressors has been steadily increasing since the1970s. In 1975, a typical hermetic reciprocating compressor would have an energyefficiency ratio (EER) of 8.5 Btu/W - hr (compared to an isentropic compressor drivenby a 100 percent efficient motor, which could have an EER of 16.5). During the early1980s, reciprocating compressors with EER levels of 10.0, were introduced and since
3-21
1990, scroll compressors and high-efficiency reciprocating compressors having withEER values between 11.0 and 11.5 have been mass-produced.
With the exception of a small number of two-speed and variable-speed compressors, allcompressors are driven by two-pole, CSCR single-phase induction motors. Mostcompressor models are also available with 3-phase motors for small commercial airconditioning applications.
The aforementioned increase in the overall compressor EER has been achieved througha combination of improved compressor design and increased motor efficiency. Duringthe mid-70s, compressors motor efficiencies were somewhat less than 80 percent; incurrent compressors, motor efficiencies range from 87 to 90 percent, approaching withintwo to three percentage points of practical limits.
NAECA minimum efficiency standards have driven the latest increases in compressorefficiency levels (from 10.5 to 11.5) and compressor motor efficiency levels. Relativelylittle increase in compressor efficiency levels can be expected, given the relatively closefurther practical limits of both the compressor and motor. For example, an 80 percentefficient compressor driven by a 90 percent efficient motor would have an EER of 11.8,only slightly higher than current products. Increases beyond these levels are exceedinglydifficult to attain at the 2 to 5 hp residential size. Thus, relatively little potential forefficiency improvement remains.
As discussed below, variable-speed configurations can save significant amounts ofenergy.
3.2.2.2 Variable-Speed Compressor MotorThe capacity of an air conditioner is generally specified based on the anticipatedmaximum cooling load of the house, usually established by the design ambienttemperature and maximum mid-day solar heat gain. The ability to meet the cooling load,under these conditions, is important to consumer satisfaction with the product. However,a large majority of the operating hours occurs under much milder conditions, requiringonly a fraction of the cooling capacity of the air conditioner. In a typical central airconditioner having a single speed compressor, the unit cycles on and off, in response toa thermostat, to maintain the conditioned space at the desired set temperature. Underpart load conditions, continuous operation at efficiently modulated capacities isconsiderably more efficient than on/off cycling at full capacity, due to several factors:� When operating continuously at part load, the heat exchangers are better utilized,
resulting in a lower condensing temperature and a higher evaporating temperature,increasing the compressor COP significantly.
� Losses associated with on/off cycling can amount to 5 percent or more of the total
losses and are eliminated with continuous operation.
3-22
� At reduced capacity, the indoor air flow rate can be reduced. When this is done witha variable-speed blower, the speed cubed power law results in significant energysavings at 2/3 capacity and below.
A similar reasoning applies to the operation of a heat pump in heating mode. There aretwo basic options for implementing capacity modulation: � A continuously-variable-speed, motor-driven compressor with the ECPM motor–
the most efficient option; the application of a variable-speed compressor to a systemalong with an ECPM indoor blower results in an efficiency increase. This increasecan be expressed by improving the SEER value about 50 percent over an otherwiseidentical single-speed compressor system (e.g., from 10 Btu/Wh to 15 Btu/Wh).
� A two-speed motor, which results in a 30 to 40 percent efficiency increase (e.g.,
SEER increases from 10.5 Btu/Wh to 14 Btu/Wh) � Other non-motor-based discrete capacity steps, such as dual compressors (used in
the York “Stellar Ultra” product line) or cylinder unloading (as in the Bristol“Digital Inertia” compressor)
As indicated in Table 3-10, the most cost-effective option is the two-speed compressor,but none of the options returns a particularly short payback to the average user.
3.2.2.3 Condenser Fan MotorThe condenser fan motor power consumption is typically about 5 percent of the total airconditioner power consumption. A more efficient motor would result in some energysavings, with the savings from a more efficient PSC motor resulting in an approximatefive-year payback.
3.2.3 Indoor Air Blowers in Forced Draft Heating and Air Conditioning Systems
As discussed in the preceding subsection, indoor blowers are used to force cooled orheated air through ductwork, for central air conditioning and for heating from a varietyof sources. The indoor blower imparts sufficient static pressure to overcome the pressurelosses in the system. These losses consist of the pressure losses through the furnace core,the air filter, the evaporator coil, the supply air ducts and diffusers, and the return airpath (separate ductwork or through the conditioned space). Basically, it is a system offixed flow resistances, with the individual pressure drops being proportional to thesquare of the flow rate and the air moving power being proportional to the cube of theflow rate.
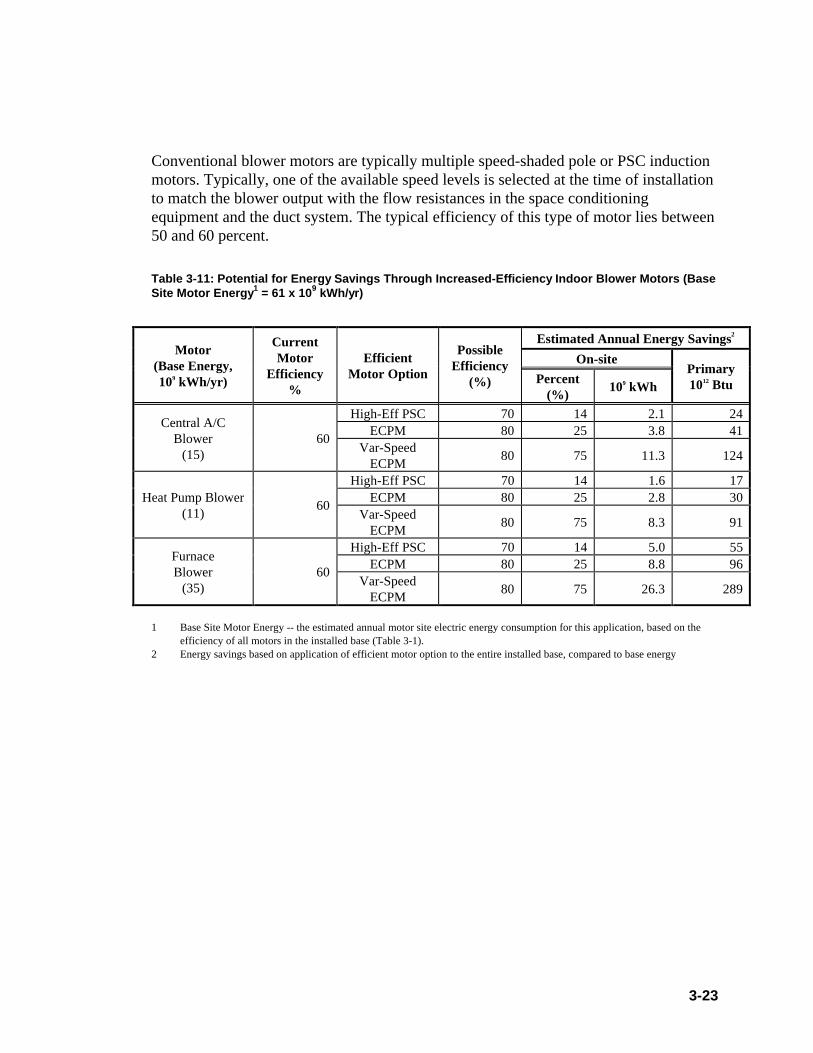
3-23
Conventional blower motors are typically multiple speed-shaded pole or PSC inductionmotors. Typically, one of the available speed levels is selected at the time of installationto match the blower output with the flow resistances in the space conditioningequipment and the duct system. The typical efficiency of this type of motor lies between50 and 60 percent.
Table 3-11: Potential for Energy Savings Through Increased-Efficiency Indoor Blower Motors (BaseSite Motor Energy 1 = 61 x 109 kWh/yr)
Estimated Annual Energy Savings2
On-siteMotor
(Base Energy,109 kWh/yr)
CurrentMotor
Efficiency%
EfficientMotor Option
PossibleEfficiency
(%) Percent(%)
109 kWhPrimary1012 Btu
High-Eff PSC 70 14 2.1 24ECPM 80 25 3.8 41
Central A/CBlower
(15)60
Var-SpeedECPM
80 75 11.3 124
High-Eff PSC 70 14 1.6 17ECPM 80 25 2.8 30Heat Pump Blower
(11)60
Var-SpeedECPM
80 75 8.3 91
High-Eff PSC 70 14 5.0 55ECPM 80 25 8.8 96
FurnaceBlower
(35)60
Var-SpeedECPM
80 75 26.3 289
1 Base Site Motor Energy -- the estimated annual motor site electric energy consumption for this application, based on theefficiency of all motors in the installed base (Table 3-1).
2 Energy savings based on application of efficient motor option to the entire installed base, compared to base energy
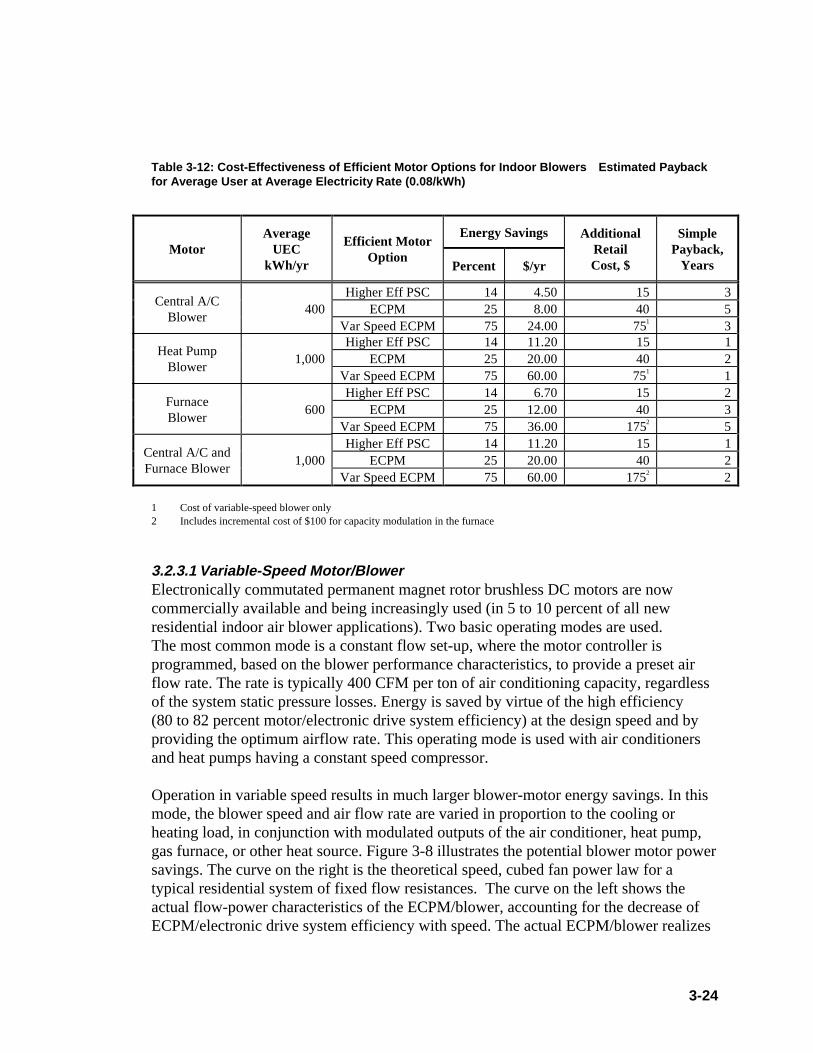
3-24
Table 3-12: Cost-Effectiveness of Efficient Motor Options for Indoor Blowers ¾¾Estimated Paybackfor Average User at Average Electricity Rate (0.08/kWh)
Energy SavingsMotor
AverageUEC
kWh/yr
Efficient MotorOption
Percent $/yr
AdditionalRetailCost, $
SimplePayback,
Years
Higher Eff PSC 14 4.50 15 3ECPM 25 8.00 40 5
Central A/CBlower
400Var Speed ECPM 75 24.00 751 3Higher Eff PSC 14 11.20 15 1
ECPM 25 20.00 40 2Heat Pump
Blower1,000
Var Speed ECPM 75 60.00 751 1Higher Eff PSC 14 6.70 15 2
ECPM 25 12.00 40 3FurnaceBlower
600Var Speed ECPM 75 36.00 1752 5Higher Eff PSC 14 11.20 15 1
ECPM 25 20.00 40 2Central A/C andFurnace Blower
1,000Var Speed ECPM 75 60.00 1752 2
1 Cost of variable-speed blower only2 Includes incremental cost of $100 for capacity modulation in the furnace
3.2.3.1 Variable-Speed Motor/BlowerElectronically commutated permanent magnet rotor brushless DC motors are nowcommercially available and being increasingly used (in 5 to 10 percent of all newresidential indoor air blower applications). Two basic operating modes are used.The most common mode is a constant flow set-up, where the motor controller isprogrammed, based on the blower performance characteristics, to provide a preset airflow rate. The rate is typically 400 CFM per ton of air conditioning capacity, regardlessof the system static pressure losses. Energy is saved by virtue of the high efficiency(80 to 82 percent motor/electronic drive system efficiency) at the design speed and byproviding the optimum airflow rate. This operating mode is used with air conditionersand heat pumps having a constant speed compressor.
Operation in variable speed results in much larger blower-motor energy savings. In thismode, the blower speed and air flow rate are varied in proportion to the cooling orheating load, in conjunction with modulated outputs of the air conditioner, heat pump,gas furnace, or other heat source. Figure 3-8 illustrates the potential blower motor powersavings. The curve on the right is the theoretical speed, cubed fan power law for atypical residential system of fixed flow resistances. The curve on the left shows theactual flow-power characteristics of the ECPM/blower, accounting for the decrease ofECPM/electronic drive system efficiency with speed. The actual ECPM/blower realizes
3-25
the majority of the potential for power reduction by reducing the airflow to match load,thus disproportionately reducing the power consumption.
In air conditioning mode, reduced blower power consumption also reduces the coolingload by the same amount, because blower power dissipation contributes an internal loadto the house. At a typical, seasonal average compressor COP of 4.0, compressor powersavings are 25 percent of any reduction in blower motor power input. However, inheating mode, the opposite occurs. Less blower energy dissipation requires additionalheat input. On a primary energy basis, the energy increase is 25 - 35 percent of the savedblower motor energy. Overall, the two effects tend to negate each other. Thus, no neteffect on the energy consumption of other system components is assumed in Tables 3-11and 3-12.
The energy saving potential is significant compared to operating in on/off mode. Forexample, at 50 percent output, the actual electric power to the blower is 10 percent ofthe power input to a conventional blower motor. However, the operating time isapproximately double. Therefore, the net energy consumption over time is 20 percentof the on/off mode energy consumption of a conventional blower motor.
As indicated in Table 3-12, a variable-speed ECPM blower is generally cost-effective,considering air moving equipment cost and air moving energy cost savings. However,a modulated heating or cooling source generally must be used in conjunction with thevariable capacity blower, so the energy savings and cost-effectiveness are more properlyviewed in the context of a complete variable capacity system. In section 3.2.2, thecontribution of the ECPM blower to both the cost and performance of variable capacityair conditioning and heat pump systems is included in the estimated energy savings andpayback period.
In the case of a warm air gas or oil furnace (the third case in Tables 3-11 and 3-12), theestimated incremental cost of a modulated firing rate is included in the additional retailcost. In this instance, even when the cost of modulated firing is included, the variable-speed blower is still cost-effective.

3-26
Figure 3-8: Variable-Speed Motor/Blower Power Consumption Characteristics
0 25 50 75 1000
25
50
75
100
Percent of Design Airflow
Fan Law
ECM Motor/Blower
3.2.4 Room Air Conditioners
Room air conditioners (RAC), often called window air conditioners, consume about 1/6of the energy consumed by central air conditioners and heat pumps in the residentialsector. The lower energy consumption is the result of lower unit capacities and shorterduty cycles. RACs also have comparable annual unit sales to central systems as well asshorter average product lifetimes. They are arranged so that one double-ended motordrives both the condenser fan and the indoor air blower. Therefore, room airconditioners have two motors�the compressor motor and the double-ended fan/blowermotor.
Significant energy savings can be obtained through variable capacity design ofresidential central air conditioners and heat pumps. Through the use of the DOE energyefficiency test procedure for residential central air conditioners and heat pumps [CFR430, Subt. B, Appendix M], a reasonable degree of consensus can be obtainedconcerning the energy savings. The DOE test procedure includes methods for measuringthe impact of several variable capacity options including multiple compressors, multiple
Percent of Power
3-27
speed compressors, and continuously variable-speed compressors. These procedureswere developed with significant industry input.
In contrast, there is no consensus test procedure for measuring energy savings due tovariable capacity design features of a room air conditioner. In DOE test procedure(CFR 430, Supt. B, Appendix F), the air conditioner is tested under a single set ofstandard conditions, at full capacity. In actual use, the homeowner will often want tooperate at less than full capacity. This is done more efficiently with a variable-speedcompressor and an ECPM fan/blower motor than with the typical arrangement ofcompressor on/off cycling and multi-speed induction fan motors. The validity of avariable capacity test procedure for room air conditioners, which could be used tocalculate real world energy savings, is debatable because many variables beyond theoutdoor temperature enter into the occupants’ selection of the capacity.
Nevertheless, some level of energy savings could be expected with an efficient variable-speed fan motor, a variable-speed compressor, or a combination of the two, because:
� The typical RAC has a two- or three-speed fan motor, which is particularlyinefficient at lower speeds, while an ECPM motor would capture most of thesavings associated with the speed cubed fan law.
� At reduced fan speeds, a variable-speed compressor would also operate at a reduced
speed, raising the evaporating and lowering the condensing temperatures, andimproving the COP.
3.2.4.1 Compressor MotorApproximately 95 percent of currently produced room air conditioners use the so-calledrotary (rolling piston, stationary vane type) compressors. The majority of thesecompressors are driven by single-speed 3500 RPM, two-pole, single-phase, PSC-typeinduction motors (for commercial applications, a limited selection of three-phase modelsare also available). As discussed in Section 2, this is the least costly high-efficiencyconfiguration for single-phase induction motors, because a separate starting capacitorand relay is not required. However, the starting torque is limited. The air conditioner offcycle must be long enough to allow refrigerant to bleed through the capillary tube to theevaporator, allowing high and low side pressures to equalize, before attempting to restartthe compressor.
According to [Dickey, 1994], motor efficiencies in currently produced compressorsrange from 84 to 89 percent. The range reflects the fact that compressors are produced ina finite number of shell diameters and consequently, a finite number of motor stator androtor diameters. At a fixed motor diameter, ranging the length of the lamination stackvaries the motor output and increases the efficiency variation. Current motor efficienciesare already close to practical limits, with an additional increase in efficiency of about

3-28
one to two percentage points being feasible, through design modification and the use oflower loss motor lamination steel.
3.2.4.2 Fan/Blower MotorThe fan motor consumes approximately 10 to 15 percent of the input energy to a roomair conditioner. Typically, two- or three-speed motors are used to provide a degree ofcapacity control and quieter operation at the lower fan speeds. According to [Beard,1994], the majority of RACs produced today use PSC motors to drive the fans, withrespectable full-speed efficiencies of 50 to 70 percent, depending on the capacity andnumber of fan speeds. This range of efficiencies is close to the practical limit forinduction motors. However, low-speed efficiencies are considerably less. The actualmotor power consumption does not decrease significantly at the lower speeds. Asdiscussed above, an ECPM motor would operate at an increased full-speed efficiency(by 10 to 15 percent on average) and at a significantly increased low-speed efficiencycompared to standard multiple-speed PSC motors.
3.2.4.3 Efficiency Improvement and Energy Savings PotentialTables 3-13 and 3-14 summarize the potential national energy savings and the paybackthat could be realized through application of incrementally higher-efficiency motors orvariable-speed motors. Potential energy savings of 15 percent were assumed for avariable-capacity, compressor blower/fan (approximately half of the savings obtainedwith variable speed in central air conditioners).
Table 3-13: Potential for Energy Savings Through Increased-Efficiency Room Air ConditionerMotors (Base Site Motor Energy 1 = 29 x 109 kWh/yr)
Estimated Annual Energy Savings2
On-siteMotor
(Base Energy,109 kWh/yr)
CurrentMotor
Efficiency(%)
EfficientMotor Option
PossibleEfficiency
(%)Percent 109 kWh
Primary1012 Btu
Higher-Efficiency PSC
89 2.2 0.6 6Compressor
(25)87 Variable-Speed
ECPM3 90 10 2.5 28
Fan/Blower(4)
60Variable-Speed
ECPM75 50
4 2 22
1 Base Site Motor Energy–the estimated annual motor site electric energy consumption for this application, based on theefficiency of all motors in the installed base (Table 3-1).
2 Energy savings based on application of efficient motor option to the entire installed base, compared to base energy3 In conjunction with a variable-speed ECPM evaporator fan4 Energy savings include reduced compressor energy due to reduced cooling load, more efficient low speed operation

3-29
Table 3-14: Cost-Effectiveness of Efficient Motor Options for Room Air Conditioners ¾¾EstimatedPayback for Average User at Average Electricity Rate ($0.08/kWh)
Energy SavingsMotor
Average UECkWh/yr
Efficient MotorOption
Percent $/yr
AdditionalRetailCost, $
SimplePayback,
Years
Compressor 900Higher-Efficiency
PSC2.2 1.60 20 13
ECPM VariableSpeed1
10 7.20 200 20+Fan/Blower 100
Variable ECPMSpeed2
502 4.00 40 10
1 Used with a variable-speed ECPM evaporator fan, included in the “additional retail cost”2 Energy savings include reduced compressor energy due to reduced cooling load, more efficient low speed operation
3.2.5 Clothes Washers
The estimated electric energy consumption of the drive motor for residential clotheswashers is somewhat more than 2 percent of the total motor electric energy consumptionin the residential sector. The typical washer drive motor is a 1/2 or 3/4 hp, two-speed1725/1140 RPM single-phase induction motor, with the lower speed used to operate a“gentle” or “delicate” cycle. At the typical efficiency levels of 60 percent to 65 percent,there is some margin for increase. However, with a typical duty cycle of only 200 hoursper year, the higher cost, higher-efficiency motor will not be cost-effective (200 hours x50W saved = 10 kWh/year or about $1 worth of energy cost savings). Energy forheating the hot water is a much more significant part of the total energy input to aclothes washer. Hot water energy is more than 90 percent of the total energy input evenat the current standard level which eliminates hot rinses and significantly limits warmrinses.
In the NAECA standards that established the current minimum efficiency for clotheswashers, one of the design options considered was increasing the efficiency drive motorfrom 65 percent in the base case to 75 percent (the difference between standard level 1and 2). The resulting incremental retail price increase of an average washer wasestimated to be $11.60 (in 1987 $), with calculated annual energy cost savings of $1.10(also in 1987 $), and a resulting payback period of 10 years.
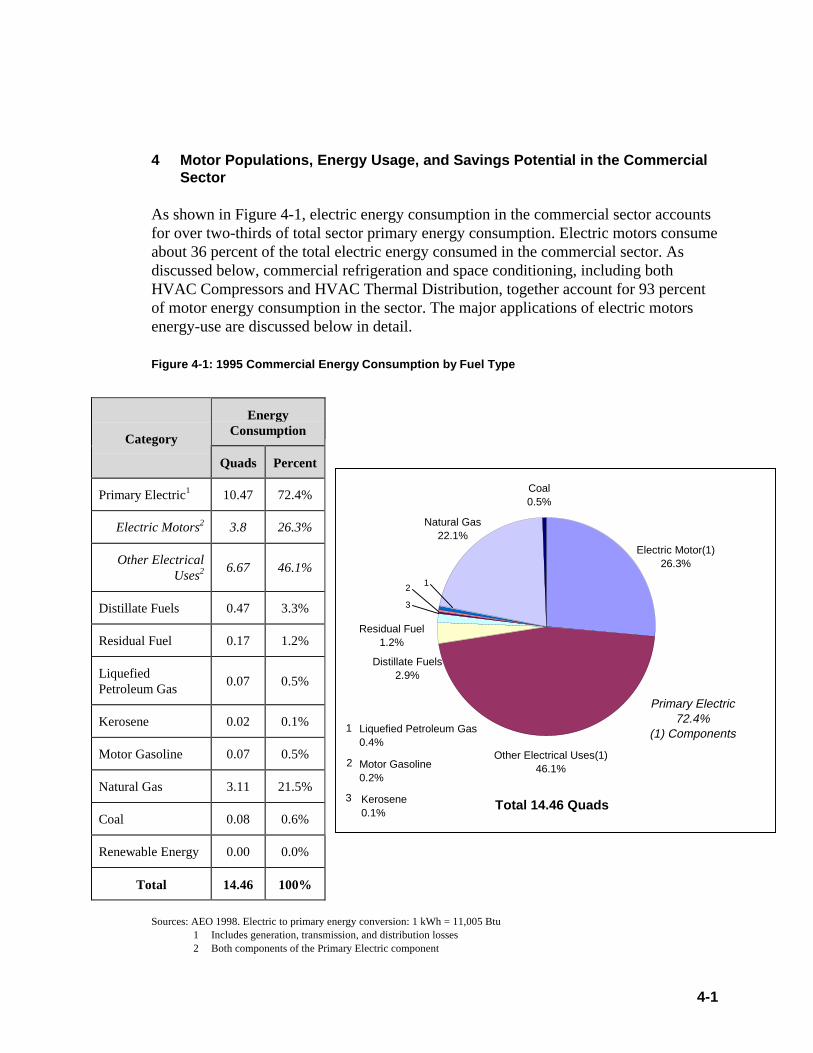
4-1
4 Motor Populations, Energy Usage, and Savings Potential in the CommercialSector
As shown in Figure 4-1, electric energy consumption in the commercial sector accountsfor over two-thirds of total sector primary energy consumption. Electric motors consumeabout 36 percent of the total electric energy consumed in the commercial sector. Asdiscussed below, commercial refrigeration and space conditioning, including bothHVAC Compressors and HVAC Thermal Distribution, together account for 93 percentof motor energy consumption in the sector. The major applications of electric motorsenergy-use are discussed below in detail.
Figure 4-1: 1995 Commercial Energy Consumption by Fuel Type
EnergyConsumption
Category
Quads Percent
Primary Electric1 10.47 72.4%
Electric Motors2 3.8 26.3%
Other ElectricalUses2
6.67 46.1%
Distillate Fuels 0.47 3.3%
Residual Fuel 0.17 1.2%
LiquefiedPetroleum Gas
0.07 0.5%
Kerosene 0.02 0.1%
Motor Gasoline 0.07 0.5%
Natural Gas 3.11 21.5%
Coal 0.08 0.6%
Renewable Energy 0.00 0.0%
Total 14.46 100%
Sources: AEO 1998. Electric to primary energy conversion: 1 kWh = 11,005 Btu1 Includes generation, transmission, and distribution losses2 Both components of the Primary Electric component
Primary Electric72.4%
(1) Components
Distillate Fuels2.9%
Liquefied Petroleum Gas0.4%
Kerosene0.1%
Natural Gas22.1%
Coal0.5%
Total 14.46 Quads
Residual Fuel1.2%
Motor Gasoline0.2%
1
1
2
2
3
3
Electric Motor(1)26.3%
Other Electrical Uses(1)46.1%
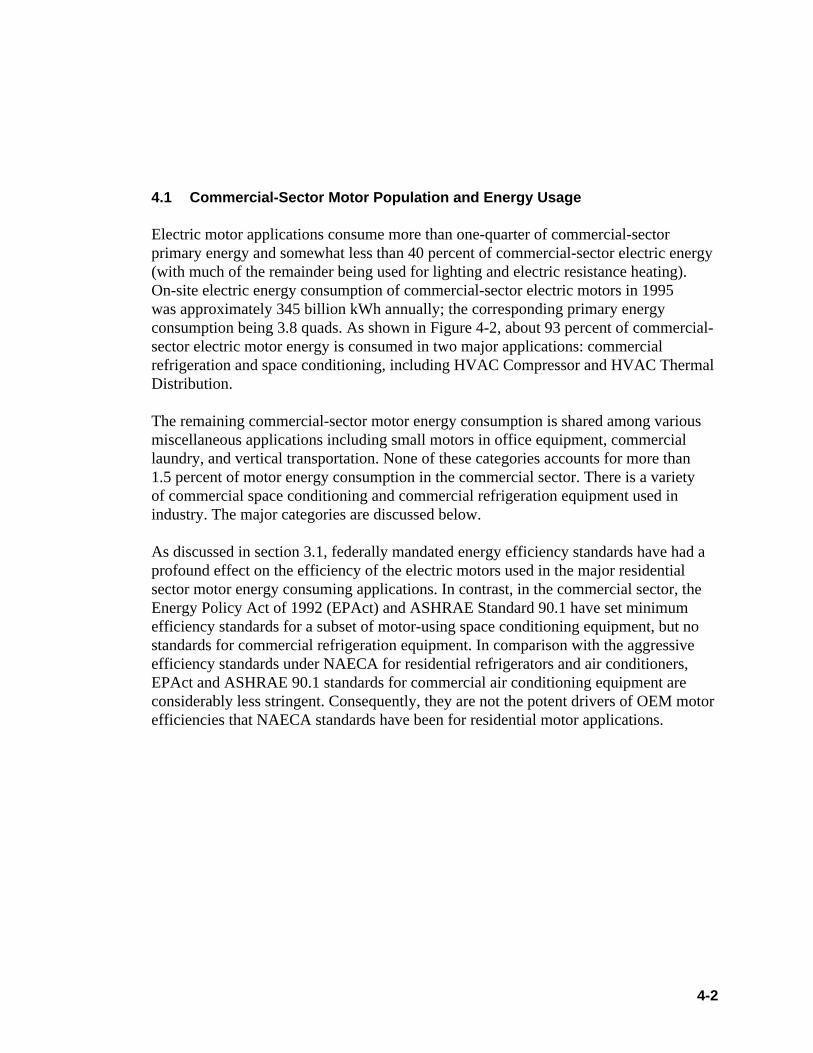
4-2
4.1 Commercial-Sector Motor Population and Energy Usage
Electric motor applications consume more than one-quarter of commercial-sectorprimary energy and somewhat less than 40 percent of commercial-sector electric energy(with much of the remainder being used for lighting and electric resistance heating).On-site electric energy consumption of commercial-sector electric motors in 1995was approximately 345 billion kWh annually; the corresponding primary energyconsumption being 3.8 quads. As shown in Figure 4-2, about 93 percent of commercial-sector electric motor energy is consumed in two major applications: commercialrefrigeration and space conditioning, including HVAC Compressor and HVAC ThermalDistribution.
The remaining commercial-sector motor energy consumption is shared among variousmiscellaneous applications including small motors in office equipment, commerciallaundry, and vertical transportation. None of these categories accounts for more than1.5 percent of motor energy consumption in the commercial sector. There is a varietyof commercial space conditioning and commercial refrigeration equipment used inindustry. The major categories are discussed below.
As discussed in section 3.1, federally mandated energy efficiency standards have had aprofound effect on the efficiency of the electric motors used in the major residentialsector motor energy consuming applications. In contrast, in the commercial sector, theEnergy Policy Act of 1992 (EPAct) and ASHRAE Standard 90.1 have set minimumefficiency standards for a subset of motor-using space conditioning equipment, but nostandards for commercial refrigeration equipment. In comparison with the aggressiveefficiency standards under NAECA for residential refrigerators and air conditioners,EPAct and ASHRAE 90.1 standards for commercial air conditioning equipment areconsiderably less stringent. Consequently, they are not the potent drivers of OEM motorefficiencies that NAECA standards have been for residential motor applications.
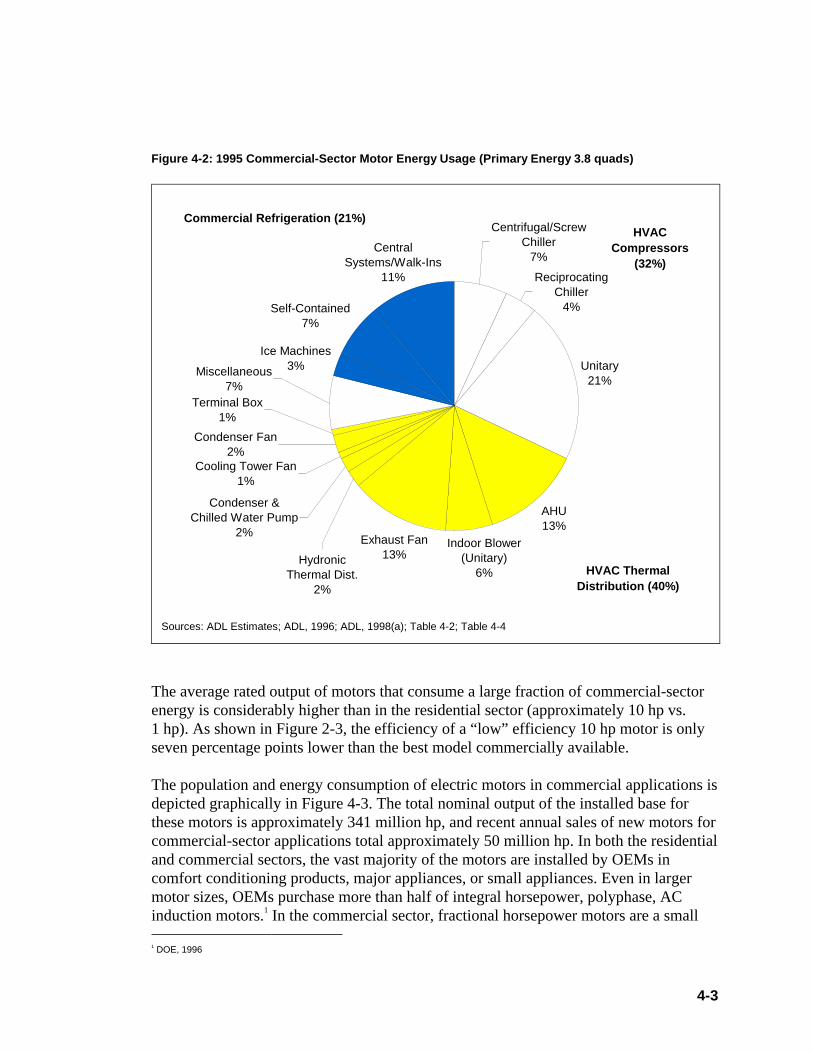
4-3
Figure 4-2: 1995 Commercial-Sector Motor Energy Usage (Primary Energy 3.8 quads)
Central Systems/Walk-Ins
11%
Self-Contained7%
Cooling Tower Fan1%
Ice Machines3%
Condenser Fan2%
Terminal Box1%
Miscellaneous7%
Condenser & Chilled Water Pump
2%
Hydronic Thermal Dist.
2%
Exhaust Fan13%
Indoor Blower (Unitary)
6%
Centrifugal/Screw Chiller
7%
Reciprocating Chiller
4%
Unitary21%
AHU13%
Commercial Refrigeration (21%)
HVAC Thermal Distribution (40%)
HVAC Compressors
(32%)
Sources: ADL Estimates; ADL, 1996; ADL, 1998(a); Table 4-2; Table 4-4
The average rated output of motors that consume a large fraction of commercial-sectorenergy is considerably higher than in the residential sector (approximately 10 hp vs.1 hp). As shown in Figure 2-3, the efficiency of a “low” efficiency 10 hp motor is onlyseven percentage points lower than the best model commercially available.
The population and energy consumption of electric motors in commercial applications isdepicted graphically in Figure 4-3. The total nominal output of the installed base forthese motors is approximately 341 million hp, and recent annual sales of new motors forcommercial-sector applications total approximately 50 million hp. In both the residentialand commercial sectors, the vast majority of the motors are installed by OEMs incomfort conditioning products, major appliances, or small appliances. Even in largermotor sizes, OEMs purchase more than half of integral horsepower, polyphase, ACinduction motors.1 In the commercial sector, fractional horsepower motors are a small 1 DOE, 1996

4-4
portion (approximately 8 percent) of the installed horsepower base. Within this base,motors below 20 hp account for approximately 42 percent of the total while motorsabove 20 hp account for approximately 58 percent of the total installed horsepower base.This contrasts significantly with the industrial sector, where previous studies haveestimated that 72 percent of motor energy is consumed by motors of over 50 hp capacity(only 5 percent of the motor population).
Figure 4-3: 1995 Commercial Building Sector Motor Inventory and Motor Energy Consumption byHorsepower Range for Major Applications
0.00
5.00
10.00
15.00
20.00
25.00
30.00
35.00
40.00
45.00
<1/10 hp 1/10 - 1/4hp
1/4 - 1/2hp
1/2 - 1 hp 1 - 2 hp 2 - 5 hp 5 - 10 hp 10 - 25 hp25 - 50 hp 50 - 100hp
100 - 250hp
250 - 500hp
Motor Horsepower Range (hp)
Inst
alle
d B
ase
of M
otor
s (M
M)
0.00
10.00
20.00
30.00
40.00
50.00
60.00
70.00
80.00
90.00
100.00
110.00
Ene
rgy
(kW
h X
10^
9)
0.090.32 0.020.12
Sources: Tables 4-1 to 4-21
Inventory Total(122.9 million)
Annual Energy ConsumptionTotal (356 X 10^9 kWh)
A broad understanding of motor efficiency distribution can be obtained by comparingthe average installed base efficiency and average new production with the minimumefficiency levels established by EPAct and influenced by NAECA. A furthercomparison can be made with the practical limits of induction motors to determine theunrealized efficiency gains. Figures 4-4 plots these efficiency levels for the commercial-size motors. At power levels above 20 hp, the efficiency difference between “low” and“high” efficiency motors declines to five or six percentage points (see a discussion ofthe cost-effectiveness of specifying incrementally higher-efficiency three-phase motorsin Section 2).
4-5
In the commercial sector, the efficiency of the installed base will be upgraded in similar,but more gradual fashion, due to EPAct and ASHRAE Std. 90.1. Under the EPAct-mandated standards that took effect in October 1997, previous NEMA efficient motorsare the minimum efficiency permitted for sale, applied to general-purpose integralhorsepower polyphase AC induction motors.
Figure 4-4: Comparison of the Efficiency of Three-Phase Induction Motors
1 2 5 10 20 50 100 200 500 1,000
60
70
80
90
100
Rated Motor Power, Horsepower
Ful
l Loa
d E
ffici
ency
, Per
cent
Practical Limit
Average New Production
Average Installed Base
4.2 Commercial-Sector Motor Energy Savings Potential
From the preceding section, commercial refrigeration and space conditioning, includingspace cooling and heating, thermal distribution for space cooling/heating, andventilation, together account for 93 percent of motor energy consumption within thecommercial sector. These two applications are in widespread use and involve significantmotor power and relatively high duty cycles, typically more than two thousandoperating hours per year.In this section, the commercial-sector energy savings potential and cost-effectiveness areevaluated for:
Source: ADL Estimates; MotorMaster+ 3.0

4-6
� Incrementally increasing the efficiency of motors� Application of adjustable-speed drives, where appropriate The opportunities to save energy are evaluated in terms of their energy saving potential,cost-effectiveness (at current cost levels), and the potential to improve the cost-effectiveness. Note that variable-speed drives are not evaluated for HVAC compressorapplications for the reasons given below, and that background data for HVAC thermaldistribution estimates are shown for incrementally higher-efficiency motors, notvariable-speed drives. Figure 4-5 summarizes the commercial-sector savings potential: about 564 trillion Btu ofenergy savings potential is estimated to exist, with 65 percent of the savings fromHVAC applications. Figure 4-6 shows that the use of incrementally efficient motorsgenerally carries an attractive payback in the commercial sector: over 85 percent of thetechnical savings potential has an estimated payback of under three years.Approximately 324 trillion Btus, over 90 percent of the potential savings, hasa payback less than five years. Although the total estimated commercial-sector savings is only about 35 percent that ofthe residential sector (see Fig. 3-7), the measures are significantly more cost-effective ina number of cases, most options having paybacks of three years or less. When onlymeasures with a payback of five years or less are considered, the savings potential of theresidential and commercial sectors are roughly equivalent (see the Executive Summary).Certain refrigeration applications such as the use of ECPMs in driving refrigerator fanshave particularly short paybacks, generally less than two years. In HVAC applications, the 1997 implementation of EPAct motor efficiency standardsappears to have been at least partially responsible for the presence of relatively smallprice differentials between high-efficiency motors and those of standard efficiency (theminimum EPAct efficiency for general purpose three-phase motors�see Table 2-1).This results in reasonable paybacks for a number of HVAC measures, primarily inapplications driving fans and pumps. Many of the compressor motor replacementmeasures currently tend to have paybacks in the range of five years. Note, however, thatat the time of this writing, EPAct efficiency standards were in place less than a year.Consequently, price differentials will continue to change, stabilizing with fewer linearityissues across the motor size range examined.

4-7
Figure 4-5: Allocation of Commercial Motor Savings Potential
RefrigerationApplications
w/VSD8%
RefrigerationApplications
w/o VSD26%
HVAC w/VSD51%
HVAC w/oVSD15%
Total Potential Savings "Best Options" is 564 Trillion Btus
RefrigerationApplications(195 TBtu)
34%
HVAC(369 TBtu)
65%
Sources: Tables 4-2, 4-4, 4-6, 4-8, 4-10, 4-12, Figure 4-7
Figure 4-6: Payback Period for Increased-Efficiency Motors in Commercial Applications
Payback 3-5 Years
(23.5 TBtu)
Payback > 5 Years
(22.4 TBtu)
Payback < 3 Years
(300.4 TBtu)
Sources: Tables 4-2, 4-4, 4-6, 4-8, 4-10, 4-12 through 4-21
Assumptions: 11,005 Btu/kWh heat rate; $0.08/kWh electric rate [DOE, 1998]; application of variable-speed drives not included Equipment Not Included: Roll-in Refrigerators & Freezers, Other Refrigerators/Freezers, Small Grocery
Figures 4-5 and 4-6 are based on the calculations noted in the tables in this section. Thesavings for refrigeration applications noted in Figure 4-5 are slightly less than thosenoted in Table 4-12. This is to account for the fact that compressor motor and evaporatorfan motor savings cannot be summed directly. Higher compressor motor efficiencies

4-8
result in a lowering of potential savings for evaporator fan motors. Savings for somemeasures have been reduced by about 5 percent, where appropriate, to estimate theresult of this effect. Note also that in the following tables, two sets of baselineefficiencies are used for two purposes. The calculations of energy savings are based on acomparison between high-efficiency motors and the estimated efficiency of the installedinventory. Calculations of payback, however, compare high-efficiency motors to thestandard motor efficiencies now available, which are generally near EPAct minimums.This reflects the actual economic choices that would be made currently in evaluating areplacement for a failed motor. The $0.08/kWh electric rate used in the calculations isthe 1996 average rate for the commercial sector [DOE, 1998]. Because each of the main three subgroups (compressors, thermal distribution, andrefrigeration) varies considerably in its technology, constitution of stakeholders andenergy savings potential, the subgroups are treated separately in sections 4.2.1, 4.2.2 and4.2.3, respectively.
4.2.1 Air Conditioning Compressors
Air conditioning equipment used in the commercial sector covers a wide range ofcooling capacities (from 1 ton to several thousands of tons) and systems, as summarizedin Table 4-1, and consumes nearly 1.7 quads of primary energy (Figure 4-2). Thisdiversity of systems includes small packaged systems (residential type room airconditioners, packaged terminal air conditioners, and residential central systems), larger
Table 4-1: 1995 Commercial Air Conditioning Equipment Compressor Motor Characteristics
Type of System Annual
Unit Sales2 AverageLifetime1
Installed Base5
CapacityRange, Tons
Motor PowerRange, hp
MotorEfficiency
Range Room Air Conditioner 829,860 11 9,128,460 1¼ and higher 1/2 – 3 80 - 88 PTAC3 212,418 15 3,186,270 1/2 - 1 1/2 1/2 – 2 80 - 85 Small Unitary4 589,100 15 8,836,500 2 - 5 2 – 5 80 - 90 Medium Unitary4 169,118 15 2,536,770 5 - 20 5 – 20 82 - 92 Large Unitary4 16,040 15 240,600 20 - 100 20 – 100 85 - 92 Reciprocating Chiller 13,000 20 210,000 10 - 150 7 1/2 – 150 85 - 92 Screw Chiller 2,500 20 20,000 50 - 1,000 40 – 750 90 - 94 Centrifugal Chiller 10,087 23 90,000 75 - 8,000 50 - 6,000 90 - 96 Absorption Chiller 500 23 8,000 100 - 1,500 None N/A
Sources: 1 DOE, 1998
2 USCB, 1995(b)3 Includes Packaged Terminal Heat Pumps4 Single Packaged A/C and Year-round Packaged A/C.5 ADL Estimates based on annual unit sales and average unit lifetimes
unitary systems (primarily rooftop systems) and chillers. The majority of the energy isconsumed by large tonnage systems with large (>10 hp) drive motors. In general, the

4-9
smaller systems are constant-capacity (single-speed, fixed-displacement, and single-compressor), while the larger systems incorporate some form of capacity modulation(e.g., multiple compressors, cylinder unloading, screw compressor slide valves, orcentrifugal compressor pre-rotation vanes). In currently produced equipment, with few exceptions, the drive motors are singlespeed, three phase induction motors with efficiencies that approach within a fewpercentage points of practical limits. Thus, the opportunity to improve air conditioningefficiencies through continuous variable capacity operation, instead of the full capacityon/off operation, is one that has largely been implemented in the commercial sector(with the exception of small-capacity systems). The maximum technical potential forprimary energy savings across the entire installed compressor base (using incrementallyhigher-efficiency motors) is approximately 76 trillion Btu (Table 4-2). This potentialwill be realized as older equipment is retired and replaced with equipment that is moreefficient.
Table 4-2: Potential Energy Savings With Incrementally Higher-Efficiency Commercial AirConditioning Compressor Drive Motors
Efficiency (%) Energy Savings Type of System
Annual Operating
Hours
CurrentEnergy
Consumption109 kWh7
Current Possible Site 109 kWh
Primary 1012 Btu
Payback
Room AirConditioner1
1000 7.8 87 90 0.23 2.5 5.9
PTAC1 1000 2.9 82 90 0.23 2.5 5.9 Small Unitary2 1000 23.3 85 93 1.9 20.9 1.6 Medium Unitary3 1200 26.1 87 94 1.8 19.8 4.5 Large Unitary4 1500 15.1 89 95 0.9 9.9 1.5 ReciprocatingChiller4 1500 13.2 89 95 0.8 8.8 1.5
Screw Chiller5 1500 3.6 92 96 0.1 1.1 5.0 CentrifugalChiller6 1500 21.6 93 97 0.9 9.9 5.8
Total — 113.6 — — 6.9 75.9 — Assumptions: Energy savings are calculated based on efficiencies shown, reflecting actual savings seen when replacing installedbase with new motor. Payback is calculated based on costs and efficiencies from Table 2-1. Sources: Tables 2-1 and 4-11 Based on 1 hp motor2 Based on 3 hp motor3 Based on 10 hp motor4 Based on 50 hp motor5 Based on 150 hp motor6 Based on 200 hp motor7 Calculation: Installed base * annual operating hours * [(assumed hp / efficiency) * 0.746]

4-10
4.2.2 Space Conditioning Thermal Distribution
Thermal distribution in commercial buildings encompasses four basic areas:heated/cooled/ventilation air distribution, chilled and hot water distribution, coolingwater circulation, and heat rejection to ambient air (via condensers and cooling towers).As in the case of commercial buildings and their equipment, various thermal distributionsystems are in use. Examples of these include small capacity, residential type, ductedand non-ducted air distribution systems, such as window air conditioners, PTACs, andsmall unitary systems, to large, complex hydronic systems including large air handlerswith extensive ductwork. An exhaustive treatment of this area is beyond the scope ofthis study, but the estimates developed below indicate that this is a promising energysavings area that should be examined. Again, the focus of this work is on the blower orpump drive motor and the opportunity for energy savings through motor enhancementssuch as higher-efficiency and variable-speed operation. Space conditioning energyconsumption and thermal distribution motor energy consumption are affected by manyother factors such as duct and pipe cross sections, duct leakage, insulation effectiveness,and control schemes that overcool and reheat the air. These factors would merit acomprehensive, system level evaluation, but are outside the scope of this work. For this work, a limited range of typical configurations represents the complexity andvariety of commercial building thermal distribution systems. Air and water distributionsystems are discussed below in separate sections, but a basic consideration common toboth is that part-load energy consumption can be reduced significantly with variableflow systems. Approximately 100 billion kWh is consumed on site (equivalent to about 1.1 quadsprimary) to drive fans and blowers used for a variety of functions. Some examplesinclude the distribution of heated and cooled air within commercial buildings, to rejectheat from commercial building air conditioning systems, to distribute hot and chilledwater and to circulate HVAC system cooling water. This large magnitude (about two-thirds of commercial building air conditioner compressor power consumption) reflectsthe fact that heating and cooling effects often have to be transported over long distancesin commercial buildings. Significant energy savings are possible through this motortechnology, particularly with the applications of variable-speed blower drives to interiorconditioned air distribution. In new installations, the incremental investment in avariable-speed drive for air handling is generally cost-effective, with payback periodsranging from two to five years. The makeup of the potential savings is illustrated inFigure 4-7. This savings is accomplished through either more-efficient motors oradjustable-speed drives.
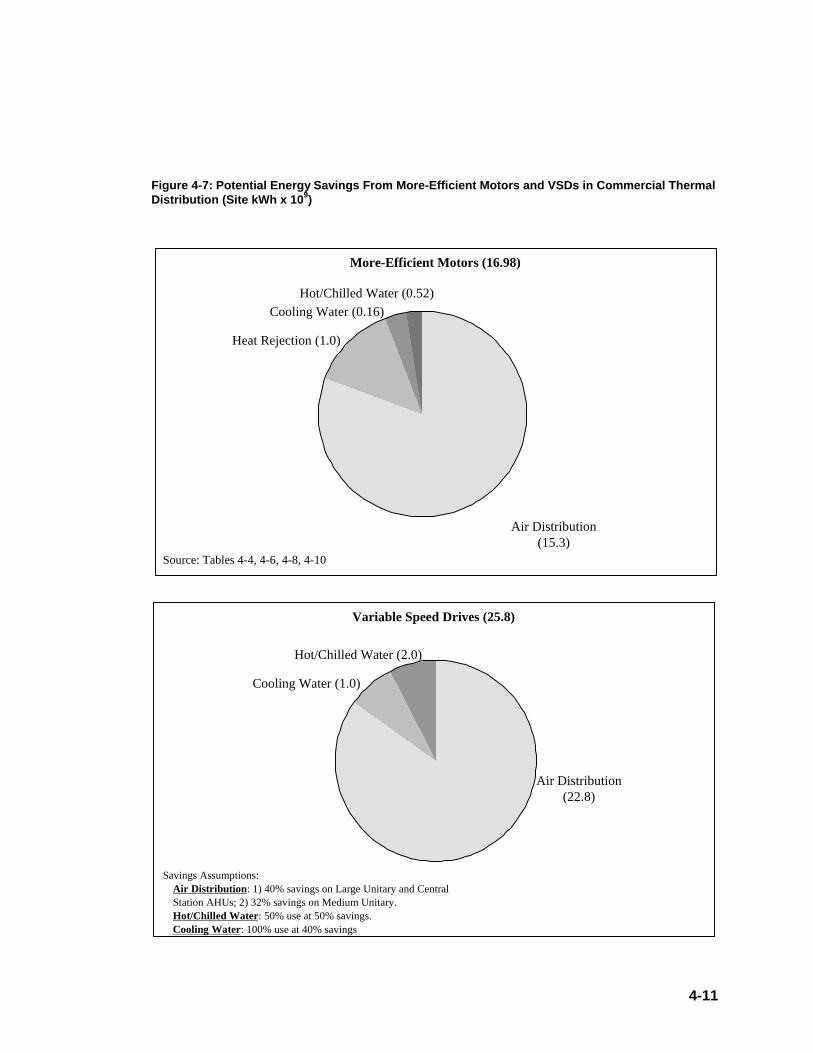
4-11
Figure 4-7: Potential Energy Savings From More-Efficient Motors and VSDs in Commercial ThermalDistribution (Site kWh x 10 9)
Variable Speed Drives (25.8)
More-Efficient Motors (16.98)
Savings Assumptions:Air Distribution : 1) 40% savings on Large Unitary and CentralStation AHUs; 2) 32% savings on Medium Unitary.Hot/Chilled Water : 50% use at 50% savings.Cooling Water: 100% use at 40% savings
Cooling Water (1.0)
Air Distribution(22.8)
Hot/Chilled Water (2.0)
Air Distribution(15.3)
Hot/Chilled Water (0.52)
Cooling Water (0.16)
Heat Rejection (1.0)
Source: Tables 4-4, 4-6, 4-8, 4-10
4-12
4.2.2.1 Air Distribution As described in [Sun, 1993] there is a considerable variety of commercial building air-distribution configurations. The following are currently the most commonly used: � Local recirculating systems with small packaged equipment such as room air
conditioners and PTACs with room fan coil units � Ducted air distribution from small, residential-scale, unitary air conditioning
systems, which usually also include a heat source (gas furnace, heat pump, orelectric resistance); The blower speed and airflow rates are generally constant,operating in an on/off mode in response to a cooling or heating demand.
� Ducted air circulation systems from rooftop unitary systems, similar to a residential
central air conditioning system (but larger); Rooftop air conditioners are available insingle-zone and multi-zone configurations (with each zone typically having adedicated interior air blower), with constant or variable air volume. From theviewpoint of motor efficiency and motor energy consumption, zoning is not animportant distinction but, as discussed below, variable-air-volume systems will useless energy seasonally. The vast majority of these systems are constant-air-volumesystems.
� Constant-air-volume central station air handlers supplying large ducted air
distribution systems; As the name implies, blowers operate continuously at fulloutput, supplying both heated and cooled air blended, as needed, in individual zonesto maintain the desired temperature.
� Variable-air-volume central station air handlers used in large commercial buildings
where heating and cooling are needed simultaneously within the building; Airflowrates are varied in response to a demand for heating or cooling.
Table 4-3 estimates the installed base of commercial-sector interior air distribution fanand blower motors. Table 4-4 provides an estimate of blower-motor energy consumptionand potential savings through specifying increased efficiency motors. Generally it iscost-effective to specify a higher-efficiency motor instead of a lower-efficiency motor,but not cost-effective to carry out an early retrofitting of a high-efficiency motor in placeof a lower-efficiency one.

4-13
Table 4-3: Motors in Commercial-Sector Interior Air Distribution (Space Cooling and SpaceHeating¾¾1995)
Blower Motor Type of System
Annual Unit Sales2
AverageLifetime1
Installed Base5 Horsepower Efficiency
Room Air Conditioner 829,860 11 9,128,460 1/10 – 1/3 50 – 70 PTAC3 212,418 15 3,186,270 1/10 – 1/4 50 – 70 Small Unitary4 589,100 15 6,193,029 1/4 – 3/4 60 – 80 Medium Unitary4 169,118 15 1,780,161 1 - 5 70 – 85 Large Unitary4 16,040 15 167,113 5 - 25 80 – 90 Exhaust Fan 836,2386 156 12,543,5766 1/4 – 3/4 60 – 80 Room Fan Coil 234,650 15 3,519,750 1/10 – 1/4 50 – 70 Central Station AHU 336,207 15 1,780,429 5 - 25 80 – 90
Sources: 1 DOE, 19982 USCB, 1995(b)3 Includes Packaged Terminal Heat Pumps4 Single Packaged A/C and Year-round Packaged A/C.5 ADL Estimates based on annual unit sales and average unit lifetimes6 Estimate based on ADL, 1998(a) energy usage calculation.
Calculation: Base = Energy Consumption (in kWh) / [(Effective Full Load Hours of 5681 ave) * [(Assumed hp of 0.5/ Assumed Efficiency of 60 percent) * 0.746]]
Table 4-4: Potential Energy Savings With Incrementally Higher-Efficiency Interior Air DistributionBlower Drive Motors ¾¾Commercial Buildings
Efficiency % Savings
Type of System
Typical Annual
Operating Hours
CurrentEnergy
Consumption 109 kWh6
Current Possible Site 109 kWh
Primary 1012 Btu
PaybackPeriod(yrs)
Room AirConditioner1
1000 1.9 60 75 0.3 3.3 7.7
PTAC1 1500 1.2 50 75 0.3 3.3 2.6 Small Unitary2 2000 7.7 60 80 1.5 16.5 0.0 MediumUnitary3 2500 8.3 80 90 0.8 9.1 0.4
Large Unitary4 3000 4.4 85 92 0.3 3.3 0.6 Exhaust Fan2 56815 44.3 60 80 8.9 97.9 0.0 Room Fan Coil1 2000 1.8 50 75 0.5 5.5 2.2 Central StationAHU4 3000 45.8 87 93 2.7 29.7 0.7
Total — 115.4 — — 15.3 168.6 Assumptions: Energy savings are calculated based on efficiencies shown, reflecting actual savings seen when replacing installedbase with new motor. Payback is calculated based on costs and efficiencies from Table 2-1. Sources: Tables 2-1, 2-3 and 4-31 Based on 1/6 hp ECPM vs. PSC motor with 100 percent retail markup.2 Based on 1/2 hp induction motor. [Grainger] indicates no cost differential for high-efficiency motor3 Based on 2 hp motor4 Based on 10 hp motor5 Based on average from ADL, 1998(a) for Exhaust Fan EFLH6 Calculation: Installed base * annual operating hours * [(assumed hp / efficiency) * 0.746]

4-14
Variable-air-volume systems save air motive power by varying the airflow rate inproportion to the heating and cooling loads. In addition, variable-air-volume systemsprovide significant energy savings because they minimize overcooling and reheating ofconditioned air. The focus here is on air-moving blower motor energy savings. The inherent blower power savings available in variable air volume systems areillustrated in system curves which plot typical system static pressure loss vs. flow rateand the corresponding air moving power. These curves are typical of complex airdistribution systems where a constant air supply pressure is maintained at the diffuserswhere conditioned air is introduced into the conditioned space as demanded by heatingor cooling requirements. In simpler distribution systems, where no minimum staticpressure is required at the diffusers, the pressure-flow and power-flow curves follow aflow-squared and flow-cubed relationship, respectively. The air moving power at 1/2flow will only be 1/8 of the full flow power in this system. Airflow rates are varied in VAV systems using several basic methods:� Output throttling, e.g., with a motorized damper (the least efficient way)� Inlet guide vanes (more efficient than throttling)� Variable-ratio transmissions between the motor and blower shaft (efficient)� Variable-speed drive of the blower motor (most efficient) The first two of these techniques vary the air flow rate by throttling or partiallythrottling the air flow, and as a result, fail to realize significant motor energy savings. Inaddition, since these techniques do not involve enhanced motor performance, they areoutside the scope of this study. Varying the airflow rate using a variable-speed blowerdrive does realize significant energy savings because the speed-pressure-flowcharacteristic of the blower matches the flow-pressure loss characteristic of the ductsystems. In a simple, ducted air distribution system operated in an on/off mode, significantsavings, greater than half the blower energy, can be realized by a continuous variable-speed operation, capacity modulated mode. This is essentially the residential central airconditioning operating mode discussed in Section 3.2.3. A capacity modulated coolingand heating source is needed along with the variable-speed blower motor. In applying a variable-speed drive to a more complex, large building air distributionsystem, less energy savings are realized because a minimum air supply pressure must bemaintained at the diffusers, regardless of the demand. Nevertheless, energy savingsbetween 25 and 40 percent of the input energy to a throttled VAV can be realized. Onaverage, the payback period on the investment in an inverter drive for a variable-speedmotor is only a marginally attractive five years [ACEEE, 1991]. Electric utility rebateprograms have played a major role in many VSD applications in this area.
4-15
In a pilot study of VSDs performed by the EPA for the Energy Star Buildings program[EPA, 1993], surveys and field tests were conducted in 10 buildings around the country.In comparison to variable-inlet vanes (VIVs), VSDs provided an average energy savingsof 52 percent and average demand savings of 27 percent. The average, simple payback period was two and a half years. The following were themajor lessons learned from the experiments:� VSDs are usually profitable, especially if the existing fan is oversized.� The benefits are diminished if the fan runs at or near the rated capacity for long
periods.� Backward-inclined airfoil fans are the best candidates for VSDs. Forward-curved
fans become unstable and are difficult to control at lower speeds. Also, to limit power quality degradation, VSDs should be equipped with:� Internal power factor correction capacitors� Integral harmonic filters to reduce the total current harmonic levels to within
5 percent To estimate the energy savings potential of VSDs, the following assumptions are used:� 80 percent of Medium Unitary Systems are candidates for VSDs. For VSD potential
applications, energy savings are estimated at 40 percent.� 100 percent of all Large Unitary and Central Station AHUs are candidates for VSDs.
VSDs result in 40 percent energy savings. As shown in Figure 4-7, the total potential energy savings from VSDs in interior airdistribution blower systems is 23 billion kWh.
4.2.2.2 Hydronic Hot and Chilled Water Circulation/Distribution Hydronic thermal (chilled water and hot water) distribution systems tend to be used infairly large systems, with pump motor power ranging from 1 to 25 hp. Tables 4-5 and4-6 summarize the energy use and potential energy savings. The majority of the systemscontain reasonably efficient three-phase motors, generally within five percentage pointsor closer of the best available motor efficiency. At partial cooling or heating loads, thewater circulation rate could be reduced with a variable-speed drive resulting insignificant energy savings. To gain these significant savings, the entire hydronicdistribution system must be designed to operate in a variable flow/variable head mode.Larger horsepower systems represent the most cost-effective applications for VSDs,because inverter cost per horsepower is lower and the cost of controls is spread over agreater potential savings base.

4-16
Table 4-5: Motors in Commercial-Sector Hydronic Thermal Distribution (1995)
Pump Motor - Typical Type of Air
Conditioning System Annual
Unit Sales2 AverageLifetime1
Installed Base3 Horsepower
(hp) Efficiency
(%) Centrifugal Chiller 10,087 23 90,000 20 90 Screw Chiller 2,500 20 20,000 15 90 Reciprocating Chiller 13,000 20 210,000 5 88 Absorption Chiller 500 23 8,000 25 90 Hydronic Boiler 15,1864 23 350,000 15 90
Sources: 1 DOE, 19982 USCB, 1995(b)3 ADL Estimates based on annual unit sales and average unit lifetimes4 ADL Estimates based on [Appliance 1998]
Table 4-6: Potential Energy Savings With Incrementally Higher-Efficiency Drive Motors for HydronicCirculation Pumps in Commercial Buildings
MotorEfficiency (%) Annual Savings
Type of System
TypicalAnnual
Operating Hours
CurrentEnergy
Consumption 109 kWh3 Current Possible Site
109 kWh Primary1012 Btu
Payback(years)
Centrifugal Chiller1 1500 1.3 90 95 0.1 1.1 0.6 Screw Chiller2 1500 0.1 90 94 0.01 0.1 2.2 Reciprocating Chiller2 1500 1.2 88 93 0.1 1.1 1.7 Absorption Chiller1 1500 0.1 90 95 0.01 0.1 0.6 Hydronic Heating2 1500 6.44 90 94 0.3 3.3 2.2 Total — 9.1 — — .52 5.7 — Assumptions: Energy savings are calculated based on efficiencies shown, reflecting actual savings seen when replacing installedbase with new motor. Payback is calculated based on costs and efficiencies from Table 2-1. Sources: Tables 2-1 and 4-5 1 Based on 25 hp motor costs and efficiencies.2 Based on 10 hp motor3 ADL Estimate based on the calculation: Installed base * annual operating hours * [(assumed hp / efficiency) * 0.746], and a
factor of 0.48 for pumps.4 ADL Estimate based on the calculation: Installed base * annual operating hours * [(assumed hp / efficiency) * 0.746], and a
factor of 1.5 for heating pumps A rough estimate of the potential energy savings for a variable-speed/variable flowhydronic system can be made by equally distributing the operating hours over a capacityrange from 100 percent to 25 percent of the design flow. Since the hydronic distributionsystem includes fixed resistances, the power-flow rate cubed relationship provides areasonably accurate model of system behavior. In this instance, allowing for inverterefficiency at full and part load, the energy savings would be 50 percent as compared to aconstant flow system. The potential savings are approximately 2-3 billion kWh based onthe assumption that a majority of the installations could use this type of variable-

4-17
speed/variable flow system. For a 10 hp pump, operating 2,000 hours per year, at8¢/kWh, electric energy consumption would be 16,700 kWh/year and energy costs will
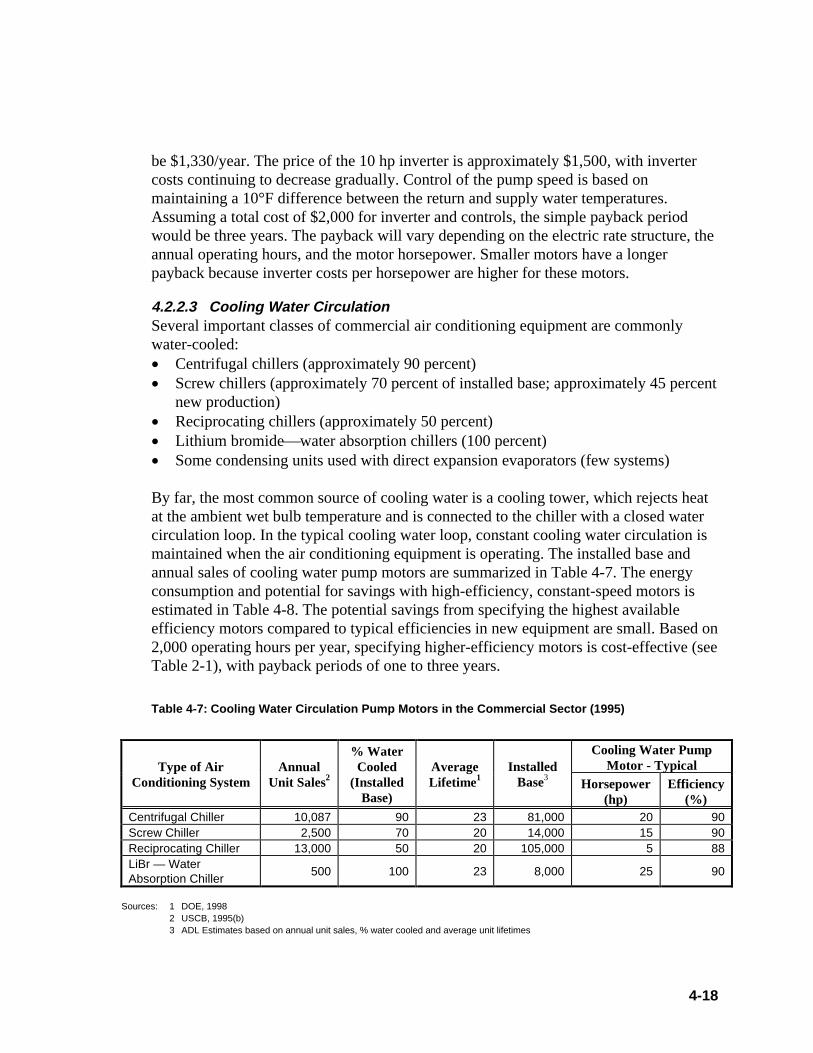
4-18
be $1,330/year. The price of the 10 hp inverter is approximately $1,500, with invertercosts continuing to decrease gradually. Control of the pump speed is based onmaintaining a 10°F difference between the return and supply water temperatures.Assuming a total cost of $2,000 for inverter and controls, the simple payback periodwould be three years. The payback will vary depending on the electric rate structure, theannual operating hours, and the motor horsepower. Smaller motors have a longerpayback because inverter costs per horsepower are higher for these motors.
4.2.2.3 Cooling Water Circulation Several important classes of commercial air conditioning equipment are commonlywater-cooled:� Centrifugal chillers (approximately 90 percent)� Screw chillers (approximately 70 percent of installed base; approximately 45 percent
new production)� Reciprocating chillers (approximately 50 percent)� Lithium bromide�water absorption chillers (100 percent)� Some condensing units used with direct expansion evaporators (few systems) By far, the most common source of cooling water is a cooling tower, which rejects heatat the ambient wet bulb temperature and is connected to the chiller with a closed watercirculation loop. In the typical cooling water loop, constant cooling water circulation ismaintained when the air conditioning equipment is operating. The installed base andannual sales of cooling water pump motors are summarized in Table 4-7. The energyconsumption and potential for savings with high-efficiency, constant-speed motors isestimated in Table 4-8. The potential savings from specifying the highest availableefficiency motors compared to typical efficiencies in new equipment are small. Based on2,000 operating hours per year, specifying higher-efficiency motors is cost-effective (seeTable 2-1), with payback periods of one to three years.
Table 4-7: Cooling Water Circulation Pump Motors in the Commercial Sector (1995)
Cooling Water Pump
Motor - Typical Type of AirConditioning System
Annual Unit Sales2
% WaterCooled
(InstalledBase)
AverageLifetime1
Installed Base3 Horsepower
(hp) Efficiency
(%) Centrifugal Chiller 10,087 90 23 81,000 20 90 Screw Chiller 2,500 70 20 14,000 15 90 Reciprocating Chiller 13,000 50 20 105,000 5 88 LiBr — WaterAbsorption Chiller 500 100 23 8,000 25 90
Sources: 1 DOE, 1998 2 USCB, 1995(b) 3 ADL Estimates based on annual unit sales, % water cooled and average unit lifetimes

4-19
Table 4-8: Potential Energy Savings With Incrementally Higher-Efficiency Cooling Water PumpDrive Motors
Efficiency (%) Savings
Type of System
TypicalAnnual
OperatingHours
Current Energy
Consumption 109 kWh 4
Current Possible1 Site 109 kWh
Primary 1012 Btu
Paybackperiod (yrs)
Centrifugal Chiller2 1500 1.4 90 95 0.1 1.1 0.6 Screw Chiller3 1500 0.1 90 94 0.01 0.1 2.2 ReciprocatingChiller3 1500 0.7 88 93 0.04 0.4 1.7
LiBr WaterAbsorption Chiller2
1500 0.2 90 95 0.01 0.1 0.6
TOTAL 2.4 — — 0.16 1.7 Assumptions: Energy savings are calculated based on efficiencies shown, reflecting actual savings seen when replacing installedbase with new motor. Payback is calculated based on costs and efficiencies from Table 2-1. Sources: Tables 2-1 and 4-71 Maximum practical efficiency at median motor power, per Figure 2-32 Based on 25 hp motor costs and efficiencies3 Based on 10 hp motor4 ADL estimate based on the calculation: Installed base * annual operating hours * [(assumed hp / efficiency) * 0.746], and a
factor of 0.56 for condenser pumps.
Within the loop, head losses consist of:� Pressure loss through piping (wall friction, elbows, other fittings, and valves)� Pressure loss through condenser tubing� Pressure loss in cooling tower water piping and distribution nozzles� Gravity head loss through cooling tower (height difference between the distribution
nozzles and the sump) The first three of these losses, which are flow friction losses following the familiar flow-rate-cubed vs. power characteristic, are 80 to 90 percent of the total head loss. Thebalance of the head loss is consumed by the gravity head loss in the cooling tower. Atpart load, with heat rejection well below design levels, a variable-speed drive on thepump motor could be used to reduce the flow rate. This would reduce powersignificantly due to the small fixed gravity head loss and the speed/flow-cubed powerlaw. However, a reduction of the cooling water flow rate will result in a small increasein the condensing temperature, offsetting some of the pump power savings. An analysisof this trade-off is beyond the scope of this study. An upper bound on the potentialenergy savings and cost-effectiveness is established assuming that no additionalcompressor power results from reducing the cooling water flow rate at part load. Power savings of 40 percent could be realized in a constant flow system, not includingthe fixed gravity head loss through the cooling tower, with potential total site energysavings of 1 billion kWh. Again, more detailed analysis of the impact on condensing

4-20
temperature and compressor power consumption are needed to evaluate whether this is aviable approach for saving energy.
4.2.2.4 Heat Rejection to Ambient Air The ultimate heat sink for nearly all commercial air-conditioning equipment, whether airor water-cooled, is ambient air. The cooling water in water-cooled systems usuallypasses through a cooling tower, which rejects heat to air as latent heat. Both air-cooledcondensers and cooling towers require forced airflow over and through the heat orheat/mass transfer surface. Table 4-9 summarizes the numbers and sizes of motorstypically used for heat rejection from commercial air conditioning systems. Table 4-10summarizes the potential for energy savings through upgrading the efficiency of thesemotors from current levels to the best possible level.
Table 4-9: Motors in Commercial-Sector Air Conditioning Heat Rejection (1995)
Fan/Blower Motor Type of System Annual
Unit Sales2 AverageLifetime1
Installed Base5 Horsepower Efficiency
Room Air Conditioner9 829,860 11 9,128,460 1/10 – 1/3 50 – 70 PTAC3,9 212,418 15 3,186,270 1/10 – 1/4 50 – 70 Small Unitary4 589,100 15 6,193,029 1/4 – 1/2 50 – 70 Medium Unitary4 169,118 15 1,780,161 3/4 – 2 70 – 80 Large Unitary4 16,040 15 167,113 2 - 10 80 – 90 Air Cooled ScrewChillers 1,3752,6 20 6,0005,7 1 – 10 80 - 90
Air CooledReciprocating Chillers 13,0002,8 20 105,0005,8 2 - 10 80 – 90
Cooling Tower 8,948 20 178,960 5 - 25 80 – 90 Sources: 1 DOE, 1998
2 USCB, 1995(b)3 Includes Packaged Terminal Heat Pumps4 Single Packaged A/C and Year-round Packaged A/C5 ADL Estimates based on annual unit sales and average unit lifetimes6 ADL Estimates of new air cooled production @ 55 percent7 ADL Estimates of current installed base @ 30 percent8 ADL Estimates of current installed base and new production @ 50 percent9 One double ended motor drives both the indoor air blower and the condenser fan. Energy savings already counted with
interior air handling.
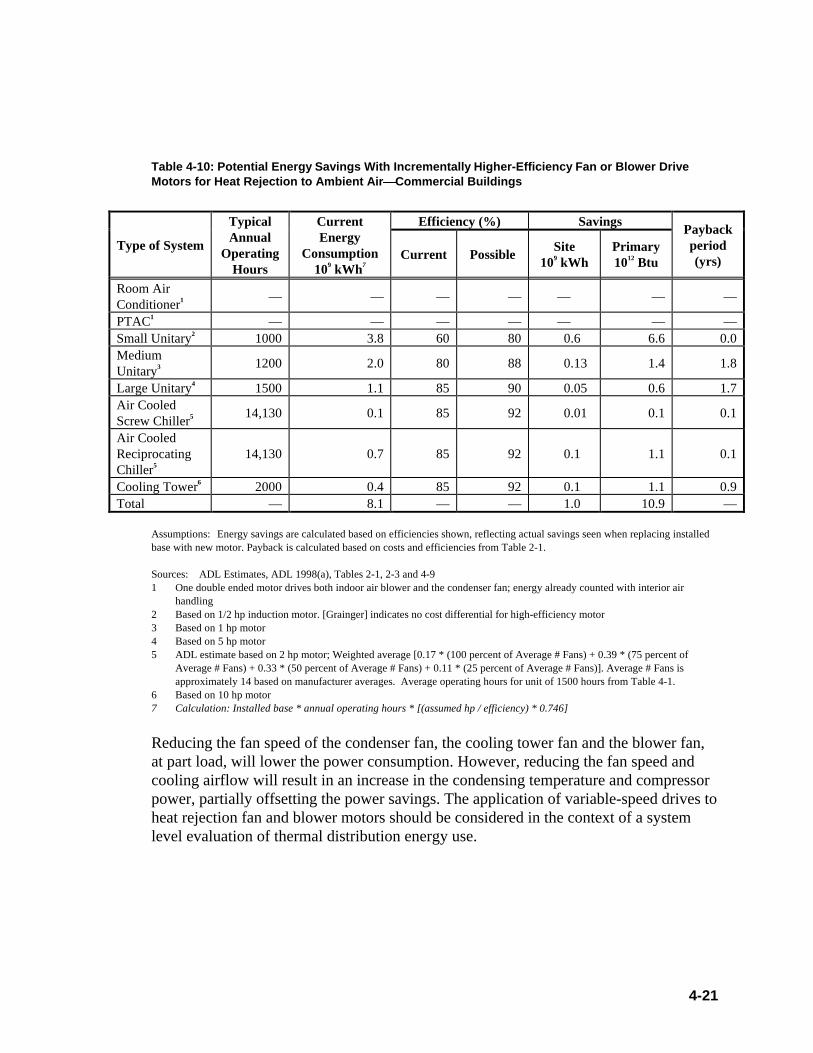
4-21
Table 4-10: Potential Energy Savings With Incrementally Higher-Efficiency Fan or Blower DriveMotors for Heat Rejection to Ambient Air ¾¾Commercial Buildings
Efficiency (%) Savings
Type of System
TypicalAnnual
Operating Hours
CurrentEnergy
Consumption 109 kWh7
Current Possible Site 109 kWh
Primary 1012 Btu
Paybackperiod (yrs)
Room AirConditioner1
— — — — — — —
PTAC1 — — — — — — — Small Unitary2 1000 3.8 60 80 0.6 6.6 0.0 MediumUnitary3 1200 2.0 80 88 0.13 1.4 1.8
Large Unitary4 1500 1.1 85 90 0.05 0.6 1.7 Air CooledScrew Chiller5
14,130 0.1 85 92 0.01 0.1 0.1
Air CooledReciprocatingChiller5
14,130 0.7 85 92 0.1 1.1 0.1
Cooling Tower6 2000 0.4 85 92 0.1 1.1 0.9 Total — 8.1 — — 1.0 10.9 —
Assumptions: Energy savings are calculated based on efficiencies shown, reflecting actual savings seen when replacing installedbase with new motor. Payback is calculated based on costs and efficiencies from Table 2-1. Sources: ADL Estimates, ADL 1998(a), Tables 2-1, 2-3 and 4-91 One double ended motor drives both indoor air blower and the condenser fan; energy already counted with interior air
handling2 Based on 1/2 hp induction motor. [Grainger] indicates no cost differential for high-efficiency motor3 Based on 1 hp motor4 Based on 5 hp motor5 ADL estimate based on 2 hp motor; Weighted average [0.17 * (100 percent of Average # Fans) + 0.39 * (75 percent of
Average # Fans) + 0.33 * (50 percent of Average # Fans) + 0.11 * (25 percent of Average # Fans)]. Average # Fans isapproximately 14 based on manufacturer averages. Average operating hours for unit of 1500 hours from Table 4-1.
6 Based on 10 hp motor7 Calculation: Installed base * annual operating hours * [(assumed hp / efficiency) * 0.746]
Reducing the fan speed of the condenser fan, the cooling tower fan and the blower fan,at part load, will lower the power consumption. However, reducing the fan speed andcooling airflow will result in an increase in the condensing temperature and compressorpower, partially offsetting the power savings. The application of variable-speed drives toheat rejection fan and blower motors should be considered in the context of a systemlevel evaluation of thermal distribution energy use.
4-22
4.2.3 Commercial Refrigeration
Commercial refrigeration equipment includes:� Supermarket refrigerated display cases and walk-in refrigerators utilizing remote
compressors and condensing equipment� Self-contained systems (such as upright and horizontal merchandisers, beverage
merchandisers, deli cases, reach-in and roll-in refrigerator/freezers, and under-counter refrigerator/freezers)
� Walk-in coolers and freezers� Refrigerated vending machines� Ice machines Primary energy usage in the commercial refrigeration sector is approximately 993trillion Btus. The contribution of different commercial refrigeration equipment types tothis total is shown in Figure 4-8. Compressor and fan motor electricity consumptionrepresenting 760 trillion Btus (>76 percent of total energy) are summarized in Table 4-11 for the most common refrigeration applications. Typical performance data is includedas a baseline for technical improvement. The analyses below indicate that there are large opportunities for savings in thecommercial refrigeration sector. This savings potential is associated with high-efficiencyfan motors and high-efficiency compressors, technologies which, in refrigerationsystems, have typical paybacks of less than two years when installed in new equipment.High-efficiency fan motors can also be implemented on a retrofit basis. Table 4-12summarizes the energy savings possible in commercial refrigeration equipment.Payback economics are found in the tables describing individual technologies in thesubsections below. The savings potential for commercial refrigeration is more significant than forresidential refrigeration because: (1) there has been no counterpart to NAECA in thissector to stimulate efficiency increases, and (2) the duty cycles typical for commercialfan and compressor motors are generally longer.

4-23
Figure 4-8: Primary Energy Usage in Commercial Refrigeration (total 993 trillion BTUs)
Supermarkets(326)
Walk-Ins(180)
Other(80)
Beverage Merchandiser
(52)
Reach-In Freezer(65)
Reach-In Refrigerator
(54)
Source: ADL,1996

4-24
Table 4-11: Commercial Refrigeration Compressor and Fan Motor Energy Consumption
Typical Performance Data
Equipment Type
Application
Number of
Systems (x 1,000)
Compressorhp
CompressorMotor
Efficiency
Fan MotorOutput
Fan MotorEfficiency
CompressorPrimary Energy
Consumption 1012 Btu1
Fan Primary Energy
Consumption1012 Btu1
Reach-In Refrigerators 1,3002 1/3 -1/2 .7 6W - 1/15 hp 0.43 - 0.56 32 12
Reach-In Freezers 8002 1/2-1 .7 6W - 1/15 hp 0.43 - 0.56 44 8
Beverage Merchandisers 8002 1/3-3/4 .7 6W - 1/15 hp 0.17 22 15
Roll-In Refrigerators & Freezers 250 1/3-1 .7 6W - 1/15 hp 0.43 - 0.58 8 3
Self-Contained
Other Refrigerators & Freezers(include non-beverage)merchandisers)
900 1/5-1/2 .7 6W - 1/15 hp 0.15 - 0.17 24 9
VendingMachines
Refrigerated Vending Machines 4,1002 1/3 .7 6W 0.15 59 20
Ice Makers Ice Machine 1,2002 .42-.45 25W .15 - .25 93 8
Walk-Ins: C-Store andFoodservice
8802 1/5-1/2 .7-.8 1/15 hp -
1/4 hp 0.25 99 57
CentralizedSystems
Small Grocery 20 5-50 0.7-0.8 6W - 1 hp 0.15 - 0.25 14 2
Rack Mounted Supermarket 30 100-2003 0.88 6W - 1 hp 0.15 - 0.58 170 60
Totals 566
194 1 Based on a heat rate of 11,005 Btu/kWh
2 DOE, 1996 3 3 to 15 HP per compressor
Grand Total 760
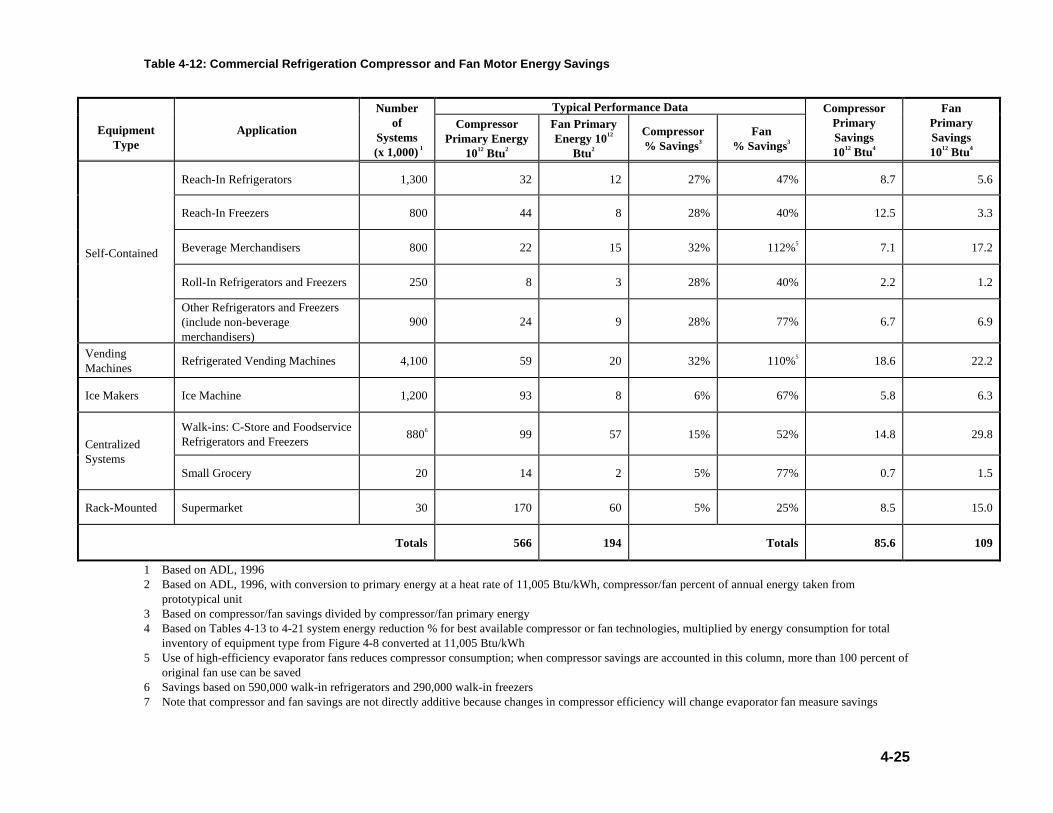
4-25
Table 4-12: Commercial Refrigeration Compressor and Fan Motor Energy Savings
Typical Performance Data
Equipment
Type Application
Number of
Systems (x 1,000) 1
CompressorPrimary Energy
1012 Btu2
Fan PrimaryEnergy 1012
Btu2
Compressor% Savings3
Fan % Savings3
CompressorPrimary Savings 1012 Btu4
Fan Primary Savings 1012 Btu4
Reach-In Refrigerators 1,300 32 12 27% 47% 8.7 5.6
Reach-In Freezers 800 44 8 28% 40% 12.5 3.3
Beverage Merchandisers 800 22 15 32% 112%5 7.1 17.2
Roll-In Refrigerators and Freezers 250 8 3 28% 40% 2.2 1.2
Self-Contained
Other Refrigerators and Freezers(include non-beveragemerchandisers)
900 24 9 28% 77% 6.7 6.9
VendingMachines
Refrigerated Vending Machines 4,100 59 20 32% 110%5 18.6 22.2
Ice Makers Ice Machine 1,200 93 8 6% 67% 5.8 6.3
Walk-ins: C-Store and FoodserviceRefrigerators and Freezers
8806 99 57 15% 52% 14.8 29.8 CentralizedSystems
Small Grocery 20 14 2 5% 77% 0.7 1.5
Rack-Mounted Supermarket 30 170 60 5% 25% 8.5 15.0
Totals 566 194 Totals 85.6 109
1 Based on ADL, 19962 Based on ADL, 1996, with conversion to primary energy at a heat rate of 11,005 Btu/kWh, compressor/fan percent of annual energy taken from
prototypical unit3 Based on compressor/fan savings divided by compressor/fan primary energy4 Based on Tables 4-13 to 4-21 system energy reduction % for best available compressor or fan technologies, multiplied by energy consumption for total
inventory of equipment type from Figure 4-8 converted at 11,005 Btu/kWh5 Use of high-efficiency evaporator fans reduces compressor consumption; when compressor savings are accounted in this column, more than 100 percent of
original fan use can be saved6 Savings based on 590,000 walk-in refrigerators and 290,000 walk-in freezers7 Note that compressor and fan savings are not directly additive because changes in compressor efficiency will change evaporator fan measure savings

4-26
4.2.3.1 Central Systems There are approximately 30,000 supermarkets in the United States. Supermarkets representabout 7 percent of the country’s commercial-sector electricity usage. About half of thisusage is associated with supermarket refrigeration systems. Supermarkets range in size fromless than 10,000 ft2 to greater than 70,000 ft2 total selling area. The average size is 26,715 ft2. A supermarket with a 45,000-ft2 sales area and 24-hour operation is chosen as the baselinefor the savings calculations for improved motor efficiency. The total annual electricityconsumption for the model supermarket is 1.6 million kWh. Supermarket refrigeration is divided into two distinct segments with different technologiesthat are governed by different issues. The more visible part of these systems is the displaycases that hold food for the self-service shopping style of supermarkets. The display caseshave their own electric loads, and they must be cooled by the store’s refrigeration system. The heart of supermarket refrigeration systems is represented by the compressor racks,which consist of a number of parallel-connected compressors located in a separate machineroom. Each rack may have from three to five compressors serving a series of loads withnearly identical evaporator temperatures. A typical store will have 10 to 20 compressors inthe 3-hp to 15-hp size range. Most compressor racks are “uneven parallel,” meaning that thecapacities of compressors in a rack are not equal. This improves the ability of the system tohandle part-load conditions efficiently. Because of the high duty cycle and tight operating margins, store operators are unwilling toinvest in efficient equipment. The semi-hermetic refrigerant compressors are among themost efficient compressors in use. The typical efficiency of the 5 and 10 hp motorscommonly used is 88 to 90 percent, with efficiencies a few percentage points higher beingpossible. The principal opportunity for motor related energy savings in supermarket refrigerationresides in the use of more efficient evaporator fan motors. Most evaporator and condenserfan motors are inexpensive and inefficient single-phase shaded pole motors. The efficiencyof permanent split capacitor (PSC) or ECPM motors is significantly better. Additionally,since evaporator fans contribute to refrigeration load, use of a high-efficiency, evaporatorfan motor results in increased savings through the reduction in compressor load. Table 4-13describes the economics of improved motor designs. The cost premiums and annualconsumption reductions are based on the typical supermarket evaporator fan inventoryshown in Table 4-14.

4-27
Table 4-13: Economic Analysis: Supermarkets
Motor Type ReductionkWh/yr
Reduction kW
CostPremium
PaybackPeriod
PSC Evap Fan Motors 102,700 11.8 $7,600 0.9 ECPM Evap FanMotors
131,200 14.9 $12,600 1.2
Assumptions: $0.08 per kWh electric rate; wattage and cost from Table 4-14, 100 percent fan duty cycle, 100percent markup for end user from OEM motor costs; overall refrigeration COP of 1.9, which affects energyuse through reduced compressor loading
Table 4-14: Evaporator Fan Motor Sizes and OEM Costs in a Typical Supermarket
Shaded Pole PSC ECPM
Motor Output (W)
Total Number Total
Cost Total Power
(W) TotalCost
Total Power(W)
TotalCost
Total Power(W)
6 85 $595 3,400 $2,125 1,275 $2,975 720 9 100 $1,000 5,300 $2,800 2,100 $4,000 1,250 25 40 $1,000 4,400 $1,480 2,040 $1,920 1,320
Totals $2,600 13,100 $6,410 5,420 $8,900 3,290 Source: ADL, 1996, Table 2-3
4.2.3.2 Beverage Merchandisers and Reach-In Equipment This section describes the energy saving motor technologies and the energy savingspotential that are applicable to beverage merchandisers. The technical and economicdiscussions are generalized to the entire class of unitary refrigeration equipment of whichincludes beverage merchandisers. Table 4-15 summarizes the energy reduction options. The typical beverage merchandiser uses two 9W output shaded pole evaporator fan motorsthat use 53W of input power each. Replacement with PSC motors would save 64W in fanpower, while ECPMs would save 81W for the system. Reduction in refrigeration loadwould increase energy savings by about an additional 60 percent of the fan motor savings. The condenser fan motor is typically a shaded pole motor with a 53W input and a 9Woutput. Replacement with a PSC motor would save 32W, while replacement with an ECPMwould save 40.5W. The prototypical beverage merchandiser has a standard efficiency hermetic reciprocatingcompressor with a resistor start, induction run (RSIR) motor. The efficiency of the motor isabout 70 percent, with input power nominally 425W. Efficiency modifications to thecompressor include the use of a high-efficiency motor (80 percent), reducing suction gaspressure losses, reducing the valve clearance gap, reducing the heating of suction gas within

4-28
Table 4-15: Economic Analysis: Beverage Merchandiser
Baseline Energy Use: 3923 kWh/year for 1-Door Unit
Notes Technology
Option
End-UserCost
Premium
EnergyReduction(kWh/yr)
SystemEnergy
Reduction %
SimplePayback
Period (yrs)
1 PSC Evap FanMotor
$72 887 23 1.0
2 ECPM Evap FanMotor
$120 1118 29 1.4
3 PSC Cond. FanMotor
$36 140 4 3.2
4 ECPM Cond. FanMotor
$60 175 5 4.4
5 High-Eff.Compressor
$16 335 9 .6
6 ECPM CompressorMotor
$100 251 6 5.0
7 Variable-SpeedCompressor
$150 536 14 3.7
Notes: 1&2 High-Efficiency Evaporator Fan Motors: Replacement of two 9-Watt output shaded pole
motors with two 9-Watt output PSC or ECPM motors. Additional compressor load savingsbased on the 1.72 COP.
3&4 High-Efficiency Condenser Fan Motors: Replacement of one 9-Watt output shaded pole motorwith a 9-Watt output PSC or ECPM motor. 50 percent duty cycle.
5 High-Efficiency Compressor: Increase in motor efficiency to 80 percent. OEM cost of $8, enduser markup of 100 percent.
6&7 ECPM Compressor Motor/Variable-Speed Compressor: Replacement of the existing 1/3 hpmotor with an ECPM motor (efficiency increase from 70 percent to 82 percent). Cost premiumof $100 for the ECPM motor cost, $50 standard motor cost, 100 percent end-user markup).Additional 20 percent reduction in compressor energy usage for variable-speed operation.Controls cost for variable-speed operation of $50.
the compressor shell, reducing pressure drop through the discharge valve, and reducingmechanical losses. The OEM costs for 1/3 hp compressors are about $40. Currently available high-efficiencycompressors reportedly have a 10 percent cost premium. An $8 OEM cost premium is usedin the economic analysis. Further improvements in compressor efficiency would result from the use of ECPMcompressor motors. Currently such compressors are not available except in limited numbersfor special orders. The use of ECPM motors would allow variable-speed operation of thecompressors when used in conjunction with appropriate controls. Variable-speed operationwould allow further reductions in energy usage. For the economic analyses of the self-contained equipment, it is assumed that reductions in compressor power of 15 to20 percent are possible with variable-speed operation. This reduction range has been

4-29
achieved in tests at Arthur D. Little using two-speed compressor operation ina residential refrigerator/freezer. Tables similar to 4-15 are presented for Reach-In Freezers (Table 4-16), Reach-InRefrigerators (Table 4-17), Ice Machines (Table 4-18), Vending Machines (Table 4-19),Walk-In Coolers (Table 4-20) and Walk-In Freezers (Table 4-21). All tables present energyreduction percentages based on reduction of energy use for the complete equipment system(e.g., beverage merchandiser). Savings are calculated based on a $0.08/kWh electric rate[DOE, 1998]. Cost and efficiency data are taken from, or consistent with, [ADL, 1996].
Table 4-16: Economic Analysis: Reach-In Freezers
Baseline Energy Use: 5198 kWh/year for Single-Door Unit
Notes Technology
Option
End-UserCost
Premium
EnergyReduction(kWh/yr)
SystemEnergy
Reduction %
Simple Payback Period
(yrs)
1 ECPM Evap FanMotor
$24 118 2 2.5
2 ECPM Cond. FanMotor
$24 138 3 2.2
3 High-Eff.Compressor
$24 831 16 0.4
4 ECPMCompressorMotor
$110 814 16 1.8
5 Variable-SpeedCompressor
$160 986 19 2.1
Notes: 1 ECPM Evaporator Fan Motor: Replacement of one 9-Watt output PSC motor with one 9-Watt
output ECPM motor. Additional compressor load savings based on a 1.25 COP. 2 ECPM Condenser Fan Motor: Replacement of one 1/20 hp PSC motor with a 1/20 hp ECPM
motor. 75 percent duty cycle. 3 High-Efficiency Compressor: Increase in motor efficiency to 80 percent. OEM cost of $12,
end user markup of 100 percent. 4&5 ECPM Compressor Motor/Variable-Speed Compressor: Replacement of the existing 1/2 hp
motor with an ECPM motor (efficiency increase from 70 percent to 83 percent). Cost premiumof $110 for the ECPM motor ($110 ECPM motor cost, $55 standard motor cost, 100 percentend-user mark-up). Additional 15 percent reduction in compressor energy usage for variable-speed operation. Controls cost for variable-speed operation of $50.
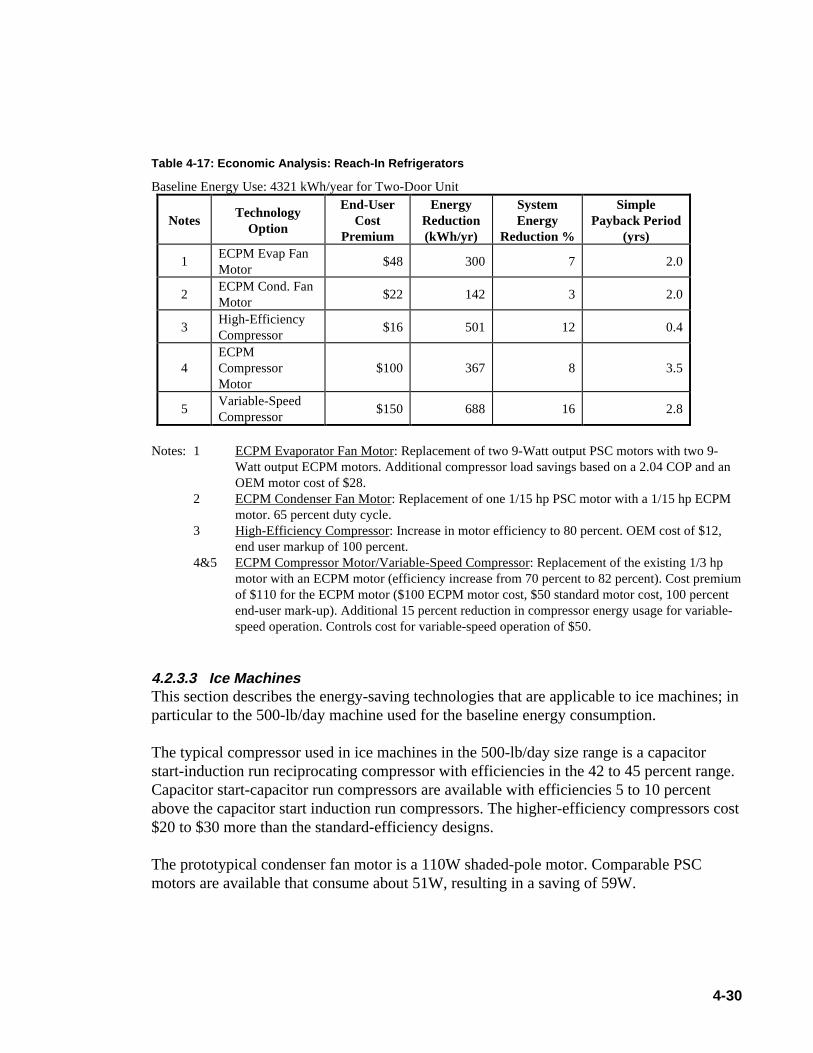
4-30
Table 4-17: Economic Analysis: Reach-In Refrigerators
Baseline Energy Use: 4321 kWh/year for Two-Door Unit
Notes Technology
Option
End-UserCost
Premium
EnergyReduction(kWh/yr)
SystemEnergy
Reduction %
Simple Payback Period
(yrs)
1 ECPM Evap FanMotor
$48 300 7 2.0
2 ECPM Cond. FanMotor
$22 142 3 2.0
3 High-EfficiencyCompressor
$16 501 12 0.4
4 ECPMCompressorMotor
$100 367 8 3.5
5 Variable-SpeedCompressor
$150 688 16 2.8
Notes: 1 ECPM Evaporator Fan Motor: Replacement of two 9-Watt output PSC motors with two 9-
Watt output ECPM motors. Additional compressor load savings based on a 2.04 COP and anOEM motor cost of $28.
2 ECPM Condenser Fan Motor: Replacement of one 1/15 hp PSC motor with a 1/15 hp ECPMmotor. 65 percent duty cycle.
3 High-Efficiency Compressor: Increase in motor efficiency to 80 percent. OEM cost of $12,end user markup of 100 percent.
4&5 ECPM Compressor Motor/Variable-Speed Compressor: Replacement of the existing 1/3 hpmotor with an ECPM motor (efficiency increase from 70 percent to 82 percent). Cost premiumof $110 for the ECPM motor ($100 ECPM motor cost, $50 standard motor cost, 100 percentend-user mark-up). Additional 15 percent reduction in compressor energy usage for variable-speed operation. Controls cost for variable-speed operation of $50.
4.2.3.3 Ice Machines This section describes the energy-saving technologies that are applicable to ice machines; inparticular to the 500-lb/day machine used for the baseline energy consumption. The typical compressor used in ice machines in the 500-lb/day size range is a capacitorstart-induction run reciprocating compressor with efficiencies in the 42 to 45 percent range.Capacitor start-capacitor run compressors are available with efficiencies 5 to 10 percentabove the capacitor start induction run compressors. The higher-efficiency compressors cost$20 to $30 more than the standard-efficiency designs. The prototypical condenser fan motor is a 110W shaded-pole motor. Comparable PSCmotors are available that consume about 51W, resulting in a saving of 59W.
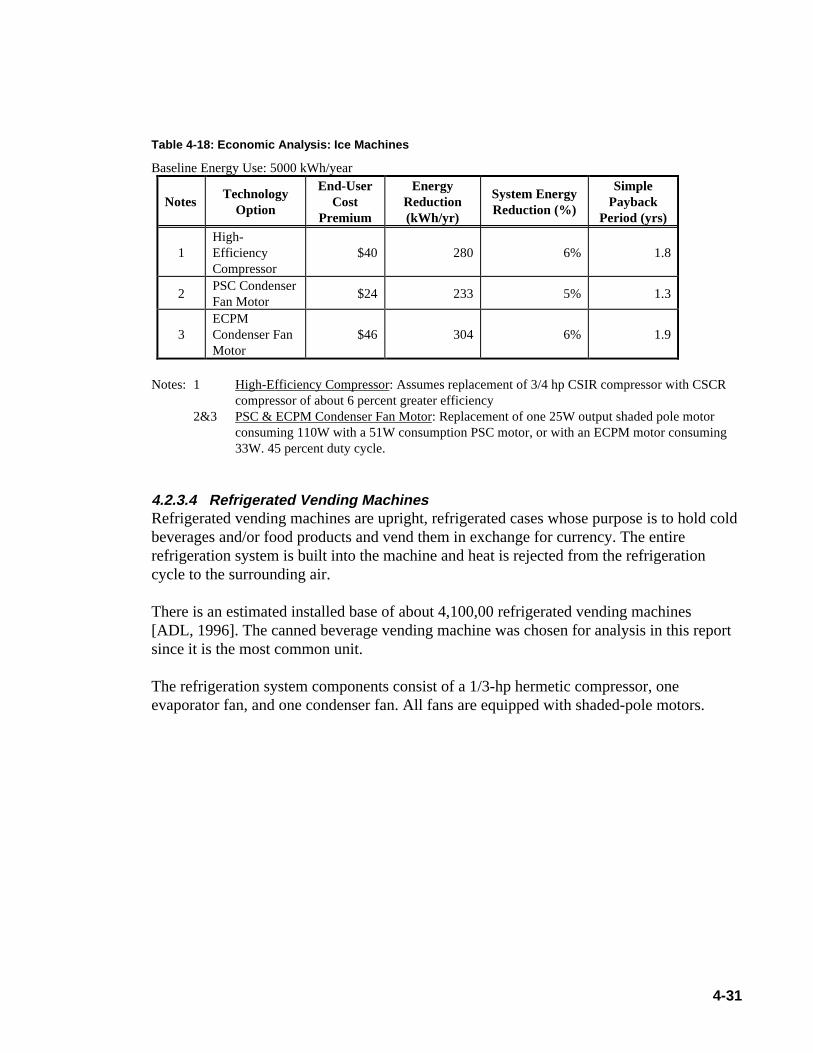
4-31
Table 4-18: Economic Analysis: Ice Machines
Baseline Energy Use: 5000 kWh/year
Notes Technology
Option
End-UserCost
Premium
EnergyReduction(kWh/yr)
System EnergyReduction (%)
SimplePayback
Period (yrs)
1 High-EfficiencyCompressor
$40 280 6% 1.8
2 PSC CondenserFan Motor
$24 233 5% 1.3
3 ECPMCondenser FanMotor
$46 304 6% 1.9
Notes: 1 High-Efficiency Compressor: Assumes replacement of 3/4 hp CSIR compressor with CSCR
compressor of about 6 percent greater efficiency 2&3 PSC & ECPM Condenser Fan Motor: Replacement of one 25W output shaded pole motor
consuming 110W with a 51W consumption PSC motor, or with an ECPM motor consuming33W. 45 percent duty cycle.
4.2.3.4 Refrigerated Vending Machines Refrigerated vending machines are upright, refrigerated cases whose purpose is to hold coldbeverages and/or food products and vend them in exchange for currency. The entirerefrigeration system is built into the machine and heat is rejected from the refrigerationcycle to the surrounding air. There is an estimated installed base of about 4,100,00 refrigerated vending machines [ADL, 1996]. The canned beverage vending machine was chosen for analysis in this reportsince it is the most common unit. The refrigeration system components consist of a 1/3-hp hermetic compressor, oneevaporator fan, and one condenser fan. All fans are equipped with shaded-pole motors.
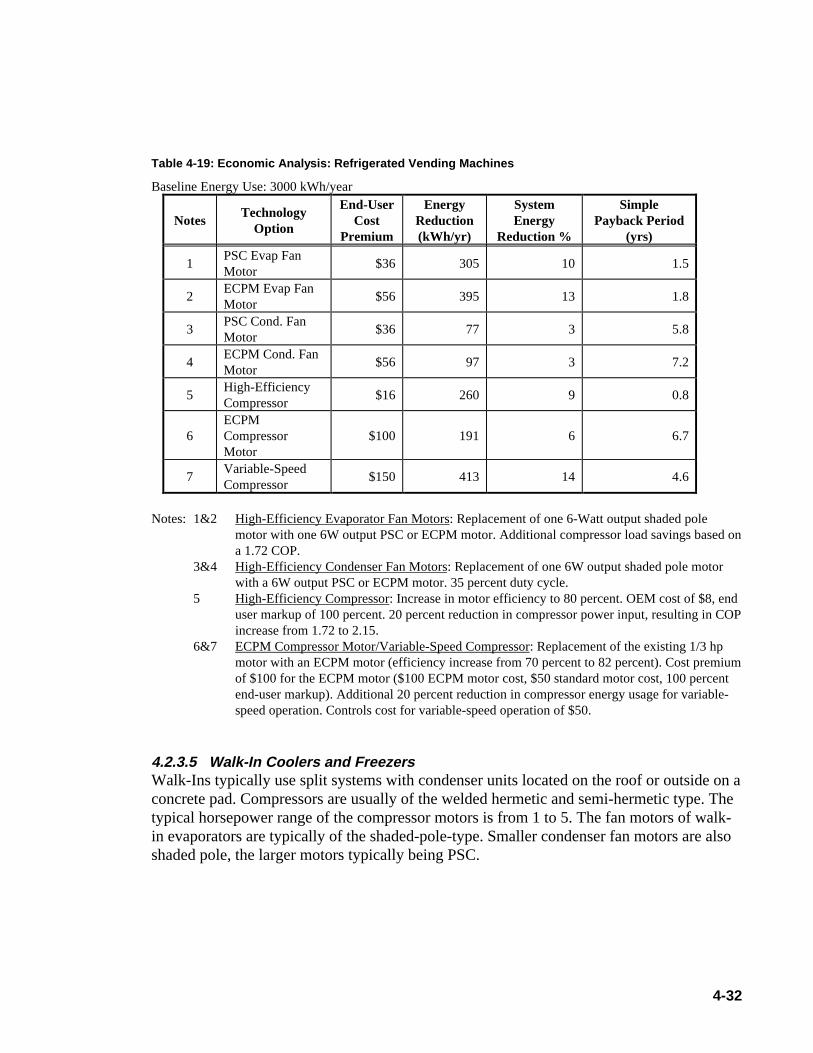
4-32
Table 4-19: Economic Analysis: Refrigerated Vending Machines
Baseline Energy Use: 3000 kWh/year
Notes Technology
Option
End-UserCost
Premium
EnergyReduction(kWh/yr)
SystemEnergy
Reduction %
Simple Payback Period
(yrs)
1 PSC Evap FanMotor
$36 305 10 1.5
2 ECPM Evap FanMotor
$56 395 13 1.8
3 PSC Cond. FanMotor
$36 77 3 5.8
4 ECPM Cond. FanMotor
$56 97 3 7.2
5 High-EfficiencyCompressor
$16 260 9 0.8
6 ECPMCompressorMotor
$100 191 6 6.7
7 Variable-SpeedCompressor
$150 413 14 4.6
Notes: 1&2 High-Efficiency Evaporator Fan Motors: Replacement of one 6-Watt output shaded pole
motor with one 6W output PSC or ECPM motor. Additional compressor load savings based ona 1.72 COP.
3&4 High-Efficiency Condenser Fan Motors: Replacement of one 6W output shaded pole motorwith a 6W output PSC or ECPM motor. 35 percent duty cycle.
5 High-Efficiency Compressor: Increase in motor efficiency to 80 percent. OEM cost of $8, enduser markup of 100 percent. 20 percent reduction in compressor power input, resulting in COPincrease from 1.72 to 2.15.
6&7 ECPM Compressor Motor/Variable-Speed Compressor: Replacement of the existing 1/3 hpmotor with an ECPM motor (efficiency increase from 70 percent to 82 percent). Cost premiumof $100 for the ECPM motor ($100 ECPM motor cost, $50 standard motor cost, 100 percentend-user markup). Additional 20 percent reduction in compressor energy usage for variable-speed operation. Controls cost for variable-speed operation of $50.
4.2.3.5 Walk-In Coolers and Freezers Walk-Ins typically use split systems with condenser units located on the roof or outside on aconcrete pad. Compressors are usually of the welded hermetic and semi-hermetic type. Thetypical horsepower range of the compressor motors is from 1 to 5. The fan motors of walk-in evaporators are typically of the shaded-pole-type. Smaller condenser fan motors are alsoshaded pole, the larger motors typically being PSC.
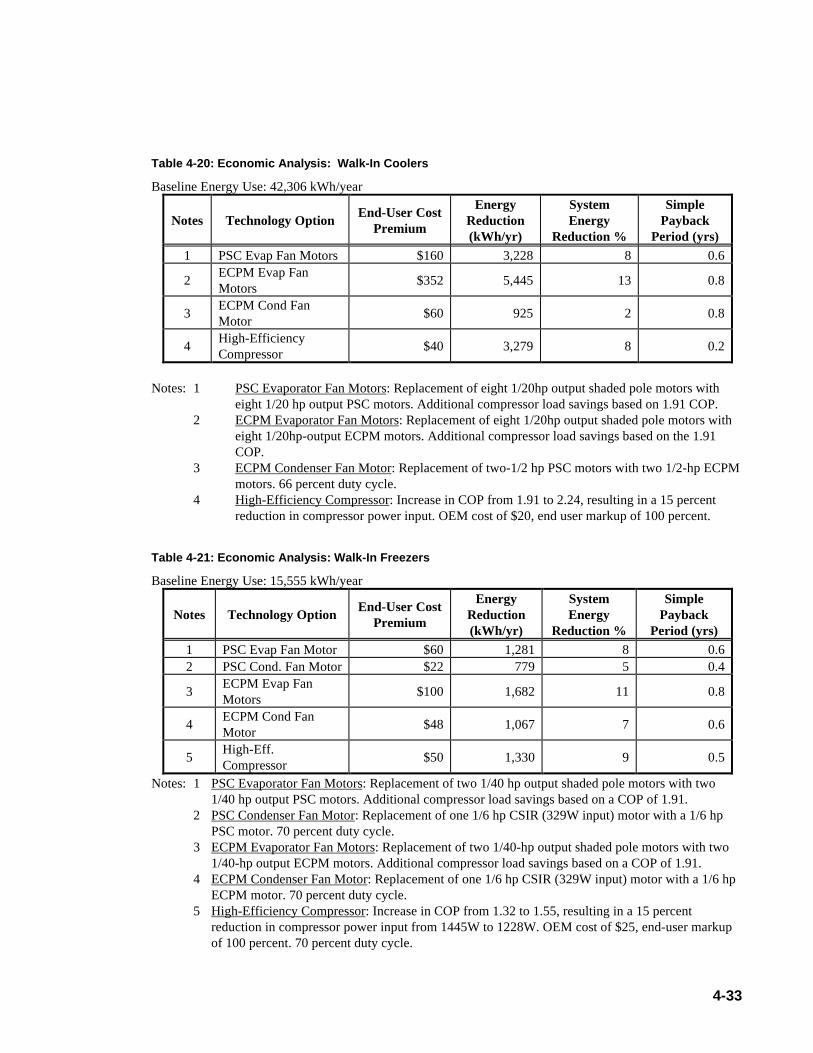
4-33
Table 4-20: Economic Analysis: Walk-In Coolers
Baseline Energy Use: 42,306 kWh/year
Notes Technology Option End-User Cost
Premium
EnergyReduction(kWh/yr)
SystemEnergy
Reduction %
Simple Payback
Period (yrs) 1 PSC Evap Fan Motors $160 3,228 8 0.6
2 ECPM Evap FanMotors
$352 5,445 13 0.8
3 ECPM Cond FanMotor
$60 925 2 0.8
4 High-EfficiencyCompressor
$40 3,279 8 0.2
Notes: 1 PSC Evaporator Fan Motors: Replacement of eight 1/20hp output shaded pole motors with
eight 1/20 hp output PSC motors. Additional compressor load savings based on 1.91 COP. 2 ECPM Evaporator Fan Motors: Replacement of eight 1/20hp output shaded pole motors with
eight 1/20hp-output ECPM motors. Additional compressor load savings based on the 1.91COP.
3 ECPM Condenser Fan Motor: Replacement of two-1/2 hp PSC motors with two 1/2-hp ECPMmotors. 66 percent duty cycle.
4 High-Efficiency Compressor: Increase in COP from 1.91 to 2.24, resulting in a 15 percentreduction in compressor power input. OEM cost of $20, end user markup of 100 percent.
Table 4-21: Economic Analysis: Walk-In Freezers
Baseline Energy Use: 15,555 kWh/year
Notes Technology Option End-User Cost
Premium
EnergyReduction(kWh/yr)
SystemEnergy
Reduction %
Simple Payback
Period (yrs) 1 PSC Evap Fan Motor $60 1,281 8 0.6 2 PSC Cond. Fan Motor $22 779 5 0.4
3 ECPM Evap FanMotors
$100 1,682 11 0.8
4 ECPM Cond FanMotor
$48 1,067 7 0.6
5 High-Eff.Compressor
$50 1,330 9 0.5
Notes: 1 PSC Evaporator Fan Motors: Replacement of two 1/40 hp output shaded pole motors with two1/40 hp output PSC motors. Additional compressor load savings based on a COP of 1.91.
2 PSC Condenser Fan Motor: Replacement of one 1/6 hp CSIR (329W input) motor with a 1/6 hpPSC motor. 70 percent duty cycle.
3 ECPM Evaporator Fan Motors: Replacement of two 1/40-hp output shaded pole motors with two1/40-hp output ECPM motors. Additional compressor load savings based on a COP of 1.91.
4 ECPM Condenser Fan Motor: Replacement of one 1/6 hp CSIR (329W input) motor with a 1/6 hpECPM motor. 70 percent duty cycle.
5 High-Efficiency Compressor: Increase in COP from 1.32 to 1.55, resulting in a 15 percentreduction in compressor power input from 1445W to 1228W. OEM cost of $25, end-user markupof 100 percent. 70 percent duty cycle.
4-34
4.2.4 Miscellaneous Commercial-Sector Motor Applications
About 93 percent of commercial-sector motor energy is consumed in the major applicationsdiscussed above. A number of the miscellaneous motor applications in the commercialsector are analogous to the residential sector in the sense that a diverse range isencompassed by applications that are economically important but low in one or more of thefollowing: duty cycle, power consumption, or numbers in use. Examples include:� Office equipment (personal computers, printers, photocopiers, etc.) cooling fans� Photocopier and printer drive motors� Commercial laundry equipment� Vacuum cleaners, floor polishers, carpet cleaners, etc.� Commercial kitchen equipment (food mixers, meat slicers, etc.)� Air compressors� Power tools In general, these motors perform many useful functions, which are out of proportion to theirenergy consumption. While the motor efficiencies are often low, the total energy consumedby these motors is insignificant, due to their small numbers, lower power rating, and/or lowduty cycle.

5-1
5 Market Barriers to Increased Use of High-Efficiency Motors
To be able to formulate programs that increase the efficiency of motor systems in thecommercial and residential sectors, it is necessary to obtain a clear understanding of themajor stakeholders in the various categories of motor applications. Successful programsmust be tailored to the essential decision-makers and be consistent with their particularbusiness practices. Given the large variations among the investigated market segmentsregarding such fundamental characteristics as market needs, market drivers, purchasingcriteria and decision makers, it is imperative that the selected policies be responsive to theuniqueness of each group. The following discussion of market barriers to improved motorefficiency identifies the essential players and major issues.
The motor and variable-speed drive markets have numerous stakeholders with manydifferent and sometimes conflicting interests. Interested parties include motor end-users,motor and drive manufacturers, original equipment manufacturers (OEM), equipmentdistributors, trade associations, electric utilities, certification organizations, research centers,government agencies, engineering firms and construction companies. The exact role and therelative importance of each stakeholder can vary significantly across markets and evenwithin markets. Our discussion of market barriers to improved motor efficiency willprimarily cover the two areas of motor market and stakeholder.
5.1 Residential
In residential appliances, the primary barrier to the use of incrementally more expensive,higher-efficiency components is the combined effect of typical consumer appliancepurchase decision priorities and the stringently competitive pricing faced by manufacturers,distributors, and retailers. Efficiency is only one of the many features sought by consumers,and all evidence indicates that efficiency is typically a low priority, well behind first costand utility/styling features. The competitive pricing environment forces manufacturers,distributors, and retailers alike to accept comparatively low prices and margins, and toattempt to cut costs at all levels to maintain margins. For the manufacturer, this meansspecifying lower cost components. For the retailer, it means expensive showroom floorspace, display samples, and the selection of inventory, which offers a variety of price levels,and features in which consumers have a demonstrated interest.
A second barrier is that individuals other than those responsible for paying the electric billselect a significant number of residential appliances. Most often, this individual is a builder,whose primary interest is in providing the required functions of heating, air conditioning,and refrigeration at the lowest initial cost, with little regard to the continuing operating cost.
As discussed in Section 3.1, NAECA standards have significantly raised the minimumefficiency levels for the applications that together use more than 85 percent of residentialsector motor energy. For these applications�refrigerators, window air conditioners, centralair conditioners, heat pumps, dishwashers and laundry appliances�current standards are
5-2
sufficiently stringent (with more stringent standards levels under consideration in therulemaking process) to have shifted manufacturers’ design trade-offs. Furnace blowersare the one motor-driven application that stand out as significant in residential energyconsumption and not yet covered by NAECA standards. Expectations are that this use willeventually be covered by standards, but differences regarding the approach that should betaken to do this are not yet resolved.
Variable-speed motors have not proven very cost-effective as yet, but there is evidence thatthe new NAECA standard levels for these appliances will lead to significantly increased useof variable-speed drives. The increased volume could result in gradually falling costs. Theuse of variable speed switched reluctance motors in Maytag washers are an example of thisincreased use.
5.2 Commercial Refrigeration
End UsersThe needs, attitudes, decision criteria, and decision making process for the refrigerationequipment end-user vary across product lines. Generally, it may be useful to distinguishbetween end-users that pay their own energy costs and those who do not. For example, mostvending machines are owned by bottling companies who do not pay utility bills in thebuildings where the units are located. This effectively eliminates any incentive for thebottling companies to select the higher priced, but more efficient machines.
By contrast, supermarkets are responsible for their own energy bills, which are of the sameorder as the net margins realized in the highly competitive supermarket industry(1/2 to 1 percent of sales). This has led to an emphasis on the energy savings in the designand specification of refrigeration systems, particularly in supermarket chains that haveaccess to the necessary capital and central engineering staffs. Even so, the emphasis onefficiency has been most pronounced in the central refrigeration systems�the compressorracks and condensers. Marketing staff, with merchandising considerations overshadowingefficiency has controlled selection of display cases.
Many refrigeration products are sold to non-chain convenience stores, smaller grocers, andrestaurants. This market segment encounters many additional barriers. Some examplesinclude a lack of awareness of the energy savings potential, payback expectations of threeyears or less, a strong risk aversion to new technologies, market fragmentation, higherbusiness risk and less capital availability. Walk-In Refrigerator/Freezers and Reach-Ins arethe most affected products.

5-3
ManufacturersSupermarket refrigeration systems are very often custom designed for a particular storelayout and equipment loads. Hence it is difficult to supply supermarket industryprofessionals with general performance criteria from which to evaluate their systems’energy usage. Without a baseline consumption or standardized system configuration thatcould be optimized through experience, designers are constantly re-engineering withvarying degrees of success. Furthermore, stores are frequently re-modeled and display casesare added or deleted. This alters the system loads and configurations.
The production numbers for commercial refrigeration equipment is low in comparison toresidential products such as refrigerator/freezers. The engineering and tooling costsassociated with commercial equipment cannot be allocated to as may units. Since the marketis competitive, this creates a disincentive to an improved product design.
5.3 Air Conditioning Compressors/Commercial HVAC
End-UsersGrouped metering and insufficient feedback to commercial tenants have been cited as majorbarriers to the more efficient use of energy. In many commercial buildings, electricitymetering is grouped for several tenants and so individual tenants have no direct incentive tolower their own consumption. Commercial leases often pass down shared services on asquare feet leased basis. Larger lease charges and fees thus mask the energy costs. Veryoften, the commercial tenant is part of a larger chain or corporate entity that pays the leaseand utility bills. The tenant may never see the utility bills and will not receive any feedbackon the energy consumption.
Many tenants of commercial space associate reduced energy consumption with reducedcomfort. This is particularly true of measures designed to setback room temperature levelsor reduce ventilation rates.
Finally, separation of equipment ownership from responsibility for utility bills is the majorhurdle in commercial facilities. Although many commercial tenants may have their separateHVAC unit, it is owned and usually maintained by the building owner that makes little, ifany, effort to improve energy efficiency since energy costs are passed down to the tenants.Similarly, decisions as to what HVAC equipment is installed is not made by the personresponsible for the energy bills. Some criteria that are more important to the buildingdeveloper include lower first cost and a familiarity with the equipment to be installed.

5-4
5.4 HVAC Thermal Distribution/Adjustable-Speed Drives
End-UsersWhile it is certain that in many applications, VSDs can significantly reduce fan and pumpenergy, an engineering analysis is normally required to estimate the cost-effectiveness of aparticular application. Calculations of site-specific energy savings involve knowledge ofpresent flow variations in the system and of the current methods used for control.
ASD projects require careful evaluations that can often lie outside a client’s technical abilityor the availability of time. Without a professional review, installations may not be welldesigned, the applications wrong, and the savings overstated.
Engineering FirmsOne of the main issues facing the acceptance of VSDs in the design phase of thecommercial building plan, is the lack of trained and experienced consulting engineers whohave the required knowledge to design these systems. The potential for litigation seriouslycontributes to risk aversion and limits any new product acceptance.
Variable-speed drives require considerable technical experience on the part of the systemdesigner to avoid potentially costly design problems. VSDs must be matched, correctly, tothe host electrical distribution system. Power quality deterioration, motor stress, noise, anddamaging vibration can result from ASD misapplication. Additionally, in some cases, VSDsmay require the installation of new electrical protection devices or the purchase of new,more efficient motors.
Faced with competitive pressures, engineering design has drifted to “boilerplate”approaches that make maximum use of “packaged” equipment solutions. Systemsengineering, the careful consideration of optimal flows and pressures is reluctantly, yetnecessarily replaced by convenient rules-of-thumb. System optimization could end up as alost art unless it becomes recognized and rewarded.
ContractorsVSDs represent a relatively new technology that is unfamiliar to many mechanical andelectrical contractors. Their lack of product knowledge translates into lost opportunities inthe retrofit market and leads to the adoption of a “risk premium” on new constructionprojects where the equipment is specified.
5-5
DistributorsThe complexity in VSD applications essentially makes them specialty items that mostelectrical equipment distributors do not stock. The manufacturer’s representative who oftenprovides considerable benefit in assisting the engineer or contractor in the system designdominates the sales channel. The added service translates into higher product costs. In thissituation, the distributor’s role is limited to assuming the credit risk.
UtilitiesThe site-specific nature of ASD savings does not lend itself particularly well to genericrebates such as payments per HP. The trend in regulatory circles is increasingly towardsverified kW and kWh savings. High DSM programmatic costs may result from the need toperform pre-implementation audits and post-implementation monitoring. ESCO typeperformance contracting seems well suited to the installation of VSDs but the transactioncosts can be significant.
6-1
6 Bibliography
ACEEE 1991. Energy Efficient Motor Systems–A Handbook on Technology Programs, andPolicy Opportunities. American Council for an Energy–Efficient Economy (ACEEE). 1991.
ACEEE 1995. Elliott, R.N.. Energy Efficiency in Electric Motor Systems. AmericanCouncil for an Energy-Efficient Economy (ACEEE). April 1995.
ACEEE 1996. Friedman, N.R., et al.. Electric Motor System Market Transformation,American Council for an Energy-Efficient Economy (ACEEE). March 1996.
Americold, 1990 (January). Private communication.
Appliance 1998. “Statistical Review — 45th Annual Report of the U.S. Appliance Industry”.Appliance Magazine. April 1998.
Appliance Magazine Web site, Appliance Magazine, April 1998,“http://www.appliance.com”
ADL 1990 (August). Impact of a CFC Ban on the Cost and Performance of HouseholdRefrigerators, Centrifugal Chillers, and Commercial/Industrial Refrigeration Systems.Arthur D. Little, Inc. Technical Memorandum to U.S. DOE.
ADL 1993. Patel, R.. Characterization of Commercial Building Appliances. Arthur D.Little, Inc.. August 1993.
ADL 1996. Energy Savings Potential for Commercial Refrigeration Equipment. Arthur D.Little for U.S. Department of Energy, Office of Building Technologies. June 1996.
ADL 1998. Zogg, R.A. and Alberino, D.L., Electricity Consumption by Small End Uses inResidential Buildings. Arthur D. Little for U.S. Department of Energy, Office of BuildingTechnologies, Contract No. DE-AC01-96CE23798. August 1998.
ADL 1998(a). Westphalen, D. and Koszalinski, S.A., Commercial Building Energy Use -Volume II: Thermal Distribution, Auxiliary Equipment, and Ventilation. Arthur D. Little forU.S. Department of Energy, Office of Building Technologies, Contract No. DE-AC01-96CE23798, Task Assignment #4. November 24, 1998.
AEO 1998. Annual Energy Outlook 1998. Energy Information Administration, ReportNo. DOE/EIA-0383 (98). December 1997.
Baldor, 1989 (November). Private communication.
Beard 1994. Comments of the Associate of Home Appliance Manufacturers RegardingEnergy Efficiency Standards for Room Air Conditioners. Docket No. EE-RM-90-201.July 18, 1994.

6-2
Cann, P. 1989 (November 28 - December 1). “Integrated Heat Pumps,” Meeting CustomerNeeds with Heat Pumps. Atlanta, GA., Sponsored by EPRI.
CBECS 1989. Commercial Buildings Characteristics - 1989. DOE/EIA-0246(89).June 1991.
CBECS 1989. Commercial Buildings Energy Consumption and Expenditures—1989.DOE/EIA-0318(89). April 1992.
Copeland, 1990 (January). Private communication.
Dickey, 1994. Testimony before the US. Department of Energy, Office of Energy Efficiencyand Renewable Energy, EE-431, Energy Conservation Program for Consumer Products,Docket No. EE-RM-90-201, 50 Federal Register, pg. 10464, March 4, 1994.
Dieckmann 1993. State-of-the-Art Survey of Motor Technology Applicable to HermeticCompressors for Domestic Refrigerator/Freezers. J. Dieckmann and E. McMahon. U.S.EPA Report, EPA-430-R-93-009, Global Change Division, Office of AtmosphericPrograms, Washington, DC. April 1993.
Dieckmann 1993. State-of-the-Art-Survey of Hermetic Compressor Technology Applicableto Domestic Refrigerator/Freezers. J. Dieckmann and W. Johnson. U.S. EPA Report EPA-430-R-93-010, Global Change Division, Office of Atmospheric Programs, Washington, DC.April 1993.
DOE 1996. National Market Transformation Strategies for Industrial Electric MotorSystems. U.S. Department of Energy, Office of Industrial Technologies. May 1996.
DOE 1998. U.S. Department of Energy, Office of Building Technology, State andCommunity Programs Core Databook. June 12, 1998.
DOE/OIT, 1998. United States Industrial Electric Motors Systems Market OpportunitiesAssessment. Xenergy, Inc.. August 22, 1998.
Electric Power Research Institute, 1987. ASD Directory. Second Edition. Palo Alto,California.
Emerson Electric, 1990 (January). Private communication.
EPA 1993. Multiple Pathways to Super-Efficient Refrigerators. United StatesEnvironmental Protection Agency. June 1993. EPA-430-R-93-008.
EPRI, 1992 (June). Electrical Motors - Markets, Trends and Applications. EPRITR-100423.

6-3
Federal Register, 1989a (February 7), pp. 6077-8.
Federal Register, 1989b (November 17), pp. 47916-47938.
Federal Register, 1991 (May 14). Energy Conservation Program for Consumer Products:Final Rule Regarding Energy Conservation Standards for Three Types of ConsumerProducts. pp. 22267-8.
Fitzgerald, A.E., Kingsley, C. Jr., Urmans, S.D., Electric Machinery. McGraw-Hill, 1990.
GE Motors, 1990a (January 12), Telefax summarizing induction motor efficiencies.
GE Motors, 1990b (January). Private communication.
Grainger, 1998-99. W. W. Grainger General Catalog No. 389.
Greenberg, S., et al., 1988 (March). Technology Assessment: Adjustable-speed Motors andMotor Drives (Residential and Commercial Sectors). LBL-25080.
GRI, 1989, Hurley, J., Shukla, K., and Kohli, P., Commercial Appliance Energy UseUpdate-1989. GRI-92/0225.
LBL, 1996. Draft Report on Energy Conservation Potential for Small Electric Motors.Lawrence Berkeley National Laboratory for U.S. Department of Energy, Office of Codesand Standards. August 1996.
LBL, 1998. Sanchez, M.C., et al., Miscellaneous Electricity Use in the U.S. ResidentialSector. Ernest Orlando, Lawrence Berkeley National Laboratory, Draft Report No. LBL-40295. January 1998.
Lloyd, J. D. 1982. Variable-Speed Compressor Motors Operated on Inverters. AHSRAETransactions V88, pt 1.
Lorenz, A., Meutzner, K. 1975. On Application of Non-azeotropic Two-componentRefrigerants in Domestic Refrigerators and Home Freezers. IIR.
Lovins, A. B., et al., 1989 Edition (April). The State of the Art: Drivepower, A CompetitekReport published by the Rocky Mountain Institute. Snowmass, CO.
MotorMaster+ 3.0 Database. Washington State Energy Office. 1998.
RECS 1992. Housing Characteristics 1990. Residential Energy Consumption Survey,DOE/EIA-0314(90). May 1992.
6-4
RECS 1993. Household Energy Consumption and Expenditures 1990. Residential EnergyConsumption Survey, DOE/EIA-0321(90). February 1993.
Slemon, G.R.. Electric Machines and Drives. Addison-Wesley. 1992.
Smith, A.O., 1990 (January). Private communication.
Sulfstede, L., 1989 (November 28 - December 1). Residential Variable Speed Technology -Meeting Customer Needs with Heat Pumps. Atlanta, GA, Sponsored by EPRI.
Sun, Tseng-Yoo, 1993. “The Variety of Air Handling Systems,” Heating, Piping, and AirConditioning, pp. 53 – 60. December, 1993.
Toshiba(a) International Corporation, Houston, Texas. Toshiba Instruction and MaintenanceManual - Tosvert - 130E Transistor Inverter. Bulletin No. IMVT130E230.
Toshiba(b) International Corporation, Houston, Texas, Toshiba Inverter Seminar (a 20-pagebrochure published by Toshiba).
USCB 1995(a). Major Household Appliances. U.S. Census Bureau, Report No. MA36F,1995.
USCB 1995(b). Refrigeration and Heating Equipment. U.S. Census Bureau, ReportNo. MA35M, 1995.
ZBA 1993. Communication with William Bahnfleth, ZBA, Inc. Engineers/Architects.June 1993.

Filename: DOE Motor Report 2-2-00.docDirectory: C:\DocsTemplate: C:\Program Files\Microsoft Office\Templates\Normal.dotTitle: A HeadSubject:Author: COMDISCO\ARTHUR D LITTLE INCKeywords:Comments:Creation Date: 02/02/00 2:03 PMChange Number: 4Last Saved On: 02/02/00 2:37 PMLast Saved By: Stephen DiBenedettoTotal Editing Time: 11 MinutesLast Printed On: 02/02/00 2:49 PMAs of Last Complete Printing
Number of Pages: 130Number of Words: 35,922 (approx.)Number of Characters: 204,760 (approx.)