oracle® business intelligence · vii preface this guide introduces readers to oracle business...
TRANSCRIPT
Oracle® Business IntelligenceConcepts Guide
10g Release 2 (10.1.2.1)
B16378-01
July 2005

Oracle Business Intelligence Concepts Guide, 10g Release 2 (10.1.2.1)
B16378-01
Copyright © 2004, 2005 Oracle. All rights reserved.
The Programs (which include both the software and documentation) contain proprietary information; they are provided under a license agreement containing restrictions on use and disclosure and are also protected by copyright, patent, and other intellectual and industrial property laws. Reverse engineering, disassembly, or decompilation of the Programs, except to the extent required to obtain interoperability with other independently created software or as specified by law, is prohibited.
The information contained in this document is subject to change without notice. If you find any problems in the documentation, please report them to us in writing. This document is not warranted to be error-free. Except as may be expressly permitted in your license agreement for these Programs, no part of these Programs may be reproduced or transmitted in any form or by any means, electronic or mechanical, for any purpose.
If the Programs are delivered to the United States Government or anyone licensing or using the Programs on behalf of the United States Government, the following notice is applicable:
U.S. GOVERNMENT RIGHTS Programs, software, databases, and related documentation and technical data delivered to U.S. Government customers are "commercial computer software" or "commercial technical data" pursuant to the applicable Federal Acquisition Regulation and agency-specific supplemental regulations. As such, use, duplication, disclosure, modification, and adaptation of the Programs, including documentation and technical data, shall be subject to the licensing restrictions set forth in the applicable Oracle license agreement, and, to the extent applicable, the additional rights set forth in FAR 52.227-19, Commercial Computer Software—Restricted Rights (June 1987). Oracle Corporation, 500 Oracle Parkway, Redwood City, CA 94065
The Programs are not intended for use in any nuclear, aviation, mass transit, medical, or other inherently dangerous applications. It shall be the licensee's responsibility to take all appropriate fail-safe, backup, redundancy and other measures to ensure the safe use of such applications if the Programs are used for such purposes, and we disclaim liability for any damages caused by such use of the Programs.
Oracle, JD Edwards, PeopleSoft, and Retek are registered trademarks of Oracle Corporation and/or its affiliates. Other names may be trademarks of their respective owners.
The Programs may provide links to Web sites and access to content, products, and services from third parties. Oracle is not responsible for the availability of, or any content provided on, third-party Web sites. You bear all risks associated with the use of such content. If you choose to purchase any products or services from a third party, the relationship is directly between you and the third party. Oracle is not responsible for: (a) the quality of third-party products or services; or (b) fulfilling any of the terms of the agreement with the third party, including delivery of products or services and warranty obligations related to purchased products or services. Oracle is not responsible for any loss or damage of any sort that you may incur from dealing with any third party.
iii
Contents
Preface ................................................................................................................................................................ vii
Audience...................................................................................................................................................... viiDocumentation Accessibility .................................................................................................................... viiStructure ..................................................................................................................................................... viiiRelated Documents ................................................................................................................................... viiiOracle By Example Series........................................................................................................................... ixConventions ................................................................................................................................................. x
1 The Oracle Business Intelligence Solution
What is Business Intelligence? .............................................................................................................. 1-1Business Intelligence and Transactional Data................................................................................ 1-2Business Intelligence and Data Warehousing................................................................................ 1-2Oracle Business Intelligence and Oracle Database........................................................................ 1-2Oracle Business Intelligence Components ..................................................................................... 1-3
Components for Structuring Data for Analysis...................................................................... 1-3Components for Analyzing Data and Creating Reports....................................................... 1-3Components for Publishing and Interacting with Reports................................................... 1-3Components for Building Custom Applications.................................................................... 1-3
Answering Business Questions with Oracle Business Intelligence .............................................. 1-4How Is My Business Performing? ................................................................................................... 1-4
Gauges .......................................................................................................................................... 1-4Conditional Formatting.............................................................................................................. 1-5Graphs .......................................................................................................................................... 1-6Sorting and Ranking................................................................................................................... 1-7
What Factors Are Influencing My Business? ................................................................................. 1-8Displaying Exception Data ........................................................................................................ 1-8Interactive Drilling...................................................................................................................... 1-9Interactive Layout Changes.................................................................................................... 1-11Data Mining: Attribute Importance ...................................................................................... 1-12
Where Is My Business Headed?.................................................................................................... 1-13Trend Analysis ......................................................................................................................... 1-13Modeling and Planning........................................................................................................... 1-14
Where Should We Focus Our Efforts? ......................................................................................... 1-14What-If Analysis ...................................................................................................................... 1-15Data Mining: Classification and Regression ........................................................................ 1-16
iv
Data Mining: Market Basket Analysis .................................................................................. 1-17Report Styles for Answering Business Questions ...................................................................... 1-18
Sharing Answers to Business Questions .......................................................................................... 1-18Presenting Information in a Dashboard ...................................................................................... 1-19Presenting Information in an Interactive Web Application...................................................... 1-19Presenting Information in Excel.................................................................................................... 1-20
Exporting to Excel .................................................................................................................... 1-20Working Directly in Excel....................................................................................................... 1-20
Printing Reports .............................................................................................................................. 1-21Publishing Data to Other Formats ................................................................................................ 1-21Distributing Reports ....................................................................................................................... 1-21
2 Technical Fundamentals for Implementation
Consolidating Data for Analysis ........................................................................................................... 2-1Data Sources........................................................................................................................................ 2-1
Operational Data......................................................................................................................... 2-1External Data ............................................................................................................................... 2-2
Extraction, Transformation, and Loading ...................................................................................... 2-2More Information ............................................................................................................................... 2-3
Data Models .............................................................................................................................................. 2-3Transactional Model .......................................................................................................................... 2-3Dimensional Model............................................................................................................................ 2-4
Facts or Measures........................................................................................................................ 2-4Dimensions .................................................................................................................................. 2-4Hierarchies ................................................................................................................................... 2-4Levels ............................................................................................................................................ 2-4
Data Structures.......................................................................................................................................... 2-5Relational Tables in Third Normal Form........................................................................................ 2-5Star Schemas ....................................................................................................................................... 2-5Analytic Workspaces ......................................................................................................................... 2-6Data Structure and Preparation for Data Mining.......................................................................... 2-7
Metadata Models for Data Access ......................................................................................................... 2-8Relational Metadata ........................................................................................................................... 2-8OLAP Metadata.................................................................................................................................. 2-9Key Differences Between Relational and OLAP Metadata Models............................................ 2-9
Hierarchies ................................................................................................................................... 2-9Aggregation .............................................................................................................................. 2-11Calculations .............................................................................................................................. 2-12
Models for Data Mining ...................................................................................................................... 2-12Tools for Creating Reports................................................................................................................... 2-13
Oracle Reports ................................................................................................................................. 2-13Who Uses Oracle Reports ....................................................................................................... 2-14Source Data for Oracle Reports.............................................................................................. 2-14More Information..................................................................................................................... 2-14
OracleBI Discoverer Plus ............................................................................................................... 2-14Who Uses OracleBI Discoverer Plus ..................................................................................... 2-16Source Data for OracleBI Discoverer Plus............................................................................ 2-16
v
More Information..................................................................................................................... 2-16OracleBI Spreadsheet Add-In........................................................................................................ 2-16
Who Uses OracleBI Spreadsheet Add-In.............................................................................. 2-17Source Data for OracleBI Spreadsheet Add-In .................................................................... 2-17More Information..................................................................................................................... 2-17
Oracle Spreadsheet Add-In for Predictive Analytics................................................................. 2-17Who Uses Oracle Spreadsheet Add-In for Predictive Analytics....................................... 2-18Data Sources for Oracle Spreadsheet Add-In for Predictive Analytics ........................... 2-18More Information..................................................................................................................... 2-18
Custom Application Development Tool ........................................................................................... 2-18Data Source for BI Beans ................................................................................................................ 2-19More Information ............................................................................................................................ 2-19
Deploying Oracle Business Intelligence .......................................................................................... 2-19OracleAS Portal and OracleBI Discoverer Portlet Provider...................................................... 2-20
More Information..................................................................................................................... 2-20OracleBI Discoverer Viewer .......................................................................................................... 2-21
More Information..................................................................................................................... 2-21Oracle Reports Output Options .................................................................................................... 2-22
More Information..................................................................................................................... 2-22
3 Example Implementations
Implementing a Business Intelligence Solution ................................................................................ 3-1Planning a Business Intelligence System ........................................................................................ 3-1Identify End-User Requirements ..................................................................................................... 3-2Identify the Data Sources .................................................................................................................. 3-3Design the Data Model...................................................................................................................... 3-3Create the Data Store ......................................................................................................................... 3-3Generate the Summary Data ............................................................................................................ 3-3Prepare the Data for Client Access .................................................................................................. 3-3Grant Access Rights ........................................................................................................................... 3-3Distribute the Client Software and Documentation...................................................................... 3-3Create and Distribute Reports.......................................................................................................... 3-4
Global Enterprises: Ad-Hoc Reporting and Advanced Analytics .................................................. 3-4Software Requirements ..................................................................................................................... 3-5
Components for Delivering Reports ........................................................................................ 3-5Components for Creating Reports............................................................................................ 3-5Components for Preparing Data............................................................................................... 3-5Component for Developing Custom Applications ................................................................ 3-5Database ....................................................................................................................................... 3-5
Getting Started With Analytic Workspaces ................................................................................... 3-5Design the Data Model............................................................................................................... 3-5Create the Data Store.................................................................................................................. 3-6Generate the Summary Data ..................................................................................................... 3-6Prepare the Data for Client Access ........................................................................................... 3-6Grant Access Rights.................................................................................................................... 3-6Distribute the Client Software and Documentation .............................................................. 3-7Define Advanced Analytics....................................................................................................... 3-7
vi
Deploy Custom Applications.................................................................................................... 3-7Acme Corporation: Web-Based Access to Transactional Data ......................................................... 3-7
Software Requirements ..................................................................................................................... 3-7Components for Delivering Reports ........................................................................................ 3-8Components for Creating Reports............................................................................................ 3-8Component for Preparing Data ................................................................................................ 3-8Database ....................................................................................................................................... 3-8
Getting Started With Discoverer...................................................................................................... 3-8Design the Data Model............................................................................................................... 3-8Generate the Summary Data ..................................................................................................... 3-8Prepare the Data for Client Access ........................................................................................... 3-9Grant Access Rights.................................................................................................................... 3-9Distribute the Client Software and Documentation .............................................................. 3-9
A Oracle Business Intelligence Packaging
Oracle Business Intelligence ................................................................................................................. A-1Oracle Business Intelligence Tools ...................................................................................................... A-1Oracle Business Intelligence Warehouse Builder Installation ....................................................... A-2Oracle Database ....................................................................................................................................... A-2
Index
vii
Preface
This guide introduces readers to Oracle Business Intelligence. It provides an overview of what you can do with Oracle Business Intelligence, and it explains concepts that you need to understand as you plan to implement a business intelligence solution.
AudienceOracle Business Intelligence Concepts Guide is intended for information consumers, report creators, analysts, data providers, DBAs, and application developers who perform the following tasks:
■ Use data analysis to help make business decisions
■ Develop custom reports for their own use and for other users
■ Prepare data for analysis
■ Administer Oracle Database for a business intelligence system
■ Develop custom solutions for analyzing data stored in an Oracle database
To use this document, you need no prior experience with business intelligence software.
Documentation AccessibilityOur goal is to make Oracle products, services, and supporting documentation accessible, with good usability, to the disabled community. To that end, our documentation includes features that make information available to users of assistive technology. This documentation is available in HTML format, and contains markup to facilitate access by the disabled community. Accessibility standards will continue to evolve over time, and Oracle is actively engaged with other market-leading technology vendors to address technical obstacles so that our documentation can be accessible to all of our customers. For more information, visit the Oracle Accessibility Program Web site at
http://www.oracle.com/accessibility/
Accessibility of Code Examples in DocumentationScreen readers may not always correctly read the code examples in this document. The conventions for writing code require that closing braces should appear on an otherwise empty line; however, some screen readers may not always read a line of text that consists solely of a bracket or brace.
viii
Accessibility of Links to External Web Sites in DocumentationThis documentation may contain links to Web sites of other companies or organizations that Oracle does not own or control. Oracle neither evaluates nor makes any representations regarding the accessibility of these Web sites.
TTY Access to Oracle Support ServicesOracle provides dedicated Text Telephone (TTY) access to Oracle Support Services within the United States of America 24 hours a day, seven days a week. For TTY support, call 800.446.2398.
StructureThis guide is structured as follows:
Chapter 1, "The Oracle Business Intelligence Solution"This chapter provides a general introduction to business intelligence and shows you how Oracle Business Intelligence helps you answer business questions. It is written for business users and IT professionals.
Chapter 2, "Technical Fundamentals for Implementation"This chapter describes fundamental concepts for building a business intelligence solution with Oracle Business Intelligence. It focuses on data structures and metadata for reporting and describes options for reporting tools and delivery mechanisms. This chapter is written primarily for IT professionals.
Chapter 3, "Example Implementations"This chapter provides sample scenarios for two different Oracle Business Intelligence solutions. It is written primarily for IT professionals.
Appendix A, "Oracle Business Intelligence Packaging"This appendix lists the components of different Oracle Business Intelligence packages.
Related DocumentsFor more information, see these Oracle resources:
■ Oracle Application Server Installation Guide
■ Oracle Business Intelligence Discoverer Plus User’s Guide
■ Oracle Business Intelligence Discoverer Publishing Workbooks in Oracle Application Server Portal
■ Oracle Business Intelligence Discoverer Viewer User’s Guide
■ Oracle Business Intelligence Discoverer Administration Guide
■ Oracle Reports Building Reports
■ Oracle Application Server Reports Services Publishing Reports to the Web
■ Oracle Warehouse Builder User’s Guide
■ Oracle Data Warehousing Guide
■ Oracle OLAP Application Developer’s Guide
■ Oracle Data Mining Concepts
ix
■ Oracle Data Mining Application Developer’s Guide
■ Oracle Data Mining Administrator’s Guide
■ Oracle Business Intelligence Beans Help (in Oracle JDeveloper)
■ Oracle Business Intelligence Spreadsheet Add-In Help (in Microsoft Excel)
The Oracle Technology Network (OTN) provides services and resources that developers, DBAs, and architects need to build, test, and deploy applications using Oracle products and industry-standard technologies. It provides free access to documentation, release notes, white papers, product announcements, and other vital information. The OTN Web site is at
http://www.oracle.com/technology/index.html
The OTN Web site for Business Intelligence is at
http://www.oracle.com/technology/products/bi/index.html
Oracle By Example SeriesThe Oracle By Example (OBE) series provides hands-on, step-by-step instructions on how to implement various technology solutions to business problems. OBE contains numerous lessons on Business Intelligence from its Web site at:
http://www.oracle.com/technology/obe/start/bi.html
Following is a list of some of these lessons.
OracleBI DiscovererThe OracleBI Discoverer area includes these and other lessons:
■ Creating Business Intelligence Reports Using OracleBI Discoverer Plus OLAP
■ Analyzing Sales History Information using OracleBI Discoverer Plus Relational
■ Viewing Sales History Information Using OracleBI Discoverer Viewer
■ Creating a Business Intelligence Dashboard Using OracleBI Discoverer Portlets
OracleBI Spreadsheet Add-InThe OracleBI Spreadsheet Add-In are includes this lesson:
■ Using the OracleBI Spreadsheet Add-In
OracleBI BeansThe OracleBI Beans area include these lessons:
■ Develop Business Intelligence Applications Using OracleBI Beans
■ Develop Business Intelligence Objects Using OracleBI Beans
Oracle ReportsThe Oracle Reports area includes these and other lessons:
■ Creating a Report Using the Report Wizard
■ Creating a Graph Using the Graph Wizard
■ Applying Conditional Formatting in a Paper Report
■ Applying Conditional Formatting in the JSP Web Source
x
Oracle Warehouse BuilderThe Oracle Warehouse Builder area these and other lessons:
■ Importing Source Metadata
■ Defining a Target Module
■ Dimensional Design Using Oracle Warehouse Builder
■ Designing ETL Data Flow Mapping
■ Designing Process Flows
Oracle Database: Business Intelligence and Data WarehousingThe Oracle Business Intelligence platform area includes these and other lessons:
■ ETL Infrastructure Inside Oracle Database 10g
■ Populating Your OLAP Analytic Workspace Using Analytic Workspace Manager
■ Solving Business Problems with Oracle Data Mining
■ Using Basic Database Functionality for Data Warehousing
ConventionsThe following text conventions are used in this document:
Convention Meaning
boldface Boldface type indicates graphical user interface elements associated with an action, or terms defined in text or the glossary.
italic Italic type indicates book titles, emphasis, or placeholder variables for which you supply particular values.
monospace Monospace type indicates commands within a paragraph, URLs, code in examples, text that appears on the screen, or text that you enter.
The Oracle Business Intelligence Solution 1-1
1The Oracle Business Intelligence Solution
This chapter describes what business intelligence is and what you can do with Oracle Business Intelligence. It contains the following sections:
■ What is Business Intelligence?
■ Answering Business Questions with Oracle Business Intelligence
■ Sharing Answers to Business Questions
What is Business Intelligence?Business intelligence (or BI) is the process of getting information about your business from available data. In the Information Age, corporations have at their disposal massive amounts of data, collected in transactional systems. These systems are essential for businesses to keep track of their affairs.
Having data is not the same as having information. Data becomes information when you can use it to answer business questions, so you can understand your business better. Business intelligence allows you to answer those questions, so that decision makers at all levels can respond quickly to changes in the business.
Business intelligence provides answers to basic questions such as:
■ What are my five top selling products?
■ How do my sales this year compare to sales last year?
■ What is the 3-month moving average of my sales?
Business intelligence can also answer more probing analytical questions such as:
■ Why are sales down in this region?
■ What can we predict for sales next quarter?
■ What factors can we alter to improve the sales forecast?
■ How will our margins improve if we run this promotion?
■ What factors differentiate our high value customers from other customers?
■ Which products do customers buy together?
■ Which customers are most likely to buy a particular product?
■ Which transactions may be fraudulent?
What is Business Intelligence?
1-2 Oracle Business Intelligence Concepts Guide
Business Intelligence and Transactional DataBusiness intelligence begins with the day-to-day information that you need to run your business. You need to know what was ordered yesterday and what was shipped. You need to know which accounts are more than 30 days outstanding. You need to know the volume of calls that come into a call center. This information comes from the data that you collect during business transactions, in an operational system such as Oracle E-Business Suite. Oracle Business Intelligence gives you access to this transactional data, so that you can report from it to find current information.
Business Intelligence and Data WarehousingFor many business intelligence questions, you need historical data or data from a number of different sources. The solution for this kind of business intelligence is often built upon a data warehouse and is part of the data warehouse environment.
A data warehouse is a relational database that is designed for query and analysis rather than for transaction processing. It contains historical data derived from transaction data, but it can include data from other sources. Data warehouses separate analysis workload from transaction workload and enable an organization to consolidate data from several sources.
Data warehouses often integrate data from a number of transactional systems, making it possible to compare and to analyze data from a broad base of source data. After data is loaded into a data warehouse, it is not changed except to correct errors. This integration of nonvolatile data allows the data warehouse to be a single source of truth for answering business questions.
Unlike transactional systems, data warehouses store historical data. This historical data is crucial to business intelligence, which requires analysis of past performance. Business intelligence uses this historical data for time-based analysis and trend analysis.
Data warehouses organize data around business subjects, such as customers, products, and time. These business subjects form the basis of the business questions that business intelligence answers.
In addition to a relational database, a data warehouse environment can include an extraction, transformation, and loading (ETL) solution, online analytical processing (OLAP) and data mining capabilities, client analysis tools, and other applications that manage the process of gathering data and delivering it to business users.
Oracle Business Intelligence and Oracle DatabaseOracle Database includes a rich set of data warehousing features and functions, so an Oracle data warehouse can be tuned for very fast analytic queries on very large data sets. Oracle Database also features a full set of statistical functions, such as ranking functions, time-series functions, linear regression, descriptive statistics, correlations, hypothesis testing. Oracle Business Intelligence components leverage many of these statistical functions.
Oracle OLAP and Oracle Data Mining are database options that are part of the data warehousing environment, providing advanced analytic features. Oracle Business Intelligence leverages these and other database features and options as it supports analysis of business data, to answer your business questions.
What is Business Intelligence?
The Oracle Business Intelligence Solution 1-3
Oracle Business Intelligence ComponentsOracle Business Intelligence includes a number of components that make it possible for you to answer business questions from your data.
Components for Structuring Data for AnalysisOracle Business Intelligence includes the following components for preparing your data for analysis:
■ Oracle Business Intelligence Warehouse Builder (OracleBI Warehouse Builder) for designing, implementing, and maintaining a data warehouse environment and the metadata for building reports
■ Oracle Business Intelligence Discoverer Administrator (OracleBI Discoverer Administrator) for creating and maintaining a business-oriented view of relational data for other OracleBI Discoverer components
■ Analytic Workspace Manager for structuring data for advanced analysis
Components for Analyzing Data and Creating ReportsOracle Business Intelligence includes the following components for analyzing data and creating reports:
■ Oracle Business Intelligence Discoverer Plus (OracleBI Discoverer Plus) for creating standard and ad-hoc reports
■ Oracle Reports for creating high-fidelity enterprise reports
■ Oracle Business Intelligence Spreadsheet Add-In (OracleBI Spreadsheet Add-In) for working directly in Microsoft Excel, to query analytic data
■ Oracle Data Miner, which is the graphical user interface for Oracle Data Mining, for performing data mining, such as response modeling, market basket analysis, and customer profiling and clustering.
■ Oracle Spreadsheet Add-In for Predictive Analytics for performing one-click, automated data mining in Microsoft Excel
Components for Publishing and Interacting with ReportsOracle Business Intelligence includes the following components for sharing reports with others:
■ Oracle Business Intelligence Discoverer Portlet Provider (OracleBI Discoverer Portlet Provider), which supports publishing reports in OracleAS Portal
■ Oracle Reports, which supports the publication of enterprise reports to a printer, to the Web, and in OracleAS Portal
■ Oracle Business Intelligence Discoverer Viewer (OracleBI Discoverer Viewer), which supports viewing reports and analyzing data in a Web browser
Components for Building Custom ApplicationsOracle Business Intelligence includes the following component for building your own business intelligence application:
■ Oracle Business Intelligence Beans (OracleBI Beans), which, integrated with JDeveloper, supports the development of JSP applications
Oracle OLAP supports the creation of advanced analytic functions, such as forecasting and allocations, which you can make available in an OracleBI Beans application.
Answering Business Questions with Oracle Business Intelligence
1-4 Oracle Business Intelligence Concepts Guide
In addition, Oracle OLAP and Oracle Data Mining have Java and SQL APIs, which you can call in a BI application.
Answering Business Questions with Oracle Business IntelligenceOracle Business Intelligence allows you to answer a range of business questions. This section describes how Oracle Business Intelligence helps you answer common business questions:
■ How Is My Business Performing?
■ What Factors Are Influencing My Business?
■ Where Is My Business Headed?
■ Where Should We Focus Our Efforts?
How Is My Business Performing?The most basic kind of business intelligence involves knowing the state of your business. You need to know whether you are meeting your strategic goals, which areas of your business are performing well and which are not, and whether conditions are improving. With Oracle Business Intelligence, it is easy to find answers to questions about the state of your business, such as:
■ Are we making our sales targets?
■ What are my five best selling products?
■ Am I over budget?
■ How do my sales this year compare to sales last year?
■ What is the 3-month moving average of my sales?
■ Which orders shipped yesterday?
Oracle Business Intelligence includes a number of tools to answer these kinds of questions, including:
■ Gauges
■ Conditional formatting, including stoplight formatting
■ Graphs
■ Sorting and ranking
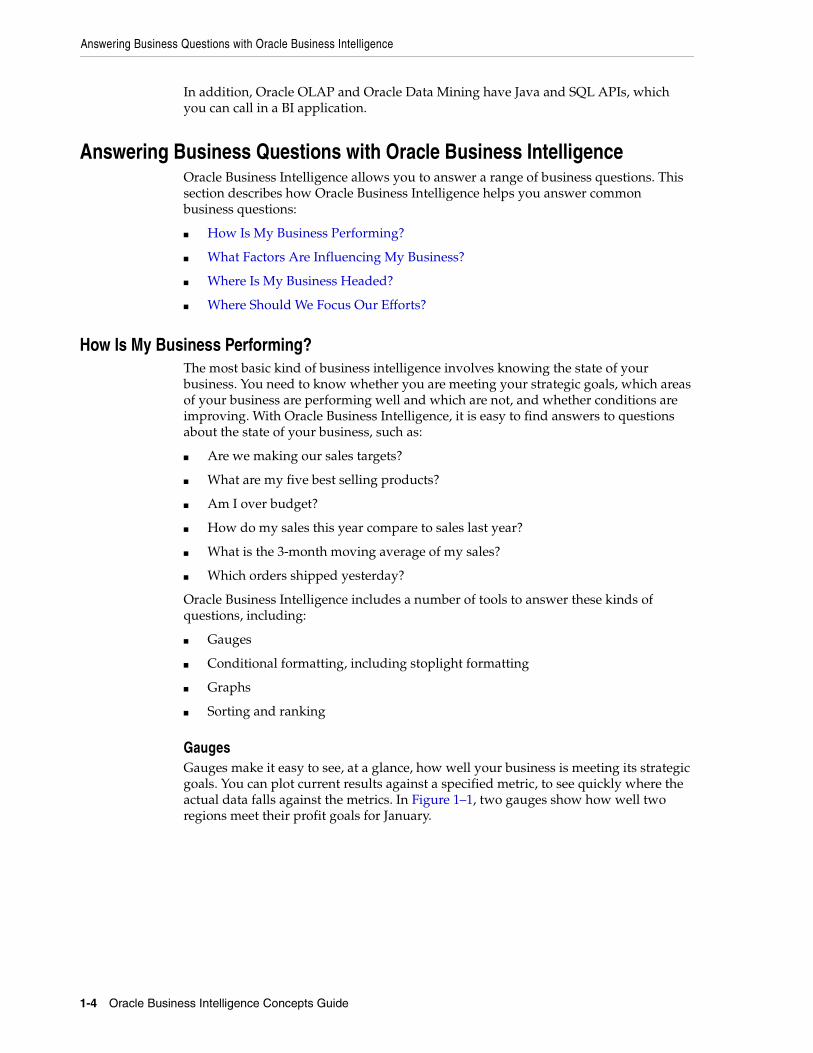
GaugesGauges make it easy to see, at a glance, how well your business is meeting its strategic goals. You can plot current results against a specified metric, to see quickly where the actual data falls against the metrics. In Figure 1–1, two gauges show how well two regions meet their profit goals for January.
Answering Business Questions with Oracle Business Intelligence
The Oracle Business Intelligence Solution 1-5
Figure 1–1 Gauges for January Profits in East and Central Regions
Gauges are available through OracleBI Discoverer Portlet Provider.
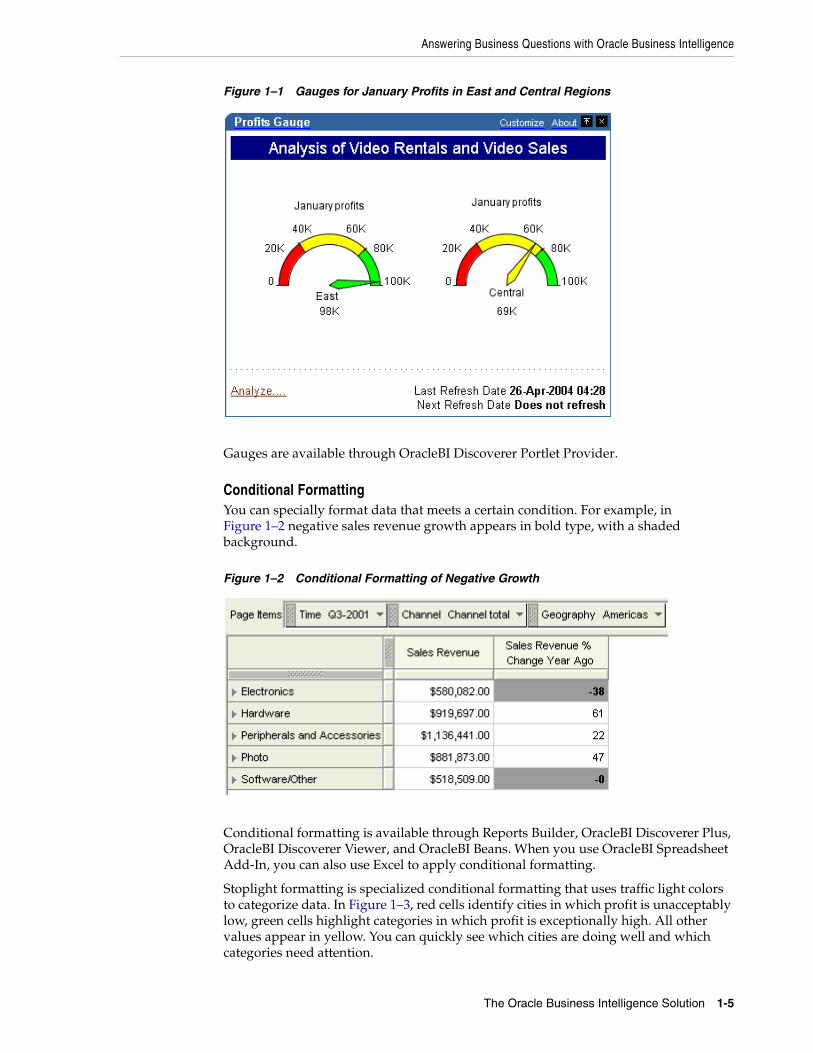
Conditional FormattingYou can specially format data that meets a certain condition. For example, in Figure 1–2 negative sales revenue growth appears in bold type, with a shaded background.
Figure 1–2 Conditional Formatting of Negative Growth
Conditional formatting is available through Reports Builder, OracleBI Discoverer Plus, OracleBI Discoverer Viewer, and OracleBI Beans. When you use OracleBI Spreadsheet Add-In, you can also use Excel to apply conditional formatting.
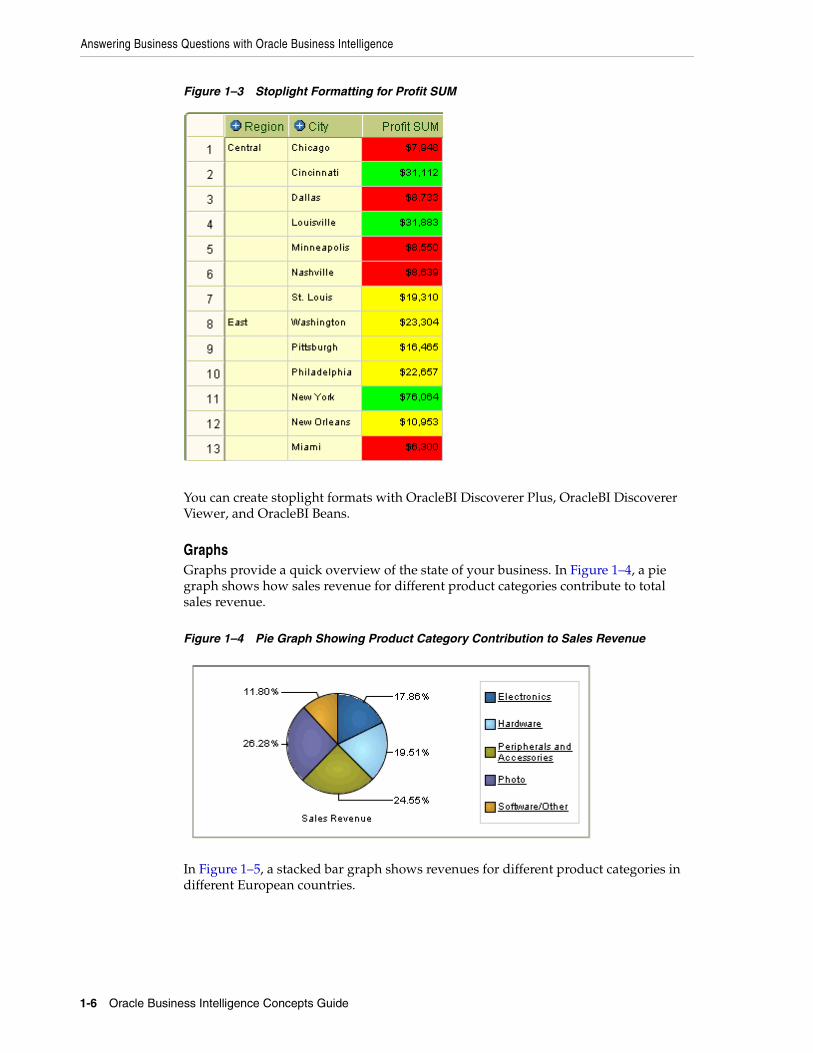
Stoplight formatting is specialized conditional formatting that uses traffic light colors to categorize data. In Figure 1–3, red cells identify cities in which profit is unacceptably low, green cells highlight categories in which profit is exceptionally high. All other values appear in yellow. You can quickly see which cities are doing well and which categories need attention.
Answering Business Questions with Oracle Business Intelligence
1-6 Oracle Business Intelligence Concepts Guide
Figure 1–3 Stoplight Formatting for Profit SUM
You can create stoplight formats with OracleBI Discoverer Plus, OracleBI Discoverer Viewer, and OracleBI Beans.
GraphsGraphs provide a quick overview of the state of your business. In Figure 1–4, a pie graph shows how sales revenue for different product categories contribute to total sales revenue.
Figure 1–4 Pie Graph Showing Product Category Contribution to Sales Revenue
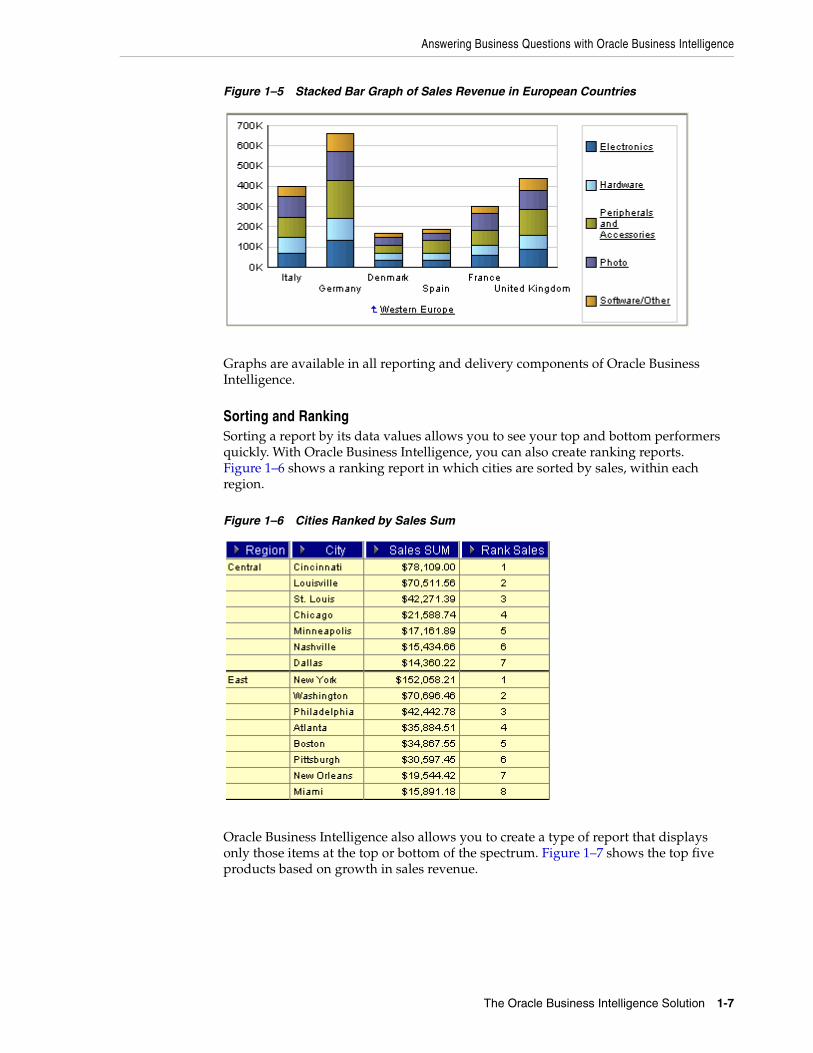
In Figure 1–5, a stacked bar graph shows revenues for different product categories in different European countries.
Answering Business Questions with Oracle Business Intelligence
The Oracle Business Intelligence Solution 1-7
Figure 1–5 Stacked Bar Graph of Sales Revenue in European Countries
Graphs are available in all reporting and delivery components of Oracle Business Intelligence.
Sorting and RankingSorting a report by its data values allows you to see your top and bottom performers quickly. With Oracle Business Intelligence, you can also create ranking reports. Figure 1–6 shows a ranking report in which cities are sorted by sales, within each region.
Figure 1–6 Cities Ranked by Sales Sum
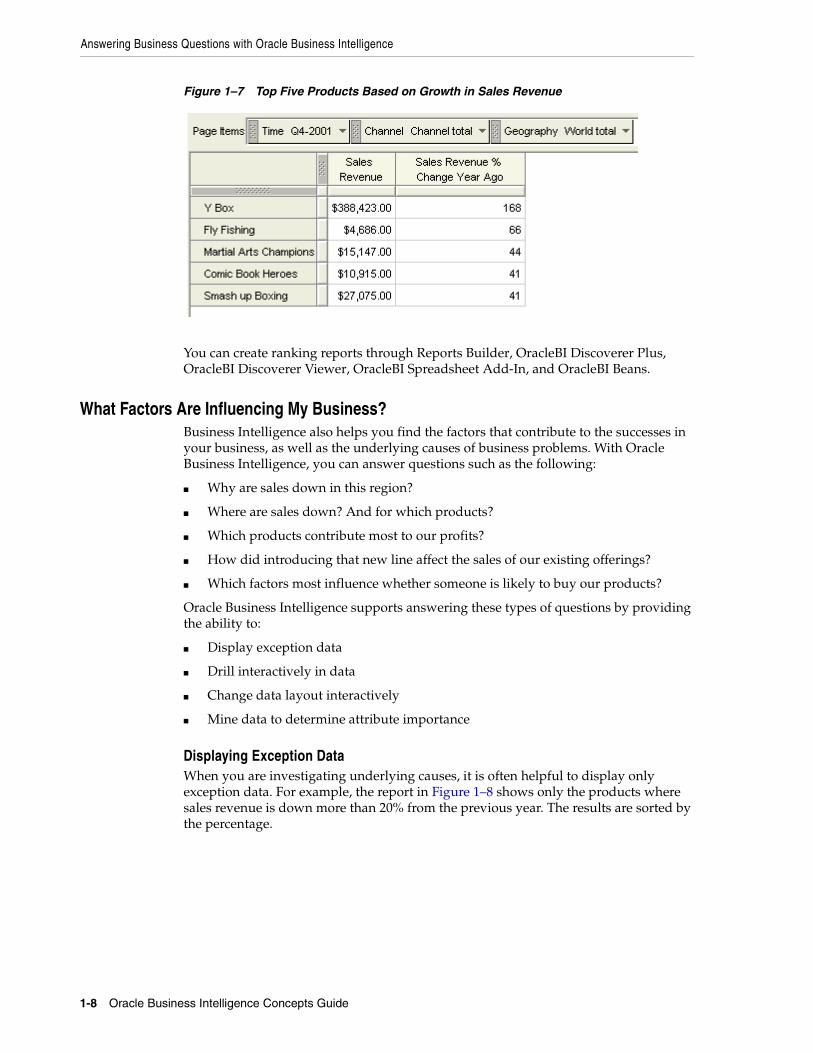
Oracle Business Intelligence also allows you to create a type of report that displays only those items at the top or bottom of the spectrum. Figure 1–7 shows the top five products based on growth in sales revenue.
Answering Business Questions with Oracle Business Intelligence
1-8 Oracle Business Intelligence Concepts Guide
Figure 1–7 Top Five Products Based on Growth in Sales Revenue
You can create ranking reports through Reports Builder, OracleBI Discoverer Plus, OracleBI Discoverer Viewer, OracleBI Spreadsheet Add-In, and OracleBI Beans.
What Factors Are Influencing My Business?Business Intelligence also helps you find the factors that contribute to the successes in your business, as well as the underlying causes of business problems. With Oracle Business Intelligence, you can answer questions such as the following:
■ Why are sales down in this region?
■ Where are sales down? And for which products?
■ Which products contribute most to our profits?
■ How did introducing that new line affect the sales of our existing offerings?
■ Which factors most influence whether someone is likely to buy our products?
Oracle Business Intelligence supports answering these types of questions by providing the ability to:
■ Display exception data
■ Drill interactively in data
■ Change data layout interactively
■ Mine data to determine attribute importance
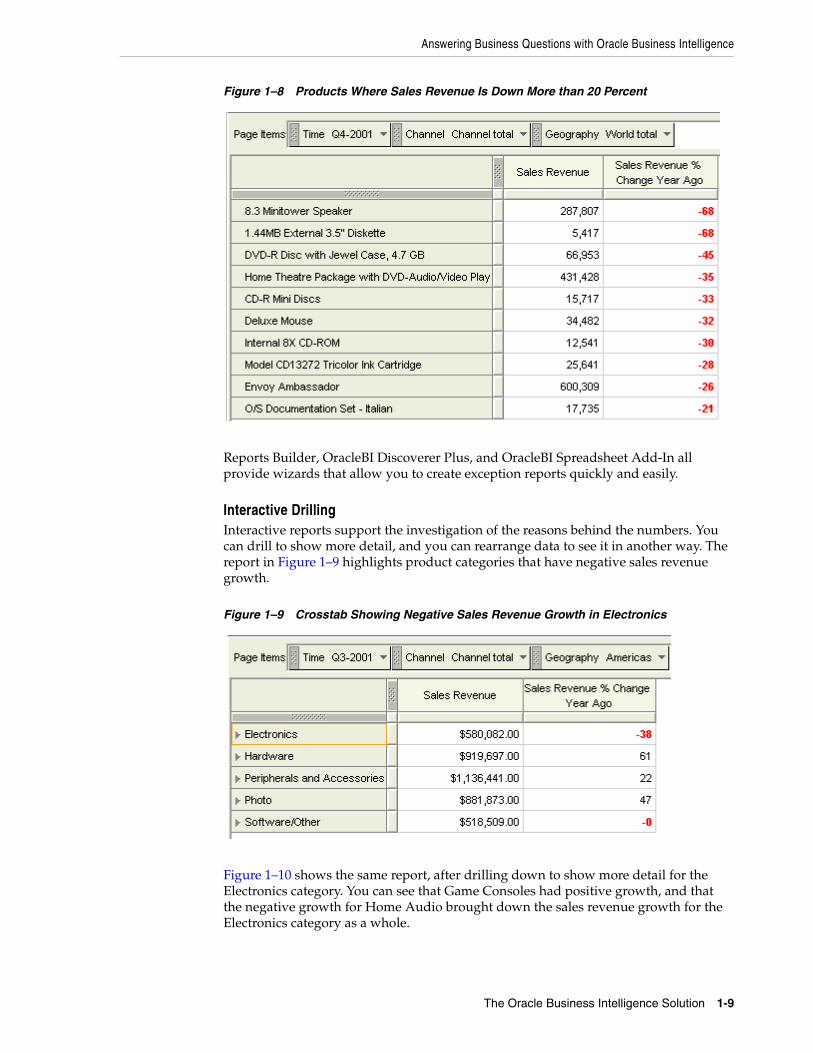
Displaying Exception DataWhen you are investigating underlying causes, it is often helpful to display only exception data. For example, the report in Figure 1–8 shows only the products where sales revenue is down more than 20% from the previous year. The results are sorted by the percentage.
Answering Business Questions with Oracle Business Intelligence
The Oracle Business Intelligence Solution 1-9
Figure 1–8 Products Where Sales Revenue Is Down More than 20 Percent
Reports Builder, OracleBI Discoverer Plus, and OracleBI Spreadsheet Add-In all provide wizards that allow you to create exception reports quickly and easily.
Interactive DrillingInteractive reports support the investigation of the reasons behind the numbers. You can drill to show more detail, and you can rearrange data to see it in another way. The report in Figure 1–9 highlights product categories that have negative sales revenue growth.
Figure 1–9 Crosstab Showing Negative Sales Revenue Growth in Electronics
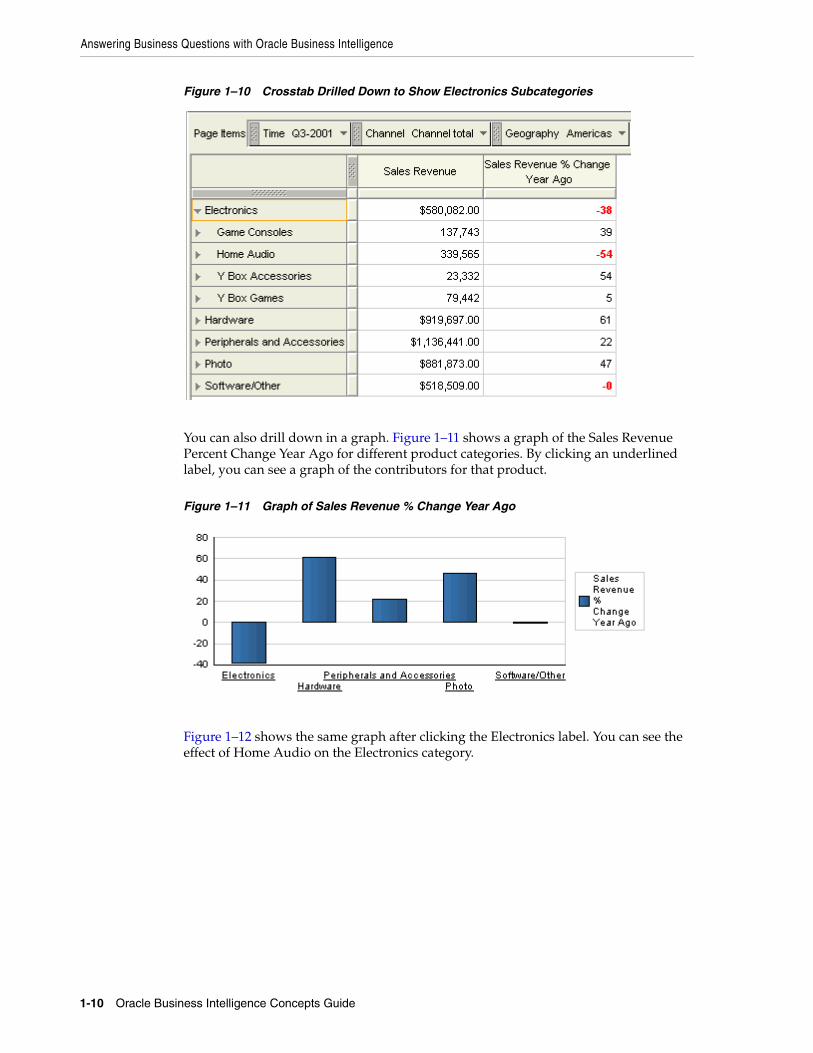
Figure 1–10 shows the same report, after drilling down to show more detail for the Electronics category. You can see that Game Consoles had positive growth, and that the negative growth for Home Audio brought down the sales revenue growth for the Electronics category as a whole.
Answering Business Questions with Oracle Business Intelligence
1-10 Oracle Business Intelligence Concepts Guide
Figure 1–10 Crosstab Drilled Down to Show Electronics Subcategories
You can also drill down in a graph. Figure 1–11 shows a graph of the Sales Revenue Percent Change Year Ago for different product categories. By clicking an underlined label, you can see a graph of the contributors for that product.
Figure 1–11 Graph of Sales Revenue % Change Year Ago
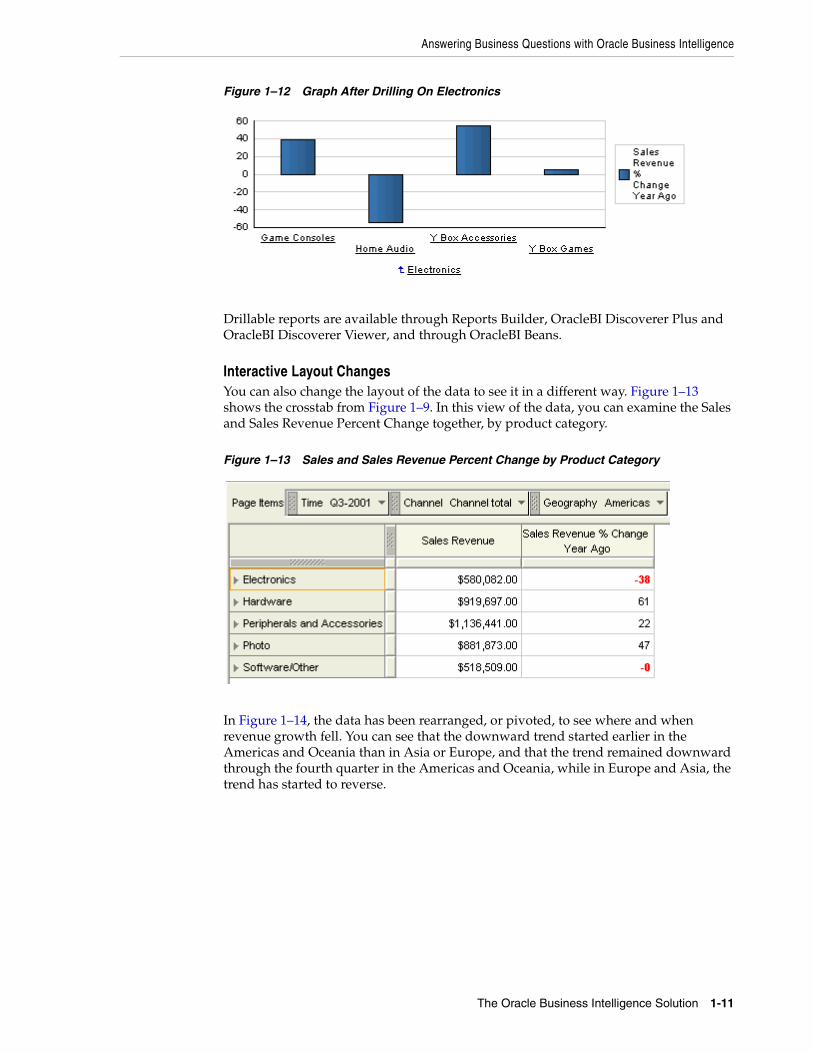
Figure 1–12 shows the same graph after clicking the Electronics label. You can see the effect of Home Audio on the Electronics category.
Answering Business Questions with Oracle Business Intelligence
The Oracle Business Intelligence Solution 1-11
Figure 1–12 Graph After Drilling On Electronics
Drillable reports are available through Reports Builder, OracleBI Discoverer Plus and OracleBI Discoverer Viewer, and through OracleBI Beans.
Interactive Layout ChangesYou can also change the layout of the data to see it in a different way. Figure 1–13 shows the crosstab from Figure 1–9. In this view of the data, you can examine the Sales and Sales Revenue Percent Change together, by product category.
Figure 1–13 Sales and Sales Revenue Percent Change by Product Category
In Figure 1–14, the data has been rearranged, or pivoted, to see where and when revenue growth fell. You can see that the downward trend started earlier in the Americas and Oceania than in Asia or Europe, and that the trend remained downward through the fourth quarter in the Americas and Oceania, while in Europe and Asia, the trend has started to reverse.
Answering Business Questions with Oracle Business Intelligence
1-12 Oracle Business Intelligence Concepts Guide
Figure 1–14 Sales Revenue Percent Change by Time and Geography
Interactive reports are available through Reports Builder, OracleBI Discoverer Plus and OracleBI Discoverer Viewer, and through OracleBI Beans.
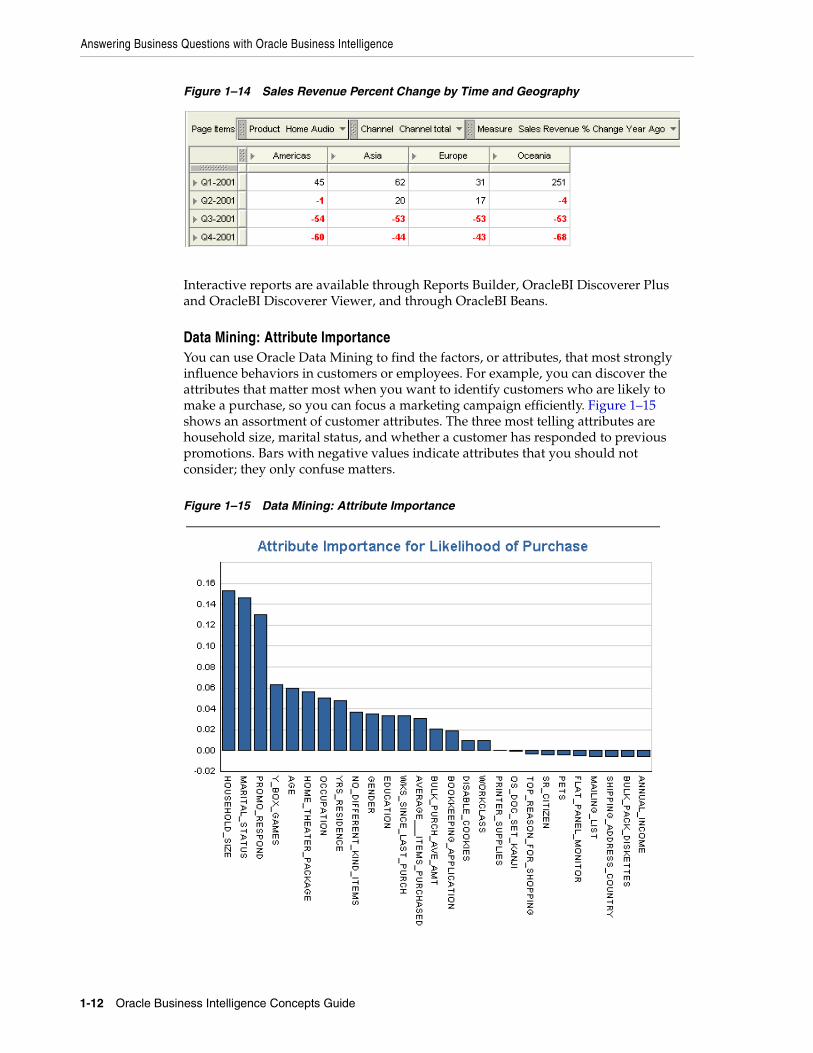
Data Mining: Attribute ImportanceYou can use Oracle Data Mining to find the factors, or attributes, that most strongly influence behaviors in customers or employees. For example, you can discover the attributes that matter most when you want to identify customers who are likely to make a purchase, so you can focus a marketing campaign efficiently. Figure 1–15 shows an assortment of customer attributes. The three most telling attributes are household size, marital status, and whether a customer has responded to previous promotions. Bars with negative values indicate attributes that you should not consider; they only confuse matters.
Figure 1–15 Data Mining: Attribute Importance
Answering Business Questions with Oracle Business Intelligence
The Oracle Business Intelligence Solution 1-13
Oracle Data Mining is an option to Oracle Database. It includes Oracle Data Miner, a graphical interface that supports the creation of data mining models, for attribute importance and other data mining analyses.
Where Is My Business Headed?It is not enough to know the state of your business and how the business got to be where it is. You need to be able to look ahead, to identify trends, and to plan for the future. Oracle Business Intelligence helps you answer forward-looking questions, such as:
■ What can we predict for sales next quarter?
■ What factors can we alter to improve the sales forecast?
■ What are our hot items going to be? How many should we make?
■ How many employees will we need for this new project?
■ How much should we budget for shipping?
To help you answer these types of questions, Oracle Business Intelligence provides support for:
■ Trend analysis
■ Modeling and planning
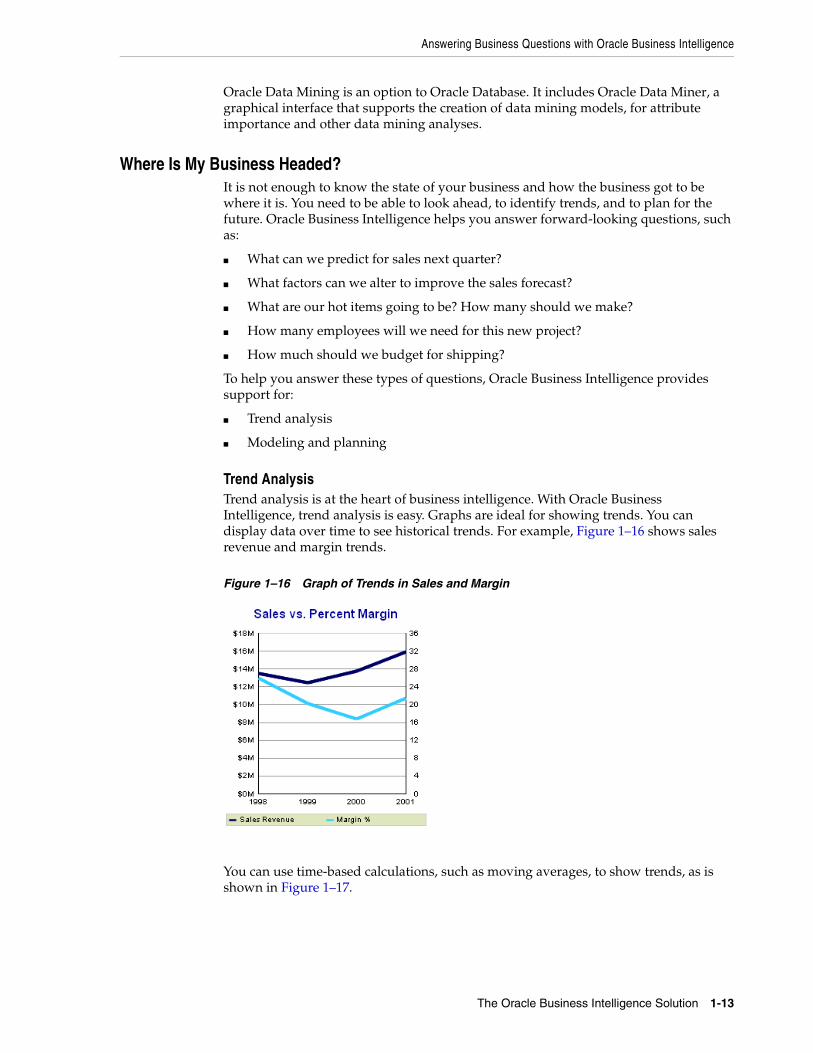
Trend AnalysisTrend analysis is at the heart of business intelligence. With Oracle Business Intelligence, trend analysis is easy. Graphs are ideal for showing trends. You can display data over time to see historical trends. For example, Figure 1–16 shows sales revenue and margin trends.
Figure 1–16 Graph of Trends in Sales and Margin
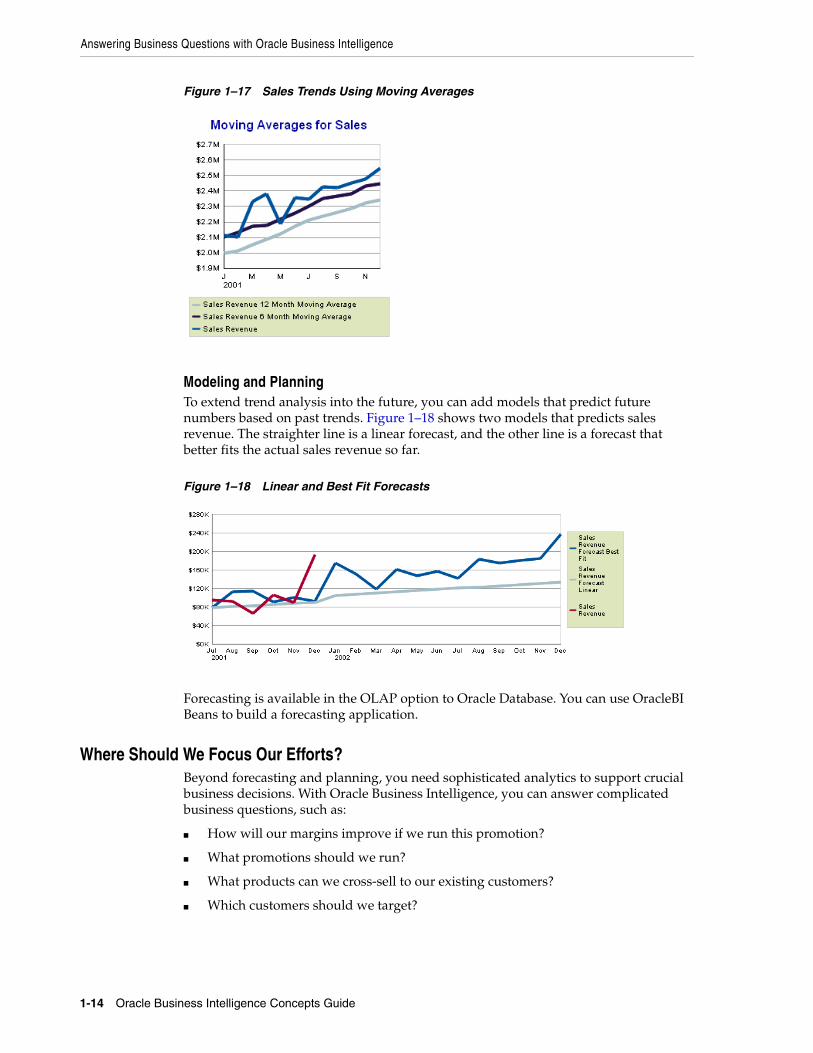
You can use time-based calculations, such as moving averages, to show trends, as is shown in Figure 1–17.
Answering Business Questions with Oracle Business Intelligence
1-14 Oracle Business Intelligence Concepts Guide
Figure 1–17 Sales Trends Using Moving Averages
Modeling and PlanningTo extend trend analysis into the future, you can add models that predict future numbers based on past trends. Figure 1–18 shows two models that predicts sales revenue. The straighter line is a linear forecast, and the other line is a forecast that better fits the actual sales revenue so far.
Figure 1–18 Linear and Best Fit Forecasts
Forecasting is available in the OLAP option to Oracle Database. You can use OracleBI Beans to build a forecasting application.
Where Should We Focus Our Efforts?Beyond forecasting and planning, you need sophisticated analytics to support crucial business decisions. With Oracle Business Intelligence, you can answer complicated business questions, such as:
■ How will our margins improve if we run this promotion?
■ What promotions should we run?
■ What products can we cross-sell to our existing customers?
■ Which customers should we target?
Answering Business Questions with Oracle Business Intelligence
The Oracle Business Intelligence Solution 1-15
To help you answer these types of questions, Oracle Business Intelligence supports:
■ What-If analysis
■ Advanced analytics and data mining, for market basket analysis, customer response modeling, customer profiling and clustering, and predictive analytics
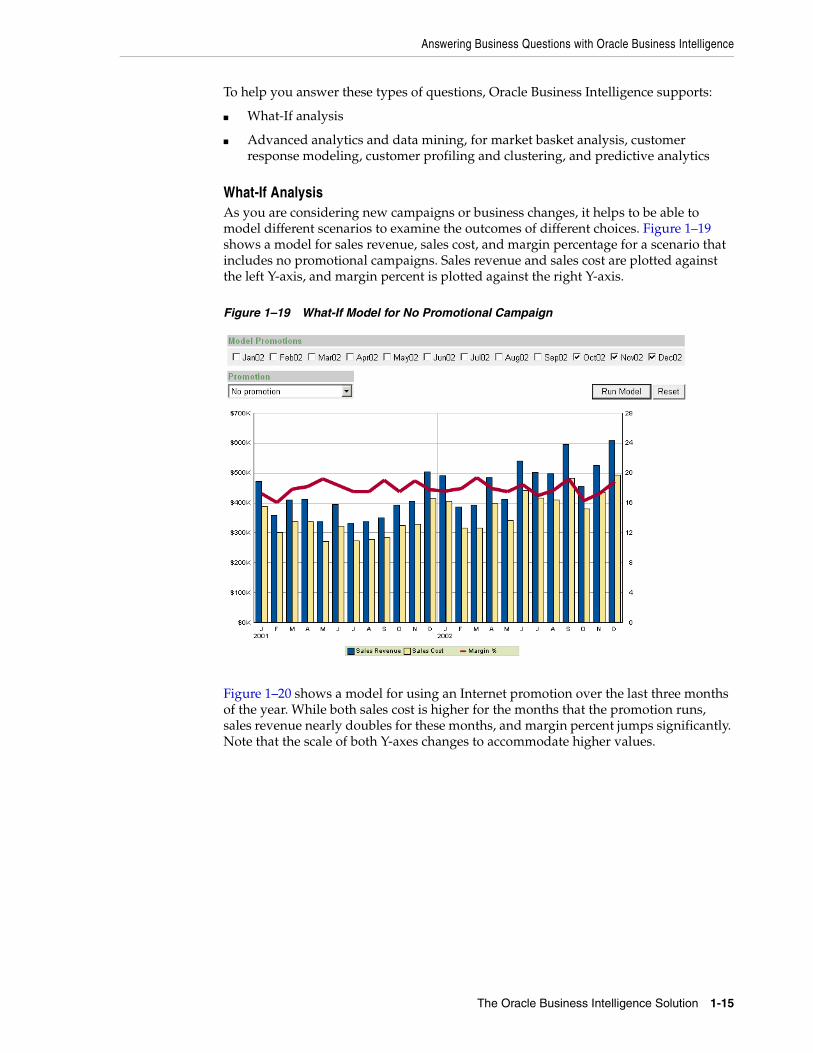
What-If AnalysisAs you are considering new campaigns or business changes, it helps to be able to model different scenarios to examine the outcomes of different choices. Figure 1–19 shows a model for sales revenue, sales cost, and margin percentage for a scenario that includes no promotional campaigns. Sales revenue and sales cost are plotted against the left Y-axis, and margin percent is plotted against the right Y-axis.
Figure 1–19 What-If Model for No Promotional Campaign
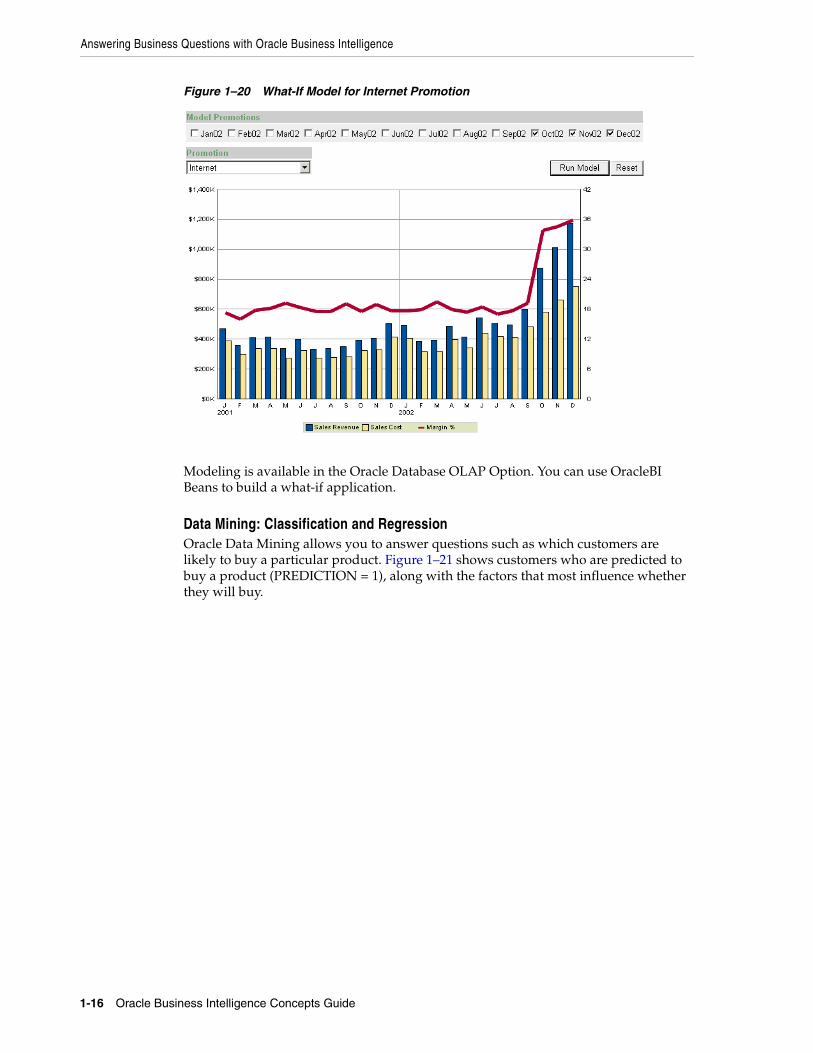
Figure 1–20 shows a model for using an Internet promotion over the last three months of the year. While both sales cost is higher for the months that the promotion runs, sales revenue nearly doubles for these months, and margin percent jumps significantly. Note that the scale of both Y-axes changes to accommodate higher values.
Answering Business Questions with Oracle Business Intelligence
1-16 Oracle Business Intelligence Concepts Guide
Figure 1–20 What-If Model for Internet Promotion
Modeling is available in the Oracle Database OLAP Option. You can use OracleBI Beans to build a what-if application.
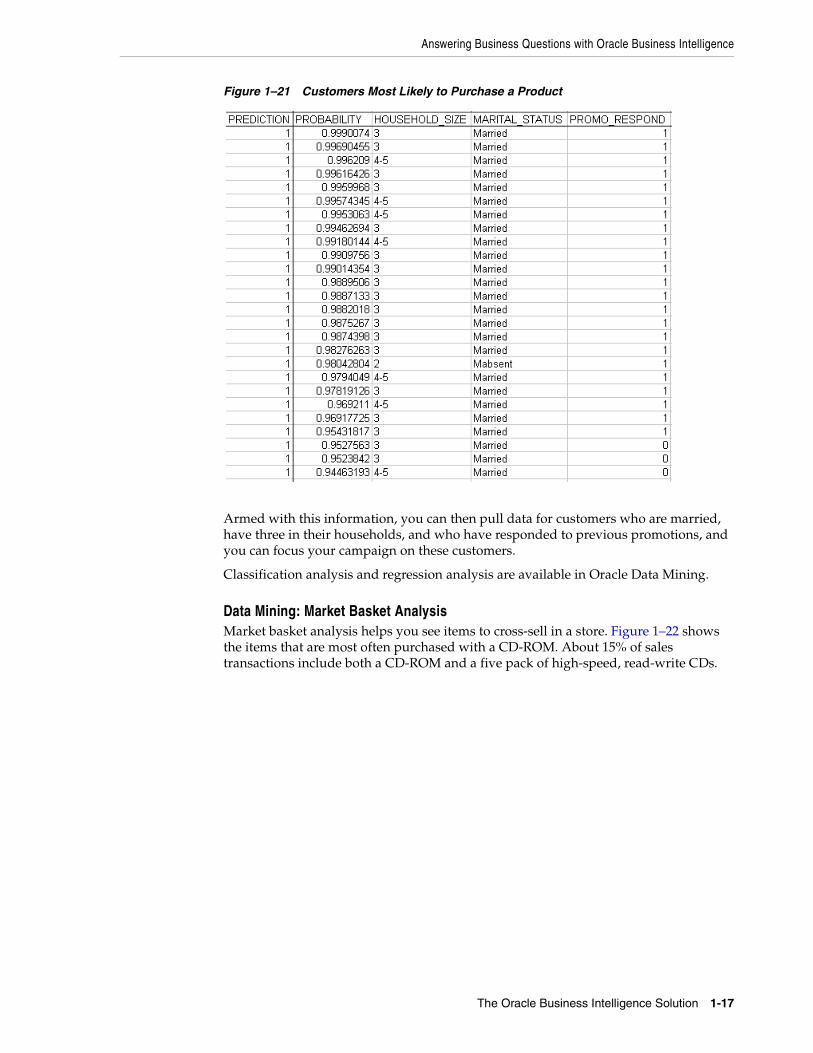
Data Mining: Classification and RegressionOracle Data Mining allows you to answer questions such as which customers are likely to buy a particular product. Figure 1–21 shows customers who are predicted to buy a product (PREDICTION = 1), along with the factors that most influence whether they will buy.
Answering Business Questions with Oracle Business Intelligence
The Oracle Business Intelligence Solution 1-17
Figure 1–21 Customers Most Likely to Purchase a Product
Armed with this information, you can then pull data for customers who are married, have three in their households, and who have responded to previous promotions, and you can focus your campaign on these customers.
Classification analysis and regression analysis are available in Oracle Data Mining.
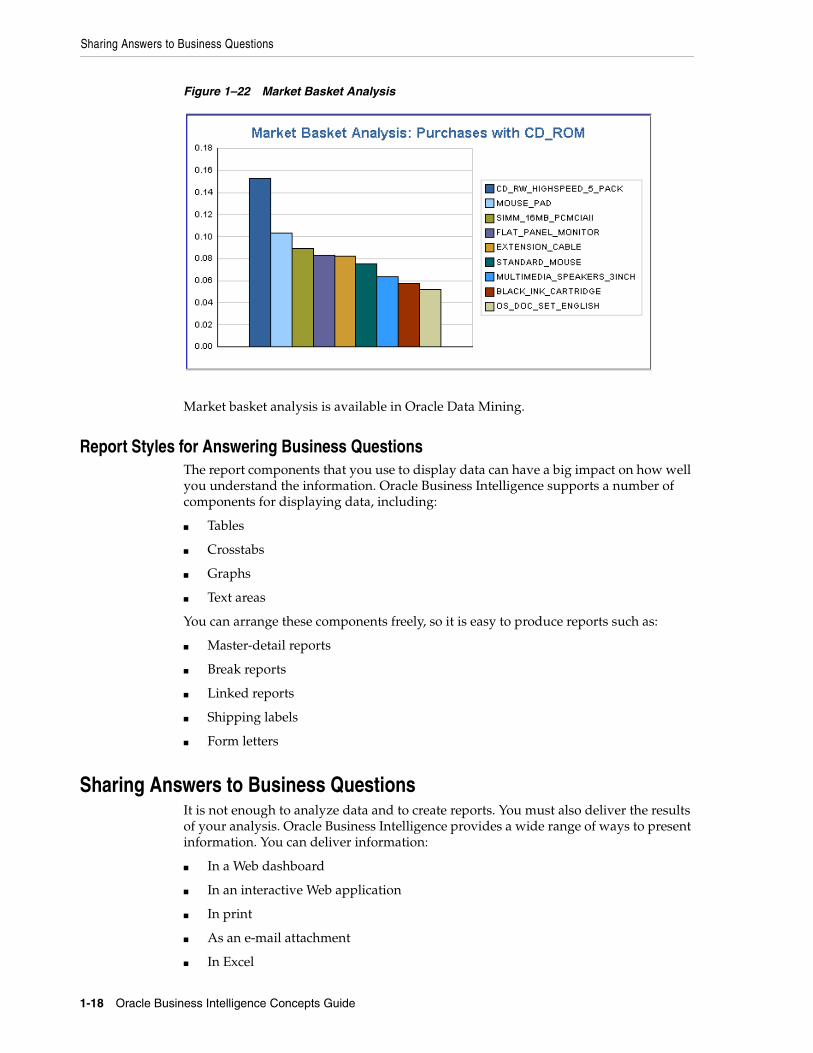
Data Mining: Market Basket AnalysisMarket basket analysis helps you see items to cross-sell in a store. Figure 1–22 shows the items that are most often purchased with a CD-ROM. About 15% of sales transactions include both a CD-ROM and a five pack of high-speed, read-write CDs.
Sharing Answers to Business Questions
1-18 Oracle Business Intelligence Concepts Guide
Figure 1–22 Market Basket Analysis
Market basket analysis is available in Oracle Data Mining.
Report Styles for Answering Business QuestionsThe report components that you use to display data can have a big impact on how well you understand the information. Oracle Business Intelligence supports a number of components for displaying data, including:
■ Tables
■ Crosstabs
■ Graphs
■ Text areas
You can arrange these components freely, so it is easy to produce reports such as:
■ Master-detail reports
■ Break reports
■ Linked reports
■ Shipping labels
■ Form letters
Sharing Answers to Business QuestionsIt is not enough to analyze data and to create reports. You must also deliver the results of your analysis. Oracle Business Intelligence provides a wide range of ways to present information. You can deliver information:
■ In a Web dashboard
■ In an interactive Web application
■ In print
■ As an e-mail attachment
■ In Excel
Sharing Answers to Business Questions
The Oracle Business Intelligence Solution 1-19
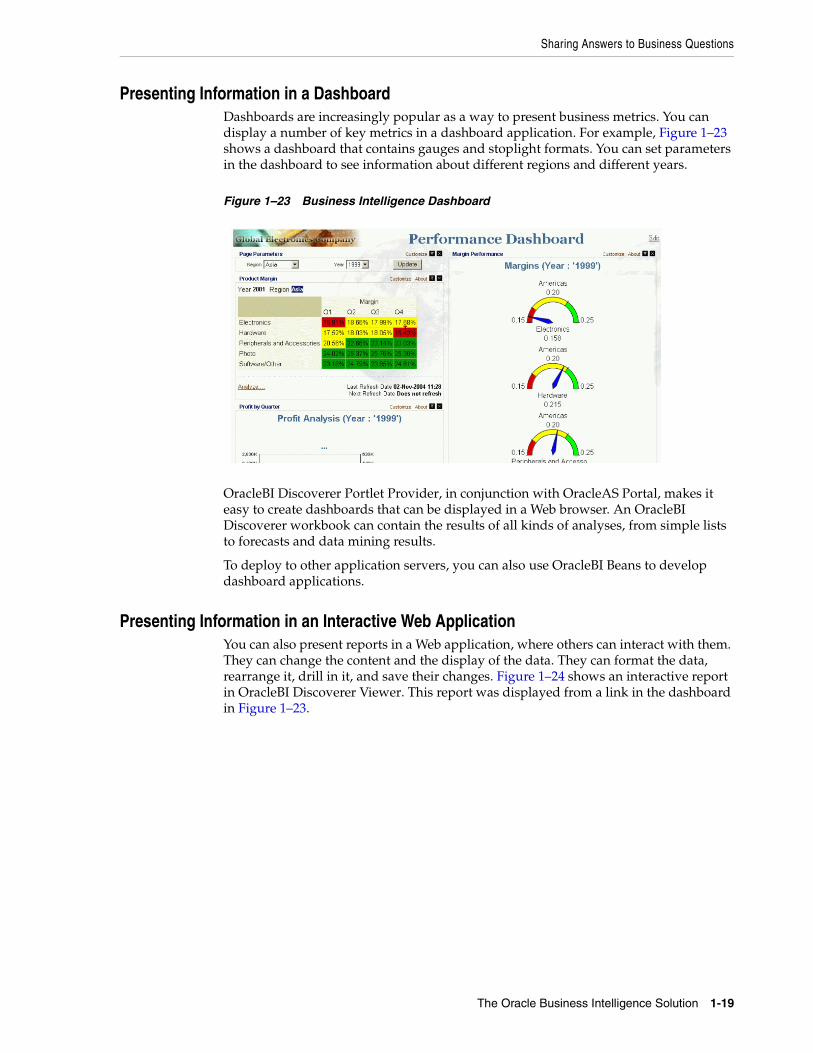
Presenting Information in a DashboardDashboards are increasingly popular as a way to present business metrics. You can display a number of key metrics in a dashboard application. For example, Figure 1–23 shows a dashboard that contains gauges and stoplight formats. You can set parameters in the dashboard to see information about different regions and different years.
Figure 1–23 Business Intelligence Dashboard
OracleBI Discoverer Portlet Provider, in conjunction with OracleAS Portal, makes it easy to create dashboards that can be displayed in a Web browser. An OracleBI Discoverer workbook can contain the results of all kinds of analyses, from simple lists to forecasts and data mining results.
To deploy to other application servers, you can also use OracleBI Beans to develop dashboard applications.
Presenting Information in an Interactive Web ApplicationYou can also present reports in a Web application, where others can interact with them. They can change the content and the display of the data. They can format the data, rearrange it, drill in it, and save their changes. Figure 1–24 shows an interactive report in OracleBI Discoverer Viewer. This report was displayed from a link in the dashboard in Figure 1–23.

Sharing Answers to Business Questions
1-20 Oracle Business Intelligence Concepts Guide
Figure 1–24 Stoplight Report in OracleBI Discoverer Viewer
OracleBI Discoverer Viewer presents interactive reports that you create with OracleBI Discoverer Plus.
Presenting Information in ExcelMany people are comfortable using Microsoft Excel, for reporting and analysis.
Exporting to ExcelYou can analyze data in OracleBI Discoverer and export the results in Excel format.
You can export data to Excel from OracleBI Discoverer Plus and from OracleBI Discoverer Viewer. From Oracle Reports, you can publish reports to comma-separated or tab-delimited formats, which can be imported into Excel.
In Oracle Data Miner, you can create and run data mining models and export the results to Excel.
Working Directly in ExcelWith Oracle OLAP or Oracle Data Mining, you can work directly in Microsoft Excel.
OracleBI Spreadsheet Add-In allows you to connect to the database from Excel, which gives you the familiarity of Excel with the analytic capabilities of OLAP. The same interface that makes it easy to select data in OracleBI Discoverer Plus OLAP is available in OracleBI Spreadsheet Add-In. The data is stored in Oracle Database, and you connect to the database when you open the spreadsheet. This reinforces the database as the single source of truth for business data.
Oracle Spreadsheet Add-In for Predictive Analytics presents simplified data mining in Excel. You can use the Explain feature to help you understand your current data; for example, you can find factors that influence likelihood of purchase. You can use the Predict feature to find likely outcomes from existing data, such as predicting which
Sharing Answers to Business Questions
The Oracle Business Intelligence Solution 1-21
transactions are likely to be fraudulent. With Oracle Spreadsheet Add-In for Predictive Analytics, you can mine data in Oracle Database, or the data can be in Excel itself.
From OracleBI Discoverer Plus Relational and from OracleBI Discoverer Viewer with a relational data source, you can also export to the Excel Web Query format, which allows you to run a relational query inside Excel. You cannot change this query in Excel, but it is a live run of the report, and not just snapshot data.
When you work with a spreadsheet Add-In, you can work directly in Excel to add sums and other calculations, graphs, formatting, and so on.
Printing ReportsYou can print reports from any of the Oracle Business Intelligence reporting components. OracleBI Discoverer has printing capabilities built in, allowing you to print reports from OracleBI Discoverer Viewer or from OracleBI Discoverer Plus. You can also export reports from OracleBI Discoverer in PDF format, for print quality without the printer.
For pixel-perfect printing of all kinds of data, Oracle Reports provides enterprise reporting capabilities. With Reports Builder, you have fine-grained control over the layout of reports, and you can create highly polished printed reports, in Postscript, in PCL, and in PDF formats.
As an enterprise reporting tool, Oracle Reports supports a range of printing needs, beyond those of analytic reports. With Oracle Reports, you can print mailing labels, form letters, invoices, checks, and other highly formatted documents.
Publishing Data to Other FormatsOracle Reports allows you to publish reports in a wide variety of formats, so you can use a number of applications to incorporate report data. In addition to publishing reports in print, over the Web, and in spreadsheets, Oracle Reports allows you to publish data in XML and RTF.
Distributing ReportsOracleBI Discoverer makes it easy to share reports across an organization, while preventing unauthorized access to reports. Oracle Business Intelligence Discoverer Administrator (OracleBI Discoverer Administrator) allows you to group available data into business areas and to allow access only to those who need it. In addition, reports that you create in OracleBI Discoverer Plus are stored in the database, which also allows you to control access to reports. Authorized users view the reports in OracleBI Discoverer Viewer or OracleBI Discoverer Plus.
Users of OracleBI Discoverer Viewer can send reports to other users through e-mail. When you use OracleBI Spreadsheet Add-In, you can easily attach the resulting spreadsheet to an e-mail message. Those users are authenticated when they try to connect to the data, so you do not have to worry about report recipients changing the data and passing it on.
Oracle Spreadsheet Add-In for Predictive Analytics allows you to share the results of a data mining application in a spreadsheet, separated from the database where the data has been analyzed, so users do not need database access to see the results of the analysis.
Oracle Reports supports highly sophisticated report distribution. For example, you can schedule report distribution, such that the report can be run overnight and sent by e-mail to a set of recipients. You can also schedule the printing of reports, and Oracle

Sharing Answers to Business Questions
1-22 Oracle Business Intelligence Concepts Guide
Reports supports bursting, where a report can be split into a number of printed reports, based on sets of data in the report. This allows you, for example, to split a Sales report by district and to print data for each different district as a separate report.
Technical Fundamentals for Implementation 2-1
2Technical Fundamentals for Implementation
Implementing a business intelligence solution involves a number of people across the organization, from information technology (IT) professionals to executives and line of business managers. Often, however, it falls to the IT professionals to design and implement the technical aspects of the BI solution. This chapter is addressed to these IT professionals.
This chapter describes how Oracle Business Intelligence supports the implementation of a business intelligence solution. It includes the following sections:
■ Consolidating Data for Analysis
■ Data Models
■ Data Structures
■ Metadata Models for Data Access
■ Models for Data Mining
■ Tools for Creating Reports
■ Custom Application Development Tool
■ Deploying Oracle Business Intelligence
Consolidating Data for AnalysisWhile you can use Oracle Business Intelligence to report directly against a transactional system, most business intelligence requires historical data and data from diverse sources, and that data must be structured for analysis. A data warehouse is the foundation of a business intelligence solution.
OracleBI Warehouse Builder supports the process of designing and developing a data warehouse, from identifying source data to the creation of metadata for reporting. OracleBI Warehouse Builder takes advantage of the powerful data warehousing features in Oracle Database. In addition, the interface in OracleBI Warehouse Builder helps your team to consolidate data for reporting and to maintain the data warehouse after it has been deployed.
Data SourcesA data warehouse usually consolidates data from a number of sources.
Operational DataOperational data is the main source of data for reporting. This data comes from your organization’s business transactions, which are normally stored in one or more

Consolidating Data for Analysis
2-2 Oracle Business Intelligence Concepts Guide
relational systems. Your transactional data may be in Oracle Database, as well as other systems. For example, your current data might come from Oracle Database, but perhaps you have historical data in a legacy system. Or perhaps your organization has recently acquired a company whose data is stored in a non-Oracle database.
OracleBI Warehouse Builder can read metadata from a number of different database sources, including:
■ Oracle databases
■ SAP R/3
■ DB2, Sybase, Informix, SQL Server, and others, through Oracle Transparent Gateways
■ ODBC
■ Mainframe systems
External DataYour business intelligence system is likely to need data other than your own operational data. For example, to support the kind of analysis you want, you might have demographic data from a third party vendor. This data might come through ODBC, in flat files, or in spreadsheet files.
In OracleBI Warehouse Builder, you can use external tables to represent flat files in relational form. External tables are read-only Oracle Database tables that behave like regular source tables in OracleBI Warehouse Builder. The metadata for these tables is stored in the OracleBI Warehouse Builder repository and can be used when you design the transformation of the source data. OracleBI Warehouse Builder also allows you to incorporate spreadsheet data in your data warehouse.
Extraction, Transformation, and LoadingAs you combine data from disparate sources, you design and implement the extraction, transformation, and loading (ETL) of the source data into a target data warehouse.
During extraction, the desired data is identified and extracted from various sources. Often you extract more than you will eventually need, because it is hard to identify precisely the data that you will actually use. As you extract data, database scalability is an issue. Because data warehouses store historical data, they grow very fast. Oracle Data Warehousing includes a number of scalability features, and OracleBI Warehouse Builder leverages these features.
Because a data warehouse consolidates data from disparate sources, it must be transformed to provide accurate, consistent data for reporting. OracleBI Warehouse Builder provides a graphical environment for modeling transformations, making it easy to map source data to target data. OracleBI Warehouse Builder includes a solution for name and address cleansing. This solution automatically corrects common errors and inconsistencies in name and address data. OracleBI Warehouse Builder also includes a match merge operator that uses business rules to consolidate duplicate records in the source data.
Extracted and transformed data is loaded into the target data warehouse. You can create target warehouse objects in OracleBI Warehouse Builder. The target objects can be relational or dimensional, as described in "Metadata Models for Data Access".
In OracleBI Warehouse Builder, a mapping describes a series of ETL operations. You define the operations when you create mappings. You can use the Mapping Editor in
Data Models
Technical Fundamentals for Implementation 2-3
OracleBI Warehouse Builder to define these operations graphically, or you can use a scripting interface to create mappings.
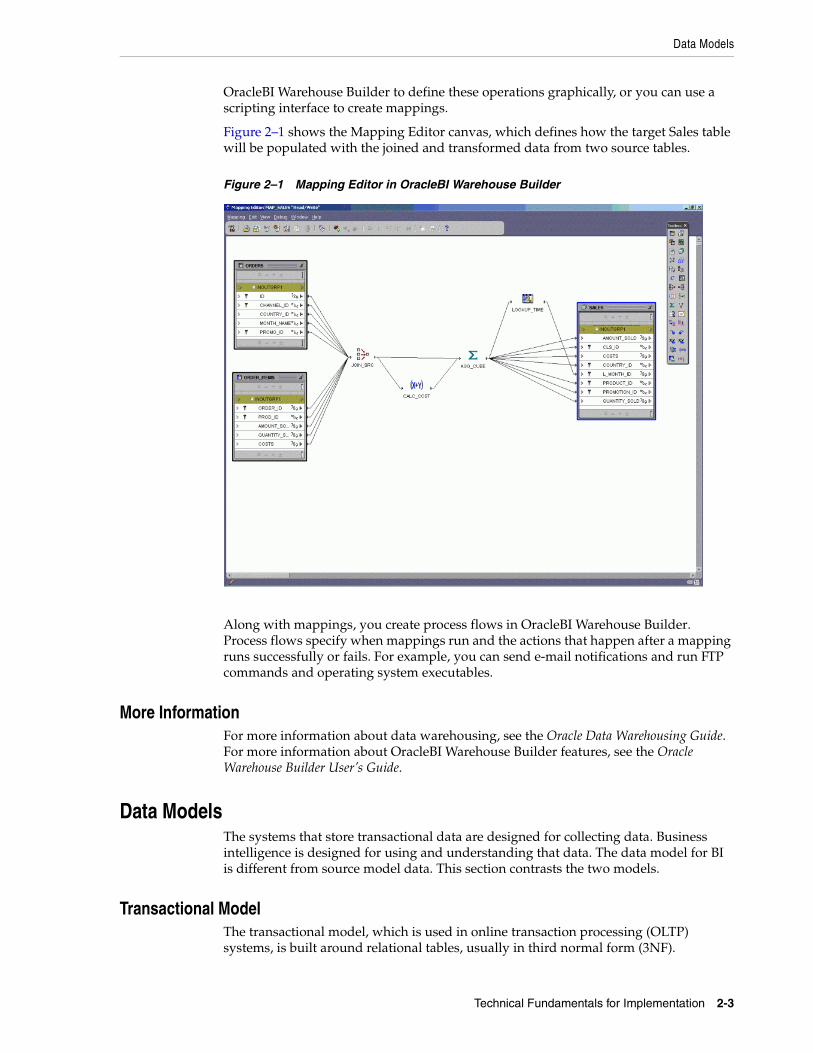
Figure 2–1 shows the Mapping Editor canvas, which defines how the target Sales table will be populated with the joined and transformed data from two source tables.
Figure 2–1 Mapping Editor in OracleBI Warehouse Builder
Along with mappings, you create process flows in OracleBI Warehouse Builder. Process flows specify when mappings run and the actions that happen after a mapping runs successfully or fails. For example, you can send e-mail notifications and run FTP commands and operating system executables.
More InformationFor more information about data warehousing, see the Oracle Data Warehousing Guide. For more information about OracleBI Warehouse Builder features, see the Oracle Warehouse Builder User’s Guide.
Data ModelsThe systems that store transactional data are designed for collecting data. Business intelligence is designed for using and understanding that data. The data model for BI is different from source model data. This section contrasts the two models.
Transactional ModelThe transactional model, which is used in online transaction processing (OLTP) systems, is built around relational tables, usually in third normal form (3NF).
Data Models
2-4 Oracle Business Intelligence Concepts Guide
OLTP systems are tuned for storing and processing transactions. These systems need to be able to handle easily the addition, removal, and changing of individual records. The system is normalized, to ensure that the database can be updated efficiently and accurately. The transactional model is for collecting data.
Dimensional ModelThe dimensional model is designed not for collecting data, but for retrieving data in a meaningful way. The goal of the dimensional model is to make the data understandable to business users. There is a dimensional aspect to the way users think about data. For example, a sales manager might say, "I want to see sales revenues by product, region, and quarter." The dimensional model seeks mimic the way that users think about business.
Dimensional data can be stored in relational tables or in multidimensional cubes, as described in the "Data Structures" section, but the concepts are the same.
Facts or MeasuresThe data that users want to examine and analyze, such as Sales, Costs, and Profit, is presented as facts or measures, depending on the physical structure of the data. This data is usually numeric.
DimensionsDimensions are categorizations of data, in the way business users think of it. When users say they want to see numbers "by" something or "over" something, they are identifying the dimensions of the data. Common dimensions are Geography, Product, Customer, and Time.
Individual geographical locations, products, customers, and times are called dimension values or dimension members.
HierarchiesDimensions are often structured hierarchically, so that some values are grouped "under" other values. For example, cities can be grouped under countries, and countries under continents. A dimension can have more than one hierarchy. For example, a Time dimension might have a calendar hierarchy and a fiscal hierarchy.
Hierarchies can define how data is aggregated and how users can navigate data in an interactive report. For example, a hierarchy in a Time dimension can specify whether users can drill down from years to quarters or from years to months.
LevelsHierarchies often have several levels. For example, a Product hierarchy might have a total level, a category level, a subcategory level, a family level, and an item level. A Time hierarchy might have levels for days, weeks, months, quarters, and years.
Levels are more significant in some hierarchies than in others. For example, in an Employee dimension, some individual contributors might have only one or two layers of management, while others might have several layers. There is not a strong grouping of all employees at a certain level.
Data Structures
Technical Fundamentals for Implementation 2-5
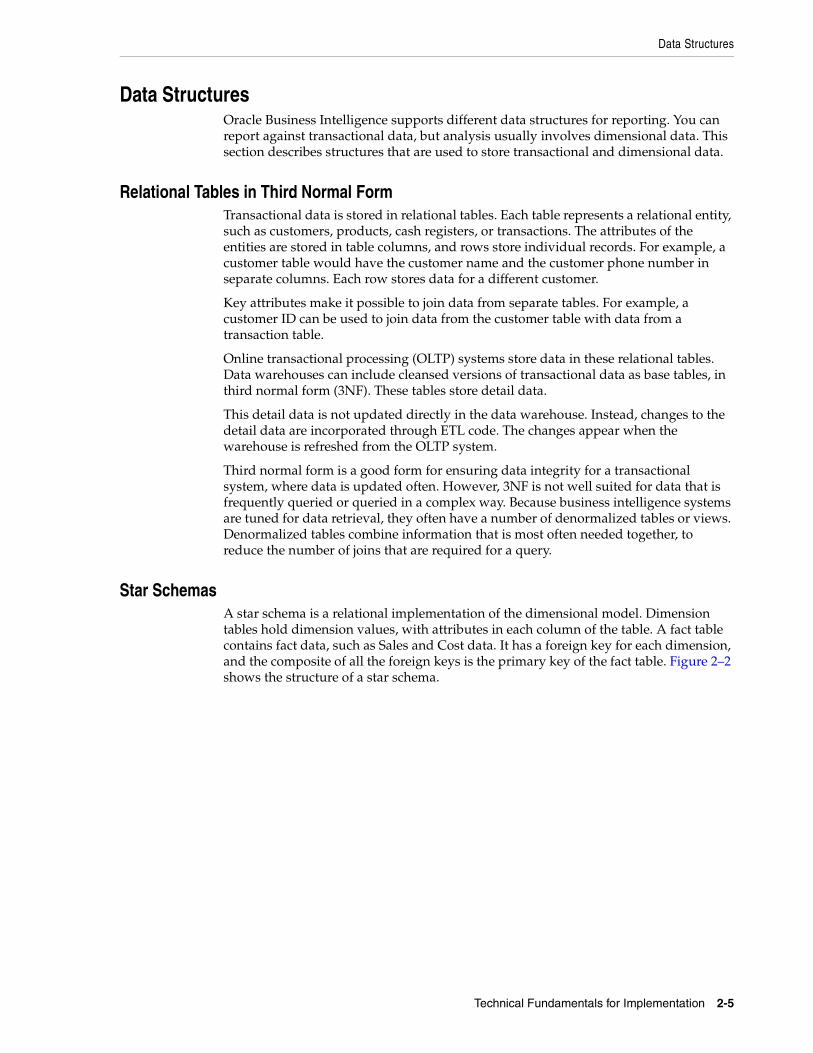
Data StructuresOracle Business Intelligence supports different data structures for reporting. You can report against transactional data, but analysis usually involves dimensional data. This section describes structures that are used to store transactional and dimensional data.
Relational Tables in Third Normal FormTransactional data is stored in relational tables. Each table represents a relational entity, such as customers, products, cash registers, or transactions. The attributes of the entities are stored in table columns, and rows store individual records. For example, a customer table would have the customer name and the customer phone number in separate columns. Each row stores data for a different customer.
Key attributes make it possible to join data from separate tables. For example, a customer ID can be used to join data from the customer table with data from a transaction table.
Online transactional processing (OLTP) systems store data in these relational tables. Data warehouses can include cleansed versions of transactional data as base tables, in third normal form (3NF). These tables store detail data.
This detail data is not updated directly in the data warehouse. Instead, changes to the detail data are incorporated through ETL code. The changes appear when the warehouse is refreshed from the OLTP system.
Third normal form is a good form for ensuring data integrity for a transactional system, where data is updated often. However, 3NF is not well suited for data that is frequently queried or queried in a complex way. Because business intelligence systems are tuned for data retrieval, they often have a number of denormalized tables or views. Denormalized tables combine information that is most often needed together, to reduce the number of joins that are required for a query.
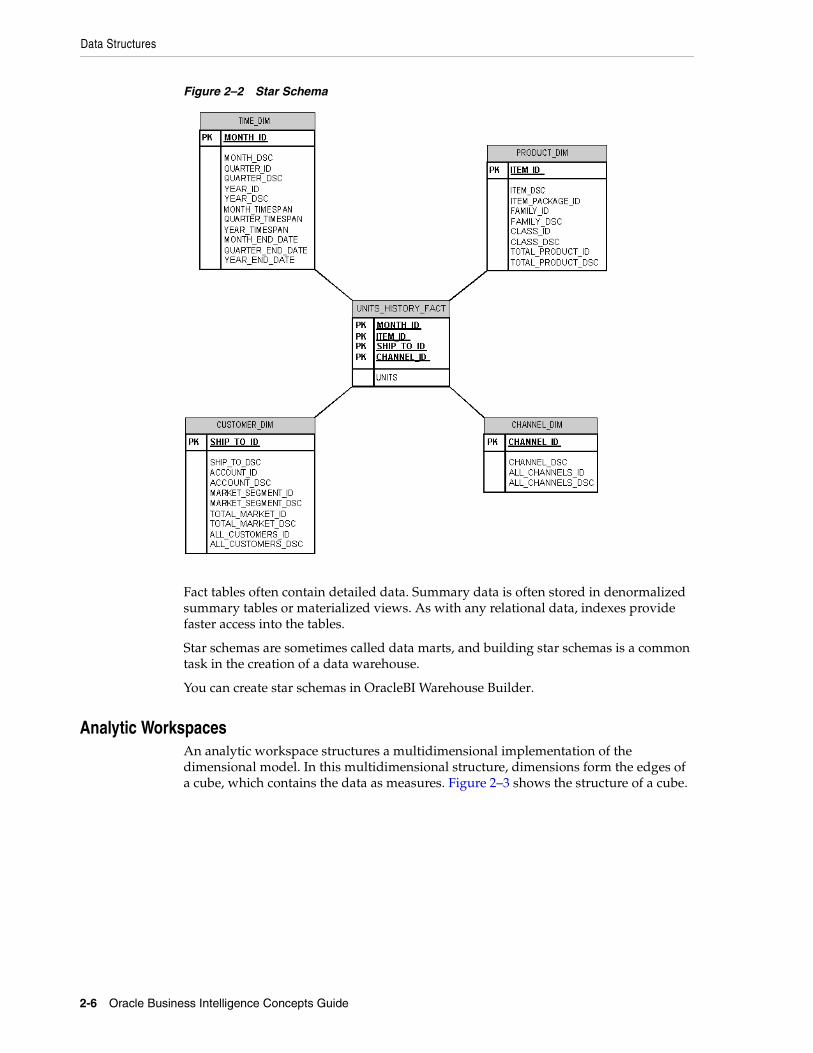
Star SchemasA star schema is a relational implementation of the dimensional model. Dimension tables hold dimension values, with attributes in each column of the table. A fact table contains fact data, such as Sales and Cost data. It has a foreign key for each dimension, and the composite of all the foreign keys is the primary key of the fact table. Figure 2–2 shows the structure of a star schema.
Data Structures
2-6 Oracle Business Intelligence Concepts Guide
Figure 2–2 Star Schema
Fact tables often contain detailed data. Summary data is often stored in denormalized summary tables or materialized views. As with any relational data, indexes provide faster access into the tables.
Star schemas are sometimes called data marts, and building star schemas is a common task in the creation of a data warehouse.
You can create star schemas in OracleBI Warehouse Builder.
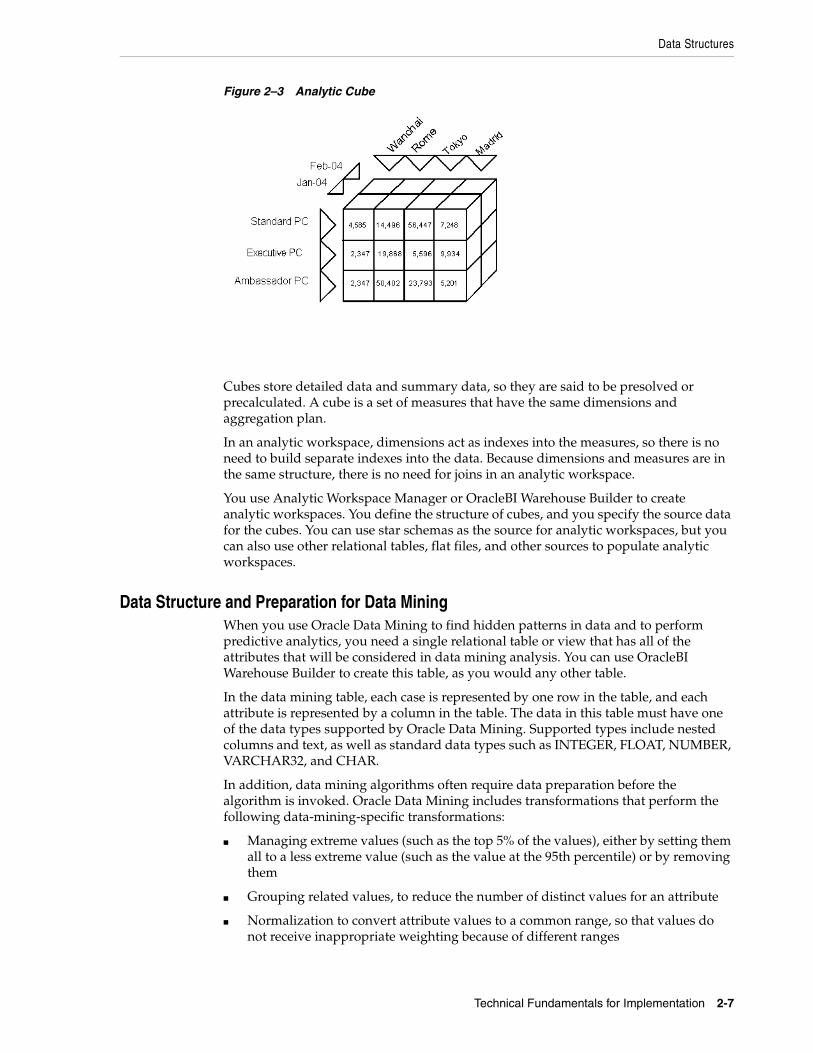
Analytic WorkspacesAn analytic workspace structures a multidimensional implementation of the dimensional model. In this multidimensional structure, dimensions form the edges of a cube, which contains the data as measures. Figure 2–3 shows the structure of a cube.
Data Structures
Technical Fundamentals for Implementation 2-7
Figure 2–3 Analytic Cube
Cubes store detailed data and summary data, so they are said to be presolved or precalculated. A cube is a set of measures that have the same dimensions and aggregation plan.
In an analytic workspace, dimensions act as indexes into the measures, so there is no need to build separate indexes into the data. Because dimensions and measures are in the same structure, there is no need for joins in an analytic workspace.
You use Analytic Workspace Manager or OracleBI Warehouse Builder to create analytic workspaces. You define the structure of cubes, and you specify the source data for the cubes. You can use star schemas as the source for analytic workspaces, but you can also use other relational tables, flat files, and other sources to populate analytic workspaces.
Data Structure and Preparation for Data MiningWhen you use Oracle Data Mining to find hidden patterns in data and to perform predictive analytics, you need a single relational table or view that has all of the attributes that will be considered in data mining analysis. You can use OracleBI Warehouse Builder to create this table, as you would any other table.
In the data mining table, each case is represented by one row in the table, and each attribute is represented by a column in the table. The data in this table must have one of the data types supported by Oracle Data Mining. Supported types include nested columns and text, as well as standard data types such as INTEGER, FLOAT, NUMBER, VARCHAR32, and CHAR.
In addition, data mining algorithms often require data preparation before the algorithm is invoked. Oracle Data Mining includes transformations that perform the following data-mining-specific transformations:
■ Managing extreme values (such as the top 5% of the values), either by setting them all to a less extreme value (such as the value at the 95th percentile) or by removing them
■ Grouping related values, to reduce the number of distinct values for an attribute
■ Normalization to convert attribute values to a common range, so that values do not receive inappropriate weighting because of different ranges
Metadata Models for Data Access
2-8 Oracle Business Intelligence Concepts Guide
The preparation necessary for a data mining application depends on the kinds of models that will be applied to the data.
For more information about preparing data for data mining, see Oracle Data Mining Concepts or the Oracle Data Mining Application Developer’s Guide.
Metadata Models for Data AccessIt is not enough to gather the data that you need in a data warehouse. You also need to prepare the data for reporting, by providing metadata that allows users to understand and navigate the data, and by summarizing the data.
Metadata management is a crucial activity in BI development. If report builders cannot understand and navigate the data, then they cannot query the data appropriately. Even if the data warehouse contains clean, high-quality data, without good metadata, it is very difficult to know which data structures to use for queries. Two different business users can ask the same question of the data and come up with different answers.
Business intelligence uses summary, or aggregate, data, to provide optimal query performance for business users. You decide which data to summarize and how to store the summarized data. The needs of the business users should determine which data you decide to summarize.
The structure of the summarized data depends on the metadata model that you use for a report. When you use a relational data warehouse, you can store summary data in materialized views, usually separate from the detail data. When you use Oracle OLAP, you can store summary data in an analytic workspace, which also includes the data that it summarizes.
OracleBI Warehouse Builder provides support for creating and maintaining metadata and for creating summaries. Also, Analytic Workspace Manager supports the creation of analytic workspaces, which include summary data. For relational reporting, OracleBI Discoverer Administrator supports the creation of metadata and the management of summary data.
Relational MetadataWhen you use OracleBI Discoverer Plus Relational or OracleBI Discoverer Viewer against relational data, you use relational metadata to access the data, which can be stored in star schemas, 3NF tables, or other relational tables. A Discoverer manager creates an End User Layer (EUL) for this metadata.
The EUL insulates users from database complexity. It contains business areas, which group folders for particular sets of users. Folders in the business areas represent result sets for building reports. A folder can represent a table, a set of tables, or a query. Items in the folders represent the columns in the result set.
The EUL may also contain:
■ Hierarchies for drilling navigation
■ Joins that connect tables or views
■ Conditions that filter data for reports
■ Calculations created for business users
You use OracleBI Discoverer Administrator to create and maintain EULs and to control access to different business areas. You can also create relational metadata in OracleBI
Metadata Models for Data Access
Technical Fundamentals for Implementation 2-9
Warehouse Builder and export it to an EUL that OracleBI Discoverer Administrator can read.
For more information about creating and maintaining EULs, see the Oracle Business Intelligence Discoverer Administration Guide.
OLAP MetadataWhen you use OracleBI Discoverer Plus OLAP, the OracleBI Spreadsheet Add-In, or a custom application that includes OracleBI Beans, you use OLAP metadata to access dimensional data, which is normally stored in analytic workspaces. In addition to the dimensional data, analytic workspaces store OLAP metadata, where you define the dimensions and the measures that are available to users. A cube is a set of measures that have the same dimensions and aggregation plan.
OLAP metadata can also include:
■ Hierarchies, both for aggregation and for drill navigation
■ Saved selections that filter the data in a report
■ Calculations for business users
As noted in "Data Structures", analytic workspaces do not require joins.
You use OracleBI Warehouse Builder or Analytic Workspace Manager to create analytic workspaces.
When dimensional data is in a star schema, you can store OLAP metadata in the OLAP Catalog. You use OracleBI Warehouse Builder to create this metadata. Most business intelligence systems that use OLAP metadata use analytic workspaces, both for better performance and for more analytic capability.
For more information about analytic workspaces and the OLAP catalog, see the Oracle OLAP Application Developer’s Guide.
Key Differences Between Relational and OLAP Metadata ModelsOracle Business Intelligence enables access to data through relational metadata and through OLAP metadata. The model that you choose depends on a number of factors. This section highlights basic differences between the two models and some of the implications of those differences.
HierarchiesIn the relational model, hierarchies are very flexible. Any attribute in a relational table or view can serve as any level in a hierarchy. Values in the hierarchy can have more than one parent, so it is possible to have a many-to-many (M:M) relationship between hierarchy levels. For example, you can allow users to drill from a year to quarter as shown in Figure 2–4.
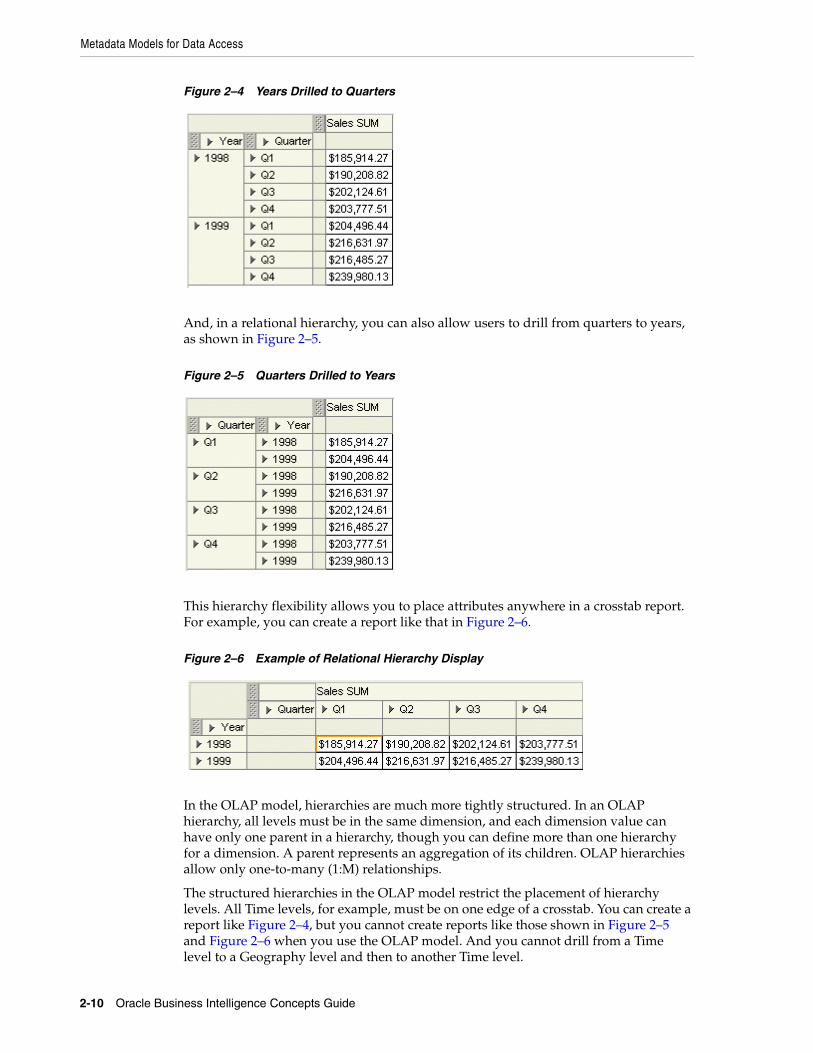
Metadata Models for Data Access
2-10 Oracle Business Intelligence Concepts Guide
Figure 2–4 Years Drilled to Quarters
And, in a relational hierarchy, you can also allow users to drill from quarters to years, as shown in Figure 2–5.
Figure 2–5 Quarters Drilled to Years
This hierarchy flexibility allows you to place attributes anywhere in a crosstab report. For example, you can create a report like that in Figure 2–6.
Figure 2–6 Example of Relational Hierarchy Display
In the OLAP model, hierarchies are much more tightly structured. In an OLAP hierarchy, all levels must be in the same dimension, and each dimension value can have only one parent in a hierarchy, though you can define more than one hierarchy for a dimension. A parent represents an aggregation of its children. OLAP hierarchies allow only one-to-many (1:M) relationships.
The structured hierarchies in the OLAP model restrict the placement of hierarchy levels. All Time levels, for example, must be on one edge of a crosstab. You can create a report like Figure 2–4, but you cannot create reports like those shown in Figure 2–5 and Figure 2–6 when you use the OLAP model. And you cannot drill from a Time level to a Geography level and then to another Time level.
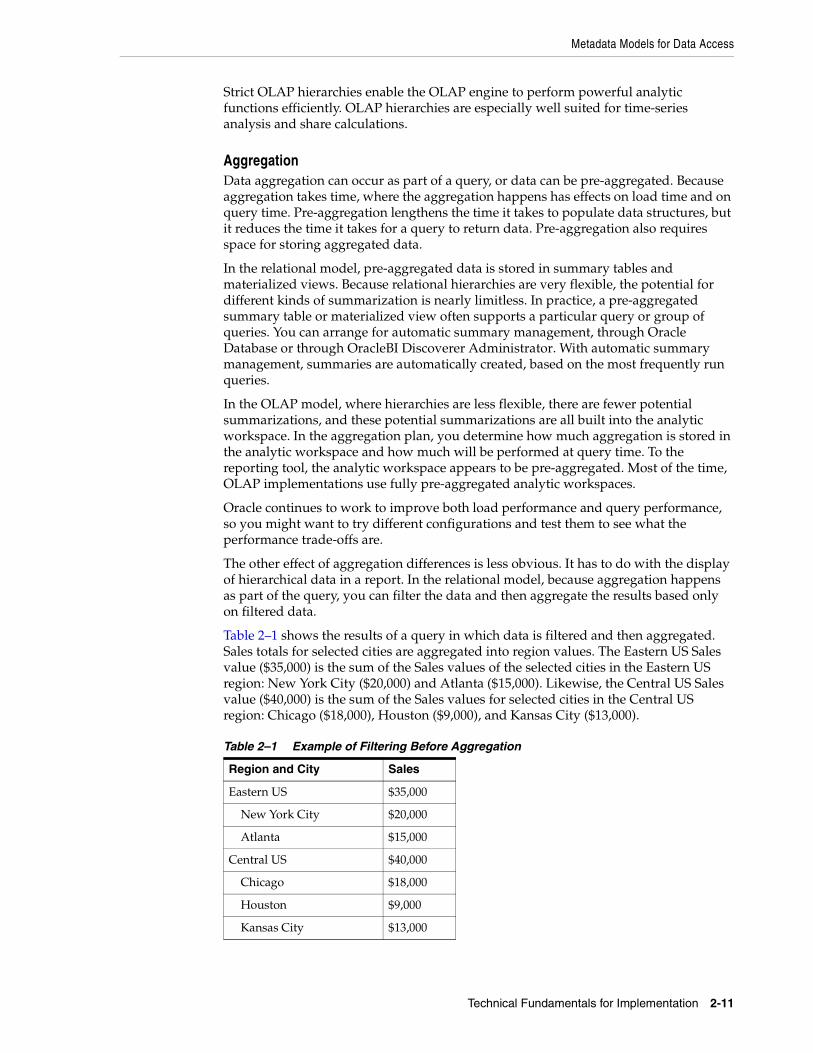
Metadata Models for Data Access
Technical Fundamentals for Implementation 2-11
Strict OLAP hierarchies enable the OLAP engine to perform powerful analytic functions efficiently. OLAP hierarchies are especially well suited for time-series analysis and share calculations.
AggregationData aggregation can occur as part of a query, or data can be pre-aggregated. Because aggregation takes time, where the aggregation happens has effects on load time and on query time. Pre-aggregation lengthens the time it takes to populate data structures, but it reduces the time it takes for a query to return data. Pre-aggregation also requires space for storing aggregated data.
In the relational model, pre-aggregated data is stored in summary tables and materialized views. Because relational hierarchies are very flexible, the potential for different kinds of summarization is nearly limitless. In practice, a pre-aggregated summary table or materialized view often supports a particular query or group of queries. You can arrange for automatic summary management, through Oracle Database or through OracleBI Discoverer Administrator. With automatic summary management, summaries are automatically created, based on the most frequently run queries.
In the OLAP model, where hierarchies are less flexible, there are fewer potential summarizations, and these potential summarizations are all built into the analytic workspace. In the aggregation plan, you determine how much aggregation is stored in the analytic workspace and how much will be performed at query time. To the reporting tool, the analytic workspace appears to be pre-aggregated. Most of the time, OLAP implementations use fully pre-aggregated analytic workspaces.
Oracle continues to work to improve both load performance and query performance, so you might want to try different configurations and test them to see what the performance trade-offs are.
The other effect of aggregation differences is less obvious. It has to do with the display of hierarchical data in a report. In the relational model, because aggregation happens as part of the query, you can filter the data and then aggregate the results based only on filtered data.
Table 2–1 shows the results of a query in which data is filtered and then aggregated. Sales totals for selected cities are aggregated into region values. The Eastern US Sales value ($35,000) is the sum of the Sales values of the selected cities in the Eastern US region: New York City ($20,000) and Atlanta ($15,000). Likewise, the Central US Sales value ($40,000) is the sum of the Sales values for selected cities in the Central US region: Chicago ($18,000), Houston ($9,000), and Kansas City ($13,000).
Table 2–1 Example of Filtering Before Aggregation
Region and City Sales
Eastern US $35,000
New York City $20,000
Atlanta $15,000
Central US $40,000
Chicago $18,000
Houston $9,000
Kansas City $13,000
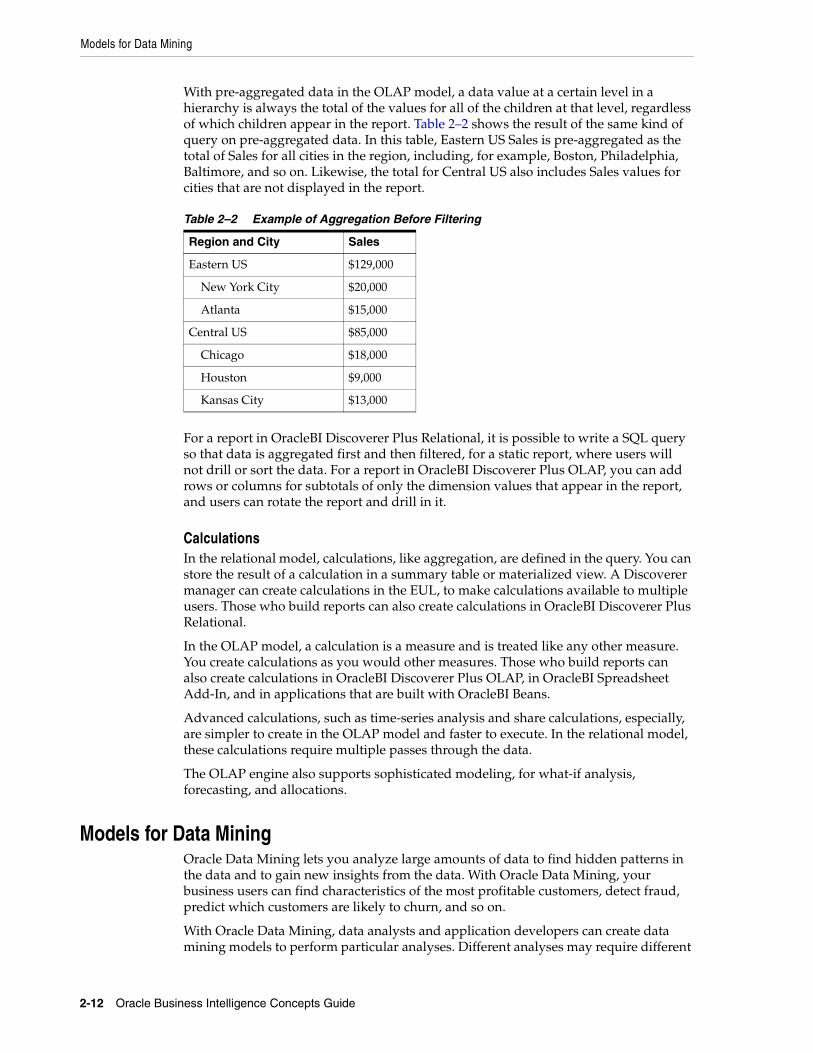
Models for Data Mining
2-12 Oracle Business Intelligence Concepts Guide
With pre-aggregated data in the OLAP model, a data value at a certain level in a hierarchy is always the total of the values for all of the children at that level, regardless of which children appear in the report. Table 2–2 shows the result of the same kind of query on pre-aggregated data. In this table, Eastern US Sales is pre-aggregated as the total of Sales for all cities in the region, including, for example, Boston, Philadelphia, Baltimore, and so on. Likewise, the total for Central US also includes Sales values for cities that are not displayed in the report.
For a report in OracleBI Discoverer Plus Relational, it is possible to write a SQL query so that data is aggregated first and then filtered, for a static report, where users will not drill or sort the data. For a report in OracleBI Discoverer Plus OLAP, you can add rows or columns for subtotals of only the dimension values that appear in the report, and users can rotate the report and drill in it.
CalculationsIn the relational model, calculations, like aggregation, are defined in the query. You can store the result of a calculation in a summary table or materialized view. A Discoverer manager can create calculations in the EUL, to make calculations available to multiple users. Those who build reports can also create calculations in OracleBI Discoverer Plus Relational.
In the OLAP model, a calculation is a measure and is treated like any other measure. You create calculations as you would other measures. Those who build reports can also create calculations in OracleBI Discoverer Plus OLAP, in OracleBI Spreadsheet Add-In, and in applications that are built with OracleBI Beans.
Advanced calculations, such as time-series analysis and share calculations, especially, are simpler to create in the OLAP model and faster to execute. In the relational model, these calculations require multiple passes through the data.
The OLAP engine also supports sophisticated modeling, for what-if analysis, forecasting, and allocations.
Models for Data MiningOracle Data Mining lets you analyze large amounts of data to find hidden patterns in the data and to gain new insights from the data. With Oracle Data Mining, your business users can find characteristics of the most profitable customers, detect fraud, predict which customers are likely to churn, and so on.
With Oracle Data Mining, data analysts and application developers can create data mining models to perform particular analyses. Different analyses may require different
Table 2–2 Example of Aggregation Before Filtering
Region and City Sales
Eastern US $129,000
New York City $20,000
Atlanta $15,000
Central US $85,000
Chicago $18,000
Houston $9,000
Kansas City $13,000
Tools for Creating Reports
Technical Fundamentals for Implementation 2-13
algorithms, which produce different data mining models. These models contain patterns that were found in data or that predict likely outcomes for data.
Developing a model is an iterative process. Even after the model is deployed, it may need to be rebuilt with new or additional data.
Oracle Data Mining supports the following data mining functions:
■ Classification: Grouping items into discrete classes and predicting which class a case belongs to, such as high-value customers or customers likely to churn
■ Regression: Predicting a continuous value, such as income, debt amount, or price of a home
■ Attribute Importance: Identifying the attributes that are most important in predicting a target attribute
■ Anomaly Detection: Identifying items that do not satisfy the characteristics of "normal" data (outliers) -- requires Oracle Database 10.2
■ Clustering: Finding natural groupings in the data
■ Association: Analyzing market baskets and finding items that often occur together
■ Feature Extraction: Creating a reduced set of new attributes (features) as a combination of the original attributes, such as reducing a set of 5000 variables to a more manageable set of 50 variables
Oracle Data Miner makes it easier to create data models and data mining applications. With Oracle Data Miner, wizards provide a guide through data preparation, model creation and evaluation, and model scoring. Oracle Data Miner relieves analysts from having to learn SQL or Java in order to create data mining models. Mining activity guides walk analysts through the data mining process.
Tools for Creating ReportsThe choice of tools for creating reports has a big impact on the success of a business intelligence implementation. You must have tools that are powerful enough to make the most sophisticated reports that business users need. You also want tools that make it possible for business users to create reports for themselves.
Oracle Business Intelligence includes a variety of tools for creating reports, from the most sophisticated enterprise reports to simple worksheets that anyone can do. This section describes these tools.
Oracle ReportsOracle Reports is a powerful enterprise reporting tool that enables you to develop and deploy high quality reports, from a number of data sources and to a variety of destinations. You can use Oracle Reports to create a wide range of reports for the full range of business activities. For example, you can use Oracle Reports to create invoices, form letters, packing slips, shipping labels, financial statements, sales reports, and high quality presentations such as annual reports.
Reports Builder is the development component of Oracle Reports. It allows report specialists fine control over report format and output, and it supports a wide variety of data sources as input. Reports Builder includes access to virtually any data format, through pluggable data sources (PDSs), such as JDBC and XML.
Reports Builder provides many report objects, such as tables in different formats, graphs, text, images, bar codes, and so on. An editor allows report specialists to
Tools for Creating Reports
2-14 Oracle Business Intelligence Concepts Guide
modify paper report layouts in a WYSIWYG model. Wizards and default report templates enable quick report creation, yet the templates are customizable, for maximum flexibility.
Oracle Reports supports many output formats, including HTML, HTMLCSS, XML, PDF, PCL, PostScript, and ASCII, so you can deliver reports however users want them.
Who Uses Oracle ReportsOracle Reports is a powerful reporting tool. Most often, a report specialist in the IT department is responsible for creating and maintaining reports with Oracle Reports and for delivering them to business users.
Source Data for Oracle ReportsOracle Reports can display data from any data source. Although Oracle Reports started with relational data, because of its pluggable data sources (PDSs), Oracle Reports can access data from different sources, including OLAP, JDBC, and XML. For data that requires special access mechanisms, you can create your own pluggable data source.
Data Mining results are stored in a relational table, so they are easily displayed in Oracle Reports.
More InformationFor more information about building reports with Oracle Reports, see Oracle Reports Building Reports.
OracleBI Discoverer PlusOracleBI Discoverer Plus is an intuitive data analysis and reporting tool. OracleBI Discoverer Plus makes it easy for users to analyze their data and share it with others in the organization. Reports that are created with OracleBI Discoverer Plus can easily be viewed in a Web browser, either in OracleBI Discoverer Viewer or as a portlet in an OracleAS Portal dashboard. OracleBI Discoverer Plus reports can also be easily printed or exported to Microsoft Excel.
OracleBI Discoverer Plus reports, also known as worksheets, are organized in workbooks, which users can share. Worksheets can include tables or crosstabs and graphs, as well as titles and text areas for explanation.
An interactive model allows direct manipulation of the data, for changing the layout or the contents of a report. Report builders and recipients can drill, pivot, and sort the data, enabling the slice and dice capability that users expect from business intelligence. Wizards guide new users in query creation and report building tasks.
OracleBI Discoverer Plus includes powerful analytic features, such as the ability to apply conditional formatting to the data, including stoplight formats. With OracleBI Discoverer Plus, you can display data numerically and graphically in the same worksheet. A table and a graph, or a crosstab and a graph, share the same query. Alternately, you can choose to display only the numeric form or only the graph.
In OracleBI Discoverer Plus Relational, report specialists can add parameters to reports, so the same report can be used by different customers, who set parameters to choose data of interest to them.
In OracleBI Discoverer Plus OLAP, users have access to the OLAP engine, which supports sophisticated time-series analysis, share calculations, and so on.
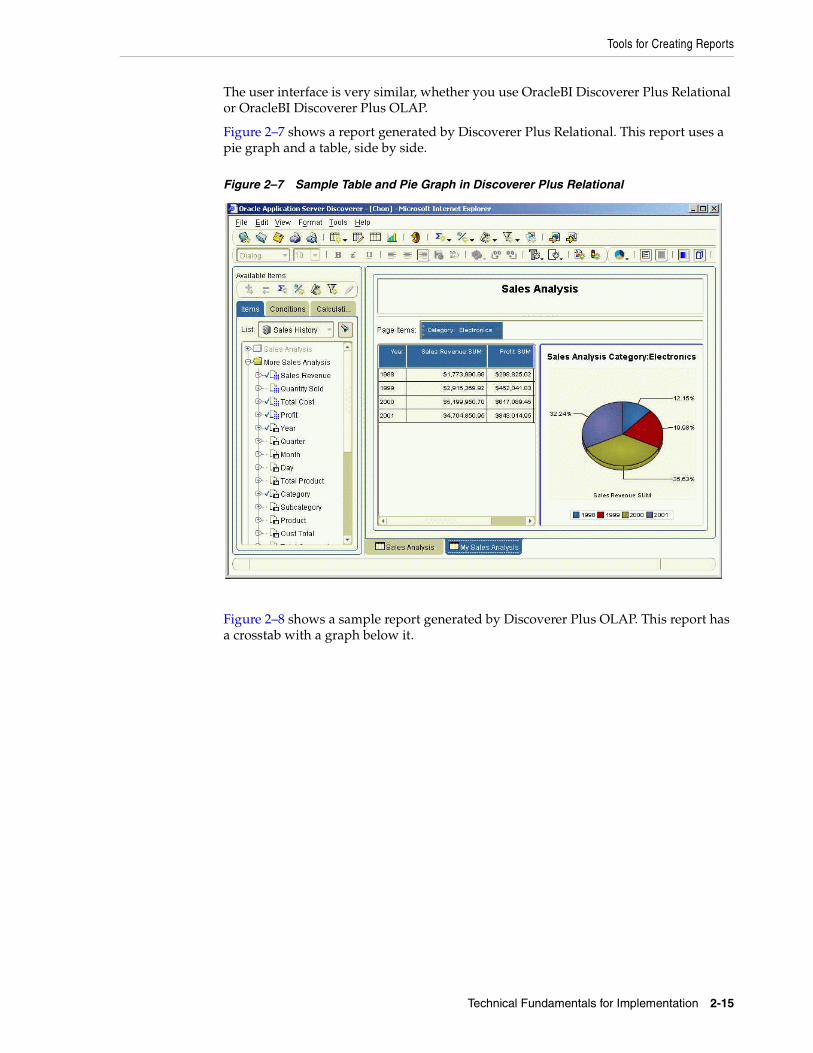
Tools for Creating Reports
Technical Fundamentals for Implementation 2-15
The user interface is very similar, whether you use OracleBI Discoverer Plus Relational or OracleBI Discoverer Plus OLAP.
Figure 2–7 shows a report generated by Discoverer Plus Relational. This report uses a pie graph and a table, side by side.
Figure 2–7 Sample Table and Pie Graph in Discoverer Plus Relational
Figure 2–8 shows a sample report generated by Discoverer Plus OLAP. This report has a crosstab with a graph below it.

Tools for Creating Reports
2-16 Oracle Business Intelligence Concepts Guide
Figure 2–8 Sample Crosstab and Bar Graph in Discoverer Plus OLAP
Who Uses OracleBI Discoverer PlusOracleBI Discoverer Plus is powerful enough for report specialists to use to create sophisticated analytic reports for others, but it is also easy to use, so business users can create their own reports as well. An intuitive user interface allows business users to select and arrange data and to apply conditional formatting, including stoplight reports.
Source Data for OracleBI Discoverer PlusOracleBI Discoverer Plus Relational uses metadata provided in an End User Layer (EUL) to display data from relational tables, including star schemas.
OracleBI Discoverer Plus OLAP normally displays data from an analytic workspace, though it can also display data from star schemas, through metadata in an OLAP Catalog.
More InformationFor more information about OracleBI Discoverer Plus, see the Oracle Business Intelligence Discoverer Plus User’s Guide.
OracleBI Spreadsheet Add-InOracleBI Spreadsheet Add-In enables analysts to work with dimensional data in Microsoft Excel. The Add-In fetches data through an active connection to an analytic workspace and displays the data in a spreadsheet. Analysts can use the Add-In to perform OLAP operations such as drilling, rotation, and data selection.
With OracleBI Spreadsheet Add-In, calculations can be defined in the analytic workspace and shared across user communities. OLAP calculations are performed quickly and efficiently in the database, and they do not require massive downloads of data to Excel.
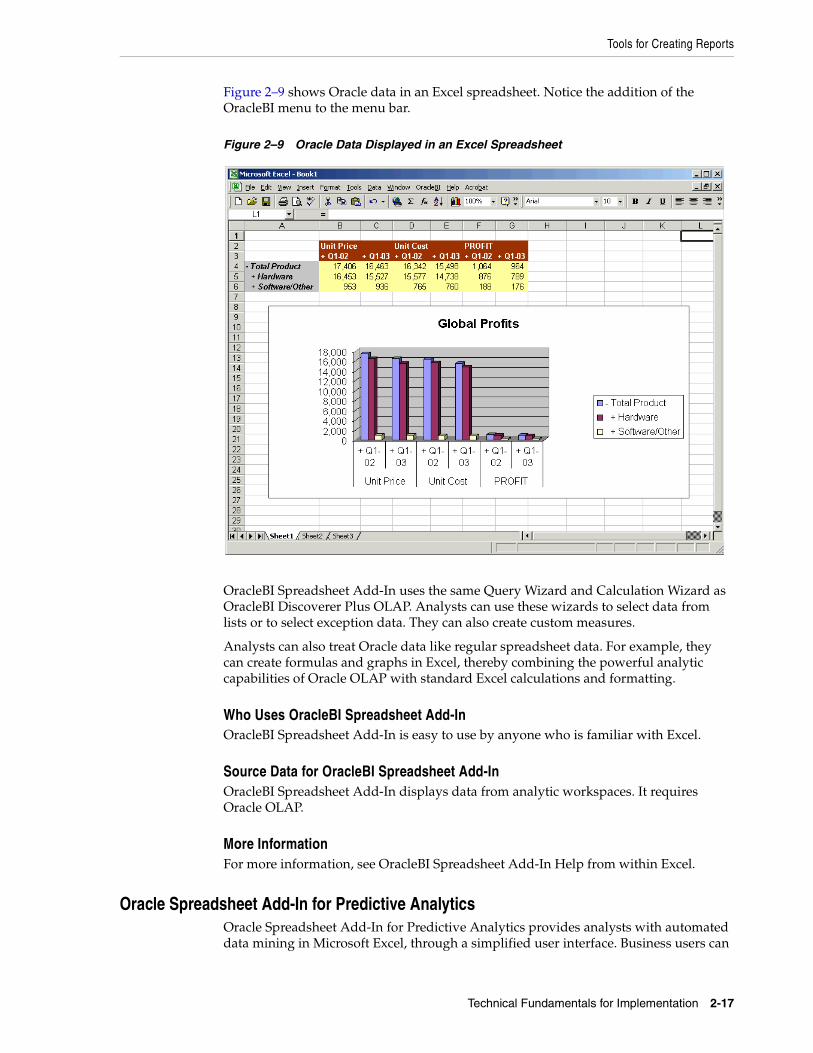
Tools for Creating Reports
Technical Fundamentals for Implementation 2-17
Figure 2–9 shows Oracle data in an Excel spreadsheet. Notice the addition of the OracleBI menu to the menu bar.
Figure 2–9 Oracle Data Displayed in an Excel Spreadsheet
OracleBI Spreadsheet Add-In uses the same Query Wizard and Calculation Wizard as OracleBI Discoverer Plus OLAP. Analysts can use these wizards to select data from lists or to select exception data. They can also create custom measures.
Analysts can also treat Oracle data like regular spreadsheet data. For example, they can create formulas and graphs in Excel, thereby combining the powerful analytic capabilities of Oracle OLAP with standard Excel calculations and formatting.
Who Uses OracleBI Spreadsheet Add-InOracleBI Spreadsheet Add-In is easy to use by anyone who is familiar with Excel.
Source Data for OracleBI Spreadsheet Add-InOracleBI Spreadsheet Add-In displays data from analytic workspaces. It requires Oracle OLAP.
More InformationFor more information, see OracleBI Spreadsheet Add-In Help from within Excel.
Oracle Spreadsheet Add-In for Predictive AnalyticsOracle Spreadsheet Add-In for Predictive Analytics provides analysts with automated data mining in Microsoft Excel, through a simplified user interface. Business users can
Custom Application Development Tool
2-18 Oracle Business Intelligence Concepts Guide
mine Oracle or Excel data, using simple Predict and Explain features. Predictive analytics provides automated methodologies that simplify data mining.
The Explain feature allows users to understand their data better, by identifying attributes that have the greatest influence on a target attribute, such as "high value customers." Explain searches the data for these attributes, ranks them in order, and displays the results in Excel. Explain can be used to identify attributes most closely associated with customers of high value, for example, or customers who switch to a competitor.
The Predict feature allows users to make predictions based on observed data and hidden patterns in the data. Predict digs through data, builds a predictive model, and applies that model to the data. Predict makes predictions about whether a record in a table or Excel spreadsheet belongs to a certain class, such as customers who are likely to purchase a product. Predict could also be used to predict which customers are likely to have the highest lifetime value to an organization, for example, or which people are most likely to commit fraud.
Who Uses Oracle Spreadsheet Add-In for Predictive AnalyticsOracle Spreadsheet Add-In for Predictive Analytics is generally used by business analysts.
Data Sources for Oracle Spreadsheet Add-In for Predictive AnalyticsOracle Spreadsheet Add-In for Predictive Analytics analyzes data in relational tables or in Excel spreadsheets. It requires the Oracle Data Mining option.
More InformationThe documentation for Oracle Spreadsheet Add-In for Predictive Analytics is included in the product download from Oracle Technology Network.
Custom Application Development ToolThe report-building tools in Oracle Business Intelligence cover a wide variety of reports. You might, however, have special circumstances that require a custom application. For example, you might need reports that comply with the corporate look and feel in a Web application. Or you might need access to advanced OLAP features that are not exposed in OracleBI Discoverer Plus OLAP, such as forecasting, what-if analysis, or allocation.
OracleBI Beans is a set of standards-based JavaBeans, integrated into Oracle JDeveloper for the development of Java-based and Web-based applications. The application development environment includes a rich set of tags for Java Server Pages (JSPs), making it easy to build analytic Web applications. These applications can include advanced features such as interactive user interfaces and drill-to-detail reports, as well as Oracle OLAP analytic features.
Figure 2–10 shows a custom dashboard application that was built using OracleBI Beans. The application presents two graphs:
■ A bubble graph presents a margin analysis. The size of the bubble indicates sales revenue.
■ A line graph shows a number of different forecasts. Each line represents a different forecast method. The forecasts use the analytic engine in Oracle OLAP.
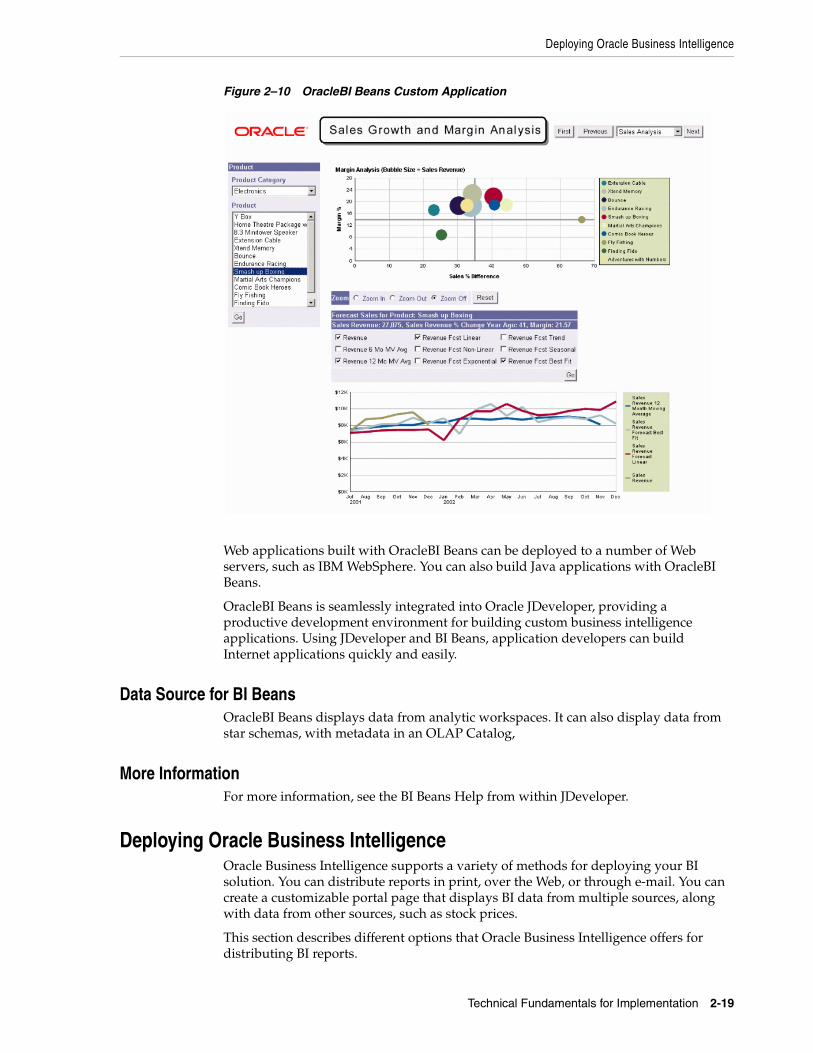
Deploying Oracle Business Intelligence
Technical Fundamentals for Implementation 2-19
Figure 2–10 OracleBI Beans Custom Application
Web applications built with OracleBI Beans can be deployed to a number of Web servers, such as IBM WebSphere. You can also build Java applications with OracleBI Beans.
OracleBI Beans is seamlessly integrated into Oracle JDeveloper, providing a productive development environment for building custom business intelligence applications. Using JDeveloper and BI Beans, application developers can build Internet applications quickly and easily.
Data Source for BI BeansOracleBI Beans displays data from analytic workspaces. It can also display data from star schemas, with metadata in an OLAP Catalog,
More InformationFor more information, see the BI Beans Help from within JDeveloper.
Deploying Oracle Business IntelligenceOracle Business Intelligence supports a variety of methods for deploying your BI solution. You can distribute reports in print, over the Web, or through e-mail. You can create a customizable portal page that displays BI data from multiple sources, along with data from other sources, such as stock prices.
This section describes different options that Oracle Business Intelligence offers for distributing BI reports.
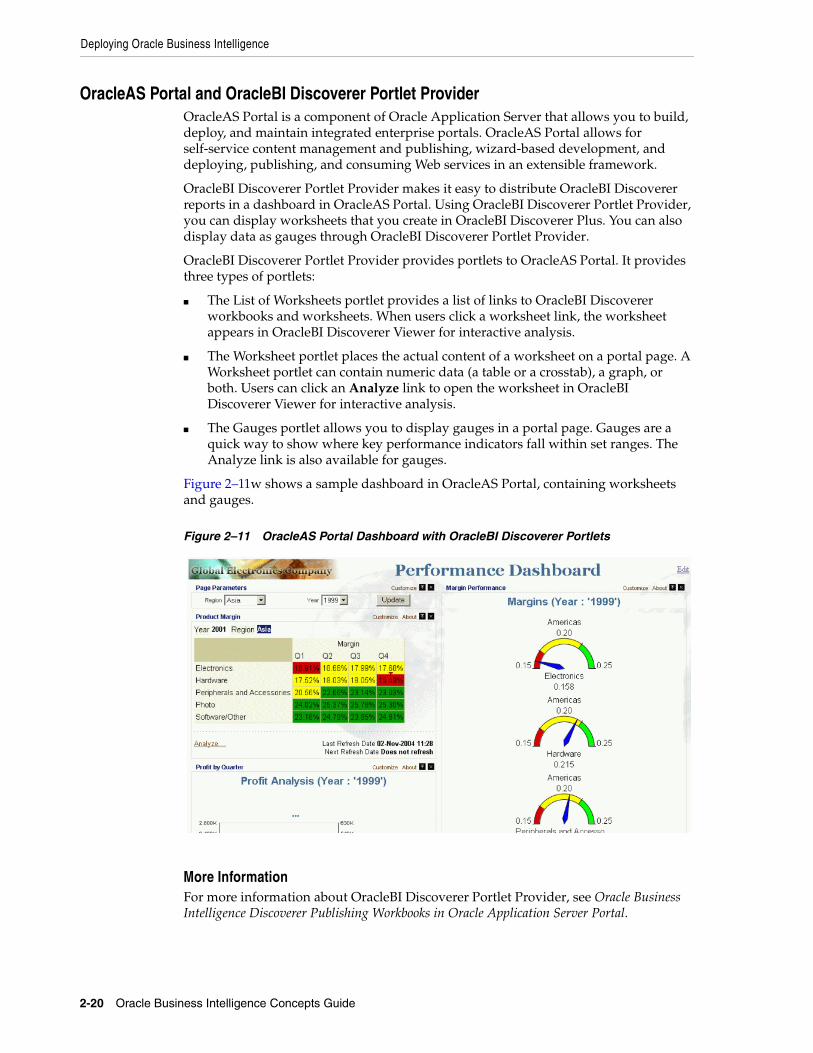
Deploying Oracle Business Intelligence
2-20 Oracle Business Intelligence Concepts Guide
OracleAS Portal and OracleBI Discoverer Portlet ProviderOracleAS Portal is a component of Oracle Application Server that allows you to build, deploy, and maintain integrated enterprise portals. OracleAS Portal allows for self-service content management and publishing, wizard-based development, and deploying, publishing, and consuming Web services in an extensible framework.
OracleBI Discoverer Portlet Provider makes it easy to distribute OracleBI Discoverer reports in a dashboard in OracleAS Portal. Using OracleBI Discoverer Portlet Provider, you can display worksheets that you create in OracleBI Discoverer Plus. You can also display data as gauges through OracleBI Discoverer Portlet Provider.
OracleBI Discoverer Portlet Provider provides portlets to OracleAS Portal. It provides three types of portlets:
■ The List of Worksheets portlet provides a list of links to OracleBI Discoverer workbooks and worksheets. When users click a worksheet link, the worksheet appears in OracleBI Discoverer Viewer for interactive analysis.
■ The Worksheet portlet places the actual content of a worksheet on a portal page. A Worksheet portlet can contain numeric data (a table or a crosstab), a graph, or both. Users can click an Analyze link to open the worksheet in OracleBI Discoverer Viewer for interactive analysis.
■ The Gauges portlet allows you to display gauges in a portal page. Gauges are a quick way to show where key performance indicators fall within set ranges. The Analyze link is also available for gauges.
Figure 2–11w shows a sample dashboard in OracleAS Portal, containing worksheets and gauges.
Figure 2–11 OracleAS Portal Dashboard with OracleBI Discoverer Portlets
More InformationFor more information about OracleBI Discoverer Portlet Provider, see Oracle Business Intelligence Discoverer Publishing Workbooks in Oracle Application Server Portal.
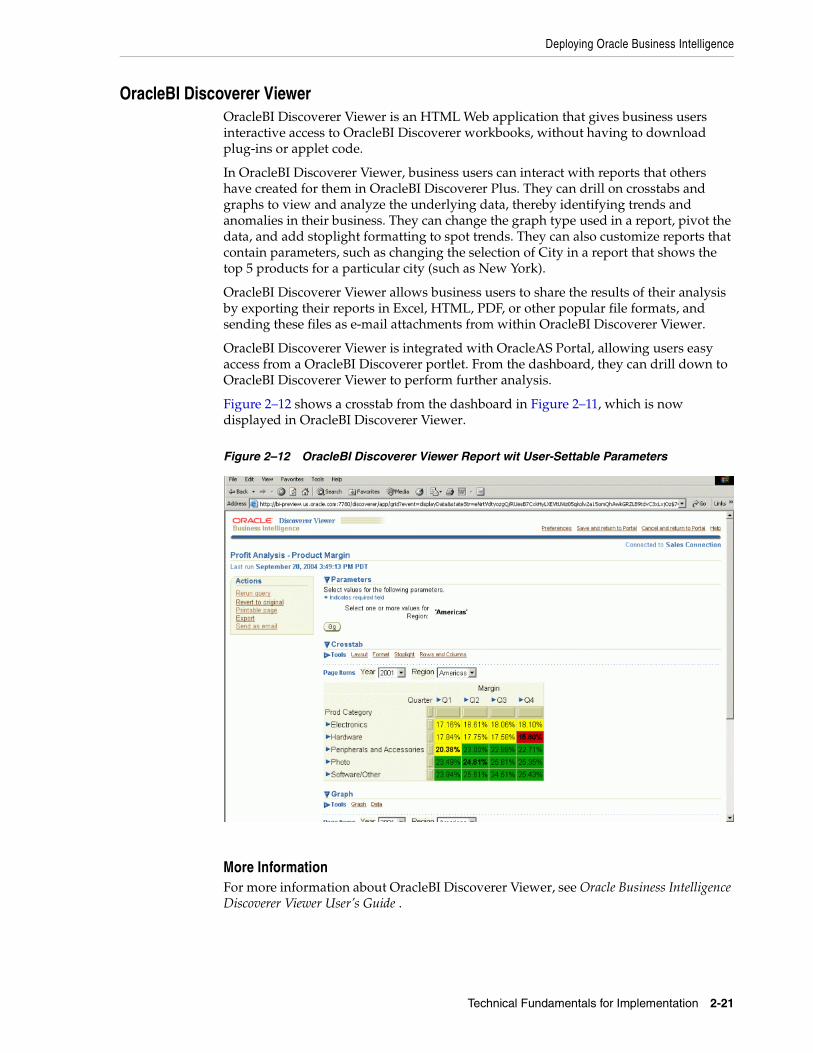
Deploying Oracle Business Intelligence
Technical Fundamentals for Implementation 2-21
OracleBI Discoverer ViewerOracleBI Discoverer Viewer is an HTML Web application that gives business users interactive access to OracleBI Discoverer workbooks, without having to download plug-ins or applet code.
In OracleBI Discoverer Viewer, business users can interact with reports that others have created for them in OracleBI Discoverer Plus. They can drill on crosstabs and graphs to view and analyze the underlying data, thereby identifying trends and anomalies in their business. They can change the graph type used in a report, pivot the data, and add stoplight formatting to spot trends. They can also customize reports that contain parameters, such as changing the selection of City in a report that shows the top 5 products for a particular city (such as New York).
OracleBI Discoverer Viewer allows business users to share the results of their analysis by exporting their reports in Excel, HTML, PDF, or other popular file formats, and sending these files as e-mail attachments from within OracleBI Discoverer Viewer.
OracleBI Discoverer Viewer is integrated with OracleAS Portal, allowing users easy access from a OracleBI Discoverer portlet. From the dashboard, they can drill down to OracleBI Discoverer Viewer to perform further analysis.
Figure 2–12 shows a crosstab from the dashboard in Figure 2–11, which is now displayed in OracleBI Discoverer Viewer.
Figure 2–12 OracleBI Discoverer Viewer Report wit User-Settable Parameters
More InformationFor more information about OracleBI Discoverer Viewer, see Oracle Business Intelligence Discoverer Viewer User’s Guide .
Deploying Oracle Business Intelligence
2-22 Oracle Business Intelligence Concepts Guide
Oracle Reports Output OptionsYou can use Oracle Reports to distribute reports in any format. Of all the Oracle Business Intelligence tools, Oracle Reports has the richest set of output formats. You can create high quality printed reports and high quality Web reports. Oracle Reports supports standard output formats such as HTML, HTMLCSS, XML, PDF, PCL, PostScript, and ASCII.
Oracle Reports enables you to distribute the same report in multiple output formats, and you can distribute a report to multiple destinations from a single run of the report. You can create distributions for an entire report and for individual sections of the report. For example, in a single run of a report, you can generate HTML output, send a PostScript version to the printer, and also e-mail any or all sections of the report to a distribution list.
You can define the distribution for a report using XML, using a dialog in Oracle Reports, or through a command line interface.
More InformationFor more information about Oracle Reports report formats and distributing reports, see Oracle Reports Building Reports and Oracle Application Server Reports Services Publishing Reports to the Web.
Example Implementations 3-1
3Example Implementations
This chapter provides two scenarios to show you how to craft a business intelligence system. One scenario uses OLAP for advanced analytics, and the other scenario reports against transactional data.
This chapter contains the following topics:
■ Implementing a Business Intelligence Solution
■ Global Enterprises: Ad-Hoc Reporting and Advanced Analytics
■ Acme Corporation: Web-Based Access to Transactional Data
Implementing a Business Intelligence SolutionThis chapter describes two fictitious companies, with two different data sets and two different sets of requirements. It presents an Oracle Business Intelligence solution for each one, using a set of Oracle Business Intelligence components.
The Global example is based on the Global schema, which is available on the Oracle Business Intelligence Web site at
http://www.oracle.com/technology/bi/olap/olap.html
The Acme example is based on the sample schemas provided with Oracle Database. Both solutions follow the same basic steps, which are listed in the next topic.
Planning a Business Intelligence SystemImplementing a business intelligence system requires careful planning to assure that it meets expectations. These are the basic steps:
1. Identify End-User Requirements
2. Identify the Data Sources
3. Design the Data Model
4. Create the Data Store
5. Generate the Summary Data
6. Prepare the Data for Client Access
7. Grant Access Rights
8. Distribute the Client Software and Documentation
9. Create and Distribute Reports
Implementing a Business Intelligence Solution
3-2 Oracle Business Intelligence Concepts Guide
Identify End-User RequirementsIt is important to anticipate how end users will analyze the data. By interviewing key users, you can identify the questions that the business intelligence system needs to answer.
You can ask questions such as:
■ What information do you have now?
■ What additional information do you need?
■ How do you want the information presented?
Business requirements can be generated at all levels of your organization. The following are examples of the requirements you might need to address:
■ Board of Directors
– Competitive analysis
– Key indicator tracking
– Trend analysis
– Exception reporting
■ Administrative Analysis and Planning
– Investment and acquisitions assessment
– Reorganization analysis
– Long-range planning
– Resource allocation
– Capacity planning
– Human resource planning
■ Finance Department
– Budgeting
– Consolidation
– Variance analysis
– Financial modeling
– Cash management
– Asset liability modeling
– Activity-based management
■ Sales and Marketing Department
– Product profitability
– Customer profiling
– Distribution analysis
– Sales performance and effectiveness
You can find out about the reports and data sources currently available, and what users like and dislike about their current information system. You may also discover their expectations about run-time performance.
Implementing a Business Intelligence Solution
Example Implementations 3-3
Identify the Data SourcesFrom the types of questions that end users want answered, you can identify the sources of the data that can provide the answers. The data can be distributed among numerous locations, such as transactional databases and flat files. If the data is not available within your company, then you should discuss whether it is possible to acquire the data or whether end users must modify their expectations.
Design the Data ModelThe logical data model must support the needs and expectations of your end users. The logical data model presents the data in business terms so that users can quickly identify the data they need to use.
For OLAP tools, you define dimensions, measures, and so forth. Then you can map the metadata objects to the physical data sources.
For relational tools, you define items, calculations, joins, and so forth using any existing relational data source.
Create the Data StoreYou must deploy the data model as physical objects in the database and load the data from its sources.
For OLAP tools, the data store is an analytic workspace.
For relational tools, the data store may be the current OLTP system or a star schema in a data warehouse.
Generate the Summary DataBusiness intelligence data is essentially hierarchical, so that data can be summarized at various levels. For performance, some of this data (ideally the data most frequently queried) is summarized and stored as a data maintenance procedure.
In analytic workspaces, summary data is stored in the same analytic workspace objects as the base-level data. In relational schemas, summary data is stored in materialized views.
Prepare the Data for Client AccessThe client tools query the metadata to find out what data is available, where to get it, and how to present it.
Grant Access RightsUsers must have database access rights granted to them so that they can view and manipulate the data.
Distribute the Client Software and DocumentationAfter the data store is ready for client access, you can distribute the software and provide documentation to your end users.
Global Enterprises: Ad-Hoc Reporting and Advanced Analytics
3-4 Oracle Business Intelligence Concepts Guide
Create and Distribute ReportsReport developers can develop reports and share them with the user community. When you use OracleAS Portal, you can easily create dashboards where reports can be published.
Global Enterprises: Ad-Hoc Reporting and Advanced AnalyticsGlobal Enterprises sells computer hardware and software in a variety of outlets. While they have been industry leaders for many years, the price of hardware has fallen dramatically in the last few years. They have little room for error if they are going to remain profitable.
To create a data warehouse, they need to consolidate information from disparate sources from around the world. This will provide them with the data to answer the following business analysis questions:
■ What products are profitable?
■ Who are our customers, and what and how are they buying?
■ What accounts are most profitable?
■ What is the performance of each distribution channel?
■ Is there a seasonal variance to the business?
Identifying trends in the data that will answer these questions requires ad-hoc analysis and sophisticated analytic computations, such as:
Change in sales from prior periodPercent change in sales from prior periodChange in sales from prior yearPercent change in sales from prior yearProduct shareChannel shareMarket shareExtended costExtended marginExtended margin change from prior periodExtended margin percent change from prior period
Global Enterprises uses OracleBI Warehouse Builder to generate a star schema for their data warehouse. Their current problems arise not in the data itself, but in the tools to manipulate that data. They believe that a choice of OracleBI Discoverer Plus OLAP and OracleBI Spreadsheet Add-In will satisfy their sales managers. However, they are also planning to have their IT department take a close look at OracleBI Beans to explore custom solutions to their most aggressive requirements, such as forecasting and what-if analysis.
The applications development team at Global Enterprises will use Analytic Workspace Manager for developing analytic workspaces. After they finish designing the logical model, they plan to turn over responsibility for managing the analytic workspaces to the IT department, who will use OracleBI Warehouse Builder. Until then, the IT department will continue to deploy star schemas.
Global Enterprises: Ad-Hoc Reporting and Advanced Analytics
Example Implementations 3-5
Software RequirementsGlobal Enterprises will use a number of components of Oracle Business Intelligence to implement their BI solution.
Components for Delivering ReportsOracleBI Discoverer ViewerOracleAS Portal with OracleBI Discoverer Portlet ProviderCustom Java applications
Components for Creating ReportsOracleBI Discoverer PlusOracleBI Spreadsheet Add-In
Components for Preparing DataOracleBI Warehouse BuilderAnalytic Workspace Manager
Component for Developing Custom ApplicationsJDeveloper with OracleBI Beans
DatabaseOracle Database 10g Enterprise Edition with the OLAP option
Getting Started With Analytic WorkspacesPrerequisite: Install the software identified under "Software Requirements".
Global Enterprises has already identified its end-user requirements and the data sources, as described previously. To create an analytic workspace for Global Enterprises, take these remaining steps, which are described in more detail below:
1. Design the Data Model
2. Create the Data Store
3. Generate the Summary Data
4. Prepare the Data for Client Access
5. Grant Access Rights
6. Distribute the Client Software and Documentation
7. Define Advanced Analytics
8. Deploy Custom Applications
Design the Data ModelOpen the Model View of Analytic Workspace Manager, and define these objects:
■ Analytic workspace
■ Dimensions
■ Levels
■ Attributes
Global Enterprises: Ad-Hoc Reporting and Advanced Analytics
3-6 Oracle Business Intelligence Concepts Guide
■ Hierarchies
■ Cubes
■ Measures
Analytic Workspace Manager stores the logical model as standard form metadata in the analytic workspace, and it creates all of the objects needed to instantiate the model at the same time.
When the source data is in a star or snowflake schema, you can quickly define a logical multidimensional model. The dimension tables contain columns for values at various levels, and their attributes. For example, a Time dimension table might have surrogate keys for weeks, quarters, and years; they are the levels of a hierarchy, which you might name the Calendar hierarchy. The display names, end date, and time span columns are attributes of the Time dimension. Each fact table is a cube, and the columns containing facts are the measures. Other types of schemas require individual analysis.
Create the Data StoreTo map the logical objects to their data sources, choose the Mapping folder in the Model View Navigator of Analytic Workspace Manager. You can drag-and-drop the source tables onto the mapping canvas, then draw connectors between the logical objects and the appropriate columns. The Maintenance Wizard loads data from relational data sources into the analytic workspace.
Generate the Summary DataYou can define the aggregation rules for each cube. The rules identify the aggregation operator for each dimension and the portion of data that you want to presummarize and store. This plan provides the default summarization rules for all measures in the cube. The Maintenance Wizard executes the aggregation rules and generates the stored aggregates.
Prepare the Data for Client AccessUsing the Calculation Wizard, you can easily define the derived measures for all users, thus adding a wealth of information to your analytic workspace.
OracleBI Discoverer Plus OLAP and OracleBI Spreadsheet Add-In enable users to define additional calculations (custom measures) and saved selections, so they do not have to be defined entirely in the analytic workspace. Discoverer Plus OLAP stores them in the Discoverer Catalog, where they can be accessed by other users with the appropriate permissions.
Grant Access RightsFor users to access the data, they require the following database privileges:
CONNECTQUERY REWRITESELECT on the table in which the analytic workspace is stored
You can use Oracle Enterprise Manager or SQL to define users and groups, and to assign these privileges.

Acme Corporation: Web-Based Access to Transactional Data
Example Implementations 3-7
Distribute the Client Software and DocumentationAfter the analytic workspace is ready for use, you can make OracleBI Spreadsheet Add-In and OracleBI Discoverer Plus available for installation. You can also set up a dashboard with Discoverer portals so that power users can publish their reports.
Define Advanced AnalyticsAdvanced analytics take development time. You can define forecasts, models, and what-if scenarios in the analytic workspace by using OracleBI Beans. Meanwhile, analysts can take advantage of the rich analytics already available through custom measures.
Check the Oracle Technology Network at http://www.oracle.com/technology for new versions of Analytic Workspace Manager Release 2, which will support these definitions in a graphical interface.
Deploy Custom ApplicationsThe IT department plans to develop custom Java applications using OracleBI Beans in JDeveloper, in order to tailor the user interface to the specific needs of their user community.
Acme Corporation: Web-Based Access to Transactional DataAcme Corporation operates worldwide to fill orders for several different products. The company has several divisions:
■ Human Resources tracks information on company employees and facilities.
■ Order Entry tracks product inventories and sales of company products through various channels.
■ Product Media maintains descriptions and detailed information on each product sold by the company.
■ Information Exchange manages shipping through business-to-business (B2B) applications.
Acme wants to provide a flexible, out-of-the-box query and analysis tool to their executives and managers, who are distributed across the globe. The tool must enable them to query vast amounts of data that is stored in their Oracle databases, regardless of the product edition or the schema designs. They expect the queries to range from analysis of individual transactions on a daily basis to historical expenditure profiles for the whole organization. They do not have any requirements for extensive or ad-hoc analysis.
Acme chooses OracleBI Discoverer for its query and analysis tool. The majority of users need only a Web browser to retrieve and review their data in numerous graphical formats, and they can drill and pivot through the data.
Software RequirementsOracleBI Discoverer provides all of the components needed to satisfy Acme's business intelligence requirements. Since they already have their data stored in Oracle databases, and their immediate goal is analyzing "as is" data, they have no need for an ETL tool at this time. At a later date, they may want to use OracleBI Warehouse Builder to create a true data warehouse containing cleaned, transformed, and aggregated data in a star schema.
Acme Corporation: Web-Based Access to Transactional Data
3-8 Oracle Business Intelligence Concepts Guide
Components for Delivering ReportsOracleBI Discoverer ViewerOracleAS Portal with OracleBI Discoverer Portlet Provider
Components for Creating ReportsOracleBI Discoverer Plus
Component for Preparing DataOracleBI Discoverer Administrator
DatabaseOracle Database 10g Enterprise or Standard Edition
Getting Started With DiscovererAcme Corporation has already identified its end-user requirements and the data store already exists, as described previously. To implement a Discoverer system for Acme Corporation, you must take these additional steps, which are described in more detail below.
Prerequisite: Install the software identified under "Software Requirements".
1. Design the Data Model
2. Generate the Summary Data
3. Prepare the Data for Client Access
4. Grant Access Rights
5. Distribute the Client Software and Documentation
Design the Data ModelThe EUL contains the metadata that defines one or more business areas. A business area is a conceptual grouping of tables and views that apply to a user's specific data requirements. Business areas can be set up to reflect the needs of the user or group of users accessing the EUL.
After identifying the requirements of your users, you should have a good idea of the information different user groups need to access. For example, one group of users might want to access sales information, another group might want to access manufacturing information, and so on.
In OracleBI Discoverer Administrator, you define a business area for classifying information with a common business purpose. Then you specify which database tables and views hold that class of information. You also load metadata and other information about the tables and views into the business area.
Generate the Summary DataUse OracleBI Discoverer Administrator to create summary tables, which will optimize query performance. You also have the option of using OracleBI Discoverer automated summary management or registering existing summary tables.
See Also: Oracle Business Intelligence Discoverer Administration Guide for detailed instructions for performing each of these steps.
Acme Corporation: Web-Based Access to Transactional Data
Example Implementations 3-9
Prepare the Data for Client AccessThe default settings and contents of a business area are sufficient to enable users to access and analyze data. However, OracleBI Discoverer Administrator provides you with a number of features to enhance the default analysis capabilities so that users can view the data in the most flexible and understandable way.
These are some of the steps you can take to refine business areas:
■ Create optional and mandatory conditions to restrict the number of rows returned in a folder.
■ Create calculated items so that users do not need to formulate complex calculations themselves.
■ Create joins to combine folders that were not joined when tables were loaded from the database.
■ Combine folders into complex folders to completely hide joins and relational structures from users.
■ Create custom folders to represent a result set returned by SQL.
■ Edit item names, descriptions, and other formatting information to make data easier to understand.
■ Create item classes to support lists of values, alternative sorts, and drill to detail.
■ Create hierarchies to simplify drill-down operations.
Grant Access RightsYou can grant access to business areas based on user requirements for accessing data.
OracleBI Discoverer does not compromise database security. Users cannot see information in OracleBI Discoverer that they do not have database privileges to access. All OracleBI Discoverer security and privileges are imposed in addition to database security.
Distribute the Client Software and DocumentationAfter the EUL has been created and access rights have been granted, you can make OracleBI Discoverer Plus available to users. You can also set up an OracleAS Portal dashboard where power users can publish their reports through OracleBI Discoverer Portlet Provider.

Acme Corporation: Web-Based Access to Transactional Data
3-10 Oracle Business Intelligence Concepts Guide
Oracle Business Intelligence Packaging A-1
AOracle Business Intelligence Packaging
This appendix describes the availability of different components of Oracle Business Intelligence. and contains the following topics:
■ Oracle Business Intelligence
■ Oracle Business Intelligence Tools
■ Oracle Business Intelligence Warehouse Builder Installation
■ Oracle Database
Oracle Business IntelligenceOracle Business Intelligence is packaged as part of Oracle Application Server. It includes:
■ Oracle Business Intelligence Discoverer Plus
■ Oracle Business Intelligence Discoverer Viewer
■ Oracle Business Intelligence Discoverer Portlet Provider
■ Oracle Business Intelligence Discoverer EUL Command Line for Java
■ Oracle Business Intelligence Discoverer Services
■ Oracle Application Server Reports Services
■ Other components upon which these depend
The Oracle Application Server installation includes all of these components, as well as Oracle Application Server Portal.
Oracle Business Intelligence ToolsOracle Business Intelligence Tools is packaged as part of Oracle Developer Suite. It includes:
■ Oracle Business Intelligence Discoverer Administrator
■ Oracle Business Intelligence Spreadsheet Add-In
■ Oracle Business Intelligence Beans Add-In to Oracle JDeveloper
Oracle JDeveloper is also included in the Developer Suite CD pack and must be installed before installing OracleBI Beans.
■ Oracle Reports Reports Builder
■ Oracle Business Intelligence Discoverer Desktop
Oracle Business Intelligence Warehouse Builder Installation
A-2 Oracle Business Intelligence Concepts Guide
■ Oracle Business Intelligence Discoverer EUL Command Line for Java
The Oracle Developer Suite includes all of these components, as well as Oracle JDeveloper.
Oracle Business Intelligence Warehouse Builder InstallationOracle Business Intelligence Warehouse Builder is available on its own CD in the Oracle Developer Suite CD pack. A major new release will also be available soon through Oracle Technology Network.
Oracle DatabaseThe following components of Oracle Business Intelligence are licensed as options to the database and are available through Oracle Technology Network:
■ Oracle OLAP option, which includes Analytic Workspace Manager
■ Oracle Data Mining option, which includes Oracle Data Miner and Oracle Spreadsheet Add-In for Predictive Analytics
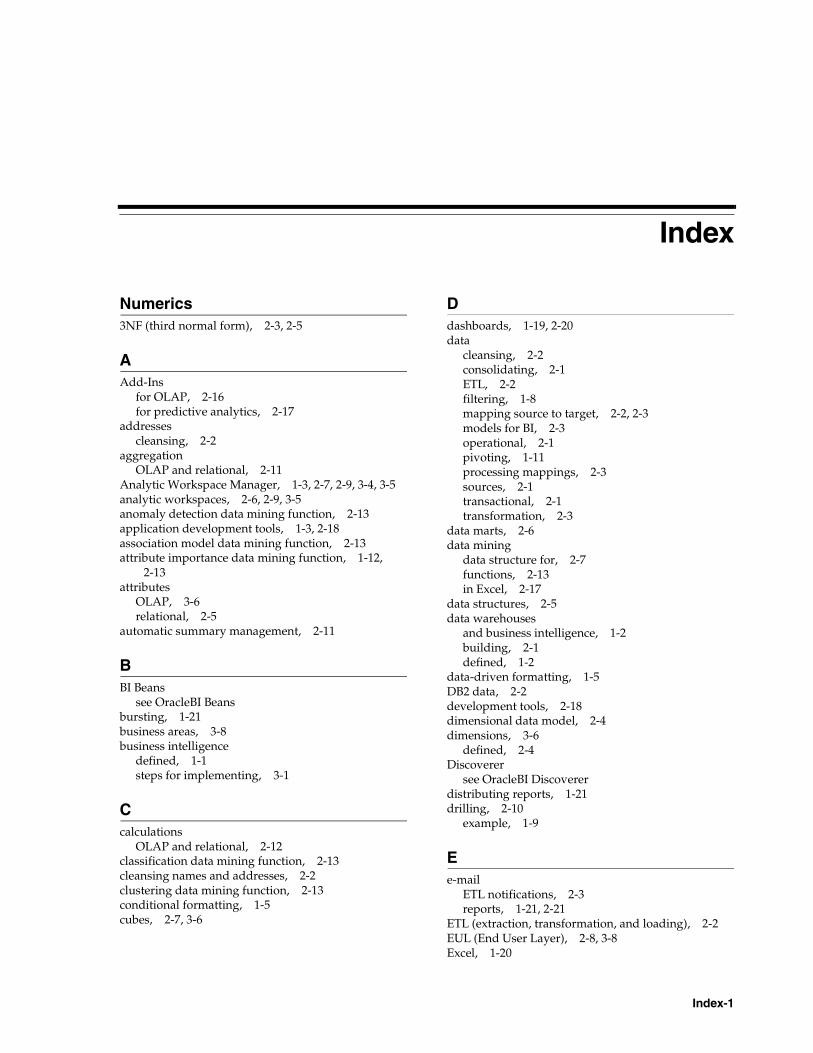
Index-1
Index
Numerics3NF (third normal form), 2-3, 2-5
AAdd-Ins
for OLAP, 2-16for predictive analytics, 2-17
addressescleansing, 2-2
aggregationOLAP and relational, 2-11
Analytic Workspace Manager, 1-3, 2-7, 2-9, 3-4, 3-5analytic workspaces, 2-6, 2-9, 3-5anomaly detection data mining function, 2-13application development tools, 1-3, 2-18association model data mining function, 2-13attribute importance data mining function, 1-12,
2-13attributes
OLAP, 3-6relational, 2-5
automatic summary management, 2-11
BBI Beans
see OracleBI Beansbursting, 1-21business areas, 3-8business intelligence
defined, 1-1steps for implementing, 3-1
Ccalculations
OLAP and relational, 2-12classification data mining function, 2-13cleansing names and addresses, 2-2clustering data mining function, 2-13conditional formatting, 1-5cubes, 2-7, 3-6
Ddashboards, 1-19, 2-20data
cleansing, 2-2consolidating, 2-1ETL, 2-2filtering, 1-8mapping source to target, 2-2, 2-3models for BI, 2-3operational, 2-1pivoting, 1-11processing mappings, 2-3sources, 2-1transactional, 2-1transformation, 2-3
data marts, 2-6data mining
data structure for, 2-7functions, 2-13in Excel, 2-17
data structures, 2-5data warehouses
and business intelligence, 1-2building, 2-1defined, 1-2
data-driven formatting, 1-5DB2 data, 2-2development tools, 2-18dimensional data model, 2-4dimensions, 3-6
defined, 2-4Discoverer
see OracleBI Discovererdistributing reports, 1-21drilling, 2-10
example, 1-9
Ee-mail
ETL notifications, 2-3reports, 1-21, 2-21
ETL (extraction, transformation, and loading), 2-2EUL (End User Layer), 2-8, 3-8Excel, 1-20
Index-2
data mining in, 1-20, 2-17exporting to, 1-20OLAP data in, 1-20, 2-16
exception data, 1-8external data, 2-2
Ffacts, 2-4feature extraction data mining function, 2-13financial statements, 2-13forecasting, 1-14form letters, 2-13formatting
conditional, 1-5report components, 1-18stoplight, 1-5
FTP, 2-3
Ggauges
example, 1-4portlet for, 2-20
graphsdrilling, 1-10examples, 1-6
Hhierarchies
defined, 2-4OLAP, 3-6OLAP and relational, 2-9
IInformix data, 2-2interactive reports, 1-11, 1-19, 2-21invoices, 2-13
JJava beans, 2-18JSPs (Java Server Pages), 2-18
Llayout
changing, 1-11levels, 2-4, 3-6
Mmainframe data, 2-2Mapping Editor in OracleBI Warehouse Builder, 2-3mapping source data, 2-2market basket analysis, 1-17, 2-13measures, 2-4metadata
differences between OLAP and relational, 2-9
OLAP, 2-9relational, 2-8
models for forecasting, 1-14moving averages, 1-14
Nnames
cleansing, 2-2
OODBC data, 2-2OLAP (online analytical processing), 1-2
attributes, 3-6cubes, 3-6metadata, 2-9
OLAP Catalog, 2-9OLTP (online transaction processing), 2-3Oracle Application Server, 2-20Oracle Application Server Reports Services, 1-3Oracle Business Intelligence
components, 1-3packaging, A-1
Oracle Business Intelligence Toolspackaging, A-1
Oracle Data Miner, 1-3, 2-13Oracle Data Mining, 2-12
data mining functions, 2-13in Excel, 2-17
Oracle Database, 2-2Oracle Reports, 1-3
described, 2-13output options, 2-22
Oracle Spreadsheet Add-In for Predictive Analytics, 1-3, 1-20, 2-17
Oracle Transparent Gateways, 2-2OracleAS Portal, 1-19, 2-20OracleBI Beans, 1-3, 2-18OracleBI Discoverer Administrator, 1-3, 2-8OracleBI Discoverer example, 3-7OracleBI Discoverer Plus, 1-3, 2-14OracleBI Discoverer Portlet Provider, 1-3, 2-20OracleBI Discoverer Viewer, 1-3, 1-19
described, 2-21OracleBI Spreadsheet Add-In, 1-3, 1-20, 2-16OracleBI Warehouse Builder, 1-3, 2-1
Mapping Editor, 2-3
Pperformance, 2-11, 2-12
aggregation, 2-11pluggable data sources in Oracle Reports, 2-13Portlet Provider
see OracleBI Discoverer Portlet Providerportlets, 1-3predictive analysis, 1-16printing reports, 1-21process flows in OracleBI Warehouse Builder, 2-3
Index-3
Rranking data, 1-7regression data mining function, 2-13reports, 1-16
available formats, 1-18bursting, 1-21conditional formatting, 1-5dashboards, 1-19, 2-20distributing, 1-21drilling, 1-9, 1-10e-mailing, 1-21, 2-21, 2-22filtering data, 1-8forecasts, 1-14gauges, 1-4, 2-20graphs, 1-6in Excel, 1-20interactive, 1-9, 1-10, 1-11, 1-19, 2-21market basket analysis, 1-17, 2-13models, 1-14moving averages, 1-14performance, 2-12predicting customer behavior, 1-12printing, 1-21, 2-22publishing in XML, 1-21ranking data, 1-7scheduling, 1-21sharing, 1-18sorting data, 1-7stoplight formatting, 1-5tools for creating, 2-13trend analysis, 1-13what-if analysis, 1-15
Reports Builder, 2-13
SSAP data, 2-2scheduling reports, 1-21share calculations, 2-11, 2-12shipping labels, 2-13sorting data, 1-7source data, 2-1
mapping to target data, 2-2Spreadsheet Add-Ins
for predictive analytics, 2-17spreadsheets, 1-20, 2-16, 2-17SQL Server data, 2-2star schemas
described, 2-5OLAP metadata, 2-9
statistical functions in Oracle Database, 1-2stoplight formatting, 1-5summarization
OLAP and relational, 2-11Sybase data, 2-2
Ttarget data
mapping to source, 2-2
third normal form, 2-3, 2-5time-series analysis, 2-11, 2-12transactional data, 1-2
data model, 2-3trend analysis, 1-13
VViewer
see OracleBI Discoverer Viewer
WWarehouse Builder
see OracleBI Warehouse BuilderWeb servers, 2-19, 2-20what-if analysis, 1-15worksheets, 2-14
XXML
publishing reports, 1-21

Index-4