oral hygiene status in school adolescents: a study of...
TRANSCRIPT
474
IntroductionPopulation in the United Arab Emirates is estimated in 2014 to be 9.37 million and Dubai is the most populated city (2.1 million estimated). Dubai is home to a rapidly growing and diverse population with a large number of school-age children. The Dubai cultural mix is unique with estimates of over 75 percent of Dubai residents are expected to be expatriates. A strong majority of expatriate families move to Dubai before or after secondary education of their children and not during secondary education.
Health care policy and changes in health care policy are affected by the population of patients where such policy serves. When diverse populations change rapidly, health care policy is affected as well as access to health care. The oral health condition and needs of the school-age children in Dubai is virtually unknown. The incidence of oral hygiene levels and incidence of malocclusion provides the basis for an understanding for how the population is best served by the dental profession. Gingivitis, and more especially caries, is not the result of a single causative agent but the majority of studies of caries and of gingivitis in young children (where relationships may be clearest) in the Middle East have considered one or a relatively small number of factors. Epidemiological studies available in Dubai have attempted to describe the oral health status of mainly very young children. These surveys were carried out in schools where children were examined, and the available data regarding oral health status of Dubai based school age children are very scarce if not unknown.
A search of the related literature shows that there have been no studies on the prevalence of malocclusion on the Dubai
population. There have not been to date any studies that have used simplified Oral hygiene index (OHI-S) in populations. The aim of this study was to generate a baseline figure of the oral hygiene status of school-age children in Dubai specifically from ages 12 years to 17 years old; to compare and contrast oral hygiene status among several Middle East nationalities and south Asian nationalities. It is the hope of this study that the clearer picture of the oral health status of school aged children in Dubai is generated by this study. And this in mind, the National government of Dubai may be able to formulate basic guidelines for oral health services.
Literature ReviewA literature review on oral hygiene has been very limited to its correlation to periodontal disease and malocclusion. Thornton et al. concluded that plaque scores and periodontal disease levels were high among residents with mental retardation in a large traditional state institution, a small regional facility, and community group homes [1].
Shaw et al. reviewed the dental effects of malocclusion and indicated that the role of tooth malposition and periodontal disease was not clearly established [2]. Glickman and Manson pointed out numerous variables are considered predisposing and aggravate to gingival and periodontal disease [3,4]. Logically, bacterial plaque which is considered the major etiological factor in the development of chronic gingivitis may be more difficult to remove from malpositioned teeth, according to Loe et al., and that the greater patient dexterity required may not be achieved [5]. A number of studies have demonstrated a relationship between malocclusion and/or malposition of teeth and periodontal disease [6-10].
Oral Hygiene Status in School Adolescents: A study of 20,000 School-age Adolescents in 66 Public and Private Schools Comparing Oral Hygiene Status by Gender and EthnicityMohammed Al Nuaimi, Donald J. Ferguson, Anas Al-MullaDepartment of Orthodontics, European University College, Dubai Healthcare city, Block D, Bldg 27, office 302, PO Box. 53382, Dubai, UAE.
AbstractAims To compare and contrast oral health related data related to Simplified Oral hygiene index (OHI-S) in Dubai school-aged students as a function of the population demographics gender and ethnicity. Methods A total of 20,880 subjects were screened in 66 public and private school located in Dubai, United Arab Emirates. The study sample was grouped according to seven geographic regions. The total sample included 9,765 females and 11,115 males. Ages ranged from 9.08 years to 24.4 years with an overall mean age of 14.5 years. Calibrated dentists scored all subjects for Debri, Calculus and Simplified Oral hygiene index (OHI-S). Upon completion, statistical comparison of the study variables by region and gender was applied. Results Debri, calculus and OHI-S scores were calculated by Middle East and South Asia regions represented by countries with more than 100 subjects per country. OHI-S and debri scores were significantly higher in Middle East (0.90 and 0.78) subjects than South Asia (0.84 and 0.68, p=0.000). In contrast, Calculus score was higher in South Asia subjects compared to Middle East.Conclusions
• Middle East subjects averaged significantly higher debri and OHI-S scores when compared to South Asia subjects overall. • The highest debri score average was found in Middle East male (Egypt) and female (Palestine) subjects.• The highest calculus score average was found in South Asia male and female (both Bangladesh) subjects.• The highest OHI-S score average was found in South Asia male (Bangladesh) and female (Pakistan) subjects.
Debri and OHI-S scores were lowest for Middle East female Iran subjects.
Corresponding author: Anas Al-Mulla, Department of Orthodontics, European University College, Dubai Healthcare city, Block D, Bldg 27, office 302, PO Box. 53382, Dubai, UAE; Tel: +97-143-624-787, Extn-5035; Fax: 0097143624793; e-mail: [email protected]
475
OHDM - Vol. 13 - No. 2 - June, 2014
There have been numerous studies supporting the link between malocclusion and oral hygiene. Gabris assessed the prevalence of malocclusion, associated caries experience, and level of oral hygiene in the Hungarian population using the World health organization (WHO) questionnaire which was designed to assess dentofacial anomalies [11]. The author found visible plaque index (VPI) scores of the 340 adolescents with malocclusion significantly higher. Buckley reported crowding had a low but statistically significant correlation with plaque, calculus and gingival inflammation [12]. Ngom investigated the association between orthodontic anomalies and periodontal conditions and reported a weak but significant correlation between certain parameters of intraarch and interarch relationship and some indices of periodontal conditions [13].
Other studies, however, did not find such a link or association between malocclusion and with plaque, calculus
and gingival inflammation [14-20]. Many factors may account for these conflicting results [2,10]. In particular, gingival plaque and malocclusion scores have tended to be recorded as averages of whole mouth results and frequently there has been a failure to take into account individual tooth irregularities most likely to be associated with periodontal breakdown.
Some variables may mask any effect on plaque accumulation caused by tooth malposition alone. Ainamo suggested that the effect of tooth malposition was lost at the extremes of oral hygiene [21]. Furthermore, the author pointed out that distribution of plaque observed on different surfaces within the oral cavity would indicate that plaque removal by natural or mechanical cleansing is more difficult from some areas irrespective of the presence or absence of malpositioned teeth.
Ashley et al. demonstrated no evidence of a relationship between incisor overlap and amount of plaque in the study
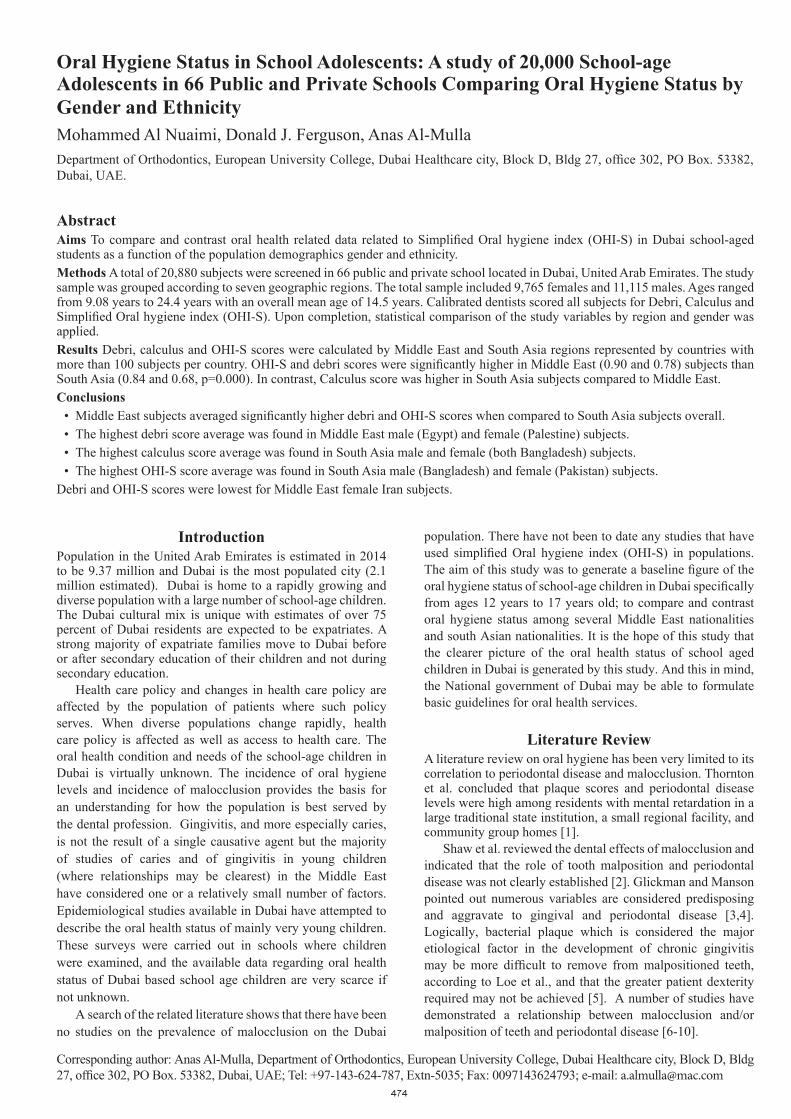
Geographic-Region N
AfricaSouth AsiaGreater AsiaMiddle EastEuropeAmericasAustralia & NZ
10777781
14911542
115170
4620880
Total sample: 20,880
Total sample
Figure 1. Study sample representing seven geographic regions of the world ranging from Australia-New Zealand (48 subjects) to Middle East (11,542 subjects).
AGE N Percent Mean SDGender Female 9765 46.8 14.55 2.02 Male 11115 53.2 14.54 2.10Total 20880 100.0 14.55 2.02
Geographic-Region Africa 1077 5.2 14.74 1.90 South Asia 7781 37.3 14.06 1.84 Greater Asia 149 0.7 14.67 1.59 Middle East 11542 55.3 14.86 2.08 Europe 115 0.6 14.33 1.83 Americas 170 0.8 14.36 1.76 Australia & NZ 46 0.2 13.92 1.78Total 20880 100.0 14.55 2.02
Cultural-Region Middle East 12022 58.6 14.84 2.07 South Asia 7610 37.3 14.06 1.84Total 19632 94.1 14.54 2.02
Table 1. Descriptive statistics of the study sample by age including sample number (N), percentage of sample (Percent), mean, and standard deviation (SD); breakdown is by gender, by Geographic-Region, and by Cultural-Region which comprised 94.1 percent of the total sample.
476
OHDM - Vol. 13 - No. 2 - June, 2014
subjects [22]. Griffiths found that the lower segments, whether aligned or malaligned, had significantly more plaque than upper anterior segments which were aligned or malaligned [23]. Ingervall demonstrated that in a group of young adults, crowding of teeth did not favor plaque accumulation on proximal tooth surfaces and crowding influenced the degree of gingival inflammation only to a minor extent [24]. Dalva evaluated the correlation between dental crowding and the periodontal index of gingival and plaque in development of gingivitis and concluded that dental crowding on the individuals examined was not a determining factor of gingivitis [25]. The purpose of this study was to compare and contrast oral health related data related to Simplified Oral hygiene index (OHI-S) in Dubai school-aged students as a function of the population demographics gender and ethnicity.
Materials and MethodsSampleSchool aged students were screened in 66 public and private schools in Dubai between 1 May 2008 and 2 February 2009. Selection criteria for subject Inclusion for this study included the following:
1) Enrolled in a public or private primary or secondary school in Dubai.
2) Permanent dentition generally.Specific criteria for subject exclusion for this study
included the following:1) Not enrolled in a public or private primary or secondary
school in Dubai, 2) Greater than 3 primary teeth present in the mouth, and 4) presence of fixed orthodontic appliances or history of orthodontic treatment.
A total of 20,880 subjects were screened in 66 public and private school located in Dubai, United Arab Emirates. The study sample was grouped according to seven geographic
regions as follows: Middle East (11,542 or 55.3%), South Asia (7,781 or 37.3%), Africa (1077 or 5.2%), Americas (170 or 0.8%), Greater Asia (149 or 0.7%), and Europe (115 or 0.6%), and Australia/New Zealand (46 or 0.2%). Overall, 19,323 (92.5%) of the sample subjects were from the geographic regions of Middle East and South Asia (Figure 1).
The total sample of 20,880 subjects included 9,765 females and 11,115 males. Ages ranged from 9.08 years to 24.42 years with an overall mean age of 14.55 + 2.02 years; average age of females (14.55 years) was nearly identical to males (14.54 years).The sample was then redistributed according to cultural region or identity wherein northern Africa countries (Egypt, Algeria, Libya, and Morocco) were moved from Africa to the Middle East to create a “Cultural-Region” Middle East sample. Finally, the “Cultural-Region” category was further restricted by including only countries represented by 100 study subjects; this resulted in only Egypt being added to the Middle East category. Final sample size for Middle East was 12,022 or 57.6% of initial sample and for South Asia was 7,610 or 36.5% of initial sample; combined Middle East and South Asia sample comprised 19,632 or 94.1% of total initial sample screened. This “right-sizing” method was performed to make statistical testing more reasonable and remainder of testing was based upon a 19,632 sample size (Table 1).ProceduresEthical clearance for this study was obtained from the Research Committee of European University College. Permission to participate in the study was first granted from the public and private schools. At the schools where permission was granted, a participant information statement explaining the study written in the local language of Arabic and English was distributed to the students, and a questionnaire regarding social data on the child and family was sent to parents for completion.
A B
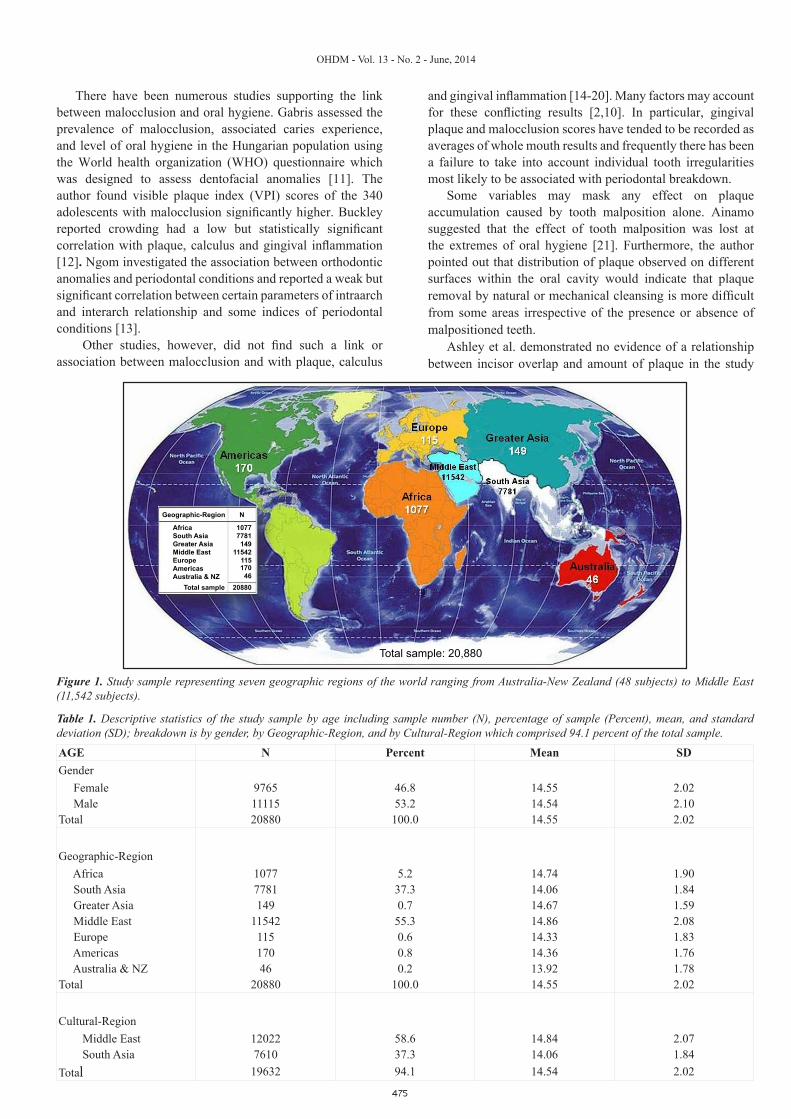
Figure 2. Screening form used to collect OHI-S data by calibrated school screeners (A) and diagram illustrating how the plaque and calculus scores were derived (B) 0=none, 1 ≤ 1/3rd surface covered, 2 ≥ 1/3rd but <2/3rds, and 3 ≥ 2/3rds surface covered.
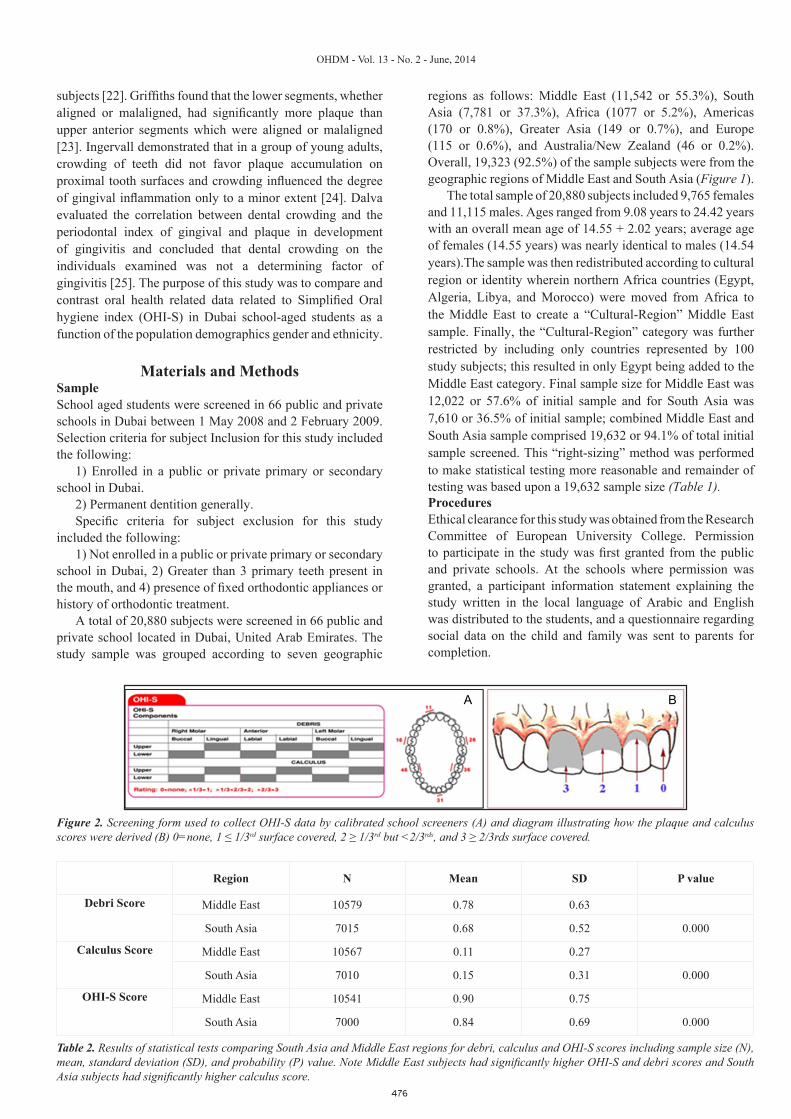
Table 2. Results of statistical tests comparing South Asia and Middle East regions for debri, calculus and OHI-S scores including sample size (N), mean, standard deviation (SD), and probability (P) value. Note Middle East subjects had significantly higher OHI-S and debri scores and South Asia subjects had significantly higher calculus score.
Region N Mean SD P value
Debri Score
Middle East 10579 0.78 0.63
South Asia 7015 0.68 0.52 0.000
Calculus Score
Middle East 10567 0.11 0.27
South Asia 7010 0.15 0.31 0.000
OHI-S Score
Middle East 10541 0.90 0.75
South Asia 7000 0.84 0.69 0.000
477
OHDM - Vol. 13 - No. 2 - June, 2014
In order to ensure data quality, all examinations were carried out by five licensed dentists-screeners. Training and calibration of the screeners initially were performed in the Dubai schools where the supervisor and the screeners jointly examined the subjects and discussed the findings. This process continued until examiner reliability was achieved. Following multiple calibration sessions, the five school screeners licensed to practice dentistry in Dubai examined students for Oral hygiene – simplified (OHI-S) parameters using a screening form developed to record and document OHI-S findings (Figure 2A).
The Simplified Oral hygiene index (OHI-S) utilized six tooth surfaces for scoring, four posterior and two anterior teeth [26]. In the posterior portion of the dentition, the first fully erupted tooth distal to the second bicuspid, usually the first molar but sometimes the second or third molar was examined. The buccal surfaces of the selected upper molars and the lingual surfaces of the selected lower molars were inspected. In the anterior portion of the mouth, the labial surfaces of the upper right and the lower left central incisors were scored. In the absence of either of these anterior teeth, the central incisor on the opposite side of the midline was used (Figure 2A).
The scoring system of the OHI-S consists of two components, the debris (plaque) index and the calculus index. Plaque is defined as a soft matter adhering to the tooth surface and consisting of bacteria in a matrix of bacterial and salivary polymers and cell remnants. Scoring was done after staining the teeth for plaque exposure with an erythrosin-based disclosing solution (FD & C Red Dye No. 3). Disclosing solution is typically not used in the OHI-S scoring but was used in this study to expedite scoring by enhancing the visual examination for plaque. A cotton pellet was saturated with the solution, then gently applied to the teeth.
The scoring for plaque was done according to the following criteria: 0 = no debris or stain present; 1 = soft
debris not covering more than one-third of the tooth surface being examined; 2 = soft debris covering more than one-third, but not more than two-thirds, of the exposed tooth surface; 3 = soft debris covering more than two-thirds of the exposed tooth surface (Figure 2B).
Calculus is a hard deposit of inorganic salts mixed in an organic matrix. There are two types of calculus differentiated by location: supragingival calculus above the gingival margin; and subgingival calculus below the gingival margin. Calculus was scored in the same manner as plaque, based on the extent of supragingival calculus coverage over the tooth surface (Figure 2B).
After scores for the plaque and calculus were recorded, index values were calculated by totaling the scores and dividing the sum by the number of sites examined. At least two of the six possible surfaces must have been examined for an individual score to be calculated. The average individual or group score is known as the Simplified debris index (DI-S). The same method was used to obtain the calculus scores or the Simplified calculus index (CI-S). The average individual or group debris scores plus the calculus scores were combined
Figure 3. Results of statistical tests comparing South Asia and Middle East regions for debri, calculus and OHI-S scores including sample size (N), mean, standard deviation (SD), and probability (P)
value. Note Middle East subjects had significantly higher OHI-S and debri scores and South Asia subjects had significantly higher
calculus score.
Gender N Mean SD P value
Debri Female 8057 0.67 0.56Male 9888 0.80 0.61 0.000
Calculus Female 8053 0.12 0.28Male 9875 0.14 0.29 0.006
OHI-SFemale 8034 0.80 0.70Male 9858 0.94 0.74 0.000
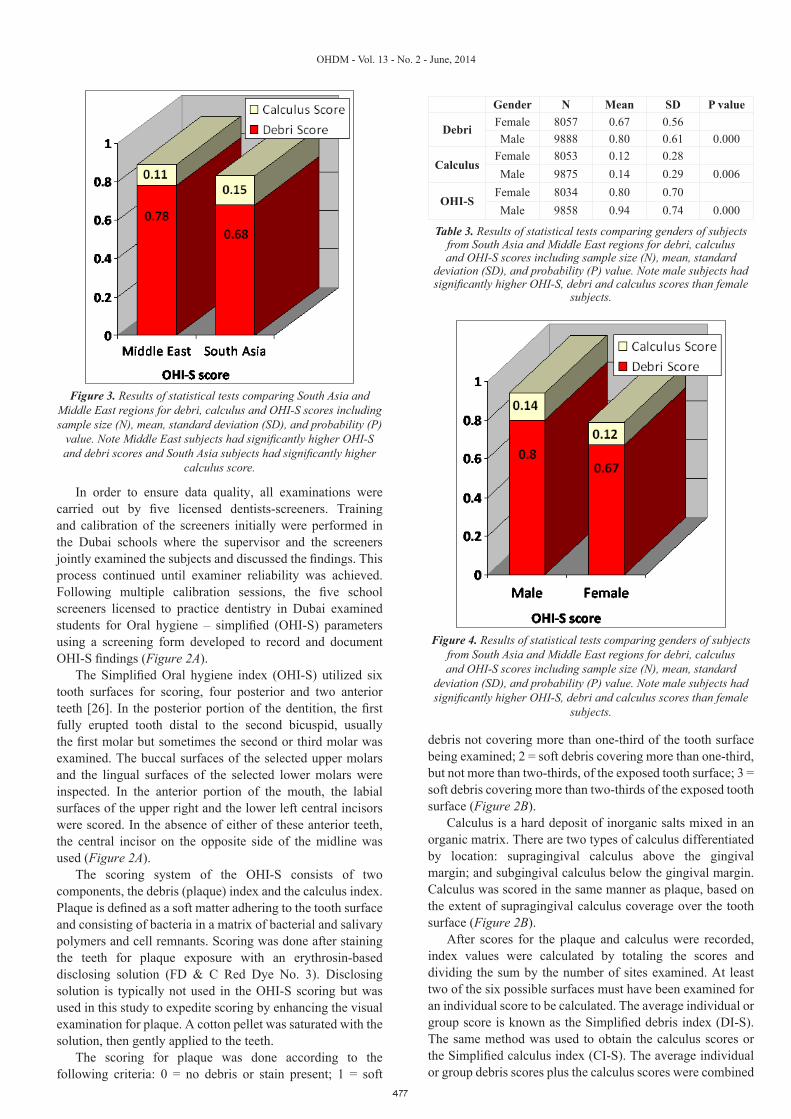
Table 3. Results of statistical tests comparing genders of subjects from South Asia and Middle East regions for debri, calculus and OHI-S scores including sample size (N), mean, standard
deviation (SD), and probability (P) value. Note male subjects had significantly higher OHI-S, debri and calculus scores than female
subjects.
Figure 4. Results of statistical tests comparing genders of subjects from South Asia and Middle East regions for debri, calculus and OHI-S scores including sample size (N), mean, standard
deviation (SD), and probability (P) value. Note male subjects had significantly higher OHI-S, debri and calculus scores than female
subjects.

478
OHDM - Vol. 13 - No. 2 - June, 2014
to obtain the Simplified Oral Hygiene Index. The CI-S and DI-S values may range from 0 to 3 and the overall OHI-S score ranged from 0 to 6.
The five study screeners were required to read WHO instructions on scoring by using the Simplified Oral hygiene index [27]. Classroom instruction was presented by PowerPoint showing appropriate intra-oral views of patients and screeners were asked to score using the OHI-S Index form (Figure 2). At the end of each case scoring session, score sheets were gathered and reviewed; results were discussed with the 5 screeners by identifying which scores were different from the others. Consensus scoring agreement was reached by the group for each case before scoring the next 4 cases. A week later, all screeners together scored sequentially 5 different patient cases presented by PowerPoint followed by discussion
compared to Middle East (0.11, p=0.000) subjects (Table 2 and Figure 3).
Debri, calculus and OHI-S scores were calculated by gender for subjects with the Middle East and South Asia regions represented by countries with more than 100 subjects per country. Males showed significantly increased values in all three scores (Table 3 and Figure 4).
Debri, calculus and OHI-S scores were calculated by gender-region. OHI-S score was significantly higher for males than for females regardless of region; OHI-S score for Middle East male (0.97) and South Asia male (0.88) subjects were significantly higher than their female (0.80 and 0.80, p<0.001) counterparts, respectfully. The same was true from debri scores; Middle East male (0.86) and South Asia male (0.72) subjects were significantly higher than their female
Score Gender-Region N Mean SD P value
Debri
Female- ME 4577 0.69 0.60 p<0.001 vs M-ME & F-SAMale - ME 6002 0.85 0.64 p=0.000 vs all others
Female - SA 3326 0.64 0.50 p<0.001 vs all othersMale-SA 3689 0.72 0.54 p=0.001 vs M-ME & F-SA
Calculus
Female- ME 4573 0.10 0.25 p<0.005 vs all othersMale - ME 5994 0.12 0.27 p<0.005 vs all others
Female - SA 3326 0.15 0.30 p=0.001 vs M-ME & F-MEMale-SA 3684 0.16 0.31 p=0.001 vs M-ME & F-ME
OHI-S
Female- ME 4559 0.80 0.72 p=0.000 vs M-ME & M-SAMale - ME 5982 0.97 0.76 p=0.000 vs all others
Female - SA 3321 0.80 0.67 p=0.000 vs M-ME & M-SAMale-SA 3679 0.88 0.71 p=0.000 vs all others
Table 4. Results of statistical tests comparing gender-regions for debri, calculus and OHI-S scores including sample size (N), mean, standard deviation (SD), and probability (P) value. Note male subjects had significantly higher OHI-S and debri scores and South Asia males and female
subjects had significantly higher calculus score.
Figure 5. Results of statistical tests comparing gender-regions for debri, calculus and OHI-S scores including sample size (N), mean,
standard deviation (SD), and probability (P) value. Note male subjects had significantly higher OHI-S and debri scores and South
Asia males and female subjects had significantly higher calculus score.
of deviating scores on each case and consensus agreement. On the third session a week later, all screeners were tested by scoring 5 different cases without any discussion; score sheets were statistically compared using the Dahlberg reliability formula with results demonstrating less than 5% deviation for each of the scoring parameters. After two months of screening students in schools, the calibration exercise was repeated using 2 different patient cases presented by PowerPoint with same scoring parameters outcome (<5%).Statistical analysisThe data initially collected on screening forms was de-personalized and transferred to Excel spreadsheet format prior to converting to SPSS format for data processing. Using SPSS software, inter-group comparisons for OHI-S scores were made on the basis of ethnicity using non-parametric Mann-Whitney U and Kruskal Wallis H-testing. All tests of significance were completed at the 0.05 level.
ResultsDebri, calculus and OHI-S scores were calculated by Middle East and South Asia regions represented by countries with more than 100 subjects per country. OHI-S and debri scores were significantly higher in Middle East (0.90 and 0.78) subjects than South Asia (0.84 and 0.68, p=0.000). In contrast, Calculus score was higher in South Asia (0.15) subjects
479
OHDM - Vol. 13 - No. 2 - June, 2014
Score South Asia N Mean SD P value
Debri
India 5429 0.67 0.52 p<0.041 vs Filipino & PakistanPhilippine 422 0.75 0.52 p=0.024 vs IndiaPakistan 1029 0.72 0.54 p=0.041 vs India
Bangladesh 135 0.77 0.58
Calculus
India 5426 0.15 0.30Philippine 420 0.13 0.26Pakistan 1029 0.17 0.32
Bangladesh 135 0.21 0.38
OHI-S
India 5419 0.82 0.69 p=0.024 vs PakistanPhilippine 419 0.88 0.66Pakistan 1027 0.89 0.71 p=0.024 vs India
Bangladesh 135 0.97 0.83
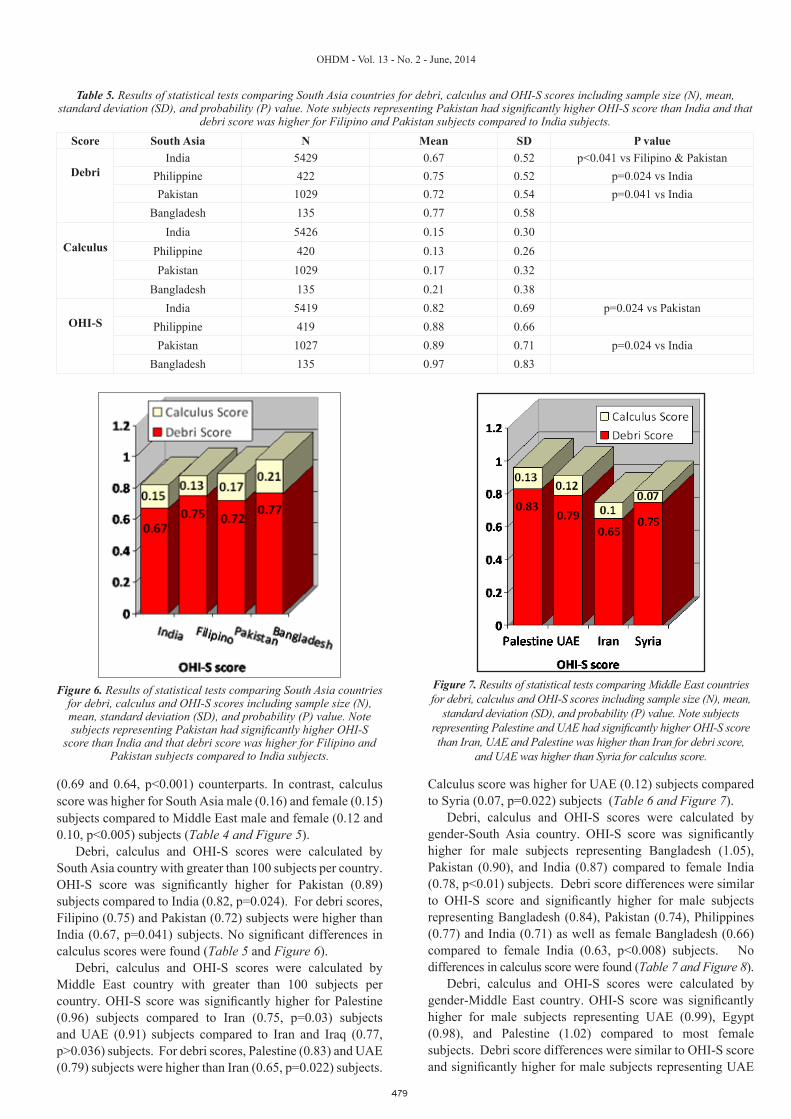
Table 5. Results of statistical tests comparing South Asia countries for debri, calculus and OHI-S scores including sample size (N), mean, standard deviation (SD), and probability (P) value. Note subjects representing Pakistan had significantly higher OHI-S score than India and that
debri score was higher for Filipino and Pakistan subjects compared to India subjects.
Figure 6. Results of statistical tests comparing South Asia countries for debri, calculus and OHI-S scores including sample size (N), mean, standard deviation (SD), and probability (P) value. Note subjects representing Pakistan had significantly higher OHI-S
score than India and that debri score was higher for Filipino and Pakistan subjects compared to India subjects.
Figure 7. Results of statistical tests comparing Middle East countries for debri, calculus and OHI-S scores including sample size (N), mean,
standard deviation (SD), and probability (P) value. Note subjects representing Palestine and UAE had significantly higher OHI-S score than Iran, UAE and Palestine was higher than Iran for debri score,
and UAE was higher than Syria for calculus score.
(0.69 and 0.64, p<0.001) counterparts. In contrast, calculus score was higher for South Asia male (0.16) and female (0.15) subjects compared to Middle East male and female (0.12 and 0.10, p<0.005) subjects (Table 4 and Figure 5).
Debri, calculus and OHI-S scores were calculated by South Asia country with greater than 100 subjects per country. OHI-S score was significantly higher for Pakistan (0.89) subjects compared to India (0.82, p=0.024). For debri scores, Filipino (0.75) and Pakistan (0.72) subjects were higher than India (0.67, p=0.041) subjects. No significant differences in calculus scores were found (Table 5 and Figure 6).
Debri, calculus and OHI-S scores were calculated by Middle East country with greater than 100 subjects per country. OHI-S score was significantly higher for Palestine (0.96) subjects compared to Iran (0.75, p=0.03) subjects and UAE (0.91) subjects compared to Iran and Iraq (0.77, p>0.036) subjects. For debri scores, Palestine (0.83) and UAE (0.79) subjects were higher than Iran (0.65, p=0.022) subjects.
Calculus score was higher for UAE (0.12) subjects compared to Syria (0.07, p=0.022) subjects (Table 6 and Figure 7).
Debri, calculus and OHI-S scores were calculated by gender-South Asia country. OHI-S score was significantly higher for male subjects representing Bangladesh (1.05), Pakistan (0.90), and India (0.87) compared to female India (0.78, p<0.01) subjects. Debri score differences were similar to OHI-S score and significantly higher for male subjects representing Bangladesh (0.84), Pakistan (0.74), Philippines (0.77) and India (0.71) as well as female Bangladesh (0.66) compared to female India (0.63, p<0.008) subjects. No differences in calculus score were found (Table 7 and Figure 8).
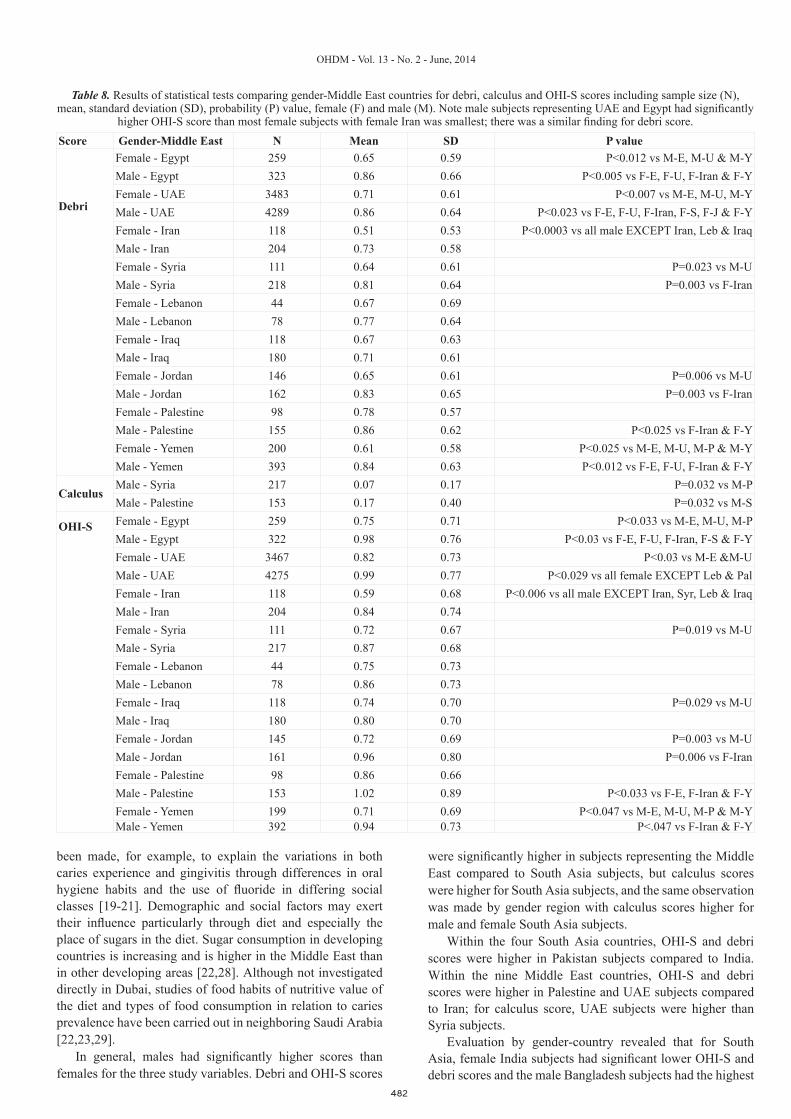
Debri, calculus and OHI-S scores were calculated by gender-Middle East country. OHI-S score was significantly higher for male subjects representing UAE (0.99), Egypt (0.98), and Palestine (1.02) compared to most female subjects. Debri score differences were similar to OHI-S score and significantly higher for male subjects representing UAE

480
OHDM - Vol. 13 - No. 2 - June, 2014
Highest and smallest scores per gender-country were identified for each of the three study variables. For debri score, highest male was UAE and Egypt (both 0.86) and highest female was Palestine (0.78); smallest male was India (0.71) and smallest female was Iran (0.51). For calculus score, highest male was Bangladesh (0.21) and highest female was Bangladesh (0.20); smallest male was Syria (0.07) and smallest female was (Iraq). For OHI-S score, highest male was Bangladesh (1.05) and highest female was Pakistan (0.87); smallest male was Iraq (0.80) and smallest female was in Iran (0.59) subjects (Figure 11).
DiscussionTooth brushing is considered as the most reliable means of plaque control provided thorough and regular cleaning is accomplished. Nowadays, a wide variation of tooth brush designs, brushing techniques, frequency, and times of tooth brushing are taught; the oral hygiene habits of the school age children are reflected in oral hygiene instruction.
An individual was considered to have good oral hygiene when he presented a clean mouth without accumulations of debris around the crowns of the teeth. Since, toothbrushing information was not solicited from the subjects, oral hygiene
(0.86), Egypt (0.86), and Palestine (0.86) compared to most female subjects. The only significantly different calculus score was male Palestine (0.17) subjects was significantly different from male Syria (0.07) subjects (Table 8 and Figure 9).
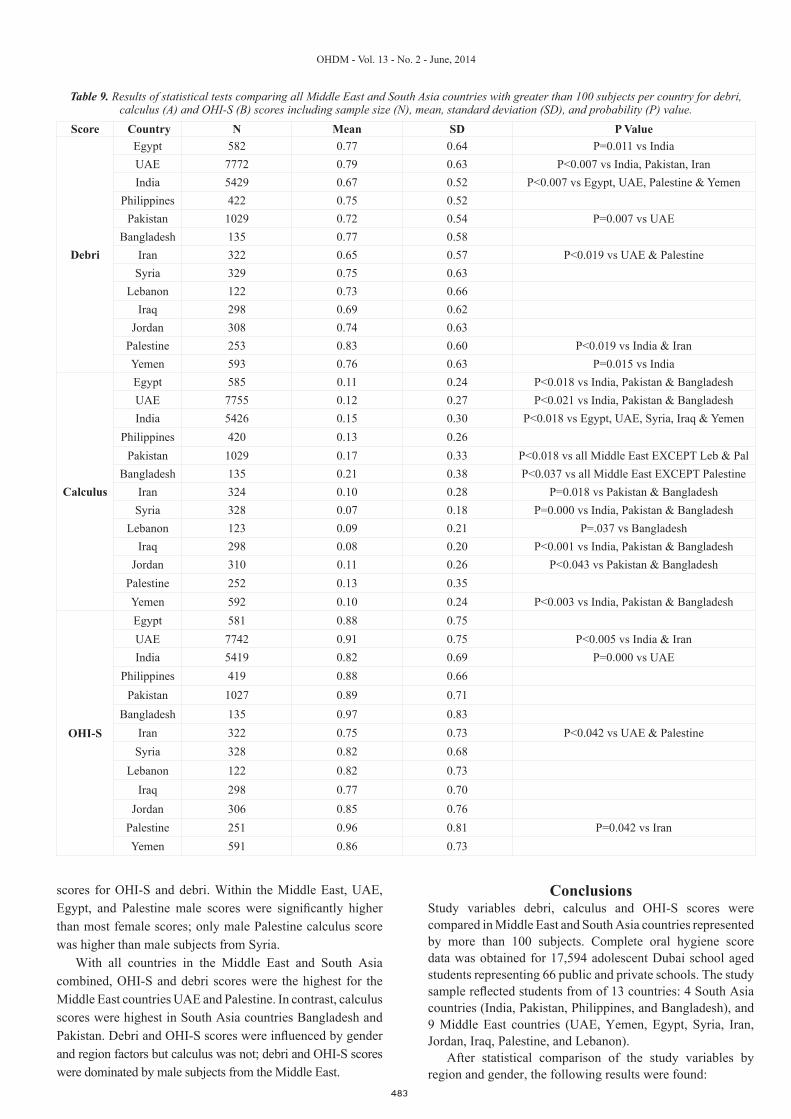
Debri, calculus and OHI-S scores were compared for all Middle East and South Asia countries represented by more than 100 subjects per country. OHI-S scores for Palestine (0.96) and UAE (0.91) subjects were significantly higher than India (0.82) and Iran (0.75) subject scores. In general, debri scores were similar to OHI-S scores with Palestine (0.83) and UAE (0.79) subject scores higher than India (0.67) and Iran (0.65) subject scores. South Asia calculus scores for Bangladesh (0.21) and Pakistan (0.17) subjects were significantly higher than most Middle East country scores including UAE (0.12) and Syria (0.07) subjects (Table 9, Figure 10A and 10B).
The 3 study variables, debri, calculus and OHI-S scores, were compared by gender-country with all Middle East and South Asia countries combined. Univariate analysis of variance was used to examine how the factors region (Middle East vs South Asia), gender (male vs female), and country (13 countries of the sample) explained the results. Testing results demonstrated that the combination factor gender-region explained differences (p=0.000) in debri and OHI-S scores but not calculus score.
Score Middle East N Mean SD P value
Debri
Egypt 582 0.77 0.64UAE 7772 0.79 0.63 P=0.002 vs IranIran 322 0.65 0.57 P<0.022 vs UAE & PalestineSyria 329 0.75 0.63Lebanon 122 0.73 0.66Iraq 298 0.69 0.62Jordan 308 0.74 0.63Palestine 253 0.83 0.60 P=0.022 vs IranYemen 593 0.76 0.63
Calculus
Egypt 585 0.11 0.24UAE 7755 0.12 0.27 P=0.022 vs SyriaIran 324 0.10 0.28Syria 328 0.07 0.18 P=0.022 vs SyriaLebanon 123 0.09 0.21Iraq 298 0.08 0.20Jordan 310 0.11 0.26Palestine 252 0.13 0.35Yemen 592 0.10 0.24
OHI-S
Egypt 581 0.88 0.75UAE 7742 0.91 0.75 P<0.036 vs Iraq & IranIran 322 0.75 0.73 P<0.03 vs UAE & PalestineSyria 328 0.82 0.68Lebanon 122 0.82 0.73Iraq 298 0.77 0.70 P=0.036 vs UAEJordan 306 0.85 0.76Palestine 251 0.96 0.81 P=0.03 vs IranYemen 591 0.86 0.73
Table 6. Results of statistical tests comparing Middle East countries for debri, calculus and OHI-S scores including sample size (N), mean, standard deviation (SD), and probability (P) value. Note subjects representing Palestine and UAE had significantly higher OHI-S score than Iran,
UAE and Palestine was higher than Iran for debri score, and UAE was higher than Syria for calculus score.

481
OHDM - Vol. 13 - No. 2 - June, 2014
status at time of examination in the present study was likely due to mechanical self-cleansing factors, such as type of dental arch, tooth form, and type of food consumed.
The role of diet and plaque as direct causes of oral disease has been extensively reported. It is also widely accepted that
oral health status is closely linked to socioeconomic factors that are understood to be strongly associated with oral health knowledge, attitudes and behaviors [13-18]. Attempts have
Score Gender-South Asia N Mean SD P value
Debri
Female-India 2584 0.63 0.50 P<0.008 vs M-I, M-F, M&F-BMale-India 2845 0.71 0.53 P=0.000 vs M-IFemale-Philippines 187 0.71 0.50Male-Philippines 235 0.77 0.54 P=0.001 vs F-IFemale-Pakistan 499 0.69 0.52Male-Pakistan 530 0.74 0.56 P=0.000 vs F-IFemale-Bangladesh 56 0.66 0.53Male-Bangladesh 79 0.84 0.61 P=0.008 vs F-I
Calculus
Female-India 2584 0.15 0.29Male-India 2842 0.16 0.31Female-Philippines 187 0.14 0.27Male-Philippines 233 0.13 0.26Female-Pakistan 499 0.18 0.34Male-Pakistan 530 0.15 0.31Female-Bangladesh 56 0.20 0.37Male-Bangladesh 79 0.21 0.39
OHI-S
Female-India 2580 0.78 0.66 P<0.01 vs M-I, M-P, M-BMale-India 2839 0.87 0.70 P=0.000 vs F-IFemale-Philippines 187 0.85 0.64Male-Philippines 232 0.90 0.67Female-Pakistan 498 0.87 0.70Male-Pakistan 529 0.90 0.72 P=0.004 vs F-IFemale-Bangladesh 56 0.86 0.79Male-Bangladesh 79 1.05 0.85 P=0.01 vs F-I
Table 7. Results of statistical tests comparing Middle East countries for debri, calculus and OHI-S scores including sample size (N), mean, standard deviation (SD), and probability (P) value. Note subjects representing Palestine and UAE had significantly higher OHI-S score than Iran,
UAE and Palestine was higher than Iran for debri score, and UAE was higher than Syria for calculus score.
Figure 8. Results of statistical tests comparing Middle East countries for debri, calculus and OHI-S scores including sample size (N), mean,
standard deviation (SD), and probability (P) value. Note subjects representing Palestine and UAE had significantly higher OHI-S score than Iran, UAE and Palestine was higher than Iran for debri score,
and UAE was higher than Syria for calculus score.
Figure 9. Results of statistical tests comparing gender-Middle East countries for debri, calculus and OHI-S scores including sample size (N), mean, standard deviation (SD), probability (P) value, female (F) and male (M). Note male subjects representing UAE
and Egypt had significantly higher OHI-S score than most female subjects with female Iran was smallest; there was a similar finding
for debri score.
482
OHDM - Vol. 13 - No. 2 - June, 2014
been made, for example, to explain the variations in both caries experience and gingivitis through differences in oral hygiene habits and the use of fluoride in differing social classes [19-21]. Demographic and social factors may exert their influence particularly through diet and especially the place of sugars in the diet. Sugar consumption in developing countries is increasing and is higher in the Middle East than in other developing areas [22,28]. Although not investigated directly in Dubai, studies of food habits of nutritive value of the diet and types of food consumption in relation to caries prevalence have been carried out in neighboring Saudi Arabia [22,23,29].
In general, males had significantly higher scores than females for the three study variables. Debri and OHI-S scores
were significantly higher in subjects representing the Middle East compared to South Asia subjects, but calculus scores were higher for South Asia subjects, and the same observation was made by gender region with calculus scores higher for male and female South Asia subjects.
Within the four South Asia countries, OHI-S and debri scores were higher in Pakistan subjects compared to India. Within the nine Middle East countries, OHI-S and debri scores were higher in Palestine and UAE subjects compared to Iran; for calculus score, UAE subjects were higher than Syria subjects.
Evaluation by gender-country revealed that for South Asia, female India subjects had significant lower OHI-S and debri scores and the male Bangladesh subjects had the highest
Score Gender-Middle East N Mean SD P value
Debri
Female - Egypt 259 0.65 0.59 P<0.012 vs M-E, M-U & M-YMale - Egypt 323 0.86 0.66 P<0.005 vs F-E, F-U, F-Iran & F-YFemale - UAE 3483 0.71 0.61 P<0.007 vs M-E, M-U, M-YMale - UAE 4289 0.86 0.64 P<0.023 vs F-E, F-U, F-Iran, F-S, F-J & F-YFemale - Iran 118 0.51 0.53 P<0.0003 vs all male EXCEPT Iran, Leb & IraqMale - Iran 204 0.73 0.58Female - Syria 111 0.64 0.61 P=0.023 vs M-UMale - Syria 218 0.81 0.64 P=0.003 vs F-IranFemale - Lebanon 44 0.67 0.69Male - Lebanon 78 0.77 0.64Female - Iraq 118 0.67 0.63Male - Iraq 180 0.71 0.61Female - Jordan 146 0.65 0.61 P=0.006 vs M-UMale - Jordan 162 0.83 0.65 P=0.003 vs F-IranFemale - Palestine 98 0.78 0.57Male - Palestine 155 0.86 0.62 P<0.025 vs F-Iran & F-YFemale - Yemen 200 0.61 0.58 P<0.025 vs M-E, M-U, M-P & M-YMale - Yemen 393 0.84 0.63 P<0.012 vs F-E, F-U, F-Iran & F-Y
CalculusMale - Syria 217 0.07 0.17 P=0.032 vs M-PMale - Palestine 153 0.17 0.40 P=0.032 vs M-S
OHI-S
Female - Egypt 259 0.75 0.71 P<0.033 vs M-E, M-U, M-PMale - Egypt 322 0.98 0.76 P<0.03 vs F-E, F-U, F-Iran, F-S & F-YFemale - UAE 3467 0.82 0.73 P<0.03 vs M-E &M-UMale - UAE 4275 0.99 0.77 P<0.029 vs all female EXCEPT Leb & PalFemale - Iran 118 0.59 0.68 P<0.006 vs all male EXCEPT Iran, Syr, Leb & IraqMale - Iran 204 0.84 0.74Female - Syria 111 0.72 0.67 P=0.019 vs M-UMale - Syria 217 0.87 0.68Female - Lebanon 44 0.75 0.73Male - Lebanon 78 0.86 0.73Female - Iraq 118 0.74 0.70 P=0.029 vs M-UMale - Iraq 180 0.80 0.70Female - Jordan 145 0.72 0.69 P=0.003 vs M-UMale - Jordan 161 0.96 0.80 P=0.006 vs F-IranFemale - Palestine 98 0.86 0.66Male - Palestine 153 1.02 0.89 P<0.033 vs F-E, F-Iran & F-YFemale - Yemen 199 0.71 0.69 P<0.047 vs M-E, M-U, M-P & M-YMale - Yemen 392 0.94 0.73 P<.047 vs F-Iran & F-Y
Table 8. Results of statistical tests comparing gender-Middle East countries for debri, calculus and OHI-S scores including sample size (N), mean, standard deviation (SD), probability (P) value, female (F) and male (M). Note male subjects representing UAE and Egypt had significantly
higher OHI-S score than most female subjects with female Iran was smallest; there was a similar finding for debri score.
483
OHDM - Vol. 13 - No. 2 - June, 2014
Score Country N Mean SD P Value
Debri
Egypt 582 0.77 0.64 P=0.011 vs IndiaUAE 7772 0.79 0.63 P<0.007 vs India, Pakistan, IranIndia 5429 0.67 0.52 P<0.007 vs Egypt, UAE, Palestine & Yemen
Philippines 422 0.75 0.52Pakistan 1029 0.72 0.54 P=0.007 vs UAE
Bangladesh 135 0.77 0.58Iran 322 0.65 0.57 P<0.019 vs UAE & Palestine
Syria 329 0.75 0.63Lebanon 122 0.73 0.66
Iraq 298 0.69 0.62Jordan 308 0.74 0.63
Palestine 253 0.83 0.60 P<0.019 vs India & IranYemen 593 0.76 0.63 P=0.015 vs India
Calculus
Egypt 585 0.11 0.24 P<0.018 vs India, Pakistan & BangladeshUAE 7755 0.12 0.27 P<0.021 vs India, Pakistan & BangladeshIndia 5426 0.15 0.30 P<0.018 vs Egypt, UAE, Syria, Iraq & Yemen
Philippines 420 0.13 0.26Pakistan 1029 0.17 0.33 P<0.018 vs all Middle East EXCEPT Leb & Pal
Bangladesh 135 0.21 0.38 P<0.037 vs all Middle East EXCEPT PalestineIran 324 0.10 0.28 P=0.018 vs Pakistan & Bangladesh
Syria 328 0.07 0.18 P=0.000 vs India, Pakistan & BangladeshLebanon 123 0.09 0.21 P=.037 vs Bangladesh
Iraq 298 0.08 0.20 P<0.001 vs India, Pakistan & BangladeshJordan 310 0.11 0.26 P<0.043 vs Pakistan & Bangladesh
Palestine 252 0.13 0.35Yemen 592 0.10 0.24 P<0.003 vs India, Pakistan & Bangladesh
OHI-S
Egypt 581 0.88 0.75UAE 7742 0.91 0.75 P<0.005 vs India & IranIndia 5419 0.82 0.69 P=0.000 vs UAE
Philippines 419 0.88 0.66Pakistan 1027 0.89 0.71
Bangladesh 135 0.97 0.83Iran 322 0.75 0.73 P<0.042 vs UAE & Palestine
Syria 328 0.82 0.68Lebanon 122 0.82 0.73
Iraq 298 0.77 0.70Jordan 306 0.85 0.76
Palestine 251 0.96 0.81 P=0.042 vs IranYemen 591 0.86 0.73
Table 9. Results of statistical tests comparing all Middle East and South Asia countries with greater than 100 subjects per country for debri, calculus (A) and OHI-S (B) scores including sample size (N), mean, standard deviation (SD), and probability (P) value.
scores for OHI-S and debri. Within the Middle East, UAE, Egypt, and Palestine male scores were significantly higher than most female scores; only male Palestine calculus score was higher than male subjects from Syria.
With all countries in the Middle East and South Asia combined, OHI-S and debri scores were the highest for the Middle East countries UAE and Palestine. In contrast, calculus scores were highest in South Asia countries Bangladesh and Pakistan. Debri and OHI-S scores were influenced by gender and region factors but calculus was not; debri and OHI-S scores were dominated by male subjects from the Middle East.
ConclusionsStudy variables debri, calculus and OHI-S scores were compared in Middle East and South Asia countries represented by more than 100 subjects. Complete oral hygiene score data was obtained for 17,594 adolescent Dubai school aged students representing 66 public and private schools. The study sample reflected students from of 13 countries: 4 South Asia countries (India, Pakistan, Philippines, and Bangladesh), and 9 Middle East countries (UAE, Yemen, Egypt, Syria, Iran, Jordan, Iraq, Palestine, and Lebanon).
After statistical comparison of the study variables by region and gender, the following results were found:

484
OHDM - Vol. 13 - No. 2 - June, 2014
Figures 10A & 10B. Results of statistical tests comparing all Middle East and South Asia countries with greater than 100 subjects per country for debri, calculus (A) and OHI-S (B) scores including sample size (N), mean, standard deviation (SD), and probability (P) value. Note that
Palestine and UAE subjects had significantly higher OHI-S (Figure B) scores than India and Iran subjects and the finding was similar for debri scores. Calculus (Figure A) scores were higher for South Asia countries Bangladesh and Pakistan compared to subjects from most Middle East
countries.
Figures 11 A, 11B & 11C. Univariate anova testing demonstrated that differences in debri (A) and OHI-S (C) scores were explained by gender-region but in calculus (B) score differences. Graphic representation of the largest and smallest scores by gender for each of the 3 study variables
are illustrated; note that the distribution of scores for debri and OHI-S follow a different pattern than calculus score distribution.
1. Middle East subjects averaged significantly higher debri and OHI-S scores when compared to South Asia subjects overall.
2. The highest debri score average was found in Middle East male (Egypt) and female (Palestine) subjects.
3. The highest calculus score average was found in South Asia male and female (both Bangladesh) subjects.
4. The highest OHI-S score average was found in South Asia male (Bangladesh) and female (Pakistan) subjects.
5. Debri and OHI-S scores were lowest for Middle East female Iran subjects.
In Dubai public schools, it may be concluded that oral hygiene status as measured by debri score is poorest in male students from the Middle East. Although calculus contributes substantially less to the overall oral hygiene (OHI-S) score, calculus formation is higher in South Asia students. Overall oral hygiene, as measured by OHI-S score, is higher in Middle East male students, especially male students from UAE, Egypt, and Palestine.
References1. Thornton JB, Al-Zahid S, Campbell VA, Marchetti A, Bradley
EL Jr. Oral hygiene levels and periodontal disease prevalence among residents with mental retardation at various residential settings. Special Care in Dentistry. 1989; 9: 186-190.
2. Shaw WC, Addy M, Ray C. Dental and social effects of malocclusion and effectiveness of orthodontic treatment. A review. Community Dentistry and Oral Epidemiology. 1980; 8: 36-45.
3. Glickman I. Clinical periodontology. (4th Edn.) Philadelphia:
Saunders. 1972; pp. 344-364. 4. Manson JD. Periodontics. (3rd Edn.) London: Henry Kimpton.
1975; pp. 38-39.5. Loe H, Theilade E, Jensen SB. Experimental gingivitis in man.
Journal of Periodontology. 1965; 36: 177-187.6. Hellgren A. Association between crowding of the teeth and
gingivitis. Transactions of European Orthodontic Society Journal. 1956; 134-140.
7. Miller J, Hobson P. The relationship between malocclusion,
485
OHDM - Vol. 13 - No. 2 - June, 2014
oral cleanliness, gingival conditions and dental caries in school children. British Dental Journal. 1961; 111: 43-52.
8. Poukon DR, Aaronson JA. The relationship between occlusion and periodontal status. American Journal of Ophthalmology. 1961; 47: 690-699.
9. Alexander AG, Tipnis AK: The effect of irregularity of teeth and the degree of overbite and overjet on gingival health. British Dental Journal. 1970; 128: 539-544.
10. Sandaili T. Irregularities of the teeth and their relation to the periodontal condition with particular reference to the lower labial segment. Transactions of European Orthodontic Society Journal. 1973; 319-333.
11. Gabris K, Márton S, Madléna M: Prevalence of malocclusions in Hungarian adolescents. European Journal of Orthodontics. 2006; 28: 467-470.
12. Buckley LA. The Relationships between malocclusion, gingival inflammation, plaque and calculus. Journal of Periodontology. 1981; 52: 35-40.
13. Ngom PI, Diagne F, Benoist HM, Thiam F. Intraarch and interarch relationships of the anterior teeth and periodontal conditions. The Angle Orthodontist. 2005; 76: 236–242.
14. Forsberg A. A clinical study of the periodontal tissues of the upper incisors in two age groups. Acta Odontologica Scandinavica. 1951; 8: 63-67.
15. Massler M, Sen Savara BS. Relation of gingivitis to dental caries and malocclusion in children 14-17 years of age. Journal of Periodontology. 1951; 22: 87-96.
16. Beagrie GS, James GA. The association of posterior tooth irregularity and periodontal disease. British Dental Journal. 1962; 3: 239-243.
17. Geiger AM. Consecutive cases of periodontal disease. American Journal of Ophthalmology. 1962; 48: 331-360.
18. Gould MSE, Picton DDA. The relationship between irregularities of the teeth and periodontal disease. British Dental
Journal. 1966; 121.19. Sergl, HG. Auswirkungen des Engstandes der unteren
Frontzahne - ein Beitrag zur Frage der Behandlungsbedurftigkeit. Journal of Orofacial Orthopedic. 1970; 3: 56-63.
20. Katz RV. An epidemiological study of the relationship between various states of occlusion and the pathological conditions of dental caries and periodontal disease. Journal of Dental Research. 1977; 3: 433-439.
21. Ainamo J. Relationship between malalignment of the teeth and periodontal disease. Scandinavian Journal of Dental Research. 1972; 80: 104-110.
22. Ashley FP, Usiskin LA, Wilson RF, Wagaiyu E. The relationship between irregularity of the incisor teeth, plaque, and gingivitis. European Journal of Orthodontics. 1998; 20: 65–72.
23. Griffiths GS, Addy M. Effects of malalignment of teeth in the anterior segments on plaque accumulation. Journal of Clinical Periodontology. 1981; 8: 481-490.
24. Ingervall B, Jacobsson U, Nyman S. A clinical study of the relationship between crowding of teeth, plaque and gingival condition. Journal of Clinical Periodontology. 1977; 4: 214-222.
25. Dalva de Souza Schroede M. Evaluation of periodontal index of gingival and plaque with dental crowding in development of gingivitis in children and adolescents. Revista Sul-brasiliera de Odontologia. 2004; 17-21.
26. Greene JC, Vermillion JR. The simplified oral hygiene index. The Journal of the American Dental Association. 1964; 68: 7.
27. http://www.whocollab.od.mah.se/expl/ohisgv64.html 28. Behlfelt K, Ericsson L, Jacobson L, Linder-Aronson S.
The occurrence of plaque and gingivitis and its relationship to tooth alignment within the dental arches. Journal of Clinical Periodontology. 1981; 8: 329-337.
29. Al-Shammery AR. Caries experience of urban and rural children in Saudi Arabia. Journal of Public Health Dentistry. 1999; 59: 60–64.