organisational factors impacting on employee …the purpose of this study was to investigate the...
TRANSCRIPT

i
ORGANISATIONAL FACTORS IMPACTING ON EMPLOYEE RETENTION
BY
PENDULWA VUYOKAZI GUMA
SUBMITTED IN PARTIAL FULFILMENT OF THE REQUIREMENTS FOR THE
DEGREE OF MASTERS IN BUSINESS ADMINISTRATION AT THE
NELSON MANDELA METROPOLITAN UNIVERSITY
PROMOTER : PROFESSOR DM BERRY
DATE SUBMITTED : JANUARY 2011

ii
DECLARATION
This work has not previously been accepted in substance for any degree and is not
being concurrently submitted in candidature for any degree.
Signed
Date
STATEMENT 1
This dissertation is being submitted in partial fulfilment of the requirements for the
degree of Masters in Business Administration.
Signed
Date
STATEMENT 2
The dissertation is the result of my own independent work/investigation, except where
otherwise stated.
Signed
Date
iii
ACKNOWLEDGEMENTS
The process I have taken to complete this dissertation has provided me with a platform
to better understand my capabilities and skills both personally and academically. This
journey of self actualisation would not have been fulfilled without the guidance, support
and cooperation of other people.
I wish to express my sincere gratitude to the following people for their contributions in
the successful completion of this study. Without their guidance, encouragement,
support and motivation, I would not have been able to complete this study.
Professor Dave Berry, for his guidance, patience and motivation.
Ms Faith Goqwana and Ms Ngqeleni for assisting in editing the research.
The DEDEA employees, for the cooperation, sincerity and willingness to
respond to the questionnaire.
My family for their love, support and encouragement.
My husband for his support, understanding and believing in me.
My kids for their understanding when I was busy with my school work.
Lastly, but not least, Aunty Nogcinile (my kids nanny) for being there for my
family, for her understanding, support and caring attitude.
Pendulwa Vuyokazi Guma
East London
January 2011

iv
ABSTRACT
Organisations must have a constant influx of candidates for potential employment.
New employee positions are required as market areas are expanded. Recruitment
occurs even in the face of limited growth or decline in service capacity, because
individuals with specialised skills or training who leave the organisation must be
replaced, and because services or technologies that have been revised or modified must
be staffed. The recruitment of personnel plays an important role in assisting the
organisation to adapt and remain competitive.
The Eastern Cape Department of Economic Development and Environmental Affairs
(DEDEA) employs a wide variety of workers. Thus, the sources of applicants and types
of methods used to expand the applicant pool vary depending on the occupational
classification being considered.
It, therefore, becomes self-defeating to invest significant resources in a recruitment
effort if such effort is offset by high turnover rates. Retention of employees is as
essential as their recruitment.
The purpose of this study was to investigate the organisational factors impacting on
employee retention at DEDEA. The population for the study included 781 DEDEA
employees. The response rate for the emailed questionnaire was 54% or 425
respondents. The Likert-type scale instrument consisted of forty questions divided into
two sections: Section one looked at the demographic profile of the respondents and
section two focused on getting responses on the five organisational impacting on

v
employee retention, namely: career development; compensation; positive recognition;
staff engagement and management.
In order to achieve the purpose of this study, the following research design was
adopted:
Step 1 A literature review was conducted to determine the various
organizational factors impacting on employee retention.
Step 2 From the literature review, a process model was adopted to assist
the researcher in structuring the research questionnaire.
Step 3 A questionnaire was constructed according to the principles and
guidelines in steps 2 and step 3.
Step 4 Empirical data was obtained by means of an email survey.
Step 5 The results of the survey were analysed and interpreted.
Step 6 The empirical results were integrated with Step 3.
Step 7 Conclusions and recommendations were done.
The main findings from the study were:
The study revealed a significant relationship between the selected organisational
factors and employee retention.
The study also produced a model suitable for use by DEDEA as a guide in
determining what initiatives the organisation should embark on to improve
employee retention.

vi
Table of Contents Page
DECLARATION .......................................................................................................................... ii
ACKNOWLEDGEMENTS ......................................................................................................... iii
ABSTRACT ................................................................................................................................. iv
CHAPTER 1 ................................................................................................................................. 1
1. PROBLEM STATEMENT AND OUTLINE OF THE STUDY .............................................. 1
1.1 BACKGROUND AND MAIN PROBLEM ................................................................. 1
1.2 SUB-PROBLEMS ........................................................................................................ 2
1.3 DEMARCATION OF THE RESEARCH .................................................................... 3
1.3.1 Human resources ................................................................................................... 3
1.3.2 Size of the organisation ......................................................................................... 3
1.3.3 Scope of study ....................................................................................................... 3
1.3.4 Basis for the evaluation ......................................................................................... 4
1.4 OBJECTIVES OF THE RESEARCH .......................................................................... 4
1.5 RESEARCH DESIGN .................................................................................................. 4
1.6 STRUCTURE OF THE REMAINDER OF THE STUDY ........................................... 5
CHAPTER 2 ................................................................................................................................. 6
2. ORGANISATIONAL FACTORS IMPACTING ON EMPLOYEE RETENTION ........ 6
2.1 INTRODUCTION ........................................................................................................ 6
2.2 DEFINING EMPLOYEE RETENTION ...................................................................... 7
2.3 DEVELOPING TRENDS IMPACTING ON EMPLOYEE RETENTION ................. 7
2.3.1 Generational transition .......................................................................................... 7
2.3.2 Defining the generations ....................................................................................... 7
2.3.3 Characteristics of an intergenerational workforce................................................. 8
2.3.4 Strategies to manage the intergenerational workforce .......................................... 9
2.3.5 The future workforce ........................................................................................... 10
2.4 THE VALUE OF RETAINING THE BEST EMPLOYEES ...................................... 10
2.5 THE IMPORTANCE OF EMPLOYEE RETENTION .............................................. 12
2.6 UNDERSTANDING THE REASONS FOR EMPLOYEE TURNOVER ................. 13
2.7 THE NEGATIVE IMPACT OF TURNOVER ON THE ORGANISATION ........... 15
2.7.1 External drivers of the retention crisis ................................................................ 18

vii
2.7.2 Internal drivers of the retention crisis ................................................................. 20
2.8 FACTORS IMPACTING ON EMPLOYEE RETENTION ....................................... 25
2.9 THE IMPACT OF CAREER DEVELOPMENT ON EMPLOYEE RETENTION . 26
2.9.1 The strategic importance of career development ................................................ 27
2.9.2 Career development support methods ................................................................. 28
2.9.3 Stages of career development .............................................................................. 30
2.9.4 Career development cycle .................................................................................... 35
2.10 THE IMPACT OF REMUNERATION/COMPENSATION ON EMPLOYEE
RETENTION .......................................................................................................................... 37
2.10.1 Compensation objectives .................................................................................... 38
2.10.2 The strategic importance of compensation .......................................................... 40
2.11 THE IMPACT OF POSITIVE RECOGNITION ON EMPLOYEE RETENTION ..... 42
2.11.1 How to provide effective employee recognition ................................................. 42
2.11.2 Impact of Positive Recognition ........................................................................... 43
2.11.3 Guidelines for effective employee recognition ................................................... 45
2.12 THE IMPACT OF STAFF ENGAGEMENT ON EMPLOYEE RETENTION ....... 49
2.12.1 The importance of employee engagement .......................................................... 50
2.12.2 Factors influencing employee engagement ......................................................... 50
2.12.3 Aspects of employee engagement ....................................................................... 51
2.12.4 Categories of employee engagement ................................................................... 51
2.12.5 The importance of employee engagement .......................................................... 52
2.12.6 Advantages of having engaged employees ......................................................... 53
2.12.7 Factors leading to employee engagement ........................................................... 54
2.13 THE IMPACT OF MANAGEMENT ON EMPLOYEE RETENTION .................... 58
2.13.1 Defining Management ......................................................................................... 58
2.13.2 A perspective on management in a South African organisation ......................... 59
2.13.3 Qualities of a good manager ............................................................................... 60
2.13.4 The role of management in employee retention .................................................. 61
2.13.5 Techniques to assist management ....................................................................... 63
2.13.6 The influence of management on job satisfaction ............................................... 65
2.13.7 Roles and responsibilities for recruiting and retaining employees ...................... 67
2.13.8 Creating an A+ manager ..................................................................................... 68
CHAPTER 3 ............................................................................................................................... 70
3. RESEARCH METHODOLOGY AND BIOGRAPHICAL ANALYSIS OF RESPONDENTS
..................................................................................................................................................... 70

viii
3.1 INTRODUCTION ...................................................................................................... 70
3.2 RESEARCH METHODOLOGY ................................................................................ 70
3.2.1 Research theory ................................................................................................... 70
3.2.2 The research process ............................................................................................ 71
3.2.3 The research problem .......................................................................................... 73
3.2.4 Application of methodology ............................................................................... 74
3.3 THE LITERATURE REVIEW ................................................................................... 74
3.4 THE QUESTIONNAIRE ............................................................................................ 76
3.4.1 Design of the questionnaire ................................................................................. 76
3.4.2 Design of the questions ....................................................................................... 77
3.4.3 Testing the questionnaire .................................................................................... 78
3.4.4 Distribution ......................................................................................................... 78
3.5 SAMPLE AND VALIDITY ....................................................................................... 79
3.5.1 Sample ................................................................................................................. 79
3.5.2 Validity and reliability ........................................................................................ 79
3.6 STATISTICAL ANALYSIS ....................................................................................... 80
3.7 ANALYSIS AND INTERPRETATION OF BIOGRAPHICAL DATA.................... 80
3.7.1 Total Population – response rate ......................................................................... 80
3.7.2 Branch office – response rate .............................................................................. 83
3.7.3 Position in the organisation – response rate ........................................................ 84
3.7.4 Age – response rate (Generation Subsets) ........................................................... 85
3.7.5 Gender – response rate ........................................................................................ 87
3.7.6 Nationality – response rate .................................................................................. 88
3.7.7 Language – response rate .................................................................................... 89
3.7.8 Salary level – response rate ................................................................................. 90
3.7.9 Qualification – response rate ............................................................................... 92
3.7.10 Years of service – response rate .......................................................................... 93
3.8 ANONYMITY ............................................................................................................ 94
3.9 CONCLUDING REMARKS ...................................................................................... 95
CHAPTER 4 ............................................................................................................................... 96
4. ANALYSIS AND INTERPRETATION OF RESEARCH RESULTS .................................. 96
4.1 INTRODUCTION ...................................................................................................... 96
4.2 ORDINAL DATA SURVEY ...................................................................................... 96
4.3 HOW DOES DEDEA MEASURE UP ....................................................................... 97

ix
4.3.1 Career development ............................................................................................ 99
4.3.2 Remuneration .................................................................................................... 101
4.3.3 Positive Recognition ......................................................................................... 103
4.3.4 Staff engagement ............................................................................................... 104
4.3.5 Management ...................................................................................................... 106
4.3.6 Reasons for leaving the organisation ................................................................ 108
4.3.7 Consideration of leaving DEDEA ..................................................................... 109
4.3.8 Rating of organisational factors ........................................................................ 110
4.4 CLOSING REMARKS ............................................................................................. 113
CHAPTER 5 ............................................................................................................................. 114
5. SUMMARY, CONCLUSIONS AND RECOMMENDATIONS ......................................... 114
5.1 INTRODUCTION .................................................................................................... 114
5.2 LITERATURE REVIEW.......................................................................................... 114
5.3 EMPIRICAL STUDY ............................................................................................... 114
5.3.1 Survey findings ................................................................................................. 115
5.4 RECOMMENDATIONS .......................................................................................... 115
5.5 PROBLEM AREAS AND LIMITATIONS ............................................................. 118
5.6 RECOMMENDATIONS FOR FURTHER RESEARCHER ................................... 119
5.7 CONCLUSION ......................................................................................................... 119
REFERENCE LIST .............................................................................................................. 120
ANNEXURE A - Memorandum addressed to questionnaire respondents ................................ 126
ANNEXURE B – QUESTIONNAIRE ..................................................................................... 127

x
Figures
Page
Figure 2.1 Causes of voluntary employee turnover 14
Figure 2.2 Unemployment rate in South Africa 19
Figure 2.3 A model for understanding employee attraction and retention 25
Figure 2.4 Stages of career development 31
Figure 2.5 Career development cycle 35
Figure 2.6 The link between recognition and employee retention 44
Figure 2.7 Factors leading to employee engagement 54
Figure 3.1 The research cycle 71
Figure 3.2 Total population response rate 81
Figure 3.3 Branch office response rate 84
Figure 3.4 Position in the organisation response rate 85
Figure 3.5 Age (Generation Subsets) response rate 86
Figure 3.6 Gender response rate 87
Figure 3.7 Nationality response rate 89
Figure 3.8 Home language response rate 90
Figure 3.9 Salary level response rate 91
Figure 3.10 Qualification response rate 93
Figure 3.11 Years of service response rate 94
Figure 4.1 Retention strategies 98
Figure 4.2 Career development 100
Figure 4.3 Remuneration 102

xi
Figure 4.4 Positive recognition 103
Figure 4.5 Staff engagement 105
Figure 4.6 Management 107
Figure 4.7 Possible reasons for leaving the organisation 108
Figure 4.8 Consideration of leaving DEDEA 109
Figure 4.9.1 Limited career development 111
Figure 4.9.2 Insufficient remuneration 111
Figure 4.9.3 No positive recognition 112
Figure 4.9.4 Lack of staff engagement 112
Figure 4.9.5 Inefficient management 112
Figure 5.1 Strategic model for employee retention 116

xii
Tables
Page
Table 2.1 Characteristics of an intergenerational workforce 8
Table 2.2 Unemployment rate in South Africa 19
Table 2.3 Approaches to the provision of employee recognition 47
Table 2.4 Advantages of having engaged employees 53
Table 2.5 Description of great managers by employees 61
Table 2.6 Roles and responsibilities for recruiting & retaining employees 67
Table 3.1 Total population response rate 81
Table 3.2 Branch office response rate 83
Table 3.3 Position in the organisation response rate 85
Table 3.4 Age (Generation Subsets) response rate 86
Table 3.5 Gender response rate 87
Table 3.6 Nationality response rate 88
Table 3.7 Home language response rate 90
Table 3.8 Salary level response rate 91
Table 3.9 Qualification response rate 92
Table 3.10 Years of service response rate 93
Table 4.1 Retention strategies 97
Table 4.2 Career development 99
Table 4.3 Remuneration 101
Table 4.4 Positive recognition 103
Table 4.5 Staff engagement 104

xiii
Table 4.6 Management 106
Table 4.7 Possible reasons for leaving the organisation 108
Table 4.8 Consideration of leaving DEDEA 109
Table 4.9 Rating of organisational factors 110

1
CHAPTER 1
1. PROBLEM STATEMENT AND OUTLINE OF THE STUDY
1.1 BACKGROUND AND MAIN PROBLEM
“The economic downturn is affecting workforces around the globe, and regardless of
region, recruitment and retention seem to take the biggest hit (Forgacs, 2009:40).”
According to Hebenstreit (2008:4) employee retention is a significant concern and
expense for every organization, with the expense of recruiting and retaining a new
worker costing anywhere from half to 200% of the departing employee‟s annual salary.
Depending on the employment level, the many costs associated with employee turnover
are co-worker burden, recruitment and training costs, lost productivity, loss of clients
and loss of intellectual capital (Rion, 2009:8).
Rion (2009:8) defines employee turnover as a ratio comparison of the number of
employees an organization must replace in a given time period to the average number of
total employees. He further purports that; there are a number of factors originating
from both the employer and the employee that significantly impact employee turnover.
Hebenstreit (2008:5) emphasize that it is essential to create a variety of options and
alternatives for a total employee retention programme to address areas that matter to the
employees as well as focusing on certain others that may be ignored, unconsidered or
underutilized.
Withers (2001:4) argues that finding and keeping great employees has never been so
critical, but the way to get the job done has also changed dramatically. This is because
employees view their work differently than they used to previously, a fact that has

2
given rise to an increased demand on organizations to invest in employee retention
programmes. Organisations need approaches to acquire, motivate, and retain valuable
employees.
The Department of Economic Development and Environmental Affairs has been faced
with high employee turnover across all levels of employment. This has caused the
department not to be able to accomplish its set goals as employees leave and new ones
have to be recruited, inducted and trained.
The above opinions thus directed the researcher to the main problem of this study,
namely:
Organisational factors impacting on employee retention.
1.2 SUB-PROBLEMS
In order to counter the departure of employees as described in the main problem, the
following sub-problems were identified:
Sub-Problem 1
What employee retention strategies does the literature reveal that will assist an
organisation retain its employees?
Sub-Problem 2
What employee retention strategies emanating from this study, if implemented
would influence employees to remain employed at the Department of Economic
Development and Environmental Affairs?

3
Sub-Problem 3
How can the results obtained from the resolution of sub-problems one and two
(above) be combined into an integrated strategic model which can be used to
retain employees at DEDEA.
1.3 DEMARCATION OF THE RESEARCH
Demarcating the research serves the purpose of making the research topic more
manageable from a research point of view. The omission of certain topics does not
imply that there is no need to research them.
1.3.1 Human resources
The focus of the study was limited to employees at the Department of Economic
Development and Environmental Affairs (DEDEA). These employees include first-line
employees (salary level 1-7), middle management (salary level 8-12) and senior
management level (salary level 13-16).
1.3.2 Size of the organisation
The research was limited to the DEDEA head office (in Bhisho) and the regional
offices in Amathole, Alfred Nzo, Cacadu, Chris Hani, OR Tambo and Ukhahlamba.
The total staff establishment of the organisation is 860 with 781 filled posts.
1.3.3 Scope of study
The research was limited to examining the five organisational factors impacting on
employee retention, namely: career development, remuneration, positive recognition,

4
staff engagement and management style. This study excluded all other factors that have
an impact on employee retention.
1.3.4 Basis for the evaluation
The researcher intended to develop a model of organisational factors impacting on
employee retention based on the information from the current literature and integrating
it with the research findings.
1.4 OBJECTIVES OF THE RESEARCH
The primary objective of this study was to investigate the organizational factors and
how they impact on employee retention at DEDEA. More specifically, the objectives
were to:
Determine from the literature, the impact of organizational factors on employee
retention;
Determine the reasons for the exodus of employees from the organization
(DEDEA);
Formulate an employee retention strategy model for implementation at DEDEA.
1.5 RESEARCH DESIGN
In this section the broad research methodology is described. The following process was
adopted to solve the man and sub-problems:
Step 1 A literature review was conducted to determine the various
organizational factors impacting on employee retention.
Step 2 From the literature review, a process model was adopted to assist
the researcher in structuring the research questionnaire.
Step 3 A questionnaire was constructed according to the principles and
guidelines in steps 2 and step 3.
Step 4 Empirical data was obtained by means of an email survey.
5
Step 5 The results of the survey were analysed and interpreted.
Step 6 The empirical results were integrated with Step 3.
Step 7 Conclusions and recommendations were done.
1.6 STRUCTURE OF THE REMAINDER OF THE STUDY
The remainder of the research project included the following chapters:
Chapter 2 Organisational factors impacting on employee retention
Chapter 3 Research methodology and biographical analysis of respondents
Chapter 4 Analysis and interpretation of research results
Chapter 5 Summary, conclusions and recommendations

6
CHAPTER 2
2. ORGANISATIONAL FACTORS IMPACTING ON
EMPLOYEE RETENTION
2.1 INTRODUCTION
The study begins with a review of the need for employee retention in a public sector
organisation (DEDEA), and concludes that there are organisational factors that impact
on employee retention. Gering and Conner (2002:40) state that retaining good workers
is critical to any organisation. Literature and best practices indicate that, to some
extent, if employers treat their employees as valued contributors, they tend to remain in
the organisation.
To this end, organisations train, offer competitive compensation plans and increase
benefits to secure their employees‟ loyalty. Despite these efforts, many organisations
experience a shortage of employees and high turnover rates.
In an era of employee shortages and increased service delivery demands, it is important
to explore factors which contribute to the retention of employees who contribute a
wealth of knowledge and experience to their organisations.
The chapter will explore the organisational factors impacting on employee retention.
These include career development, remuneration/compensation, positive recognition,
staff engagement and management. From this review and from the survey analysis, a
variety of recommendations will be generated, which, it is hoped will assist to inform
the creation of policies and practices that specifically address issues of employee
retention.

7
2.2 DEFINING EMPLOYEE RETENTION
Schuler and Jackson (2006:216) define retention as everything an employer does to
encourage qualified and productive employees to continue working for the organisation.
The main objective of retention is to reduce unwanted voluntary turnover by valuable
people in the organisation. Together, effective recruitment and retention efforts attract
individuals to the organisation and also increase the chance of retaining the individuals
once they are hired.
2.3 DEVELOPING TRENDS IMPACTING ON EMPLOYEE RETENTION
Different generations are currently in the workplace with their differences magnified as
a result of the current fragmented, global, and highly technological world. The changes
in the workplace, in society, and in organisations over the years have been massive.
These changes, according to Fields (2001:19) have, to a great extent, caused the rules
of the workplace to change.
2.3.1 Generational transition
Today‟s workforce is a blend of up to four generations which can be both challenging
and rewarding for employers, requiring specific management strategies. In the
workforce, more than ever before, there is an intergenerational blend of employees –
Veterans, Baby Boomers, Generation X and Generation Y (Harrison, 2010:1).
2.3.2 Defining the generations
According to Harrison (2010:1) the following four generations have been identified as
forming part of the contemporary workforce:
Veterans : born 1922 – 1943

8
Baby boomers : born 1944 – 1960 (or 1965)
Generation X : born 1960/65 – 1980
Generation Y : born after 1980 and still growing
2.3.3 Characteristics of an intergenerational workforce
Research, according Harrison (2010:2) indicates the following work characteristics
between the four generations:
Table 2.1 Characteristics of an intergenerational workforce
Generation Characteristics
Veterans Strong work ethic
Conservative and usually very loyal to the employer
Boomers May be more diligent at work
More comfortable in a stable working environment
Generally loyal to their employer
Accepting of “chain of command” leadership style
Generation X Prefer independence
Self motivation and self sufficiency
May emphasise the need for personal satisfaction, not
just hard work
Have broken the traditional Maslow‟s hierarchy of need
by challenging the path of individual development
Concerned with work/life balance
Generation Y Well educated
Articulate with high levels of technical skills
More individualistic and comfortable being part of the
global village
Source: Harrison (2010:2)
These work characteristics can lead to employees having different standards of work
practice and behaviours, which can lead to risks to overall individual and organisational
performance.

9
2.3.4 Strategies to manage the intergenerational workforce
Recognising the value of the unique traits of each generation of workers is a positive
way of embracing an intergenerational workforce. While some may feel that older
employees are more rigid and more change resistant, their maturity and experience can
help them foresee problems before they arise. This experience can be used to benefit
other staff through mentoring and support.
In contrast, younger employees may have more creative ideas and a better appreciation
of contemporary issues, which can complement a mature approach when all ages are
supported to work together collaboratively (Harrison, 2010:3).
A large part of managing the intergenerational workforce, according to Harrison
(2010:3) is change management. Managing such change would include acknowledging
the different climate today‟s workers are in from time past. Harrison also suggests that
organisations should focus at least some of their human resource activities on working
with the up-and-coming new generation of workers, determining their views on
working, reward and workplace preferences.
Harrison (2010:3) further explains that, another initiative organisations can take to
ensure both their own competitiveness and an ability to retain an intergenerational
workforce is to offer „life-long learning‟ that is commensurate with the knowledge era
we are now in. A programme of continual learning will keep employees up to date with
current trends and developments, and will bridge generational gaps by ensuring that all
employees acquire up to date information needed in their work.
Fields (2001:20) argues that the ranks of workers with the right technological and
managerial stuff to survive and thrive shrank, and those “with the goods” started to flex

10
their workforce muscle and demand some heretofore unthinkable things if they were to
be recruited and retained in an organisation. In other words, the movement has
switched from the age of the disposable employee to that of the indispensable
employee.
2.3.5 The future workforce
In today‟s fast-paced work environment, there are as many work and lifestyle
arrangements as there are ages of people in the workforce. Employers who want to be
successful in retaining and attracting indispensable employees are open to exploring a
variety of work arrangements with staff: telecommuting, job sharing, flexible
scheduling, compressed work weeks, and so forth (Fields, 2001: 263).
During the next decade, managers will need to utilise strategies and tools to ease the
transition of Boomers out of the workforce, and to welcome succeeding generations in
their place. The best way to approach this according to Mann (2006:5) will be, to
follow a multidimensional policy that will:
Encourage Boomers to remain in the workforce.
Recognise the technical competence, entrepreneurial spirit and work-life
balance needs of Generation X.
Anticipate the tech-savvy, collaborative work styles and need for self-directed
education and training for Generation Y.
2.4 THE VALUE OF RETAINING THE BEST EMPLOYEES
Schuler and Jackson (2006:219) state that recruiting people to meet the organisation‟s
human resource needs is only half the battle in the war for talent. The other half is
keeping these people. Organisations that keep their employee turnover rates lower gain

11
an advantage against their competitors by reducing overall labour costs and improving
productivity.
Moseley, Jeffers and Paterson (2008:53) state that employee retention is important to
organisations, as increased turnover creates instability and puts additional workload and
stress on remaining staff, increasing job dissatisfaction and therefore potentiating the
turnover cycle.
The phrase “employer of choice and substance” has come to be defined as an employer
who is highly regarded by a targeted population of employees because the organisation
offers great opportunities, rewards, compensation, etc that are in line with that niche
market‟s personal and professional value system. In other words, the employer
becomes so attractive to people that they choose to work for that employer rather than a
competitor (Fields, 2001:99).
The concept of employer-of-choice has intensified in the last decade. Employees want
to work for the best employers. Organisations strive to be the “best company to work
for” because this statement translates directly into lower rates of turnover. According to
Moseley et. al. (2008:3), becoming an employer-of-choice often involves the issue of
acquiring the best talent for the organisation, motivating employees to improve
performance, keeping them satisfied and loyal, developing employees so they can grow
and contribute skills, and ultimately retaining those employees.
Much has been made of the skills shortage in South Africa. One of the main factors
cited for the government‟s inability to get on top of the service backlogs is the lack of
skills in the country. In addition to this, the skills shortage is believed to have an
adverse impact on the country‟s growth rate.
12
According to Horwitz (2008:1), skills shortages are a global phenomenon that threaten
to hamper economic growth. He further purports that retention strategies are critical in
a global market that is faced with the shortage of skilled workers. The skills shortage
challenge is not a South African phenomenon alone. It is therefore important for
business, government, public and private sector leaders to address this critical
component of employee retention for competitiveness and service delivery.
2.5 THE IMPORTANCE OF EMPLOYEE RETENTION
Employee retention has become a serious and complex problem for all organisations.
Managing employee retention and keeping turnover rate below target and industry
norms is one of the most challenging issues facing organisations (Phillips & Connell,
2003: xi).
Employee turnover is important to individuals, organisations, and society. For the
individual, leaving a job may cause temporary loss of income and benefits, family
stress, problem with individual self esteem, and possibly sustained unemployment and
relocation for the individual and family (Phillips & Connell, 2003:5).
From the organisational perspective, employee turnover may lead disruption of service
to clients. The extra time and money spent on recruitment and training of the
replacement and the added stress of more work for the remaining staff during the
interim are a few of the consequences suffered by the organisation when turnover
occurs.
From a societal perspective, employee turnover can have a negative impact when it
leads to employees with critical and scarce skills leave the country to work abroad.

13
Kaye and Jordan-Evans (2009:17) point out that retention is increasingly important as a
result of:
The shortage of skilled workers,
Changes in employee attitudes,
The availability of new employment options,
The high costs associated with hiring new talent, and
The fact that in the new global economy, having talented employees is the
differentiator.
2.6 UNDERSTANDING THE REASONS FOR EMPLOYEE TURNOVER
Sometimes organisations are faced with unavoidable turnover. This occurs when
employees retire or move for non-job-related reasons. Schuler and Jackson (2006:248)
argue that turnover due to the upcoming retirement of Baby Boomers is expected to
have major implications for future recruiting activities. Furthermore, they also state
that not all turnover is bad.
Research suggests that too little turnover can actually harm the organisation‟s
performance. Sometimes organisations encourage employees to leave. The objective
may be to shrink the size of the workforce, or simply to help unproductive employees
realise that they may be better off finding alternative employment. But the big share of
turnover that is caused by dissatisfied employees is not desirable and may be avoidable
by implementing employee retention strategies.
14
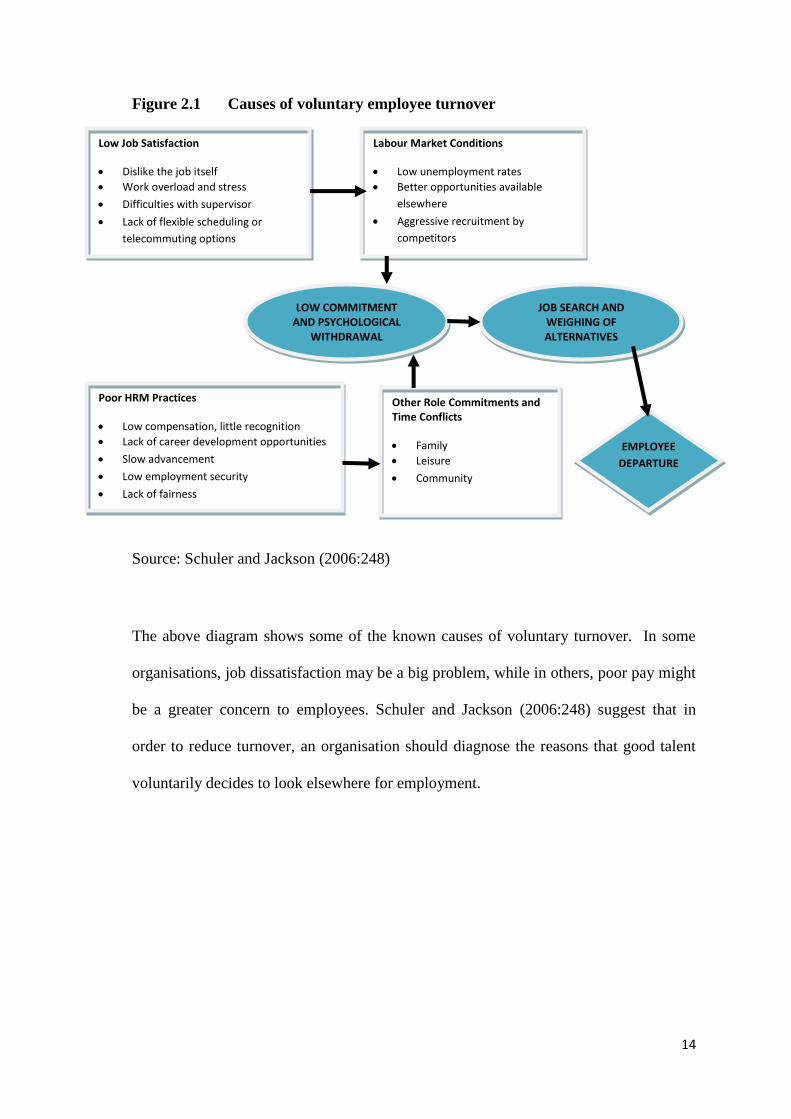
Figure 2.1 Causes of voluntary employee turnover
Source: Schuler and Jackson (2006:248)
The above diagram shows some of the known causes of voluntary turnover. In some
organisations, job dissatisfaction may be a big problem, while in others, poor pay might
be a greater concern to employees. Schuler and Jackson (2006:248) suggest that in
order to reduce turnover, an organisation should diagnose the reasons that good talent
voluntarily decides to look elsewhere for employment.
Low Job Satisfaction
Dislike the job itself
Work overload and stress
Difficulties with supervisor
Lack of flexible scheduling or
telecommuting options
Labour Market Conditions
Low unemployment rates
Better opportunities available
elsewhere
Aggressive recruitment by
competitors
Other Role Commitments and Time Conflicts
Family
Leisure
Community
Poor HRM Practices
Low compensation, little recognition
Lack of career development opportunities
Slow advancement
Low employment security
Lack of fairness
Lack of flexible scheduling or
telecommuting options
LOW COMMITMENT AND PSYCHOLOGICAL
WITHDRAWAL
JOB SEARCH AND WEIGHING OF ALTERNATIVES
EMPLOYEE
DEPARTURE
15
2.7 THE NEGATIVE IMPACT OF TURNOVER ON THE ORGANISATION
Although every manager and team leader is aware of problems associated with
turnover, the following is a list of categories that frame the major negative
consequences (Phillips & Connell, 2003:5-6).
High financial cost
Turnover has a huge economic impact on the organisation, both direct and
indirect costs. It is essential to translate turnover into numbers as they need to
realise the true cost of turnover. Sometimes the cost impact alone causes it to
become a critical strategic issue. The performance of companies has been
inhibited by high turnover rates.
Survival is an issue
In a tight labour market where the success of the organisation depends on
employees with critical skills, recruiting and retaining the appropriate talent can
determine the success or failure of the organisation.
Exit problems and issues
With increased litigation at the workplace, many organisations spend significant
time and resources addressing issues of disgruntled and departing employees.
Some individuals find the need to involve the legal system, leaving the
organisation with the challenge of facing an even bigger problem. Even
employees who leave voluntarily can cost the organisation time and money.

16
Productivity loss and workflow interruption
In most turnover situations, a person who exits abruptly leaves a productivity
gap. This void does not only cause problems for the specific job performed by
the departing employee, but also for members as well others on the same team
within the workflow.
Service quality
With so much emphasis on providing excellent service to external and internal
customers, high turnover has a negative impact on the quality of customer
service. Turnover of front-line employees is often regarded as the most serious
threat to providing excellent external customer service.
Loss of expertise
Particularly in knowledge industries, a departing employee may have the critical
skills needed for working with specific software, completing a step in an
important process, or carrying out a task for a project. Sometimes a product line
may suffer because of such a departure. A departed employee may be
impossible to replace – at least in the short term.
Loss of business opportunities
Turnover may result in a shortage of staff for a project or leave the remaining
staff unprepared to take advantage of a new business opportunity. Existing
projects or contracts may be delayed or even lost because a key player is no
longer available.

17
Administrative problems
In most organisations, turnover creates an administrative problem, not only in
additional paper work, but also in time spent confronting and addressing
turnover-related issues. This takes precious time away from more important,
productive responsibilities.
Disruption of social and communication networks
Every organisation has an informal network. Turnover disrupts the
communication and socialisation patterns critical to the maintenance of
teamwork and a productive work environment.
Job satisfaction of remaining employees
The disruptive nature of turnover is amplified when other employees are forced
to assume the workload of departing colleagues or address problems associated
with their departure. Remaining team members can be distracted by their
concern and curiosity about why employees are leaving.
Image of the organisation
High turnover creates the negative organisational image. Once this image has
been established in the job marketplace, it is difficult to change, especially in the
recruiting channels.
The above are significant and negative consequences. With such impact, excessive
turnover should command the attention of everyone in the organisation.

18
2.7.1 External drivers of the retention crisis
According to Phillips and Connell (2003:7), major changes have occurred in
organisations – both internally and externally – making the employee retention issue
more critical today than in previous years. Unfortunately, these changes will only
worsen the crisis in the future. The following are the external drivers of retention:
Economic growth
Almost all industrialised nations, and many emerging economies, have
experienced long economic expansions. As economies grow, job growth will
continue. In almost all segments of the economy, economic expansions
translate directly into new jobs, which in turn create new opportunities for
employees to leave current employment.
Slower growth of job seekers
Despite economic growth, the number of job seekers is not increasing as quickly
as job growth. In South Africa, the job seeker growth rate is growing at a
slower rate each year. This therefore means that employees are leaving their
jobs hence the steady job seeker growth rate increase each year.
Unemployment rate at low levels
Low unemployment rates lead to increased turnover because more jobs are
available. The unemployment rate in South Africa, at 25,3 percent in the last
quarter of 2010, continues to hover around a low rate. This is shown in figure
2.2 below:

19
Table 2.2 Unemployment rate in South Africa
Source: Statistics South Africa (2010)
Figure: 2.2 Unemployment rate in South Africa
Source: Statistics South Africa (2010)
Shortage of special skills
Compounding the situation is the short supply of workers with special skills,
particularly in high-tech occupations, health care, and other critical areas. The
news is often flooded with situations in which the number of candidates for jobs
falls far short of the demand. This involves every spectrum from high-tech
specialists, engineers, and scientists, where employment opportunities have
0
5
10
15
20
25
30
35
Q2: 2009
Q1: 2010
Q2: 2010
Kwa Zulu
Natal
Western
Cape Limpopo Gauteng
Eastern
Cape
Free
State
North
West Mpumalanga
Northern
Cape
South
Africa
Q2: 2009 19.3 20.5 24.9 23.1 27.9 26.9 27.7 26.5 26.5
23.6
Q1:
2010 19.3 20.3 26.8 27.1 29.8 27.2 26.3 29.3 27.8
26.8
Q2: 2010 20.8 21.8 22.6 27.1 27.7 28 28.1 28.1 30.1
22.6

20
outpaced the supply, to entry-level positions, such as those in the fast-food
industry, where jobs require skilfulness.
Entrepreneurship
In recent years, most countries have seen a growth in the establishment of small
businesses, particularly in those businesses created by individuals leaving large
organisations and taking their expertise with them. In South Africa, baby-
boomers are taking early retirement to start their own businesses, sometimes in
direct competition with the organisation they left.
Job changes for more favourable climates
In recent decades, a significant number of jobs shifted to areas where the
weather is considered more favourable. Turnover is created as people migrate.
This change has little to do with a specific organisation, just the location of the
jobs themselves.
2.7.2 Internal drivers of the retention crisis
Internal changes in organisations operate in concert with the external influences to
excessive turnover. Internal issues include structural changes within the organisation
and changes in employees‟ attitudes about work and their employers. The following
internal drivers, as highlighted by Phillips and Connell (2003:10) have a tremendous
impact on turnover:
Lack of organisational loyalty
Perhaps one of the most frustrating issues is the growing lack of organisational
loyalty. Research shows that organisational loyalty has deterioted in the recent

21
years. Years ago employees appreciated their jobs and would strive to stay with an
organisation for a long time. There was a sense of pride in working for the same
company.
Desire for challenging and useful work
Employees want creative, challenging, and useful work, a desire that has been
evolving for many years. For many employees, their jobs define who they are
and they have a need to use their minds and make a significant contribution. If
they cannot achieve this within the framework of the current job, they will find
one where they can.
Need for autonomy, flexibility, and independence
Employees are becoming more accustomed to having the autonomy and
flexibility to organise and control their work and work environment. And one
way of telecommuting is making it easier to work at home. This need is
attracting many employees to organisations offering a flexible structure.
Need for performance-based rewards
More employees are seeking appropriate reward systems that reflect individual
contribution and performance. If rewards are not in direct proportion to
achievement, employees will often find jobs in organisations where they will be
rewarded accordingly.
Need for recognition of participation, accomplishments and contributions
In addition to monetary rewards, employees want credit for what they do and
what they have accomplished. Periodic feedback and recognition have been an

22
important part of motivational research for years. Employees seek workplaces
where they can be acknowledged in a more systematic and consistent manner.
Desire for all types of benefits
Unfortunately, employees expect compensation in all forms. Some employees
go to the extent of seeking an organisation with particular benefits that are
critical to their needs. Organisations therefore have had to adjust their
programmes to offer all sorts of perks, sometimes bordering on the absurd.
Need to learn new skills
Perhaps a more recent development is employees‟ desire to acquire new skills
and skills sets. Employees want to learn new technologies, processes, and
projects and acquire new skills, particularly in the technical areas. Employees
view skills acquisition – not seniority – as providing them with job security.
Consequently, employees seek organisations that are willing to invest in them.
The availability of generous tuition payment, ample job-related training, and
continuous development opportunities can be effective organisational
incentives.
Career growth
In addition to obtaining new skills, employees want the opportunity to advance
within an organisation as they grow and develop these skills. Some
advancement is upward and other movement is lateral, such as growth of
specialised skills, but if employees cannot advance inside the organisation, they
will move to another one.

23
Desire to be on the leading edge
Employees are interested in organisations with a good reputation, and are
considered to be advanced in technology or product development, or the best at
what they do. These high-profile organisations are admired by many others and
often they are best in the field and able to attract individuals who want to be
associated with the best. More often, employees who do not find these
characteristics in their organisations may leave and look for other organisation.
Desire for competitive compensation
Increased salary schedules have probably been the most visible and discussed
internal change in organisations. Compensation levels have grown significantly,
sometimes outstripping other economic indicators. Employees want more
money, with more disposable income. They also view their income level as a
reflection of their worth to the organisation and their profession.
Need for a caring, supportive environment
Some employees place a high level of importance on working in a caring and
supportive environment. Gone are the days of willingness to tolerate harsh
attitudes, continuous conflict, and unappreciative bosses. If organisations do not
have the nurturing environment they want, employees tend to move to another
organisation where they can find it.
Need for work/life balance
Many employees seek a job where they can establish a balance between their
work and personal lives. Few employees are willing to work an excessive
number of hours, cope with unusual working conditions, or tolerate highly

24
stressful demanding situations. They want time for involvement in family
activities, social networks and religious commitments. Employees seek
organisations that will provide the appropriate work/life balance.

25
2.8 FACTORS IMPACTING ON EMPLOYEE RETENTION
The Recruitment Communications Company (2002:2) states that, broadly, there are
three sets of factors that determine an organisation‟s ability to attract and retain
employees. These are shown in figure 2.3 below:
Figure 2.3 The model for understanding employee attraction and retention
Source: The Recruitment Communication Company (2002:2)
Of the three categories, organisational practices are the most controllable; given an
understanding of what is currently happening and what should be happening in an
organisation. Although it may not be possible or even legal to control individual
attributes, it is relatively easy to identify links between them and job satisfaction and
then modify organisational practices accordingly.
For the purposes of this study, five organisational factors impacting on employee
retention will be looked at, namely: career development, remuneration/compensation,
positive recognition, employee engagement and management.
EXTERNAL INFLUENCES
These are outside the organisation
such as the global labour market or
overall economic climate
ORGANISATIONAL
INFLUENCES
Employment programmes,
policies and the variety of
other factors which make
up the working climate or
culture in an organisation
INDIVIDUAL INFLUENCES
Characteristics of
individual employees
that may indicate
likelihood of their joining
and staying with a given
employer
Attraction
and
Retention

26
2.9 THE IMPACT OF CAREER DEVELOPMENT ON EMPLOYEE
RETENTION
Introduction
The European Centre for the Development of Vocational Training (2008:12) states that,
organisations need to realise that career development for their workforce is a way of
helping to attract and retain the best people: by recognising and responding to the needs
of employees they will get the best out of them.
Werner and DeSimone (2009:404) suggest that it is essential that individual employees
and organisations develop an understanding of career development in today‟s ever
changing global world. Contemporary employees tend to be assertive and vocal about
their needs, and they desire control over their professional and private lives.
Organisations concerned with the productive utilization of their human resources can
also benefit from understanding the many dilemmas and challenges faced by employees
as they attempt to help them plan, develop and manage their careers.
Defining Career Development
Nel, Werner, Haasbroek, Poisat, Sono and Schultz (2008:483) define career
development as a formal approach by the organisation to ensure that employees with
proper qualifications and experience are available when needed. To realise this goal,
the organisation needs to support career development and be committed to it.
“Career development can be defined as an “ongoing” process by which individuals
progress through a series of stages, each of which is characterised by a relatively unique
set of issues, themes or tasks” (Greenhaus, Callanan and Goldshalk (2000:13), as cited
in Swanepoel, Erasmus, Van Wyk, and Schenk (2007:398).

27
Horwitz (2008:1) points out that in Asia, China and Japan, the problem of lack of
skilled workers is seen to be the biggest threat organisations will face in the future.
This places more pressure on South African organisations to compete for skilled labour
in the global labour pool. In South Africa, according to Horwitz (2008:1), organisations
are failing to retain workers, owing to the fact that employees quit their jobs because of
lack of career advancement and ineffective utilisation of their knowledge and skills.
2.9.1 The strategic importance of career development
According to Schuler and Jackson (2006:310) the best competitors use training and
development practices to improve the ability of the workforce to implement their
business strategy. Improving the competence of the workforce is one way that career
development can create a competitive advantage. Career development can be perceived
as a means by which employers address employees‟ needs.
By offering career development opportunities, employers help employees to develop
their own personal competitive advantage and ensure their long-term employability.
Many employees seek out employers who provide training and development activities
that facilitate career advancement. When they receive such opportunities, employees
are likely to commit to the organisation.
The Harvard Business Review on Appraising Employee Performance (2005:116) states
that most managers often botch career development and retention because they
mistakenly assume that people are satisfied with jobs they excel at. However, there are
other reasons why career development may go wrong. The first is the way jobs usually
get filled, and the second is the fact that career development so often gets handed over
to the human resources department.

28
Most people get moved or promoted in their organisations according to a preset
schedule, a new assignment every 18 months or when another position in the
organisation opens up.
Career development in general requires an ongoing dialogue between an employee and
his/her boss. It should not be relegated to another department, however good it may be.
The human resources department adds its value in training and supporting managers as
career developers.
2.9.2 Career development support methods
Swanepoel et. al. (2007:413) suggest that while the employee is primarily responsible
for career planning, the organisation‟s management can do a great deal to support
employees in managing their careers and in making more realistic career decisions.
The following are methods that can be used by organisations to support career
development:
Career planning workshops
Career planning workshops are widely used by organisations as part of their career
development systems. In such workshops people obtain self-knowledge (that is, insight
into their strengths and weaknesses) and are introduced to work opportunities. An
action plan to utilise the strengths and overcome the weaknesses is usually developed.
Otte and Hutcheson (1992:19-20), as cited in Swanepoel et. al. (2007:414) propose that
such workshops should cover the following aspects:
o Individual assessment (information about the individual);
o Environmental assessment (information about work);
o Comparison of self-perception with those of others (reality testing);
29
o Establishing long and short-term career goals (goal setting);
o Choosing among alternatives (decision making); and
o Establishing and implementing plans (action planning).
Career discussion
“A career discussion is a planned discussion between a manager and an
employee attempting to clarify developmental options in the employee‟s
current job, examine career issues in light of current job performance and goals
of the organisation, and/or clarify future career options for that employee” (Otte
and Hutcheson 1992:46).
Conducting career discussions is one of the most important human resource
manager‟s tasks. In this way managers support career planning. In this
instance, the manager should act as an adviser and facilitate the career
development process.
Career centres
A career centre is a repository of the relevant material that can assist employees
in career planning. The information provided may not only inform the
employee of career opportunities within the organisation, but also avail him/her
of self knowledge.
Career planning workbooks
Facilities such as career centres and workshops (as discussed above) are not
always available to all employees. A well designed workbook can fill this need.
The individual works alone through a series of assessment exercises and thereby

30
obtains valuable self-knowledge. In this way a workbook can achieve some of
the objectives of a workshop.
Mentoring
Meyer and Fourie (2004:2) define mentoring as a dynamic and reciprocal
relationship in a work environment whereby a more advanced and wise career
incumbent (mentor) helps a less experienced person who has development
potential (mentee – who is not his direct subordinate) develop in some specified
capacity.
Mentoring is a process of transferring and exchanging information between a
mentor and a mentee as they develop a long-term relationship over an extended
period of time. Meyer and Fourie (2004:3) further explain that, mentoring is not
about being sponsored for a promotion, but rather as one of many tools that
assist in the career development of employees.
2.9.3 Stages of career development
The stages of career development are outlined by Greenhaus, Callanan and Godshalh
(2000:117) in figure 2.4 below:

31
Figure 2.4 Stages of career development
Source: Greenhaus et. al. (2000:117)
STAGE 1: OCCUPATIONAL CHOICE: PREPARATION FOR WORK
From a career perspective, the major tasks of this stage are to form and refine an
occupational self image, explore the qualities of alternative occupations, develop at
least a tentative occupational choice, and pursue the type of education or training
required to implement the choice. The accomplishment of these tasks requires
considerable insight into one‟s own talents, interests, values and desired lifestyle, as
well as the requirements, opportunities, and rewards associated with alternative
occupational fields.
Stage 1: Occupational
Choice : Preparation
for Work
Stage 2: Organisational
Entry
Stage 3: The Early Career
Stage 4: The Mid-career
Stage 5: Late Career
STAGES OF
CAREER
DEVELOPMENT

32
The initial time frame for this stage, birth to 25, signifies that the formation of an image
of oneself and the world of work takes place throughout childhood, adolescence, and
early adulthood. However, the model of career management adopted here is based on
continual exploration and discovery, and many people develop second or third
occupational choices in the course of their work lives. Because occupational choices
can occur at other stages as well, the tasks associated with occupational choice can
reappear throughout one‟s lifetime (Greenhaus et. al., 2000:117).
STAGE 2: ORGANISATIONAL ENTRY
The main task at this stage is to select a job and an organisation in one‟s chosen career
field. A positive outcome at this stage is the choice of a job that can satisfy one‟s career
values and use one‟s talents. Unfortunately, many individuals‟ job selections are based
on incomplete or unrealistic information. Such people may experience considerable
disillusionment and dissatisfaction when the reality of the work environment does not
live up to their expectations.
The organisational entry stage, which may take several months of job searching ,
initially takes place between the ages of 18 and 25, often depending on the
qualification one has attained. Although this stage is experienced initially by persons
who are moving directly from school to their first career-related work assignment, one
can enter a new organisation at any age; therefore, the age range can be variable
(Greenhaus et. al., 2000:118).

33
STAGE 3: THE EARLY CAREER
This stage encompasses two periods, reflects the dominant issue of early adulthood:
finding the niche for oneself in the adult world and striving to make it along the chosen
path.
Having selected an occupation and a first job, a critical first task of the early career is to
become established in one‟s career and organisation. The new employee must not only
master the technical aspects of his or her job but must also learn the norms, values, and
expectations of the organisation. In this establishment period of the early career, the
individual‟s major task is to learn about the job and the organisation and to become
accepted as a competent contributor to the organisation. In other words, one makes a
place for oneself in the occupation and the organisation (Greenhaus et. al., 2000:120).
STAGE 4: THE MID-CAREER
An individual‟s mid-career (ages 40-55) is initiated by the middle transmission which
serves as a bridge between early and middle adulthood. A number of tasks and
concerns characterise the midcareer years. First, the individual is likely to reappraise
the life structure that dominated his or her early career. Next, it is necessary to begin to
form a life structure (with its career implications) to move oneself fully into middle
adulthood. Whether the new life structure is consistent with the prior one or constitutes
a minor or radical departure, a number of specific work-related issues confront the
individual in midcareer (Greenhaus et. al., 2000:120).
STAGE 5: LATE CAREER
Although there has not been a great deal of research on the late career, it appears that
the individual is faced with two major decisions to consider. First, he/she may continue

34
to be a productive contributor to the organisation and maintain his or her sense of self-
worth and dignity. However, the maintenance of productivity and self-esteem is often
hindered by changes within the individual and by society‟s bias against older people.
Second, the individual in late career may anticipate and plan for an effective retirement,
so that disengagement from work is not devastating to the individual and that the
postretirement years are meaningful and satisfying.
The late career extends roughly from the mid-50 to retirement (Greenhaus et. al.,
2000:121).
McIntyre (2010:2) argues that for employees who are driven and desire to progress to a
higher level in the organisation, career development may play a key role in providing
them with job satisfaction which in turn leads to employee retention. The following are
some strategies to address career development:
Invest in employees with training.
Provide educational assistance by covering the cost of outside courses.
Have a mentoring system in place.
Use cross functional teams to expose employees to different departments and
managers.
Ensure that there are opportunities for promotions and transfers.
According to Heathfield (2008:1) the one key factor in employee motivation and
retention is the opportunity employees want to continue to grow and develop job and
career enhancing skills.

35
2.9.4 Career development cycle
Profiling for success (2006:1) suggests the following diagram to explain the career
development cycle.
Figure: 2.5 Career development cycle
Source: Profiling for success (2006:1)
Self-awareness or understanding more about oneself is at the centre of personal
development and career development. One way to think about self-awareness and how
it relates to development activities is discussed below, as suggested by Profiling for
success (2006:1).

36
Strengths , skills and preferences
Self-awareness leads to an understanding of one‟s strengths, core skills and
preferences. These cover a wide range of capabilities (what an employee
knows, what he/she can do and what they have the potential to do) and
preferences and motivations (interests and motivates them, how they do things
and how they relate to others).
Capabilities and applications
When employees know what their strengths and preferences are, they need to
think about how they can apply these in different situations.
Self-awareness
Self-awareness is about knowing oneself. It is a lifelong process that occurs
gradually, but at times it can be helpful to put effort into raising one‟s self-
awareness.
Areas for development or weaknesses
Self-awareness can identify areas that an employee may want to develop. These
areas may be related to academic abilities, skills such as planning and time
management, or personal characteristics such as how an employee work as part
of a team or deal with difficult situations.
Development activities, new strategies
When an employee knows what they want to develop, there are usually many
ways of going about doing it. Generally, there is no one approach is best. The
approach depends on what they want to develop. What is important, however, is
that the employee plans their development carefully, set themselves small,
manageable targets and check their progress against them regularly.

37
From the above discussion it can be concluded that, to reduce turnover, managers must
show a genuine interest in their employees‟ development and success. Employees want
to feel that their contributions are important and want employers to demonstrate their
commitment to stated corporate values. Gering and Conner (2002:42) state that career
development programmes prepare employees to perform their jobs satisfactorily and be
accountable for their job performance. Employees need to be rewarded for their
achievements and provided with opportunities for advancement.
2.10 THE IMPACT OF REMUNERATION/COMPENSATION ON
EMPLOYEE RETENTION
Compensation has always been at the heart of any employment relationship.
Swanepoel et. al. (2003:487) explain that, in its simplest form, this relationship is
usually based on an economically motivated process whereby certain inputs (physical
and mental work behaviour) are exchanged for some outputs (rewards) that are
considered to be desirable in satisfying individual needs or goals. The utilisation of
rewards can therefore be a very important and powerful tool for shaping and
determining work behaviour aimed at attaining the strategic objectives of an
organisation.
Vance (2004:15) states that compensation consists of financial elements (pay and
benefits), but may also include non-financial elements or perks, such as on-site day
care, employee assistance programs, subsidized cafeterias, travel discounts,
organisation picnics and so on. The most effective compensation plans support the
organisations‟ strategic objectives. For example, if an organisational strategy hinges on
innovation, then the compensation system should encourage and reward risk-taking. A
well-designed compensation plan gives an organisation a competitive advantage. It

38
helps to attract the best job candidates, motivate them to perform to their maximum
potential and retain them for the long term.
Nel et. al. (2001:281) suggest that a good compensation system must attract good
employees by structuring salary packages that tempt people to apply for the job in the
first place; it must also be able to retain such workers, because many other employers in
the marketplace will be seeking their services as well.
2.10.1 Compensation objectives
Compensation objectives are those guidelines that determine the nature of a reward
system. They also serve as standards against which the effectiveness of the system is
evaluated. According to Swanepoel et. al. (2003:490), the classical objectives of any
compensation system are to attract, retain and motivate employees. In addition, many
more objectives may be formulated to ensure that the compensation system contributes
to the organisation‟s overall objectives. The following, as stated by Swanepoel
(2003:490) are some of the common objectives of an effective reward system:
Attracting the right quality of applicants
Generally organisations that give the greatest rewards tend to attract the most
applicants and can therefore recruit the best qualified staff. In order to maintain
a competitive pay-level strategy, an organisation needs some knowledge of the
going rate in the labour market.
Retaining suitable employees
To encourage valuable staff members to remain, the compensation system must
offer competitive rewards for these employees to feel contented when they

39
compare their rewards with those received by individuals performing similar
jobs in other organisations.
Maintaining equity among employees
In the context of compensation the concept equity relates to perceptions of
fairness in the distribution of rewards. It is generally considered to be one of the
most important objectives of any compensation system. Different types of
equity can be distinguished: external, internal and individual.
o External equity involves comparisons of rewards across similar jobs in the
labour market.
o Internal equity deals with comparisons of rewards across different jobs within
the same organisation. It addresses the issue of the relative worth of, for
example, an engineer versus an accountant working for the same employer.
o Individual (procedural) equity is concerned with the extent to which an
employee‟s compensation is reflective of his or her contribution and the fairness
with which pay changes such as increases are made. Changes may be based, for
example, on individual performance, on competencies, or according to fixed
increments or seniority.
Rewarding good performance and providing incentives for desired
behaviour
An organisation can structure its reward system to encourage employee
behaviour directed towards improving corporate performance and achieving
specific aims.

40
Maintaining cost-effectiveness
The compensation system often constitutes the single largest operation of an
organisation and should therefore be designed and assessed from a cost/benefit
perspective. A systematic pay structure is therefore needed to prevent undue
expense and possible over or underpayment of employees.
Compliance with legal requirements
Compensation design faces certain legal requirements and needs to comply with
legislative regulations and collectively bargained agreements. Labour
legislation such as the Employment Equity, No. 55 of 1998 and the Basic
Conditions of Employment Act, No. 75 of 1997 have a direct impact on
compensation design; and collectively bargained agreements reached with
unions also restrict the freedom of design choices for the compensation
manager.
Providing for flexibility and administrative efficiency
Design should be flexible enough to prevent bureaucratic rigidity and allow for
dealing with alterations in relative market rates and individual differences in
terms of merit. In addition, it should be simple enough to explain, understand
and operate.
2.10.2 The strategic importance of compensation
Like many other aspects of an organisation‟s approach to managing human resources,
compensation can facilitate (or interfere with) the achievement of different strategic
objectives. The three main objectives, according to Schuler and Jackson (2006:362)
are:

41
i. Attracting and retaining the talent required for sustainable competitive
advantage;
ii. Focusing the energy of employees on implementing the organisation‟s particular
competitive strategy; and
iii. Improving productivity.
2.10.2.1 Attracting and Retaining Talent
Schuler and Jackson (2006:362) argue that, in conjunction with an organisation‟s
recruitment and selection efforts, a total compensation system provides pay that is
sufficient to attract the right people at the right time for the right jobs and keep them
motivated to perform their jobs to the best of their ability. Unless compensation is
perceived as internally fair and externally competitive, skilled employees are likely to
leave.
2.10.2.2 Compensation, Recruitment and Retention
According to Schuler and Jackson (2006:370), the monetary and non-monetary
compensation that an organisation offers partly determines the number and quality of
job applications received during recruitment. Once the best applicants have been
selected, their decisions on whether to join the organisation are likely to be influenced
by the salary and bonuses offered.
Compensation practices also influence employees‟ decisions on whether to stay with
their employers or leave.
From the above discussion it can be concluded that compensation / remuneration
constitutes the largest part of the employee retention process. Employees always have
high expectations regarding their compensation packages. These packages vary for
42
organisation to organisation. An attractive compensation package plays a critical role
in employee retention.
2.11 THE IMPACT OF POSITIVE RECOGNITION ON EMPLOYEE
RETENTION
Introduction
According to Jacobson (2008:1), every employee has a need to be commended and
recognised, and the more often they get it the better. Supervisors are in a better position
to commend and recognise employee performance. In order to make employee
recognition more effective, it is crucial that managers strategically tie recognition
results with employee performance and reward employees for great achievements in a
timely manner and to use a wider menu of options for employee recognition.
2.11.1 How to provide effective employee recognition
Heathfield (2008:20) suggests that organisations should prioritise employee recognition
to create a positive, productive and innovative organisational climate. Organisations
must provide employee recognition even if its saying “Thank You” and to encourage
more of the actions and thinking known to contribute to the success of the organisation.
According to Heathfield (2008:20), people who feel appreciated are more positive about
themselves and their ability to contribute. Employees with positive self-esteem are
potentially organisation‟s best employees. These beliefs about employee recognition
are common among employers even though implementation may be different.

43
2.11.2 Impact of Positive Recognition
The more organisations celebrate employee‟s achievements through day to day gestures
of appreciation or through formal corporate and organisational recognition activities,
the more employees will contribute to the achievement of organisational goals.
According to Nelson (2003:1), organisations get what they reward. Research shows
that human behaviour is shaped by its consequences, and that one of the most powerful
ways to enhance employee performance is by providing positive consequences for that
performance. If an organisation notices, recognises and rewards specific behaviour or
performance, for example excellent customer service, that behaviour will tend to be
repeated and reinforced.
A fundamental reason for the use of recognition is that it has a positive impact on the
retention of employees. Nelson (2003:1), found evidence to support the link between
employee recognition and its impact on employee attraction and retention.
Nelson (2003:2) suggests that when organisations are building a business case to
support recognition, it is important to make a connection between employee recognition
and its impact on employee attraction and retention. Nelson (2003:2) uses figure 2.6
below to illustrate the link between recognition and employee retention:

44
Figure 2.6 The link between recognition and employee retention
Source: Nelson (2003:2)
CORPORATE AND DEPARTMENTAL RECOGNITION PROGRAMMES
(formal and informal activities
EMPLOYEE RECOGNITION
Positive Reinforcement of desired performance and behaviours
Positive and
consistent
feedback
Employees:
Understand their role in achieving organisational goals and priorities
Have improved relationships with their supervisor / manager
Feel valued
Have pride in one’s performance
Are more satisfied,
productive and engaged
Improved communication
Reinforced corporate
service values
Improved productivity
More supportive work
environment
Employee attraction
Employee retention
ACHIEVEMENT OF ORGANISATIONAL GOALS
ORGNISATIONAL SUCCESS

45
Government‟s Performance management and Development system provides a vehicle
for managers and supervisors to provide employees with the information they need to
do their jobs well. Employees look to their managers for feedback on their
performance. Constructive and consistent feedback whether it is in the form of praise
or suggestions for improvement can be a valuable form of recognition.
2.11.3 Guidelines for effective employee recognition
Nelson (2003:3) suggests that, in order for organisations to ensure that employee
recognition activities are effective, genuine and meaningful, they should consider the
following:
Recognition should be fair, transparent, inclusive, frequent, timely and varied.
The form of recognition used should be appropriate to the contribution that was
made.
Recognition should be meaningful and reflect the preferences of the recipient.
Recognition activities should be respectful of workplace diversity.
Employees at all levels should be involved in the development, implementation
and review of recognition programmes and practices.
When recognition is the result of a group or team effort, all contributing
members of the team should be recognised.
Recognition activities should be communicated and promoted to foster a culture
of recognition and pride among employees.
46
Heathfield (2008:21) adds the following guidelines for effective employee recognition:
Fairness, clarity and consistency
Employees need to see that each person who makes the same or similar
contribution has an equal likelihood of receiving recognition for the efforts.
Heathfield (2008:21) recommends that for regularly provided employee
recognition, organisations establish criteria for what makes an employee eligible
for the employee recognition. Anyone who meets the criteria will then be
recognised.
Employee recognition approaches and content must be inconsistent
This sounds contradictory to the point above. But in reality, organisations want
to offer employee recognition that is consistently fair, but they also want to
make sure that employee recognition efforts do not become expectations or
entitlements. As expectations, employee recognition efforts become
entitlements, which actually defeat the purpose of the whole process.
Organisations must be specific in letting the individual know the reason for
the recognition
The main purpose of feedback is to reinforce what the organisation would like
to see the employee do more of; the purpose of employee recognition is the
same. In fact, employee recognition is one of the most powerful forms of
feedback that an organisation can provide.
Offer employee recognition as close to the event recognised as possible
When an employee performs positively, recognition must be provided
immediately. It is likely that the employee is already feeling good about his /her
performance; the timely recognition of the employee will enhance the positive

47
feelings. This, in turn positively affects the employee‟s confidence in his/her
ability to do well in the organisation.
Heathfield (2008:23) lists the following initiatives to approach the provision of
employee recognition:
Table 2.3 Approaches to the provision of employee recognition
Money
Base Salary
Bonuses
Gift certificates
Cash rewards
Written words
Handwritten thank you notes
A letter of appreciation in the employee file
Handwritten cards to mark celebratory occasions
Recognition posted on the employee bulletin board
Contribution noted in the organisational newsletter
Positive attention from supervisory staff
Stop by an individual‟s workstation or office to talk informally
Provide frequent positive performance feedback
Provide public praise at a staff meeting
Take the employee out to lunch
Encourage employee development
Send people to conferences and seminars
Ask people to present a summary of what they learned at a conference or
seminar at a department meeting
Work out a written employee development plan
Make career development commitments and a schedule
Gifts
Organisation logo merchandise such as shirts, hats, mugs, jackets
Gift certificates to local stores
The opportunity to select items from a catalogue
The ability to exchange “positive points” for merchandise or entry into a
draw
The work itself
Provide cross training opportunities
Provide more of the kinds of work the employee likes and less of the
work they do not like
Provide opportunities for empowerment and self-management
Ask employee to represent the depart at an important external meeting
Have the employee represent the department on an inter-departmental
committee

48
Provide opportunities for the employee to determine their own goals and
direction
Participation in idea-generation and decision making
Symbols and Honours
Framed or unframed certificates to hang on the wall or file
Engraved plaques
Larger work area or office
More and/or better equipment
Provide status symbols, whatever they are in the organisation
Source: Heathfield (2008:23)
From the discussions above, it can be concluded that, organisations must decide what
they want to achieve through employee recognition efforts. Many organisations use a
scatter approach to employee recognition. They put a lot of emphasis on employee
recognition and hope that some efforts will stick and create the results they want. Or
they recognise so infrequently that employee recognition becomes a downer for the
many when the infrequent few are recognised. The most important part of any
recognition system is that it must be linked to organisational values and that it is
management-centred or driven. It is important for organisations to make employee
recognition a common practice, not a scarce resource. Organisations must develop a
work environment that fosters employee recognition, success and retention.

49
2.12 THE IMPACT OF STAFF ENGAGEMENT ON EMPLOYEE
RETENTION
Defining Employee Engagement
Vazirani (2007:2) defines employee engagement as the level of commitment and
involvement an employee has towards his or her organisation and its values. An
engaged employee is aware of the organisational context, and works with colleagues to
improve performance for the benefit of the organisation. The organisation must work to
develop and nurture engagement, which requires a two-way relationship between the
employer and the employee. Thus engagement is a barometer that determines the
associations of a person with the organisation.
An employee who is engaged is emotionally, cognitively and personally committed to
the organisation and its goals by exceeding the basic requirements and expectations of
the job (Bagraim, Cunningham, Potgieter and Viedge, 2007:14).
Greenberg (2004:1) defines employee engagement as the level of commitment and
involvement an employee has towards their organisation and its values. He states that
the primary behaviour of engaged employees are:
Speaking positively about the organisation to co-workers, potential employees
and customers.
Having a strong desire to be a member of the organisation.
Exerting extra effort to contribute to the organisation‟s success.
Many smart organisations work towards the development and nurturing of employee
engagement. It is important to note that employee engagement is a process that requires

50
a two-way relationship between employer and employee (Bagraim, Cunningham,
Potgieter and Viedge, 2007:14).
Bagraim et. al. (2007:14) continues to point out that engaged employees experience
meaning in their jobs, and, as a result, are responsible, accountable and innovative, form
strong relationships with co-workers and managers, and demonstrate organisational
citizenship behaviour. Employees who are engaged share their knowledge, experience,
insight and wisdom in the organisation, which, ultimately, gives an organisation a
competitive advantage.
2.12.1 The importance of employee engagement
An organisation‟s capacity to manage employee engagement is closely related to its
ability to achieve high performance levels and superior organisational results
(Greenberg, 2004:2). Engaged employees will stay with the organisation, be an
advocate of the organisation and its products and services, and contribute to the bottom
line organisational success. Also, engaged employees normally perform better and are
more motivated. Greenberg (2004:2) claims that there is a link between employee
engagement and profitability. Employee engagement is critical to any organisation that
seeks not only to retain valued employees, but also increase its level of performance.
2.12.2 Factors influencing employee engagement
Many organisational factors influence employee engagement and retention. Greenberg
(2004:3) proposes the following:
A culture of respect where outstanding work is valued.
Availability of constructive feedback and mentoring.
Opportunity for advancement and professional development.

51
Fair and appropriate reward, recognition and incentive systems.
Availability of effective leadership.
Clear job expectations.
Adequate tools to complete work responsibilities.
High levels of motivation.
Many other factors exist that might apply to a particular organisation and the
importance of these factors will also vary within the organisation.
2.12.3 Aspects of employee engagement
Vazirani (2007:4) states that the three basic aspects of employee engagement
according to the global studies are:The employees and their own unique
psychological makeup and experience.
The employers and their ability to create conditions that promote employee
engagement.
Interaction between employees at all levels.
2.12.4 Categories of employee engagement
According to Hoover (2005:84), there are three types of employees:
Engaged – engaged employees are builders. The want to know the desired
expectations for their role so they can meet and exceed them. They are naturally
curious about their organisation and their place in it. They perform at
consistently high levels. They want to use their talents and strength at work
every day. They work with passion and they drive innovation and move their
organisation forward.

52
Not engaged – not engaged employees tend to concentrate on tasks rather than
the goals and outcomes they are expected to accomplish. They want to be told
what to do just so they can do it and say they have finished. They focus on
accomplishing tasks rather than achieving an outcome. Employees who are not
engaged tend to feel their contributions are being overlooked, and their potential
is not being tapped. They often feel this way because they do not have
productive relationships with their managers or with their co-workers.
Actively disengaged – the actively disengaged employees are the “cave
dwellers.” They are consistently against virtually everything. They are not just
unhappy at work; they are busy acting out their unhappiness. They sow seeds of
negativity at every opportunity. Everyday these employees undermine what
their engaged co-workers accomplish. As workers increasingly rely on each
other to generate products and services, the problems and tensions that are
fostered by actively disengaged workers can cause great damage to an
organisation‟s functioning.
2.12.5 The importance of employee engagement
Vazirani (2007:6) states that engagement is important for managers to cultivate due to
the fact that disengagement or alienation is central to the problem of workers‟ lack of
commitment and motivation Meaningless work is often associated with apathy and
detachment from one‟s work He further points out that an organisation‟s capacity to
manage employee engagement is closely related to its ability to achieve high
performance levels and superior organisational results.

53
2.12.6 Advantages of having engaged employees
According to Vazirani (2007:6) some of the advantages of having engaged employees
are listed in table 2.4 below:
Table 2.4 Advantages of having engaged employees
Advantages of having Engaged Employees
Engaged employees will stay
with the organisation, be an
advocate of the organisation, its
products and services, and
contribute to bottom line
organisational success.
Employee engagement builds
passion, commitment and
alignment with the
organisation‟s strategies and
goals.
Employee engagement
increases trust in the
organisation.
Employee engagement creates a
sense of loyalty in a
competitive environment.
Employee engagement provides
a high-energy working
environment.
Employee engagement boosts
organisational growth.
Engaged employees will
normally perform better and
are more motivated.
There is a significant link
between employee
engagement and profitability.
They form an emotional
connection with the
organisation. This impacts
their attitude towards the
organisations‟ clients, and
thereby improves customer
satisfaction and service levels.
Employee engagement makes
the employees effective brand
ambassadors for the
organisation.
Source: Vazirani (2007:6)
A highly engaged employee will consistently deliver beyond expectations. In the
workplace research on employee engagement (Harter, Schmidt and Hayes, 2002:268)
have repeatedly asked employees “whether they have the opportunity to do what they
do best every day.” While one in five employees strongly agrees to this statement, those
work units scoring higher on this perception have substantially higher performance.

54
Thus employee engagement is critical to any organisation that seeks to retain valued
employees. As organisations globalise and become more dependent on technology in a
virtual working environment, there is a greater need to connect and engage with
employees to provide them with an organisational identity.
2.12.7 Factors leading to employee engagement
According to Vazirani (2007:7) the following factors lead to employee engagement:
Figure 2.7 Factors leading to employee engagement
Career Development – opportunities
for personal development E
N
G
A
G
E
M
E
N
T
Career Development – effective
management of talent
Leadership – clarity of organisational
values
Leadership – respectful treatment of
employees
Leadership – organisation‟s standards
of ethical behaviour FEELING
VALUED
AND
INVOLVED
Equal opportunities & fair treatment
Pay and benefits
Health & safety
Job Satisfaction
Communication
Family friendliness
Cooperation
Source: Vazirani (2007:7)
Career Development – Opportunities for Personal Development –
organisations with high levels of engagement provide employees with
opportunities to develop their abilities, learn new skills, acquire new knowledge

55
and realise their potential. When organisations plan for the career paths of their
employees and invest in them, in this way their people invest back in the
organisations.
Career Development – Effective Management of Talent – career development
influences engagement for employees. Retaining the most talented employees
and providing opportunities for personal development becomes an important
issue to be considered by organisations.
Leadership – Clarity of Organisational Values – employees need to feel that
the core values for which their organisation stand are unambiguous and clear.
Leadership – Respectful Treatment of Employees – successful organisations
show respect for each employees‟ qualities and contribution regardless of their
job level.
Leadership – Organisation’s Standards of Ethical Behaviour – an
organisation‟s ethical standards also lead to engagement of an individual.
Empowerment – employees want to be involved in decisions that affect their
work. The leaders of high engagement workplaces create a trustful and
challenging environment, in which employees are encouraged to dissent from
the prevailing orthodoxy and to input and innovate to move the organisation
forward.
Image – how much employees are prepared to endorse the products and services
which their organisation provides to its customers depends largely on the
perceptions of the quality of those goals and services. High levels of employee
engagement are inextricably linked with high levels of customer engagement.

56
Other Factors
Vazirani (2007:8) goes on to add the following factors that lead to employee
engagement:
Equal Opportunities and Fair Treatment – the employee engagement levels
would be high if their bosses (superiors) provide equal opportunities for growth
and advancement to all the employees.
Performance Appraisal – fair evaluation of an employee‟s performance is an
important criterion for determining the level of employee engagement. The
organisation which follows appropriate performance appraisal techniques
(which are transparent and not biased) will have high levels of employee
engagement.
Pay and Benefits – an organisation should have a proper pay system so that
employees are motivated to work in the organisation. In order to boost
engagement levels, employees should also be provided with certain benefits and
competitive compensation.
Health and Safety – research indicates that the engagement levels are low if the
employee does not feel secure while working. Therefore organisations should
adopt appropriate methods and systems for the health and safety of their
employees.
Job Satisfaction – only a satisfied employee can become an engaged employee.
Therefore it is essential for an organisation to see to it that the job given to the
employee matches his/her career goals. This will make employees enjoy their
work and ensure job satisfaction.

57
Communication – the organisation should follow the open door policy. There
should be both upward and downward communication with the use of
appropriate communication channels in the organisation. If the employee is
given a say in the decision making and has the right to be heard, then the
engagement levels are likely to be high.
Family Friendliness – a person‟s family life influences his/her work life. When
an employee realises that the organisation is considering his/her family‟s
benefits also, he/she will have an emotional attachment with the organisation
which leads to engagement.
Cooperation – if the entire organisation works together by helping each other,
i.e., all the employees as well as the supervisors coordinate well, then the
employees will be engaged.
Vance (2004:28) proposes that engaged employees can help an organisation achieve its
mission, execute its strategy and generate important organisational results. Employee
engagement is more complex than it may appear on the surface. The decision to invest
in strengthening engagement or commitment depends on an organisation‟s strategy and
the makeup of its workforce. It is vital to consider the organisation‟s view of
engagement, as well as its strategy and workforce composition.
It can be concluded that employee engagement is a positive attitude shown by
employees towards the organisation and its values. It is rapidly gaining popularity, use
and importance in the workplace and impacts organisations in many ways. Employee
engagement emphasises the importance of employee communication on the success of
an organisation. An organisation should thus recognise employees, more than any other
variable, as powerful contributors to an organisation‟s competitive position. Therefore,

58
employee engagement should be a continuous process of learning, improvement,
measurement and action.
2.13 THE IMPACT OF MANAGEMENT ON EMPLOYEE RETENTION
The vast technological advances of the past two decades, coupled with the increasing
openness of the world, have significantly changed the way organisations operate.
Remarkable shifts can also be seen in how employees go about their daily tasks, and
relate to one another and to their managers.
To adapt to this fast and ever changing world, managers have to be equipped not only in
their fields of expertise, but also in directing huge teams of people to repurpose the 21st
century organisation.
2.13.1 Defining Management
Kreitner et. al. (2002:8), as cited in Bagraim et. al. (2007:8) define management as the
process of working with and through others to achieve organisational objectives in an
efficient and ethical manner.
Bagraim et. al. (2007:10) argue that managers operate in a much unstructured
environment and they have to respond rapidly to demands that are often unpredictable.
Managing in a global environment has many implications.
Employees want more than money to stay with an organisation. Although pay
sometimes becomes a justification and often shows up in exit interviews, most
employees stay in organisations because they have a trusting relationship with their
managers. Given the frequent changes in management, reorganisation, mergers and the

59
like, building and maintaining a trusting two-way relationship is becoming harder than
ever for managers.
2.13.2 A perspective on management in a South African organisation
De Villiers (2007:xviii) states that management is vital both for the success of an
organisation as well as fostering relationships with other stakeholders in the
organisations. The primary role of management is to ensure sustainable profitability of
the organisation. This result is dependent on the internal management of people and
resources and especially the ability to retain best performing employees.
2.13.2.1 Management Style Descriptions
Rhema Group (2008:7) provides the following descriptions of management styles:
Autocratic / Bureaucratic
Provides clear direction (what and how).
Monitors closely.
Ensures compliance to policies / procedures.
Controls high risk or crisis situations.
Autocratic / Participative
Sells requirements to other to gain “buy-in.”
Manages with tight controls.
Ensures compliance to established standards.
Involves people on certain issues.

60
Democratic / Participative
Shares direction / requirement with others.
Manages through participation / involvement.
Encourages people to provide ideas.
Builds teams and desires a peer relationship with direct reports.
Freedom with Control
Agrees on parameters with freedom to act with direct reports.
Manages through the use of selective controls.
Encourages people to become more self-sufficient and self managing.
Supports an individual‟s development.
Coaching / Supporting
Empowers people to be self-managing.
Seeks feedback for continuous improvement.
Provides coaching / mentoring, as needed.
Actively encourages personal growth.
2.13.3 Qualities of a good manager
In a research conducted by Mastery Works Inc, Farren (2008:1) reports that one of the
top three factors affecting an employees‟ decision to leave an organisation was whether
the manager developed a trusting relationship with the employee. Some of the phrases
employees used to describe great managers are tabled below:

61
Table 2.5 Description of great managers by employees
DESCRIPTION OF GREAT MANAGERS BY EMPLOYEES
Respectful
Supportive
Challenging
Developed unique talent
Family conscious
Trustworthy
Integrity
Provided career opportunities
Cared
Helped me learn from mistakes
Supported risk taking
Went to bat for me
Talked about long term goals
Source: Farren (2008:2)
The survey found that managers who respected and valued employees‟ competency,
paid attention to their aspirations, assured challenging work, valued the quality of work
life and provided chances for learning had loyal and engaged employees. In these days
of corporate scandals, having a manager with integrity and respect has become more
important than ever.
The majority of survey respondents indicated that they wanted to stay in their
organisations. They would rather not have to start all over again in another organisation
and rebuild their reputation, network, comfort level and confidence. However, if the
desired conditions are not available within their current organisation, they will move on
– whether they want to or not. Ease of movement, of course, is likeliest for the most
valuable and highly marketable employees. These are the first to leave and hardest to
replace. And, managers are frequently the cause of dissatisfaction, disengagement and
resignations Farren (2008:2).
2.13.4 The role of management in employee retention
Managers can help promote an organisation and make it attractive to employees, or they
can be the cause of high turnover. Managers often are less directly involved in the early

62
recruiting stages, and they usually become more actively involved at the selection stage.
Then, once the employees are on board, the manager plays a key role in determining
whether good employees stay with the organisation or leave for something better
(Schuler and Jackson, 2006:220).
Heathfield (2008:1) postulates that employees leave managers and supervisors more
often than they leave organisations or jobs. In other words, the most common cause of
employee turnover is the lack of a positive relationship between the employee and the
manager or supervisor. He further argues that it is not enough that management is liked
by the employees. Starting with clear expectations of the employee, management has a
critical role to play in retention. Anything that management does to make the employee
feel unvalued will contribute to turnover. Heathfield (2008:1) lists the following
frequent employee complaints:
Lack of clarity about expectations.
Lack of clarity about earning potential.
Lack of feedback about performance.
Failure to hold scheduled meetings, and
Failure to provide a framework within which the employee perceives she/he can
succeed.
Flex Execs Management Solutions (2010:2) postulate that the answer is that most
people leave their jobs because of their manager, supervisor or team leaders. One may
ask what it is about this workplace relationship that makes it the number one reason so
many people leave their jobs. Basically, it is the lack of trust, communication, relevant
and timely feedback, appreciation, fair treatment and information.

63
Managers must routinely brush up on effective management techniques to handle a
workforce that is probably older and grayer, more focused, knows its value, and is not
afraid to walk out the door if treated unfairly or feel unwanted and unchallenged by
management.
2.13.5 Techniques to assist management
Fields (2001:218) lists the following brief overview of management and executive
programmes that can help management build their skills and abilities to better retain
employees.
Delegation: Management must learn techniques that ensure their success as well
as that of their staff.
Disciplinary action and handling difficult employees: Management must
learn proven approaches for handling disciplinary action and difficult
employees.
Effective communication skills: Management must learn how to communicate
up, down and across the organisation.
Effective interviewing skills: Management must update skills to select the right
candidates the first time around.
Human resources and the law: Management must be able to cut through the
legal issues and human resource jargon. This practical knowledge will help to
avoid costly mistakes.
Human resources management for non-human resource professionals:
Management should have essential human resources related tools and
knowledge so they can manage more effectively and be more attuned to
potential legal liability issues.

64
Individual career enhancement: Management must convey the “upside” of
change and how it can positively affect an employee‟s career.
Management roles and responsibilities: Management teams will be elevated
in order to clarify, understand, and successfully conduct their managerial
functions.
Managing across generations: Management must acquire the skills necessary
to manage the issue of diversity.
Managing diversity and diversity awareness: Management must learn to
manage and value diversity in the evolving workplace.
Meeting management: Management must learn to make all meetings more
productive and effective.
Motivational leadership: Management should be leaders who energise and
empower others to excel and achieve.
Performance management: Management ought to be able to link individual,
team, and organisational objectives.
Project management: Management need to be equipped with the skills to
manage projects successfully from start to finish.
Rewards and motivation during constant change: Management must
understand how to maintain high staff morale and reward and motivate them in
these ever-changing times.
Strategic planning and goal-setting: Management must set measurable goals
and craft a shared vision and strategic direction.
Team building: Management must learn how to develop and motivate teams.

65
Time management: Management must be able to utilise time effectively to
avoid undue stress, achieve a greater balance between work and personal life,
improve productivity, and attain goals.
2.13.6 The influence of management on job satisfaction
According to Hildebrand (2008:3) the employee‟s relationship with the supervisor has
the greatest impact on whether to stay or go, because a supervisor has control over the
CORE elements that create job satisfaction i.e. Compensation, Opportunity,
Recognition and Environment. It is therefore important to hold management
accountable for retaining a thriving workforce. This means that not only do
organisations need a performance management system that recognises and rewards
management for meeting objectives that reduce employee turnover; managers need to
understand what steps they can take to meet their responsibility in employee retention.
To assist management in embracing their accountability for employee retention,
Hildebrand (2008:4) suggests the following interventions as they relate to the CORE
elements of job satisfaction:
Compensation
Employees are encouraged to do their jobs and do them well. However, to increase
their compensation package they are going to have to do a lot more. Managers are
advised to:
Routinely monitor internal pay equity among staff members and recommend
adjustments when needed.
Reward performance not for seniority.

66
Establish an incentive-based compensation plan where at least some portion
of earnings is determined by successful completion of objectives in order to
encourage achievement.
Opportunity
Routinely discuss career plans with each staff member then provide
development opportunities based on their skills, interests and goals.
Work with each employee to help them identify reasonable and reachable
performance objectives.
Ask for ideas and input on how and where to make improvements in
programmes, systems, services, processes and procedures.
Involve those who implement decisions into the decision-making process.
Recognition
Encourage mutual recognition among co-workers.
Praise employees even for small steps.
Recognise individuals as well as team accomplishments.
Individualise recognition by asking each employee how to best demonstrate
appreciation for them.
Environment
Encourage cooperation through teamwork.
Lead by example – only hold others to high standards after meeting them
yourself.
Create trust by practicing open communication.
Build a flexible work environment that welcomes new ideas, risk taking, and
does not carve all decisions in stone.
Routinely provide feedback and solicit it from others.

67
The only way to truly understand employees is to ask them what they want and to find
out what can be done to help them reach their goals. By asking, becoming involved,
and being accountable, supervisors can go a long way in improving employee job
satisfaction as well as retention (Hildebrand, 2007:5).
2.13.7 Roles and responsibilities for recruiting and retaining employees
Schuler and Jackson (2006:221) list several ways that employees, employers and
managers can be involved in during the recruitment and retention of employees. These
are summarised in the table 2.5 below:
Table 2.6 Roles and responsibilities for recruiting and retaining employees
Line Managers HR Professionals Employees
Work with HR staff to
develop recruiting
objectives and plans
that meet the
organisation‟s
strategic needs and
address employees‟
concerns.
Work with line
managers to
develop recruiting
objectives and
plans that meet the
organisation‟s
strategic needs and
address employee‟s
concerns.
Openly discuss
your short term and
long-term goals in
order to facilitate
the development of
recruiting plans
that address your
concerns.
Develop an
understanding of the
linkages that exist
between recruiting
activities, other
aspects of the HRM
system, and longer
term employee
retention.
Design recruitment
and retention
activities that
contribute to the
development of
integrated,
internally
consistent HRM
systems.
When searching for
work, consider all
aspects of the
HRM system
before making a
decision about
where to work.
Help disseminate
information about
open positions to all
potentially qualified
internal candidates.
Develop recruiting
plan that meet legal
guidelines and
generate a diverse
pool of qualified
internal and
external
candidates.
Participate in
recruiting efforts
such as referring
others to the
company and
answering
questions about
what it is like to
work there.

68
Stay informed of
labour market trends
in order to anticipate
the implications for
recruiting and
retaining talent.
Evaluate recruiting
outcomes and be
innovative in
developing
practices to ensure
a sufficient number
of qualified
applicants.
Use knowledge of
competitors‟
recruiting
approaches to help
your employer
develop innovative
and more effective
practices.
Understand and abide
by relevant legal
regulations.
Provide training as
needed to line
managers and
employees
involved in
recruitment
activities.
Work with HR
professionals and
line managers in
the organisation‟s
efforts to
effectively manage
workforce
diversity.
Facilitate retention
efforts by being
supportive of
employees and
facilitating their
development.
Monitor retention
patterns to
diagnose potential
problems. Use exit
interviews,
employee surveys,
etc. to identify
needed
improvements.
Seek out
information about
openings within the
company and
actively pursue
those that fit your
personal career
objectives.
Source: Schuler and Jackson (2006:221)
2.13.8 Creating an A+ manager
Farren (2008:2) postulates that while analysing why people stayed or left an
organisation, five management practices emerged as hallmarks of a manager with high
retention rates. When the practices were present, employees stayed because they felt
appreciated and knew how they could contribute to the organisation now and in the
future. When the practices are not regularly embodied and reinforced by management,
loss of key people increases. These practices include:
Appreciating the uniqueness of each employee – values, interests, skills,
knowledge, style and work/life balance needs.

69
Assessing and giving frequent feedback to employees – performance, reputation
and network.
Anticipating and speaking about the future of the organisation – industry,
organisation, profession and job trends.
Aligning employees‟ goals and aspirations with the mission and strategies of the
organisation.
Accelerating learning, mentoring, training and on-the-job development
opportunities.
From the above discussion, it can be concluded that it is important for management to
understand the causes of turnover. Most employees stay in organisations because they
have a trusting relationship with their managers. Given the frequent changes in
management, reorganisations, mergers and the like, building and maintaining a trusting
two-way relationship with employees is becoming critical to ensure employee retention.

70
CHAPTER 3
3. RESEARCH METHODOLOGY AND BIOGRAPHICAL
ANALYSIS OF RESPONDENTS
3.1 INTRODUCTION
Chapter three begins with a discussion of the research methodology used in the study.
The methodology used (quantitative) is discussed from a theoretical perspective, and
then for application and use. Information regarding the survey (questionnaire) design is
presented. The questions in the questionnaire are explained using examples of how the
respective questions were arrived at, and for what purpose. Prior to distribution of the
questionnaire, a pilot study of the questionnaire was conducted to test for accuracy
relating to the responses. Statistical analysis theory and presentation of information in
this chapter provides information on how best to analyse the survey results for the
purpose of presentation style and technique.
A full review of the biographical information of the survey results are presented toward
the end of this chapter, followed by concluding remarks. The most pertinent results at
this point in the research are that: a 54% response rate was obtained; and that 86% of
respondents are permanently employed, 78% are females, 84% are African.
3.2 RESEARCH METHODOLOGY
3.2.1 Research theory
Leedy and Ormrod (2005:2) define research as a systematic process of collecting,
analysing and interpreting information (data) in order to increase our understanding of
the phenomenon in which the researcher is interested.

71
3.2.2 The research process
Research is, according to Leedy and Ormrod (2005:6), by its nature, cyclical. The
research process follows a cycle and follows logical and developmental steps. These
steps, as highlighted by Leedy and Ormrod (2005:7) are summarised in figure 3.1
below:
FIGURE 3.1 The research cycle
Source: Leedy and Ormrod (2005:7)
Research is a
cyclical process
(6)
Research interprets the meaning of the data, which leads to a resolution of the problem, thus confirming
or rejecting the hypotheses.
(1)
Research begins with a problem: an unanswered
question in the mind of the researcher.
(2)
Research defines the goal in terms of a clear
statement of the problem.
(3)
Research subdivides the problem into appropriate
subproblems.
(4)
Research posits tentative solutions to the problem(s)
through reasonable hypotheses. these
hypotheses direct the researcher to appropriate
data.
(5)
Research looks for data directed by the hypotheses
and guided by the problem. the data are
collected and organised.

72
Qualities of a good researcher according to Collis and Hussey (2003:2) are good
communication skills, intellectual skills, information technology skills, organisational
skills, must be motivated to complete the research project, must be able to work
independently and must be aware of his/her personal strengths and weaknesses.
The different types of research, as listed by Collis and Hussey (2003:10) are defined
below:
Exploratory research – is conducted into a research problem or issue when
there are very few or no earlier studies to which we can refer for information
about the issue or problem. The aim of this type of study is to look for patterns,
ideas or hypotheses, rather than testing or confirming a hypothesis.
Descriptive research – is research which describes phenomena as they exist. It
is used to identify and obtain information on the characteristics of a particular
problem or issue.
Analytical research – goes further than descriptive research. The researcher
goes beyond merely describing the characteristics, to analysing and explaining
why or how it is happening. Thus, it aims to understand phenomena by
discovering and measuring causal relations among them.
Collis and Hussey (2003:47) purport that there are two main research paradigms,
namely: the positivist (quantitative) and the phenomenological (qualitative).
Leedy and Ormrod (2005:94) define quantitative research as research used to answer
questions about relationships among measured variables with the purpose of explaining,
predicting, and controlling phenomena. This approach is sometimes called the
traditional, experimental, or positivist approach.

73
In contrast, they (Leedy and Ormrod, 2005:94) also define qualitative research as
typically used to answer questions about the complex nature of phenomena, often with
the purpose of describing and understanding the phenomena from the participants‟ point
of view. The qualitative approach is also referred to as the interpretative, constructivist,
or post positivist approach.
The use of different research approaches, methods and techniques in the same study is
known as triangulation (Collis & Hussey, 2003:78).
Gill and Johnson (2002:229) define triangulation in three ways:
(i) The use of different research methods in the same study to collect data so as to
check the validity of any findings.
(ii) The collection of different data upon the same phenomena, sometimes using
different researchers so as to validate any findings.
(iii) Collecting data upon the same phenomena at different times and places within
the same study.
It is against the background of the theoretical information presented in the previous
paragraphs that this section, the Research Methodology, of the study is presented.
Methodology according to Leedy and Ormrod (2005:12) is the general approach the
researcher takes in carrying out the research project; to some extent, this approach
dictates the particular tools the researcher selects.
3.2.3 The research problem
In chapter one of this study, insights into the problem area (namely the high cost of
turnover and the intensification of the employer-of-choice concept) gave rise to the
selected problem: “Organisational factors impacting on employee retention”.

74
3.2.4 Application of methodology
The main objective of the research was to look at organisational factors impacting on
employee retention with a view to assisting DEDEA to be able to develop a retention
strategy that will be informed by the outcome of the study, taking into account the
selected five organisational factors. This was done by reviewing literature on the
identified factors (career development, remuneration, positive recognition, employee
engagement and management) impacting on employee retention.
Thus, the methodology employed in this study is methodological triangulation (Collis
and Hussey, 2003:78), which is a combination of quantitative and qualitative methods
of research. This also provides for enhanced validity as argued by Gill and Johnson
(2002:229). Both primary research (survey) and secondary research (internal and
external published and unpublished media) sources have been used.
3.3 THE LITERATURE REVIEW
According to Gill and Johnson (2002:24) any research project will necessitate reading
what has been written on the subject and gathering it together in a critical review which
demonstrates some awareness of the current state of knowledge on the subject, its
limitations and how the proposed research aims to add to what is known.
Leedy and Ormrod (2005:64) state the following benefits of a literature review:
It can offer new ideas, perspectives, and approaches that may not have occurred
to the researcher.
It can inform the researcher about other researchers who conduct work in the
area of interest – individuals whom the researcher may wish to contact for
advice or feedback.

75
It can show the researcher how others have handled methodological and design
issues in studies similar to the researcher‟s own.
It can reveal sources of data that the researcher may not have known existed.
It can introduce the researcher to measurement tools that other researchers have
developed and used effectively.
It can reveal methods of dealing with problem situations that may be similar to
difficulties the researcher is facing.
It can help to interpret and make sense of the researcher‟s own finding and
ultimately, help to tie the researcher‟s results to the work of those who have
conducted research in the same field.
It will bolster the researcher‟s confidence that the topic is one worth studying,
because one will find that others have invested considerable time, effort, and
resources in studying it.
The literature search according to Collis and Hussey (2003:84) is a process of finding as
much secondary data (i.e. data which already exists) as possible. The search therefore
included research databases on the Nelson Mandela Universities (NMMU) off-campus
website, such as EBSCOHost and the NMMU‟s library database. Other sources
included the World Wide Web and various published and unpublished sources.
The literature search was specifically based on organisational factors impacting on
employee retention. The aim was a deliberate attempt to avoid reading too deeply into
employee retention strategies, thereby creating a fresh look at how DEDEA can use the
information gathered during the survey to tailor make its own retention strategy that
will take into consideration the impact of the selected five organisational factors
impacting on employee retention.

76
3.4 THE QUESTIONNAIRE
According to Collis and Hussey (2003:173), questionnaires are associated with both
positivistic and phenomenological methodologies. They (Collis and Hussey) describe a
questionnaire as a list of carefully structured questions, chosen after considerable
testing, with a view to eliciting reliable responses from a chosen sample. The aim is to
find out what a selected group of participants do, think or feel.
3.4.1 Design of the questionnaire
Because the questionnaire was based on actual strategy rather than retention theory,
design issues were to some extent demanding. The design had to be formulated from
scratch using a combination of factors identified within chapter two of the study. The
questionnaire was, however, designed with simplicity in mind. Much effort was put in
ensuring that there is balance between simplicity in design and focusing on answering
the research problem, i.e. the assessment of the extent to which the five identified
organisational factors impact on employee retention.
The design was divided into two sections,
Section one – Demographic profiling (see attached Appendix B)
Section two – nine sub-sections detailing the organisational factors impacting on
employee retention listed from A - F (also in Appendix B):
A. Retention Strategies
B. Career Development
C. Remuneration
D. Positive Recognition

77
E. Staff Engagement
F. Management
The contributions of Schuler and Jackson (2006) were seen to encompass much of the
literature study as presented in chapter two. This formed the basis of the questionnaire
design, more so from an academic framework perspective; because of its generic
direction about retention issues, i.e. headings B, C, D, E, and F. Some questions were
drawn for the writings of other sections of the literature study within chapter two. This
was in order to strengthen the strategic direction of the questionnaire. Examples of
these questions are from sub-section A, G, H, I.
3.4.2 Design of the questions
A Likert rating scale as described in Collis and Hussey (2003:184) was used for section
two of the questionnaire. The questions were turned into statements and the
respondents were asked to indicate their level of agreement by checking the chosen box
with an “x”.
With the exception of sub-section I, all question statements were posed in a positive
context. The benefit of this was to discourage leading statements, i.e. leading the
respondent into a negative context. It is after all, the negative context that the
researcher attempted to invalidate, but if established, it is an indication of a problem
area. Therefore, if the answer is “Disagree”, then it is actually so. Collis and Hussey
(2003:185) propose that questions of a sensitive nature should be avoided, or if asked,
they should be towards the end of the questionnaire; however they strongly advise
against asking negative questions.

78
3.4.3 Testing the questionnaire
Prior to distribution, the questionnaire was tested on fifteen respondents in a pilot study.
A pilot study is an essential element of testing the questionnaire prior to distribution.
The questionnaire was submitted to these respondents via e-mail. Collis and Hussey
(2003:175) suggest that the researcher can have colleagues or friends read through the
questionnaire and play the role of respondents, even if they know little about the
subject.
The test respondents were selected based on the following criteria:
They had to be known to the researcher for the sake of honest feedback;
They had to represent a broad spectrum of employment levels (1-16) as well as
race groups, so that the researcher could test language issues and the
respondents‟ understanding of the questions.
It is worth mentioning that no concerns were raised from the piloted group. With the
exception of a suggestion to include a section to address qualification and skills match
(which was done) all test respondents were satisfied with the questionnaire.
3.4.4 Distribution
Distribution of the questionnaire was via electronic mail to 781 respondents. The
mailing list of all respondents was obtained from the DEDEA address book which
includes the Bhisho head office, Amathole, Cacadu, Chris Hani, OR Tambo, Alfred
Nzo and Joe Gqabi Regional Offices. The questionnaire was supported with a covering
letter addressed to the respondents, requesting them to complete and return the
questionnaire. The covering letter (attached as annexure A) stated the purpose of the
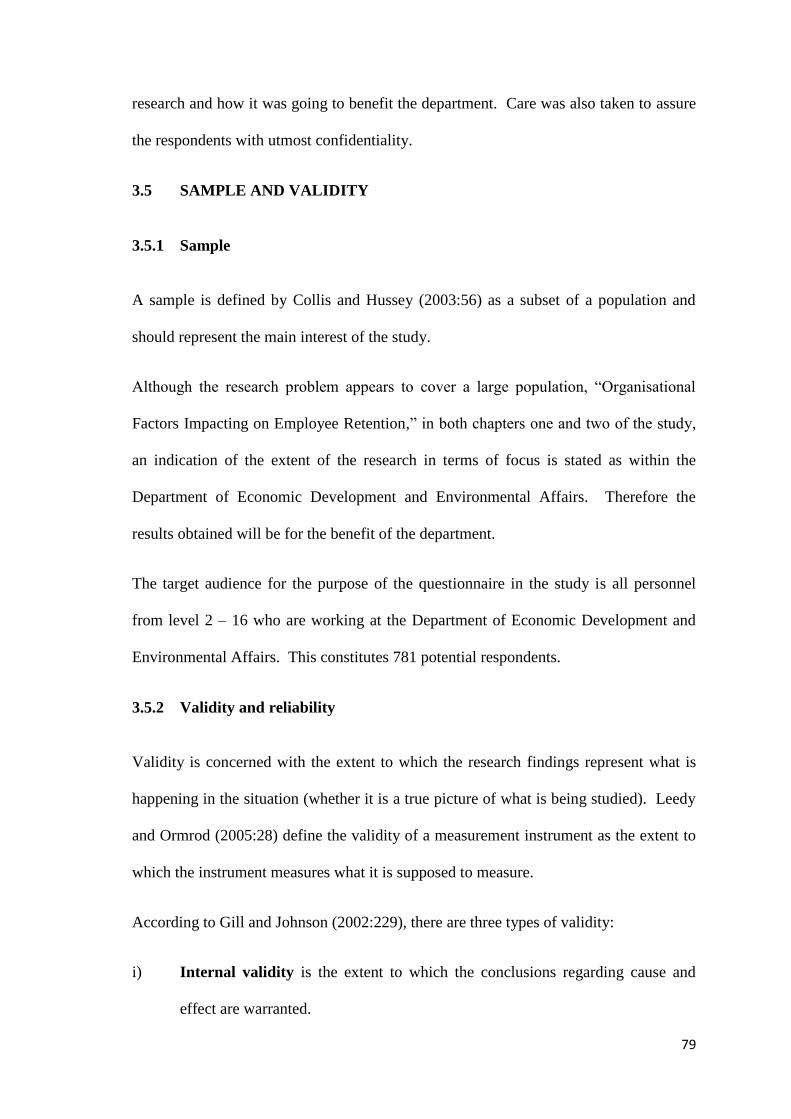
79
research and how it was going to benefit the department. Care was also taken to assure
the respondents with utmost confidentiality.
3.5 SAMPLE AND VALIDITY
3.5.1 Sample
A sample is defined by Collis and Hussey (2003:56) as a subset of a population and
should represent the main interest of the study.
Although the research problem appears to cover a large population, “Organisational
Factors Impacting on Employee Retention,” in both chapters one and two of the study,
an indication of the extent of the research in terms of focus is stated as within the
Department of Economic Development and Environmental Affairs. Therefore the
results obtained will be for the benefit of the department.
The target audience for the purpose of the questionnaire in the study is all personnel
from level 2 – 16 who are working at the Department of Economic Development and
Environmental Affairs. This constitutes 781 potential respondents.
3.5.2 Validity and reliability
Validity is concerned with the extent to which the research findings represent what is
happening in the situation (whether it is a true picture of what is being studied). Leedy
and Ormrod (2005:28) define the validity of a measurement instrument as the extent to
which the instrument measures what it is supposed to measure.
According to Gill and Johnson (2002:229), there are three types of validity:
i) Internal validity is the extent to which the conclusions regarding cause and
effect are warranted.

80
ii) Population validity is the extent to which conclusions might be generalised to
other people.
iii) Ecological validity is the extent to which conclusions might be generalised to
social contexts other than those in which data have been collected.
Collis and Hussey (2003:186) purport that reliability is concerned with the findings of
the research. The findings can be said to be reliable if the researcher or anyone else
repeated the research and obtained the same results.
3.6 STATISTICAL ANALYSIS
Each questionnaire received was printed, numbered and collated. The raw data was
tallied using Microsoft Excel spreadsheet. The use of statistical techniques on the Excel
spreadsheet assisted in adding up and deriving statistical data for analysis and decision
making.
3.7 ANALYSIS AND INTERPRETATION OF BIOGRAPHICAL DATA
3.7.1 Total Population – response rate
From the 781 questionnaires distributed, 425 responses were received, representing a
response rate of 54%. The balance of 356 questionnaires remains outstanding,
representing 46% of all respondents in the population. These are represented in Table
3.1 and in Figure 3.2 below.
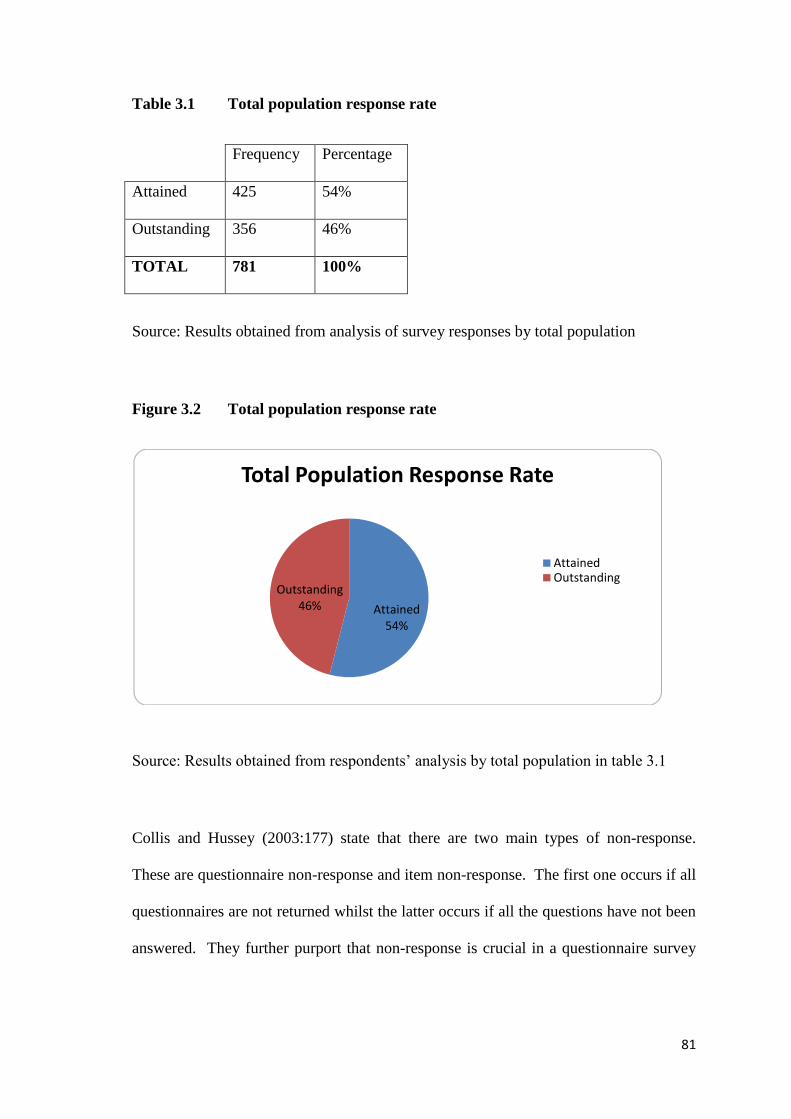
81
Table 3.1 Total population response rate
Frequency Percentage
Attained 425 54%
Outstanding 356 46%
TOTAL 781 100%
Source: Results obtained from analysis of survey responses by total population
Figure 3.2 Total population response rate
Source: Results obtained from respondents‟ analysis by total population in table 3.1
Collis and Hussey (2003:177) state that there are two main types of non-response.
These are questionnaire non-response and item non-response. The first one occurs if all
questionnaires are not returned whilst the latter occurs if all the questions have not been
answered. They further purport that non-response is crucial in a questionnaire survey
Attained54%
Outstanding46%
Total Population Response Rate
AttainedOutstanding

82
because the research design is usually based on the fact that the researcher will
generalise from the sample population.
Wallace and Mellor (1988) cited by Collis and Hussey (2003:177) describe methods for
dealing with non-response questionnaires as follows:
To analyse and compare responses by date of reply. One method is to send a
follow-up letter to those who did not respond to the first request. The
questionnaires which result from the follow-up letter are then compared with
those from the first request
A comparison of the characteristics of those who responded with those of the
population, assuming the researcher knows them
A comparison of the characteristics of the respondents with non-respondents
from the sample, assuming the research has relevant data such as age,
occupation, etc.
In some cases, these methods were used by the researcher for non-response
questionnaires, each one of which is explained below:
3 x response questionnaires: the “Nationality” portion was not completed (the
response questionnaires were still used, as the researcher knew the respondents);
2 x response questionnaires: the “Current Salary” portion was not completed
(the response questionnaires were still used, as the researcher had access to a
DEDEA HR report);
6 x response questionnaires: section B of the questionnaires was not completed
(these could not be used in the survey and were therefore omitted).

83
3.7.2 Branch office – response rate
Out the 425 questionnaires received, 121 were received from Bhisho Head office,
representing 28% of the total response; 89 were received from the Cacadu Regional
Office, representing 21% of the total response; 69 were received from the Amathole
Regional Office, representing 16% of the total response; 50 were received from the OR
Tambo Regional Office, representing 12% of the total response; 34 were received from
Alfred Nzo, representing 8% of the total response; 32 were received from the Chris
Hani Regional Office, representing a 7.5% (rounded off to 8%) of the total response and
30 were received from the Ukhahlamba Regional Office, representing 7% of the total
response.
These are represented in Table 3.2 and Figure 3.2 below:
Table 3.2 Branch office – response rate
Frequency Percentage
Bhisho Head Office 121 28%
Cacadu regional Office 89 21%
Amathole Regional Office 69 16%
OR Tambo Regional Office 50 12%
Alfred Nzo Regional Office 34 8%
Chris Hani Regional Office 32 8%
Ukhahlamba Regional Office 30 7%
TOTAL 425 100%
Source: Results obtained from analysis of survey responses by branch office

84
Figure 3.3 Branch office response rate
Source: Results obtained from respondents‟ analysis by branch office in table 3.2
3.7.3 Position in the organisation – response rate
The response rate by position in the organisation is divided between three categories,
namely: permanent, contract and intern. From the received questionnaires, 365 are
permanent which constitutes 86% of the respondents; 55 are on contract, representing
13% of the respondents and 5 are interns, representing 1% of the respondents. These
are presented in Table 3.3 and in Figure 3.4 below:
28%
21%
16%
12%
8% 8% 7%
0
5
10
15
20
25
30
Branch Office
Branch Office

85
Table 3.3 Position in the organisation
Frequency Percentage
Permanent 365 86%
Contract 55 13%
Intern 5 1%
TOTAL 425 100%
Source: Results obtained from analysis of survey responses by employee position in the
organisation
Figure 3.4 Position in the organisation
Source: Results obtained from analysis of survey responses by position in the
organisation in table 3.3
3.7.4 Age – response rate (Generation Subsets)
In the category of age (generation subsets); 8 employees were below 21 years,
representing a 2% response; 64 employees were between 21-29, with a 15% response;
189 employees were between 30-39, with a 44.5% response; 101 employees were
between 40-49, with a 24% response; 61 were between 50-59, with a 14% response and
Permanent86%
Contract13%
Intern1%
Position in the organisation
Permanent
Contract
Intern

86
2 employees were aged 60 years and more with a 0.5% response. These are represented
in Table 3.4 and in Figure 3.5 below.
Table 3.4 and figure 3.5 indicate that the organisation in which the survey was done has
a relatively young group of employees with 44.5% of the respondents falling into the
Generation X category (age 30-39), which could influence the process and strategies to
effectively retain them.
Table 3.4 Age (Generation Subsets)
Frequency Percentage
Generation Y 72 17%
Generation X 189 44.5%
Baby Boomer 162 38%
Matures / Veterans 2 0.5%
TOTAL 425 100%
Source: Results obtained from analysis of survey responses by generation subset
Figure 3.5 Age (Generation Subsets)
Source: Results obtained from analysis of survey responses by generation subset in
table 3.4
Gen Y17%
Gen X44.5%
BabyBoomer38%
Matures0.5%
Generation Subsets
Gen Y
Gen X
Baby Boomer
Matures

87
3.7.5 Gender – response rate
In the category of gender: 330 employees were females, representing a 78% response
and 95 employees were males, representing a 22% response. These are presented in
Table 3.5 and Figure 3.6 below:
Table 3.5 Gender – response rate
Frequency Percentage
Female 330 78%
Male 95 22%
TOTAL 425 100%
Source: Results obtained from analysis of survey responses by gender
Figure 3.6 Gender – response rate
Source: Results obtained from analysis of survey responses by gender
Female78%
Male22%
Gender
Female
Male

88
3.7.6 Nationality – response rate
The response rate by nationality is divided between the following groups: 357 Africans
which constitute 84% of the responses; 4 Indians, with a 1% response; 18 Coloureds
with 4% response; 46 Whites with 11% response. The two main sub-categories are
therefore Africans and Whites, followed by Coloureds. These are represented in table
3.6 and in Figure 3.6 below.
The survey results in table 3.6 and figure 3.7 indicate that the majority of the
respondents (84%) are Africans.
Table 3.6 Nationality response rate
Frequency Percentage
African 357 84%
Indian 4 1%
Coloured 18 4%
White 46 11%
Other 0 0
TOTAL 425 100%
Source: Results obtained from analysis of survey responses by nationality

89
Figure 3.7 Nationality response rate
Source: Results obtained from analysis of survey responses by nationality
3.7.7 Language – response rate
The response rate by language is divided between the following groups: 345 employees
had Xhosa as their home language which, constitutes 81.2% of the respondents; 48
employees had English as their home language, which constitutes 11.3% of the
respondents; 17 had Afrikaans as home language, which constitutes 4% of the
respondents; 6 had Zulu as home language, which constitutes 1.4% of the respondents
and 9 had other (specified as Northern Sotho and Venda) as their home language,
constituting 2.1%. These are represented in Table 3.7 and Figure 3.8 below:
African84%
Indian1%
Coloured4%
White11%
Other0%
Nationality
African
Indian
Colloured
White
Other
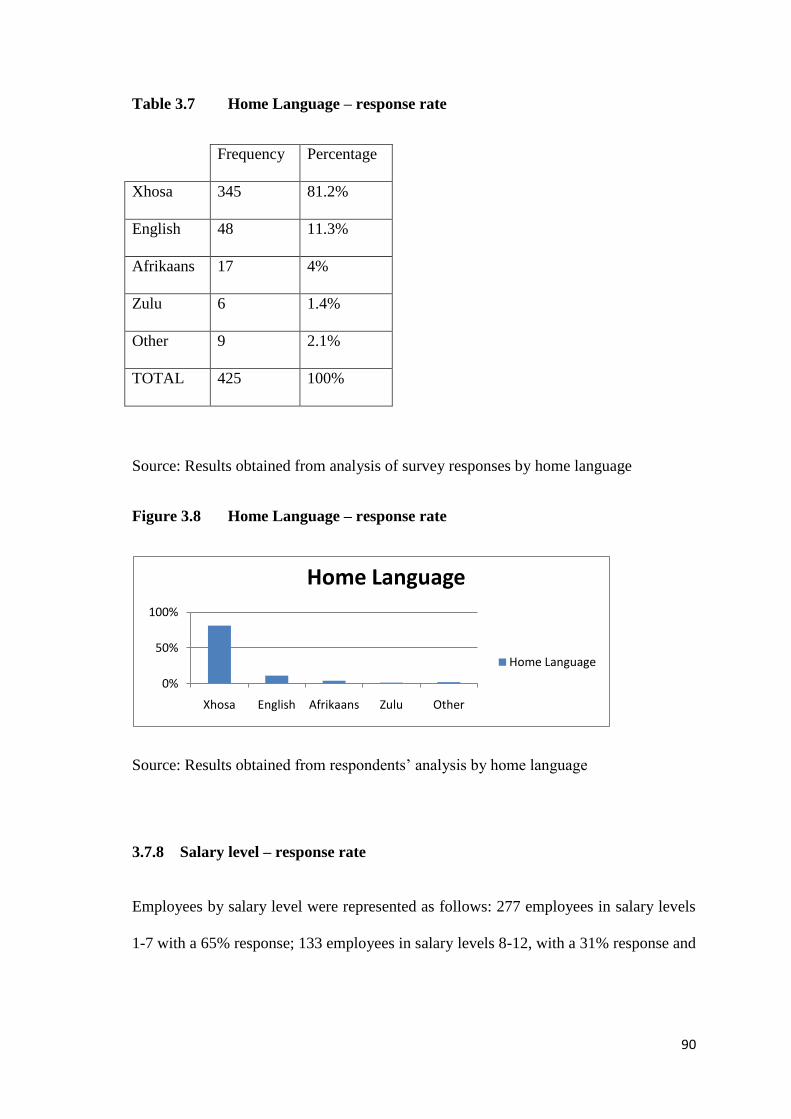
90
Table 3.7 Home Language – response rate
Frequency Percentage
Xhosa 345 81.2%
English 48 11.3%
Afrikaans 17 4%
Zulu 6 1.4%
Other 9 2.1%
TOTAL 425 100%
Source: Results obtained from analysis of survey responses by home language
Figure 3.8 Home Language – response rate
Source: Results obtained from respondents‟ analysis by home language
3.7.8 Salary level – response rate
Employees by salary level were represented as follows: 277 employees in salary levels
1-7 with a 65% response; 133 employees in salary levels 8-12, with a 31% response and
0%
50%
100%
Xhosa English Afrikaans Zulu Other
Home Language
Home Language

91
15 employees in salary level 13-16, with a 4% response. These are represented in Table
3.8 and Figure 3.9 below:
Table 3.8 Salary level – response rate
Frequency Percentage
Salary Level 1-7 277 65%
Salary Level 8-12 133 31%
Salary Level 13-16 15 4%
TOTAL 425 100%
Source: Results obtained from analysis of survey responses by salary level
Figure 3.9 Salary level – response rate
Source: Results obtained from analysis of survey responses by salary levels
0% 10% 20% 30% 40% 50% 60% 70%
Level 1-7
Level 8-12
Level 13-16
Salary Level
Salary Levels

92
3.7.9 Qualification – response rate
An error which occurred in the qualification category was made by omitting the sub-
category of below Matric. The respondents, however, indicated in their questionnaires
that they fall under the said sub-category. The correctness of the information provided
in this sub-category was verified by the DEDEA HR report. In this category, responses
were recorded as: 45 employees were below matric (11%); 79 employees have matric
(19%); 239 employees have a three year qualification (national diploma or degree)
(56%) and 62 employees have a post graduate qualification (BTech, Honours, Masters,
Doctorate) (14%). These are represented in Table 3.9 and Figure 3.10 below:
Table 3.9 Qualification – response rate
Frequency Percentage
Below Matric 45 11%
Matric 79 19%
National Diploma 239 56%
Post Graduate 62 14%
TOTAL 100%
Source: Results obtained from analysis of survey responses by qualification

93
Figure 3.10 Qualification – response rate
Source: Results obtained from analysis of survey responses by employee qualification
3.7.10 Years of service – response rate
Of the responses received: 36 employees were in the 6-12 month category, with 8%
response; 46 employees were in the 1-2 year category, with11% response; 101
employees were in the 2-3 year category, with 24% response; 97 employees were in the
3-5 year category, with 23% response; 98 were in the 5-10 year category, with 23%
response and 47 were in the 10 years and more category, with a 11% response. These
are represented in Table 3.10 and Figure 3.11 below:
Table 3.10 Years of service – response rate
Frequency Percentage
6-12 months 36 8%
1-2 years 46 11%
2-3 years 101 24%
3-5 years 97 23%
0% 20% 40% 60%
Below Matric
Matric
ND/Degree
Post Grad
Employee Qualification
Employee Qualification

94
5-10 years 98 23%
10 years + 47 11%
TOTAL 425 100%
Source: Results obtained from analysis of survey responses by years of service
Figure 3.11 Years of service – response rate
Source: Results obtained from analysis of survey responses by years of service
3.8 ANONYMITY
Collis and Hussey (2003:35) suggest that a researcher should offer the participants the
opportunity to remain anonymous. This means assuring participants that they will not
be identified with any of the opinions they express.
In this research also, anonymity and confidentiality have been observed.
0% 5% 10% 15% 20% 25% 30%
6-12 months
1-2 years
2-3 years
3-5 years
5-10 years
10 years+
Years of Service
Years of Service

95
3.9 CONCLUDING REMARKS
After extensive review of methodological theory, it was determined that a
methodological triangulation (a combination of quantitative and qualitative data)
method of research would be employed. The questionnaire was drawn up using
information emanating from the literature review in chapter two of the study, and
distributed to 781 respondents in Bhisho Head Office, Amathole, Cacadu, Alfred Nzo,
OR Tambo, Chris Hani and Joe Gqabi Regional Offices. The response rate was 54%
(425 responses).
Some of the key indicators in the biographical analysis of the survey results were as
follows: 84% of the respondents were Africans, followed by 11% White, and 4%
Coloured. 24% of the respondents were employed at DEDEA for between 2-3 years;
44.5% of respondents are Generation X‟s (aged between 30-39), 17% were Generation
Y‟s (aged between 18-29) and 38% were Baby Boomers (aged between 40-59).
96
CHAPTER 4
4. ANALYSIS AND INTERPRETATION OF RESEARCH RESULTS
4.1 INTRODUCTION
Chapter three described the research methodology used in this study. The empirical
study was conducted in order to investigate the organisational factors impacting on
employee retention. In this chapter the results of the empirical study will be analysed
and interpreted.
A summary of the responses received from the respondents to the questionnaire is
presented in tabular and graphical form and is presented in the same sequence as the
questions in the survey questionnaire. After each section, the results are discussed
For analysis purposes, all questionnaire responses were found to be reliable. The
chapter concludes with a summary of all the survey category results. The concluding
remarks of this chapter serve to shed more light on the discussion.
4.2 ORDINAL DATA SURVEY
According to Collis and Hussey (2003:202), ordinal data is nominal data (i.e. classified
into named categories) which has been ordered in some way. When analysing ordinal
data according to Collis and Hussey (2003:203) bar charts should be used for display
purposes. In light of this, bar charts and pie charts will be used in this chapter. The
statistics will be displayed in a proportionate manner showing the results for “Disagree”
(on the left) and “Agree” (on the right). Totals in each category will be averaged.

97
4.3 HOW DOES DEDEA MEASURE UP
The purpose of this section is to evaluate the impact of organisational factors on
employee retention.
Table 4.1 Retention Strategies
A) Retention Strategies
Q No I am encouraged to stay at
DEDEA because:
Disagree Agree TOTAL
1 DEDEA is a good investor in
people
No
%
148
35%
277
65%
425
100%
2 DEDEA fosters an
environment where diverse
individuals can work
together effectively
No
%
124
29%
301
71%
425
100%
3 Employees are valued as
assets to DEDEA
No
%
45
11%
380
89%
425
100%
4 DEDEA assist employees to
find an ideal work-life
balance
No
%
62
14%
363
86%
425
100%
SUB TOTAL AVERAGES No
%
95
22%
330
78%
425
100%
Source: Survey Questionnaire: Section B
Table 4.1 depicts a strong response (78%) to the statement that employees are
encouraged to stay at DEDEA because of the retention strategies currently available.
From Table 4.1 an overwhelming majority of respondents (89%) agree that they are
valued as assets to the organisation; 86% agree that DEDEA assists employees to find
an ideal work-life balance; 71% agree that DEDEA fosters an environment where

98
diverse individuals can work together effectively and 65% of the respondents agree that
DEDEA is a good investor in people.
Figure 4.1 Retention Strategies
Source: Survey Questionnaire: Section B
35%
29%
11%
14%
22%
65%
71%
89%
86%
78%
0% 20% 40% 60% 80% 100% 120%
Q. 1
Q. 2
Q. 3
Q. 4
Sub-Cat AVG
Disagree
Agree

99
4.3.1 Career development
The responses to the statements regarding career development are summarised in table
4.2 and figure 4.2.
Table 4.2 Career Development
B) CAREER DEVELOPMENT
Q No DEDEA offers staff
the following
assistance for career
development
Disagree Agree TOTAL
5 Financial assistance
(e.g. bursaries, study
loans etc)
No
%
193
45%
232
55%
425
100%
6 Study leave or time off No
%
133
31%
292
69%
425
100%
7 On the job training No
%
240
56%
185
44%
425
100%
8 Coaching / mentoring No
%
336
79%
89
21%
425
100%
9 There are great
opportunities for career
advancement
No
%
382
90%
43
10%
425
100%
10 My personal
development needs are
addressed
No
%
378
89%
47
11%
425
100%
SUB TOTAL AVERAGES No
%
384
65%
148
35%
425
100%
Source: Survey Questionnaire: Section B

100
Figure 4.2 Career Development
Source: Survey Questionnaire: Section B
69% of the respondents indicated that DEDEA offers study leave or time off in support
of career development; 55% agreed that financial assistance is offered to employees.
56% of the respondents did not agree that DEDEA offers on-the-job training, 79%
disagreed with the statement that asked if DEDEA offered coaching or mentoring as
part of career development. 90% and 89% respectively felt that DEDEA did not offer
opportunities for career advancement and that their personal development needs were
not addressed.
45%
31%
56%
79%
90%
89%
65%
55%
69%
44%
21%
10%
11%
35%
0% 20% 40% 60% 80% 100% 120%
Q5
Q5
Q7
Q8
Q9
Q10
Sub-Cat AVG
Disagree
Agree

101
4.3.2 Remuneration
Table 4.3 Remuneration
C) REMUNERATION
Q No Statement Disagree Agree TOTAL
11 Total remuneration is
competitive
No
%
48
11%
377
89%
425
100%
12 Fringe benefits are good No
%
51
12%
374
88%
425
100%
13 Service bonus is good No
%
4
1%
421
99%
425
100%
14 Annual increases are
good
No
%
378
89%
47
11%
425
100%
15 I am satisfied with the
level of pay I receive
No
%
277
65%
148
35%
425
100%
16 The pay offered by
DEDEA is competitive
No
%
52
12%
373
88%
425
100%
SUB TOTAL AVERAGES No
%
135
32%
290
68%
425
100%
Source: Survey Questionnaire: Section B

102
Figure 4.3 Remuneration
Source: Results obtained from analysis of survey responses: C) Remuneration
Of the 425 responses received, an overwhelming 99% agreed that service bonus was
good; followed by 89% of respondents who agreed that the total remuneration offered
by DEDEA is competitive. However, 89% of the respondents felt that the annual
remuneration increase is not good.
11%
12%
1%
89%
65%
12%
32%
89%
88%
99%
11%
35%
88%
68%
0% 20% 40% 60% 80% 100%
Q11
Q12
Q13
Q14
Q15
Q16
Sub-Cat AVG
Diasgree
Agree

103
4.3.3 Positive Recognition
Table 4.4 Positive Recognition
D) POSITIVE RECOGNITION
Q No Statement Disagree Agree TOTAL
17 I receive recognition
when I do a good job
No
%
373
88%
52
12%
425
100%
18 Employees are recognised
for good work
performance
No
%
373
88%
52
12%
425
100%
19 Performance incentives
are clearly linked to
standards and goals
No
%
373
88%
52
12%
425
100%
20 Regular performance
reviews are conducted
No
%
45
11%
380
89%
425
100%
21 Constructive feedback is
given when it is due
No
%
423
99.5%
2
0.5%
425
100%
SUB TOTAL AVERAGES No
%
317
75%
108
25%
425
100%
Source: Survey Questionnaire: Section B
Figure 4.4 Positive Recognition
Source: Survey Questionnaire: Section B
88%
88%
88%
11%
99.50%
75%
12%
12%
12%
89%
0.5%
25%
0% 20% 40% 60% 80% 100%
Q17
Q18
Q19
Q20
Q21
Sub-Cat AVG
Disagree
Agree

104
The responses from the employees indicated that, DEDEA was not doing well with
regards to this factor. 88% of the respondents disagreed with the statements about
receiving recognition for a job well done, and performance incentives being linked to
standards and goals. However, 89% of the respondents agreed that regular performance
reviews were conducted.
4.3.4 Staff engagement
Table 4.5 Staff engagement
E) STAFF ENGAGEMENT
Q No Statement Disagree Agree TOTAL
22 I care about the future of my
department
No
%
149
35%
276
65%
425
100%
23 I am proud to work for this
department
No
%
196
46%
229
54%
425
100%
24 I feel a sense of personal
accomplishment from my
job
No
%
190
45%
235
55%
425
100%
25 I would say my department
is a good place to work
No
%
285
67%
140
33%
425
100%
26 I understand how my job
contributes to the overall
success of the department
No
%
99
23%
326
77%
425
100%
27 I am willing to put in extra
effort beyond what is
normally expected
No
%
52
12%
373
88%
425
100%
SUB TOTAL AVERAGES No
%
162
38%
263
62%
425
100%
Source: Survey Questionnaire: Section B

105
Figure 4.5 Staff Engagement
Source: Survey Questionnaire: Section B
88% of the respondents agreed that they were willing to put in extra effort beyond what
was normally expected of them; 65% stated that they cared about the future of the
organisation; 77% understood how their jobs contributed to the overall success of the
organisation; 55% felt a sense of personal accomplishment from their jobs. However,
67% of the respondents indicated that they would not say the organisation is a good
place to work at.
35%
46%
45%
67%
23%
12%
38%
65%
54%
55%
33%
77%
88%
62%
0% 20% 40% 60% 80% 100%
Q22
Q23
Q24
Q25
Q26
Q27
Sub-Cat AVG
Disagree
Agree

106
4.3.5 Management
Table 4.6 Management
F) MANAGEMENT
Q No Statement Disagree Agree TOTAL
28 Management
communicates a clear
vision and mission
No
%
51
12%
374
88%
425
100%
29 Management is taking
steps to ensure
organisational long-
term success
No
%
52
12%
373
88%
425
100%
30 Management supports
new ideas and ways of
doing things
No
%
18
4%
407
96%
425
100%
31 Management promotes
lifelong learning
No
%
40
9%
385
91%
425
100%
32 Rewards performance
and recognises
accomplishment
No
%
95
22%
330
78%
425
100%
33 Management is
respectful, trustworthy
and instils pride
No
%
197
46%
228
54%
425
100%
SUB TOTAL AVERAGES No
%
76
18%
349
82%
425
100%
Source: Survey Questionnaire: Section B

107
Figure 4.6 Management
Source: Survey Questionnaire: Section B
96% of the respondents agreed that management supported new ideas and ways of
doing things; 91% agreed that management promotes lifelong learning; 88% agreed that
management communicated a clear vision and mission and that management was taking
steps to ensure organisational long-term success and 78% felt that management
rewarded performance and recognises accomplishments.
12%
12%
4%
9%
22%
46%
18%
88%
88%
96%
91%
78%
54%
82%
0% 20% 40% 60% 80% 100%
Q28
Q29
Q30
Q31
Q32
Q33
Sub-Cat AVG
Disagree
Agree

108
4.3.6 Reasons for leaving the organisation
Table 4.7 Possible reasons for leaving the organisation
G) POSSIBLE REASONS FOR LEAVING THE ORGANISATION
Q No Statement Disagree Agree TOTAL
34 Desire to be self
employed
No
%
285
67%
140
33%
425
100%
35 Redundancy No
%
332
78%
93
22%
425
100%
36 Frustration in present
job
No
%
373
88%
52
12%
425
100%
37 An excellent
opportunity presented
itself
No
%
134
32%
291
68%
425
100%
38 Desire to join the
Private Sector
No
%
146
34%
279
66%
425
100%
SUB TOTAL AVERAGES No
%
254
60%
171
40%
No
%
Source: Survey Questionnaire: Section B
Figure 4.7 Possible reasons for leaving the organisation
Source: Survey Questionnaire: section B
67%
78%
88%
32%
34%
60%
33%
22%
12%
68%
66%
40%
0% 20% 40% 60% 80% 100%
Q34
Q35
Q36
Q37
Q38
Sub-Cat AVG
Disagree
Agree

109
The majority of the respondents (88%) believe that the reasons for them leaving the
organisation would be because of frustration in their present jobs, followed by 78% who
rated redundancy as the likely reason for them to leave. 67% of the respondents
showed a desire to be self-employed.
4.3.7 Consideration of leaving DEDEA
89% of the respondent indicated that they have considered leaving the organisation.
The survey results are indicated in Table 4.8 and chart 4.8 below:
Table 4.8 Consideration of leaving DEDEA
H) CONSIDERATION of LEAVING DEDEA
Q No Yes No TOTAL
39 Have you or are you
considering DEDEA?
No
%
378
89%
47
11%
425
100%
Source: Survey Questionnaire: Section B
Figure 4.8 Consideration of leaving DEDEA
Source: Survey Questionnaire: Section B
89%
11%
Consideration of leaving DEDEA
Yes
No

110
4.3.8 Rating of organisational factors
Table 4.9 Rating of organisational factors
I) RATING OF ORGANISATIONAL FACTORS
Q No Rate the ffg. reasons
from most relevant to
least
Most
Relevant
Least
Relevant
TOTAL
40 Limited career
development
No
%
369
87%
56
13%
425
100%
41 Insufficient
remuneration
No
%
274
64%
151
36%
425
100%
42 No positive recognition No
%
283
67%
142
33%
425
100%
43 Lack of staff
engagement
No
%
282
66%
143
34%
425
100%
44 Ineffective management No
%
187
44%
238
56%
No
%
SUB TOTAL AVERAGES No
%
279
66%
146
34%
No
%
Source: Survey Questionnaire: Section B
87% of respondents rated limited career development as the most relevant reason that
will be responsible for their leaving DEDEA while 13% rated this as the least relevant.
64% of respondents rated insufficient remuneration as the most relevant reason that will
be responsible for their leaving DEDEA while 36% rated this as the least relevant.

111
67% of respondents rated no positive recognition as the most relevant reason that will
be responsible for their leaving DEDEA while 33% rated this factor as the least
relevant.
66% of respondents rated lack of staff engagement as the most relevant reason that will
be responsible for their leaving DEDEA while 34% rated this factor as the least
relevant.
56% of respondents rated ineffective management as the least relevant reason that will
be responsible for their leaving DEDEA while 44% rated this factor as the most
relevant. These survey findings are shown in the graphs below:
Figure 4.9.1 Limited career development
Source: Survey Questionnaire: Section B
Figure 4.9.2 Insufficient remuneration
Source: Survey Questionnaire: Section B
87%
13%
Limited career development
Most Relevant
Least Relevant
64%
36%
Insufficient remuneration
Most Relevant
Least Relevant

112
Figure 4.9.3 No positive recognition
Source: Survey Questionnaire: Section B
Figure 4.9.4 Lack of staff engagement
Source: Survey Questionnaire: Section B
Figure 4.9.5 Ineffective management
Source: Survey Questionnaire: Section B
67%
33%
No positive recognition
Most Relevant
Least Relevant
66%
34%
Lack of staff engagement
Most Relevant
Least Relevant
44%
56%
Ineffective management
Most Relevant
Least Relevant

113
4.4 CLOSING REMARKS
The purpose of this chapter was to analyse and interpret the data obtained from the
research questionnaire. The researcher has analysed and interpreted the research
findings, which will be used to draw final conclusions and recommendations in the
following chapter.
Chapter five will focus on recommendations and concluding remarks, based on the
abovementioned findings. Limitations of the research and opportunities for further
research will also be highlighted.

114
CHAPTER 5
5. SUMMARY, CONCLUSIONS AND RECOMMENDATIONS
5.1 INTRODUCTION
The main problem and the three sub-problems have been discussed in the previous
chapters of the study. The main problem of the study, namely “Organisational factors
impacting on employee retention” is highlighted in chapter two. In this final chapter,
the researcher will draw conclusions from the results obtained in the empirical study.
The difficulties and limitations experienced during the research period will also be
discussed. Finally, the researcher will present recommendations for improvements that
could be undertaken in the organisation chosen for the research study. Suggestions for
further research options will also be tabled.
5.2 LITERATURE REVIEW
The main problem that this study attempted to address is an investigation on the
organisational factors impacting on employee retention. A comprehensive literature
review was conducted which included an analytical overview of the organisational
factors under investigation and their impact on employee retention. The findings of the
research were analysed and interpreted in chapters three and four. Based on this
research, the researcher developed an integrated model of organisational factors
impacting on employee retention.
5.3 EMPIRICAL STUDY
An empirical study was conducted using a questionnaire to address the research
problem. The empirical study was also used to test the validity of the model developed

115
by the researcher from the literature study. A questionnaire survey was undertaken
amongst first-line, middle and senior managers at the Department of Economic
Development and Environmental Affairs.
The results of the survey questionnaire indicate that the majority of the respondents are
in agreement with the literature that there areorganisational factors impacting on
employee retention, namely, career development, remuneration, positive recognition,
staff engagement and management.
5.3.1 Survey findings
The total response rate for the survey was 54% (i.e. 425 responded out of 781
questionnaires that were distributed. From the biographical analysis in chapter three of
the study, the general characteristics of the DEDEA employee are that:
Most likely to work at Bhisho Head Office;
Permanently employed;
Is a Generation X ( or perhaps a Baby Boomer);
Is a female
African (rarely white or coloured)
Has an average qualification at national diploma/degree level.
5.4 RECOMMENDATIONS
The researcher has the following recommendations regarding the findings:
Recommendation 1
The findings of this study revealed a significant relationship between the
selected organisational factors and employee retention. The study produced a

116
model suitable for use by DEDEA as a guide in determining what initiatives the
organisation should adopt to retain the organisation‟s employees. A Strategic
Model for Organisational Factors Impacting on Employee Retention (Figure
5.1) is the culmination of research and research findings from chapters two
through four of the study.
Figure 5.1 Strategic model for on employee retention
Source: Developed from results obtained from research survey
Sub-problem 3 in chapter one required that an integrated strategic model which can be
used to retain employees at DEDEA be developed. Details of the Model are discussed
below:
Employee Retention
Remuneration
Career
Development
Positive
Recognition
Staff
Engagement
Management
Organisation
Employee
Retention
Programmes

117
The centre of the model represents the final outcome i.e. improved employee retention.
On the left hand side of the outcome are the organisational factors impacting on
employee retention namely: career development, remuneration, positive recognition,
staff engagement and management. The relationship is shown such that if an
organisation, the organisational retention programmes and the employee work together
to ensure the attainment of organisational objectives without neglecting the employee‟s
personal goals.
Recommendation 2
On organisational factor B) Career Development – DEDEA needs to take
cognisance of the fact that, an overwhelming 90% of the respondents indicated
that the felt that there were no opportunities for career advancement; 89%
indicated that their personal development needs were not addressed and 79%
indicated that no coaching or mentoring programmes were in place to assist
employees for career development. It is the researcher‟s recommendation that
the organisation does not ignore these important sub-categories when
developing retention strategies. The researcher recommends that DEDEA take
note of the influence these have on employee retention.
Recommendation 3
As the study was conducted in a government department, the researcher noted
that there is not much that the organisation can do on organisational factor C)
Remuneration as the salary levels were the same across all government
departments. Although most of the respondents were generally happy with total
remuneration, fringe benefits and service bonus, there a percentage (65%) of the
respondents who highlighted the fact that they were not satisfied with the level
of pay they received. This requires further investigation as the researcher

118
assumed that it is probably because of poor job placement whereby employees
feel that they are inappropriately placed in comparison to their qualification,
skills and aspirations.
Recommendation 4
Although 89% of the respondents agreed that regular performance reviews were
conducted, 88-99.5% of the respondents cited a disagreement to the other sub-
categories in organisational factor D) Positive Recognition. It is the researcher‟s
recommendation that the Performance Management and Development System
be effectively utilised so as to close the gaps highlighted by this study.
5.5 PROBLEM AREAS AND LIMITATIONS
Although the objectives of this study have been achieved, there are a few limitations
that were encountered during the research, but it is important to mention them:
356 employees (46% of the total population) did not submit their responses by
the stipulated date. This caused delays in completing the capturing of the
questionnaires. The researcher had anticipated this challenge, but the response
rate of 54% was treated as satisfactorily.
The majority of the respondents were very similar in most of the biographical
aspects investigated and therefore the recommendations could only be made
applicable to the employees that were surveyed.
The research was only conducted at the Eastern Cape Department of Economic
Development and Environmental Affairs and therefore conclusions and
recommendations are only applicable to DEDEA until further studies prove that
they can be applicable to other government departments.

119
5.6 RECOMMENDATIONS FOR FURTHER RESEARCHER
During the course of the research, certain limitations were encountered and these
present one with opportunities for further research. These opportunities are as follows:
? An investigation into what employees believe are the organisational factors
impacting on employee retention. This investigation will provide management
with a basis for developing ideal retention strategies.
? To extend the study to include other governments in the Eastern Cape Provincial
Administration;
? To conduct a benchmark study on the selected organisational factors with other
government departments in other countries in the same developmental league as
South Africa.
5.7 CONCLUSION
The study included an analysis of organisational factors impacting on employee
retention. From the study it can be concluded that the Eastern Cape Department of
Economic Development and Environmental Affairs can improve on employee retention
by taking into account the factors that were highlighted in this study.
Retention strategies are complex and are not easy to implement. In order for retention
strategies to be effective, the employees, and their managers or supervisors need to be
actively involved in the development and implementation of the strategies. Managers
need to have a clear understanding of the needs, abilities, goals and preferences of the
workforce.

120
REFERENCE LIST
Bagraim, J., Cunningham, P., Potgieter, T., Viedge, C. 2007. Organisational
Behavior: A Contemporary South African Perspective. Pretoria: Van Schaik.
Collis, L., Hussey, R. 2003. Business Research: A Practical Guide for Undergraduate
and Postgraduate Students. (2nd
Edition). New York: Palgrave Macmillan.
De Villiers, J. 2007. South Africa’s Leading Managers. Business Report. (4th
Edition). South Africa. CRF South Africa
Farren, C. 2008. Managers: A Key Factor in Employee Retention and Engagement.
[Online]. Available: http://www.masteryworks.com. [03 July 2010]
Fields, M.R.A. 2001. Indispensable Employees: How to Hire Them, How to keep
them. New Jersey: Career Press.
Forgacs, L. 2009. Recruitment and Retention Across Continents. 63(6). [Online].
Available: http://researchpro.seals.ac.za. Last accessed on [12 November 2010]
Gill, J., Johnson, P. 2002. Research Methods for Managers. (3rd
Edition). London:
Sage Publications.
Greenberg, J. 2004. Managing Behaviour in Organisations. Prentice Hall.

121
Gering, J., Conner, J. 2002. A Strategic Approach to Employee Retention. Healthcare
Financial Management. 56(11).
Greenhaus, J.L., Callanan, G.A., Godshalh, V.M. 2000. Career Management. (3rd
Edition). Harcourt College.
Grobler, P.A., Warnich, S., Carell, M.R., Elbert, N.F., Hatfield, R.D. 2002. Human
Resource Management in South Africa. (2nd
Edition). Thomson Learning.
Harrison, D. 2010. Do Different Generations have Different Workplace Attitudes?
[Online]. Available: http://www.researchpro.seals.ac.za. [19 August 2010].
Harter, J.K., Schmidt. F.L., Hayes, T.L. 2002. Business Unit Level Relationship
between employee satisfaction, employee engagement and business outcomes: A meta-
analysis. Applied Psychology. 87(2).
Heathfield, S.M. 2008. Training and Development for Employee Motivation and
Retention. [Online]. Available: http://www.about.co. [15 October 2010]
Heathfield, S.M. 2008. Top Ten Ways to Retain Your Great Employee. [Online].
Available: http://www.about.com. [19 August 2010]
Heathfield, S.M. 2008. The power of Positive Employee Recognition. [Online].
Available: http://www.about.com. [15 October 2010]

122
Hebenstreit, R.K. 2008. A Call to Apply the Principles of the Enneagram in
Organisations to Attract, Retain and Motivate Employees. 1(1). [Online]. Available:
http://researchpro.seals.ac.za. [12 November 2010]
Hildebrand, D.S. 2008. Retention and Job Satisfaction. [Online]. Available:
http://www.allbusiness.com [19 August 2010]
Hoover, G. 2005. Maintaining Employee Engagement when Communicating Difficult
Issues. [Online]. Available: http://www.allbusiness.com. [19 August 2010]
Horwitz, F. 2008. Retention strategies critical in a global market skills shortage.
Available onine at http://www.gsb.uct.ac.za/hrm. Last accessed on 21 September 2010.
Jacobson, D. 2008. Making Creative Use of Employee Recognition. [Online].
Available: http://www.govleaders.org. [19 August 2010]
Kaye and Jordan-Evans. 2009. Factors Affecting Employee Retention. Management
Today. [Online]. Available: http://researchpro.seals.ac.za. [12 November 2010]
Leedy, P.D., Ormrod, J.E. 2005. Practical Research: Planning and Design. (8th
Edition). New Jersey: Pearson Education International.
Mann, J. 2006. Generations in the Workplace. The Bulletin, Volume 74. Issue 1.
Available online at www.acui.ord. Last accessed on 08 September 2010.

123
Moseley, A., Jeffers, L., Patterson, J. 2008. The retention of the older nursing
workforce: A literature review exploring factors that influence the retention and
turnover of older nurses. Contemporary Nurse. Australian Nursing Profession. 30(1).
Meyer, M., Fourie, L. 2004. Mentoring and Coaching: Tools and Techniques for
Implementation. South Africa: Knowres Publishing.
Nel, P.S., Gerber, P.D., Van Dyk, P.S., Haasbroek, G.D., Schultz, H.B., Sono, T.,
Werner, A. 2001. Human Resources Management. (5th
Edition). South Africa: Oxford
University Press.
Nel, P.S., Werner, A., Haasbroek, G.D., Poisat, P., Sono, T., Schultz, H.B. 2008.
Human Resource Management. (7th
Edition). Cape Town: Oxford University Press.
Nelson, B. 2003. The 1001 Reward and Recognition: You Get What You Reward.
New York: Workman Publishing.
Philips, J.J., Connell, A.O. 2003. Managing Retention: a strategic accountability
approach. Butterworth: Heinemann.
Profiling for success. 2006. Stages of Career Development. [Online]. Available:
http://www.profilingforsuccess.com [16 November 2010]
Poisat, P. 2006. A critical Analysis of Organisational Strategies for Employee
Engagement. D Tech Thesis. Port Elizabeth: Nelson Mandela Metropolitan University.

124
Rion, J. 2009. Professional Development: The Key to Retention. 71(2). [Online].
Available: http://researchpro.seals.ac.za [12 November 2010]
Rhema Group. 2008. Management Styles. [Online]. Available:
http://www.rhemagroup.com [03 July 2010]
Schuler, S.R., Jackson, S.C. 2006. Managing Human Resources. Cengage Learning.
Swanepoel, B., Erasmus, B., Van Wyk, M., Schenk, H. 2003. South African Human
Resource Management: Theory and Practice. (2nd
Edition). Lansdowne: Juta and Co
Ltd.
The Recruitment Communications Company. 2002. Understanding Employee
Retention. [Online]. Available: http://www.rcc.com [03 July 2010]
Vance, R.J. 2004. Employee Engagement and Commitment. The SHRM Foundation.
[Online]. Available: http://www.shrm.org [03 July 2010]
Vazirani, N. 2007. Employee Engagement. [Online]. Available:
http://www.siescom.edu [03 July 2010]
Withers, P. 2001. Six Secrets to Attracting and Retaining Great Employees. [Online].
Available: http://www.cbs.com [19 August 2010]
Werner, J.M., DeSimone, R.L. 2009. Human Resource Development. (4th
Edition).
Thomson South-Western Publishers.

125
Werner, A., Bagraim, J., Cunningham, P., Potgieter, T., Viedge, C. 2007.
Organisational Behaviour: A contemporary South African perspective. Pretoria: Van
Schaik.

126
ANNEXURE A - Memorandum addressed to questionnaire
respondents
Memorandum addressed to questionnaire respondents
TO : DEDEA PERSONNEL (HEAD OFFICE, EL, UTA, KOKSTAD,
QTN, PE, AND UKHAHLAMBA)
FROM : PENDULWA GUMA
DATE : 01 JULY 2010
SUBJECT : QUESTIONNAIRE: ORGANISATIONAL FACTORS
IMPACTING ON EMPLOYEE RETENTION
Dear Respondent
I require your assistance please.
I am conducting a survey on organizational factors impacting on employee retention
within the Eastern Cape Department of Economic Development and Environmental
Affairs. I received permission from the Head of Department and your Regional
Directors to conduct the particular research.
The information will be used in partial fulfillment of the requirements of the Masters
Degree in Business Administration (MBA) at the Nelson Mandela Metropolitan
University (NMMU); for completion of the Thesis.
Your assistance in completing the attached questionnaire and returning it to me (which
should not take more than 10 minutes of your time) will be much appreciated.
I undertake to treat all information provided as strictly confidential.
Regards,
Pendulwa Guma: Researcher
Professor Dave Berry: Promoter

127
ANNEXURE B – QUESTIONNAIRE
ORGANISATIONAL FACTORS IMPACTING ON EMPLOYEE RETENTION
Dear Employee
You are invited to participate in the above mentioned research project. The survey should
only take 10 – 15 minutes to complete. To ensure confidentiality of all responses, you are not
obliged to provide your name. The information you give in response to this survey will provide
the Eastern Cape Department of Economic Development and Environmental Affairs with
valuable information and insight to effectively develop and implement an employee retention
strategy with a clear understanding of the organizational factors impacting on employee
retention.
You are welcome to contact Pendulwa Guma on 082 749 0570 or
[email protected] if you have any questions in completing this
questionnaire.
Thank you for taking the time and effort in completing this questionnaire!

128
Questionnaire number:
SECTION ONE: DEMOGRAPHIC PROFILE
Please answer the following questions as honestly and accurately as possible. Please note that
this information is important for demographic and statistical purposes.
SECTION 1 Please complete all questions
Mark with an “x”
A} Demographic Information
I work in the __________(which) branch office Question 1
Bhisho Head Office
Amathole Regional Office
Alfred Nzo Regional Office
Cacadu Regional Office
Chris Hani Regional Office
OR Tambo Regional Office
Ukhahlamba Regional Office
My position in the organization: Question 2
Permanent Position
Contract Position
Intern
My current age is between: Question 3
Under 21 years
21 – 29 years
30 – 39 years
101

129
SECTION 1 Please complete all questions
Mark with an “x”
40 – 49 years
50 – 59 years
60 years and above
My Gender Question 4
Female
Male
My Nationality is: Question 5
African
Coloured
Indian
White
Other (please specify)
My Home Language is: Question 6
Xhosa
English
Afrikaans
Zulu
Other (please specify)
My current salary level is: Question 7
Salary level 1 – 7
Salary level 8 – 12

130
SECTION 1 Please complete all questions
Mark with an “x”
Salary level 13 - 16
My Highest Qualification is (mark one) Question 8
Matric
National Diploma / Degree (3 year qualification)
Post Graduate (BTech, Honours, Masters, Doctorate)
I am employed at DEDEA for between…(how many) years now: Question 9
6 – 12 months
1 – 2 years
2 – 3 years
3 – 5 years
5 – 10 years
10 years and more

131
SECTION 2 Please complete all questions
Mark with an “x”
A} Retention Strategies
Dis
agr
ee
No
Op
inio
n
Agr
ee
Qu
est
ion
No
.
I am encouraged to stay at DEDEA because:
DEDEA is a good investor in people
1
DEDEA fosters an environment where diverse
individuals can work together effectively
2
Employees are valued as assets to DEDEA
3
DEDEA assists employees to find an ideal work-life
balance
4
B}Career Development
Dis
agr
ee
No
op
inio
n
Agr
ee
Qu
est
ion
no
.
DEDEA offers staff the following assistance for career
development:
Financial assistance (e.g. bursaries, study loans etc) 5
Study leave or time off 6
On the job training 7
Coaching / mentoring 8
There are great opportunities for career 9

132
SECTION 2 Please complete all questions
Mark with an “x”
advancement for me
My personal development needs are addressed 10
C}Remuneration
Dis
agr
ee
No
op
inio
n
Agr
ee
Qu
est
ion
no
.
Total remuneration is competitive 11
Fringe benefits are good (housing, medical, pension) 12
Service bonus is good 13
Annual increases are good 14
I am satisfied with the level of pay I receive 15
The pay offered by DEDEA is competitive 16
D}Positive Recognition
Dis
agr
ee
No
op
inio
n
Agr
ee
Qu
est
ion
no
.
I receive recognition when I do a good job 17
Employees are recognized for good work
performance
18
Performance incentives are clearly linked to
standards and goals
19
Regular performance reviews are conducted 20
Constructive feedback is given when it is due 21

133
SECTION 2 Please complete all questions
Mark with an “x”
E}Staff Engagement
Dis
agr
ee
No
op
inio
n
Agr
ee
Qu
est
ion
no
.
I care about the future of my department 22
I am proud to work for this department 23
I feel a sense of personal accomplishment from my
job
24
I would say my department is a good place to work 25
I understand how my job contributes to the overall
success of the department
26
I am willing to put in extra effort beyond what is
normally expected
27
F}Management
Dis
agr
ee
No
op
inio
n
Agr
ee
Qu
est
ion
no
.
Management communicates a clear vision and
mission
28
Management is taking steps to ensure organizational
long-term success
29
Management supports new ideas and ways of doing
things
30
Management promotes lifelong learning 31

134
SECTION 2 Please complete all questions
Mark with an “x”
Rewards performance and recognizes
accomplishments
32
Management is respectful, trustworthy and instills
pride
33
G}My reasons for leaving the organization would be:
Dis
agr
ee
No
op
inio
n
Agr
ee
Qu
est
ion
no
.
Desire to be self employed 34
Redundancy 35
Frustration in present job 36
An excellent opportunity presented itself 37
Desire to join the Private Sector 38
I}Have you or are you considering leaving DEDEA YES NO 39
J}If you should consider leaving your current position, rate
the following reasons responsible, from most relevant (1)
to least relevant (5)
Rating from most (1) to least
(5) relevant
40
Limited Career Development
Insufficient Remuneration
No positive recognition
Lack of Staff Engagement
Ineffective Management

135
SECTION 2 Please complete all questions
Mark with an “x”
THANK YOU FOR YOUR TIME
PLEASE REMEMBER TO SAVE WHEN YOU FORWARD VIA EMAIL