originally published as -...
TRANSCRIPT
Originally published as:
Friedrich, A., Winkler, B., Morgenroth, W., Ruiz-Fuertes, J., Koch-Müller, M., Rhede, D., Milman, V. (2014): Pressure-induced spin collapse of octahedrally coordinated Fe3+ in Ca3Fe2[SiO4]3 from experiment and theory. - Physical Review B, 90, 9
DOI: http://doi.org/10.1103/PhysRevB.90.094105
PHYSICAL REVIEW B 90, 094105 (2014)
Pressure-induced spin collapse of octahedrally coordinated Fe3+ in Ca3Fe2[SiO4]3
from experiment and theory
Alexandra Friedrich,* Bjorn Winkler, Wolfgang Morgenroth, and Javier Ruiz-FuertesInstitut fur Geowissenschaften, Goethe-Universitat, Altenhoferallee 1, D-60438 Frankfurt a.M., Germany
Monika Koch-MullerGFZ Potsdam, Sektion 3.3, Telegrafenberg, 14473 Potsdam, Germany
Dieter RhedeGFZ Potsdam, Sektion 4.2, Telegrafenberg, 14473 Potsdam, Germany
Victor MilmanDassault Systemes BIOVIA, 334 Science Park, Cambridge CB4 0WN, United Kingdom
(Received 9 April 2014; revised manuscript received 11 August 2014; published 5 September 2014)
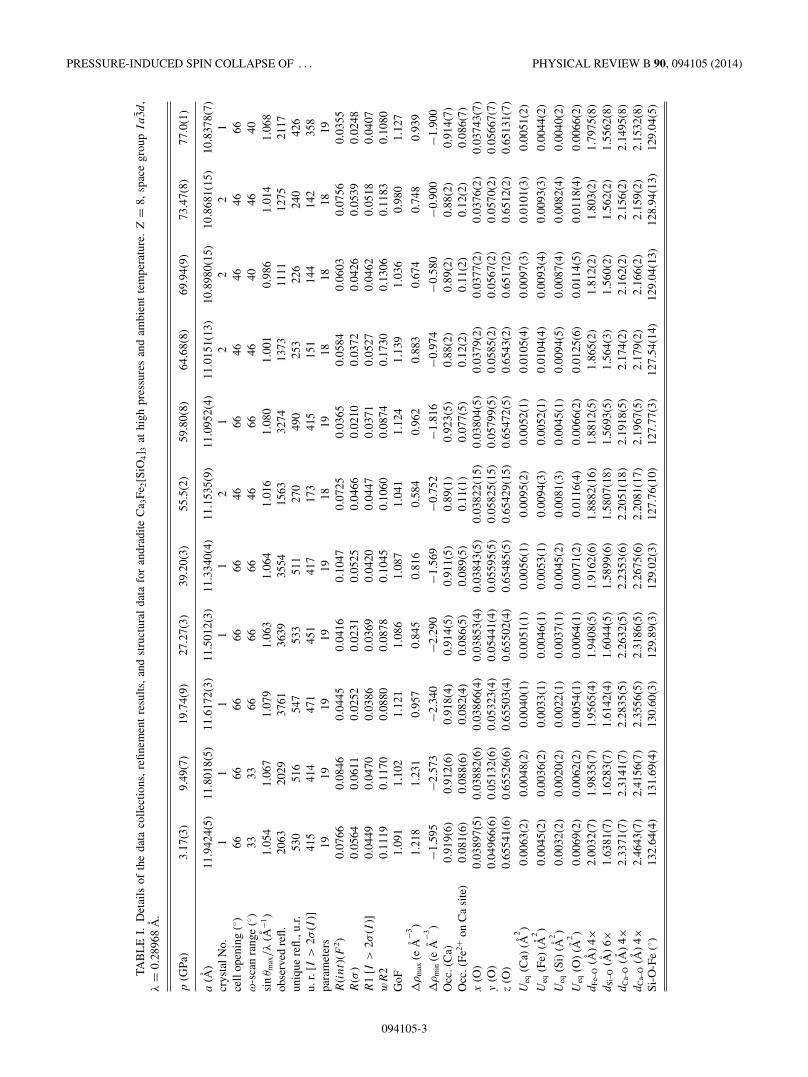
The high-pressure behavior of andradite garnet, Ca3Fe2[SiO4]3, was studied at pressures up to 80 GPa usingsingle-crystal synchrotron x-ray diffraction, Raman spectroscopy, and quantum mechanical calculations basedon density functional theory. An isosymmetric phase transition was observed in the pressure range between 60and 70 GPa, which is associated with a gradual high-spin to low-spin electronic transition in Fe3+. Experimentalstructural data before and after the phase transition are in excellent agreement with the theoretically predictedstructural compression of the high-spin and low-spin phases, respectively. While the overall unit-cell volumeis reduced by about 2.5% across the phase transition, a collapse of about 10% of the FeO6 octahedral volumeis observed, attributed to the reduced Fe–O bond lengths associated with low-spin Fe3+. In combination withearlier data the present study shows that a spin collapse of Fe3+ in FeO6 octahedra will be triggered if the Fe–Obond length reaches a critical value of d(Fe–O) < ≈ 1.9 A. Earlier reported results for the compressibility ofthe cation coordination polyhedra are substantially revised, with BFeO6 = 195(2) GPa, BCaO8 = 104(2) GPa, andBSiO4 = 348(11) GPa for the high-spin phase. The mode Gruneisen parameters range between 0.61 and 1.34.The computed spin-pairing energy is ≈4.2 eV at 0 GPa.
DOI: 10.1103/PhysRevB.90.094105 PACS number(s): 61.50.Ks, 61.05.cp, 71.15.Mb, 78.30.−j
I. INTRODUCTION
Iron is the most abundant transition metal, and due to theirelectronic structures, both Fe2+ and Fe3+ ions may undergospin-pairing transitions at high pressures. Such pressure-induced spin transitions have already been predicted by Fyfe[1] and high-pressure experiments allowed to obtain exper-imental evidence for these electronic transitions in Fe0.94O[2], hematite, Fe2O3 [3,4], and FeS [5] using Mossbauerspectroscopy and x-ray emission spectroscopy (XES).
Garnets play an important role in nature and technology.They are important minerals of the Earth’s mantle, used injewelry, and crystals with the garnet structure are fabricatedfor laser, magnetic, and ion-conducting technologies [6].A pressure-induced magnetic collapse and spin transitionaccompanied by a Mott transition has been observed insynthetic yttrium iron garnet (YIG), Y3Fe5O12, at 48 GPa[7,8]. Y3Fe5O12 is a well-known magnetic garnet with wideapplication in electronic devices. Magnetic garnets are usedas magneto-optical isolators and in microwave technology asmagnetic resonance filters, tuned oscillators, and band-rejectand band-pass filters [6]. In Y3Fe5O12, Fe3+ occupies octa-hedral and tetrahedral sites of the garnet structure. However,as the high-pressure phase of Y3Fe5O12 was amorphous [7,9],
the structural changes due to the HS-LS transition could notbe evaluated.
Andradite, Ca3Fe2[SiO4]3, is a garnet end member withFe3+ in octahedral coordination. Like the majority of garnets, itcrystallizes in space group Ia3d, where all the cations occupyfully-constrained special positions (Fig. 1). The high symme-try of the garnet structure and of the cation coordinations makeandradite an ideal model system to study pressure-inducedspin-pairing transitions of Fe3+ in octahedral coordination.Specifically, the spin-pairing behavior in andradite may serveas a benchmark for that of iron-bearing magnesium silicateperovskite, (Mg1−xFex)SiO3, where spin transitions of ironhave been extensively studied [10] and a spin-pairing transitionin Fe3+ located on the octahedral B site was controversiallyproposed at pressures of 13–24 GPa [11] or 50–60 GPa [12].Several high-pressure studies have already been conducted onandradite up to 36 GPa [13–17]. No structural phase transitionhas been reported so far. In the present study we report ona pressure-induced spin transition in andradite from single-crystal x-ray diffraction, Raman spectroscopy and quantummechanical calculations based on density-functional theory.
II. METHODS
A. Experimental details
Andradite single crystals were synthesized from a stoi-chiometric mixture of synthetic Ca(OH)2, Fe2O3, and SiO2
with OH in excess to promote crystal growth, sealed within
1098-0121/2014/90(9)/094105(10) 094105-1 ©2014 American Physical Society

ALEXANDRA FRIEDRICH et al. PHYSICAL REVIEW B 90, 094105 (2014)
FIG. 1. (Color online) Crystal structure of andradite. FeO6 oc-tahedra (red) and SiO4 tetrahedra (blue) share corners in a three-dimensional framework. Ca atoms (yellow spheres) occupy triangulardodecahedral sites.
a platinum capsule, at 3 GPa and 1273 K in a multianvilpress using the 18/11 assembly according to the experimentaldesign given in Koch-Muller et al. [18]. The chemicalcomposition was determined by wavelength-dispersive x-ray analysis (WDS) techniques using a JEOL JXA-8500F(HYPERPROBE) electron microprobe. Natural and syntheticreference standards were diopside (for Mg, Si, and Ca),hematite (for Fe), and orthoclase (for Al).
Several grains of garnets were embedded in UV glue,ground and polished on both sides to thicknesses rangingfrom 35 to 136 μm for FTIR investigations. UnpolarizedFTIR spectra were obtained at the synchrotron IR beamlineat BESSY II (Berlin, Germany) using a Nicolet 870 FTIRspectrometer (with KBr beamsplitter) combined with a Con-tinuum microscope and a MCT detector. The aperture was setto 12 × 12 μm2. The spectra were collected with a resolutionof 2 cm−1 and averaged over 256 scans. As no molar absorptioncoefficient ε for andradite has been reported so far, we usedthe IR calibration of Bell et al. [19] for two pyrope-richgarnets (6700 ± 670 l mol−1
H2O cm−2) for quantification. For thehigh-pressure experiments small single crystals of andradite(�25 μm diameter and �8 μm thickness) were loaded togetherwith ruby chips for pressure determination [20] and neon as apressure-transmitting medium into holes of ≈85 μm diameterin rhenium gaskets preindented to thicknesses of �30 μmin Boehler-Almax diamond anvil cells equipped with conicaldiamonds (250 and 200 μm culet sizes) [21].
Single-crystal synchrotron x-ray diffraction was performedat the Extreme Conditions Beamline P02.2 at PETRA III,Hamburg, Germany (λ = 0.28968 A, beam size 2.4(H) ×2.1(V) μm2) [22]. Diffraction images were collected oncompression at various pressures up to 77 GPa (except for thedata at 70 GPa, which were collected after decompression from73.5 GPa) with a PerkinElmer XRD 1621 flat-panel detector ata sample-to-detector distance of 399.82 mm by 1◦ ω scanning.A smaller scan range than the cell opening was used at the twolowest pressures due to a displacement of the ω-rotation axisfrom the synchrotron beam, which was then realigned, and at70 and 77 GPa due to the limited availability of synchrotron
beam time (Table I). The image format was convertedaccording to the procedure described by Rothkirch et al. [23]for further processing with the CrysAlisP ro software Agilent[24] for indexing Bragg reflections, intensity data reduction,and empirical absorption correction. Crystal structures wererefined with SHELXL97-2 [25], operated using the WinGXinterface [26]. The final refinement was carried out withanisotropic displacement parameters for all atoms. The Ca:Feratio was refined for the triangular dodecahedral site with theconstraint that the sum of the occupancies of Ca and Fe wasfixed to one. An extinction correction was applied for one ofthe crystals (No. 1). The polyhedral volumes were calculatedwith the program IVTON [27]. Experimental details, crystaldata and refinement results are summarized in Table I.
Micro-Raman measurements were performed with a Reni-shaw Raman spectrometer (RM-1000) equipped with a CCDdetector and a green Nd:YAG-laser (532 nm, 200 mW). Weemployed a nonconfocal geometry and a 20× objective lenswith a long-working distance. The sample was one of thetwo single crystals (crystal No. 1) which had been usedfor single-crystal x-ray diffraction and pressurized to about78 GPa. Raman spectra were measured after the diffractionexperiments during decompression to ambient pressure in therange from 100 to 1300 cm−1. All spectra were corrected bysubtracting a background and fitted to Lorentzian functionsusing the program DatLab [28].
B. Computational details
The quantum-mechanical calculations were performedbased on density functional theory (DFT) for a pure andraditeend-member composition Ca3Fe3+
2 [SiO4]3 using the programCASTEP [29]. The calculations were performed with theon-the-fly pseudopotentials from the CASTEP database usinga kinetic cutoff energy of 800 eV and a 4 × 4 × 4 Monkhorst-Pack grid [30], yielding distances �0.03 A−1 between sam-pling points of the reciprocal lattice. The Wu-Cohen [31]exchange-correlation functional was employed.
The high-spin (HS) and the low-spin (LS) structuresrepresent local minima in the total energy hypersurface. Hence,we chose the corresponding formal spin states as startingvalues, but allowed full spin relaxation after a few SCF cycles.The results were then analyzed by a Mulliken populationanalysis and invariably showed either the HS or LS state. Theuse of other starting configurations also led to either the HS orLS state, and attempts to model to an intermediate spin statewhile not fixing the spin failed.
III. RESULTS
A. Composition of the synthetic garnets
The product of the synthesis in the multianvil press consistsof reddish isomorphic single crystals in size ranging from sub-micron to about 200 μm. Optical inspection in transmitted lightas well as microprobe analyses reveal that two different popu-lations of garnets have been grown: a nearly pure andraditeend member, (Ca2.88Mg0.07Fe2+
0.04)(Fe3+1.96Al0.04)Si3O12, with
lighter red color and andradite with 7 mole% skiagite com-ponent, (Ca2.71Fe2+
0.21Mg0.03)(Fe3+1.97Al0.03)Si3O12, with darker
red color. See Supplemental Material [32] for a table of the
094105-2
PRESSURE-INDUCED SPIN COLLAPSE OF . . . PHYSICAL REVIEW B 90, 094105 (2014)
TAB
LE
I.D
etai
lsof
the
data
colle
ctio
ns,
refin
emen
tre
sults
,an
dst
ruct
ural
data
for
andr
adite
Ca 3
Fe2[S
iO4] 3
athi
ghpr
essu
res
and
ambi
ent
tem
pera
ture
.Z
=8,
spac
egr
oup
Ia
3d,
λ=
0.28
968
A.
p(G
Pa)
3.17
(3)
9.49
(7)
19.7
4(9)
27.2
7(3)
39.2
0(3)
55.5
(2)
59.8
0(8)
64.6
8(8)
69.9
4(9)
73.4
7(8)
77.0
(1)
a(A
)11
.942
4(5)
11.8
018(
5)11
.617
2(3)
11.5
012(
3)11
.334
0(4)
11.1
535(
9)11
.095
2(4)
11.0
151(
13)
10.8
980(
15)
10.8
681(
15)
10.8
378(
7)cr
ysta
lNo.
11
11
12
12
22
1ce
llop
enin
g(◦ )
6666
6666
6646
6646
4646
66ω
-sca
nra
nge
(◦ )33
3366
6666
4666
4640
4640
sin
θ max
/λ
(A−1
)1.
054
1.06
71.
079
1.06
31.
064
1.01
61.
080
1.00
10.
986
1.01
41.
068
obse
rved
refl.
2063
2029
3761
3639
3554
1563
3274
1373
1111
1275
2117
uniq
uere
fl.,u
.r.53
051
654
753
351
127
049
025
322
624
042
6u.
r.[I
>2σ
(I)]
415
414
471
451
417
173
415
151
144
142
358
para
met
ers
1919
1919
1918
1918
1818
19R
(int)
(F2)
0.07
660.
0846
0.04
450.
0416
0.10
470.
0725
0.03
650.
0584
0.06
030.
0756
0.03
55R
(σ)
0.05
640.
0611
0.02
520.
0231
0.05
250.
0466
0.02
100.
0372
0.04
260.
0539
0.02
48R
1[I
>2σ
(I)]
0.04
490.
0470
0.03
860.
0369
0.04
200.
0447
0.03
710.
0527
0.04
620.
0518
0.04
07w
R2
0.11
190.
1170
0.08
800.
0878
0.10
450.
1060
0.08
740.
1730
0.13
060.
1183
0.10
80G
oF1.
091
1.10
21.
121
1.08
61.
087
1.04
11.
124
1.13
91.
036
0.98
01.
127
�ρ
max
(eA
−3)
1.21
81.
231
0.95
70.
845
0.81
60.
584
0.96
20.
883
0.67
40.
748
0.93
9
�ρ
min
(eA
−3)
−1.5
95−2
.573
−2.3
40−2
.290
−1.5
69−0
.752
−1.8
16−0
.974
−0.5
80−0
.900
−1.9
00O
cc.(
Ca)
0.91
9(6)
0.91
2(6)
0.91
8(4)
0.91
4(5)
0.91
1(5)
0.89
(1)
0.92
3(5)
0.88
(2)
0.89
(2)
0.88
(2)
0.91
4(7)
Occ
.(Fe
2+on
Ca
site
)0.
081(
6)0.
088(
6)0.
082(
4)0.
086(
5)0.
089(
5)0.
11(1
)0.
077(
5)0.
12(2
)0.
11(2
)0.
12(2
)0.
086(
7)x
(O)
0.03
897(
5)0.
0388
2(6)
0.03
866(
4)0.
0385
3(4)
0.03
843(
5)0.
0382
2(15
)0.
0380
4(5)
0.03
79(2
)0.
0377
(2)
0.03
76(2
)0.
0374
3(7)
y(O
)0.
0496
6(6)
0.05
132(
6)0.
0532
3(4)
0.05
441(
4)0.
0559
5(5)
0.05
825(
15)
0.05
799(
5)0.
0585
(2)
0.05
67(2
)0.
0570
(2)
0.05
667(
7)z
(O)
0.65
541(
6)0.
6552
6(6)
0.65
503(
4)0.
6550
2(4)
0.65
485(
5)0.
6542
9(15
)0.
6547
2(5)
0.65
43(2
)0.
6517
(2)
0.65
12(2
)0.
6513
1(7)
Ueq
(Ca)
(A2)
0.00
63(2
)0.
0048
(2)
0.00
40(1
)0.
0051
(1)
0.00
56(1
)0.
0095
(2)
0.00
52(1
)0.
0105
(4)
0.00
97(3
)0.
0101
(3)
0.00
51(2
)
Ueq
(Fe)
(A2)
0.00
45(2
)0.
0036
(2)
0.00
33(1
)0.
0046
(1)
0.00
53(1
)0.
0094
(3)
0.00
52(1
)0.
0104
(4)
0.00
93(4
)0.
0093
(3)
0.00
44(2
)
Ueq
(Si)
(A2)
0.00
32(2
)0.
0020
(2)
0.00
22(1
)0.
0037
(1)
0.00
45(2
)0.
0081
(3)
0.00
45(1
)0.
0094
(5)
0.00
87(4
)0.
0082
(4)
0.00
40(2
)
Ueq
(O)
(A2)
0.00
69(2
)0.
0062
(2)
0.00
54(1
)0.
0064
(1)
0.00
71(2
)0.
0116
(4)
0.00
66(2
)0.
0125
(6)
0.01
14(5
)0.
0118
(4)
0.00
66(2
)d
Fe–O
(A)
4×2.
0032
(7)
1.98
35(7
)1.
9565
(4)
1.94
08(5
)1.
9162
(6)
1.88
82(1
6)1.
8812
(5)
1.86
5(2)
1.81
2(2)
1.80
3(2)
1.79
75(8
)d
Si–O
(A)
6×1.
6381
(7)
1.62
83(7
)1.
6142
(4)
1.60
44(5
)1.
5899
(6)
1.58
07(1
8)1.
5693
(5)
1.56
4(3)
1.56
0(2)
1.56
2(2)
1.55
62(8
)d
Ca–
O(A
)4×
2.33
71(7
)2.
3141
(7)
2.28
35(5
)2.
2632
(5)
2.23
53(6
)2.
2051
(18)
2.19
18(5
)2.
174(
2)2.
162(
2)2.
156(
2)2.
1495
(8)
dC
a–O
(A)
4×2.
4643
(7)
2.41
56(7
)2.
3556
(5)
2.31
86(5
)2.
2675
(6)
2.20
81(1
7)2.
1967
(5)
2.17
9(2)
2.16
6(2)
2.15
9(2)
2.15
32(8
)Si
-O-F
e(◦ )
132.
64(4
)13
1.69
(4)
130.
60(3
)12
9.89
(3)
129.
02(3
)12
7.76
(10)
127.
77(3
)12
7.54
(14)
129.
04(1
3)12
8.94
(13)
129.
04(5
)
094105-3
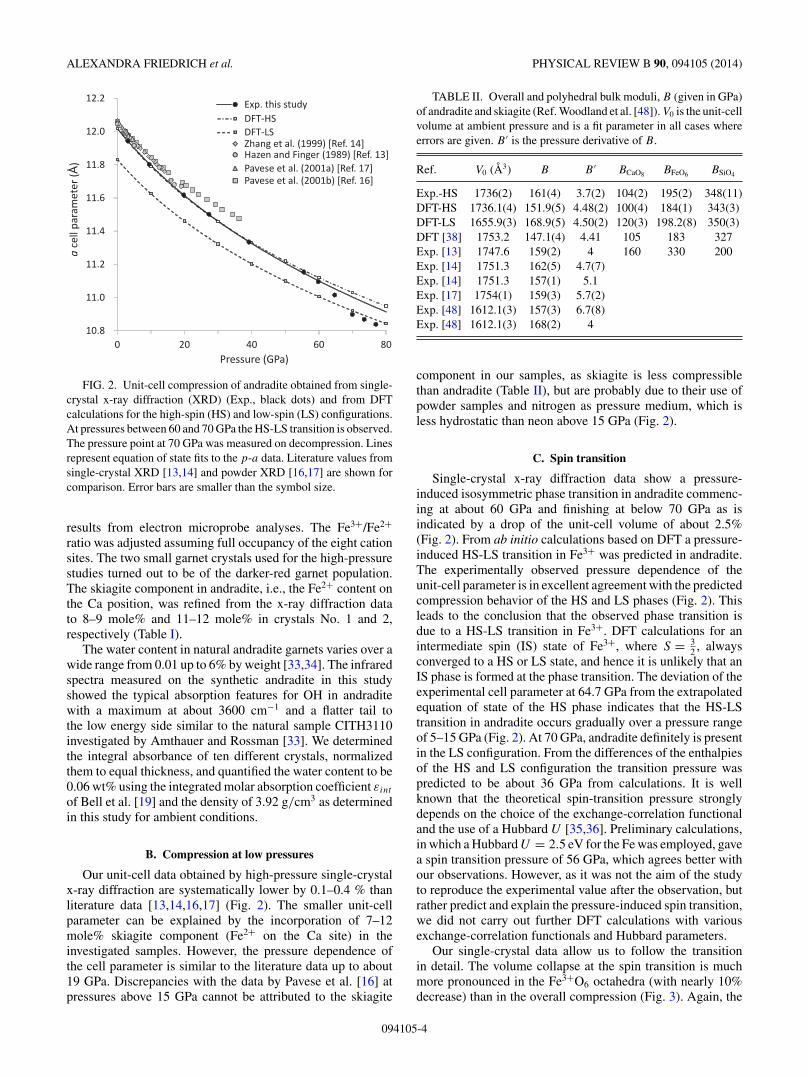
ALEXANDRA FRIEDRICH et al. PHYSICAL REVIEW B 90, 094105 (2014)
FIG. 2. Unit-cell compression of andradite obtained from single-crystal x-ray diffraction (XRD) (Exp., black dots) and from DFTcalculations for the high-spin (HS) and low-spin (LS) configurations.At pressures between 60 and 70 GPa the HS-LS transition is observed.The pressure point at 70 GPa was measured on decompression. Linesrepresent equation of state fits to the p-a data. Literature values fromsingle-crystal XRD [13,14] and powder XRD [16,17] are shown forcomparison. Error bars are smaller than the symbol size.
results from electron microprobe analyses. The Fe3+/Fe2+ratio was adjusted assuming full occupancy of the eight cationsites. The two small garnet crystals used for the high-pressurestudies turned out to be of the darker-red garnet population.The skiagite component in andradite, i.e., the Fe2+ content onthe Ca position, was refined from the x-ray diffraction datato 8–9 mole% and 11–12 mole% in crystals No. 1 and 2,respectively (Table I).
The water content in natural andradite garnets varies over awide range from 0.01 up to 6% by weight [33,34]. The infraredspectra measured on the synthetic andradite in this studyshowed the typical absorption features for OH in andraditewith a maximum at about 3600 cm−1 and a flatter tail tothe low energy side similar to the natural sample CITH3110investigated by Amthauer and Rossman [33]. We determinedthe integral absorbance of ten different crystals, normalizedthem to equal thickness, and quantified the water content to be0.06 wt% using the integrated molar absorption coefficient εint
of Bell et al. [19] and the density of 3.92 g/cm3 as determinedin this study for ambient conditions.
B. Compression at low pressures
Our unit-cell data obtained by high-pressure single-crystalx-ray diffraction are systematically lower by 0.1–0.4 % thanliterature data [13,14,16,17] (Fig. 2). The smaller unit-cellparameter can be explained by the incorporation of 7–12mole% skiagite component (Fe2+ on the Ca site) in theinvestigated samples. However, the pressure dependence ofthe cell parameter is similar to the literature data up to about19 GPa. Discrepancies with the data by Pavese et al. [16] atpressures above 15 GPa cannot be attributed to the skiagite
TABLE II. Overall and polyhedral bulk moduli, B (given in GPa)of andradite and skiagite (Ref. Woodland et al. [48]). V0 is the unit-cellvolume at ambient pressure and is a fit parameter in all cases whereerrors are given. B ′ is the pressure derivative of B.
Ref. V0 (A3) B B ′ BCaO8 BFeO6 BSiO4
Exp.-HS 1736(2) 161(4) 3.7(2) 104(2) 195(2) 348(11)DFT-HS 1736.1(4) 151.9(5) 4.48(2) 100(4) 184(1) 343(3)DFT-LS 1655.9(3) 168.9(5) 4.50(2) 120(3) 198.2(8) 350(3)DFT [38] 1753.2 147.1(4) 4.41 105 183 327Exp. [13] 1747.6 159(2) 4 160 330 200Exp. [14] 1751.3 162(5) 4.7(7)Exp. [14] 1751.3 157(1) 5.1Exp. [17] 1754(1) 159(3) 5.7(2)Exp. [48] 1612.1(3) 157(3) 6.7(8)Exp. [48] 1612.1(3) 168(2) 4
component in our samples, as skiagite is less compressiblethan andradite (Table II), but are probably due to their use ofpowder samples and nitrogen as pressure medium, which isless hydrostatic than neon above 15 GPa (Fig. 2).
C. Spin transition
Single-crystal x-ray diffraction data show a pressure-induced isosymmetric phase transition in andradite commenc-ing at about 60 GPa and finishing at below 70 GPa as isindicated by a drop of the unit-cell volume of about 2.5%(Fig. 2). From ab initio calculations based on DFT a pressure-induced HS-LS transition in Fe3+ was predicted in andradite.The experimentally observed pressure dependence of theunit-cell parameter is in excellent agreement with the predictedcompression behavior of the HS and LS phases (Fig. 2). Thisleads to the conclusion that the observed phase transition isdue to a HS-LS transition in Fe3+. DFT calculations for anintermediate spin (IS) state of Fe3+, where S = 3
2 , alwaysconverged to a HS or LS state, and hence it is unlikely that anIS phase is formed at the phase transition. The deviation of theexperimental cell parameter at 64.7 GPa from the extrapolatedequation of state of the HS phase indicates that the HS-LStransition in andradite occurs gradually over a pressure rangeof 5–15 GPa (Fig. 2). At 70 GPa, andradite definitely is presentin the LS configuration. From the differences of the enthalpiesof the HS and LS configuration the transition pressure waspredicted to be about 36 GPa from calculations. It is wellknown that the theoretical spin-transition pressure stronglydepends on the choice of the exchange-correlation functionaland the use of a Hubbard U [35,36]. Preliminary calculations,in which a Hubbard U = 2.5 eV for the Fe was employed, gavea spin transition pressure of 56 GPa, which agrees better withour observations. However, as it was not the aim of the studyto reproduce the experimental value after the observation, butrather predict and explain the pressure-induced spin transition,we did not carry out further DFT calculations with variousexchange-correlation functionals and Hubbard parameters.
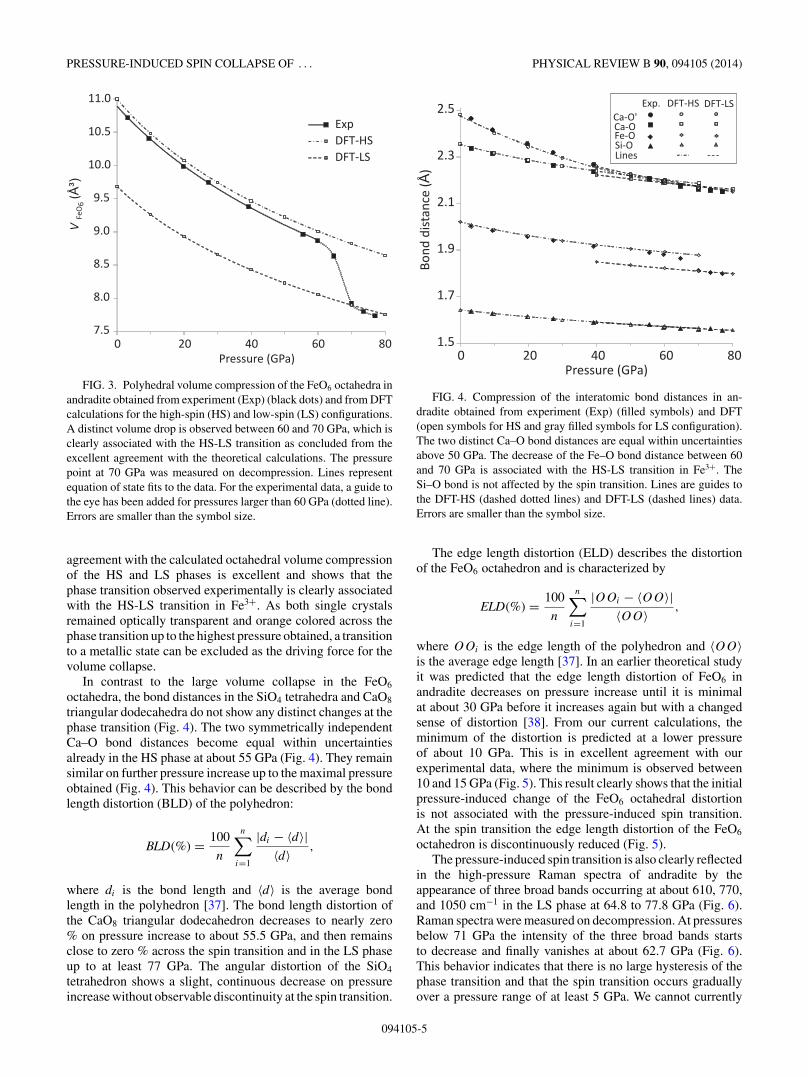
Our single-crystal data allow us to follow the transitionin detail. The volume collapse at the spin transition is muchmore pronounced in the Fe3+O6 octahedra (with nearly 10%decrease) than in the overall compression (Fig. 3). Again, the
094105-4
PRESSURE-INDUCED SPIN COLLAPSE OF . . . PHYSICAL REVIEW B 90, 094105 (2014)
FIG. 3. Polyhedral volume compression of the FeO6 octahedra inandradite obtained from experiment (Exp) (black dots) and from DFTcalculations for the high-spin (HS) and low-spin (LS) configurations.A distinct volume drop is observed between 60 and 70 GPa, which isclearly associated with the HS-LS transition as concluded from theexcellent agreement with the theoretical calculations. The pressurepoint at 70 GPa was measured on decompression. Lines representequation of state fits to the data. For the experimental data, a guide tothe eye has been added for pressures larger than 60 GPa (dotted line).Errors are smaller than the symbol size.
agreement with the calculated octahedral volume compressionof the HS and LS phases is excellent and shows that thephase transition observed experimentally is clearly associatedwith the HS-LS transition in Fe3+. As both single crystalsremained optically transparent and orange colored across thephase transition up to the highest pressure obtained, a transitionto a metallic state can be excluded as the driving force for thevolume collapse.
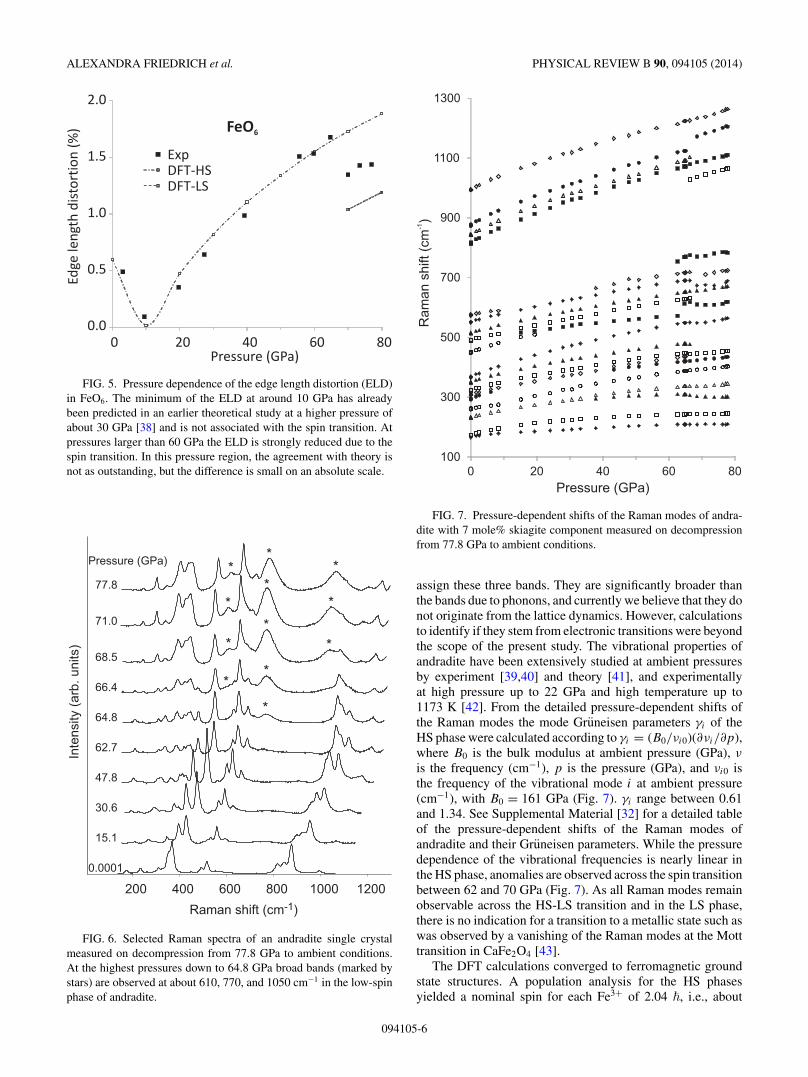
In contrast to the large volume collapse in the FeO6
octahedra, the bond distances in the SiO4 tetrahedra and CaO8
triangular dodecahedra do not show any distinct changes at thephase transition (Fig. 4). The two symmetrically independentCa–O bond distances become equal within uncertaintiesalready in the HS phase at about 55 GPa (Fig. 4). They remainsimilar on further pressure increase up to the maximal pressureobtained (Fig. 4). This behavior can be described by the bondlength distortion (BLD) of the polyhedron:
BLD(%) = 100
n
n∑
i=1
|di − 〈d〉|〈d〉 ,
where di is the bond length and 〈d〉 is the average bondlength in the polyhedron [37]. The bond length distortion ofthe CaO8 triangular dodecahedron decreases to nearly zero% on pressure increase to about 55.5 GPa, and then remainsclose to zero % across the spin transition and in the LS phaseup to at least 77 GPa. The angular distortion of the SiO4
tetrahedron shows a slight, continuous decrease on pressureincrease without observable discontinuity at the spin transition.
FIG. 4. Compression of the interatomic bond distances in an-dradite obtained from experiment (Exp) (filled symbols) and DFT(open symbols for HS and gray filled symbols for LS configuration).The two distinct Ca–O bond distances are equal within uncertaintiesabove 50 GPa. The decrease of the Fe–O bond distance between 60and 70 GPa is associated with the HS-LS transition in Fe3+. TheSi–O bond is not affected by the spin transition. Lines are guides tothe DFT-HS (dashed dotted lines) and DFT-LS (dashed lines) data.Errors are smaller than the symbol size.
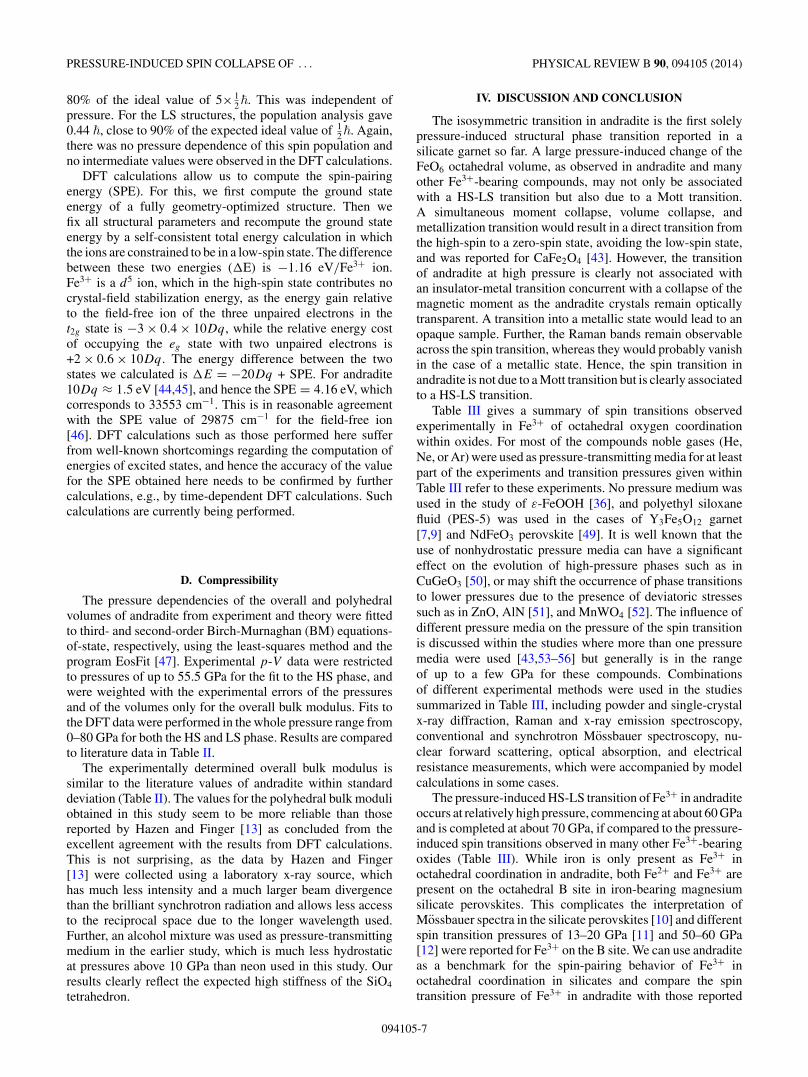
The edge length distortion (ELD) describes the distortionof the FeO6 octahedron and is characterized by
ELD(%) = 100
n
n∑
i=1
|OOi − 〈OO〉|〈OO〉 ,
where OOi is the edge length of the polyhedron and 〈OO〉is the average edge length [37]. In an earlier theoretical studyit was predicted that the edge length distortion of FeO6 inandradite decreases on pressure increase until it is minimalat about 30 GPa before it increases again but with a changedsense of distortion [38]. From our current calculations, theminimum of the distortion is predicted at a lower pressureof about 10 GPa. This is in excellent agreement with ourexperimental data, where the minimum is observed between10 and 15 GPa (Fig. 5). This result clearly shows that the initialpressure-induced change of the FeO6 octahedral distortionis not associated with the pressure-induced spin transition.At the spin transition the edge length distortion of the FeO6
octahedron is discontinuously reduced (Fig. 5).The pressure-induced spin transition is also clearly reflected
in the high-pressure Raman spectra of andradite by theappearance of three broad bands occurring at about 610, 770,and 1050 cm−1 in the LS phase at 64.8 to 77.8 GPa (Fig. 6).Raman spectra were measured on decompression. At pressuresbelow 71 GPa the intensity of the three broad bands startsto decrease and finally vanishes at about 62.7 GPa (Fig. 6).This behavior indicates that there is no large hysteresis of thephase transition and that the spin transition occurs graduallyover a pressure range of at least 5 GPa. We cannot currently
094105-5
ALEXANDRA FRIEDRICH et al. PHYSICAL REVIEW B 90, 094105 (2014)
FIG. 5. Pressure dependence of the edge length distortion (ELD)in FeO6. The minimum of the ELD at around 10 GPa has alreadybeen predicted in an earlier theoretical study at a higher pressure ofabout 30 GPa [38] and is not associated with the spin transition. Atpressures larger than 60 GPa the ELD is strongly reduced due to thespin transition. In this pressure region, the agreement with theory isnot as outstanding, but the difference is small on an absolute scale.
200 400 600 800 1000 1200
Inte
nsity
(arb
. uni
ts)
Raman shift (cm-1)
0.0001
15.1
30.6
47.8
62.7
64.8
66.4
68.5
71.0
77.8
Pressure (GPa)
*
**
**
*
**
*
**
*
FIG. 6. Selected Raman spectra of an andradite single crystalmeasured on decompression from 77.8 GPa to ambient conditions.At the highest pressures down to 64.8 GPa broad bands (marked bystars) are observed at about 610, 770, and 1050 cm−1 in the low-spinphase of andradite.
FIG. 7. Pressure-dependent shifts of the Raman modes of andra-dite with 7 mole% skiagite component measured on decompressionfrom 77.8 GPa to ambient conditions.
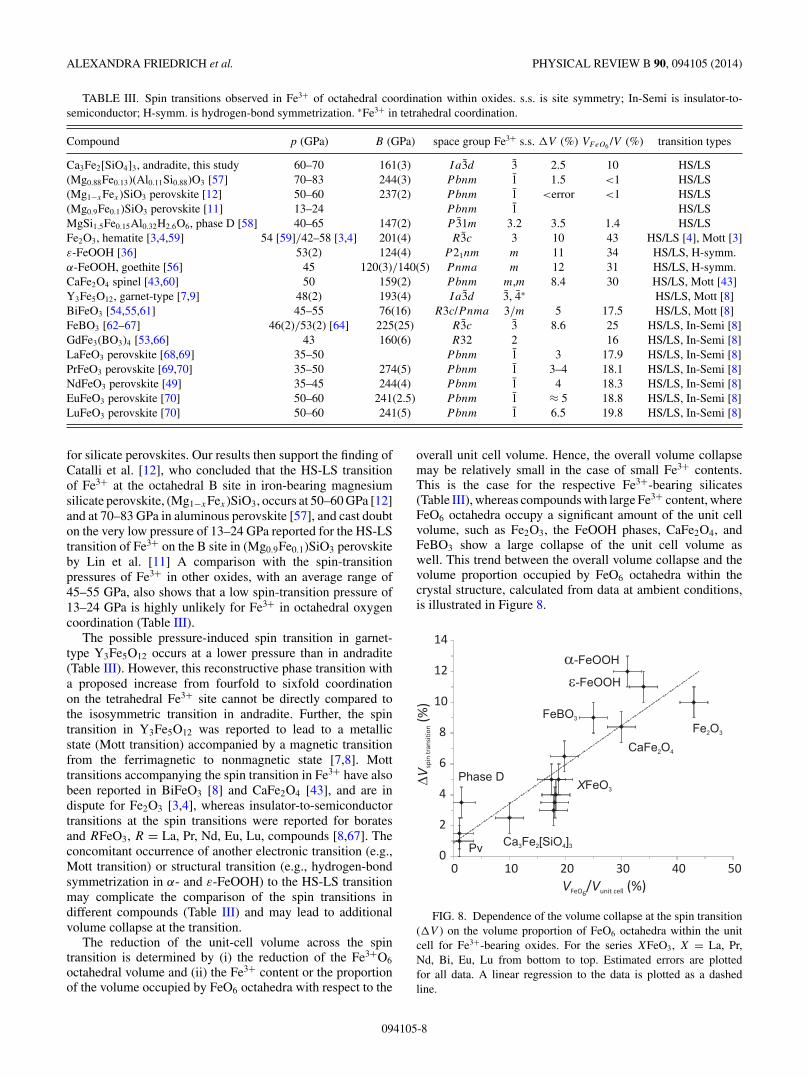
assign these three bands. They are significantly broader thanthe bands due to phonons, and currently we believe that they donot originate from the lattice dynamics. However, calculationsto identify if they stem from electronic transitions were beyondthe scope of the present study. The vibrational properties ofandradite have been extensively studied at ambient pressuresby experiment [39,40] and theory [41], and experimentallyat high pressure up to 22 GPa and high temperature up to1173 K [42]. From the detailed pressure-dependent shifts ofthe Raman modes the mode Gruneisen parameters γi of theHS phase were calculated according to γi = (B0/νi0)(∂νi/∂p),where B0 is the bulk modulus at ambient pressure (GPa), ν
is the frequency (cm−1), p is the pressure (GPa), and νi0 isthe frequency of the vibrational mode i at ambient pressure(cm−1), with B0 = 161 GPa (Fig. 7). γi range between 0.61and 1.34. See Supplemental Material [32] for a detailed tableof the pressure-dependent shifts of the Raman modes ofandradite and their Gruneisen parameters. While the pressuredependence of the vibrational frequencies is nearly linear inthe HS phase, anomalies are observed across the spin transitionbetween 62 and 70 GPa (Fig. 7). As all Raman modes remainobservable across the HS-LS transition and in the LS phase,there is no indication for a transition to a metallic state such aswas observed by a vanishing of the Raman modes at the Motttransition in CaFe2O4 [43].
The DFT calculations converged to ferromagnetic groundstate structures. A population analysis for the HS phasesyielded a nominal spin for each Fe3+ of 2.04 �, i.e., about
094105-6
PRESSURE-INDUCED SPIN COLLAPSE OF . . . PHYSICAL REVIEW B 90, 094105 (2014)
80% of the ideal value of 5× 12 �. This was independent of
pressure. For the LS structures, the population analysis gave0.44 �, close to 90% of the expected ideal value of 1
2 �. Again,there was no pressure dependence of this spin population andno intermediate values were observed in the DFT calculations.
DFT calculations allow us to compute the spin-pairingenergy (SPE). For this, we first compute the ground stateenergy of a fully geometry-optimized structure. Then wefix all structural parameters and recompute the ground stateenergy by a self-consistent total energy calculation in whichthe ions are constrained to be in a low-spin state. The differencebetween these two energies (�E) is −1.16 eV/Fe3+ ion.Fe3+ is a d5 ion, which in the high-spin state contributes nocrystal-field stabilization energy, as the energy gain relativeto the field-free ion of the three unpaired electrons in thet2g state is −3 × 0.4 × 10Dq, while the relative energy costof occupying the eg state with two unpaired electrons is+2 × 0.6 × 10Dq. The energy difference between the twostates we calculated is �E = −20Dq + SPE. For andradite10Dq ≈ 1.5 eV [44,45], and hence the SPE = 4.16 eV, whichcorresponds to 33553 cm−1. This is in reasonable agreementwith the SPE value of 29875 cm−1 for the field-free ion[46]. DFT calculations such as those performed here sufferfrom well-known shortcomings regarding the computation ofenergies of excited states, and hence the accuracy of the valuefor the SPE obtained here needs to be confirmed by furthercalculations, e.g., by time-dependent DFT calculations. Suchcalculations are currently being performed.
D. Compressibility
The pressure dependencies of the overall and polyhedralvolumes of andradite from experiment and theory were fittedto third- and second-order Birch-Murnaghan (BM) equations-of-state, respectively, using the least-squares method and theprogram EosFit [47]. Experimental p-V data were restrictedto pressures of up to 55.5 GPa for the fit to the HS phase, andwere weighted with the experimental errors of the pressuresand of the volumes only for the overall bulk modulus. Fits tothe DFT data were performed in the whole pressure range from0–80 GPa for both the HS and LS phase. Results are comparedto literature data in Table II.
The experimentally determined overall bulk modulus issimilar to the literature values of andradite within standarddeviation (Table II). The values for the polyhedral bulk moduliobtained in this study seem to be more reliable than thosereported by Hazen and Finger [13] as concluded from theexcellent agreement with the results from DFT calculations.This is not surprising, as the data by Hazen and Finger[13] were collected using a laboratory x-ray source, whichhas much less intensity and a much larger beam divergencethan the brilliant synchrotron radiation and allows less accessto the reciprocal space due to the longer wavelength used.Further, an alcohol mixture was used as pressure-transmittingmedium in the earlier study, which is much less hydrostaticat pressures above 10 GPa than neon used in this study. Ourresults clearly reflect the expected high stiffness of the SiO4
tetrahedron.
IV. DISCUSSION AND CONCLUSION
The isosymmetric transition in andradite is the first solelypressure-induced structural phase transition reported in asilicate garnet so far. A large pressure-induced change of theFeO6 octahedral volume, as observed in andradite and manyother Fe3+-bearing compounds, may not only be associatedwith a HS-LS transition but also due to a Mott transition.A simultaneous moment collapse, volume collapse, andmetallization transition would result in a direct transition fromthe high-spin to a zero-spin state, avoiding the low-spin state,and was reported for CaFe2O4 [43]. However, the transitionof andradite at high pressure is clearly not associated withan insulator-metal transition concurrent with a collapse of themagnetic moment as the andradite crystals remain opticallytransparent. A transition into a metallic state would lead to anopaque sample. Further, the Raman bands remain observableacross the spin transition, whereas they would probably vanishin the case of a metallic state. Hence, the spin transition inandradite is not due to a Mott transition but is clearly associatedto a HS-LS transition.
Table III gives a summary of spin transitions observedexperimentally in Fe3+ of octahedral oxygen coordinationwithin oxides. For most of the compounds noble gases (He,Ne, or Ar) were used as pressure-transmitting media for at leastpart of the experiments and transition pressures given withinTable III refer to these experiments. No pressure medium wasused in the study of ε-FeOOH [36], and polyethyl siloxanefluid (PES-5) was used in the cases of Y3Fe5O12 garnet[7,9] and NdFeO3 perovskite [49]. It is well known that theuse of nonhydrostatic pressure media can have a significanteffect on the evolution of high-pressure phases such as inCuGeO3 [50], or may shift the occurrence of phase transitionsto lower pressures due to the presence of deviatoric stressessuch as in ZnO, AlN [51], and MnWO4 [52]. The influence ofdifferent pressure media on the pressure of the spin transitionis discussed within the studies where more than one pressuremedia were used [43,53–56] but generally is in the rangeof up to a few GPa for these compounds. Combinationsof different experimental methods were used in the studiessummarized in Table III, including powder and single-crystalx-ray diffraction, Raman and x-ray emission spectroscopy,conventional and synchrotron Mossbauer spectroscopy, nu-clear forward scattering, optical absorption, and electricalresistance measurements, which were accompanied by modelcalculations in some cases.
The pressure-induced HS-LS transition of Fe3+ in andraditeoccurs at relatively high pressure, commencing at about 60 GPaand is completed at about 70 GPa, if compared to the pressure-induced spin transitions observed in many other Fe3+-bearingoxides (Table III). While iron is only present as Fe3+ inoctahedral coordination in andradite, both Fe2+ and Fe3+ arepresent on the octahedral B site in iron-bearing magnesiumsilicate perovskites. This complicates the interpretation ofMossbauer spectra in the silicate perovskites [10] and differentspin transition pressures of 13–20 GPa [11] and 50–60 GPa[12] were reported for Fe3+ on the B site. We can use andraditeas a benchmark for the spin-pairing behavior of Fe3+ inoctahedral coordination in silicates and compare the spintransition pressure of Fe3+ in andradite with those reported
094105-7
ALEXANDRA FRIEDRICH et al. PHYSICAL REVIEW B 90, 094105 (2014)
TABLE III. Spin transitions observed in Fe3+ of octahedral coordination within oxides. s.s. is site symmetry; In-Semi is insulator-to-semiconductor; H-symm. is hydrogen-bond symmetrization. ∗Fe3+ in tetrahedral coordination.
Compound p (GPa) B (GPa) space group Fe3+ s.s. �V (%) VFeO6 /V (%) transition types
Ca3Fe2[SiO4]3, andradite, this study 60–70 161(3) Ia3d 3 2.5 10 HS/LS(Mg0.88Fe0.13)(Al0.11Si0.88)O3 [57] 70–83 244(3) Pbnm 1 1.5 <1 HS/LS(Mg1−xFex)SiO3 perovskite [12] 50–60 237(2) Pbnm 1 <error <1 HS/LS(Mg0.9Fe0.1)SiO3 perovskite [11] 13–24 Pbnm 1 HS/LSMgSi1.5Fe0.15Al0.32H2.6O6, phase D [58] 40–65 147(2) P 31m 3.2 3.5 1.4 HS/LSFe2O3, hematite [3,4,59] 54 [59]/42–58 [3,4] 201(4) R3c 3 10 43 HS/LS [4], Mott [3]ε-FeOOH [36] 53(2) 124(4) P 21nm m 11 34 HS/LS, H-symm.α-FeOOH, goethite [56] 45 120(3)/140(5) Pnma m 12 31 HS/LS, H-symm.CaFe2O4 spinel [43,60] 50 159(2) Pbnm m,m 8.4 30 HS/LS, Mott [43]Y3Fe5O12, garnet-type [7,9] 48(2) 193(4) Ia3d 3, 4∗ HS/LS, Mott [8]BiFeO3 [54,55,61] 45–55 76(16) R3c/Pnma 3/m 5 17.5 HS/LS, Mott [8]FeBO3 [62–67] 46(2)/53(2) [64] 225(25) R3c 3 8.6 25 HS/LS, In-Semi [8]GdFe3(BO3)4 [53,66] 43 160(6) R32 2 16 HS/LS, In-Semi [8]LaFeO3 perovskite [68,69] 35–50 Pbnm 1 3 17.9 HS/LS, In-Semi [8]PrFeO3 perovskite [69,70] 35–50 274(5) Pbnm 1 3–4 18.1 HS/LS, In-Semi [8]NdFeO3 perovskite [49] 35–45 244(4) Pbnm 1 4 18.3 HS/LS, In-Semi [8]EuFeO3 perovskite [70] 50–60 241(2.5) Pbnm 1 ≈ 5 18.8 HS/LS, In-Semi [8]LuFeO3 perovskite [70] 50–60 241(5) Pbnm 1 6.5 19.8 HS/LS, In-Semi [8]
for silicate perovskites. Our results then support the finding ofCatalli et al. [12], who concluded that the HS-LS transitionof Fe3+ at the octahedral B site in iron-bearing magnesiumsilicate perovskite, (Mg1−xFex)SiO3, occurs at 50–60 GPa [12]and at 70–83 GPa in aluminous perovskite [57], and cast doubton the very low pressure of 13–24 GPa reported for the HS-LStransition of Fe3+ on the B site in (Mg0.9Fe0.1)SiO3 perovskiteby Lin et al. [11] A comparison with the spin-transitionpressures of Fe3+ in other oxides, with an average range of45–55 GPa, also shows that a low spin-transition pressure of13–24 GPa is highly unlikely for Fe3+ in octahedral oxygencoordination (Table III).
The possible pressure-induced spin transition in garnet-type Y3Fe5O12 occurs at a lower pressure than in andradite(Table III). However, this reconstructive phase transition witha proposed increase from fourfold to sixfold coordinationon the tetrahedral Fe3+ site cannot be directly compared tothe isosymmetric transition in andradite. Further, the spintransition in Y3Fe5O12 was reported to lead to a metallicstate (Mott transition) accompanied by a magnetic transitionfrom the ferrimagnetic to nonmagnetic state [7,8]. Motttransitions accompanying the spin transition in Fe3+ have alsobeen reported in BiFeO3 [8] and CaFe2O4 [43], and are indispute for Fe2O3 [3,4], whereas insulator-to-semiconductortransitions at the spin transitions were reported for boratesand RFeO3, R = La, Pr, Nd, Eu, Lu, compounds [8,67]. Theconcomitant occurrence of another electronic transition (e.g.,Mott transition) or structural transition (e.g., hydrogen-bondsymmetrization in α- and ε-FeOOH) to the HS-LS transitionmay complicate the comparison of the spin transitions indifferent compounds (Table III) and may lead to additionalvolume collapse at the transition.
The reduction of the unit-cell volume across the spintransition is determined by (i) the reduction of the Fe3+O6
octahedral volume and (ii) the Fe3+ content or the proportionof the volume occupied by FeO6 octahedra with respect to the
overall unit cell volume. Hence, the overall volume collapsemay be relatively small in the case of small Fe3+ contents.This is the case for the respective Fe3+-bearing silicates(Table III), whereas compounds with large Fe3+ content, whereFeO6 octahedra occupy a significant amount of the unit cellvolume, such as Fe2O3, the FeOOH phases, CaFe2O4, andFeBO3 show a large collapse of the unit cell volume aswell. This trend between the overall volume collapse and thevolume proportion occupied by FeO6 octahedra within thecrystal structure, calculated from data at ambient conditions,is illustrated in Figure 8.
FIG. 8. Dependence of the volume collapse at the spin transition(�V ) on the volume proportion of FeO6 octahedra within the unitcell for Fe3+-bearing oxides. For the series XFeO3, X = La, Pr,Nd, Bi, Eu, Lu from bottom to top. Estimated errors are plottedfor all data. A linear regression to the data is plotted as a dashedline.
094105-8
PRESSURE-INDUCED SPIN COLLAPSE OF . . . PHYSICAL REVIEW B 90, 094105 (2014)
There is no obvious relation between the pressure of the spintransition and the overall bulk modulus (Table III). However,a relationship with the FeO6 octahedral bulk modulus maybe expected. In principle, the FeO6 bulk modulus should notvary much between different oxides and hence, similar spintransition pressures are expected. Nevertheless, variations ofthe starting pressures of the spin transitions between about35 GPa and 60 GPa are observed (Table III). Clearly, dataare missing for the bulk modulus of FeO6 of most compounds.Another measure for the occurrence of a spin transition in Fe3+is the pressure-induced reduction of the Fe–O bond lengths[59]. If the Fe–O distance is reduced below a critical value, theoccurrence of a spin transition and the discontinuous reductionof the Fe–O bond length due to the smaller ionic radius of Fe3+in the LS state if compared to the HS state is expected. Fromthe comparison of the reduction of the average Fe–O distancesin hematite (α-Fe2O3), CaFe2O4, goethite (α-FeOOH), andFeBO3 as given in Bykova et al. [59], a critical Fe–O distanceof below 1.89–1.92 A is estimated to induce a spin transitionin these compounds. This is supported by our findings, wherethe critical Fe–O distance is 1.88 A at 60 GPa in andradite(Table I). Therefore, the Fe–O distance of ≈1.9 A seems to bea critical parameter for all Fe3+ sites in octahedral oxygen
coordination. Clearly, more structural data of other ferriccompounds are needed. In summary, we have identified andcharacterized a HS-LS transition in Fe3+ in andradite, repre-sentative for the behavior of Fe3+ in octahedral coordination insilicates.
ACKNOWLEDGMENTS
Financial support from the DFG, Germany, within priorityprogram SPP1236 to A.F. (Project FR-2491/2-1) and toB.W. (Project Wi1232/36), the BMBF, Germany (Projects05KS7RF1, 05K10RFA and 05K13RF1), and DESY-PhotonScience, Germany is gratefully acknowledged. Portions ofthis research were carried out at the light source PETRAIII at DESY and at the infrared beam line, IRIS, at BESSYII, both members of the Helmholtz Association (HGF).J.R.-F. thanks the Alexander von Humboldt Foundation fora postdoctoral fellowship. We would like to thank H.-P.Liermann (PETRA III) for assistance in using beamlineP02.2 and Ulrich Schade (BESSY II) for support during themeasurements. We are grateful for constructive reviews of twoanonymous referees that helped to strengthen and improve themanuscript.
[1] W. S. Fyfe, Geochim. Cosmochim. Acta 19, 141 (1960).[2] M. P. Pasternak, R. D. Taylor, R. Jeanloz, X. Li, J. H. Nguyen,
and C. A. McCammon, Phys. Rev. Lett. 79, 5046 (1997).[3] M. P. Pasternak, G. K. Rozenberg, G. Y. Machavariani,
O. Naaman, R. D. Taylor, and R. Jeanloz, Phys. Rev. Lett. 82,4663 (1999).
[4] J. Badro, G. Fiquet, V. V. Struzhkin, M. Somayazulu, H.-k.Mao, G. Shen, and T. LeBihan, Phys. Rev. Lett. 89, 205504(2002).
[5] J.-P. Rueff, C.-C. Kao, V. V. Struzhkin, J. Badro, J. Shu, R. J.Hemley, and H. K. Mao, Phys. Rev. Lett. 82, 3284 (1999).
[6] C. A. Geiger, Elements 9, 447 (2013).[7] I. S. Lyubutin, A. G. Gavriliuk, I. A. Trojan, and R. A. Sadykov,
JETP Lett. 82, 702 (2005).[8] I. S. Lyubutin, S. G. Ovchinnikov, A. G. Gavriliuk, and V. V.
Struzhkin, Phys. Rev. B 79, 085125 (2009).[9] A. G. Gavriliuk, V. V. Struzhkin, I. S. Lyubutin, M. I. Eremets,
I. A. Trojan, and V. V. Artemov, JETP Lett. 83, 37 (2006).[10] J.-F. Lin, S. Speziale, Z. Mao, and H. Marquardt, Rev. Geophys.
51, 244 (2013).[11] J.-F. Lin, E. E. Alp, Z. Mao, T. Inoue, C. McCammon, Y. Xiao,
P. Chow, and J. Zhao, Am. Mineral. 97, 592 (2012).[12] K. Catalli, S.-H. Shim, V. B. Prakapenka, J. Zhao, W. Sturhahn,
P. Chow, Y. Xiao, H. Liu, H. Cynn, and W. J. Evans, Earth andPlanet. Sci. Lett. 289, 68 (2010).
[13] R. M. Hazen and L. W. Finger, Am. Mineral. 74, 352(1989).
[14] L. Zhang, H. Ahsbahs, A. Kutoglu, and C. A. Geiger, Phys.Chem. Minerals 27, 52 (1999).
[15] Z. Wang, T. Yage, and T. Kondo, J. Phys. Chem. Solids 60, 441(1999).
[16] A. Pavese, D. Levy, and V. Pischedda, Eur. J. Mineral. 13, 929(2001).
[17] A. Pavese, V. Diella, V. Pischedda, M. Merli, R. Bocchio, andM. Mezouar, Phys. Chem. Minerals 28, 242 (2001).
[18] M. Koch-Muller, D. Rhede, R. Schulz, and R. Wirth, Phys.Chem. Minerals 36, 329 (2009).
[19] D. R. Bell, P. H. Ihinger, and G. R. Rossman, Am. Mineral. 80,465 (1995).
[20] H. K. Mao, J. Xu, and P. M. Bell, J. Geophys. Res. 91, 4673(1986).
[21] R. Boehler, Rev. Sci. Instrum. 77, 115103 (2006).[22] H.-P. Liermann, W. Morgenroth, A. Ehnes, A. Berghauser,
B. Winkler, H. Franz, and E. Weckert, J. Phys. Conf. Ser. 215,012029/1 (2010).
[23] A. Rothkirch, G. D. Gatta, M. Meyer, S. Merkel, M. Merlini,and H.-P. Liermann, J. Synchrotron Rad. 20, 711 (2013).
[24] Agilent, CrysAlisPro Software System, version 1.171.36.28,Agilent Technologies UK Ltd., Oxford, UK (2013).
[25] G. M. Sheldrick, Acta Crystallogr. A 64, 112 (2008).[26] L. J. Farrugia, J. Appl. Cryst. 32, 837 (1999).[27] T. Balic-Zunic and I. Vickovic, J. Appl. Cryst. 29, 305 (1996).[28] K. Syassen, DATLAB (2005), Version 1.37d, MPI/FKF Stuttgart,
Germany.[29] S. J. Clark, M. D. Segall, C. J. Pickard, P. J. Hasnip, M. I. J.
Probert, K. Refson, and M. C. Payne, Z. Kristallogr. 220, 567(2005).
[30] H. J. Monkhorst and J. D. Pack, Phys. Rev. B 13, 5188(1976).
[31] Z. Wu and R. E. Cohen, Phys. Rev. B 73, 235116 (2006).[32] See Supplemental Material at http://link.aps.org/supplemental/
10.1103/PhysRevB.90.094105 for a table of the results fromelectron microprobe analyses and for a detailed table of thepressure-dependent shifts of the Raman modes of andradite andtheir Gruneisen parameters.
[33] G. Amthauer and G. R. Rossman, Am. Mineral. 83, 835 (1998).
094105-9
ALEXANDRA FRIEDRICH et al. PHYSICAL REVIEW B 90, 094105 (2014)
[34] B. Phichaikamjornwut, H. Skogby, P. Ounchanum,P. Limtrakun, and A. Boonsoong, Eur. J. Mineral. 24,107 (2012).
[35] R. Wentzcovitch, H. Hsu, and K. Umemoto, Eur. J. Mineral. 24,851 (2012).
[36] A. E. Gleason, C. E. Quiroga, A. Suzuki, R. Pentcheva, andW. L. Mao, Earth and Planet. Sci. Lett. 379, 49 (2013).
[37] E. V. Akhmatskaya, R. H. Nobes, V. Milman, and B. Winkler,Z. Kristallogr. 214, 808 (1999).
[38] V. Milman, E. V. Akhmatskaya, R. H. Nobes, B. Winkler, C. J.Pickard, and J. A. White, Acta Crystallogr. B 57, 163 (2001).
[39] A. M. Hofmeister and A. Chopelas, Phys. Chem. Minerals 17,503 (1991).
[40] B. A. Kolesov and C. A. Geiger, Phys. Chem. Minerals 25, 142(1998).
[41] F. Pascale, M. Catti, A. Damin, R. Orlando, V. R. Saunders, andR. Dovesi, J. Phys. Chem. B 109, 18522 (2005).
[42] P. Gillet, G. Fiquet, J. M. Malezieux, and C. A. Geiger, Eur. J.Mineral. 4, 651 (1992).
[43] E. Greenberg, G. K. Rozenberg, W. Xu, M. P. Pasternak,C. McCammon, K. Glazyrin, and L. S. Dubrovinsky, Phys. Rev.B 88, 214109 (2013).
[44] D. T. Sviridov, R. K. Sviridova, and J. F. Smirnov, OpticalSpectra of Transition Metal Ions in Crystals (Nauka, Moscow,1976).
[45] M.-A. Arrio, S. Rossano, C. Brouder, L. Galoisy, and G. Calas,Europhys. Lett. 51, 454 (2000).
[46] R. G. Burns, Mineralogical applications of crystal field theory(Cambridge University Press, Cambridge, 1993).
[47] R. J. Angel, J. Gonzalez-Platas, and M. Alvaro, Z. Kristallogr.229, 405 (2014).
[48] A. B. Woodland, R. J. Angel, M. Koch, M. Kunz, andR. Miletich, J. Geophys. Res. 104, 20049 (1999).
[49] A. G. Gavriliuk, I. A. Troyan, R. Boehler, M. I. Eremets, I. S.Lyubutin, and N. R. Serebryanaya, JETP Lett. 77, 619 (2003).
[50] A. Jayaraman, S. R. Shieh, S. K. Sharma, L. C. Ming, and S. Y.Wang, J. Raman Spectr. 32, 167 (2001).
[51] L. Bayarjargal, L. Wiehl, and B. Winkler, High Press. Res. 33,642 (2013).
[52] J. Ruiz-Fuertes, D. Errandonea, O. Gomis, A. Friedrich, andF. J. Manjon, J. Appl. Phys. 115, 043510 (2014).
[53] I. S. Lyubutin, A. G. Gavriliuk, V. V. Struzhkin, S. G.Ovchinnikov, S. A. Kharlamova, L. N. Bezmaternykh, M. Hu,and P. Chow, JETP Lett. 84, 518 (2007).
[54] A. G. Gavriliuk, V. V. Struzhkin, I. S. Lyubutin, S. G.Ovchinnikov, M. Y. Hu, and P. Chow, Phys. Rev. B 77, 155112(2008).
[55] M. Guennou, P. Bouvier, G. S. Chen, B. Dkhil, R. Haumont,G. Garbarino, and J. Kreisel, Phys. Rev. B 84, 174107 (2011).
[56] W. Xu, E. Greenberg, G. K. Rozenberg, M. P. Pasternak,E. Bykova, T. Boffa-Ballaran, L. Dubrovinsky, V. Prakapenka,M. Hanfland, O. Y. Vekilova, S. I. Simak, and I. A. Abrikosov,Phys. Rev. Lett. 111, 175501 (2013).
[57] K. Catalli, S.-H. Shim, P. Dera, V. B. Prakapenka, J. Zhao,W. Sturhahn, P. Chow, Y. Xiao, H. Cynn, and W. J. Evans, EarthPlanet. Sci. Lett. 310, 293 (2011).
[58] Y.-Y. Chang, S. D. Jacobsen, J.-F. Lin, C. R. Bina, S.-M. Thomas,J. Wu, G. Shen, Y. Xiao, P. Chow, D. J. Frost, C. A. McCammon,and P. Dera, Earth Planet. Sci. Lett. 382, 1 (2013).
[59] E. Bykova, M. Bykov, V. Prakapenka, Z. Konopkova, H.-P.Liermann, N. Dubrovinskaia, and L. Dubrovinsky, High Press.Res. 33, 534 (2013).
[60] M. Merlini, M. Hanfland, M. Gemmi, S. Huotari, L. Simonelli,and P. Strobel, Am. Mineral. 95, 200 (2010).
[61] A. G. Gavriliuk, V. V. Struzhkin, I. S. Lyubutin, and I. A. Troyan,JETP Lett. 86, 197 (2007).
[62] I. A. Troyan, A. G. Gavrilyuk, V. A. Sarkisyan, I. S. Lyubutin,R. Ruffer, O. Leupold, A. Barla, B. Doyle, and A. I. Chumakov,JETP Lett. 74, 24 (2001).
[63] V. A. Sarkisyan, I. A. Troyan, I. S. Lyubutin, A. G. Gavrilyuk,and A. F. Kashuba, JETP Lett. 76, 664 (2002).
[64] A. G. Gavriliuk, I. A. Trojan, R. Boehler, M. Eremets,A. Zerr, I. S. Lyubutin, and V. A. Sarkisyan, JETP Lett. 75, 23(2002).
[65] I. A. Troyan, M. I. Eremets, A. G. Gavrilyuk, I. S. Lyubutin, andV. A. Sarkisyan, JETP Lett. 78, 13 (2003).
[66] A. G. Gavriliuk, S. A. Kharlamova, I. S. Lyubutin, I. A. Troyan,S. G. Ovchinnikov, A. M. Potseluiko, M. I. Eremets, and R.Boehler, JETP Lett. 80, 426 (2004).
[67] I. A. Troyan, A. G. Gavrilyuk, S. G. Ovchinnikov, I. S. Lyubutin,and N. V. Kazak, JETP Lett. 94, 748 (2012).
[68] G. R. Hearne, M. P. Pasternak, R. D. Taylor, and P. Lacorre,Phys. Rev. B 51, 11495 (1995).
[69] W. M. Xu, O. Naaman, G. K. Rozenberg, M. P. Pasternak, andR. D. Taylor, Phys. Rev. B 64, 094411 (2001).
[70] G. K. Rozenberg, M. P. Pasternak, W. M. Xu, L. S. Dubrovin-sky, S. Carlson, and R. D. Taylor, Europhys. Lett. 71, 228(2005).
094105-10