orix kabushiki kaisha · united states securities and exchange commission washington, d.c. 20549...
TRANSCRIPT

UNITED STATES SECURITIES AND EXCHANGE COMMISSIONWashington, D.C. 20549
FORM 20-F/A(Amendment No. 1)
(Mark One)‘ REGISTRATION STATEMENT PURSUANT TO SECTION 12(b) OR (g) OF THE SECURITIES EXCHANGE ACT OF 1934
ORÈ ANNUAL REPORT PURSUANT TO SECTION 13 OR 15(d) OF THE SECURITIES EXCHANGE ACT OF 1934
For the fiscal year ended March 31, 2017OR
‘ TRANSITION REPORT PURSUANT TO SECTION 13 OR 15(d) OF THE SECURITIES EXCHANGE ACT OF 1934For the transition period from to
OR‘ SHELL COMPANY REPORT PURSUANT TO SECTION 13 OR 15(d) OF THE SECURITIES EXCHANGE ACT OF 1934
Date of event requiring this shell company report:Commission file number: 001-14856
ORIX KABUSHIKI KAISHA(Exact name of Registrant as specified in its charter)
ORIX CORPORATION(Translation of Registrant’s name into English)
Japan(Jurisdiction of incorporation or organization)
World Trade Center Building, 2-4-1 Hamamatsu-cho, Minato-kuTokyo 105-6135, Japan
(Address of principal executive offices)Yukio Uchimura
World Trade Center Building, 2-4-1 Hamamatsu-cho, Minato-kuTokyo 105-6135, Japan
Telephone: +81-3-3435-1273Facsimile: +81-3-3435-1276
(Name, telephone, e-mail and/or facsimile number and address of company contact person)Securities registered or to be registered pursuant to Section 12(b) of the Act:
Title of each class Name of each exchange on which registered
(1) Common stock without par value (the “Shares”) . . . . . . . . . . . . . . . . . . . . . . . . . . . . . . . . . . . . . . . . . . . . . . . . . . New York Stock Exchange*(2) American depository shares (the “ADSs”), each of which represents five shares . . . . . . . . . . . . . . . . . . . . . . . . . New York Stock Exchange
Securities registered or to be registered pursuant to Section 12(g) of the Act:None
Securities for which there is a reporting obligation pursuant to Section 15(d) of the Act:None
Indicate the number of outstanding shares of each of the issuer’s classes of capital or common stock as of the close of the period covered by the annual report.As of March 31, 2017, 1,324,107,328 Shares were outstanding, including Shares that were represented by 4,857,401 ADSs.
Indicate by check mark if the Registrant is a well-known seasoned issuer, as defined in Rule 405 of the Securities Act.È Yes ‘ No
If this report is an annual or transition report, indicate by check mark if the Registrant is not required to file reports pursuant to Section 13 or 15(d) of theSecurities Exchange Act of 1934.
‘ Yes È NoNote—Checking the box above will not relieve any Registrant required to file reports pursuant to Section 13 or Section 15(d) of the Securities Exchange
Act of 1934 from their obligations under those sections.Indicate by check mark whether the Registrant:(1) has filed all reports required to be filed by Section 13 or 15(d) of the Securities Exchange Act of 1934
during the preceding 12 months (or for such shorter period that the Registrant was required to file such reports), and (2) has been subject to such filingrequirements for the past 90 days.
È Yes ‘ NoIndicate by check mark whether the Registrant submitted electronically and posted on its corporate Web site, if any, every Interactive Data File required to
be submitted and posted pursuant to Rule 405 of Regulation S-T during the preceding 12 months (or for such shorter period that the Registrant was required tosubmit and post such files).
È Yes ‘ NoIndicate by check mark whether the Registrant is a large accelerated filer, an accelerated filer, a non-accelerated filer, or an emerging growth company.
See definition of “large accelerated filer”, “accelerated filer”, and “emerging growth company” in Rule 12b-2 of the Exchange Act.Large accelerated filer È Accelerated filer ‘ Non-accelerated filer ‘ Emerging growth company ‘
If an emerging growth company that prepares its financial statements in accordance with U.S. GAAP, indicate by check mark if the registrant has electednot to use the extended transition period for complying with any new or revised financial accounting standards† provided pursuant to Section 13(a) of theExchange Act. ‘
† The term “new or revised financial accounting standard” refers to any update issued by the Financial Accounting Standards Board to its AccountingStandards Codification after April 5, 2012.
Indicate by check mark which basis of accounting the Registrant has used to prepare the financial statements included in this filing.È U.S. GAAP ‘ International Financial Reporting Standards as issued by the International Accounting Standards Board ‘ Other
If “Other” has been checked in response to the previous question, indicate by check mark which financial statement item the Registrant has elected tofollow.
‘ Item 17 ‘ Item 18If this is an annual report, indicate by check mark whether the Registrant is a shell company (as defined in Rule 12b-2 of the Exchange Act).
‘ Yes È No(APPLICABLE ONLY TO ISSUERS INVOLVED IN BANKRUPTCY PROCEEDINGS DURING THE PAST FIVE YEARS)Indicate by check mark whether the Registrant has filed all documents and reports required to be filed by Sections 12, 13 or 15(d) of the Securities Exchange
Act of 1934 subsequent to the distribution of securities under a plan confirmed by a court.‘ Yes ‘ No
* Not for trading, but only for technical purposes in connection with the registration of the ADSs.

TABLE OF CONTENTS
Page
EXPLANATORY NOTE . . . . . . . . . . . . . . . . . . . . . . . . . . . . . . . . . . . . . . . . . . . . . . . . . . . . . . . . . . . . . . . . ii
PART III . . . . . . . . . . . . . . . . . . . . . . . . . . . . . . . . . . . . . . . . . . . . . . . . . . . . . . . . . . . . . . . . . . . . . . . . . . . . . 1Item 18. Financial Statements . . . . . . . . . . . . . . . . . . . . . . . . . . . . . . . . . . . . . . . . . . . . . . . . . . . . . . 1Item 19. Exhibits . . . . . . . . . . . . . . . . . . . . . . . . . . . . . . . . . . . . . . . . . . . . . . . . . . . . . . . . . . . . . . . . 2
SIGNATURES . . . . . . . . . . . . . . . . . . . . . . . . . . . . . . . . . . . . . . . . . . . . . . . . . . . . . . . . . . . . . . . . . . . . . . . . 3
INDEX TO CONSOLIDATED FINANCIAL STATEMENTS . . . . . . . . . . . . . . . . . . . . . . . . . . . . . . . . . . . F-1
EXHIBIT INDEX
i

EXPLANATORY NOTE
This Amendment No. 1 on Form 20-F/A (this “Amendment”) amends the Annual Report on Form 20-F forthe year ended March 31, 2017 of ORIX KABUSHIKI KAISHA (the “Company”), as originally filed with theU.S. Securities and Exchange Commission on June 29, 2017 (the “Original Form 20-F”). The Company is filingthis Amendment solely to:
(i) file a corrected version of the Report of Independent Registered Public Accounting Firm of KPMGAZSA LLC dated June 29, 2017, relating to the audit of the Company’s consolidated financialstatements as of March 31, 2016 and 2017 and for each of the years in three-year period endedMarch 31, 2017;
(ii) resubmit the consolidated financial statements of the Company to which such corrected Report ofIndependent Registered Public Accounting Firm relates; and
(iii) file a corrected version of the consent of independent registered public accounting firm.
The consolidated financial statements of the Company included in Item 18 of this Amendment have notbeen amended and are included in this Amendment solely in connection with the filing of the corrected Report ofthe Independent Registered Public Accounting Firm mentioned above.
This Amendment does not affect any other parts of, or exhibits to, the Original Form 20-F, and it does notreflect events occurring after the date of the Original Form 20-F. Accordingly, this Amendment should be read inconjunction with the Original Form 20-F and any documents filed with or furnished to the U.S. Securities andExchange Commission by the Company subsequent to June 29, 2017.
ii

PART III
Item 18. Financial Statements
See pages F-1 through F-136.
The following consolidated financial statements of ORIX listed below and the report thereon by itsindependent registered public accounting firm are filed as part of this Form 20-F:
(a) Consolidated Balance Sheets as of March 31, 2016 and 2017 (page F-4 to F-5);
(b) Consolidated Statements of Income for the years ended March 31, 2015, 2016 and 2017 (page F-6 toF-7);
(c) Consolidated Statements of Comprehensive Income for the years ended March 31, 2015, 2016 and2017 (page F-8);
(d) Consolidated Statements of Changes in Equity for the years ended March 31, 2015, 2016 and 2017(page F-9 to F-10);
(e) Consolidated Statements of Cash Flows for the years ended March 31, 2015, 2016 and 2017 (pageF-11);
(f) Notes to Consolidated Financial Statements (page F-12 to F-135);
(g) Schedule II.—Valuation and Qualifying Accounts and Reserves (page F-136).
1

Item 19. Exhibits
We have filed the following documents as exhibits to this document.
Exhibit Number Description
Exhibit 1.1* Articles of Incorporation of ORIX Corporation, as amended on June 27, 2017.
Exhibit 1.2 Regulations of the Board of Directors of ORIX Corporation, as amended on June 1, 2015(Incorporated by reference from the annual report on Form 20-F filed on June 25, 2015,commission file number 001-14856).
Exhibit 1.3 Share Handling Regulations of ORIX Corporation, as amended on October 7, 2013(Incorporated by reference from the annual report on Form 20-F filed on June 26, 2014,commission file number 001-14856).
Exhibit 7.1* A statement explaining in reasonable detail how ratios in the annual report were calculated.
Exhibit 8.1* List of subsidiaries.
Exhibit 11.1 Code of Ethics, as amended on April 18, 2014 (Incorporated by reference from the annualreport on Form 20-F filed on June 26, 2014, commission file number 001-14856).
Exhibit 12.1* Certifications required by Rule 13a-14(a) (17 CFR 240.13a-14(a)) or Rule 15d-14(a) (17 CFR240.15d 14(a)).
Exhibit 12.2 Certifications required by Rule 13a-14(a) (17 CFR 240.13a-14(a)) or Rule 15d-14(a) (17 CFR240.15d 14(a)).
Exhibit 13.1* Certifications required by Rule 13a-14(b) (17 CFR 240.13a-14(b)) or Rule 15d-14(b) (17 CFR240.15d 14(b)) and Section 1350 of Chapter 63 of Title 18 of the United States Code (18U.S.C. 1350).
Exhibit 13.2 Certifications required by Rule 13a-14(b) (17 CFR 240.13a-14(b)) or Rule 15d-14(b) (17 CFR240.15d 14(b)) and Section 1350 of Chapter 63 of Title 18 of the United States Code (18U.S.C. 1350).
Exhibit 15.1* Consent of independent registered public accounting firm
Exhibit 15.2 Consent of independent registered public accounting firm
Exhibit 101* Instance Document.
Exhibit 101* Schema Document.
Exhibit 101* Calculation Linkbase Document.
Exhibit 101* Definition Linkbase Document.
Exhibit 101* Labels Linkbase Document.
Exhibit 101* Presentation Linkbase Document.
* Filed with the Original Form 20-F and incorporated by reference therefrom
We have not included as exhibits certain instruments with relation to our long-term debt or the long-termdebt of our subsidiaries. The total amount of securities of us or our subsidiaries authorized under any suchinstrument does not exceed 10% of our consolidated total assets. We hereby agree to furnish to the SEC, upon itsrequest, a copy of any and all such instruments.
2

SIGNATURES
The company hereby certifies that it meets all of the requirements for filing on Form 20-F/A and that it hasduly caused and authorized the undersigned to sign this annual report on its behalf.
ORIX KABUSHIKI KAISHA
By: /s/ KAZUO KOJIMA
Name: Kazuo KojimaTitle: Attorney-in-Fact
Chief Financial Officer
Date: July 5, 2017
3

INDEX TO CONSOLIDATED FINANCIAL STATEMENTS
Page
Reports of Independent Registered Public Accounting Firm . . . . . . . . . . . . . . . . . . . . . . . . . . . . . . . . . . . . F-2
Consolidated Balance Sheets as of March 31, 2016 and 2017 . . . . . . . . . . . . . . . . . . . . . . . . . . . . . . . . . . . F-4
Consolidated Statements of Income For the Years Ended March 31, 2015, 2016 and 2017 . . . . . . . . . . . . F-6
Consolidated Statements of Comprehensive Income For the Years Ended March 31, 2015, 2016 and2017 . . . . . . . . . . . . . . . . . . . . . . . . . . . . . . . . . . . . . . . . . . . . . . . . . . . . . . . . . . . . . . . . . . . . . . . . . . . . . . F-8
Consolidated Statements of Changes in Equity For the Years Ended March 31, 2015, 2016 and 2017 . . . F-9
Consolidated Statements of Cash Flows For the Years Ended March 31, 2015, 2016 and 2017 . . . . . . . . . F-11
Notes to Consolidated Financial Statements . . . . . . . . . . . . . . . . . . . . . . . . . . . . . . . . . . . . . . . . . . . . . . . . . F-12
Schedule II.—Valuation and Qualifying Accounts and Reserves . . . . . . . . . . . . . . . . . . . . . . . . . . . . . . . . . F-136
F-1

REPORT OF INDEPENDENT REGISTERED PUBLIC ACCOUNTING FIRM
To the Shareholders and the Board of Directors of ORIX Corporation:
We have audited the accompanying consolidated balance sheets of ORIX Corporation (a Japanesecorporation) and its subsidiaries as of March 31, 2016 and 2017, and the related consolidated statements ofincome, comprehensive income, changes in equity and cash flows for each of the years in the three-year periodended March 31, 2017. In connection with our audits of the consolidated financial statements, we also haveaudited financial statement Schedule II. These consolidated financial statements and financial statement scheduleare the responsibility of the Company’s management. Our responsibility is to express an opinion on theseconsolidated financial statements and financial statement schedule based on our audits.
We conducted our audits in accordance with the standards of the Public Company Accounting OversightBoard (United States). Those standards require that we plan and perform the audit to obtain reasonable assuranceabout whether the financial statements are free of material misstatement. An audit includes examining, on a testbasis, evidence supporting the amounts and disclosures in the financial statements. An audit also includesassessing the accounting principles used and significant estimates made by management, as well as evaluatingthe overall financial statement presentation. We believe that our audits provide a reasonable basis for ouropinion.
In our opinion, the consolidated financial statements referred to above present fairly, in all material respects,the financial position of ORIX Corporation and its subsidiaries as of March 31, 2016 and 2017, and the results oftheir operations and their cash flows for each of the years in the three-year period ended March 31, 2017, inconformity with U.S. generally accepted accounting principles. Also in our opinion, the related financialstatement schedule, when considered in relation to the basic consolidated financial statements taken as a whole,presents fairly, in all material respects, the information set forth therein.
As discussed in Note 35 to the consolidated financial statements, the share repurchase based on theresolution at the Board of Directors meeting held on October 26, 2016 and February 16, 2017 was completed.
We also have audited, in accordance with the standards of the Public Company Accounting Oversight Board(United States), ORIX Corporation’s internal control over financial reporting as of March 31, 2017, based oncriteria established in Internal Control—Integrated Framework (2013) issued by the Committee of SponsoringOrganizations of the Treadway Commission (COSO), and our report dated June 29, 2017 expressed anunqualified opinion on the effectiveness of ORIX Corporation’s internal control over financial reporting.
KPMG AZSA LLCTokyo, JapanJune 29, 2017
F-2

REPORT OF INDEPENDENT REGISTERED PUBLIC ACCOUNTING FIRM
To the Shareholders and the Board of Directors of ORIX Corporation:
We have audited ORIX Corporation’s (a Japanese corporation) internal control over financial reporting as ofMarch 31, 2017, based on criteria established in Internal Control—Integrated Framework (2013) issued by theCommittee of Sponsoring Organizations of the Treadway Commission (COSO). The Company’s management isresponsible for maintaining effective internal control over financial reporting and for its assessment of theeffectiveness of internal control over financial reporting, included in the accompanying Management’s Report onInternal Control over Financial Reporting, included in Item 15 “Controls and Procedures” of the accompanyingForm 20-F. Our responsibility is to express an opinion on ORIX Corporation’s internal control over financialreporting based on our audit.
We conducted our audit in accordance with the standards of the Public Company Accounting OversightBoard (United States). Those standards require that we plan and perform the audit to obtain reasonable assuranceabout whether effective internal control over financial reporting was maintained in all material respects. Ouraudit included obtaining an understanding of internal control over financial reporting, assessing the risk that amaterial weakness exists, and testing and evaluating the design and operating effectiveness of internal controlbased on the assessed risk. Our audit also included performing such other procedures as we considered necessaryin the circumstances. We believe that our audit provides a reasonable basis for our opinion.
A company’s internal control over financial reporting is a process designed to provide reasonable assuranceregarding the reliability of financial reporting and the preparation of financial statements for external purposes inaccordance with generally accepted accounting principles. A company’s internal control over financial reportingincludes those policies and procedures that (1) pertain to the maintenance of records that, in reasonable detail,accurately and fairly reflect the transactions and dispositions of the assets of the company; (2) provide reasonableassurance that transactions are recorded as necessary to permit preparation of financial statements in accordancewith generally accepted accounting principles, and that receipts and expenditures of the company are being madeonly in accordance with authorizations of management and directors of the company; and (3) provide reasonableassurance regarding prevention or timely detection of unauthorized acquisition, use, or disposition of thecompany’s assets that could have a material effect on the financial statements.
Because of its inherent limitations, internal control over financial reporting may not prevent or detectmisstatements. Also, projections of any evaluation of effectiveness to future periods are subject to the risk thatcontrols may become inadequate because of changes in conditions, or that the degree of compliance with thepolicies or procedures may deteriorate.
In our opinion, ORIX Corporation maintained, in all material respects, effective internal control overfinancial reporting as of March 31, 2017, based on criteria established in Internal Control—IntegratedFramework (2013) issued by the Committee of Sponsoring Organizations of the Treadway Commission (COSO).
We also have audited, in accordance with the standards of the Public Company Accounting Oversight Board(United States), the consolidated balance sheets of ORIX Corporation and its subsidiaries as of March 31, 2016and 2017, and the related consolidated statements of income, comprehensive income, changes in equity and cashflows for each of the years in the three-year period ended March 31, 2017, and our report dated June 29, 2017expressed an unqualified opinion on those consolidated financial statements.
KPMG AZSA LLCTokyo, JapanJune 29, 2017
F-3

CONSOLIDATED BALANCE SHEETSAS OF MARCH 31, 2016 AND 2017
ORIX Corporation and Subsidiaries
Millions of yen
2016 2017
ASSETSCash and Cash Equivalents . . . . . . . . . . . . . . . . . . . . . . . . . . . . . . . . . . . . . . . . . . . . . . . . . . . . . ¥ 730,420 ¥ 1,039,870Restricted Cash . . . . . . . . . . . . . . . . . . . . . . . . . . . . . . . . . . . . . . . . . . . . . . . . . . . . . . . . . . . . . . . 80,979 93,342Investment in Direct Financing Leases . . . . . . . . . . . . . . . . . . . . . . . . . . . . . . . . . . . . . . . . . . . . 1,190,136 1,204,024Installment Loans . . . . . . . . . . . . . . . . . . . . . . . . . . . . . . . . . . . . . . . . . . . . . . . . . . . . . . . . . . . . . 2,592,233 2,815,706
The amounts which are measured at fair value by electing the fair value option are asfollows:
March 31, 2016 ¥20,673 millionMarch 31, 2017 ¥19,232 million
Allowance for Doubtful Receivables on Direct Financing Leases and Probable LoanLosses . . . . . . . . . . . . . . . . . . . . . . . . . . . . . . . . . . . . . . . . . . . . . . . . . . . . . . . . . . . . . . . . . . . . (60,071) (59,227)
Investment in Operating Leases . . . . . . . . . . . . . . . . . . . . . . . . . . . . . . . . . . . . . . . . . . . . . . . . . . 1,349,199 1,313,164Investment in Securities . . . . . . . . . . . . . . . . . . . . . . . . . . . . . . . . . . . . . . . . . . . . . . . . . . . . . . . . 2,344,792 2,026,512
The amounts which are measured at fair value by electing the fair value option are asfollows:
March 31, 2016 ¥27,367 millionMarch 31, 2017 ¥24,894 million
Property under Facility Operations . . . . . . . . . . . . . . . . . . . . . . . . . . . . . . . . . . . . . . . . . . . . . . . 327,016 398,936Investment in Affiliates . . . . . . . . . . . . . . . . . . . . . . . . . . . . . . . . . . . . . . . . . . . . . . . . . . . . . . . . 530,667 524,234Trade Notes, Accounts and Other Receivable . . . . . . . . . . . . . . . . . . . . . . . . . . . . . . . . . . . . . . . 294,638 283,427Inventories . . . . . . . . . . . . . . . . . . . . . . . . . . . . . . . . . . . . . . . . . . . . . . . . . . . . . . . . . . . . . . . . . . 139,950 117,863Office Facilities . . . . . . . . . . . . . . . . . . . . . . . . . . . . . . . . . . . . . . . . . . . . . . . . . . . . . . . . . . . . . . 120,173 110,781Other Assets . . . . . . . . . . . . . . . . . . . . . . . . . . . . . . . . . . . . . . . . . . . . . . . . . . . . . . . . . . . . . . . . . 1,352,786 1,363,263
The amounts which are measured at fair value by electing the fair value option are asfollows:
March 31, 2016 ¥37,855 millionMarch 31, 2017 ¥22,116 million
Total Assets . . . . . . . . . . . . . . . . . . . . . . . . . . . . . . . . . . . . . . . . . . . . . . . . . ¥10,992,918 ¥11,231,895
Notes 1: Prior-year amounts have been adjusted for the retrospective application of Accounting Standards Update 2015-03(“Simplifying the Presentation of Debt Issuance Costs”—ASC 835-30 (“Interest—Imputation of Interest”)) onApril 1, 2016.
2: The assets of consolidated variable interest entities (VIEs) that can be used only to settle obligations of those VIEsare below:
Millions of yen
2016 2017
Cash and Cash Equivalents . . . . . . . . . . . . . . . . . . . . . . . . . . . . . . . . . . . . . . . . . . . . . . . . . . . . . ¥ 4,697 ¥ 5,674Investment in Direct Financing Leases (Net of Allowance for Doubtful Receivables on Direct
Financing Leases and Probable Loan Losses) . . . . . . . . . . . . . . . . . . . . . . . . . . . . . . . . . . . . . 134,604 90,822Installment Loans (Net of Allowance for Doubtful Receivables on Direct Financing Leases
and Probable Loan Losses) . . . . . . . . . . . . . . . . . . . . . . . . . . . . . . . . . . . . . . . . . . . . . . . . . . . . 195,702 186,818Investment in Operating Leases . . . . . . . . . . . . . . . . . . . . . . . . . . . . . . . . . . . . . . . . . . . . . . . . . . 227,340 151,686Property under Facility Operations . . . . . . . . . . . . . . . . . . . . . . . . . . . . . . . . . . . . . . . . . . . . . . . 79,697 109,656Investment in Affiliates . . . . . . . . . . . . . . . . . . . . . . . . . . . . . . . . . . . . . . . . . . . . . . . . . . . . . . . . 65,059 53,046Other . . . . . . . . . . . . . . . . . . . . . . . . . . . . . . . . . . . . . . . . . . . . . . . . . . . . . . . . . . . . . . . . . . . . . . . 93,410 105,591
¥800,509 ¥703,293
F-4

CONSOLIDATED BALANCE SHEETS—(Continued)AS OF MARCH 31, 2016 AND 2017
ORIX Corporation and Subsidiaries
Millions of yen
2016 2017
LIABILITIES AND EQUITYLiabilities:Short-term Debt . . . . . . . . . . . . . . . . . . . . . . . . . . . . . . . . . . . . . . . . . . . . . . . . . . . . . . . . . . . . . . ¥ 349,624 ¥ 283,467Deposits . . . . . . . . . . . . . . . . . . . . . . . . . . . . . . . . . . . . . . . . . . . . . . . . . . . . . . . . . . . . . . . . . . . . 1,398,472 1,614,608Trade Notes, Accounts and Other Payable . . . . . . . . . . . . . . . . . . . . . . . . . . . . . . . . . . . . . . . . . . 266,216 251,800Policy Liabilities and Policy Account Balances . . . . . . . . . . . . . . . . . . . . . . . . . . . . . . . . . . . . . . 1,668,636 1,564,758
The amounts which are measured at fair value by electing the fair value option are asfollows:
March 31, 2016 ¥795,001 millionMarch 31, 2017 ¥605,520 million
Income Taxes:Current . . . . . . . . . . . . . . . . . . . . . . . . . . . . . . . . . . . . . . . . . . . . . . . . . . . . . . . . . . . . . . . . . 17,398 93,884Deferred . . . . . . . . . . . . . . . . . . . . . . . . . . . . . . . . . . . . . . . . . . . . . . . . . . . . . . . . . . . . . . . . 341,360 351,828
Long-term Debt . . . . . . . . . . . . . . . . . . . . . . . . . . . . . . . . . . . . . . . . . . . . . . . . . . . . . . . . . . . . . . 3,936,918 3,854,984Other Liabilities . . . . . . . . . . . . . . . . . . . . . . . . . . . . . . . . . . . . . . . . . . . . . . . . . . . . . . . . . . . . . . 534,008 562,393
Total Liabilities . . . . . . . . . . . . . . . . . . . . . . . . . . . . . . . . . . . . . . . . . . . . . . 8,512,632 8,577,722
Redeemable Noncontrolling Interests . . . . . . . . . . . . . . . . . . . . . . . . . . . . . . . . . . . . . . . . . . . . . 7,467 6,548
Commitments and Contingent LiabilitiesEquity:
Common stock: 220,469 220,524Authorized: 2,590,000,000 sharesIssued:
March 31, 2016 1,324,058,828 sharesMarch 31, 2017 1,324,107,328 shares
Additional Paid-in Capital . . . . . . . . . . . . . . . . . . . . . . . . . . . . . . . . . . . . . . . . . . . . . . . . . . 257,629 268,138Retained Earnings . . . . . . . . . . . . . . . . . . . . . . . . . . . . . . . . . . . . . . . . . . . . . . . . . . . . . . . . . 1,864,241 2,077,474Accumulated Other Comprehensive Income (Loss) . . . . . . . . . . . . . . . . . . . . . . . . . . . . . . (6,222) (21,270)Treasury Stock, at Cost: (25,686) (37,168)
March 31, 2016 14,544,808 sharesMarch 31, 2017 21,520,267 shares
ORIX Corporation Shareholders’ Equity . . . . . . . . . . . . . . . . . . . . . . . . . . . . . . . 2,310,431 2,507,698Noncontrolling Interests . . . . . . . . . . . . . . . . . . . . . . . . . . . . . . . . . . . . . . . . . . . . . . . . . . . . 162,388 139,927
Total Equity . . . . . . . . . . . . . . . . . . . . . . . . . . . . . . . . . . . . . . . . . . . . . . . . . 2,472,819 2,647,625
Total Liabilities and Equity . . . . . . . . . . . . . . . . . . . . . . . . . . . . . . . . . . . . . . . . . ¥10,992,918 ¥11,231,895
Notes 1: The Company’s shares held through the Board Incentive Plan Trust (1,696,217 shares as of March 31, 2016 and2,126,076 shares as of March 31, 2017) are included in the number of treasury stock shares as of March 31, 2016and 2017.
2: Prior-year amounts have been adjusted for the retrospective application of Accounting Standards Update 2015-03(“Simplifying the Presentation of Debt Issuance Costs”—ASC 835-30 (“Interest—Imputation of Interest”)) onApril 1, 2016.
3: The liabilities of consolidated VIEs for which creditors (or beneficial interest holders) do not have recourse to thegeneral credit of the Company and its subsidiaries are below:
Millions of yen
2016 2017
Trade Notes, Accounts and Other Payable . . . . . . . . . . . . . . . . . . . . . . . . . . . . . . . . . . . . . . . . . . ¥ 1,576 ¥ 2,998Long-Term Debt . . . . . . . . . . . . . . . . . . . . . . . . . . . . . . . . . . . . . . . . . . . . . . . . . . . . . . . . . . . . . . 479,152 438,473Other . . . . . . . . . . . . . . . . . . . . . . . . . . . . . . . . . . . . . . . . . . . . . . . . . . . . . . . . . . . . . . . . . . . . . . . 11,778 10,391
¥492,506 ¥451,862
The accompanying notes to consolidated financial statements are an integral part of these statements.
F-5

CONSOLIDATED STATEMENTS OF INCOMEFOR THE YEARS ENDED MARCH 31, 2015, 2016 AND 2017
ORIX Corporation and Subsidiaries
Millions of yen
2015 2016 2017
Revenues:Finance revenues . . . . . . . . . . . . . . . . . . . . . . . . . . . . . . . . . . . . . . . . ¥ 186,883 ¥ 200,889 ¥ 200,584Gains on investment securities and dividends . . . . . . . . . . . . . . . . . 56,395 35,786 30,328Operating leases . . . . . . . . . . . . . . . . . . . . . . . . . . . . . . . . . . . . . . . . 363,095 373,910 398,655Life insurance premiums and related investment income . . . . . . . . . 351,493 189,421 295,940Sales of goods and real estate . . . . . . . . . . . . . . . . . . . . . . . . . . . . . . 450,869 834,010 1,015,249Services income . . . . . . . . . . . . . . . . . . . . . . . . . . . . . . . . . . . . . . . . . 765,548 735,186 737,903
Total revenues . . . . . . . . . . . . . . . . . . . . . . . . . . . . . . . . . . . . . . 2,174,283 2,369,202 2,678,659
Expenses:Interest expense . . . . . . . . . . . . . . . . . . . . . . . . . . . . . . . . . . . . . . . . . 72,647 72,821 72,910Costs of operating leases . . . . . . . . . . . . . . . . . . . . . . . . . . . . . . . . . . 238,157 245,069 243,537Life insurance costs . . . . . . . . . . . . . . . . . . . . . . . . . . . . . . . . . . . . . . 271,948 121,282 200,158Costs of goods and real estate sold . . . . . . . . . . . . . . . . . . . . . . . . . . 402,021 748,259 928,794Services expense . . . . . . . . . . . . . . . . . . . . . . . . . . . . . . . . . . . . . . . . 425,676 445,387 451,277Other (income) and expense, net . . . . . . . . . . . . . . . . . . . . . . . . . . . . 23,674 (3,729) (4,396)Selling, general and administrative expenses . . . . . . . . . . . . . . . . . . 427,816 422,692 418,746Provision for doubtful receivables and probable loan losses . . . . . . 11,631 11,717 22,667Write-downs of long-lived assets . . . . . . . . . . . . . . . . . . . . . . . . . . . 34,887 13,448 9,134Write-downs of securities . . . . . . . . . . . . . . . . . . . . . . . . . . . . . . . . . 8,997 4,515 6,608
Total expenses . . . . . . . . . . . . . . . . . . . . . . . . . . . . . . . . . . . . . . 1,917,454 2,081,461 2,349,435
Operating Income . . . . . . . . . . . . . . . . . . . . . . . . . . . . . . . . . . . . . . . . . . . 256,829 287,741 329,224Equity in Net Income of Affiliates . . . . . . . . . . . . . . . . . . . . . . . . . . . . . . 30,531 45,694 26,520Gains on Sales of Subsidiaries and Affiliates and Liquidation Losses,
net . . . . . . . . . . . . . . . . . . . . . . . . . . . . . . . . . . . . . . . . . . . . . . . . . . . . . 20,575 57,867 63,419Bargain Purchase Gain . . . . . . . . . . . . . . . . . . . . . . . . . . . . . . . . . . . . . . . 36,082 0 5,802
Income before Income Taxes and Discontinued Operations . . . . . . . . . . 344,017 391,302 424,965Provision for Income Taxes . . . . . . . . . . . . . . . . . . . . . . . . . . . . . . . . . . . 89,057 120,312 144,039
Income from Continuing Operations . . . . . . . . . . . . . . . . . . . . . . . . . . . . 254,960 270,990 280,926
Discontinued Operations:Income from discontinued operations, net . . . . . . . . . . . . . . . . . . . . 463 0 0Provision for income taxes . . . . . . . . . . . . . . . . . . . . . . . . . . . . . . . . (166) (0) (0)
Discontinued operations, net of applicable tax effect . . . . . . . . . . . . 297 0 0
Net Income . . . . . . . . . . . . . . . . . . . . . . . . . . . . . . . . . . . . . . . . . . . . . . . . 255,257 270,990 280,926
Net Income Attributable to the Noncontrolling Interests . . . . . . . . . . . . . 15,339 10,002 7,255
Net Income Attributable to the Redeemable Noncontrolling Interests . . . 4,970 819 432
Net Income Attributable to ORIX Corporation Shareholders . . . . . . . . . . ¥ 234,948 ¥ 260,169 ¥ 273,239
Note 1: Pursuant to FASB ASC 205-20 (“Presentation of Financial Statements—Discontinued Operations”), theresults of operations which meet the criteria for discontinued operations are reported as a separatecomponent of income, and those related amounts that had been previously reported are reclassified.
F-6

CONSOLIDATED STATEMENTS OF INCOME—(Continued)FOR THE YEARS ENDED MARCH 31, 2015, 2016 AND 2017
ORIX Corporation and Subsidiaries
2: Pursuant to Accounting Standards Update 2014-08 (“Reporting Discontinued Operations andDisclosures of Disposals of Components of an Entity”—ASC 205 (“Presentation of FinancialStatements”) and ASC 360 (“Property, Plant, and Equipment”)) which was early adopted on April 1,2014, the results of operations for fiscal 2015 reflected the adoption of this Update. This Update does notapply to a component or a group of components which was disposed of or classified as held for salebefore the adoption date. Therefore, in accordance with previous ASC 205-20, the results of theseoperation of subsidiaries and businesses, which were classified as held for sale in fiscal 2014 arereported as discontinued operations for fiscal 2015.
Millions of yen
2015 2016 2017
Income Attributable to ORIX Corporation Shareholders:Income from Continuing Operations . . . . . . . . . . . . . . . . . . . . . . . . . ¥234,651 ¥260,169 ¥273,239Discontinued Operations . . . . . . . . . . . . . . . . . . . . . . . . . . . . . . . . . . 297 0 0
Net income Attributable to ORIX Corporation Shareholders . . . . . . ¥234,948 ¥260,169 ¥273,239
Yen
2015 2016 2017
Amounts per Share of Common Stock for Income attributable to ORIXCorporation shareholders:
Basic:Income from continuing operations . . . . . . . . . . . . . . . . . . . . . . . . . . ¥179.24 ¥198.73 ¥208.88Discontinued operations . . . . . . . . . . . . . . . . . . . . . . . . . . . . . . . . . . . 0.23 0.00 0.00
Net income attributable to ORIX Corporation shareholders . . . . . . . ¥179.47 ¥198.73 ¥208.88Diluted:
Income from continuing operations . . . . . . . . . . . . . . . . . . . . . . . . . . ¥178.99 ¥198.52 ¥208.68Discontinued operations . . . . . . . . . . . . . . . . . . . . . . . . . . . . . . . . . . . 0.22 0.00 0.00
Net income attributable to ORIX Corporation shareholders . . . . . . . ¥179.21 ¥198.52 ¥208.68Cash Dividends . . . . . . . . . . . . . . . . . . . . . . . . . . . . . . . . . . . . . . . . . . . . . . . . . 23.00 58.00 46.75
The accompanying notes to consolidated financial statements are an integral part of these statements.
F-7

CONSOLIDATED STATEMENTS OF COMPREHENSIVE INCOMEFOR THE YEARS ENDED MARCH 31, 2015, 2016 AND 2017
ORIX Corporation and Subsidiaries
Millions of yen
2015 2016 2017
Net Income . . . . . . . . . . . . . . . . . . . . . . . . . . . . . . . . . . . . . . . . . . . . . . . . . . . . . ¥255,257 ¥270,990 ¥280,926
Other comprehensive income (loss), net of tax:Net change of unrealized gains (losses) on investment in
securities . . . . . . . . . . . . . . . . . . . . . . . . . . . . . . . . . . . . . . . . . . . . . 9,867 (3,121) (14,926)Net change of defined benefit pension plans . . . . . . . . . . . . . . . . . . . (14,952) (4,123) 7,670Net change of foreign currency translation adjustments . . . . . . . . . . 37,155 (26,957) (5,968)Net change of unrealized gains (losses) on derivative
instruments . . . . . . . . . . . . . . . . . . . . . . . . . . . . . . . . . . . . . . . . . . . (561) (4,063) 326
Total other comprehensive income (loss) . . . . . . . . . . . . . . . . . . . . . . . . . 31,509 (38,264) (12,898)
Comprehensive Income . . . . . . . . . . . . . . . . . . . . . . . . . . . . . . . . . . . . . . . . . . . 286,766 232,726 268,028
Comprehensive Income Attributable to the Noncontrolling Interests . . . . . . . . 7,314 7,414 4,276
Comprehensive Income Attributable to the Redeemable NoncontrollingInterests . . . . . . . . . . . . . . . . . . . . . . . . . . . . . . . . . . . . . . . . . . . . . . . . . . . . . 14,265 1,738 374
Comprehensive Income Attributable to ORIX Corporation Shareholders . . . . ¥265,187 ¥223,574 ¥263,378
The accompanying notes to consolidated financial statements are an integral part of these statements.
F-8

CONSOLIDATED STATEMENTS OF CHANGES IN EQUITYFOR THE YEARS ENDED MARCH 31, 2015, 2016 AND 2017
ORIX Corporation and Subsidiaries
Millions of yen
ORIX Corporation Shareholders’ Equity
Total ORIXCorporation
Shareholders’Equity
NoncontrollingInterests
TotalEquity
CommonStock
AdditionalPaid-inCapital
RetainedEarnings
AccumulatedOther
ComprehensiveIncome (Loss)
TreasuryStock
Balance at March 31, 2014 . . . . . . . . . . . . ¥219,546 ¥255,449 ¥1,468,172 ¥ 38 ¥(23,859) ¥1,919,346 ¥177,019 ¥2,096,365
Contribution to subsidiaries . . . . . . . . . . . . 0 26,447 26,447Transaction with noncontrolling
interests . . . . . . . . . . . . . . . . . . . . . . . . . . (505) 96 (409) (40,735) (41,144)Comprehensive income, net of tax:
Net income . . . . . . . . . . . . . . . . . . . . . . . 234,948 234,948 15,339 250,287Other comprehensive income (loss)
Net change of unrealized gains(losses) on investment insecurities . . . . . . . . . . . . . . . 11,679 11,679 (1,812) 9,867
Net change of defined benefitpension plans . . . . . . . . . . . . (13,218) (13,218) (1,734) (14,952)
Net change of foreign currencytranslation adjustments . . . . 32,284 32,284 (4,424) 27,860
Net change of unrealizedlosses on derivativeinstruments . . . . . . . . . . . . . (506) (506) (55) (561)
Total other comprehensiveincome(loss) . . . . . . . . . . . . . . . . 30,239 (8,025) 22,214
Total comprehensive income . . . . . . . . . . . 265,187 7,314 272,501
Cash dividends . . . . . . . . . . . . . . . . . . . . . . (30,117) (30,117) (4,172) (34,289)Exercise of stock options . . . . . . . . . . . . . . 510 504 1,014 0 1,014Acquisition of treasury stock . . . . . . . . . . . (3,423) (3,423) 0 (3,423)Disposal of treasury stock . . . . . . . . . . . . . . (697) (174) 871 0 0 0Adjustment of redeemable noncontrolling
interests to redemption value . . . . . . . . . (220) (220) 0 (220)Other, net . . . . . . . . . . . . . . . . . . . . . . . . . . . 844 (24) 820 0 820
Balance at March 31, 2015 . . . . . . . . . . . . ¥220,056 ¥255,595 ¥1,672,585 ¥ 30,373 ¥(26,411) ¥2,152,198 ¥165,873 ¥2,318,071
Contribution to subsidiaries . . . . . . . . . . . . 0 6,801 6,801Transaction with noncontrolling
interests . . . . . . . . . . . . . . . . . . . . . . . . . . 1,918 1,918 (10,519) (8,601)Comprehensive income, net of tax:
Net income . . . . . . . . . . . . . . . . . . . . . . . 260,169 260,169 10,002 270,171Other comprehensive income (loss)
Net change of unrealized gains(losses) on investment insecurities . . . . . . . . . . . . . . . (3,145) (3,145) 24 (3,121)
Net change of defined benefitpension plans . . . . . . . . . . . . (4,436) (4,436) 313 (4,123)
Net change of foreign currencytranslation adjustments . . . . (25,197) (25,197) (2,679) (27,876)
Net change of unrealizedlosses on derivativeinstruments . . . . . . . . . . . . . (3,817) (3,817) (246) (4,063)
Total other comprehensive income(loss) . . . . . . . . . . . . . . . . . . . . . . (36,595) (2,588) (39,183)
Total comprehensive income . . . . . . . . . . . 223,574 7,414 230,988
Cash dividends . . . . . . . . . . . . . . . . . . . . . . (76,034) (76,034) (7,181) (83,215)Exercise of stock options . . . . . . . . . . . . . . 413 409 822 0 822Acquisition of treasury stock . . . . . . . . . . . (2) (2) 0 (2)Disposal of treasury stock . . . . . . . . . . . . . . (426) (53) 727 248 0 248Adjustment of redeemable noncontrolling
interests to redemption value . . . . . . . . . 7,557 7,557 0 7,557Other, net . . . . . . . . . . . . . . . . . . . . . . . . . . . 133 17 150 0 150
Balance at March 31, 2016 . . . . . . . . . . . . ¥220,469 ¥257,629 ¥1,864,241 ¥ (6,222) ¥(25,686) ¥2,310,431 ¥162,388 ¥2,472,819
F-9

CONSOLIDATED STATEMENTS OF CHANGES IN EQUITY—(Continued)FOR THE YEARS ENDED MARCH 31, 2015, 2016 AND 2017
ORIX Corporation and Subsidiaries
Millions of yen
ORIX Corporation Shareholders’ Equity
Total ORIXCorporation
Shareholders’Equity
NoncontrollingInterests
TotalEquity
CommonStock
AdditionalPaid-inCapital
RetainedEarnings
AccumulatedOther
ComprehensiveIncome (Loss)
TreasuryStock
Balance at March 31, 2016 . . . . . . . . . . . . ¥220,469 ¥257,629 ¥1,864,241 ¥ (6,222) ¥(25,686) ¥2,310,431 ¥162,388 ¥2,472,819
Contribution to subsidiaries . . . . . . . . . . . . . 0 20,811 20,811Transaction with noncontrolling
interests . . . . . . . . . . . . . . . . . . . . . . . . . . 10,516 (5,187) 5,329 (42,421) (37,092)Comprehensive income, net of tax:
Net income . . . . . . . . . . . . . . . . . . . . . . . . 273,239 273,239 7,255 280,494Other comprehensive income (loss)
Net change of unrealized losseson investment insecurities . . . . . . . . . . . . . . . (14,918) (14,918) (8) (14,926)
Net change of defined benefitpension plans . . . . . . . . . . . . 7,508 7,508 162 7,670
Net change of foreign currencytranslation adjustments . . . . (2,725) (2,725) (3,185) (5,910)
Net change of unrealized gainson derivative instruments . . . 274 274 52 326
Total other comprehensive income(loss) . . . . . . . . . . . . . . . . . . . . . . . (9,861) (2,979) (12,840)
Total comprehensive income . . . . . . . . . . . . 263,378 4,276 267,654
Cash dividends . . . . . . . . . . . . . . . . . . . . . . . (61,299) (61,299) (5,127) (66,426)Exercise of stock options . . . . . . . . . . . . . . . 55 26 81 0 81Acquisition of treasury stock . . . . . . . . . . . . (12,128) (12,128) 0 (12,128)Disposal of treasury stock . . . . . . . . . . . . . . (409) 646 237 0 237Adjustment of redeemable noncontrolling
interests to redemption value . . . . . . . . . . 1,293 1,293 0 1,293Other, net . . . . . . . . . . . . . . . . . . . . . . . . . . . 376 376 0 376
Balance at March 31, 2017 . . . . . . . . . . . . ¥220,524 ¥268,138 ¥2,077,474 ¥(21,270) ¥(37,168) ¥2,507,698 ¥139,927 ¥2,647,625
Note: Changes in the redeemable noncontrolling interests are not included in this table. For further information, see Note 18 “RedeemableNoncontrolling Interests.”
The accompanying notes to consolidated financial statements are an integral part of these statements.
F-10

CONSOLIDATED STATEMENTS OF CASH FLOWSFOR THE YEARS ENDED MARCH 31, 2015, 2016 AND 2017
ORIX Corporation and Subsidiaries
Millions of yen
2015 2016 2017
Cash Flows from Operating Activities:Net income . . . . . . . . . . . . . . . . . . . . . . . . . . . . . . . . . . . . . . . . . . . . . . . . . . . . . . . . . . . . . . . . . ¥ 255,257 ¥ 270,990 ¥ 280,926Adjustments to reconcile net income to net cash provided by operating activities:
Depreciation and amortization . . . . . . . . . . . . . . . . . . . . . . . . . . . . . . . . . . . . . . . . . . . . . . 229,583 244,853 253,677Provision for doubtful receivables and probable loan losses . . . . . . . . . . . . . . . . . . . . . . . 11,631 11,717 22,667Equity in net income of affiliates (excluding interest on loans) . . . . . . . . . . . . . . . . . . . . . (30,267) (44,333) (24,549)Gains on sales of subsidiaries and affiliates and liquidation losses, net . . . . . . . . . . . . . . (20,575) (57,867) (63,419)Bargain purchase gain . . . . . . . . . . . . . . . . . . . . . . . . . . . . . . . . . . . . . . . . . . . . . . . . . . . . (36,082) 0 (5,802)Gains on sales of available-for-sale securities . . . . . . . . . . . . . . . . . . . . . . . . . . . . . . . . . . (32,077) (32,126) (30,701)Gains on sales of operating lease assets . . . . . . . . . . . . . . . . . . . . . . . . . . . . . . . . . . . . . . . (34,425) (38,340) (69,265)Write-downs of long-lived assets . . . . . . . . . . . . . . . . . . . . . . . . . . . . . . . . . . . . . . . . . . . . 34,887 13,448 9,134Write-downs of securities . . . . . . . . . . . . . . . . . . . . . . . . . . . . . . . . . . . . . . . . . . . . . . . . . . 8,997 4,515 6,608Decrease (Increase) in restricted cash . . . . . . . . . . . . . . . . . . . . . . . . . . . . . . . . . . . . . . . . (1,922) 9,009 155Decrease in trading securities . . . . . . . . . . . . . . . . . . . . . . . . . . . . . . . . . . . . . . . . . . . . . . . 441,554 461,298 159,809Decrease (Increase) in inventories . . . . . . . . . . . . . . . . . . . . . . . . . . . . . . . . . . . . . . . . . . . (13,481) 20,935 (5,318)Decrease (Increase) in trade notes, accounts and other receivable . . . . . . . . . . . . . . . . . . (20,742) (8,224) 8,362Increase (Decrease) in trade notes, accounts and other payable . . . . . . . . . . . . . . . . . . . . 34,275 (41,004) (6,660)Decrease in policy liabilities and policy account balances . . . . . . . . . . . . . . . . . . . . . . . . (506,043) (405,014) (103,878)Deferred tax provision . . . . . . . . . . . . . . . . . . . . . . . . . . . . . . . . . . . . . . . . . . . . . . . . . . . . 41,338 42,528 25,318Income taxes payable, net . . . . . . . . . . . . . . . . . . . . . . . . . . . . . . . . . . . . . . . . . . . . . . . . . . (39,264) 47,065 67,904Other, net . . . . . . . . . . . . . . . . . . . . . . . . . . . . . . . . . . . . . . . . . . . . . . . . . . . . . . . . . . . . . . (65,033) 11,112 58,987
Net cash provided by operating activities . . . . . . . . . . . . . . . . . . . . . . . . . . . . . . . . . 257,611 510,562 583,955
Cash Flows from Investing Activities:Purchases of lease equipment . . . . . . . . . . . . . . . . . . . . . . . . . . . . . . . . . . . . . . . . . . . . . . . . . . . (907,484) (991,154) (894,300)Principal payments received under direct financing leases . . . . . . . . . . . . . . . . . . . . . . . . . . . . 488,522 515,053 483,627Installment loans made to customers . . . . . . . . . . . . . . . . . . . . . . . . . . . . . . . . . . . . . . . . . . . . . (1,109,458) (1,101,807) (1,309,056)Principal collected on installment loans . . . . . . . . . . . . . . . . . . . . . . . . . . . . . . . . . . . . . . . . . . . 977,272 948,057 1,063,339Proceeds from sales of operating lease assets . . . . . . . . . . . . . . . . . . . . . . . . . . . . . . . . . . . . . . 272,040 239,911 321,328Investment in affiliates, net . . . . . . . . . . . . . . . . . . . . . . . . . . . . . . . . . . . . . . . . . . . . . . . . . . . . (27,698) (70,569) (51,529)Proceeds from sales of investment in affiliates . . . . . . . . . . . . . . . . . . . . . . . . . . . . . . . . . . . . . 2,128 20,991 97,453Purchases of available-for-sale securities . . . . . . . . . . . . . . . . . . . . . . . . . . . . . . . . . . . . . . . . . . (982,415) (864,874) (466,314)Proceeds from sales of available-for-sale securities . . . . . . . . . . . . . . . . . . . . . . . . . . . . . . . . . . 511,868 464,232 549,865Proceeds from redemption of available-for-sale securities . . . . . . . . . . . . . . . . . . . . . . . . . . . . 398,280 381,099 105,255Purchases of held-to-maturity securities . . . . . . . . . . . . . . . . . . . . . . . . . . . . . . . . . . . . . . . . . . (20,522) (538) (306)Purchases of other securities . . . . . . . . . . . . . . . . . . . . . . . . . . . . . . . . . . . . . . . . . . . . . . . . . . . (27,489) (32,818) (22,737)Proceeds from sales of other securities . . . . . . . . . . . . . . . . . . . . . . . . . . . . . . . . . . . . . . . . . . . 67,982 48,594 31,829Purchases of property under facility operations . . . . . . . . . . . . . . . . . . . . . . . . . . . . . . . . . . . . . (81,311) (91,492) (95,601)Acquisitions of subsidiaries, net of cash acquired . . . . . . . . . . . . . . . . . . . . . . . . . . . . . . . . . . . (73,240) (47,324) (79,405)Sales of subsidiaries, net of cash disposed . . . . . . . . . . . . . . . . . . . . . . . . . . . . . . . . . . . . . . . . . 47,800 39,437 55,530Other, net . . . . . . . . . . . . . . . . . . . . . . . . . . . . . . . . . . . . . . . . . . . . . . . . . . . . . . . . . . . . . . . . . . (4,076) (9,327) (26,586)
Net cash used in investing activities . . . . . . . . . . . . . . . . . . . . . . . . . . . . . . . . . . . . . . (467,801) (552,529) (237,608)
Cash Flows from Financing Activities:Net increase (decrease) in debt with maturities of three months or less . . . . . . . . . . . . . . . . . . 3,819 (4,707) 793Proceeds from debt with maturities longer than three months . . . . . . . . . . . . . . . . . . . . . . . . . . 1,337,870 1,376,125 1,319,523Repayment of debt with maturities longer than three months . . . . . . . . . . . . . . . . . . . . . . . . . . (1,178,401) (1,470,325) (1,456,366)Net increase in deposits due to customers . . . . . . . . . . . . . . . . . . . . . . . . . . . . . . . . . . . . . . . . . 80,924 111,220 216,118Cash dividends paid to ORIX Corporation shareholders . . . . . . . . . . . . . . . . . . . . . . . . . . . . . . (30,117) (76,034) (61,299)Contribution from noncontrolling interests . . . . . . . . . . . . . . . . . . . . . . . . . . . . . . . . . . . . . . . . 7,919 6,117 5,599Purchases of shares of subsidiaries from noncontrolling interests . . . . . . . . . . . . . . . . . . . . . . . (206) (4,764) (25,840)Cash dividends paid to redeemable noncontrolling interests . . . . . . . . . . . . . . . . . . . . . . . . . . . (3,030) (11,272) 0Net increase (decrease) in call money . . . . . . . . . . . . . . . . . . . . . . . . . . . . . . . . . . . . . . . . . . . . 6,000 36,500 (14,500)Other, net . . . . . . . . . . . . . . . . . . . . . . . . . . . . . . . . . . . . . . . . . . . . . . . . . . . . . . . . . . . . . . . . . . (11,346) (10,861) (17,487)
Net cash provided by (used in) financing activities . . . . . . . . . . . . . . . . . . . . . . . . . . 213,432 (48,001) (33,459)
Effect of Exchange Rate Changes on Cash and Cash Equivalents . . . . . . . . . . . . . . . . . . . . . . . . . . 6,237 (7,130) (3,438)
Net increase (decrease) in Cash and Cash Equivalents . . . . . . . . . . . . . . . . . . . . . . . . . . . . . . . . . . . 9,479 (97,098) 309,450
Cash and Cash Equivalents at Beginning of Year . . . . . . . . . . . . . . . . . . . . . . . . . . . . . . . . . . . . . . . 818,039 827,518 730,420
Cash and Cash Equivalents at End of Year . . . . . . . . . . . . . . . . . . . . . . . . . . . . . . . . . . . . . . . . . . . . ¥ 827,518 ¥ 730,420 ¥ 1,039,870
The accompanying notes to consolidated financial statements are an integral part of these statements.
F-11

NOTES TO CONSOLIDATED FINANCIAL STATEMENTS
ORIX Corporation and Subsidiaries
1. Significant Accounting and Reporting Policies
In preparing the accompanying consolidated financial statements, ORIX Corporation (the “Company”) andits subsidiaries have complied with accounting principles generally accepted in the United States of America(“U.S. GAAP”), except for the accounting for stock splits. Significant accounting and reporting policies aresummarized as follows:
(a) Basis of presenting financial statements
The Company and its subsidiaries in Japan maintain their books in conformity with Japanese accountingpractices, which differ in certain respects from U.S. GAAP.
The accompanying consolidated financial statements have been prepared in conformity with U.S. GAAPand, therefore, reflect certain adjustments to the books and records of the Company and its subsidiaries. Theprincipal adjustments relate to initial direct costs to originate leases and loans, use of a straight-line basis ofdepreciation for operating lease assets, deferral of life insurance policy acquisition costs, calculation of insurancepolicy liabilities, accounting for goodwill and other intangible assets in business combinations, accounting forcontingent consideration in business combinations, accounting for pension plans, accounting for sales of theparent’s ownership interest in subsidiaries, accounting for securitization of financial assets, reflection of theincome tax effect on such adjustments and reclassification of discontinued operations.
(b) Principles of consolidation
The consolidated financial statements include the accounts of the Company and all of its subsidiaries.Investments in affiliates, where the Company has the ability to exercise significant influence by way of 20% –50% ownership or other means, are accounted for by using the equity method. Where the Company holdsmajority voting interests but noncontrolling shareholders have substantive participating rights to decisions thatoccur as part of the ordinary course of their business, the equity method is applied. In addition, the consolidatedfinancial statements also include variable interest entities to which the Company and its subsidiaries are primarybeneficiaries.
A lag period of up to three months is used on a consistent basis for recognizing the results of certainsubsidiaries and affiliates.
All significant intercompany accounts and transactions have been eliminated in consolidation.
(c) Use of estimates
The preparation of consolidated financial statements in conformity with generally accepted accountingprinciples requires management to make estimates and assumptions that affect the reported amounts of assets andliabilities at the date of the financial statements and the reported amounts of revenues and expenses during thereporting period. Actual results could differ from those estimates. The Company has identified ten areas where itbelieves assumptions and estimates are particularly critical to the financial statements. The Company makesestimates and assumptions to the selection of valuation techniques and determination of assumptions used in fairvalue measurements, the determination and periodic reassessment of the unguaranteed residual value for directfinancing leases and operating leases, the determination and reassessment of insurance policy liabilities anddeferred policy acquisition costs, the determination of the allowance for doubtful receivables on direct financingleases and probable loan losses, the recognition and measurement of impairment of long-lived assets, therecognition and measurement of impairment of investment in securities, the determination of the valuation
F-12

NOTES TO CONSOLIDATED FINANCIAL STATEMENTS—(Continued)
ORIX Corporation and Subsidiaries
allowance for deferred tax assets and the evaluation of tax positions, the assessment and measurement ofeffectiveness in hedging relationship using derivative financial instruments, the determination of benefitobligation and net periodic pension cost and the recognition and measurement of impairment of goodwill andintangible assets that have indefinite useful lives.
(d) Foreign currencies translation
The Company and its subsidiaries maintain their accounting records in their functional currency.Transactions in foreign currencies are recorded in the entity’s functional currency based on the prevailingexchange rates on the transaction date.
The financial statements of overseas subsidiaries and affiliates are translated into Japanese yen by applyingthe exchange rates in effect at the end of each fiscal year to all assets and liabilities. Income and expenses aretranslated at the average rates of exchange prevailing during the fiscal year. The currencies in which theoperations of the overseas subsidiaries and affiliates are conducted are regarded as the functional currencies ofthese companies. Foreign currency translation adjustments reflected in accumulated other comprehensive income(loss) arise from the translation of foreign currency financial statements into Japanese yen.
(e) Revenue recognition
Revenues are recognized when persuasive evidence of an arrangement exists, the service has been renderedor the goods have been delivered to the customer, the transaction price is fixed or determinable and collectabilityis reasonably assured.
In addition to the aforementioned general policy, the policies as specifically described hereinafter areapplied for each of the major revenue items.
Finance Revenues—Finance revenues mainly include revenues for direct financing leases and installmentloans. The policies applied to direct financing leases and installment loans are described hereinafter.
(1) Revenues from direct financing leases
Direct financing leases consist of full-payout leases for various equipment types, including officeequipment, industrial machinery and transportation equipment. In providing leasing services, the Company andits subsidiaries execute supplemental services, such as paying insurance and handling taxes on leased assets onbehalf of lessees. The excess of aggregate lease rentals plus the estimated unguaranteed residual value over thecost of the leased equipment constitutes the unearned lease income to be taken into income over the lease term byusing the interest method. The estimated residual values represent estimated proceeds from the disposition ofequipment at the time the lease is terminated. Estimates of unguaranteed residual values are based on marketvalues of used equipment, estimates of when and how much equipment will become obsolete, and actualrecovery being experienced for similar used equipment. Initial direct costs are being deferred and amortized as ayield adjustment over the life of the related lease by using interest method. The unamortized balance of initialdirect costs is reflected as a component of investment in direct financing leases.
(2) Revenues from installment loans
Interest income on installment loans is recognized on an accrual basis. Certain direct loan origination costs,net of origination fees, are being deferred and amortized over the contractual term of the loan as an adjustment ofthe related loan’s yield using the interest method.
F-13

NOTES TO CONSOLIDATED FINANCIAL STATEMENTS—(Continued)
ORIX Corporation and Subsidiaries
Interest payments received on impaired loans other than purchased loans are recorded as interest incomeunless the collection of the remaining investment is doubtful at which time payments received are recorded asreductions of principal. For purchased loans, although the acquired assets may remain loans in legal form,collections on these loans often do not reflect the normal historical experience of collecting delinquent accounts,and the need to tailor individual collateral-realization strategies often makes it difficult to reliably estimate theamount, timing, or nature of collections. Accordingly, the Company and its subsidiaries use the cost recoverymethod of income recognition for such purchased loans regardless of whether impairment is recognized or not.
(3) Non-accrual policy
In common with all classes, past-due financing receivables are receivables for which principal or interest ispast-due 30 days or more. Loans whose terms have been modified are not classified as past-due financingreceivables if the principals and interests are not past-due 30 days or more in accordance with the modifiedterms. The Company and its subsidiaries suspend accruing revenues on past-due installment loans and directfinancing leases when principal or interest is past-due 90 days or more, or earlier, if management determines thattheir collections are doubtful based on factors such as individual debtors’ creditworthiness, historical lossexperience, current delinquencies and delinquency trends. Accrued but uncollected interest is reclassified toinvestment in direct financing leases or installment loans in the accompanying consolidated balance sheets andbecomes subject to the allowance for doubtful receivables and probable loan loss process. Cash repaymentsreceived on non-accrual loans are applied first against past due interest and then any surpluses are applied toprincipal in view of the conditions of the contract and obligors. The Company and its subsidiaries returnnon-accrual loans and lease receivables to accrual status when it becomes probable that the Company and itssubsidiaries will be able to collect all amounts due according to the contractual terms of these loans andreceivables, as evidenced by continual payments from the debtors. The period of such continual payments beforereturning to accrual status varies depending on factors that we consider are relevant in assessing the debtor’screditworthiness, such as the debtor’s business characteristics and financial conditions as well as relevanteconomic conditions and trends.
Gains on investment securities and dividends—Gains on investment securities are recorded on a trade datebasis. Dividends are recorded when right to receive dividends is established.
Operating leases—Revenues from operating leases are recognized on a straight-line basis over the contractterms. Investment in operating leases is recorded at cost less accumulated depreciation and is depreciated overtheir estimated useful lives mainly on a straight-line basis. The estimated average useful lives of principaloperating lease assets classified as transportation equipment is 9 years, measuring and information-relatedequipment is 4 years, real estate (other than land) is 29 years and other is 5 years. Depreciation expenses areincluded in costs of operating leases. Gains or losses arising from dispositions of operating lease assets areincluded in operating lease revenues.
Estimates of residual values are based on market values of used equipment, estimates of when and the extentto which equipment will become obsolete and actual recovery being experienced for similar used equipment.
Sales of goods and real estate—
(1) Sales of goods
The Company and its subsidiaries sell to their customers various types of goods, including precious metalsand jewels, and aftermarket parts and accessories for vehicles. Revenues from such sales of goods are recognizedwhen persuasive evidence of an arrangement exists, delivery has occurred, and collectability is reasonably
F-14

NOTES TO CONSOLIDATED FINANCIAL STATEMENTS—(Continued)
ORIX Corporation and Subsidiaries
assured. Delivery is considered to have occurred when the customer has taken title to the goods and assumed therisks and rewards of ownership. Revenues are recognized net of estimated sales returns and incentives.
(2) Real estate sales
Revenues from the sales of real estate are recognized when a contract is in place, a closing has taken place,the buyer’s initial and continuing investment is adequate to demonstrate a commitment to pay for the propertyand the Company and its subsidiaries do not have a substantial continuing involvement in the property.
Services income—Revenues are recognized when persuasive evidence of an arrangement exists, the servicehas been rendered to the customer, the transaction price is fixed or determinable and collectability is reasonablyassured. The policies applied to asset management, servicing and automobile maintenance services are describedhereinafter.
(1) Revenues from asset management and servicing
The Company and its subsidiaries provide to our customers investment management services forinvestments in financial assets, and asset management as well as maintenance and administrative services forinvestments in real estate properties. The Company and its subsidiaries also perform servicing on behalf of ourcustomers. The Company and its subsidiaries receive fees for those services from our customers.
Revenues from asset management and servicing primarily include management fees, servicing fees, andperformance fees. Management and servicing fees are recognized when transactions occur or services arerendered and the amounts are fixed or determinable and collectability of which is reasonably assured.Management fees are calculated based on the predetermined percentages of the market value of the assets undermanagement or net assets of the investment funds in accordance with contracts. Certain subsidiaries recognizerevenues from performance fees when earned based on the performance of the asset under management whileother subsidiaries recognize revenues from performance fees on an accrual basis over the period in whichservices are performed. Performance fees are calculated based on the predetermined percentages on theperformance of the assets under management in accordance with the contracts.
(2) Revenues from automobile maintenance services
The Company and its subsidiaries provide automobile maintenance services to lessees. Where under termsof the lease or related maintenance agreements the Company and its subsidiaries bear the favorable orunfavorable variability of cost, revenues and expenses are recorded on a gross basis. For those arrangements inwhich the Company and its subsidiaries do not have substantial risks and rewards of ownership, but instead serveas an agent in collecting from lessees and remitting payments to third parties, the Company and its subsidiariesrecord revenues net of third-party services costs. Revenues from automobile maintenance services are recognizedover the contract period in proportion to the estimated service costs to be incurred.
(f) Insurance and reinsurance transactions
Premium income from life insurance policies, net of premiums on reinsurance ceded, is recognized asearned premiums when due.
Life insurance benefits are recorded as expenses when they are incurred. Policy liabilities and policyaccount balances for future policy benefits are measured using the net level premium method, based on actuarialestimates of the amount of future policyholder benefits. The policies are characterized as long-duration policies
F-15

NOTES TO CONSOLIDATED FINANCIAL STATEMENTS—(Continued)
ORIX Corporation and Subsidiaries
and mainly consist of whole life, term life, endowments, medical insurance and individual annuity insurancecontracts. For policies other than individual annuity insurance contracts, computation of policy liabilitiesnecessarily includes assumptions about mortality, morbidity, lapse rates, future yields on related investments andother factors applicable at the time the policies are written. A certain subsidiary continually evaluates thepotential for changes in the estimates and assumptions applied in determining policy liabilities, both positive andnegative and uses the results of these evaluations both to adjust recorded liabilities and to adjust underwritingcriteria and product offerings.
The insurance contracts sold by the subsidiary also includes variable annuity, variable life and fixed annuityinsurance contracts. The subsidiary manages investment assets on behalf of variable annuity and variable lifepolicyholders, which consist of equity securities and are included in investments in securities in the consolidatedbalance sheets. These investment assets are measured at fair value with realized and unrealized gains or lossesrecognized in life insurance premiums and related investment income in the consolidated statements of income.The subsidiary elected the fair value option for the entire variable annuity and variable life insurance contractswith changes in the fair value recognized in life insurance costs.
The subsidiary provides minimum guarantees to variable annuity and variable life policyholders underwhich it is exposed to the risk of compensating losses incurred by the policyholders to the extent contractuallyrequired. To mitigate the risk, a portion of the minimum guarantee risk related to variable annuity and variablelife insurance contracts is ceded to reinsurance companies and the remaining risk is economically hedged byentering into derivative contracts. The reinsurance contracts do not relieve the subsidiary from the obligation asthe primary obligor to compensate certain losses incurred by the policyholders, and the default of the reinsurancecompanies may impose additional losses on the subsidiary. Certain subsidiaries have elected the fair value optionfor certain reinsurance contracts relating to variable annuity and variable life insurance contracts, which isincluded in other assets in the consolidated balance sheets.
Policy liabilities and policy account balances for fixed annuity insurance contracts are measured based onthe single-premiums plus interest based on expected rate and fair value adjustments relating to the acquisition ofa subsidiary, less withdrawals, expenses and other charges. The credited interest is recorded in life insurancecosts in the consolidated statements of income.
Certain costs related directly to the successful acquisition of new or renewal insurance contracts, or deferredpolicy acquisition costs are deferred and amortized over the respective policy periods in proportion to anticipatedpremium revenue. These deferred policy acquisition costs consist primarily of first-year commissions, except forrecurring policy maintenance costs and certain variable costs and expenses for underwriting policies.
(g) Allowance for doubtful receivables on direct financing leases and probable loan losses
The allowance for doubtful receivables on direct financing leases and probable loan losses is maintained at alevel which, in the judgment of management, is appropriate to provide for probable losses inherent in lease andloan portfolios. The allowance is increased by provision charged to income and is decreased by charge-offs, netof recoveries.
Developing the allowance for doubtful receivables on direct financing leases and probable loan losses issubject to numerous estimates and judgments. In evaluating the appropriateness of the allowance, managementconsiders various factors, including the business characteristics and financial conditions of the obligors, currenteconomic conditions and trends, prior charge-off experience, current delinquencies and delinquency trends,future cash flows expected to be received from the direct financing leases and loans and value of underlyingcollateral and guarantees. Impaired loans are individually evaluated for a valuation allowance based on the
F-16

NOTES TO CONSOLIDATED FINANCIAL STATEMENTS—(Continued)
ORIX Corporation and Subsidiaries
present value of expected future cash flows, the loan’s observable market price or the fair value of the collateralsecuring the loans if the loans are collateral-dependent. For non-impaired loans, including loans that are notindividually evaluated for impairment, and direct financing leases, the Company and its subsidiaries evaluateprior charge-off experience segmented by the debtors’ industries and the purpose of the loans, and then developthe allowance for doubtful receivables on direct financing leases and probable loan losses considering the priorcharge-off experience and primarily current economic conditions.
The Company and its subsidiaries charge off doubtful receivables when the likelihood of any futurecollection is believed to be minimal considering debtors’ creditworthiness and the liquidation status of collateral.
(h) Impairment of long-lived assets
The Company and its subsidiaries perform a recoverability test for long-lived assets to be held and used inoperations, including tangible assets and intangible assets being amortized, consisting primarily of officebuildings, condominiums, golf courses and other properties under facility operations, whenever events orchanges in circumstances indicated that the assets might be impaired. The assets are considered not recoverablewhen the undiscounted future cash flows estimated to be generated by those assets are less than the carryingamount of those assets. The carrying amount of assets not recoverable is reduced to fair value if lower than thecarrying amount. The Company and its subsidiaries determine the fair value using appraisals prepared byindependent third party appraisers or our own staff of qualified appraisers based on recent transactions involvingsales of similar assets or other valuation techniques such as discounted cash flows methodologies using futurecash flows estimated to be generated from operation of the existing assets or completion of development projects,as appropriate.
(i) Investment in securities
Trading securities are reported at fair value with unrealized gains and losses included in income.
Available-for-sale securities are reported at fair value, and unrealized gains or losses are recorded inaccumulated other comprehensive income (loss), net of applicable income taxes, except investments which arerecorded at fair value with unrealized gains and losses included in income by electing the fair value option.
Held-to-maturity securities are recorded at amortized cost.
Other securities are recorded at cost or carrying value that reflects equity income and loss based on theCompany’s share, except investments which are recorded at fair value with unrealized gains and losses includedin income by electing the fair value option.
For available-for-sale securities, the Company and its subsidiaries generally recognize losses related toequity securities for which the fair value has been significantly below the acquisition cost (or current carryingvalue if an adjustment has been made in the past) for more than six months. Also, the Company and itssubsidiaries charge against income losses related to equity securities in situations where, even though the fairvalue has not remained significantly below the carrying value for six months, the decline in the fair value of anequity security is based on the issuer’s specific economic conditions and not just general declines in the relatedmarket and where it is considered unlikely that the fair value of the equity security will recover withinsix months.
For debt securities, where the fair value is less than the amortized cost, the Company and its subsidiariesconsider whether those securities are other-than-temporarily impaired using all available information about their
F-17

NOTES TO CONSOLIDATED FINANCIAL STATEMENTS—(Continued)
ORIX Corporation and Subsidiaries
collectability. The Company and its subsidiaries do not consider a debt security to be other-than-temporarilyimpaired if (1) the Company and its subsidiaries do not intend to sell the debt security, (2) it is not more likelythan not that the Company and its subsidiaries will be required to sell the debt security before recovery of itsamortized cost basis and (3) the present value of estimated cash flows will fully cover the amortized cost of thesecurity. On the other hand, the Company and its subsidiaries consider a debt security to be other-than-temporarily impaired if any of the above mentioned three conditions are not met. When the Company and itssubsidiaries deem a debt security to be other-than-temporarily impaired, the Company and its subsidiariesrecognize the entire difference between the amortized cost and the fair value of the debt securities in earnings ifthe Company and its subsidiaries intend to sell the debt security or it is more likely than not that the Companyand its subsidiary will be required to sell the debt security before recovery of its amortized cost basis less anycurrent-period credit loss. However, if the Company and its subsidiaries do not intend to sell the debt securityand it is not more likely than not that the Company and its subsidiaries will be required to sell the debt securitybefore recovery of its amortized cost basis less any current-period credit loss, the Company and its subsidiariesseparate the difference between the amortized cost and the fair value of the debt securities into the credit losscomponent and the non-credit loss component. The credit loss component is recognized in earnings, and thenon-credit loss component is recognized in other comprehensive income (loss), net of applicable income taxes.
For other securities, when the Company and its subsidiaries determine the decline in value is other thantemporary, the Company and its subsidiaries reduce the carrying value of the security to the fair value and chargeagainst income losses related to these other securities.
(j) Income taxes
Income taxes are accounted for under the asset and liability method. Deferred tax assets and liabilities arerecognized for the future tax consequences attributable to differences between the financial statement carryingamounts of existing assets and liabilities and their respective tax bases and operating loss and tax creditcarryforwards. Deferred tax assets and liabilities are measured using enacted tax rates expected to apply totaxable income in the year in which those temporary differences are expected to be recovered or settled. Theeffect on deferred tax assets and liabilities of a change in tax rate is recognized in income in the period thatincludes the enactment date. A valuation allowance is recognized if, based on the weight of available evidence, itis “more likely than not” that some portion or all of the deferred tax asset will not be realized.
The Company and its subsidiaries file tax returns in Japan and certain foreign tax jurisdictions and recognizethe financial statement effects of a tax position taken or expected to be taken in a tax return when it is more likelythan not, based on the technical merits, that the position will be sustained upon tax examination, includingresolution of any related appeals or litigation processes, and measure tax positions that meet the recognitionthreshold at the largest amount of tax benefit that is greater than 50 percent likely to be realized upon settlementwith the taxing authority. The Company and its subsidiaries present an unrecognized tax benefit as either areduction of a deferred tax asset, a reduction of an amount refundable or a liability, based on the intended methodof settlement. The Company and its subsidiaries classify penalties and interest expense related to income taxes aspart of provision for income taxes in the consolidated statements of income.
The Company and certain subsidiaries have elected to file a consolidated tax return for National Corporationtax purposes.
(k) Securitized assets
The Company and its subsidiaries have securitized and sold to investors various financial assets such aslease receivables and loan receivables. In the securitization process, the assets to be securitized are sold to trustsor SPEs that issue asset-backed beneficial interests and securities to the investors.
F-18

NOTES TO CONSOLIDATED FINANCIAL STATEMENTS—(Continued)
ORIX Corporation and Subsidiaries
Trusts or SPEs used in securitization transactions are consolidated if the Company and its subsidiaries arethe primary beneficiary of the trusts or SPEs, and the transfers of the financial assets to those consolidated trustsand SPEs are not accounted for as sales. Assets held by consolidated trusts or consolidated SPEs continue to beaccounted for as lease receivables or loan receivables, as they were before the transfer, and asset-backedbeneficial interests and securities issued to the investors are accounted for as debt. When the Company and itssubsidiaries have transferred financial assets to a transferee that is not subject to consolidation, the Company andits subsidiaries account for the transfer as a sale if control over the transferred assets is surrendered.
A certain subsidiary originates and sells loans into the secondary market, while retaining the obligation toservice those loans. In addition, it undertakes obligations to service loans originated by others. The subsidiaryrecognizes servicing assets if it expects the benefit of servicing to more than adequately compensate it forperforming the servicing or recognizes servicing liabilities if it expects the benefit of servicing to less thanadequately compensate it. These servicing assets and liabilities are initially recognized at fair value andsubsequently accounted for using the amortization method whereby the assets and liabilities are amortized inproportion to and over the period of estimated net servicing income or net servicing loss. On a quarterly basis,servicing assets and liabilities are evaluated for impairment or increased obligations. The fair value of servicingassets and liabilities is estimated using an internal valuation model, or by obtaining an opinion of value from anindependent third-party vendor. Both methods are based on calculating the present value of estimated future netservicing cash flows, taking into consideration discount rates, prepayments and servicing costs. The internalvaluation model is validated at least semiannually through third-party valuations.
(l) Derivative financial instruments
The Company and its subsidiaries recognize all derivatives on the consolidated balance sheets at fair value.The accounting treatment of subsequent changes in the fair value depends on their use, and whether they qualifyas effective “hedges” for accounting purposes. Derivatives for the purpose of economic hedge that are notqualified for hedge accounting are adjusted to fair value through the consolidated statements of income. If aderivative is a hedge, then depending on its nature, changes in its fair value will be either offset against changesin the fair value of hedged assets or liabilities through the consolidated statements of income, or recorded in othercomprehensive income (loss).
If a derivative is held as a hedge of the variability of fair value related to a recognized asset or liability or anunrecognized firm commitment (“fair value” hedge), changes in the fair value of the derivative are recorded inearnings along with the changes in the fair value of the hedged item.
If a derivative is held as a hedge of the variability of cash flows related to a forecasted transaction or arecognized asset or liability (“cash flow” hedge), changes in the fair value of the derivative are recorded in othercomprehensive income (loss) to the extent that the derivative is effective as a hedge, until earnings are affectedby the variability in cash flows of the designated hedged item.
If a derivative is held as a hedge of a foreign-currency fair-value or cash-flow hedge (“foreign currency”hedge), changes in the fair value of the derivative are recorded in either earnings or other comprehensive income(loss), depending on whether the hedged transaction is a fair-value hedge or a cash-flow hedge. However, if aderivative is used as a hedge of a net investment in a foreign operation, changes in its fair value, to the extenteffective as a hedge, are recorded in the foreign currency translation adjustments account within othercomprehensive income (loss).
The ineffective portion of changes in fair value of derivatives that qualify as a hedge are recorded inearnings.
F-19

NOTES TO CONSOLIDATED FINANCIAL STATEMENTS—(Continued)
ORIX Corporation and Subsidiaries
For all hedging relationships that are designated and qualified as hedging, at inception the Company and itssubsidiaries formally document the details of the hedging relationship and the hedged activity. The Company andits subsidiaries also formally assess, both at the hedge’s inception and on an ongoing basis, the effectiveness ofthe hedge relationship. The Company and its subsidiaries cease hedge accounting prospectively when thederivative no longer qualified for hedge accounting.
(m) Pension plans
The Company and certain subsidiaries have contributory and non-contributory pension plans coveringsubstantially all of their employees. The costs of pension plans are accrued based on amounts determined usingactuarial methods, with assumptions of discount rate, rate of increase in compensation level, expected long-termrate of return on plan assets and others.
The Company and its subsidiaries also recognize the funded status of pension plans, measured as thedifference between the fair value of plan assets and the benefit obligation, on the consolidated balance sheets.Changes in that funded status are recognized in the year in which the changes occur through other comprehensiveincome (loss), net of applicable income taxes.
(n) Stock-based compensation
The Company and its subsidiaries measure stock-based compensation expense as consideration for servicesprovided by employees based on the fair value of the grant date. The costs are recognized over the requisiteservice period.
(o) Stock splits
Stock splits implemented prior to October 1, 2001 had been accounted for by transferring an amountequivalent to the par value of the shares from additional paid-in capital to common stock as required by theJapanese Commercial Code (the “Code”) before amendment. However, no such reclassification was made forstock splits when common stock already included a portion of the proceeds from shares issued at a price inexcess of par value. This method of accounting was in conformity with accounting principles generally acceptedin Japan.
As a result of a revision to the Code before amendment effective on October 1, 2001 and the Companies Actimplemented on May 1, 2006, the above-mentioned method of accounting required by the Code becameunnecessary.
In the United States, stock splits in comparable circumstances are considered to be stock dividends and areaccounted for by transferring from retained earnings to common stock and additional paid-in capital amountsequal to the fair market value of the shares issued. Common stock is increased by the par value of the shares andadditional paid-in capital is increased by the excess of the market value over par value of the shares issued. Hadsuch stock splits made prior to October 1, 2001 been accounted for in this manner, additional paid-in capital as ofMarch 31, 2017 would have increased by approximately ¥24,674 million, with a corresponding decrease inretained earnings. Total ORIX Corporation shareholders’ equity would remain unchanged. Stock splits onMay 19, 2000 were excluded from the above amounts because the stock splits were not considered to be stockdividends under U.S. GAAP.
(p) Cash and cash equivalents
Cash and cash equivalents include cash on hand, deposits placed with banks and short-term highly liquidinvestments with original maturities of three months or less.
F-20

NOTES TO CONSOLIDATED FINANCIAL STATEMENTS—(Continued)
ORIX Corporation and Subsidiaries
(q) Restricted cash
Restricted cash consists of trust accounts under securitization programs and real estate, deposits related toservicing agreements, deposits collected on the underlying assets and applied to non-recourse loans and others.
(r) Property under facility operations
Property under facility operations consist primarily of operating facilities (including golf courses, hotels andtraining facilities and senior housings) and environmental assets (including mega solar), which are stated at costless accumulated depreciation, and depreciation is calculated mainly on a straight-line basis over the estimateduseful lives of the assets. Depreciation expenses in fiscal 2015, 2016 and 2017 were ¥13,239 million,¥16,321 million and ¥20,976 million, respectively. Accumulated depreciation was ¥67,055 million and¥85,255 million as of March 31, 2016 and 2017, respectively. Estimated useful lives range up to 50 years forbuildings, up to 60 years for land improvement and up to 30 years for others.
(s) Trade notes, accounts and other receivable
Trade notes, accounts and other receivable primarily include accounts receivables in relation to sales ofassets to be leased, inventories and other assets and payment made on behalf of lessees for property tax,maintenance fees and insurance premiums in relation to direct financing lease contracts.
(t) Inventories
Inventories consist primarily of residential condominiums under development, completed residentialcondominiums (including those waiting to be delivered to buyers under the contract for sale), and merchandisefor sale. Residential condominiums under development are carried at cost less any impairment losses, andcompleted residential condominiums and merchandises for sale are stated at the lower of cost or fair value lesscost to sell. The cost of inventories that are unique and not interchangeable is determined on the specificidentification method and the cost of other inventories is principally determined on the average cost method. Asof March 31, 2016 and 2017, residential condominiums under development were ¥81,859 million and¥60,920 million, respectively, and completed residential condominiums and merchandises for sale were¥58,091 million and ¥56,943 million, respectively.
The Company and its subsidiaries recorded ¥5,241 million of write-downs principally on residentialcondominiums under development for fiscal 2015, resulting from an increase in development costs. These write-downs were principally recorded in cost of goods and real estate sold and included in the Real Estate segment.The Company and its subsidiaries recorded ¥168 million and ¥916 million of write-downs principally oncompleted residential condominiums and merchandise for sale for fiscal 2016 and 2017, respectively, primarilyresulting from a decrease in expected sales price. These write-downs were principally recorded in costs of goodsand real estate sold and included in the Investment and Operation segment.
(u) Office facilities
Office facilities are stated at cost less accumulated depreciation. Depreciation is calculated on a declining-balance basis or straight-line basis over the estimated useful lives of the assets. Depreciation expenses in fiscal2015, 2016 and 2017 were ¥4,711 million, ¥5,110 million and ¥5,380 million, respectively. Accumulateddepreciation was ¥45,310 million and ¥47,534 million as of March 31, 2016 and 2017, respectively. Estimateduseful lives range up to 65 years for buildings and fixtures and up to 20 years for machinery and equipment.
F-21

NOTES TO CONSOLIDATED FINANCIAL STATEMENTS—(Continued)
ORIX Corporation and Subsidiaries
(v) Other assets
Other assets consist primarily of the excess of purchase prices over the net assets acquired in acquisitions(goodwill) and other intangible assets, reinsurance recoverables in relation to reinsurance contracts, deferredinsurance policy acquisition costs which are amortized over the contract periods, leasehold deposits, advancepayments made in relation to purchases of assets to be leased and construction of real estate for operating lease,prepaid benefit cost, derivative assets and deferred tax assets.
(w) Goodwill and other intangible assets
The Company and its subsidiaries account for all business combinations using the acquisition method. TheCompany and its subsidiaries recognize intangible assets acquired in a business combination apart from goodwillif the intangible assets meet one of two criteria—either the contractual-legal criterion or the separability criterion.Goodwill is measured as an excess of the aggregate of consideration transferred and the fair value ofnoncontrolling interests over the net of the acquisition-date amounts of the identifiable assets acquired and theliabilities assumed in the business combination measured at fair value. The Company and its subsidiaries wouldrecognize a bargain purchase gain when the amount of recognized net assets exceeds the sum of considerationtransferred and the fair value of noncontrolling interests. In a business combination achieved in stages, theCompany and its subsidiaries remeasure their previously held equity interest at their acquisition-date fair valueand recognize the resulting gain or loss, if any, in earnings.
The Company and its subsidiaries perform an impairment test for goodwill and any intangible assets thathave indefinite useful lives at least annually. Additionally, if events or changes in circumstances indicate that theasset might be impaired, the Company and its subsidiaries test for impairment when such events or changesoccur.
The Company and its subsidiaries have the option to perform a qualitative assessment to determine whetherto calculate the fair value of a reporting unit under the first step of the two-step goodwill impairment test. TheCompany and its subsidiaries perform the qualitative assessment for some goodwill but bypass the qualitativeassessment and proceed directly to the first step of the two-step impairment test for other goodwill. For thegoodwill for which the qualitative assessment is performed, if, after assessing the totality of events orcircumstances, the Company and/or subsidiaries determine that it is not more likely than not that the fair value ofa reporting unit is less than its carrying amount, then the Company and/or subsidiaries do not perform thetwo-step impairment test. However, if the Company and/or subsidiaries conclude otherwise or determine tobypass the qualitative assessment, the Company and/or subsidiaries proceed to perform the first step of thetwo-step impairment test. The first step of goodwill impairment test, used to identify potential impairment,calculates the fair value of the reporting unit and compares the fair value with the carrying amount of thereporting unit. If the fair value of the reporting unit falls below its carrying amount, the second step of thegoodwill impairment test is performed to measure the amount of impairment loss. The second step of thegoodwill impairment test compares implied fair value of goodwill with its carrying amount. If the carryingamount of goodwill exceeds its implied fair value, an impairment loss is recognized in an amount equal to thatexcess. The Company and its subsidiaries test the goodwill either at the operating segment level or one levelbelow the operating segments.
The Company and its subsidiaries have the option to perform a qualitative assessment to determine whetherit is more likely than not that an indefinite-lived intangible asset is impaired. The Company and its subsidiariesperform the qualitative assessment for some indefinite-lived intangible assets but bypass the qualitativeassessment and perform the quantitative assessment for other indefinite-lived intangible assets. For thoseindefinite-lived assets for which the qualitative assessment is performed, if, after assessing the totality of eventsand circumstances, the Company and/or subsidiaries conclude that it is not more likely than not that the
F-22

NOTES TO CONSOLIDATED FINANCIAL STATEMENTS—(Continued)
ORIX Corporation and Subsidiaries
indefinite-lived asset is impaired, then the Company and/or subsidiaries do not perform the quantitativeimpairment test. However, if the Company and/or subsidiaries conclude otherwise or determine to bypass thequalitative assessment, the Company and/or subsidiaries calculate the fair value of the indefinite-lived intangibleasset and perform the quantitative impairment test. If the carrying amount of the indefinite-lived intangible assetexceeds its fair value, an impairment loss is recognized in an amount equal to that excess.
Intangible assets with finite lives are amortized over their useful lives and tested for impairment. TheCompany and its subsidiaries perform a recoverability test for the intangible assets whenever events or changesin circumstances indicate that the assets might be impaired. The intangible assets are considered not recoverablewhen the undiscounted future cash flows estimated to be generated by those assets are less than the carryingamount of those assets, and the net carrying amount of assets not recoverable is reduced to fair value if lowerthan the carrying amount.
(x) Trade notes, accounts and other payable
Trade notes, accounts and other payable include primarily accounts payable in relation to purchase of assetsto be leased, merchandise for sale and other assets, accounts payable in relation to construction work ofresidential condominiums and deposits received mainly for withholding income tax.
(y) Other Liabilities
Other liabilities include primarily interest, bonus accrued expense and accrued benefit liability, advancesreceived from lessees in relation to lease contracts, deposit received from real estate transaction and derivativeliabilities.
(z) Capitalization of interest costs
The Company and its subsidiaries capitalized interest costs of ¥1,369 million, ¥1,639 million and¥1,066 million in fiscal 2015, 2016 and 2017, respectively, related to specific long-term development projects.
(aa) Advertising
The costs of advertising are expensed as incurred. The total amounts charged to advertising expense in fiscal2015, 2016 and 2017 were ¥20,329 million, ¥21,276 million and ¥25,309 million, respectively.
(ab) Discontinued operations
In April 2014, Accounting Standards Update 2014-08 (“Reporting Discontinued Operations and Disclosuresof Disposals of Components of an Entity”—ASC 205 (“Presentation of Financial Statements”) and ASC 360(“Property, Plant, and Equipment”)) was issued. This Update requires an entity to report a disposal or aclassification as held for sale of a component of an entity or a group of components of an entity in discontinuedoperations if it represents a strategic shift that has (or will have) a major effect on an entity’s operations andfinancial results. The Company and its subsidiaries early adopted this Update on April 1, 2014. The Companyand its subsidiaries report a disposal of a component or a group of components of the Company and itssubsidiaries in discontinued operations if the disposal represents a strategic shift which has (or will have) a majoreffect on the Company and its subsidiaries’ operations and financial results when the component or group ofcomponents is disposed by sale or classified as held for sale on or after April 1, 2014.
Accounting Standards Update 2014-08 does not apply retrospectively to a disposal or a classification as heldfor sale of a component or a group of components of the Company and its subsidiaries which have previously
F-23

NOTES TO CONSOLIDATED FINANCIAL STATEMENTS—(Continued)
ORIX Corporation and Subsidiaries
been reported in the financial statements. Accordingly, during fiscal 2015, the Company and its subsidiariescontinue to report gains on sales and the results of operations of subsidiaries and business units, which wereclassified as held for sale at March 31 2014, as income from discontinued operations in the accompanyingconsolidated statements of income.
(ac) Earnings per share
Basic earnings per share is computed by dividing net income attributable to ORIX Corporation shareholdersby the weighted average number of shares of outstanding common stock in each period and diluted earnings pershare, which reflects the potential dilution that could occur if securities or other contracts issuing common stockwere exercised or converted into common stock.
(ad) Additional acquisition and partial sale of the parent’s ownership interest in subsidiaries
Additional acquisition of the parent’s ownership interest in subsidiaries and partial sale of such interestwhere the parent continues to retain control of the subsidiary are accounted for as equity transactions. On theother hand, in a transaction that results in the loss of control, the gain or loss recognized in income includes therealized gain or loss related to the portion of ownership interest sold and the gain or loss on the remeasurement tofair value of the interest retained.
(ae) Redeemable noncontrolling interests
Noncontrolling interests in a certain subsidiary are redeemable preferred shares which are subject to call andput rights upon certain shareholder events. As redemption of the noncontrolling interest is not solely in thecontrol of the subsidiary, it is recorded between liabilities and equity on the consolidated balance sheets at itsestimated redemption value.
(af) Issuance of stock by an affiliate
When an affiliate issues stocks to unrelated third parties, the Company and its subsidiaries’ ownershipinterest in the affiliate decreases. In the event that the price per share is more or less than the Company and itssubsidiaries’ average carrying amount per share, the Company and its subsidiaries adjust the carrying amount ofits investment in the affiliate and recognize gain or loss in the consolidated statements of income in the year inwhich the change in ownership interest occurs.
(ag) New accounting pronouncements
In May 2014, Accounting Standards Update 2014-09 (“Revenue from Contracts with Customers”—ASC606 (“Revenue from Contracts with Customers”)) was issued. The core principle of this Update is that an entityshould recognize revenue to depict the transfer of promised goods or services to customers in an amount thatreflects the consideration to which the entity expects to be entitled in exchange for those goods or services. Toachieve that core principle, an entity should apply a five-step model to determine when to recognize revenue, andin what amount. The five steps to apply the model are:
• Identify the contract(s) with a customer
• Identify the performance obligations in the contract
• Determine the transaction price
• Allocate the transaction price to the performance obligations in the contract
• Recognize revenue when (or as) the entity satisfies a performance obligation
F-24

NOTES TO CONSOLIDATED FINANCIAL STATEMENTS—(Continued)
ORIX Corporation and Subsidiaries
This Update requires an entity to disclose more information about contracts with customers than under thecurrent disclosure requirements.
In April 2016, Accounting Standards Update 2016-10 (“Identifying Performance Obligations andLicensing”—ASC 606 (“Revenue from Contracts with Customers”)) was issued as an amendment of the newrevenue standard. This Update adds further guidance on identifying performance obligations and also improvesthe operability and understandability of the licensing implementation guidance. The amendments do not changethe core principle of the guidance in ASC 606.
In May 2016, Accounting Standards Update 2016-12 (“Narrow-Scope Improvements and PracticalExpedients”—ASC 606 (“Revenue from Contracts with Customers”)) was issued as an amendment of the newrevenue standard. This Update (1) clarifies the objective of the collectibility criterion for applying paragraph606-10-25-7; (2) permits an entity to exclude amounts collected from customers for all sales (and other similar)taxes from the transaction price; (3) specifies that the measurement date for non-cash consideration is contractinception; (4) provides a practical expedient that permits an entity to reflect the aggregate effect of allmodifications that occur before the beginning of the earliest period presented when identifying the satisfied andunsatisfied performance obligations, determining the transaction price, and allocating the transaction price to thesatisfied and unsatisfied performance obligations; (5) clarifies that a completed contract for purposes of transitionis a contract for which all (or substantially all) of the revenue was recognized under legacy GAAP before the dateof initial application, and (6) clarifies that an entity that retrospectively applies ASC 606 to each prior reportingperiod is not required to disclose the effect of the accounting change for the period of adoption.
These Updates are effective for fiscal years, and interim periods within those fiscal years beginning afterDecember 15, 2017. Early adoption is permitted only for the fiscal year beginning after December 15, 2016, andinterim periods within the fiscal year. An entity should apply the amendments in these Updates using either aretrospective method or a cumulative-effect method. The entity may elect some optional practical expedientswhen applying these Updates. The entity using the cumulative-effect method would recognize the cumulativeeffect of initially applying these Updates as an adjustment to the opening balance of retained earnings or netassets at the date of initial application. Currently, the Company and its subsidiaries plan to adopt these Updateson April 1, 2018, using the cumulative-effect method. And these Updates require a number of new disclosures toenable users of the financial statements to understand the nature, amount, timing, and uncertainty of revenue andcash flows arising from contracts with customers. The scope of these Updates excludes lease contracts, financialinstruments and other contractual rights and obligations within the scope of other ASC Topics including loans,investments in securities and derivatives and also excludes contracts within the scope of ASC Topic 944(“Financial Services—Insurance”). Therefore, the Company and its subsidiaries’ such revenues will not beaffected by these Updates. However, the Company and its subsidiaries have been in process of evaluating theimpact of these Updates on our consolidated financial statements around other revenue streams. Based on theCompany and its subsidiaries’ initial assessment and best estimates to date, the impact of the application of theseUpdates will likely result in a change in the timing of revenue recognition and accounting policy for performancefees received from customers regarding asset management business. Currently, certain subsidiaries recognizesuch fees when earned based on the performance of the asset under management, while other subsidiariesrecognize the fees on accrual basis over the period in which services are performed. New guidance requiresrecognizing such fees as revenue to the extent that it is probable that a significant reversal in the amount ofcumulative revenue recognized will not occur when the uncertainty associated with the variable consideration issubsequently resolved. Other than the impact that have been currently identified, the Company and itssubsidiaries continue to evaluate the effect that the adoption of these Updates will have on the Company and itssubsidiaries’ results of operations or financial position, as well as changes in disclosures required by theseUpdates.
F-25

NOTES TO CONSOLIDATED FINANCIAL STATEMENTS—(Continued)
ORIX Corporation and Subsidiaries
In June 2014, Accounting Standards Update 2014-12 (“Accounting for Share-Based Payments When theTerms of an Award Provide That a Performance Target Could Be Achieved after the Requisite ServicePeriod”—ASC 718 (“Compensation—Stock Compensation”)) was issued. This Update requires that aperformance target that affects vesting and that could be achieved after the requisite service period be treated as aperformance condition. The Company and its subsidiaries adopted this Update on April 1, 2016. The adoptionhad no effect on the Company and its subsidiaries’ results of operations or financial position.
In August 2014, Accounting Standards Update 2014-13 (“Measuring the Financial Assets and the FinancialLiabilities of a Consolidated Collateralized Financing Entity”—ASC 810 (“Consolidation”)) was issued. ThisUpdate permits the parent of the consolidated collateralized financing entity (“CFE”) within the scope of thisUpdate to measure the CFE’s financial assets and liabilities based on either the fair value of the financial assetsor financial liabilities, whichever has the more observable inputs. The Company and its subsidiaries adopted thisUpdate on April 1, 2016. The adoption had no effect on the Company and its subsidiaries’ results of operations orfinancial position.
In August 2014, Accounting Standards Update 2014-15 (“Disclosure of Uncertainties about an Entity’sAbility to Continue as a Going Concern”—ASC 205-40 (“Presentation of Financial Statements—GoingConcern”)) was issued. This Update requires an entity to perform a going concern assessment by evaluating theirability to meet obligations for a look-forward period of one year from the financial statement issuance date (ordate the financial statements are available to be issued). Disclosures are required if it is probable an entity will beunable to meet its obligations within the look-forward period. Incremental substantial doubt disclosure isrequired if the probability is not mitigated by management’s plans. The Company and its subsidiaries adoptedthis Update on this fiscal year end. The Update only relates to certain disclosure requirements and the adoptionhad no effect on the Company and its subsidiaries’ results of operations or financial position.
In November 2014, Accounting Standards Update 2014-16 (“Determining Whether the Host Contract in aHybrid Financial Instrument Issued in the Form of a Share Is More Akin to Debt or to Equity”—ASC 815(“Derivatives and Hedging”)) was issued. This Update requires an issuer or an investor of hybrid financialinstruments issued in the form of a share to determine whether the nature of the host contract is more akin to debtor to equity by considering the economic characteristics and risks of the entire hybrid financial instrument,including the embedded derivative feature that is being evaluated for separate accounting from the host contract.The Company and its subsidiaries adopted this Update on April 1, 2016. The adoption had no effect on theCompany and its subsidiaries’ results of operations or financial position.
In January 2015, Accounting Standards Update 2015-01 (“Simplifying Income Statement Presentation byEliminating the Concept of Extraordinary Items”—ASC 225-20 (“Income Statement—Extraordinary andUnusual Items”)) was issued. This Update eliminates the concept of extraordinary items from U.S. GAAP, butdoes not change the current presentation and disclosure requirements for material events or transactions that areunusual in nature or infrequent in occurrence. The Company and its subsidiaries adopted this Update on April 1,2016. The adoption had no effect on the Company and its subsidiaries’ results of operations or financial position.
In February 2015, Accounting Standards Update 2015-02 (“Amendments to the Consolidation Analysis”—ASC 810 (“Consolidation”)) was issued. This Update requires an entity to change the way to evaluate whetherreporting entities should consolidate limited partnerships and similar legal entities, fees paid to a decision makeror service provider are variable interest in a VIE, and variable interests in a VIE held by related parties of thereporting entity require the reporting entity to consolidate the VIE. Additionally, the amendments in this Updaterescind the indefinite deferral of FASB Statement No.167 (“Amendments to FASB Interpretation No.46(R)”),included in Accounting Standards Update 2010-10 (ASC 810 (“Consolidation”)) for certain investment
F-26

NOTES TO CONSOLIDATED FINANCIAL STATEMENTS—(Continued)
ORIX Corporation and Subsidiaries
companies and similar entities. The Company and its subsidiaries adopted this Update on April 1, 2016. Theadoption had no effect on the Company and its subsidiaries’ results of operations or financial position. SeeNote 11 “Variable Interest Entities” where the required disclosure has been provided.
In April 2015, Accounting Standards Update 2015-03 (“Simplifying the Presentation of Debt IssuanceCosts”—ASC 835-30 (“Interest—Imputation of Interest”)) was issued. This Update requires that debt issuancecosts related to a recognized debt liability are presented in the balance sheet as a direct deduction from thecarrying amount of that debt liability, similar to the presentation of debt discounts or premiums. The Companyand its subsidiaries adopted this Update retrospectively to prior period financial statements on April 1, 2016. Theeffect of the retrospective adoption on the financial position as of March 31, 2016 was a decrease ofapproximately ¥3,988 million in other assets and a decrease of approximately ¥3,988 million in long-term debt inthe consolidated balance sheets.
In July 2015, Accounting Standards Update 2015-11 (“Simplifying the Measurement ofInventory”—ASC 330 (“Inventory”)) was issued. This Update applies to all inventory except for which ismeasured using last-in, first-out (LIFO) or the retail inventory method, and requires an entity to measureinventory at the lower of cost and net realizable value. Additionally, this Update defines net realizable value asthe estimated selling prices in the ordinary course of business, less reasonably predictable costs of completion,disposal, and transportation. This Update is effective for fiscal years, and interim periods within those fiscalyears beginning after December 15, 2016. The amendments in this Update should be applied on a prospectivebasis. Early adoption is permitted. The adoption of this Update is not expected to have a material effect on theCompany and its subsidiaries’ results of operations or financial position.
In September 2015, Accounting Standards Update 2015-16 (“Simplifying the Accounting for Measurement-Period Adjustments”—ASC 805 (“Business Combinations”)) was issued. This Update requires that an acquirerrecognize adjustments to provisional amounts that are identified during the measurement period in the reportingperiod in which the adjustment amounts are determined. The Company and its subsidiaries adopted this Updateon April 1, 2016. The adoption had no effect on the Company and its subsidiaries’ results of operations orfinancial position.
In January 2016, Accounting Standards Update 2016-01 (“Recognition and Measurement of FinancialAssets and Financial Liabilities”—ASC 825-10 (“Financial Instruments—Overall”)) was issued. This Updaterevises accounting related to the classification and measurement of equity investments. This Update also revisesthe presentation of certain fair value changes for financial liabilities measured at fair value. Additionally, thisUpdate amends certain disclosure requirements associated with the fair value of financial instruments. ThisUpdate is effective for fiscal years beginning after December 15, 2017, and interim periods within those fiscalyears. Early application to financial statements of fiscal years or interim periods that have not yet been issued ispermitted as of the beginning of the fiscal year of adoption. The amendments in this Update should be applied bymeans of cumulative-effect adjustment to retained earnings as of the beginning of the fiscal year of adoption.And the amendments relate to equity investments without readily determinable fair value are to be appliedprospectively. The Company and its subsidiaries will adopt this Update on April 1, 2018. The Company and itssubsidiaries continue to evaluate the effect that the adoption of this Update will have on the Company and itssubsidiaries’ results of operations or financial position, as well as changes in disclosures required by this Update.
In February 2016, Accounting Standards Update 2016-02 (ASC 842 (“Leases”)) was issued. This Updaterequires a lessee to recognize most leases on the balance sheet. Lessor accounting remains substantially similar tocurrent U.S. GAAP but with some important changes. This Update is effective for fiscal years beginning afterDecember 15, 2018, and interim periods within those fiscal years. Early application is permitted. Theamendments in this Update should be applied at the beginning of the earliest period presented using a modified
F-27

NOTES TO CONSOLIDATED FINANCIAL STATEMENTS—(Continued)
ORIX Corporation and Subsidiaries
retrospective approach. The modified retrospective approach includes a number of optional practical expedientsthat entities may elect to apply. The Company and its subsidiaries will adopt this Update on April 1, 2019. TheCompany and its subsidiaries continue to evaluate the effect that the adoption of this Update will have on theCompany and its subsidiaries’ results of operations or financial position, as well as changes in disclosuresrequired by this Update.
In March 2016, Accounting Standards Update 2016-07 (“Simplifying the Transition to the Equity MethodAccounting”—ASC 323 (“Investments—Equity Method and Joint Ventures”)) was issued. This Updateeliminates the requirement that when an investment qualifies for use of the equity method as a result of anincrease in the level of ownership interest or degree of influence, an investor must adjust the investment, resultsof operations, and retained earnings retroactively on a step-by-step basis as if the equity method had been ineffect during all previous periods that the investment had been held. This Update also requires that the equitymethod investor add the cost of acquiring the additional interest in the investee to the current basis of theinvestor’s previously held interest and requires that an entity that has an available-for sale equity security thatbecomes qualified for the equity method of accounting recognize through earnings the unrealized holding gain orloss in accumulated other comprehensive income at the date the investment becomes qualified for use of theequity method. This Update is effective for fiscal years beginning after December 15, 2016, and interim periodswithin those fiscal years. The amendments in this Update should be applied prospectively. Early application ispermitted. Generally, the effect of adopting this Update on the Company and its subsidiaries’ results ofoperations or financial position will depend on future transactions.
In June 2016, Accounting Standards Update 2016-13 (“Measurement of Credit Losses on FinancialInstruments”—ASC 326 (“Financial Instruments—Credit Losses”)) was issued. This Update significantlychanges how companies measure and recognize credit impairment for many financial assets. The new currentexpected credit loss model requires companies to immediately recognize an estimate of credit losses expected tooccur over the remaining life of the financial assets that are within the scope of this Update. This Update alsomakes targeted amendments to the current impairment model for available-for-sale debt securities. This Updateis effective for fiscal years beginning after December 15, 2019, and interim periods within those fiscal years. Theamendments in this Update should be applied through a cumulative-effect adjustment to retained earnings as ofthe beginning of the first reporting period in which the guidance is effective. Early application is permitted forfiscal year beginning after December 15, 2018, including interim periods within the fiscal year. The Companyand its subsidiaries continue to evaluate the effect that the adoption of this Update will have on the Company andits subsidiaries’ results of operations or financial position, as well as changes in disclosures required by thisUpdate.
In August 2016, Accounting Standards Update 2016-15 (“Classification of Certain Cash Receipts and CashPayments”—ASC 230 (“Statement of Cash Flows”) was issued. This Update amends ASC 230 to add or clarifyguidance on the classification of certain cash receipts and cash payments in the statement of cash flows. ThisUpdate is effective for fiscal years beginning after December 15, 2017, and interim periods within those fiscalyears. Early adoption is permitted. This Update should be applied using a retrospective transition method to eachperiod presented. If it is impracticable to apply the amendments retrospectively for some of the issues, theamendments for those issues would be applied prospectively as of the earliest date practicable. The Company andits subsidiaries are currently evaluating the effect that the adoption of this Update will have on the Company andits subsidiaries’ statement of cash flows.
In October 2016, Accounting Standards Update 2016-16 (“Intra-Entity Transfers of Assets Other ThanInventory”—ASC 740 (“Income Taxes”) was issued. This Update eliminates the exception to defer the incometax consequences of intra-entity transfers of assets other than inventory until the assets are ultimately sold to anoutside party and requires the recognition of the current and deferred tax consequences when those transfers
F-28

NOTES TO CONSOLIDATED FINANCIAL STATEMENTS—(Continued)
ORIX Corporation and Subsidiaries
occur. This Update is effective for fiscal years beginning after December 15, 2017, and interim periods withinthose fiscal years. Early adoption is permitted. This Update should be applied on a modified retrospective basisthrough a cumulative-effect adjustment directly to retained earnings as of the beginning of the period ofadoption. The Company and its subsidiaries are currently evaluating the effect that the adoption of this Updatewill have on the Company and its subsidiaries’ results of operations or financial position.
In October 2016, Accounting Standards Update 2016-17 (“Interests Held through Related Parties That Areunder Common Control”—ASC 810 (“Consolidation”) was issued. This Update amends the consolidationguidance on how a reporting entity that is the single decision maker of a VIE should treat indirect interests in theentity held through related parties that are under common control with the reporting entity when determiningwhether it is the primary beneficiary of that VIE. This Update is effective for fiscal years beginning afterDecember 15, 2016, and interim periods within those fiscal years. Early adoption is permitted, includingadoption in an interim period. If an entity early adopts the amendments in an interim period, any adjustmentsshould be reflected as of the beginning of the fiscal year that includes that interim period. The Company and itssubsidiaries have already adopted the amendments in Accounting Standards Update 2015-02 and accordinglywould be required to apply the amendments in this Update retrospectively to all relevant prior periods beginningwith the fiscal year in which the amendments in that Update 2015-02 initially were applied. The adoption of thisUpdate is not expected to have a material effect on the Company and its subsidiaries’ results of operations orfinancial position.
In November 2016, Accounting Standards Update 2016-18 (“Restricted Cash”—ASC230 (“Statement ofCash Flows”)) was issued. This Update requires that a statement of cash flows explain the change during theperiod in the total of cash, cash equivalents, and amounts generally described as restricted cash or restricted cashequivalents. This Update is effective for fiscal years beginning after December 15, 2017, and interim periodswithin those fiscal years. Early adoption is permitted, including adoption in an interim period. If an entity earlyadopts the amendments in an interim period, any adjustments should be reflected as of the beginning of the fiscalyear that includes that interim period. The Company and its subsidiaries are currently evaluating the effect thatthe adoption of this Update will have on the Company and its subsidiaries’ statement of cash flows.
In January 2017, Accounting Standards Update 2017-04 (“Simplifying the Test for GoodwillImpairment”—ASC350 (“Intangible—Goodwill and Other”)) was issued. This Update eliminates Step 2 from thecurrent goodwill impairment test. Instead, goodwill impairments would be measured by the amount by which thecarrying amount exceeds the reporting unit’s fair value. This Update also eliminates the requirement for anyreporting unit with a zero or negative carrying amount to perform a qualitative assessment and, if it is more likelythan not that the goodwill is impaired, to perform Step 2 of the goodwill impairment test. This Update is effectivefor its annual or any interim goodwill impairment tests in fiscal years beginning after December 15, 2019 andshould be applied on a prospective basis. Early adoption is permitted for interim or annual goodwill impairmenttests performed on testing dates after January 1, 2017. Generally, the effect of adopting this Update on theCompany and its subsidiaries’ results of operation or financial position will depend on the outcomes of futuregoodwill impairment tests.
(ah) Elimination of a lag period
Since its acquisition on February 27, 2014, the Company had been consolidating DAIKYOINCORPORATED (hereinafter, “DAIKYO”) on a lag basis. In order to reflect DAIKYO’s financial position andresults of operations and cash flows in the Company’s consolidated financial statements in a concurrent manner,the Company eliminated the lag period and has aligned the fiscal year end of DAIKYO with the Company’sfiscal year end of March 31 during fiscal 2015.
F-29

NOTES TO CONSOLIDATED FINANCIAL STATEMENTS—(Continued)
ORIX Corporation and Subsidiaries
Because the elimination of a lag period represents a change in accounting principle, the Companyretrospectively adjusted the prior year’s consolidated financial statements for the effects of the lag accounting.
Below are the effects of this change in accounting principle on major line items and earnings per shareamounts in the consolidated financial statements for fiscal 2015. The segment information in the Note 34“Segment Information” has been restated giving effect to these changes to conform to DAIKYO’s current fiscalyear end.
Millions of yen
2015
Adjustments Increase (decrease)
Revenues:Sales of goods and real estate . . . . . . . . . . . . . . . . . . . . . . . . . . . . . . ¥10,548Services income . . . . . . . . . . . . . . . . . . . . . . . . . . . . . . . . . . . . . . . . . 27,960Other . . . . . . . . . . . . . . . . . . . . . . . . . . . . . . . . . . . . . . . . . . . . . . . . . 1,377
Total revenues . . . . . . . . . . . . . . . . . . . . . . . . . . . . . . . . . . . . . . . . . . . . . . 39,885
Expenses:Costs of goods and real estate sold . . . . . . . . . . . . . . . . . . . . . . . . . . 6,125Services expense . . . . . . . . . . . . . . . . . . . . . . . . . . . . . . . . . . . . . . . . 23,760Selling, general and administrative expenses . . . . . . . . . . . . . . . . . . 3,804Other . . . . . . . . . . . . . . . . . . . . . . . . . . . . . . . . . . . . . . . . . . . . . . . . . 999
Total expenses . . . . . . . . . . . . . . . . . . . . . . . . . . . . . . . . . . . . . . . . . . . . . . 34,688
Operating Income . . . . . . . . . . . . . . . . . . . . . . . . . . . . . . . . . . . . . . . . . . . 5,197
Income before Income Taxes and Discontinued Operations . . . . . . . . . . . ¥ 8,068
Millions of yen, except for per share amounts
2015
Adjustments Increase (decrease)
Income from Continuing Operations . . . . . . . . . . . . . . . . . . . . . . . . . . . . . ¥ 2,184Net Income . . . . . . . . . . . . . . . . . . . . . . . . . . . . . . . . . . . . . . . . . . . . . . . . . 2,184Net Income Attributable to the Noncontrolling Interests . . . . . . . . . . . . . 1,070Net Income Attributable to ORIX Corporation Shareholders . . . . . . . . . . 1,114Basic EPS . . . . . . . . . . . . . . . . . . . . . . . . . . . . . . . . . . . . . . . . . . . . . . . . . . 0.84Diluted EPS . . . . . . . . . . . . . . . . . . . . . . . . . . . . . . . . . . . . . . . . . . . . . . . . 0.86
Millions of yen
2015
Adjustments Increase (decrease)
Net cash provided by operating activities . . . . . . . . . . . . . . . . . . . . . . . . . ¥30,919Net cash provided by (used in) investing activities . . . . . . . . . . . . . . . . . . 3,743Net cash provided by (used in) financing activities . . . . . . . . . . . . . . . . . 3,832Cash and Cash Equivalents at Beginning of Year . . . . . . . . . . . . . . . . . . . (9,260)Cash and Cash Equivalents at End of Year . . . . . . . . . . . . . . . . . . . . . . . . 29,234
F-30

NOTES TO CONSOLIDATED FINANCIAL STATEMENTS—(Continued)
ORIX Corporation and Subsidiaries
2. Fair Value Measurements
The Company and its subsidiaries classify and prioritize inputs used in valuation techniques to measure fairvalue into the following three levels:
Level 1—Inputs of quoted prices (unadjusted) in active markets for identical assets or liabilities that thereporting entity has the ability to access at the measurement date.
Level 2—Inputs other than quoted prices included within Level 1 that are observable for the assets orliabilities, either directly or indirectly.
Level 3—Unobservable inputs for the assets or liabilities.
The Company and its subsidiaries differentiate between those assets and liabilities required to be carried atfair value at every reporting period (“recurring”) and those assets and liabilities that are only required to beadjusted to fair value under certain circumstances (“nonrecurring”). The Company and its subsidiaries mainlymeasure certain loans held for sale, trading securities, available-for-sale securities, certain investment funds,derivatives, certain reinsurance recoverables, certain contingent consideration, and variable annuity and variablelife insurance contracts at fair value on a recurring basis.
F-31

NOTES TO CONSOLIDATED FINANCIAL STATEMENTS—(Continued)
ORIX Corporation and Subsidiaries
The following tables present recorded amounts of major financial assets and liabilities measured at fairvalue on a recurring basis as of March 31, 2016 and 2017:
March 31, 2016
Millions of yen
TotalCarryingValue in
ConsolidatedBalance Sheets
Quoted Pricesin Active
Markets forIdentical Assets
(Level 1)
SignificantOther
ObservableInputs
(Level 2)
SignificantUnobservable
Inputs(Level 3)
Assets:Loans held for sale*1 . . . . . . . . . . . . . . . . . . . . . . . . . . ¥ 20,673 ¥ 0 ¥ 20,673 ¥ 0Trading securities . . . . . . . . . . . . . . . . . . . . . . . . . . . . . 725,821 37,592 688,229 0Available-for-sale securities . . . . . . . . . . . . . . . . . . . . . 1,347,890 99,347 1,149,021 99,522
Japanese and foreign government bondsecurities . . . . . . . . . . . . . . . . . . . . . . . . . . . . . . 497,355 988 496,367 0
Japanese prefectural and foreign municipal bondsecurities*2 . . . . . . . . . . . . . . . . . . . . . . . . . . . . 169,534 0 169,534 0
Corporate debt securities . . . . . . . . . . . . . . . . . . . 410,779 0 410,774 5Specified bonds issued by SPEs in Japan . . . . . . . 3,461 0 0 3,461CMBS and RMBS in the Americas . . . . . . . . . . . 97,186 0 58,693 38,493Other asset- backed securities and debt
securities . . . . . . . . . . . . . . . . . . . . . . . . . . . . . . 58,230 0 667 57,563Equity securities*4 . . . . . . . . . . . . . . . . . . . . . . . . 111,345 98,359 12,986 0
Other securities . . . . . . . . . . . . . . . . . . . . . . . . . . . . . . . 17,751 0 0 17,751Investment funds*5 . . . . . . . . . . . . . . . . . . . . . . . . 17,751 0 0 17,751
Derivative assets . . . . . . . . . . . . . . . . . . . . . . . . . . . . . . 33,747 48 25,491 8,208Interest rate swap agreements . . . . . . . . . . . . . . . . 93 0 93 0Options held/written and other . . . . . . . . . . . . . . . 8,789 0 581 8,208Futures, foreign exchange contracts . . . . . . . . . . . 18,294 48 18,246 0Foreign currency swap agreements . . . . . . . . . . . 6,571 0 6,571 0
Netting*6 . . . . . . . . . . . . . . . . . . . . . . . . . . . (5,757) 0 0 0Net derivative assets . . . . . . . . . . . . . . . . . . . . . . . 27,990 0 0 0
Other assets . . . . . . . . . . . . . . . . . . . . . . . . . . . . . . . . . . 37,855 0 0 37,855Reinsurance recoverables*7 . . . . . . . . . . . . . . . . . 37,855 0 0 37,855
Total . . . . . . . . . . . . . . . . . . . . . . . . . . . ¥2,183,737 ¥136,987 ¥1,883,414 ¥163,336
Liabilities:Derivative liabilities . . . . . . . . . . . . . . . . . . . . . . . . . . . ¥ 19,870 ¥ 533 ¥ 19,337 ¥ 0
Interest rate swap agreements . . . . . . . . . . . . . . . . 5,921 0 5,921 0Options held/written and other . . . . . . . . . . . . . . . 3,637 0 3,637 0Futures, foreign exchange contracts . . . . . . . . . . . 6,655 533 6,122 0Foreign currency swap agreements . . . . . . . . . . . 3,601 0 3,601 0Credit derivatives held . . . . . . . . . . . . . . . . . . . . . 56 0 56 0
Netting*6 . . . . . . . . . . . . . . . . . . . . . . . . . . . (5,757) 0 0 0Net derivative Liabilities . . . . . . . . . . . . . . . . . . . 14,113 0 0 0
Policy Liabilities and Policy Account Balances . . . . . . 795,001 0 0 795,001Variable annuity and variable life insurance
contracts*8 . . . . . . . . . . . . . . . . . . . . . . . . . . . . 795,001 0 0 795,001
Total . . . . . . . . . . . . . . . . . . . . . . . . . . . ¥ 814,871 ¥ 533 ¥ 19,337 ¥795,001
F-32

NOTES TO CONSOLIDATED FINANCIAL STATEMENTS—(Continued)
ORIX Corporation and Subsidiaries
March 31, 2017
Millions of yen
TotalCarryingValue in
ConsolidatedBalance Sheets
Quoted Pricesin Active
Markets forIdentical Assets
(Level 1)
SignificantOther
ObservableInputs
(Level 2)
SignificantUnobservable
Inputs(Level 3)
Assets:Loans held for sale*1 . . . . . . . . . . . . . . . . . . . . . . . . . . ¥ 19,232 ¥ 0 ¥ 19,232 ¥ 0Trading securities . . . . . . . . . . . . . . . . . . . . . . . . . . . . . 569,074 37,500 531,574 0Available-for-sale securities . . . . . . . . . . . . . . . . . . . . . 1,165,417 93,995 946,906 124,516
Japanese and foreign government bondsecurities . . . . . . . . . . . . . . . . . . . . . . . . . . . . . . 345,612 2,748 342,864 0
Japanese prefectural and foreign municipal bondsecurities*2 . . . . . . . . . . . . . . . . . . . . . . . . . . . . 168,822 0 168,822 0
Corporate debt securities*3 . . . . . . . . . . . . . . . . . 393,644 11,464 380,562 1,618Specified bonds issued by SPEs in Japan . . . . . . . 1,087 0 0 1,087CMBS and RMBS in the Americas . . . . . . . . . . . 98,501 0 40,643 57,858Other asset- backed securities and debt
securities . . . . . . . . . . . . . . . . . . . . . . . . . . . . . . 64,717 0 764 63,953Equity securities*4 . . . . . . . . . . . . . . . . . . . . . . . . 93,034 79,783 13,251 0
Other securities . . . . . . . . . . . . . . . . . . . . . . . . . . . . . . . 27,801 0 0 27,801Investment funds*5 . . . . . . . . . . . . . . . . . . . . . . . . 27,801 0 0 27,801
Derivative assets . . . . . . . . . . . . . . . . . . . . . . . . . . . . . . 22,999 734 17,032 5,233Interest rate swap agreements . . . . . . . . . . . . . . . . 304 0 304 0Options held/written and other . . . . . . . . . . . . . . . 5,804 0 571 5,233Futures, foreign exchange contracts . . . . . . . . . . . 12,346 734 11,612 0Foreign currency swap agreements . . . . . . . . . . . 4,545 0 4,545 0
Netting*6 . . . . . . . . . . . . . . . . . . . . . . . . . . . (4,019) 0 0 0Net derivative assets . . . . . . . . . . . . . . . . . . . . . . . 18,980 0 0 0
Other assets . . . . . . . . . . . . . . . . . . . . . . . . . . . . . . . . . . 22,116 0 0 22,116Reinsurance recoverables*7 . . . . . . . . . . . . . . . . . 22,116 0 0 22,116
Total . . . . . . . . . . . . . . . . . . . . . . . . . . . ¥1,826,639 ¥132,229 ¥1,514,744 ¥179,666
Liabilities:Derivative liabilities . . . . . . . . . . . . . . . . . . . . . . . . . . . ¥ 16,295 ¥ 165 ¥ 16,130 ¥ 0
Interest rate swap agreements . . . . . . . . . . . . . . . . 4,567 0 4,567 0Options held/written and other . . . . . . . . . . . . . . . 1,071 0 1,071 0Futures, foreign exchange contracts . . . . . . . . . . . 8,821 165 8,656 0Foreign currency swap agreements . . . . . . . . . . . 1,677 0 1,677 0Credit derivatives held . . . . . . . . . . . . . . . . . . . . . 159 0 159 0
Netting*6 . . . . . . . . . . . . . . . . . . . . . . . . . . . (4,019) 0 0 0Net derivative Liabilities . . . . . . . . . . . . . . . . . . . 12,276 0 0 0
Policy Liabilities and Policy Account Balances . . . . . . 605,520 0 0 605,520Variable annuity and variable life insurance
contracts*8 . . . . . . . . . . . . . . . . . . . . . . . . . . . . 605,520 0 0 605,520
Total . . . . . . . . . . . . . . . . . . . . . . . . . . . ¥ 621,815 ¥ 165 ¥ 16,130 ¥605,520
*1 A certain subsidiary elected the fair value option on the loans held for sale originated on or after October 1,2011. These loans are multi-family and seniors housing loans and are sold to Federal National MortgageAssociation (“Fannie Mae”) or institutional investors. Included in “Other (income) and expense, net” in the
F-33

NOTES TO CONSOLIDATED FINANCIAL STATEMENTS—(Continued)
ORIX Corporation and Subsidiaries
consolidated statements of income were a gain from the change in the fair value of the loans of ¥246 millionfor the fiscal 2015, a loss from the change in the fair value of the loans of ¥71 million for fiscal 2016 and again from the change in the fair value of the loans of ¥31 million for fiscal 2017. No gains or losses wererecognized in earnings for fiscal 2015, 2016 and 2017 attributable to changes in instrument-specific credit risk.The amounts of aggregate unpaid principal balance and aggregate fair value of the loan held for sale as ofMarch 31, 2016, were ¥19,848 million and ¥20,673 million, respectively, and the amount of the aggregate fairvalue exceeded the amount of aggregate unpaid principal balance by ¥825 million. The amounts of aggregateunpaid principal balance and aggregate fair value as of March 31, 2017, were ¥18,362 million and¥19,232 million, respectively, and the amount of the aggregate fair value exceeded the amount of aggregateunpaid principal balance by ¥870 million. As of March 31, 2016 and 2017, there were no loans that were90 days or more past due, in non-accrual status, or both.
*2 A certain subsidiary elected the fair value option for investments in foreign government bond securitiesincluded in available-for-sale securities. Included in “Gains on investment securities and dividends” in theconsolidated statements of income were losses of ¥9 million and ¥12 million from the change in the fair valueof those investments for fiscal 2016 and 2017. The amounts of aggregate fair value elected the fair valueoption were ¥988 million and ¥1,015 million as of March 31, 2016 and 2017.
*3 A certain subsidiary elected the fair value option for investments in foreign corporate debt securitiesincluded in available-for-sale securities. Included in “Gains on investment securities and dividends” in theconsolidated statements of income was a loss of ¥31 million from the change in the fair value of thoseinvestments for fiscal 2017. The amounts of aggregate fair value elected the fair value option was¥1,026 million as of March 31, 2017.
*4 A certain subsidiary elected the fair value option for investments in equity securities included inavailable-for-sale securities. Included in “Gains on investment securities and dividends” in the consolidatedstatements of income were a gain of ¥1,070 million, a loss of ¥202 million and a gain of ¥1,277 millionfrom the change in the fair value of those investments for fiscal 2015, 2016 and 2017. The amount ofaggregate fair value elected the fair value option were ¥16,227 million and ¥15,400 million as of March 31,2016 and 2017, respectively.
*5 Certain subsidiaries elected the fair value option for investments in some funds. Included in “Gains oninvestment securities and dividends” in the consolidated statements of income were a gain of ¥1,301 millionand a loss of ¥4 million and a gain of ¥699 million from the change in the fair value of those investments forfiscal 2015, 2016 and 2017. The amounts of aggregate fair value were ¥10,152 million and ¥7,453 millionas of March 31, 2016 and 2017, respectively.
*6 It represents the amount offset under counterparty netting of derivative assets and liabilities.*7 Certain subsidiaries elected the fair value option for certain reinsurance contracts held. The fair value of the
reinsurance contracts elected for the fair value option in other assets were ¥37,855 million and¥22,116 million as of March 31, 2016 and 2017, respectively. For the effect of changes in the fair value ofthose reinsurance contracts on earnings for fiscal 2016 and 2017, see Note 23 “Life Insurance Operations.”
*8 Certain subsidiaries elected the fair value option for the entire variable annuity and variable life insurancecontracts held in order to match the earnings recognized for the changes in the fair value of policy liabilitiesand policy account balances with earnings recognized for gains or losses from the investment assetsmanaged on behalf of variable annuity and variable life policyholders, derivative contracts and the changesin the fair value of reinsurance contracts. The fair value of the variable annuity and variable life insurancecontracts elected for the fair value option in policy liabilities and policy account balances were¥795,001 million and ¥605,520 million as of March 31, 2016 and 2017, respectively. For the effect ofchanges in the fair value of the variable annuity and variable life insurance contracts on earnings for fiscal2016 and 2017, see Note 23 “Life Insurance Operations.”
F-34

NOTES TO CONSOLIDATED FINANCIAL STATEMENTS—(Continued)
ORIX Corporation and Subsidiaries
Changes in economic conditions or valuation methodologies may require the transfer of assets and liabilitiesfrom one fair value level to another. In such instances, the Company and its subsidiaries recognize the transfer atthe beginning of the quarter during which the transfers occur. The Company and its subsidiaries evaluate thesignificance of transfers between levels based upon size of the transfer relative to total assets, total liabilities ortotal earnings. For fiscal 2016 and 2017, there were no transfers between Level 1 and Level 2.
The following tables present the reconciliation of financial assets and liabilities (net) measured at fair valueon a recurring basis using significant unobservable inputs (Level 3) in fiscal 2015, 2016 and 2017:
2015
Millions of yen
Gains or losses(realized/unrealized)
Purchases*3 Sales Settlements*4
Transfersin and/
or out ofLevel 3(net)*5
Balance atMarch 31, 2015
Change inunrealized
gains or lossesincluded inearnings forassets and
liabilities stillheld at
March 31,2015*1
Balance atApril 1,
2014Included inearnings*1
Included inother
comprehensiveincome*2 Total
Available-for-sale securities . . . . . . . . . . . . ¥ 84,001 ¥ 2,101 ¥ 6,653 ¥ 8,754 ¥ 65,964 ¥(18,222) ¥ (23,796) ¥(19,650) ¥ 97,051 ¥ (1,745)Corporate debt securities . . . . . . . . . . 661 73 (24) 49 0 (210) (500) 0 0 0Specified bonds issued by SPEs in
Japan . . . . . . . . . . . . . . . . . . . . . . . . 6,772 5 101 106 1,700 0 (1,298) 0 7,280 5CMBS and RMBS in the Americas . . 17,833 60 3,724 3,784 29,372 (3,446) (4,447) (20,438) 22,658 (395)Other asset- backed securities and
debt securities . . . . . . . . . . . . . . . . . 58,735 1,963 2,779 4,742 34,892 (14,566) (17,551) 0 66,252 (1,355)Equity securities . . . . . . . . . . . . . . . . . 0 0 73 73 0 0 0 788 861 0
Other securities . . . . . . . . . . . . . . . . . . . . . . 6,317 1,290 1,142 2,432 6,180 (4,870) (1,336) 0 8,723 1,290Investment funds . . . . . . . . . . . . . . . . 6,317 1,290 1,142 2,432 6,180 (4,870) (1,336) 0 8,723 1,290
Derivative assets and liabilities (net) . . . . . 2,486 (13,838) 0 (13,838) 28,536 0 (5,314) 0 11,870 (13,838)Options held/written and other . . . . . . 2,486 (13,838) 0 (13,838) 28,536 0 (5,314) 0 11,870 (13,838)
Other asset . . . . . . . . . . . . . . . . . . . . . . . . . 0 (36,072) 0 (36,072) 72,654 0 (544) 0 36,038 (36,072)Reinsurance recoverables*6 . . . . . . . . 0 (36,072) 0 (36,072) 72,654 0 (544) 0 36,038 (36,072)
Accounts payable . . . . . . . . . . . . . . . . . . . . 2,833 (12,203) 0 (12,203) 0 0 (9,503) 0 5,533 (12,203)Contingent consideration . . . . . . . . . . 2,833 (12,203) 0 (12,203) 0 0 (9,503) 0 5,533 (12,203)
Policy Liabilities and Policy AccountBalances . . . . . . . . . . . . . . . . . . . . . . . . . 0 (100,702) 0 (100,702) 1,765,444 0 (611,663) 0 1,254,483 (100,702)
Variable annuity and variable lifeinsurance contracts*7 . . . . . . . . . . . 0 (100,702) 0 (100,702) 1,765,444 0 (611,663) 0 1,254,483 (100,702)
2016
Millions of yen
Balance atApril 1,
2015
Gains or losses(realized/unrealized)
Purchases*3 Sales Settlements*4
Transfersin and/
or out ofLevel 3(net)*5
Balance atMarch 31, 2016
Change inunrealized
gains or lossesincluded inearnings forassets and
liabilities stillheld at
March 31,2016*1
Included inearnings*1
Included inother
comprehensiveincome*2 Total
Available-for-sale securities . . . . . . . . . . . . ¥ 97,051 ¥ 922 ¥(10,458) ¥ (9,536) ¥ 47,886 ¥(15,632) ¥ (19,378) ¥ (869) ¥ 99,522 ¥ (679)Corporate debt securities . . . . . . . . . . 0 1 0 1 5 (1) 0 0 5 0Specified bonds issued by SPEs in
Japan . . . . . . . . . . . . . . . . . . . . . . . . 7,280 5 16 21 0 (1,885) (1,955) 0 3,461 2CMBS and RMBS in the Americas . . 22,658 424 (3,831) (3,407) 26,431 (2,401) (4,788) 0 38,493 (763)Other asset- backed securities and
debt securities . . . . . . . . . . . . . . . . . 66,252 492 (6,651) (6,159) 21,450 (11,345) (12,635) 0 57,563 82Equity securities . . . . . . . . . . . . . . . . . 861 0 8 8 0 0 0 (869) 0 0
Other securities . . . . . . . . . . . . . . . . . . . . . . 8,723 1,146 (2,194) (1,048) 10,933 (857) 0 0 17,751 849Investment funds . . . . . . . . . . . . . . . . 8,723 1,146 (2,194) (1,048) 10,933 (857) 0 0 17,751 849
Derivative assets and liabilities (net) . . . . . 11,870 (4,596) 0 (4,596) 5,857 0 (4,923) 0 8,208 (4,596)Options held/written and other . . . . . . 11,870 (4,596) 0 (4,596) 5,857 0 (4,923) 0 8,208 (4,596)
Other asset . . . . . . . . . . . . . . . . . . . . . . . . . 36,038 (8,482) 0 (8,482) 10,669 0 (370) 0 37,855 (8,482)Reinsurance recoverables*6 . . . . . . . . 36,038 (8,482) 0 (8,482) 10,669 0 (370) 0 37,855 (8,482)
Accounts payable . . . . . . . . . . . . . . . . . . . . 5,533 3,059 0 3,059 0 0 (2,474) 0 0 0Contingent consideration . . . . . . . . . . 5,533 3,059 0 3,059 0 0 (2,474) 0 0 0
Policy Liabilities and Policy AccountBalances . . . . . . . . . . . . . . . . . . . . . . . . . 1,254,483 40,751 0 40,751 0 0 (418,731) 0 795,001 40,751
Variable annuity and variable lifeinsurance contracts*7 . . . . . . . . . . . 1,254,483 40,751 0 40,751 0 0 (418,731) 0 795,001 40,751
F-35

NOTES TO CONSOLIDATED FINANCIAL STATEMENTS—(Continued)
ORIX Corporation and Subsidiaries
2017
Millions of yen
Balanceat April 1,
2016
Gains or losses(realized/unrealized)
Purchases*3 Sales Settlements*4
Transfersin and/
or out ofLevel 3(net)*5
Balance atMarch 31, 2017
Change inunrealized
gains or lossesincluded inearnings forassets and
liabilities stillheld at
March 31,2017*1
Included inearnings*1
Included inother
comprehensiveincome*2 Total
Available-for-sale securities . . . . . . . . . . . . ¥ 99,522 ¥ 287 ¥10,106 ¥ 10,393 ¥37,212 ¥(6,545) ¥ (16,066) ¥0 ¥124,516 ¥ 98Corporate debt securities . . . . . . . . . . 5 0 (3) (3) 1,800 0 (184) 0 1,618 0Specified bonds issued by SPEs in
Japan . . . . . . . . . . . . . . . . . . . . . . . . 3,461 1 (29) (28) 0 (1,200) (1,146) 0 1,087 0CMBS and RMBS in the Americas . . 38,493 202 2,674 2,876 21,871 (466) (4,916) 0 57,858 23Other asset- backed securities and
debt securities . . . . . . . . . . . . . . . . . 57,563 84 7,464 7,548 13,541 (4,879) (9,820) 0 63,953 75Other securities . . . . . . . . . . . . . . . . . . . . . . 17,751 639 475 1,114 14,521 (5,585) 0 0 27,801 581
Investment funds . . . . . . . . . . . . . . . . . 17,751 639 475 1,114 14,521 (5,585) 0 0 27,801 581Derivative assets and liabilities (net) . . . . . 8,208 (4,141) 0 (4,141) 2,480 0 (1,314) 0 5,233 (4,141)
Options held/written and other . . . . . . 8,208 (4,141) 0 (4,141) 2,480 0 (1,314) 0 5,233 (4,141)Other asset . . . . . . . . . . . . . . . . . . . . . . . . . 37,855 (22,398) 0 (22,398) 8,309 0 (1,650) 0 22,116 (22,398)
Reinsurance recoverables*6 . . . . . . . . 37,855 (22,398) 0 (22,398) 8,309 0 (1,650) 0 22,116 (22,398)Policy Liabilities and Policy Account
Balances . . . . . . . . . . . . . . . . . . . . . . . . . 795,001 3,651 0 3,651 0 0 (185,830) 0 605,520 3,651Variable annuity and variable life
insurance contracts*7 . . . . . . . . . . . 795,001 3,651 0 3,651 0 0 (185,830) 0 605,520 3,651
*1 Principally, gains and losses from available-for-sale securities are included in “Gains on investment securities and dividends”, “Write-downs of securities” or “Life insurance premiums and related investment income”; other securities are included in “Gains on investmentsecurities and dividends” and derivative assets and liabilities (net) are included in “Other (income) and expense, net” and gains andlosses from accounts payable are included in “Other (income) and expense, net” respectively. Also, for available-for-sale securities,amortization of interest recognized in finance revenues is included in these columns.
*2 Unrealized gains and losses from available-for-sale securities are included in “Net change of unrealized gains (losses) on investment insecurities” and “Net change of foreign currency translation adjustments.”
*3 Increases resulting from an acquisition of a subsidiary and insurance contracts ceded to reinsurance companies are included.*4 Decreases resulting from the receipts of reimbursements for benefits, and decreases resulting from insurance payouts to variable annuity
and variable life policyholders due to death, surrender and maturity of the investment period are included. Due to the elapse of thecomputation period of the contingent consideration during fiscal 2016, the unsettled payment is included in a decrease of Accountspayable.
*5 The amount reported in “Transfers in and/or out of Level 3 (net)” is the fair value at the beginning of quarter during which the transfersoccur.
*6 “Included in earnings” in the above table includes changes in the fair value of reinsurance contracts recorded in “Life insurance costs”and reinsurance premiums, net of reinsurance benefits received, recorded in “Life insurance premiums and related investment income.”
*7 “Included in earnings” in the above table is recorded in “Life insurance costs” and includes changes in the fair value of policy liabilitiesand policy account balances resulting from gains or losses on the underlying investment assets managed on behalf of variable annuityand variable life policyholders, and the changes in the minimum guarantee risks relating to variable annuity and variable life insurancecontracts as well as insurance costs recognized for insurance and annuity payouts as a result of insured events.
In fiscal 2015, CMBS in the Americas totaling ¥20,438 million were transferred from Level 3 to Level 2,since the inputs such as trading price and/or bid price became observable due to the market returning to activeand the bonds invested being more liquid with actual observable trades of the similar financial instruments and/oractive dealer bids. In addition equity securities totaling ¥788 million were transferred from Level 2 to Level 3,since the inputs became unobservable.
In fiscal 2016, equity securities totaling ¥869 million were transferred from Level 3 to Level 2, since theinputs became observable.
In fiscal 2017, there were no transfers in or out of Level 3.
F-36

NOTES TO CONSOLIDATED FINANCIAL STATEMENTS—(Continued)
ORIX Corporation and Subsidiaries
The following tables present recorded amounts of assets measured at fair value on a nonrecurring basis as ofMarch 31, 2016 and 2017. These assets are measured at fair value on a nonrecurring basis mainly to recognizeimpairment:
March 31, 2016
Millions of yen
TotalCarryingValue in
ConsolidatedBalanceSheets
Quoted Pricesin Active
Markets forIdentical
Assets(Level 1)
SignificantOther
ObservableInputs
(Level 2)
SignificantUnobservable
Inputs(Level 3)
Assets:Real estate collateral-dependent loans (net of allowance
for probable loan losses) . . . . . . . . . . . . . . . . . . . . . . . . . ¥17,511 ¥0 ¥0 ¥17,511Investment in operating leases and property under facility
operations . . . . . . . . . . . . . . . . . . . . . . . . . . . . . . . . . . . . . 25,681 0 0 25,681
¥43,192 ¥0 ¥0 ¥43,192
March 31, 2017
Millions of yen
TotalCarryingValue in
ConsolidatedBalanceSheets
Quoted Pricesin Active
Markets forIdentical
Assets(Level 1)
SignificantOther
ObservableInputs
(Level 2)
SignificantUnobservable
Inputs(Level 3)
Assets:Real estate collateral-dependent loans (net of allowance
for probable loan losses) . . . . . . . . . . . . . . . . . . . . . . . . . ¥12,472 ¥0 ¥0 ¥12,472Investment in operating leases and property under facility
operations . . . . . . . . . . . . . . . . . . . . . . . . . . . . . . . . . . . . . 22,525 0 0 22,525Certain investment in affiliates . . . . . . . . . . . . . . . . . . . . . . 15,726 0 0 15,726
¥50,723 ¥0 ¥0 ¥50,723
The following is a description of the valuation process and the main valuation methodologies used for assetsand liabilities measured at fair value:
Valuation process
The Company and its subsidiaries determine fair value of Level 3 assets and liabilities by using valuationtechniques, such as internally developed models, or using third-party pricing information. Internally developedmodels include the discounted cash flow methodologies and direct capitalization methodologies. To measure thefair value of the assets and liabilities, the Company and its subsidiaries select the valuation technique which bestreflects the nature, characteristics and risks of each asset and liability. The appropriateness of valuation methodsand unobservable inputs is verified when measuring fair values of the assets and liabilities by using internallydeveloped models. The Company and its subsidiaries also use third-party pricing information to measure the fairvalue of certain assets and liabilities. In that case, the Company and its subsidiaries verify the appropriateness ofthe prices by monitoring available information about the assets and liabilities, such as current conditions of theassets or liabilities, as well as surrounding market information. When these prices are determined to be able to
F-37

NOTES TO CONSOLIDATED FINANCIAL STATEMENTS—(Continued)
ORIX Corporation and Subsidiaries
reflect the nature, characteristics and risks of assets and liabilities reasonably, the Company and its subsidiariesuse these prices as fair value of the assets and liabilities.
Loans held for sale
Certain loans, which the Company and its subsidiaries have the intent and ability to sell to outside parties inthe foreseeable future, are considered held-for-sale. The loans held for sale in the Americas are classified asLevel 2, because the Company and its subsidiaries measure their fair value based on a market approach usinginputs other than quoted prices that are observable for the assets such as treasury rate, swap rate and marketspread.
Real estate collateral-dependent loans
The valuation allowance for large balance non-homogeneous loans is individually evaluated based on thepresent value of expected future cash flows, the loan’s observable market price or the fair value of the collateralsecuring the loans if the loans are collateral-dependent. According to ASC 820 (“Fair Value Measurement”),measurement for impaired loans determined using a present value technique is not considered a fair valuemeasurement. However, measurement for impaired loans determined using the loan’s observable market price orthe fair value of the collateral securing the collateral-dependent loans are fair value measurements and are subjectto the disclosure requirements for nonrecurring fair value measurements.
The Company and its subsidiaries determine the fair value of the real estate collateral of real estatecollateral-dependent loans using appraisals prepared by independent third party appraisers or our own staff ofqualified appraisers based on recent transactions involving sales of similar assets or other valuation techniquessuch as discounted cash flows methodologies using future cash flows estimated to be generated from operation ofthe existing assets or completion of development projects, as appropriate. The Company and its subsidiariesgenerally obtain a new appraisal once a fiscal year. In addition, the Company and its subsidiaries periodicallymonitor circumstances of the real estate collateral and then obtain a new appraisal in situations involving asignificant change in economic and/or physical conditions, which may materially affect the fair value of thecollateral. Real estate collateral-dependent loans whose fair values are estimated using appraisals of theunderlying collateral based on these valuation techniques are classified as Level 3 because such appraisalsinvolve unobservable inputs. These unobservable inputs contain discount rates and cap rates as well as futurecash flows estimated to be generated from real estate collateral. An increase (decrease) in the discount rate or caprate and a decrease (increase) in the estimated future cash flows would result in a decrease (increase) in the fairvalue of real estate collateral-dependent loans.
Investment in operating leases and property under facility operations and land and buildings undevelopedor under construction
Investment in operating leases measured at fair value is mostly real estate. The Company and its subsidiariesdetermine the fair value of investment in operating leases and property under facility operations and land andbuildings undeveloped or under construction using appraisals prepared by independent third party appraisers orthe Company’s own staff of qualified appraisers based on recent transactions involving sales of similar assets orother valuation techniques such as discounted cash flow methodologies using future cash flows estimated to begenerated from operation of the existing assets or completion of development projects, as appropriate. TheCompany and its subsidiaries classified the assets as Level 3 because such appraisals involve unobservableinputs. These unobservable inputs contain discount rates as well as future cash flows estimated to be generatedfrom the assets or projects. An increase (decrease) in the discount rate and a decrease (increase) in the estimatedfuture cash flows would result in a decrease (increase) in the fair value of investment in operating leases andproperty under facility operations and land and buildings undeveloped or under construction.
F-38

NOTES TO CONSOLIDATED FINANCIAL STATEMENTS—(Continued)
ORIX Corporation and Subsidiaries
Trading securities, Available-for-sale securities and Investment in affiliates
If active market prices are available, fair value measurement is based on quoted active market prices and,accordingly, these securities are classified as Level 1. If active market prices are not available, fair valuemeasurement is based on observable inputs other than quoted prices included within Level 1, such as prices forsimilar assets and accordingly these securities are classified as Level 2. If market prices are not available andthere are no observable inputs, then fair value is estimated by using valuation models including discounted cashflow methodologies and broker quotes. Such securities are classified as Level 3, as the valuation models andbroker quotes are based on inputs that are unobservable in the market. If fair value is based on broker quotes, theCompany and its subsidiaries check the validity of received prices based on comparison to prices of other similarassets and market data such as relevant bench mark indices.
The Company and its subsidiaries classified CMBS and RMBS in the Americas and other asset-backedsecurities as Level 2 if the inputs such as trading price and/or bid price are observable. The Company and itssubsidiaries classified CMBS and RMBS in the Americas and other asset-backed securities as Level 3 if thecompany and subsidiaries evaluate the fair value based on the unobservable inputs. In determining whether theinputs are observable or unobservable, the Company and its subsidiaries evaluate various factors such as the lackof recent transactions, price quotations that are not based on current information or vary substantially over timeor among market makers, a significant increase in implied risk premium, a wide bid-ask spread, significantdecline in new issuances, little or no public information (e.g. a principal-to-principal market) and other factors.With respect to certain CMBS and RMBS in the Americas and other asset-backed securities, the Company andits subsidiaries judged that there has been increased overall trading activity, and the Company and its subsidiariesclassified these securities as Level 2 for those securities that were measured at fair value based on the observableinputs such as trading price and/or bit price. But for those securities that lacked observable trades because theyare older vintage or below investment grade securities, the Company and its subsidiaries limit the reliance onindependent pricing service vendors and brokers. As a result, the Company and its subsidiaries establishedinternally developed pricing models using valuation techniques such as discounted cash flow model usingLevel 3 inputs in order to estimate fair value of these securities and classified them as Level 3. Under the models,the Company and its subsidiaries use anticipated cash flows of the security discounted at a risk-adjusted discountrate that incorporates our estimate of credit risk and liquidity risk that a market participant would consider. Thecash flows are estimated based on a number of assumptions such as default rate and prepayment speed, as well asseniority of the security. An increase (decrease) in the discount rate or default rate would result in a decrease(increase) in the fair value of CMBS and RMBS in the Americas and other asset-backed securities.
The Company and its subsidiaries classified the specified bonds as Level 3 because the Company and itssubsidiaries measure their fair value using unobservable inputs. Since the specified bonds are not traded in anopen market, no relevant observable market data is available. Accordingly the Company and its subsidiaries usethe discounted cash flow methodologies that incorporates significant unobservable inputs to measure their fairvalue. When evaluating the specified bonds issued by SPEs in Japan, the Company and its subsidiaries estimatethe fair value by discounting future cash flows using a discount rate based on market interest rates and a riskpremium. The future cash flows for the specified bonds issued by the SPEs in Japan are estimated based oncontractual principal and interest repayment schedules on each of the specified bonds issued by the SPEs inJapan. Since the discount rate is not observable for the specified bonds, the Company and its subsidiaries use aninternally developed model to estimate a risk premium considering the value of the real estate collateral (whichalso involves unobservable inputs in many cases when using valuation techniques such as discounted cash flowmethodologies) and the seniority of the bonds. Under the model, the Company and its subsidiaries consider theloan-to-value ratio and other relevant available information to reflect both the credit risk and the liquidity risk inour own estimate of the risk premium. Generally, the higher the loan-to-value ratio, the larger the risk premiumthe Company and its subsidiaries estimate under the model. The fair value of the specified bonds issued by SPEs
F-39

NOTES TO CONSOLIDATED FINANCIAL STATEMENTS—(Continued)
ORIX Corporation and Subsidiaries
in Japan rises when the fair value of the collateral real estate rises and the discount rate declines. The fair value ofthe specified bonds issued by SPEs in Japan declines when the fair value of the collateral real estate declines andthe discount rate rises.
Investment funds
Certain subsidiaries elected the fair value option for investments in some funds. These investment funds forwhich the fair value option is elected are classified as Level 3, because the subsidiaries measure their fair valueusing discounting to net asset value based on inputs that are unobservable in the market. A certain subsidiarymeasures its investment held by the investment company which is owned by the subsidiary at fair value.
Derivatives
For exchange-traded derivatives, fair value is based on quoted market prices, and accordingly, classified asLevel 1. For non-exchange traded derivatives, fair value is based on commonly used models and discounted cashflow methodologies. If the inputs used for these measurements including yield curves and volatilities, areobservable, the Company and its subsidiaries classify it as Level 2. If the inputs are not observable, the Companyand its subsidiaries classify it as Level 3. These unobservable inputs contain discount rates. An increase(decrease) in the discount rate would result in a decrease (increase) in the fair value of derivatives.
Reinsurance recoverables
Certain subsidiaries have elected the fair value option for certain reinsurance contracts related to variableannuity and variable life insurance contracts to partially offset the changes in fair value recognized in earnings ofthe policy liabilities and policy account balances attributable to the changes in the minimum guarantee risks ofthe variable annuity and variable life insurance contracts. These reinsurance contracts for which the fair valueoption is elected are classified as Level 3 because the subsidiaries measure their fair value using discounted cashflow methodologies based on inputs that are unobservable in the market.
Contingent consideration
The Company will be required to pay certain contingent consideration described in Note 3 “Acquisitionsand divestitures” depending on the future performance of a certain asset management business of the acquiredsubsidiary, and the Company recognizes a liability for the contingent consideration at its estimated fair value.The fair value of the contingent consideration is classified as Level 3 because the Company measures its fairvalue using a Monte Carlo model based on inputs that are unobservable in the market.
Variable annuity and variable life insurance contracts
A certain subsidiary has elected the fair value option for the entire variable annuity and variable lifeinsurance contracts held in order to match earnings recognized for changes in fair value of policy liabilities andpolicy account balances with the earnings recognized for gains or losses from the investment assets managed onbehalf of variable annuity and variable life policyholders, derivative contracts and changes in fair value ofreinsurance contracts. The changes in fair value of the variable annuity and variable life insurance contracts arelinked to the fair value of the investment in securities managed on behalf of variable annuity and variable lifepolicyholders. These securities consist mainly of equity securities traded in the market and are categorized astrading securities. In addition, variable annuity and variable life insurance contracts are exposed to the minimumguarantee risk, and the subsidiary adjusts the fair value of the underlying investments by incorporating changes
F-40

NOTES TO CONSOLIDATED FINANCIAL STATEMENTS—(Continued)
ORIX Corporation and Subsidiaries
in fair value of the minimum guarantee risk in the evaluation of the fair value of the entire variable annuity andvariable life insurance contracts. The variable annuity and variable life insurance contracts for which the fairvalue option is elected are classified as Level 3 because the subsidiary measures the fair value using discountedcash flow methodologies based on inputs that are unobservable in the market.
F-41

NOTES TO CONSOLIDATED FINANCIAL STATEMENTS—(Continued)
ORIX Corporation and Subsidiaries
Information about Level 3 Fair Value Measurements
The following tables provide information about the valuation techniques and significant unobservable inputsused in the valuation of Level 3 assets and liabilities measured at fair value on a recurring basis as of March 31,2016 and 2017.
March 31, 2016
Millions ofyen
Valuation technique(s)Significant
unobservable inputsRange
(Weighted average)Fair value
Assets:Available-for-sale securities
Corporate debt securities . . . . . . . . . . ¥ 5 Appraisals/Broker quotes — —Specified bonds issued by SPEs in
Japan . . . . . . . . . . . . . . . . . . . . . . . 806 Discounted cash flows Discount rate 0.9%(0.9%)
2,655 Appraisals/Broker quotes — —CMBS and RMBS in the
Americas . . . . . . . . . . . . . . . . . . . . 38,493 Discounted cash flows Discount rate 6.4% – 32.4%(18.5%)
Probability of default 0.0% – 34.0%(8.2%)
Other asset-backed securities anddebt securities . . . . . . . . . . . . . . . . 7,432 Discounted cash flows Discount rate 1.0% – 32.4%
(12.7%)Probability of default 0.7% – 1.1%
(0.9%)50,131 Appraisals/Broker quotes — —
Other securitiesInvestment funds . . . . . . . . . . . . . . . . 10,152 Internal cash flows Discount rate 10.0% – 40.0%
(13.6%)7,599 Appraisals/Broker quotes — —
Derivative assetsOptions held/written and other . . . . . . 4,876 Discounted cash flows Discount rate 10.0% – 15.0%
(11.7%)3,332 Appraisals/Broker quotes — —
Other assetsReinsurance recoverables . . . . . . . . . 37,855 Discounted cash flows Discount rate (0.2)% – 0.5%
(0.1%)Mortality rate 0.0% – 100.0%
(0.9%)Lapse rate 1.5% – 54.0%
(15%)Annuitization rate(guaranteed minimumannuity benefit) 0.0% – 100.0%
(99.4%)
Total . . . . . . . . . . . . . . . . . . . . . . ¥163,336
Liabilities:Policy liabilities and Policy Account
BalancesValuable annuity and variable life
insurance contracts . . . . . . . . . . . . . ¥795,001 Discounted cash flows Discount rate (0.2)% – 0.5%(0.1%)
Mortality rate 0.0% – 100.0%(1.0%)
Lapse rate 1.5% – 54.0%(14.5%)
Annuitization rate(guaranteed minimumannuity benefit) 0.0% – 100.0%
(85.2%)
Total . . . . . . . . . . . . . . . . . . . . . . ¥795,001
F-42

NOTES TO CONSOLIDATED FINANCIAL STATEMENTS—(Continued)
ORIX Corporation and Subsidiaries
March 31, 2017
Millions ofyen
Valuation technique(s)Significant
unobservable inputsRange
(Weighted average)Fair value
Assets:Available-for-sale securities
Corporate debt securities . . . . . . . . . . ¥ 1,613 Discounted cash flows Discount rate 0.5% – 1.6%(1.1%)
5 Appraisals/Broker quotes — —Specified bonds issued by SPEs in
Japan . . . . . . . . . . . . . . . . . . . . . . . 1,087 Appraisals/Broker quotes — —CMBS and RMBS in the
Americas . . . . . . . . . . . . . . . . . . . . 57,858 Discounted cash flows Discount rate 6.4% – 22.6%(18.0%)
Probability of default 0.0% – 26.4%(3.6%)
Other asset-backed securities anddebt securities . . . . . . . . . . . . . . . . 13,890 Discounted cash flows Discount rate 1.0% – 51.2%
(8.9%)Probability of default 0.6% – 11.0%
(0.8%)50,063 Appraisals/Broker quotes — —
Other securitiesInvestment funds . . . . . . . . . . . . . . . . 11,202 Internal cash flows Discount rate 0.0% – 40.0%
(10.0%)894 Discounted cash flows Discount rate 5.4% – 10.0%
(8.6%)15,705 Appraisals/Broker quotes — —
Derivative assetsOptions held/written and other . . . . . . 3,525 Discounted cash flows Discount rate 10.0% – 15.0%
(11.7%)1,708 Appraisals/Broker quotes — —
Other assetsReinsurance recoverables . . . . . . . . . 22,116 Discounted cash flows Discount rate (0.1)% – 0.5%
(0.1%)Mortality rate 0.0% – 100.0%
(1.0%)Lapse rate 1.5% – 54.0%
(14.9%)Annuitization rate(guaranteed minimumannuity benefit) 0.0% – 100.0%
(99.2%)
Total . . . . . . . . . . . . . . . . . . . . . . ¥179,666
Liabilities:Policy liabilities and Policy Account
BalancesValuable annuity and variable life
insurance contracts . . . . . . . . . . . . . ¥605,520 Discounted cash flows Discount rate (0.1)% – 0.5%(0.1%)
Mortality rate 0.0% – 100.0%(1.0%)
Lapse rate 1.5% – 54.0%(14.7%)
Annuitization rate(guaranteed minimumannuity benefit) 0.0% – 100.0%
(82.7%)
Total . . . . . . . . . . . . . . . . . . . . . . ¥605,520
F-43

NOTES TO CONSOLIDATED FINANCIAL STATEMENTS—(Continued)
ORIX Corporation and Subsidiaries
The following tables provide information about the valuation techniques and significant unobservable inputsused in the valuation of Level 3 assets measured at fair value on a nonrecurring basis as of March 31, 2016 and2017.
March 31, 2016
Millions ofyen Significant
unobservableinputs
Range(Weighted average)Fair value Valuation technique(s)
Assets:Real estate collateral-dependent loans (net
of allowance for probable loanlosses) . . . . . . . . . . . . . . . . . . . . . . . . . . ¥ 17,511 Discounted cash flows Discount rate 5.3% – 10.9%
(9.3%)Direct capitalization Capitalization rate 5.9% – 17.0%
(9.9%)Investment in operating leases and
property under facility operations . . . . . 5,679 Discounted cash flows Discount rate 5.3% – 10.0%(5.5%)
20,002 Appraisals — —
¥ 43,192
March 31, 2017
Millions ofyen Significant
unobservableinputs
Range(Weighted average)Fair value Valuation technique(s)
Assets:Real estate collateral-dependent loans
(net of allowance for probable loanlosses) . . . . . . . . . . . . . . . . . . . . . . . ¥12,472 Discounted cash flows Discount rate 10.0% – 10.7%
(10.5%)Direct capitalization Capitalization rate 10.3% – 11.2%
(10.9%)Investment in operating leases and
property under facility operations . . . . . 204 Direct capitalization Capitalization rate 8.5% – 10.0%(8.7%)
1,381 Discounted cash flows Discount rate 6.8% – 10.2%(9.0%)
20,940 Appraisals — —Certain investment in affiliates . . . . . . . . . 15,726 Market price method — —
¥ 50,723Business enterprise valuemultiples — —
The Company and its subsidiaries generally use discounted cash flow methodologies or similar internallydeveloped models to determine the fair value of Level 3 assets and liabilities. Use of these techniques requiresdetermination of relevant inputs and assumptions, some of which represent significant unobservable inputs asindicated in the preceding table. Accordingly, changes in these unobservable inputs may have a significantimpact on the fair value.
Certain of these unobservable inputs will have a directionally consistent impact on the fair value of the assetor liability for a given change in that input. Alternatively, the fair value of the asset or liability may move in
F-44

NOTES TO CONSOLIDATED FINANCIAL STATEMENTS—(Continued)
ORIX Corporation and Subsidiaries
an opposite direction for a given change in another input. Where multiple inputs are used within the valuationtechnique of an asset or liability, a change in one input in a certain direction may be offset by an opposite changein another input having a potentially muted impact to the overall fair value of that particular asset or liability.Additionally, a change in one unobservable input may result in a change to another unobservable input (that is,changes in certain inputs are interrelated to one another), which may counteract or magnify the fair value impact.
For more analysis of the sensitivity of each input, see the description of the valuation process and the mainvaluation methodologies used for assets and liabilities measured at fair value.
3. Acquisitions and divestitures
(1) Robeco Groep N.V. acquisition
On July 1, 2013, the Company acquired approximately 90.01% of the total voting equity interests of RobecoGroep N.V. (Head office: Rotterdam, the Netherlands, hereinafter, “Robeco”) from Coöperatieve CentraleRaiffeisen-Boerenleenbank B.A. (Head office: Utrecht, the Netherlands). As a result, Robeco has become aconsolidated subsidiary of the Company. Furthermore, the Company acquired additional voting equity interestsof Robeco during fiscal 2017. Therefore, Robeco has become the Company’s wholly owned subsidiary. Robeco,a mid-size global asset manager, offers a mix of investment solutions in a broad range of strategies toinstitutional and private investors worldwide.
In accordance with the share purchase agreement, the Company agreed to pay contingent considerationdepending on the future performance of a certain section of asset management business for each of Robeco’sfiscal years until the fiscal year ending in December 2015. The estimated fair value of such contingentconsideration was ¥5,176 million, which is included in the total consideration transferred. During fiscal 2017, theCompany settled ¥2,398 million which had been included in trade notes, accounts and other payable in theCompany’s consolidated balance sheets as of March 31, 2016.
(2) Hartford Life Insurance K.K. acquisition
On July 1, 2014, the Company’s wholly owned subsidiary, ORIX Life Insurance Corporation (hereinafter,“ORIX Life Insurance”), acquired the entire outstanding shares of Hartford Life Insurance K.K. (Head office:Minato-ku, Tokyo, Japan, Business description: Life insurance business and reinsurance business, hereinafter,“HLIKK”), a subsidiary of The Hartford Financial Services Group, Inc. in accordance with the share purchaseagreement executed between the Company and Hartford Life, Inc. (Head office: Simsbury, Connecticut, U.S.A.),a subsidiary of The Hartford Financial Services Group, Inc. as of April 28, 2014 in order to enhance its capitalstrength and improve the soundness of its management, in view of accelerating its growth. As a result, HLIKKhas become a consolidated subsidiary of the Company. HLIKK has discontinued selling insurance products sinceJune 2009.
In addition, on July 1, 2015, HLIKK was merged into ORIX Life Insurance.
The total cost of acquisition consideration was ¥98,355 million, of which cost, ¥97,676 million was paid incash on July 1, 2014. In addition, an additional consideration of ¥679 million was paid in cash on December 3,2014, as a result of the acquisition price adjustment calculated based on HLIKK’s net assets as of June 30, 2014pursuant to the share purchase agreement.
Transaction costs were ¥224 million and ¥1,217 million for fiscal 2014 and 2015, respectively, and areincluded in selling, general and administrative expenses in the Company’s consolidated statements of income.
F-45

NOTES TO CONSOLIDATED FINANCIAL STATEMENTS—(Continued)
ORIX Corporation and Subsidiaries
The Company allocated the acquisition consideration to HLIKK’s respective assets acquired and liabilitiesassumed, and recorded the identified assets and liabilities based on their fair values at the acquisition date by theacquisition method of accounting.
The company finalized the purchase price allocation during fiscal 2016. As a result, the following tableprovides fair value amounts allocated to assets acquired and liabilities assumed of HLIKK.
Millions of yen
Fair value amounts ofassets, liabilities
Cash and Cash Equivalents . . . . . . . . . . . . . . . . . . . . . . . . . . . . . . . . . . . . . . . . . . . . . . . . . . . . ¥ 69,244Installment Loans . . . . . . . . . . . . . . . . . . . . . . . . . . . . . . . . . . . . . . . . . . . . . . . . . . . . . . . . . . . 282Investment in Securities . . . . . . . . . . . . . . . . . . . . . . . . . . . . . . . . . . . . . . . . . . . . . . . . . . . . . . 1,847,536Trade Notes, Accounts and Other Receivable . . . . . . . . . . . . . . . . . . . . . . . . . . . . . . . . . . . . . 66,340Office Facilities . . . . . . . . . . . . . . . . . . . . . . . . . . . . . . . . . . . . . . . . . . . . . . . . . . . . . . . . . . . . . 351Other Assets . . . . . . . . . . . . . . . . . . . . . . . . . . . . . . . . . . . . . . . . . . . . . . . . . . . . . . . . . . . . . . . 319,244
Total Assets . . . . . . . . . . . . . . . . . . . . . . . . . . . . . . . . . . . . . . . . . . . . . . . . . . . . . . . . . . . . 2,302,997
Short-Term Debt . . . . . . . . . . . . . . . . . . . . . . . . . . . . . . . . . . . . . . . . . . . . . . . . . . . . . . . . . . . . 25,000Trade Notes, Accounts and Other Payable . . . . . . . . . . . . . . . . . . . . . . . . . . . . . . . . . . . . . . . . 3,979Policy Liabilities and Policy Account Balances . . . . . . . . . . . . . . . . . . . . . . . . . . . . . . . . . . . . 2,125,257Current and Deferred Income Taxes . . . . . . . . . . . . . . . . . . . . . . . . . . . . . . . . . . . . . . . . . . . . . 8,413Other Liabilities . . . . . . . . . . . . . . . . . . . . . . . . . . . . . . . . . . . . . . . . . . . . . . . . . . . . . . . . . . . . . 5,911
Total Liabilities . . . . . . . . . . . . . . . . . . . . . . . . . . . . . . . . . . . . . . . . . . . . . . . . . . . . . . . . . 2,168,560
Net . . . . . . . . . . . . . . . . . . . . . . . . . . . . . . . . . . . . . . . . . . . . . . . . . . . . . . . . . . . . . . . 134,437
Fair value of Consideration transferred . . . . . . . . . . . . . . . . . . . . . . . . . . . . . . . . . . . . . . . 98,355
Bargain purchase gain . . . . . . . . . . . . . . . . . . . . . . . . . . . . . . . . . . . . . . . . . . . . . . . . ¥ 36,082
In connection with this acquisition, the Company recognized the identifiable assets acquired and theliabilities assumed at their fair value, and recognized an excess of the fair value of the net assets acquired overthe fair value of the consideration transferred as a bargain purchase gain of ¥36,082 million for fiscal 2015,which is separately reported in the consolidated statements of income.
The following unaudited supplemental pro forma financial information presents the combined results ofoperations of the Company and its subsidiaries as though the acquisition had occurred as of April 1, 2013, thebeginning of fiscal 2014:
Millions of yen
2015
Total revenues . . . . . . . . . . . . . . . . . . . . . . . . . . . . . . . . . . . . . . . . . . . . . . . . . . . . . . . . . . . . . . ¥2,220,805Income from Continuing Operations . . . . . . . . . . . . . . . . . . . . . . . . . . . . . . . . . . . . . . . . . . . . . 259,239
Total revenues and income from continuing operations of HLIKK included in the Company’s consolidatedstatements of income for fiscal 2015 are ¥196,883 million and ¥4,597 million, respectively.
The unaudited supplemental pro forma financial information is based on estimates and assumptions, that theCompany believes are reasonable and should not be taken as indicative of what the Company’s consolidatedfinancial results would have been had the acquisition been completed on that date. The Company elected the fairvalue option to account for variable annuity insurance contracts at the acquisition date; however, it cannot
F-46

NOTES TO CONSOLIDATED FINANCIAL STATEMENTS—(Continued)
ORIX Corporation and Subsidiaries
reasonably calculate their fair values prior to the acquisition date as if the fair value option were retrospectivelyapplied. Thus, the unaudited supplemental pro forma financial information is prepared without applying the fairvalue option accounting.
(3) Other acquisitions
During fiscal 2015, the Company and its subsidiaries acquired entities other than HLIKK which wereindividually immaterial business combinations but were considered collectively material. The total cost of theacquisitions consideration was ¥102,621 million which was paid mainly in cash.
The Company allocated the acquisition consideration to the entities’ respective assets acquired andliabilities assumed, and records the identified assets, liabilities and noncontrolling interest based on their fairvalues at the acquisition date by the acquisition method of accounting. The fair value of noncontrolling interest isestimated based on the acquisition consideration taking into account an appraisal value using a binominal optionpricing model.
The Company finalized the purchase price allocation during fiscal 2016. As a result, the following tableprovides fair value amounts allocated to assets acquired and liabilities assumed of the acquired entities.
Millions of yen
Fair value amounts of assets,liabilities and noncontrolling interests
Cash and Cash Equivalents . . . . . . . . . . . . . . . . . . . . . . . . . . . . . . . . . . . . . . . . . ¥ 32,234Property under Facility Operations . . . . . . . . . . . . . . . . . . . . . . . . . . . . . . . . . . . 9,289Trade Notes, Accounts and Other Receivable . . . . . . . . . . . . . . . . . . . . . . . . . . . 37,359Inventories . . . . . . . . . . . . . . . . . . . . . . . . . . . . . . . . . . . . . . . . . . . . . . . . . . . . . . 21,249Office Facilities . . . . . . . . . . . . . . . . . . . . . . . . . . . . . . . . . . . . . . . . . . . . . . . . . . 3,250Other Assets . . . . . . . . . . . . . . . . . . . . . . . . . . . . . . . . . . . . . . . . . . . . . . . . . . . . . 158,370Other . . . . . . . . . . . . . . . . . . . . . . . . . . . . . . . . . . . . . . . . . . . . . . . . . . . . . . . . . . 1,359
Total Assets . . . . . . . . . . . . . . . . . . . . . . . . . . . . . . . . . . . . . . . . . . . . . . . . . 263,110
Short-Term Debt . . . . . . . . . . . . . . . . . . . . . . . . . . . . . . . . . . . . . . . . . . . . . . . . . 4,140Trade Notes, Accounts and Other Payable . . . . . . . . . . . . . . . . . . . . . . . . . . . . . 33,963Current and Deferred Income Taxes . . . . . . . . . . . . . . . . . . . . . . . . . . . . . . . . . . 24,457Long-Term Debt . . . . . . . . . . . . . . . . . . . . . . . . . . . . . . . . . . . . . . . . . . . . . . . . . 45,739Other Liabilities . . . . . . . . . . . . . . . . . . . . . . . . . . . . . . . . . . . . . . . . . . . . . . . . . . 26,165
Total Liabilities . . . . . . . . . . . . . . . . . . . . . . . . . . . . . . . . . . . . . . . . . . . . . . 134,464
Noncontrolling interests . . . . . . . . . . . . . . . . . . . . . . . . . . . . . . . . . . . . . . . . 26,025
Aggregate fair value of considerations transferred . . . . . . . . . . . . . . . ¥102,621
Goodwill with a value of ¥79,872 million and other intangible assets of ¥60,839 million that were identifiedin connection with the acquisitions are included in other assets in the Company’s consolidated balance sheet as ofMarch 31, 2016. The goodwill is calculated as the excess of considerations transferred and the fair value ofnoncontrolling interest over the net assets recognized at fair value. The Company calculated the amount ofgoodwill based on estimates of fair value of assets acquired, liabilities assumed and noncontrolling interest. Thegoodwill represents the future growth of the ORIX Group from new revenue streams arising from theconsolidation of the entities and synergies with the existing Company’s assets and businesses. The goodwill isnot deductible for tax purposes. The goodwill and other intangible assets recorded in connection with theacquisitions are included in the Corporate Financial Services segment, the Investment and Operation segmentand the Overseas Business segment.
F-47

NOTES TO CONSOLIDATED FINANCIAL STATEMENTS—(Continued)
ORIX Corporation and Subsidiaries
The following unaudited supplemental pro forma financial information presents the combined results ofoperations of the Company and its subsidiaries as though the acquisitions had occurred as of April 1, 2013, thebeginning of fiscal 2014:
Millions of yen
2015
Total revenues . . . . . . . . . . . . . . . . . . . . . . . . . . . . . . . . . . . . . . . . . . . . . . . . . . . . . . . . . . . . . . . . . . . ¥2,345,327Income from Continuing Operations . . . . . . . . . . . . . . . . . . . . . . . . . . . . . . . . . . . . . . . . . . . . . . . . . 255,219
Total revenues and income from continuing operations of newly consolidated subsidiaries included in theCompany’s consolidated statements of income for fiscal 2015 are ¥234,030 million and ¥5,033 million,respectively.
The unaudited supplemental pro forma financial information is based on estimates and assumptions, that theCompany believes are reasonable and should not be taken as indicative of what the Company’s consolidatedfinancial results would have been had the acquisition been completed on that date.
During fiscal 2016, the Company and its subsidiaries acquired entities for a total cost of the acquisitionconsideration of ¥51,786 million, which was paid mainly in cash. In accordance with the finalization of purchaseprice allocation during fiscal 2017, the amount of goodwill was ¥34,319 million and the goodwill is notdeductible for tax purposes. The amount of acquired intangible assets other than goodwill was ¥11,238 million.The acquisitions were mainly included in the Investment and Operation segment and the Overseas Businesssegment.
During fiscal 2017, the Company and its subsidiaries acquired entities for a total cost of the acquisitionconsideration of ¥97,090 million, which was paid mainly in cash. Goodwill initially recognized in thesetransactions amounted to ¥33,370 million and the goodwill is not deductible for tax purposes. The amount ofacquired intangible assets other than goodwill recognized in these transactions was ¥35,559 million. TheCompany reflected certain preliminary estimates with respect to the fair value of the underlying net assets ofthese entities in determining amounts of the goodwill. The amount of the goodwill and intangible assets otherthan goodwill could possibly be adjusted because certain of these acquisitions were made near the fiscal year-endand the purchase price allocations have not been completed yet. The acquisitions were mainly included in theInvestment and Operation segment and the Overseas Business segment.
The Company recognized a bargain purchase gain of ¥5,802 million associated with one of its acquisitionsin the Investment and Operation segment for fiscal 2017. The bargain purchase gain could possibly be adjustedbecause the purchase price allocation has not been completed yet.
The segment in which goodwill is allocated is disclosed in Note 13 “Goodwill and Other Intangible Assets.”
(4) Divestitures
Gains on sales of subsidiaries and affiliates and liquidation losses, net for fiscal 2015, 2016 and 2017amounted to ¥20,575 million, ¥57,867 million and ¥63,419 million, respectively. Gains on sales of subsidiariesand affiliates and liquidation losses, net for fiscal 2015 mainly consisted of ¥18,510 million in the OverseasBusiness segment. Gains on sales of subsidiaries and affiliates and liquidation losses, net for fiscal 2016 mainlyconsisted of ¥47,994 million in the Overseas Business segment and ¥9,145 million in the Investment andOperation segment. Gains on sales of subsidiaries and affiliates and liquidation losses, net for fiscal 2017 mainly
F-48

NOTES TO CONSOLIDATED FINANCIAL STATEMENTS—(Continued)
ORIX Corporation and Subsidiaries
consisted of ¥30,583 million in the Overseas Business segment, ¥29,378 million in the Investment and Operationsegment, and ¥2,234 million in the Corporate Financial Services segment. The details of significant divestituresare as follows.
During fiscal 2015, the Company sold 71.9% of the common shares of a consolidated subsidiary, STXEnergy Co., Ltd. (presently GS E&R Corp., hereinafter, “STX Energy”) to a third-party. The Company retains a25% interest in STX Energy, which became an equity method affiliate from fiscal 2015. The sale of thecontrolling interest resulted in a gain of ¥14,883 million, and the remeasurement of the retained interest to its fairvalue resulted in a gain of ¥1,329 million, both of which were included in earnings as gains on sales ofsubsidiaries and affiliates and liquidation losses, net during fiscal 2015. The fair value of the retained interest wasremeasured based on the sale proceed adjusted for a control premium.
During fiscal 2016, ORIX USA Corporation (hereinafter, “ORIX USA”), a wholly owned subsidiary of theCompany, sold 14.7% of its shares of Class A common stock of Houlihan Lokey, Inc. (hereinafter, “HoulihanLokey”), a subsidiary of ORIX USA, through the initial public offering (hereinafter, “IPO”), concurrentlyallotting its shares to Houlihan Lokey’s management and other employees. ORIX USA retained a 33.0% interestin Houlihan Lokey’s Class B common stock and thus Houlihan Lokey became an equity method investee duringfiscal 2016. The partial sale of the ownership interest resulted in a gain of ¥10,498 million, and theremeasurement of the retained interest to its fair value due to a loss of control resulted in a gain of¥29,087 million, both of which were included in earnings as gains on sales of subsidiaries and affiliates andliquidation losses, net for fiscal 2016. The fair value of the retained interest was remeasured based on the saleprice in the IPO.
During fiscal 2017, gains on the sale of a subsidiary that runs the automotive supply wholesale business ofORIX USA were included in the amount of ¥30,583 million of gains on sales of subsidiaries and affiliates andliquidation losses, net in the Overseas Business segment.
4. Cash Flow Information
Cash payments during fiscal 2015, 2016 and 2017 are as follows:
Millions of yen
2015 2016 2017
Cash payments:Interest . . . . . . . . . . . . . . . . . . . . . . . . . . . . . . . . . . . . . . . . . . . . . . . . . . . . . . . . ¥76,755 ¥77,321 ¥71,280Income taxes, net . . . . . . . . . . . . . . . . . . . . . . . . . . . . . . . . . . . . . . . . . . . . . . . . 83,462 31,046 50,813
Non-cash activities in fiscal 2015, 2016 and 2017 are as follows.
In fiscal 2015, 2016 and 2017, real estate under operating leases of ¥4,042 million, ¥15,963 million and¥1,273 million, respectively, were recognized with the corresponding amounts of installment loans andinvestment in securities being derecognized as a result of acquiring real estate collateral.
In fiscal 2015, assets and liabilities decreased by ¥7,450 million and ¥9,279 million, respectively, in theCompany’s consolidated balance sheet due to deconsolidation of certain VIEs which had been consolidated by asubsidiary. In fiscal 2016, assets and liabilities decreased by ¥7,234 million and ¥12,181 million, respectively, inthe Company’s consolidated balance sheet due to deconsolidation of certain VIEs which had been consolidatedby a subsidiary. The derecognized assets mainly consist of installment loans, and the derecognized liabilities
F-49

NOTES TO CONSOLIDATED FINANCIAL STATEMENTS—(Continued)
ORIX Corporation and Subsidiaries
mainly consist of long-term debt. Derecognition of these assets and liabilities were not included in cash flowsfrom investing activities or financing activities in the consolidated statements of cash flows because they did notinvolve cash transactions.
In addition, the Company and its subsidiaries recognized identifiable assets acquired and liabilities assumedat their fair values in connection with the acquisitions, details of which are provided in Note 3 “Acquisitions anddivestitures.”
5. Investment in Direct Financing Leases
Investment in direct financing leases at March 31, 2016 and 2017 consists of the following:
Millions of yen
2016 2017
Total Minimum lease payments to be received . . . . . . . . . . . . . . . . . . . . . . . . . . . . . . . . ¥1,366,454 ¥1,369,120Less : Estimated executory costs . . . . . . . . . . . . . . . . . . . . . . . . . . . . . . . . . . . . . . . . . . . (57,600) (56,470)Minimum lease payments receivable . . . . . . . . . . . . . . . . . . . . . . . . . . . . . . . . . . . . . . . 1,308,854 1,312,650Estimated residual value . . . . . . . . . . . . . . . . . . . . . . . . . . . . . . . . . . . . . . . . . . . . . . . . . 31,338 35,413Initial direct costs . . . . . . . . . . . . . . . . . . . . . . . . . . . . . . . . . . . . . . . . . . . . . . . . . . . . . . 5,557 5,893Unearned lease income . . . . . . . . . . . . . . . . . . . . . . . . . . . . . . . . . . . . . . . . . . . . . . . . . . (155,613) (149,932)
¥1,190,136 ¥1,204,024
Minimum lease payments receivable are due in periodic installments through fiscal 2037. At March 31,2017, the amounts due in each of the next five years and thereafter are as follows:
Years ending March 31, Millions of yen
2018 . . . . . . . . . . . . . . . . . . . . . . . . . . . . . . . . . . . . . . . . . . . . . . . . . . . . . . . . . . . . . . . . . . . . . . . . . . . ¥ 439,6702019 . . . . . . . . . . . . . . . . . . . . . . . . . . . . . . . . . . . . . . . . . . . . . . . . . . . . . . . . . . . . . . . . . . . . . . . . . . . 314,7002020 . . . . . . . . . . . . . . . . . . . . . . . . . . . . . . . . . . . . . . . . . . . . . . . . . . . . . . . . . . . . . . . . . . . . . . . . . . . 236,2782021 . . . . . . . . . . . . . . . . . . . . . . . . . . . . . . . . . . . . . . . . . . . . . . . . . . . . . . . . . . . . . . . . . . . . . . . . . . . 136,8132022 . . . . . . . . . . . . . . . . . . . . . . . . . . . . . . . . . . . . . . . . . . . . . . . . . . . . . . . . . . . . . . . . . . . . . . . . . . . 77,115Thereafter . . . . . . . . . . . . . . . . . . . . . . . . . . . . . . . . . . . . . . . . . . . . . . . . . . . . . . . . . . . . . . . . . . . . . . 108,074
Total . . . . . . . . . . . . . . . . . . . . . . . . . . . . . . . . . . . . . . . . . . . . . . . . . . . . . . . . . . . . . . . . . . . . . . ¥1,312,650
Included in finance revenues in the consolidated statements of income are direct financing leases revenuesof ¥61,116 million, ¥65,365 million and ¥56,349 million for fiscal 2015, 2016 and 2017, respectively.
Gains and losses from the disposition of direct financing lease assets, which were included in financerevenues, were not material for fiscal 2015, 2016 and 2017.
F-50

NOTES TO CONSOLIDATED FINANCIAL STATEMENTS—(Continued)
ORIX Corporation and Subsidiaries
6. Investment in Operating Leases
Investment in operating leases at March 31, 2016 and 2017 consists of the following:
Millions of yen
2016 2017
Transportation equipment . . . . . . . . . . . . . . . . . . . . . . . . . . . . . . . . . . . . . . . . . . . . . . . . ¥1,076,697 ¥1,144,511Measuring and information-related equipment . . . . . . . . . . . . . . . . . . . . . . . . . . . . . . . . 239,262 237,597Real estate . . . . . . . . . . . . . . . . . . . . . . . . . . . . . . . . . . . . . . . . . . . . . . . . . . . . . . . . . . . . 531,155 451,367Other . . . . . . . . . . . . . . . . . . . . . . . . . . . . . . . . . . . . . . . . . . . . . . . . . . . . . . . . . . . . . . . . 21,343 23,414
1,868,457 1,856,889Accumulated depreciation . . . . . . . . . . . . . . . . . . . . . . . . . . . . . . . . . . . . . . . . . . . . . . . . (542,868) (566,946)
Net . . . . . . . . . . . . . . . . . . . . . . . . . . . . . . . . . . . . . . . . . . . . . . . . . . . . . . . . . . . . . . 1,325,589 1,289,943Accrued rental receivables . . . . . . . . . . . . . . . . . . . . . . . . . . . . . . . . . . . . . . . . . . . . . . . 23,610 23,221
¥1,349,199 ¥1,313,164
For fiscal 2015, 2016 and 2017, gains from the disposition of real estate under operating leases included inoperating lease revenues are ¥16,338 million, ¥18,768 million and ¥53,004 million, respectively, and gains fromthe disposition of operating lease assets other than real estate included in operating lease revenues are¥18,087 million, ¥19,572 million and ¥16,261 million, respectively.
Costs of operating leases include depreciation and various expenses (insurance, property tax and other).Depreciation and various expenses for fiscal 2015, 2016 and 2017 are as follows:
Millions of yen
2015 2016 2017
Depreciation expenses . . . . . . . . . . . . . . . . . . . . . . . . . . . . . . . . . . . . ¥177,038 ¥184,768 ¥185,277Various expenses . . . . . . . . . . . . . . . . . . . . . . . . . . . . . . . . . . . . . . . . 61,119 60,301 58,260
¥238,157 ¥245,069 ¥243,537
The operating lease contracts include non-cancelable lease terms that range up to 20 years at March 31,2017. The minimum future rentals on non-cancelable operating leases due in each of the next five years andthereafter are as follows:
Years ending March 31, Millions of yen
2018 . . . . . . . . . . . . . . . . . . . . . . . . . . . . . . . . . . . . . . . . . . . . . . . . . . . . . . . . . . . . . . . . . . . . . . . . . . . ¥206,7772019 . . . . . . . . . . . . . . . . . . . . . . . . . . . . . . . . . . . . . . . . . . . . . . . . . . . . . . . . . . . . . . . . . . . . . . . . . . . 141,2932020 . . . . . . . . . . . . . . . . . . . . . . . . . . . . . . . . . . . . . . . . . . . . . . . . . . . . . . . . . . . . . . . . . . . . . . . . . . . 99,7642021 . . . . . . . . . . . . . . . . . . . . . . . . . . . . . . . . . . . . . . . . . . . . . . . . . . . . . . . . . . . . . . . . . . . . . . . . . . . 64,7672022 . . . . . . . . . . . . . . . . . . . . . . . . . . . . . . . . . . . . . . . . . . . . . . . . . . . . . . . . . . . . . . . . . . . . . . . . . . . 39,853Thereafter . . . . . . . . . . . . . . . . . . . . . . . . . . . . . . . . . . . . . . . . . . . . . . . . . . . . . . . . . . . . . . . . . . . . . . 55,866
Total . . . . . . . . . . . . . . . . . . . . . . . . . . . . . . . . . . . . . . . . . . . . . . . . . . . . . . . . . . . . . . . . . . . . . . ¥608,320
F-51

NOTES TO CONSOLIDATED FINANCIAL STATEMENTS—(Continued)
ORIX Corporation and Subsidiaries
7. Installment Loans
The composition of installment loans by domicile and type of borrower at March 31, 2016 and 2017 is asfollows:
Millions of yen
2016 2017
Borrowers in Japan:Consumer—
Housing loans . . . . . . . . . . . . . . . . . . . . . . . . . . . . . . . . . . . . . . . . . . . . . . . . . ¥1,122,088 ¥1,261,571Card loans . . . . . . . . . . . . . . . . . . . . . . . . . . . . . . . . . . . . . . . . . . . . . . . . . . . . 260,533 270,007Other . . . . . . . . . . . . . . . . . . . . . . . . . . . . . . . . . . . . . . . . . . . . . . . . . . . . . . . . 23,466 28,668
1,406,087 1,560,246
Corporate—Real estate companies . . . . . . . . . . . . . . . . . . . . . . . . . . . . . . . . . . . . . . . . . . . 230,001 270,965Non-recourse loans . . . . . . . . . . . . . . . . . . . . . . . . . . . . . . . . . . . . . . . . . . . . . 19,951 12,758Commercial, industrial and other companies . . . . . . . . . . . . . . . . . . . . . . . . . 365,371 340,050
615,323 623,773
Overseas:Non-recourse loans . . . . . . . . . . . . . . . . . . . . . . . . . . . . . . . . . . . . . . . . . . . . . 61,260 75,968Commercial, industrial companies and other . . . . . . . . . . . . . . . . . . . . . . . . . 479,039 530,924
540,299 606,892Purchased loans* . . . . . . . . . . . . . . . . . . . . . . . . . . . . . . . . . . . . . . . . . . . . . . . 30,524 24,795
¥2,592,233 ¥2,815,706
* Purchased loans represent loans with evidence of deterioration of credit quality since origination and for whichit is probable at acquisition that collection of all contractually required payments from the debtors is unlikely.
Generally, installment loans are made under agreements that require the borrower to provide collateral orguarantors.
At March 31, 2017, the contractual maturities of installment loans (except purchased loans) for each of thenext five years and thereafter are as follows:
Years ending March 31, Millions of yen
2018 . . . . . . . . . . . . . . . . . . . . . . . . . . . . . . . . . . . . . . . . . . . . . . . . . . . . . . . . . . . . . . . . . . . . . . . . . . . ¥ 473,6902019 . . . . . . . . . . . . . . . . . . . . . . . . . . . . . . . . . . . . . . . . . . . . . . . . . . . . . . . . . . . . . . . . . . . . . . . . . . . 308,8732020 . . . . . . . . . . . . . . . . . . . . . . . . . . . . . . . . . . . . . . . . . . . . . . . . . . . . . . . . . . . . . . . . . . . . . . . . . . . 256,9672021 . . . . . . . . . . . . . . . . . . . . . . . . . . . . . . . . . . . . . . . . . . . . . . . . . . . . . . . . . . . . . . . . . . . . . . . . . . . 223,0302022 . . . . . . . . . . . . . . . . . . . . . . . . . . . . . . . . . . . . . . . . . . . . . . . . . . . . . . . . . . . . . . . . . . . . . . . . . . . 189,921Thereafter . . . . . . . . . . . . . . . . . . . . . . . . . . . . . . . . . . . . . . . . . . . . . . . . . . . . . . . . . . . . . . . . . . . . . . 1,338,430
Total . . . . . . . . . . . . . . . . . . . . . . . . . . . . . . . . . . . . . . . . . . . . . . . . . . . . . . . . . . . . . . . . . . . . . . ¥2,790,911
Included in finance revenues in the consolidated statements of income is interest income on loans of¥110,390 million, ¥118,982 million and ¥127,128 million fiscal 2015, 2016 and 2017, respectively.
F-52

NOTES TO CONSOLIDATED FINANCIAL STATEMENTS—(Continued)
ORIX Corporation and Subsidiaries
Certain loans, for which the Company and its subsidiaries have the intent and ability to sell to outsideparties in the foreseeable future, are considered held for sale and are carried at the lower of cost or market valuedetermined on an individual basis, except loans held for sale for which the fair value option was elected. Asubsidiary elected the fair value option on its loans held for sale originated on or after October 1, 2011. Thesubsidiary enters into forward sale agreements to offset the change in the fair value of loans held for sale, and theelection of the fair value option allows the subsidiary to recognize both the change in the fair value of the loansand the change in the fair value of the forward sale agreements due to changes in interest rates in the sameaccounting period.
Loans held for sale are included in installment loans, and the outstanding balances of these loans as ofMarch 31, 2016 and 2017 were ¥21,867 million and ¥22,548 million, respectively. There were ¥20,673 millionand ¥19,232 million of loans held for sale as of March 31, 2016 and 2017, respectively, measured at fair value byelecting the fair value option.
Purchased loans acquired by the Company and its subsidiaries are generally loans with evidence ofdeterioration of credit quality since origination and for which it is probable at acquisition that collection of allcontractually required payments from the debtors is unlikely and characterized by extended period ofnon-performance by the borrower, and it is difficult to reliably estimate the amount, timing, or nature ofcollections. Because such loans are commonly collateralized by real estate, the Company and its subsidiaries maypursue various approaches to maximizing the return from the collateral, including arrangement of borrower’snegotiated transaction of such collateral before foreclosure, the renovation, refurbishment or the sale of suchloans to third parties. Accordingly, although the acquired assets may remain loans in legal form, collections onthese loans often do not reflect the normal historical experience of collecting delinquent accounts, and the need totailor individual collateral-realization strategies often makes it difficult to reliably estimate the amount, timing, ornature of collections. Accordingly, the Company and its subsidiaries use the cost recovery method of incomerecognition for such purchased loans. The total carrying amounts of these purchased loans were ¥30,524 millionand ¥24,795 million as of March 31, 2016 and 2017, respectively, and the fair value at the acquisition date ofpurchased loans acquired during fiscal 2016 and 2017 were ¥7,799 million and ¥6,326 million, respectively.
When it is probable that the Company and its subsidiaries will be unable to collect all book value, theCompany and its subsidiaries consider purchased loans impaired, and a valuation allowance for the excessamount of the book value over the estimated recoverable amount of the loans is provided. For most cases, therecoverable amount is estimated based on the collateral value. Purchased loans for which valuation allowanceswere provided amounted to ¥11,013 million and ¥7,443 million as of March 31, 2016 and 2017, respectively.
Changes in the allowance for uncollectible accounts relating to the purchased loans for fiscal 2015, 2016and 2017 are as follows:
Millions of yen
2015 2016 2017
Beginning balance . . . . . . . . . . . . . . . . . . . . . . . . . . . . . . . . . . . . . . . . . . . . . . . . . . . ¥14,148 ¥10,717 ¥ 8,233Provision (Reversal) . . . . . . . . . . . . . . . . . . . . . . . . . . . . . . . . . . . . . . . . . . . . . (690) (1,308) (1,247)Charge-offs . . . . . . . . . . . . . . . . . . . . . . . . . . . . . . . . . . . . . . . . . . . . . . . . . . . . (3,390) (1,236) (841)Recoveries . . . . . . . . . . . . . . . . . . . . . . . . . . . . . . . . . . . . . . . . . . . . . . . . . . . . . 432 232 232Other* . . . . . . . . . . . . . . . . . . . . . . . . . . . . . . . . . . . . . . . . . . . . . . . . . . . . . . . . 217 (172) (316)
Ending balance . . . . . . . . . . . . . . . . . . . . . . . . . . . . . . . . . . . . . . . . . . . . . . . . . . . . . ¥10,717 ¥ 8,233 ¥ 6,061
* Other includes foreign currency translation adjustments.
F-53

NOTES TO CONSOLIDATED FINANCIAL STATEMENTS—(Continued)
ORIX Corporation and Subsidiaries
8. Credit Quality of Financing Receivables and the Allowance for Credit Losses
ASC 310 (“Receivables”) requires an entity to provide the following information disaggregated by portfoliosegment and class of financing receivable.
Allowance for credit losses—by portfolio segment
Credit quality of financing receivables—by class
• Impaired loans
• Credit quality indicators
• Non-accrual and past-due financing receivables
Information about troubled debt restructurings—by class
A portfolio segment is defined as the level at which an entity develops and documents a systematicmethodology to determine its allowance for credit losses. The Company and its subsidiaries classify our portfoliosegments by instruments of loans and direct financing leases. Classes of financing receivables are determinedbased on the initial measurement attribute, risk characteristics of the financing receivables and the method formonitoring and assessing obligors’ credit risk, and are defined as the level of detail necessary for a financialstatement user to understand the risks inherent in the financing receivables. Classes of financing receivablesgenerally are a disaggregation of a portfolio segment, and the Company and its subsidiaries disaggregate ourportfolio segments into classes by regions, instruments or industries of our debtors.
The following table provides information about the allowance for credit losses for fiscal 2015, 2016 and2017:
March 31, 2015
Millions of yen
Loans
Directfinancing
leases TotalConsumer
Corporate
Purchasedloans*1
Non-recourseloans Other
Allowance for credit losses:Beginning balance . . . . . . . . . . . . . . . . . . . . . . ¥ 13,473 ¥ 9,047 ¥ 32,744 ¥14,148 ¥ 15,384 ¥ 84,796
Provision (Reversal) . . . . . . . . . . . . . . . . . 5,456 (1,080) 4,800 (690) 3,145 11,631Charge-offs . . . . . . . . . . . . . . . . . . . . . . . . (7,189) (53) (13,247) (3,390) (3,832) (27,711)Recoveries . . . . . . . . . . . . . . . . . . . . . . . . . 835 0 593 432 58 1,918Other*2 . . . . . . . . . . . . . . . . . . . . . . . . . . . 10 234 782 217 449 1,692
Ending balance . . . . . . . . . . . . . . . . . . . . . . . . . ¥ 12,585 ¥ 8,148 ¥ 25,672 ¥10,717 ¥ 15,204 ¥ 72,326
Individually evaluated for impairment . . . . . . . 2,606 7,751 15,541 8,481 0 34,379Not individually evaluated for impairment . . . . 9,979 397 10,131 2,236 15,204 37,947
Financing receivables:Ending balance . . . . . . . . . . . . . . . . . . . . . . . . . ¥1,330,353 ¥124,768 ¥965,028 ¥42,292 ¥1,216,454 ¥3,678,895
Individually evaluated for impairment . . . . . . . 11,993 22,032 51,793 15,216 0 101,034Not individually evaluated for impairment . . . . 1,318,360 102,736 913,235 27,076 1,216,454 3,577,861
F-54

NOTES TO CONSOLIDATED FINANCIAL STATEMENTS—(Continued)
ORIX Corporation and Subsidiaries
March 31, 2016
Millions of yen
Loans
Directfinancing
leases TotalConsumer
Corporate
Purchasedloans*1
Non-recourseloans Other
Allowance for credit losses:Beginning balance . . . . . . . . . . . . . . . . . . . . . ¥ 12,585 ¥ 8,148 ¥ 25,672 ¥10,717 ¥ 15,204 ¥ 72,326
Provision (Reversal) . . . . . . . . . . . . . . . 7,367 (491) 3,362 (1,308) 2,787 11,717Charge-offs . . . . . . . . . . . . . . . . . . . . . . (7,572) (504) (5,298) (1,236) (4,075) (18,685)Recoveries . . . . . . . . . . . . . . . . . . . . . . . 543 0 393 232 13 1,181Other*3 . . . . . . . . . . . . . . . . . . . . . . . . . 344 (5,353) (738) (172) (549) (6,468)
Ending balance . . . . . . . . . . . . . . . . . . . . . . . . ¥ 13,267 ¥ 1,800 ¥ 23,391 ¥ 8,233 ¥ 13,380 ¥ 60,071
Individually evaluated for impairment . . . . . 2,770 1,323 12,552 5,888 0 22,533Not individually evaluated for impairment . . 10,497 477 10,839 2,345 13,380 37,538
Financing receivables:Ending balance . . . . . . . . . . . . . . . . . . . . . . . . ¥1,461,982 ¥81,211 ¥ 996,649 ¥30,524 ¥1,190,136 ¥3,760,502
Individually evaluated for impairment . . . . . 14,101 11,057 37,422 11,013 0 73,593Not individually evaluated for impairment . . 1,447,881 70,154 959,227 19,511 1,190,136 3,686,909
March 31, 2017
Millions of yen
Loans
Directfinancing
leases TotalConsumer
Corporate
Purchasedloans*1
Non-recourseloans Other
Allowance for credit losses:Beginning balance . . . . . . . . . . . . . . . . . . . . . ¥ 13,267 ¥ 1,800 ¥ 23,391 ¥ 8,233 ¥ 13,380 ¥ 60,071
Provision (Reversal) . . . . . . . . . . . . . . . 17,844 1,134 3,564 (1,247) 1,372 22,667Charge-offs . . . . . . . . . . . . . . . . . . . . . . (13,363) 0 (4,485) (841) (4,067) (22,756)Recoveries . . . . . . . . . . . . . . . . . . . . . . . 469 0 222 232 11 934Other*4 . . . . . . . . . . . . . . . . . . . . . . . . . 382 17 (1,613) (316) (159) (1,689)
Ending balance . . . . . . . . . . . . . . . . . . . . . . . . ¥ 18,599 ¥ 2,951 ¥ 21,079 ¥ 6,061 ¥ 10,537 ¥ 59,227
Individually evaluated for impairment . . . . . 2,927 2,114 10,565 4,462 0 20,068Not individually evaluated for impairment . . 15,672 837 10,514 1,599 10,537 39,159
Financing receivables:Ending balance . . . . . . . . . . . . . . . . . . . . . . . . ¥1,616,009 ¥88,726 ¥1,063,628 ¥24,795 ¥1,204,024 ¥3,997,182
Individually evaluated for impairment . . . . . 16,667 6,032 28,883 7,443 0 59,025Not individually evaluated for impairment . . 1,599,342 82,694 1,034,745 17,352 1,204,024 3,938,157
Note: Loans held for sale are not included in the table above.*1 Purchased loans represent loans with evidence of deterioration of credit quality since origination and for which it is
probable at acquisition that collection of all contractually required payments from the debtors is unlikely.*2 Other mainly includes foreign currency translation adjustments and decrease in allowance related to newly consolidated
subsidiaries.*3 Other mainly includes foreign currency translation adjustments and decrease in allowance related to deconsolidated
subsidiaries. Additionally, other in non-recourse loans includes a decrease of ¥5,265 million due to the sale of controllingclass interests of a certain VIE, which was formerly consolidated, to a third party and resulting in deconsolidation of thatVIE.
F-55

NOTES TO CONSOLIDATED FINANCIAL STATEMENTS—(Continued)
ORIX Corporation and Subsidiaries
*4 Other mainly includes foreign currency translation adjustments and decrease in allowance related to deconsolidatedsubsidiaries.
In developing the allowance for credit losses, the Company and its subsidiaries consider, among otherthings, the following factors:
• business characteristics and financial conditions of obligors;
• current economic conditions and trends;
• prior charge-off experience;
• current delinquencies and delinquency trends; and
• value of underlying collateral and guarantees.
The Company and its subsidiaries individually develop the allowance for credit losses for impaired loans.For non-impaired loans, including loans that are not individually evaluated for impairment, and direct financingleases, the Company and its subsidiaries evaluate prior charge-off experience as segmented by debtor’s industryand the purpose of the loans and develop the allowance for credit losses based on such prior charge-offexperience as well as current economic conditions.
In common with all portfolio segments, a deterioration of debtors’ condition may increase the risk of delayin payments of principal and interest. For loans to consumer borrowers, the amount of the allowance for creditlosses is changed by the variation of individual debtors’ creditworthiness and value of underlying collateral andguarantees, and the prior charge-off experience. For loans to corporate other borrowers and direct financingleases, the amount of the allowance for credit losses is changed by current economic conditions and trends, thevalue of underlying collateral and guarantees, and the prior charge-off experience in addition to the debtors’creditworthiness.
The decline of the value of underlying collateral and guarantees may increase the risk of inability to collectfrom the loans and direct financing leases. Particularly for non-recourse loans for which cash flow from realestate is the source of repayment, their collection depends on the real estate collateral value, which may declineas a result of decrease in liquidity of the real estate market, rise in vacancy rate of rental properties, fall in rentsand other factors. These risks may change the amount of the allowance for credit losses. For purchased loans,their collection may decrease due to a decline in the real estate collateral value and debtors’ creditworthiness.Thus, these risks may change the amount of the allowance for credit losses.
In common with all portfolio segments, the Company and its subsidiaries charge off doubtful receivableswhen the likelihood of any future collection is believed to be minimal, mainly based upon an evaluation of therelevant debtors’ creditworthiness and the liquidation status of collateral.
F-56

NOTES TO CONSOLIDATED FINANCIAL STATEMENTS—(Continued)
ORIX Corporation and Subsidiaries
The following table provides information about the impaired loans as of March 31, 2016 and 2017:
March 31, 2016
Millions of yen
Portfolio segment Class
LoansIndividually
Evaluated forImpairment
UnpaidPrincipalBalance
RelatedAllowance
With no related allowance recorded*1: . . . . . . . ¥14,601 ¥14,498 ¥ 0Consumer borrowers . . . . . . . . . . . . . . . . . . 931 852 0
Housing loans 931 852 0Card loans 0 0 0Other 0 0 0
Corporate borrowers . . . . . . . . . . . . . . . . . . 13,670 13,646 0Non-recourse loans . . . . . . . . . . . . . . . . . Japan 4,776 4,776 0
The Americas 0 0 0Other . . . . . . . . . . . . . . . . . . . . . . . . . . . . Real estate companies 0 0 0
Entertainment companies 211 211 0Other 8,683 8,659 0
Purchased loans . . . . . . . . . . . . . . . . . . . . . . 0 0 0With an allowance recorded*2: . . . . . . . . . . . . . 58,992 57,758 22,533
Consumer borrowers . . . . . . . . . . . . . . . . . . 13,170 12,628 2,770Housing loans 3,580 3,058 1,401Card loans 4,123 4,113 590Other 5,467 5,457 779
Corporate borrowers . . . . . . . . . . . . . . . . . . 34,809 34,117 13,875Non-recourse loans . . . . . . . . . . . . . . . . . Japan 292 292 72
The Americas 5,989 5,988 1,251Other . . . . . . . . . . . . . . . . . . . . . . . . . . . . Real estate companies 8,612 8,480 2,140
Entertainment companies 2,218 2,209 840Other 17,698 17,148 9,572
Purchased loans . . . . . . . . . . . . . . . . . . . . . . 11,013 11,013 5,888
Total: . . . . . . . . . . . . . . . . . . . . . . . . . . . . . . . . . . . ¥73,593 ¥72,256 ¥22,533
Consumer borrowers . . . . . . . . . . . . . . . . . . 14,101 13,480 2,770
Housing loans 4,511 3,910 1,401
Card loans 4,123 4,113 590
Other 5,467 5,457 779
Corporate borrowers . . . . . . . . . . . . . . . . . . 48,479 47,763 13,875
Non-recourse loans . . . . . . . . . . . . . . . . . Japan 5,068 5,068 72
The Americas 5,989 5,988 1,251
Other . . . . . . . . . . . . . . . . . . . . . . . . . . . . Real estate companies 8,612 8,480 2,140
Entertainment companies 2,429 2,420 840
Other 26,381 25,807 9,572
Purchased loans . . . . . . . . . . . . . . . . . . . . . . 11,013 11,013 5,888
F-57

NOTES TO CONSOLIDATED FINANCIAL STATEMENTS—(Continued)
ORIX Corporation and Subsidiaries
March 31, 2017
Millions of yen
Portfolio segment Class
Loansindividually
evaluated forimpairment
Unpaidprincipalbalance
Relatedallowance
With no related allowance recorded*1: . . . . . . . ¥ 6,524 ¥ 6,499 ¥ 0Consumer borrowers . . . . . . . . . . . . . . . . . . 973 956 0
Housing loans 973 956 0Card loans 0 0 0Other 0 0 0
Corporate borrowers . . . . . . . . . . . . . . . . . . 5,439 5,431 0Non-recourse loans . . . . . . . . . . . . . . . . . Japan 0 0 0
The Americas 0 0 0Other . . . . . . . . . . . . . . . . . . . . . . . . . . . . Real estate companies 0 0 0
Entertainment companies 8 2 0Other 5,431 5,429 0
Purchased loans . . . . . . . . . . . . . . . . . . . . . . 112 112 0With an allowance recorded*2: . . . . . . . . . . . . . 52,501 51,153 20,068
Consumer borrowers . . . . . . . . . . . . . . . . . . 15,694 14,775 2,927Housing loans 3,271 2,796 1,202Card loans 4,102 4,091 616Other 8,321 7,888 1,109
Corporate borrowers . . . . . . . . . . . . . . . . . . 29,476 29,047 12,679Non-recourse loans . . . . . . . . . . . . . . . . . Japan 203 202 35
The Americas 5,829 5,829 2,079Other . . . . . . . . . . . . . . . . . . . . . . . . . . . . Real estate companies 7,212 7,154 1,638
Entertainment companies 1,728 1,720 637Other 14,504 14,142 8,290
Purchased loans . . . . . . . . . . . . . . . . . . . . . . 7,331 7,331 4,462
Total: . . . . . . . . . . . . . . . . . . . . . . . . . . . . . . . . . . . ¥59,025 ¥57,652 ¥20,068
Consumer borrowers . . . . . . . . . . . . . . . . . . 16,667 15,731 2,927
Housing loans 4,244 3,752 1,202
Card loans 4,102 4,091 616
Other 8,321 7,888 1,109
Corporate borrowers . . . . . . . . . . . . . . . . . . 34,915 34,478 12,679
Non-recourse loans . . . . . . . . . . . . . . . . . Japan 203 202 35
The Americas 5,829 5,829 2,079
Other . . . . . . . . . . . . . . . . . . . . . . . . . . . . Real estate companies 7,212 7,154 1,638
Entertainment companies 1,736 1,722 637
Other 19,935 19,571 8,290
Purchased loans . . . . . . . . . . . . . . . . . . . . . . 7,443 7,443 4,462
Note: Loans held for sale are not included in the table above.*1 “With no related allowance recorded” represents impaired loans with no allowance for credit losses as all
amounts are considered to be collectible.*2 “With an allowance recorded” represents impaired loans with the allowance for credit losses as all or a part
of the amounts are not considered to be collectible.
F-58

NOTES TO CONSOLIDATED FINANCIAL STATEMENTS—(Continued)
ORIX Corporation and Subsidiaries
The Company and its subsidiaries recognize installment loans other than purchased loans and loans toconsumer borrowers as impaired loans when principal or interest is past-due 90 days or more, or it is probablethat the Company and its subsidiaries will be unable to collect all amounts due according to the contractual termsof the loan agreements due to various debtor conditions, including insolvency filings, suspension of banktransactions, dishonored bills and deterioration of businesses. For non-recourse loans, in addition to theseconditions, the Company and its subsidiaries perform an impairment review using financial covenants,acceleration clauses, loan-to-value ratios, and other relevant available information.
For purchased loans, the Company and its subsidiaries recognize them as impaired loans when it is probablethat the Company and its subsidiaries will be unable to collect book values of the remaining investment due tofactors such as a decline in the real estate collateral value and debtors’ creditworthiness since the acquisition ofthese loans.
The Company and its subsidiaries consider that loans to consumer borrowers, including housing loans, cardloans and other, are impaired when terms of these loans are modified as troubled debt restructurings.
Interest payments received on impaired loans other than purchased loans are recorded as interest incomeunless the collection of the remaining investment is doubtful at which time payments received are recorded asreductions of principal. For purchased loans, although the acquired assets may remain loans in legal form,collections on these loans often do not reflect the normal historical experience of collecting delinquent accounts,and the need to tailor individual collateral-realization strategies often makes it difficult to reliably estimate theamount, timing, or nature of collections. Accordingly, the Company and its subsidiaries use the cost recoverymethod of income recognition for such purchased loans regardless of whether impairment is recognized or not.
In common with all classes, impaired loans are individually evaluated for a valuation allowance based onthe present value of expected future cash flows, the loan’s observable market price or the fair value of thecollateral securing the loans if the loans are collateral-dependent. For non-recourse loans, in principle, theestimated collectible amount is determined based on the fair value of the collateral securing the loans as they arecollateral-dependent. Further for certain non-recourse loans, the estimated collectible amount is determined basedon the present value of expected future cash flows. The fair value of the real estate collateral securing the loans isdetermined using appraisals prepared by independent third-party appraisers or our own staff of qualifiedappraisers based on recent transactions involving sales of similar assets or other valuation techniques such asdiscounted cash flows methodologies using future cash flows estimated to be generated from operation of theexisting assets or completion of development projects, as appropriate. We generally obtain a new appraisal oncea fiscal year. In addition, we periodically monitor circumstances of the real estate collateral and then obtain anew appraisal in situations involving a significant change in economic and/or physical conditions which maymaterially affect its fair value. For impaired purchased loans, the Company and its subsidiaries develop theallowance for credit losses based on the difference between the book value and the estimated collectible amountof such loans.
F-59

NOTES TO CONSOLIDATED FINANCIAL STATEMENTS—(Continued)
ORIX Corporation and Subsidiaries
The following table provides information about the average recorded investments in impaired loans andinterest income on impaired loans for fiscal 2015, 2016 and 2017:
March 31, 2015
Millions of yen
Portfolio segment Class
Average RecordedInvestments in
Impaired Loans*Interest Income on
Impaired Loans
Interest onImpaired Loans
Collected in Cash
Consumer borrowers . . . . . ¥ 11,822 ¥ 376 ¥ 273Housing loans 6,286 268 180Card loans 3,368 60 51Other 2,168 48 42
Corporate borrowers . . . . . 82,986 2,005 1,648Non-recourse loans . . . . Japan 5,975 10 10
The Americas 15,657 502 502Other . . . . . . . . . . . . . . . Real estate companies 22,009 417 355
Entertainment companies 5,951 202 149Other 33,394 874 632
Purchased loans . . . . . . . . . 18,736 0 0
Total . . . . . . . . . . . . . . . . . . . . . . . ¥113,544 ¥2,381 ¥1,921
March 31, 2016
Millions of yen
Portfolio segment Class
Average RecordedInvestments in
Impaired Loans*Interest Income on
Impaired Loans
Interest onImpaired Loans
Collected in Cash
Consumer borrowers . . . . . ¥ 13,215 ¥ 317 ¥ 269Housing loans 5,090 176 148Card loans 3,970 69 59Other 4,155 72 62
Corporate borrowers . . . . . 58,138 974 947Non-recourse loans . . . . Japan 5,117 7 7
The Americas 11,759 275 275Other . . . . . . . . . . . . . . . Real estate companies 13,843 210 198
Entertainment companies 3,505 102 99Other 23,914 380 368
Purchased loans . . . . . . . . . 12,864 0 0
Total . . . . . . . . . . . . . . . . . . . . . . . ¥ 84,217 ¥1,291 ¥1,216
F-60

NOTES TO CONSOLIDATED FINANCIAL STATEMENTS—(Continued)
ORIX Corporation and Subsidiaries
March 31, 2017
Millions of yen
Portfolio segment Class
Average RecordedInvestments in
Impaired Loans*Interest Income on
Impaired Loans
Interest onImpaired Loans
Collected in Cash
Consumer borrowers . . . . . . ¥ 15,166 ¥ 316 ¥ 277Housing loans 4,261 146 130Card loans 4,113 67 58Other 6,792 103 89
Corporate borrowers . . . . . . 39,667 626 576Non-recourse loans . . . . . Japan 1,224 6 6
The Americas 5,679 66 66Other . . . . . . . . . . . . . . . . Real estate companies 7,720 189 177
Entertainment companies 2,134 76 76Other 22,910 289 251
Purchased loans . . . . . . . . . . 9,348 591 591
Total . . . . . . . . . . . . . . . . . . . . . . . . ¥ 64,181 ¥1,533 ¥1,444
Note: Loans held for sale are not included in the table above.* Average balances are calculated on the basis of fiscal beginning and quarter-end balances.
The following table provides information about the credit quality indicators as of March 31, 2016 and 2017:
March 31, 2016
Millions of yen
Non-performing
Portfolio segment Class Performing
Loansindividually
evaluated forimpairment
90+ dayspast-dueloans not
individuallyevaluated forimpairment Subtotal Total
Consumerborrowers . . . . . . . . . ¥1,439,703 ¥14,101 ¥ 8,178 ¥22,279 ¥1,461,982
Housing loans 1,131,276 4,511 2,267 6,778 1,138,054Card loans 255,753 4,123 657 4,780 260,533Other 52,674 5,467 5,254 10,721 63,395
Corporateborrowers . . . . . . . . . 1,029,381 48,479 0 48,479 1,077,860
Non-recourseloans . . . . . . . . . . Japan 14,883 5,068 0 5,068 19,951
The Americas 55,271 5,989 0 5,989 61,260Other . . . . . . . . . . . . Real estate companies 261,558 8,612 0 8,612 270,170
Entertainment companies 98,852 2,429 0 2,429 101,281Other 598,817 26,381 0 26,381 625,198
Purchased loans . . . . . . 19,511 11,013 0 11,013 30,524Direct financing
leases . . . . . . . . . . . . . 1,177,580 0 12,556 12,556 1,190,136Japan 831,207 0 7,918 7,918 839,125Overseas 346,373 0 4,638 4,638 351,011
Total . . . . . . . . . . . . . . . . . . . . ¥3,666,175 ¥73,593 ¥20,734 ¥94,327 ¥3,760,502
F-61

NOTES TO CONSOLIDATED FINANCIAL STATEMENTS—(Continued)
ORIX Corporation and Subsidiaries
March 31, 2017
Millions of yen
Non-performing
Portfolio segment Class Performing
Loansindividually
evaluated forimpairment
90+ dayspast-dueloans not
individuallyevaluated forimpairment Subtotal Total
Consumerborrowers . . . . . . . . . ¥1,589,620 ¥16,667 ¥ 9,722 ¥26,389 ¥1,616,009
Housing loans 1,273,603 4,244 1,685 5,929 1,279,532Card loans 264,559 4,102 1,346 5,448 270,007Other 51,458 8,321 6,691 15,012 66,470
Corporateborrowers . . . . . . . . . 1,117,439 34,915 0 34,915 1,152,354
Non-recourseloans . . . . . . . . . . Japan 12,555 203 0 203 12,758
The Americas 70,139 5,829 0 5,829 75,968Other . . . . . . . . . . . . Real estate companies 313,947 7,212 0 7,212 321,159
Entertainment companies 94,190 1,736 0 1,736 95,926Other 626,608 19,935 0 19,935 646,543
Purchased loans . . . . . . 17,352 7,443 0 7,443 24,795Direct financing
leases . . . . . . . . . . . . . 1,192,424 0 11,600 11,600 1,204,024Japan 839,848 0 6,442 6,442 846,290Overseas 352,576 0 5,158 5,158 357,734
Total . . . . . . . . . . . . . . . . . . . . ¥3,916,835 ¥59,025 ¥21,322 ¥80,347 ¥3,997,182
Note: Loans held for sale are not included in the table above.
In common with all classes, the Company and its subsidiaries monitor the credit quality indicators asperforming and non-performing assets. The category of non-performing assets includes financing receivables fordebtors who have filed for insolvency proceedings, whose bank transactions are suspended, whose bills aredishonored, whose businesses have deteriorated, whose repayment is past-due 90 days or more, financingreceivables modified as troubled debt restructurings, and performing assets include all other financingreceivables. Regarding purchased loans, they are classified as non-performing assets when considered impaired,while all the other loans are included in the category of performing assets.
Out of non-performing assets, the Company and its subsidiaries consider smaller balance homogeneousloans, including housing loans, card loans and other, which are not restructured and direct financing leases, as90 days or more past-due financing receivables not individually evaluated for impairment, and consider theothers as loans individually evaluated for impairment. After the Company and its subsidiaries have set asideprovision for those non-performing assets, the Company and its subsidiaries continue to monitor at least on aquarterly basis the quality of any underlying collateral, the status of management of the debtors and otherimportant factors in order to report to management and develop additional provision as necessary.
F-62

NOTES TO CONSOLIDATED FINANCIAL STATEMENTS—(Continued)
ORIX Corporation and Subsidiaries
The following table provides information about the non-accrual and past-due financing receivables as ofMarch 31, 2016 and 2017:
March 31, 2016
Millions of yen
Past-due financing receivables
Portfolio segment Class30-89 dayspast-due
90 daysor morepast-due
Totalpast-due
Totalfinancing
receivables Non-accrual
Consumer borrowers . . ¥ 5,002 ¥ 11,348 ¥16,350 ¥ 1,461,982 ¥11,348Housing loans 2,283 4,435 6,718 1,138,054 4,435Card loans 503 1,103 1,606 260,533 1,103Other 2,216 5,810 8,026 63,395 5,810
Corporate borrowers . . 3,018 18,944 21,962 1,077,860 31,464Non-recourse
loans . . . . . . . . . . Japan 0 4,776 4,776 19,951 4,776The Americas 2,370 400 2,770 61,260 5,924
Other . . . . . . . . . . . . Real estate companies 44 2,727 2,771 270,170 2,727Entertainment companies 0 145 145 101,281 145Other 604 10,896 11,500 625,198 17,892
Direct financingleases . . . . . . . . . . . . . . 6,457 12,556 19,013 1,190,136 12,556
Japan 500 7,918 8,418 839,125 7,918Overseas 5,957 4,638 10,595 351,011 4,638
Total . . . . . . . . . . . . . . . . . . . . ¥14,477 ¥ 42,848 ¥57,325 ¥ 3,729,978 ¥55,368
March 31, 2017
Millions of yen
Past-due financing receivables
Portfolio segment Class30-89 dayspast-due
90 daysor morepast-due
Totalpast-due
Totalfinancing
receivables Non-accrual
Consumer borrowers . . ¥ 6,433 ¥ 12,971 ¥19,404 ¥ 1,616,009 ¥12,971Housing loans 2,314 3,420 5,734 1,279,532 3,420Card loans 518 1,825 2,343 270,007 1,825Other 3,601 7,726 11,327 66,470 7,726
Corporate borrowers . . 4,902 15,224 20,126 1,152,354 24,474Non-recourse
loans . . . . . . . . . . Japan 0 0 0 12,758 0The Americas 4,028 4,940 8,968 75,968 5,768
Other . . . . . . . . . . . . Real estate companies 37 1,867 1,904 321,159 1,867Entertainment companies 0 140 140 95,926 140Other 837 8,277 9,114 646,543 16,699
Direct financingleases . . . . . . . . . . . . . . 4,834 11,600 16,434 1,204,024 11,600
Japan 535 6,442 6,977 846,290 6,442Overseas 4,299 5,158 9,457 357,734 5,158
Total . . . . . . . . . . . . . . . . . . . . ¥16,169 ¥ 39,795 ¥55,964 ¥ 3,972,387 ¥49,045
Note: Loans held for sale and purchased loans are not included in the table above.
F-63

NOTES TO CONSOLIDATED FINANCIAL STATEMENTS—(Continued)
ORIX Corporation and Subsidiaries
In common with all classes, the Company and its subsidiaries consider financing receivables as past-duefinancing receivables when principal or interest is past-due 30 days or more. Loans whose terms have beenmodified are not classified as past-due financing receivables if the principals and interests are not past-due30 days or more in accordance with the modified terms.
The Company and its subsidiaries suspend accruing revenues on past-due installment loans and directfinancing leases when principal or interest is past-due 90 days or more, or earlier, if management determines thattheir collections are doubtful based on factors such as individual debtor’s creditworthiness, historical lossexperience, current delinquencies and delinquency trends. Cash repayments received on non-accrual loans areapplied first against past due interest and then any surpluses are applied to principal in view of the conditions ofthe contract and obligors. The Company and its subsidiaries return to accrual status non-accrual loans and leasereceivables when it becomes probable that the Company and its subsidiaries will be able to collect all amountsdue according to the contractual terms of these loans and lease receivables, as evidenced by continual paymentsfrom the debtors. The period of such continual payments before returning to accrual status varies depending onfactors that we consider are relevant in assessing the debtor’s creditworthiness, such as the debtor’s businesscharacteristics and financial conditions as well as relevant economic conditions and trends.
The following table provides information about troubled debt restructurings of financing receivables thatoccurred during fiscal 2015, 2016 and 2017:
March 31, 2015
Millions of yen
Portfolio segment Class
Pre-modificationOutstanding
Recorded Investment
Post-modificationOutstanding
Recorded Investment
Consumer borrowers . . . . . . . . . . . . . . . . . . . . . . . ¥ 5,504 ¥4,061Housing loans 483 263Card loans 2,566 2,018Other 2,455 1,780
Corporate borrowers . . . . . . . . . . . . . . . . . . . . . . . 946 891Non-recourse loans . . . . . . . . . . . . . . . . . . . . . . The Americas 145 145Other . . . . . . . . . . . . . . . . . . . . . . . . . . . . . . . . . Other 801 746
Total . . . . . . . . . . . . . . . . . . . . . . . . . . . . . . . . . . . . . . . . . ¥ 6,450 ¥4,952
March 31, 2016
Millions of yen
Portfolio segment Class
Pre-modificationOutstanding
Recorded Investment
Post-modificationOutstanding
Recorded Investment
Consumer borrowers . . . . . . . . . . . . . . . . . . . . . . . ¥ 6,436 ¥4,890Housing loans 71 23Card loans 2,405 1,910Other 3,960 2,957
Corporate borrowers . . . . . . . . . . . . . . . . . . . . . . . 584 582Non-recourse loans . . . . . . . . . . . . . . . . . . . . . . The Americas 575 575Other . . . . . . . . . . . . . . . . . . . . . . . . . . . . . . . . . Other 9 7
Total . . . . . . . . . . . . . . . . . . . . . . . . . . . . . . . . . . . . . . . . . ¥ 7,020 ¥5,472
F-64

NOTES TO CONSOLIDATED FINANCIAL STATEMENTS—(Continued)
ORIX Corporation and Subsidiaries
March 31, 2017
Millions of yen
Portfolio segment Class
Pre-modificationOutstanding
Recorded Investment
Post-modificationOutstanding
Recorded Investment
Consumer borrowers . . . . . . . . . . . . . . . . . . . . . . . ¥10,721 ¥8,253Housing loans 640 587Card loans 2,120 1,687Other 7,961 5,979
Corporate borrowers . . . . . . . . . . . . . . . . . . . . . . . 729 693Other . . . . . . . . . . . . . . . . . . . . . . . . . . . . . . . . . Other 729 693
Total . . . . . . . . . . . . . . . . . . . . . . . . . . . . . . . . . . . . . . . . . ¥11,450 ¥8,946
A troubled debt restructuring is defined as a restructuring of a financing receivable in which the creditorgrants a concession to the debtor for economic or other reasons related to the debtor’s financial difficulties.
The Company and its subsidiaries offer various types of concessions to our debtors to protect as much of ourinvestment as possible in troubled debt restructurings. For the debtors of non-recourse loans, the Company andits subsidiaries offer concessions including an extension of the maturity date at an interest rate lower than thecurrent market rate for a debt with similar risk characteristics. For the debtors of all financing receivables otherthan non-recourse loans, the Company and its subsidiaries offer concessions such as a reduction of the loanprincipal, a temporary reduction in the interest payments, or an extension of the maturity date at an interest ratelower than the current market rate for a debt with similar risk characteristics. In addition, the Company and itssubsidiaries may acquire collateral assets from the debtors in troubled debt restructurings to satisfy fully orpartially the loan principal or past due interest.
In common with all portfolio segments, financing receivables modified as troubled debt restructurings arerecognized as impaired and are individually evaluated for a valuation allowance. In most cases, these financingreceivables have already been considered impaired and individually evaluated for allowance for credit lossesprior to the restructurings. However, as a result of the restructuring, the Company and its subsidiaries mayrecognize additional provision for the restructured receivables.
The following table provides information about financing receivables modified as troubled debtrestructurings within the previous 12 months from March 31, 2015 and for which there was a payment defaultduring fiscal 2015:
March 31, 2015
Millions of yen
Portfolio segment Class Recorded Investment
Consumer borrowers . . . . . . . . . . . . . . . . . . . . . . . . . . . . . . ¥122Housing loans 27Card loans 62Other 33
Corporate borrowers . . . . . . . . . . . . . . . . . . . . . . . . . . . . . . 330Other . . . . . . . . . . . . . . . . . . . . . . . . . . . . . . . . . . . . . . . . Other 330
Total . . . . . . . . . . . . . . . . . . . . . . . . . . . . . . . . . . . . . . . . . . . . . . . . ¥452
F-65

NOTES TO CONSOLIDATED FINANCIAL STATEMENTS—(Continued)
ORIX Corporation and Subsidiaries
The following table provides information about financing receivables modified as troubled debtrestructurings within the previous 12 months from March 31, 2016 and for which there was a payment defaultduring fiscal 2016:
March 31, 2016
Millions of yen
Portfolio segment Class Recorded Investment
Consumer borrowers . . . . . . . . . . . . . . . . . . . . . . . . . . . . . . ¥68Card loans 45Other 23
Total . . . . . . . . . . . . . . . . . . . . . . . . . . . . . . . . . . . . . . . . . . . . . . . . ¥68
The following table provides information about financing receivables modified as troubled debtrestructurings within the previous 12 months from March 31, 2017 and for which there was a payment defaultduring fiscal 2017:
March 31, 2017
Millions of yen
Portfolio segment Class Recorded Investment
Consumer borrowers . . . . . . . . . . . . . . . . . . . . . . . . . . . . . . ¥1,526Card loans 47Other 1,479
Total . . . . . . . . . . . . . . . . . . . . . . . . . . . . . . . . . . . . . . . . . . . . . . . . ¥1,526
The Company and its subsidiaries consider financing receivables whose terms have been modified in arestructuring as defaulted receivables when principal or interest is past-due 90 days or more in accordance withthe modified terms.
In common with all portfolio segments, the Company and its subsidiaries suspend accruing revenues andmay recognize additional provision as necessary for the defaulted financing receivables.
As of March 31, 2016 and 2017, there were no foreclosed residential real estate properties. The carryingamounts of installment loans in consumer mortgage loans collateralized by residential real estate property thatare in the process of foreclosure were ¥601 million and ¥324 million as of March 31, 2016 and 2017,respectively.
9. Investment in Securities
Investment in securities as of March 31, 2016 and 2017 consists of the following:
Millions of yen
2016 2017
Trading securities* . . . . . . . . . . . . . . . . . . . . . . . . . . . . . . . . . . . . . . . . . . . . . . . . . . . . ¥ 725,821 ¥ 569,074Available-for-sale securities . . . . . . . . . . . . . . . . . . . . . . . . . . . . . . . . . . . . . . . . . . . . 1,347,890 1,165,417Held-to-maturity securities . . . . . . . . . . . . . . . . . . . . . . . . . . . . . . . . . . . . . . . . . . . . . 114,858 114,400Other securities . . . . . . . . . . . . . . . . . . . . . . . . . . . . . . . . . . . . . . . . . . . . . . . . . . . . . . 156,223 177,621
Total . . . . . . . . . . . . . . . . . . . . . . . . . . . . . . . . . . . . . . . . . . . . . . . . . . . . . . . . . . . . . . . ¥2,344,792 ¥2,026,512
* The amount of assets under management of variable annuity and variable life insurance contracts included intrading securities were ¥704,313 million and ¥547,850 million as of March 31, 2016 and 2017, respectively.
F-66

NOTES TO CONSOLIDATED FINANCIAL STATEMENTS—(Continued)
ORIX Corporation and Subsidiaries
Gains and losses realized from the sale of trading securities and net unrealized holding gains (losses) ontrading securities are included in net gains on investment securities and life insurance related investment income.For further information, see Note 22 “Gains on investment securities and dividends” and Note 23 “Life InsuranceOperations.” For fiscal 2015, 2016 and 2017, net unrealized holding gains (losses) on trading securities weregains of ¥137,704 million, losses of ¥84,678 million and gains of ¥19,049 million, respectively.
During fiscal 2015, 2016 and 2017, the Company and its subsidiaries sold available-for-sale securities foraggregate proceeds of ¥511,868 million, ¥464,232 million and ¥549,865 million, respectively, resulting in grossrealized gains of ¥32,206 million, ¥32,593 million and ¥33,804 million, respectively, and gross realized losses of¥129 million, ¥467 million and ¥3,103 million, respectively. The cost of the securities sold was based on theaverage cost of each such security held at the time of the sale.
During fiscal 2015, 2016 and 2017, the Company and its subsidiaries charged losses on securities of¥8,997 million, ¥4,515 million and ¥6,608 million, respectively, to the accompanying consolidated statements ofincome for declines in market value of securities where the decline was considered as other than temporary.
Other securities consist mainly of non-marketable equity securities, preferred capital shares carried at costand investment funds carried at an amount that reflects equity income and loss based on the investor’s share. Theaggregate carrying amount of other securities accounted for under the cost method totaled ¥27,349 million and¥25,597 million as of March 31, 2016 and 2017, respectively. Investments with an aggregate cost of¥27,125 million and ¥25,396 million respectively, were not evaluated for impairment because the Company andits subsidiaries did not identify any events or changes in circumstances that might have had a significant adverseeffect on the fair value of those investments and it was not practicable to estimate the fair value of theinvestments.
A certain subsidiary elected the fair value option for investments in foreign government bond securitiesincluded in available-for-sale securities, which as of March 31, 2016 and 2017, were fair valued at ¥988 millionand ¥1,015 million, respectively.
A certain subsidiary elected the fair value option for investments in foreign corporate debt securitiesincluded in available-for-sale securities, which as of March 31, 2017, were fair valued at ¥1,026 million.
A certain subsidiary elected the fair value option for certain investments in equity securities included inavailable-for-sale securities to mitigate volatility in the consolidated statements of income caused by thedifferences in classification of recognized gain or loss that would otherwise exist between the equity securitiesand the derivatives used to manage the risk of changes in fair value of these equity securities. As of March 31,2016 and 2017, these equity securities were fair valued at ¥16,227 million and ¥15,400 million, respectively.
Certain subsidiaries elected the fair value option for certain investments in a trust and investment fundsincluded in other securities whose net asset values do not represent the fair value of investments due to theilliquid nature of these investments. The subsidiaries manage these investments on a fair value basis and theelection of the fair value option enables the subsidiaries to reflect more appropriate assumptions to measure thefair value of these investments. As of March 31, 2016 and 2017, the fair values of these investments were¥10,152 million and ¥7,453 million, respectively.
F-67

NOTES TO CONSOLIDATED FINANCIAL STATEMENTS—(Continued)
ORIX Corporation and Subsidiaries
The amortized cost basis amounts, gross unrealized holding gains, gross unrealized holding losses and fairvalues of available-for-sale securities and held-to-maturity securities in each major security type as of March 31,2016 and 2017 are as follows:
March 31, 2016
Millions of yen
Amortizedcost
Grossunrealized
gains
Grossunrealized
losses Fair value
Available-for-sale:Japanese and foreign government bond securities . . . . . . . ¥ 464,854 ¥ 32,501 ¥ 0 ¥ 497,355Japanese prefectural and foreign municipal bond
securities . . . . . . . . . . . . . . . . . . . . . . . . . . . . . . . . . . . . 165,465 4,106 (37) 169,534Corporate debt securities . . . . . . . . . . . . . . . . . . . . . . . . . . 403,349 7,443 (13) 410,779Specified bonds issued by SPEs in Japan . . . . . . . . . . . . . 3,422 39 0 3,461CMBS and RMBS in the Americas . . . . . . . . . . . . . . . . . . 97,692 1,906 (2,412) 97,186Other asset-backed securities and debt securities . . . . . . . 63,079 1,744 (6,593) 58,230Equity securities . . . . . . . . . . . . . . . . . . . . . . . . . . . . . . . . . 85,452 33,492 (7,599) 111,345
1,283,313 81,231 (16,654) 1,347,890
Held-to-maturity:Japanese government bond securities and other . . . . . . . . 114,858 30,662 0 145,520
¥1,398,171 ¥111,893 ¥(16,654) ¥1,493,410
March 31, 2017
Millions of yen
Amortizedcost
Grossunrealized
gains
Grossunrealized
losses Fair value
Available-for-sale:Japanese and foreign government bond securities . . . . . . . ¥ 334,117 ¥12,321 ¥ (826) ¥ 345,612Japanese prefectural and foreign municipal bond
securities . . . . . . . . . . . . . . . . . . . . . . . . . . . . . . . . . . . . . 166,789 3,034 (1,001) 168,822Corporate debt securities . . . . . . . . . . . . . . . . . . . . . . . . . . 393,021 3,606 (2,983) 393,644Specified bonds issued by SPEs in Japan . . . . . . . . . . . . . . 1,077 10 0 1,087CMBS and RMBS in the Americas . . . . . . . . . . . . . . . . . . 95,700 3,359 (558) 98,501Other asset-backed securities and debt securities . . . . . . . . 61,138 3,957 (378) 64,717Equity securities . . . . . . . . . . . . . . . . . . . . . . . . . . . . . . . . . 67,914 25,618 (498) 93,034
1,119,756 51,905 (6,244) 1,165,417
Held-to-maturity:Japanese government bond securities and other . . . . . . . . . 114,400 25,323 0 139,723
¥1,234,156 ¥77,228 ¥(6,244) ¥1,305,140
F-68

NOTES TO CONSOLIDATED FINANCIAL STATEMENTS—(Continued)
ORIX Corporation and Subsidiaries
The following table provides information about available-for-sale securities and held-to-maturity securitieswith gross unrealized losses and the length of time that individual securities have been in a continuous unrealizedloss position as of March 31, 2016 and 2017, respectively:
March 31, 2016
Millions of yen
Less than 12 months 12 months or more Total
Fairvalue
Grossunrealized
lossesFairvalue
Grossunrealized
lossesFairvalue
Grossunrealized
losses
Available-for-sale:Japanese prefectural and foreign municipal
bond securities . . . . . . . . . . . . . . . . . . . . . ¥ 14,821 ¥ (30) ¥ 554 ¥ (7) ¥ 15,375 ¥ (37)Corporate debt securities . . . . . . . . . . . . . . . 32,969 (13) 1,802 0 34,771 (13)CMBS and RMBS in the Americas . . . . . . . 55,226 (2,234) 5,002 (178) 60,228 (2,412)Other asset-backed securities and debt
securities . . . . . . . . . . . . . . . . . . . . . . . . . . 14,220 (1,857) 18,846 (4,736) 33,066 (6,593)Equity securities . . . . . . . . . . . . . . . . . . . . . . 17,040 (7,550) 594 (49) 17,634 (7,599)
¥134,276 ¥(11,684) ¥26,798 ¥(4,970) ¥161,074 ¥(16,654)
March 31, 2017
Millions of yen
Less than 12 months 12 months or more Total
Fairvalue
Grossunrealized
lossesFairvalue
Grossunrealized
lossesFairvalue
Grossunrealized
losses
Available-for-sale:Japanese and foreign government bond
securities . . . . . . . . . . . . . . . . . . . . . . . . . . ¥ 33,991 ¥ (826) ¥ 0 ¥ 0 ¥ 33,991 ¥ (826)Japanese prefectural and foreign municipal
bond securities . . . . . . . . . . . . . . . . . . . . . 36,873 (696) 6,202 (305) 43,075 (1,001)Corporate debt securities . . . . . . . . . . . . . . . 152,812 (2,983) 0 0 152,812 (2,983)CMBS and RMBS in the Americas . . . . . . . 20,238 (485) 9,428 (73) 29,666 (558)Other asset-backed securities and debt
securities . . . . . . . . . . . . . . . . . . . . . . . . . . 3,308 (1) 3,991 (377) 7,299 (378)Equity securities . . . . . . . . . . . . . . . . . . . . . . 7,645 (480) 787 (18) 8,432 (498)
¥254,867 ¥ (5,471) ¥20,408 ¥ (773) ¥275,275 ¥ (6,244)
The number of investment securities that were in an unrealized loss position as of March 31, 2016 and 2017were 259 and 325, respectively. The gross unrealized losses on these securities are attributable to a number offactors including changes in interest rates, credit spreads and market trends.
For debt securities, in the case of the fair value being below the amortized cost, the Company and itssubsidiaries consider whether those securities are other-than-temporarily impaired using all available informationabout their collectability. The Company and its subsidiaries do not consider a debt security to be other-than-
F-69

NOTES TO CONSOLIDATED FINANCIAL STATEMENTS—(Continued)
ORIX Corporation and Subsidiaries
temporarily impaired if (1) the Company and its subsidiaries do not intend to sell the debt security, (2) it is notmore likely than not that the Company and its subsidiaries will be required to sell the debt security beforerecovery of its amortized cost basis and (3) the present value of estimated cash flows will fully cover theamortized cost of the security. On the other hand, the Company and its subsidiaries consider a debt security to beother-than-temporarily impaired if any of the above mentioned three conditions are not met.
Debt securities with unrealized loss position mainly include corporate debt securities in Japan, CMBS andRMBS in the Americas and other asset-backed securities.
The unrealized loss associated with corporate debt securities is primarily due to changes in the marketinterest rate and risk premium. Considering all available information to assess the collectability of thoseinvestments (such as the financial condition of and business prospects for the issuers), the Company and itssubsidiaries believe that the Company and its subsidiaries are able to recover the entire amortized cost basis ofthose investments. Because the Company and its subsidiaries do not intend to sell the investments and it is notmore likely than not that the Company and its subsidiaries will be required to sell the investments beforerecovery of their amortized cost basis, the Company and its subsidiaries do not consider these investments to beother-than-temporarily impaired at March 31, 2017.
The unrealized loss associated with CMBS and RMBS in the Americas and other asset-backed securities isprimarily caused by changes in credit spreads and interest rates. In order to determine whether a credit loss exists,the Company and its subsidiaries estimate the present value of anticipated cash flows, discounted at the currentyield to accrete the security. The cash flows are estimated based on a number of assumptions such as default rateand prepayment speed, as well as seniority of the security. Then, a credit loss is assessed by comparing thepresent value of the expected cash flows to the security’s amortized cost basis. Based on that assessment, theCompany and its subsidiaries expect to recover the entire amortized cost basis and no credit impairment wasidentified. Because the Company and its subsidiaries do not intend to sell the investments and it is not morelikely than not that the Company and its subsidiaries will be required to sell the investments before recovery oftheir amortized cost basis, the Company and its subsidiaries do not consider these investments to be other-than-temporarily impaired as of March 31, 2017.
For equity securities with unrealized losses, the Company and its subsidiaries consider various factors todetermine whether the decline is other-than-temporary, including the length of time and the extent to which thefair value has been less than the carrying value and the issuer’s specific economic conditions as well as theability and intent to hold these securities for a period of time sufficient to recover the securities’ carryingamounts. Based on our ongoing monitoring process, the Company and its subsidiaries do not consider theseinvestments to be other-than-temporarily impaired as of March 31, 2017.
The total other-than-temporary impairment with an offset for the amount of the total other-than-temporaryimpairment recognized in other comprehensive income (loss) for fiscal 2015, 2016 and 2017 are as follows:
Millions of yen
2015 2016 2017
Total other-than-temporary impairment losses . . . . . . . . . . . . . . . . . . . . . . . . . ¥9,077 ¥4,517 ¥6,608Portion of loss recognized in other comprehensive income (before taxes) . . . . (80) (2) 0
Net impairment losses recognized in earnings . . . . . . . . . . . . . . . . . . . . . . . . . . ¥8,997 ¥4,515 ¥6,608
Total other-than-temporary impairment losses for fiscal 2015 and 2016 related to equity securities, debtsecurities and other securities. Total other-than-temporary impairment losses for fiscal 2017 related to equitysecurities and other securities.
F-70

NOTES TO CONSOLIDATED FINANCIAL STATEMENTS—(Continued)
ORIX Corporation and Subsidiaries
During fiscal 2015 and 2016, other-than-temporary impairment losses related to debt securities arerecognized mainly on certain other asset-backed securities. Other asset-backed securities have experienced creditlosses due to a decline in value of the underlying assets. Because the Company and its subsidiaries do not intendto sell the investments and it is not more likely than not that the Company and its subsidiaries will be required tosell the investments before recovery of their amortized cost basis, the credit loss component is recognized inearnings, and the non-credit loss component is recognized in other comprehensive income (loss), net ofapplicable income taxes. The credit loss assessment is made by comparing the securities’ amortized cost basiswith the portion of the estimated fair value of the underlying assets available to repay the specified bonds, or withthe present value of the expected cash flows from the mortgage-backed securities, that were estimated based on anumber of assumptions such as seniority of the security.
Roll-forwards of the amount related to credit losses on other-than-temporarily impaired debt securitiesrecognized in earnings for fiscal 2015, 2016 and 2017 are as follows:
Millions of yen
2015 2016 2017
Beginning . . . . . . . . . . . . . . . . . . . . . . . . . . . . . . . . . . . . . . . . . . . . . . . . . . . . . . ¥1,991 ¥2,633 ¥1,413Addition during the period:
Credit loss for which an other-than-temporary impairment was notpreviously recognized . . . . . . . . . . . . . . . . . . . . . . . . . . . . . . . . . . . . . . 456 0 0
Credit loss for which an other-than-temporary impairment waspreviously recognized . . . . . . . . . . . . . . . . . . . . . . . . . . . . . . . . . . . . . . 282 49 0
Reduction during the period:For securities sold or redeemed . . . . . . . . . . . . . . . . . . . . . . . . . . . . . . . . . (44) (604) (171)Due to change in intent to sell or requirement to sell . . . . . . . . . . . . . . . . (52) (665) (22)
Ending . . . . . . . . . . . . . . . . . . . . . . . . . . . . . . . . . . . . . . . . . . . . . . . . . . . . . . . . ¥2,633 ¥1,413 ¥1,220
The Company and its subsidiaries recorded other-than-temporary impairments related to the non-creditlosses arising from foregoing debt securities for CMBS and RMBS in the Americas. These impairments includedthe amount of unrealized gains or losses for the changes in fair value of the debt securities after recognition ofother-than-temporary impairments in earnings. As of March 31, 2015, an unrealized gain of ¥234 million and anunrealized loss of ¥58 million, before taxes, were included and an unrealized gain of ¥149 million and anunrealized loss of ¥37 million, net of taxes, were included in unrealized gains or losses of accumulated othercomprehensive income. As of March 31, 2016, an unrealized gain of ¥61 million and an unrealized loss of¥6 million, before taxes, were included and an unrealized gain of ¥39 million and an unrealized loss of¥4 million, net of taxes, were included in unrealized gains or losses of accumulated other comprehensive income.As of March 31, 2017, an unrealized gain of ¥57 million, before taxes, were included and an unrealized gain of¥36 million, net of taxes, were included in unrealized gains or losses of accumulated other comprehensiveincome. As of March 31, 2017, no unrealized loss was included in unrealized gains or losses of accumulatedother comprehensive income.
F-71

NOTES TO CONSOLIDATED FINANCIAL STATEMENTS—(Continued)
ORIX Corporation and Subsidiaries
The following is a summary of the contractual maturities of debt securities classified as available-for-salesecurities and held-to-maturity securities held as of March 31, 2017:
Available-for-sale securities held as of March 31, 2017:
Millions of yen
Amortizedcost Fair value
Due within one year . . . . . . . . . . . . . . . . . . . . . . . . . . . . . . . . . . . . . . . . . . . . . . . . . . . . ¥ 55,086 ¥ 56,943Due after one to five years . . . . . . . . . . . . . . . . . . . . . . . . . . . . . . . . . . . . . . . . . . . . . . . 287,573 289,773Due after five to ten years . . . . . . . . . . . . . . . . . . . . . . . . . . . . . . . . . . . . . . . . . . . . . . . . 393,476 394,894Due after ten years . . . . . . . . . . . . . . . . . . . . . . . . . . . . . . . . . . . . . . . . . . . . . . . . . . . . . . 315,707 330,773
¥1,051,842 ¥1,072,383
Held-to-maturity securities held as of March 31, 2017:
Millions of yen
Amortizedcost Fair value
Due after ten years . . . . . . . . . . . . . . . . . . . . . . . . . . . . . . . . . . . . . . . . . . . . . . . . . . . . . . ¥ 114,400 ¥ 139,723
¥ 114,400 ¥ 139,723
Securities not due at a single maturity date, such as mortgage-backed securities, are included in the abovetable based on their final maturities.
Certain borrowers may have the right to call or prepay obligations. This right may cause actual maturities todiffer from the contractual maturities summarized above.
Included in finance revenues in the consolidated statements of income is interest income on investmentsecurities of ¥12,391 million, ¥12,712 million and ¥14,031 million for fiscal 2015, 2016 and 2017 respectively.
The Company and a certain foreign subsidiary acquired debt securities with evidence of deterioration ofcredit quality at the time of acquisition, and it was not probable the Company and a certain foreign subsidiarywere able to recover all contractual amounts of those debt securities. The Company and the subsidiarydetermined the expected future cash flows taking into account historical cash collections for debt securities withsimilar characteristics as well as expected prepayments and the amount and the timing of undiscounted expectedprincipal, interest and other cash flows for each pool of debt securities. Accretable yield represents the excess ofexpected future cash flows over carrying value of the debt securities, which is recognized as interest income overthe remaining life of the debt securities. For a debt security for which the fair value is less than the amortized costbasis, the Company and a certain foreign subsidiary estimates the present value of cash flows expected to becollected from the security and compares it with the amortized cost basis of the security to determine whether acredit loss exists. If, based on current information and events, the Company and the subsidiary determine a creditloss exists for that security, an other-than-temporary impairment is considered to have occurred. For a debtsecurity for which an other-than-temporary impairment is considered to have occurred, the Company and thesubsidiary recognize the entire difference between the amortized cost and the fair value in earnings if theCompany and the subsidiary intend to sell the debt security or it is more likely than not that the Company and thesubsidiary will be required to sell the debt security before recovery of its amortized cost basis less any current-period credit loss. On the other hand, if the Company and the subsidiary do not intend to sell the debt security
F-72

NOTES TO CONSOLIDATED FINANCIAL STATEMENTS—(Continued)
ORIX Corporation and Subsidiaries
and it is not more likely than not that the Company and the subsidiary will be required to sell the debt securitybefore recovery of its amortized cost basis less any current-period credit loss, the Company and the subsidiaryseparate the difference between the amortized cost and the fair value of the debt securities into the credit losscomponent and the non-credit loss component. The credit loss component is recognized in earnings, and thenon-credit loss component is recognized in other comprehensive income (loss), net of applicable income taxes.The carrying amounts and the nominal value of debt securities acquired with evidence of deterioration of creditquality were ¥319 million and ¥1,057 million as of March 31, 2016, and ¥18 million and ¥355 million as ofMarch 31, 2017. The outstanding balance of accretable yield was ¥743 million and ¥402 million as of March 31,2016 and 2017, respectively.
10. Securitization Transactions
The Company and its subsidiaries have securitized various financial assets such as lease receivables andinstallment loans (commercial mortgage loans, housing loans and other).
In the securitization process, these financial assets are transferred to SPEs, such as trusts and special-purpose companies that issue beneficial interests of the securitization trusts and securities backed by the financialassets to investors. The cash flows collected from these assets transferred to the SPEs are then used to repay theseasset-backed beneficial interests and securities. As the transferred assets are isolated from the Company and itssubsidiaries, the investors and the SPEs have no recourse to other assets of the Company and its subsidiaries incases where the debtors or the issuers of the transferred financial assets fail to perform under the original terms ofthose financial assets.
The Company and its subsidiaries often retain interests in the SPEs in the form of the beneficial interest ofthe securitization trusts. Those interests that continue to be held include interests in the transferred assets and areoften subordinate to other tranche(s) of the securitization. Those beneficial interests that continue to be held bythe Company and its subsidiaries are subject to credit risk, interest rate risk and prepayment risk on thesecuritized financial assets. With regards to these subordinated interests that the Company and its subsidiariesretain, they are subordinated to the senior investments and are exposed to different credit and prepayment risks,since they first absorb the risk of the decline in the cash flows from the financial assets transferred to the SPEsfor defaults and prepayment of the transferred assets. If there is any excess cash remaining in the SPEs afterpayment to investors in the securitization of the contractual rate of returns, most of such excess cash isdistributed to the Company and its subsidiaries for payments of the subordinated interests.
Trusts or SPEs used in securitization transactions have been consolidated if the Company and itssubsidiaries are the primary beneficiary of the trusts or SPEs.
During fiscal 2015, 2016 and 2017, there was no securitization transaction accounted for as a sale.
F-73

NOTES TO CONSOLIDATED FINANCIAL STATEMENTS—(Continued)
ORIX Corporation and Subsidiaries
Quantitative information about delinquencies, impaired loans and components of financial assets sold onsecuritization and other assets managed together as of March 31, 2016 and 2017, and quantitative informationabout net credit loss for fiscal 2015, 2016 and 2017 are as follows:
Millions of yen
Total principalamount ofreceivables
Principal amount ofreceivables that are
90 days or morepast-due and
impaired loans
March 31, 2016 March 31, 2017 March 31, 2016 March 31, 2017
Direct financing leases . . . . . . . . . . . . . . . . . . . . . ¥1,190,136 ¥1,204,024 ¥12,556 ¥11,600Installment loans . . . . . . . . . . . . . . . . . . . . . . . . . . 2,592,233 2,815,706 81,771 68,747
3,782,369 4,019,730 94,327 80,347Direct financing leases sold on securitization . . . . 706 0 0 0
Total . . . . . . . . . . . . . . . . . . . . . . . . . . . . . . . . . . . . ¥3,783,075 ¥4,019,730 ¥94,327 ¥80,347
Millions of yen
Credit loss
2015 2016 2017
Direct financing leases . . . . . . . . . . . . . . . . . . . . . . . . . . . . . . . . . . . . . . . . . . . . . . . ¥ 3,774 ¥ 4,062 ¥ 4,056Installment loans . . . . . . . . . . . . . . . . . . . . . . . . . . . . . . . . . . . . . . . . . . . . . . . . . . . 22,019 13,442 17,766
25,793 17,504 21,822Direct financing leases sold on securitization . . . . . . . . . . . . . . . . . . . . . . . . . . . . . 0 0 0
Total . . . . . . . . . . . . . . . . . . . . . . . . . . . . . . . . . . . . . . . . . . . . . . . . . . . . . . . . . . . . . ¥25,793 ¥17,504 ¥21,822
A certain subsidiary originates and sells loans into the secondary market while retaining the obligation toservice those loans. In addition, it undertakes obligations to service loans originated by others. The servicingassets related to those servicing activities are included in other assets and roll-forwards of the amount of theservicing assets during fiscal 2016 and 2017 are as follows:
Millions of yen
2016 2017
Beginning balance . . . . . . . . . . . . . . . . . . . . . . . . . . . . . . . . . . . . . . . . . . . . . . . . . . . ¥18,376 ¥16,852Increase mainly from loans sold with servicing retained . . . . . . . . . . . . . . . . . 4,077 4,118Decrease mainly from amortization . . . . . . . . . . . . . . . . . . . . . . . . . . . . . . . . . (4,467) (3,625)Increase (Decrease) from the effects of changes in foreign exchange rates . . . (1,134) (42)
Ending balance . . . . . . . . . . . . . . . . . . . . . . . . . . . . . . . . . . . . . . . . . . . . . . . . . . . . . ¥16,852 ¥17,303
The fair value of the servicing assets as of March 31, 2016 and 2017 are as follows:
Millions of yen
March 31, 2016 March 31, 2017
Beginning balance . . . . . . . . . . . . . . . . . . . . . . . . . . . . . . . . . . . . . . . . . . . . . . . . . . . ¥27,676 ¥24,229Ending balance . . . . . . . . . . . . . . . . . . . . . . . . . . . . . . . . . . . . . . . . . . . . . . . . . . . . . ¥24,229 ¥24,907
F-74

NOTES TO CONSOLIDATED FINANCIAL STATEMENTS—(Continued)
ORIX Corporation and Subsidiaries
11. Variable Interest Entities
The Company and its subsidiaries use special purpose companies, partnerships and trusts (hereinafterreferred to as SPEs) in the ordinary course of business.
These SPEs are not always controlled by voting rights, and there are cases where voting rights do not existfor these SPEs. The Company and its subsidiaries determine a variable interest entity (hereinafter referred to asVIE) among those SPEs when (a) the total equity investment at risk is not sufficient to permit the entity tofinance its activities without additional subordinated financial support provided by any parties, including theequity holders or (b) as a group, the holders of the equity investment at risk do not have (1) the ability to makedecisions about an entity’s activities that most significantly impact the entity’s economic performance throughvoting rights or similar rights, (2) the obligation to absorb the expected losses of the entity or (3) the right toreceive the expected residual returns of the entity.
The Company and its subsidiaries perform a qualitative analysis to identify the primary beneficiary of VIEs.An enterprise that has both of the following characteristics is considered to be the primary beneficiary andtherefore results in the consolidation of the VIE:
• The power to direct the activities of a VIE that most significantly impact the entity’s economicperformance
• The obligation to absorb losses of the entity that could potentially be significant to the VIE or the rightto receive benefits from the entity that could potentially be significant to the VIE
All facts and circumstances are taken into consideration when determining whether the Company and itssubsidiaries have variable interests that would deem it the primary beneficiary and therefore requireconsolidation of the VIE. The Company and its subsidiaries make ongoing reassessment of whether they are theprimary beneficiaries of a VIE.
The following are the items that the Company and its subsidiaries are considering in a qualitativeassessment:
• Which activities most significantly impact the economic performance of the VIE and who has the powerto direct such activities
• Characteristics of the Company and its subsidiaries’ variable interest or interests and other involvements(including involvement of related parties and de facto agents)
• Involvement of other variable interest holders
• The entity’s purpose and design, including the risks that the entity was designed to create and passthrough to its variable interest holders
The Company and its subsidiaries generally consider the following types of involvement to be significantwhen determining the primary beneficiary:
• Designing the structuring of a transaction
• Providing an equity investment and debt financing
• Being the investment manager, asset manager or servicer and receiving variable fees
• Providing liquidity and other financial support
The Company and its subsidiaries do not have the power to direct activities of the VIEs that mostsignificantly impact the VIEs’ economic performance if that power is shared among multiple unrelated parties,and accordingly do not consolidate such VIEs.
F-75

NOTES TO CONSOLIDATED FINANCIAL STATEMENTS—(Continued)
ORIX Corporation and Subsidiaries
Information about VIEs (consolidated and non-consolidated) for the Company and its subsidiaries are asfollows:
1. Consolidated VIEs
March 31, 2016 *4
Millions of yen
Types of VIEsTotal
assets*1Total
liabilities*1
Assets whichare pledged as
collateral*2 Commitments*3
(a) VIEs for liquidating customer assets . . . . . . . . . . . . . . . . . . . . . . . . ¥ 0 ¥ 0 ¥ 0 ¥ 0(b) VIEs for acquisition of real estate and real estate development
projects for customers . . . . . . . . . . . . . . . . . . . . . . . . . . . . . . . . . . . 953 0 0 0(c) VIEs for acquisition of real estate for the Company and its
subsidiaries’ real estate-related business . . . . . . . . . . . . . . . . . . . . . 174,854 56,325 113,869 7,000(d) VIEs for corporate rehabilitation support business . . . . . . . . . . . . . 2,055 40 0 0(e) VIEs for investment in securities . . . . . . . . . . . . . . . . . . . . . . . . . . . 24,882 9,657 17,336 2,422(f) VIEs for securitizing financial assets such as direct financing
lease receivable and loan receivable . . . . . . . . . . . . . . . . . . . . . . . . 381,313 256,620 346,169 0(g) VIEs for securitization of loan receivable originated by third
parties . . . . . . . . . . . . . . . . . . . . . . . . . . . . . . . . . . . . . . . . . . . . . . . . 21,550 20,548 21,550 0(h) VIEs for power generation projects . . . . . . . . . . . . . . . . . . . . . . . . . 159,593 82,535 88,119 121,390(i) Other VIEs . . . . . . . . . . . . . . . . . . . . . . . . . . . . . . . . . . . . . . . . . . . . 216,632 97,979 213,466 0
Total . . . . . . . . . . . . . . . . . . . . . . . . . . . . . . . . . . . . . . . . . . . . . . . . . ¥981,832 ¥523,704 ¥800,509 ¥130,812
March 31, 2017
Millions of yen
Types of VIEsTotal
assets*1Total
liabilities*1
Assets whichare pledged as
collateral*2 Commitments*3
(a) VIEs for liquidating customer assets . . . . . . . . . . . . . . . . . . . . . . . . ¥ 0 ¥ 0 ¥ 0 ¥ 0(b) VIEs for acquisition of real estate and real estate development
projects for customers . . . . . . . . . . . . . . . . . . . . . . . . . . . . . . . . . . . 663 0 0 0(c) VIEs for acquisition of real estate for the Company and its
subsidiaries’ real estate-related business . . . . . . . . . . . . . . . . . . . . . 127,425 39,877 75,382 7,000(d) VIEs for corporate rehabilitation support business . . . . . . . . . . . . . 1,544 16 0 0(e) VIEs for investment in securities . . . . . . . . . . . . . . . . . . . . . . . . . . . 50,411 2,027 5,567 1,995(f) VIEs for securitizing financial assets such as direct financing
lease receivable and loan receivable . . . . . . . . . . . . . . . . . . . . . . . . 338,138 228,935 307,315 0(g) VIEs for securitization of loan receivable originated by third
parties . . . . . . . . . . . . . . . . . . . . . . . . . . . . . . . . . . . . . . . . . . . . . . . . 18,683 17,202 18,683 0(h) VIEs for power generation projects . . . . . . . . . . . . . . . . . . . . . . . . . 212,153 111,404 127,993 84,227(i) Other VIEs . . . . . . . . . . . . . . . . . . . . . . . . . . . . . . . . . . . . . . . . . . . . 202,386 72,447 168,353 0
Total . . . . . . . . . . . . . . . . . . . . . . . . . . . . . . . . . . . . . . . . . . . . . . . . . ¥951,403 ¥471,908 ¥703,293 ¥ 93,222
*1 The assets of most VIEs are used only to repay the liabilities of the VIEs, and the creditors of the liabilities of most VIEshave no recourse to other assets of the Company and its subsidiaries.
*2 The assets are pledged as collateral by VIE for financing of the VIE.*3 This item represents remaining balance of commitments that could require the Company and its subsidiaries to provide
investments or loans to the VIE.*4 The amounts as of March 31, 2016 were disclosed according to ASC 810 (“Consolidation”) before amendment, and were
not adjusted to reflect the Accounting Standards Update 2015-02 (“Amendments to the ConsolidationAnalysis”—ASC 810 (“Consolidation”)).
F-76

NOTES TO CONSOLIDATED FINANCIAL STATEMENTS—(Continued)
ORIX Corporation and Subsidiaries
2. Non-consolidated VIEs
March 31, 2016 *2
Millions of yen
Carrying amount of thevariable interests in the
VIEs held by the Companyand its subsidiaries
Types of VIEs Total assets
Specifiedbonds and
non-recourseloans Investments
Maximumexposureto loss*1
(a) VIEs for liquidating customer assets . . . . . . . . . . . . . . . . . . . . . . . . . . ¥ 33,406 ¥ 0 ¥ 2,091 ¥ 9,551(b) VIEs for acquisition of real estate and real estate development
projects for customers . . . . . . . . . . . . . . . . . . . . . . . . . . . . . . . . . . . . . 170,001 4,776 13,039 24,964(c) VIEs for acquisition of real estate for the Company and its
subsidiaries’ real estate-related business . . . . . . . . . . . . . . . . . . . . . . . 0 0 0 0(d) VIEs for corporate rehabilitation support business . . . . . . . . . . . . . . . 0 0 0 0(e) VIEs for investment in securities . . . . . . . . . . . . . . . . . . . . . . . . . . . . 2,964,616 0 26,174 47,636(f) VIEs for securitizing financial assets such as direct financing lease
receivable and loan receivable . . . . . . . . . . . . . . . . . . . . . . . . . . . . . . . 0 0 0 0(g) VIEs for securitization of loan receivable originated by third
parties . . . . . . . . . . . . . . . . . . . . . . . . . . . . . . . . . . . . . . . . . . . . . . . . . 1,070,683 0 10,671 10,721(h) VIEs for power generation projects . . . . . . . . . . . . . . . . . . . . . . . . . . . 20,007 0 1,182 1,182(i) Other VIEs . . . . . . . . . . . . . . . . . . . . . . . . . . . . . . . . . . . . . . . . . . . . . . 104,284 0 4,868 4,868
Total . . . . . . . . . . . . . . . . . . . . . . . . . . . . . . . . . . . . . . . . . . . . . . . . . . . ¥ 4,362,997 ¥4,776 ¥ 58,025 ¥ 98,922
March 31, 2017 *3
Millions of yen
Total assets
Carrying amount of thevariable interests in the
VIEs held by the Companyand its subsidiaries
Types of VIEs
Specifiedbonds and
non-recourseloans Investments
Maximumexposureto loss*1
(a) VIEs for liquidating customer assets . . . . . . . . . . . . . . . . . . . . . . . . . . ¥ 8,671 ¥ 0 ¥ 991 ¥ 991(b) VIEs for acquisition of real estate and real estate development
projects for customers . . . . . . . . . . . . . . . . . . . . . . . . . . . . . . . . . . . . . 96,187 0 11,130 11,194(c) VIEs for acquisition of real estate for the Company and its
subsidiaries’ real estate-related business . . . . . . . . . . . . . . . . . . . . . . . 0 0 0 0(d) VIEs for corporate rehabilitation support business . . . . . . . . . . . . . . . 0 0 0 0(e) VIEs for investment in securities . . . . . . . . . . . . . . . . . . . . . . . . . . . . 30,299,519 0 80,211 109,310(f) VIEs for securitizing financial assets such as direct financing lease
receivable and loan receivable . . . . . . . . . . . . . . . . . . . . . . . . . . . . . . . 0 0 0 0(g) VIEs for securitization of loan receivable originated by third
parties . . . . . . . . . . . . . . . . . . . . . . . . . . . . . . . . . . . . . . . . . . . . . . . . . 1,744,471 0 18,448 18,483(h) VIEs for power generation projects . . . . . . . . . . . . . . . . . . . . . . . . . . . 12,414 0 1,719 3,729(i) Other VIEs . . . . . . . . . . . . . . . . . . . . . . . . . . . . . . . . . . . . . . . . . . . . . . 319,520 4,864 17,963 25,260
Total . . . . . . . . . . . . . . . . . . . . . . . . . . . . . . . . . . . . . . . . . . . . . . . . . . . ¥32,480,782 ¥4,864 ¥130,462 ¥168,967
*1 Maximum exposure to loss includes remaining balance of commitments that could require the Company and itssubsidiaries to provide investments or loans to the VIE.
F-77

NOTES TO CONSOLIDATED FINANCIAL STATEMENTS—(Continued)
ORIX Corporation and Subsidiaries
*2 The amounts as of March 31, 2016 were disclosed according to ASC 810 (“Consolidation”) before amendment, and werenot adjusted to reflect the Accounting Standards Update 2015-02 (“Amendments to the ConsolidationAnalysis”—ASC 810 (“Consolidation”)).
*3 On April 1, 2016, the Company and its subsidiaries adopted the Accounting Standards Update 2015-02 (“Amendments tothe Consolidation Analysis”—ASC 810 (“Consolidation”)), issued in February 2015. As a result of the adoption, theeffect on the non-consolidated VIEs as of April 1, 2016 was an increase of ¥2,401,930 million in total assets, an increaseof ¥56,931 million in investments and an increase of ¥69,660 million in maximum exposure to loss. This was dueprimarily to the increases of ¥2,021,460 million in total assets, ¥49,275 million in investments and ¥62,003 million inmaximum exposure to loss, included in “(e) VIEs for investment in securities.”
(a) VIEs for liquidating customer assets
The Company and its subsidiaries may use VIEs in structuring financing for customers to liquidate specificcustomer assets. The VIEs are typically used to provide a structure that is bankruptcy remote with respect to thecustomer and the use of VIE structure is requested by such customer. Such VIEs typically acquire assets to beliquidated from the customer, borrow non-recourse loans from financial institutions and have an equityinvestment made by the customer. By using cash flows from the liquidated assets, these VIEs repay the loan andpay dividends to equity investors if sufficient funds exist.
Variable interests of non-consolidated VIEs, which the Company and its subsidiaries have, are mainlyincluded in other assets in the Company’s consolidated balance sheets. The Company has a commitmentagreement by which the Company may be required to make additional investment in certain suchnon-consolidated VIEs.
(b) VIEs for acquisition of real estate and real estate development projects for customers
Customers and the Company and its subsidiaries are involved with VIEs formed to acquire real estate and/ordevelop real estate projects. In each case, a customer establishes and makes an equity investment in a VIE that isdesigned to be bankruptcy remote from the customer. The VIEs acquire real estate and/or develop real estateprojects.
The Company and its subsidiaries provide non-recourse loans to such VIEs and hold specified bonds issuedby them and/or make investments in them. The Company and its subsidiaries have consolidated certain VIEsbecause the Company or its subsidiary effectively controls the VIEs by acting as the asset manager of the VIEs.
In the Company’s consolidated balance sheets, assets of consolidated VIEs are mainly included in cash andcash equivalents and liabilities of those consolidated VIEs are mainly included in other liabilities.
With respect to the variable interests of non-consolidated VIEs, which the Company and its subsidiarieshave, specified bonds are included in investment in securities, non-recourse loans are included in installmentloans, and investments are mainly included in investment in securities, investment in affiliates and other assets inthe Company’s consolidated balance sheets. The Company and its subsidiaries have commitment agreements bywhich the Company and its subsidiaries may be required to provide additional investment in certainnon-consolidated VIEs as long as the agreed-upon terms are met. Under these agreements, the Company and itssubsidiaries are committed to invest in these VIEs with the other investors based on their respective ownershippercentages. The Company and its subsidiaries concluded that the VIEs are not consolidated because the powerto direct these VIEs is held by unrelated parties. In some cases, the Company and its subsidiaries concluded thatthe VIEs are not consolidated because the power to direct these VIEs is shared among multiple unrelated parties.
F-78

NOTES TO CONSOLIDATED FINANCIAL STATEMENTS—(Continued)
ORIX Corporation and Subsidiaries
(c) VIEs for acquisition of real estate for the Company and its subsidiaries’ real estate-related business
The Company and its subsidiaries establish VIEs and acquire real estate to borrow non-recourse loans fromfinancial institutions and simplify the administration activities necessary for the real estate. The Company and itssubsidiaries consolidate such VIEs even though the Company and its subsidiaries may not have voting rights ifsubstantially all of such VIEs’ subordinated interests are issued to the Company and its subsidiaries, andtherefore the VIEs are controlled by and for the benefit of the Company and its subsidiaries.
In the Company’s consolidated balance sheets, assets of the consolidated VIEs are mainly included in cashand cash equivalents, restricted cash, investment in operating leases, property under facility operations and otherassets, and liabilities of those consolidated VIEs are mainly included in long-term debt. The Company has acommitment agreement by which the Company may be required to make additional investment in certain suchconsolidated VIEs.
(d) VIEs for corporate rehabilitation support business
Financial institutions, the Company and its subsidiary are involved with VIEs established for the corporaterehabilitation support business. VIEs receive the funds from investors including the financial institutions, theCompany and the subsidiary, and purchase loan receivables due from borrowers which have financial problems,but are deemed to have the potential to recover in the future. The servicing operations for the VIEs are conductedby the subsidiary.
The Company and its subsidiary consolidated such VIEs since the Company and the subsidiary have themajority of the investment share of such VIEs, and have the power to direct the activities of the VIEs that mostsignificantly impact the entities’ economic performance through the servicing operations.
In the Company’s consolidated balance sheets, assets of the consolidated VIEs are mainly included ininstallment loans, and liabilities of those consolidated VIEs are mainly included in other liabilities.
(e) VIEs for investment in securities
The Company and its subsidiaries have interests in VIEs that are investment funds and mainly invest inequity and debt securities. Such VIEs are managed by certain subsidiaries or fund management companies thatare independent of the Company and its subsidiaries.
Certain subsidiaries consolidated certain such VIEs since the subsidiaries has the majority of the investmentshare of them, and has the power to direct the activities of those VIEs that most significantly impact the entities’economic performance through involvement with the design of the VIEs or other means.
In the Company’s consolidated balance sheets, assets of the consolidated VIEs are mainly included ininvestment in securities and investment in affiliates, and liabilities of those consolidated VIEs are mainlyincluded in trade notes, accounts and other payable. A subsidiary has a commitment agreement by which thesubsidiary may be required to make additional investment in certain such consolidated VIEs.
Variable interests of non-consolidated VIEs, which the Company and its subsidiaries have, are included ininvestment in securities in the Company’s consolidated balance sheets. The Company and its subsidiaries have acommitment agreement by which the Company and its subsidiaries may be required to make additionalinvestment in certain such non-consolidated VIEs.
F-79

NOTES TO CONSOLIDATED FINANCIAL STATEMENTS—(Continued)
ORIX Corporation and Subsidiaries
(f) VIEs for securitizing financial assets such as direct financing lease receivable and loan receivable
The Company and its subsidiaries use VIEs to securitize financial assets such as direct financing leasesreceivables and loans receivables. In the securitization process, these financial assets are transferred to SPEs, andthe SPEs issue beneficial interests or securities backed by the transferred financial assets to investors. After thesecuritization, the Company and its subsidiaries continue to hold a subordinated part of the securities and act as aservicer.
The Company and its subsidiaries consolidated such VIEs since the Company and its subsidiaries have thepower to direct the activities that most significantly impact the entity’s economic performance by designing thesecuritization scheme and conducting servicing activities, and have a responsibility to absorb losses of the VIEsthat could potentially be significant to the entities by retaining the subordinated part of the securities.
In the Company’s consolidated balance sheets, assets of the consolidated VIEs are mainly included inrestricted cash, investment in direct financing leases and installment loans, and liabilities of those consolidatedVIEs are mainly included in long-term debt.
(g) VIEs for securitization of loan receivable originated by third parties
The Company and its subsidiaries invest in CMBS, RMBS and other asset-backed securities originated bythird parties. In some cases of such securitization, certain subsidiaries hold the subordinated portion and thesubsidiaries act as a special-servicer of the securitization transaction. As the special servicer, the subsidiarieshave rights to dispose of real estate collateral related to the securitized commercial mortgage loans.
The subsidiaries consolidate certain of these VIEs when the subsidiaries have the power to direct theactivities of the VIEs that most significantly impact the entities’ economic performance through its role asspecial-servicer, including the right to dispose of the collateral, and have a responsibility to absorb losses of theVIEs that could potentially be significant to the entities by holding the subordinated part of the securities.
In the Company’s consolidated balance sheets, assets of the consolidated VIEs are mainly included ininstallment loans, and liabilities of those consolidated VIEs are mainly included in long-term debt.
Variable interests of non-consolidated VIEs, which the Company and its subsidiaries have, are included ininvestment in securities in the Company’s consolidated balance sheets. The Company has a commitmentagreement by which the Company may be required to make additional investment in certain suchnon-consolidated VIEs.
(h) VIEs for power generation projects
The Company and its subsidiaries may use VIEs in power generation projects. VIEs receive the funds fromthe Company and its subsidiaries, install solar panels on acquired or leased lands, and sell the generated power toelectric power companies. The Company and its subsidiaries have consolidated certain VIEs because theCompany and its subsidiaries have the majority of the investment shares of such VIEs and effectively control theVIEs by acting as the asset manager of the VIEs.
In the Company’s consolidated balance sheets, assets of the consolidated VIEs are mainly included inrestricted cash, property under facility operations and other assets, and liabilities of those consolidated VIEs aremainly included in long-term debt and other liabilities. The Company has commitment agreements by which theCompany may be required to make additional investment or execute loans in certain such consolidated VIEs.
Variable interests of non-consolidated VIEs, which the Company has, is included in investment in securitiesin the Company’s consolidated balance sheets.
F-80

NOTES TO CONSOLIDATED FINANCIAL STATEMENTS—(Continued)
ORIX Corporation and Subsidiaries
(i) Other VIEs
The Company and its subsidiaries are involved with other types of VIEs for various purposes. Consolidatedand non-consolidated VIEs of this category are mainly kumiai structures. In addition, certain subsidiaries hasconsolidated VIEs that are not included in the categories (a) through (h) above, because the subsidiaries hold thesubordinated portion of the VIEs and the VIEs are effectively controlled by the subsidiaries.
In Japan, certain subsidiaries provide investment products to their customers that employ a contractualmechanism known as a kumiai, which in part result in the subsidiaries forming a type of SPE. As a means tofinance the purchase of aircraft or other large-ticket items to be leased to third parties, the Company and itssubsidiaries arrange and market kumiai products to investors, who invest a portion of the funds necessary into thekumiai structure. The remainder of the purchase funds is borrowed by the kumiai structure in the form of anon-recourse loan from one or more financial institutions. The kumiai investors (and any lenders to the kumiaistructure) retain all of the economic risks and rewards in connection with purchasing and leasing activities of thekumiai structure, and all related gains or losses are recorded on the financial statements of the investors in thekumiai. The Company and its subsidiaries are responsible for the arrangement and marketing of these productsand may act as servicer or administrator in kumiai transactions. The fee income for the arrangement andadministration of these transactions is recognized in the Company’s consolidated statements of income. In somecases, the Company and its subsidiaries make investments in the kumiai or its related SPE, and these VIEs areconsolidated because the Company and its subsidiaries have a responsibility to absorb any significant potentialloss through the investments and have the power to direct the activities that most significantly impact theireconomic performance. In other cases, the Company and its subsidiaries are not considered to be the primarybeneficiary of the VIEs or kumiais because the Company and its subsidiaries did not make significantinvestments or guarantee or otherwise undertake any significant financial commitments or exposure with respectto the kumiai or its related SPE.
The Company may use VIEs to finance. The Company transfers its own held assets to SPEs, which borrownon-recourse loan from financial institutions and effectively pledge such assets as collateral. The Companycontinually holds subordinated interests in the SPEs and perform administrative work of such assets. TheCompany consolidates such SPEs because the Company has a right to direct the activities of them that mostsignificantly impact their economic performance by setting up the scheme and performing administrative work ofthe assets and has the obligation to absorb expected losses of them by holding the subordinated interests.
In the Company’s consolidated balance sheets, assets of the consolidated VIEs are mainly included ininvestment in operating leases, investment in affiliates and office facilities, and liabilities of those consolidatedVIEs are mainly included in long-term debt.
Variable interests in non-consolidated VIEs, which the Company and its subsidiaries hold, are mainlyincluded in investment in securities in the Company’s consolidated balance sheets. The Company and itssubsidiaries have a commitment agreement by which the Company and its subsidiaries may be required to makeadditional investment in certain such non-consolidated VIEs.
F-81

NOTES TO CONSOLIDATED FINANCIAL STATEMENTS—(Continued)
ORIX Corporation and Subsidiaries
12. Investment in Affiliates
Investment in affiliates at March 31, 2016 and 2017 consists of the following:
Millions of yen
2016 2017
Shares . . . . . . . . . . . . . . . . . . . . . . . . . . . . . . . . . . . . . . . . . . . . . . . . . . . . . . . . . . . . . . . . . . ¥499,922 ¥485,386Loans and others . . . . . . . . . . . . . . . . . . . . . . . . . . . . . . . . . . . . . . . . . . . . . . . . . . . . . . . . . . 30,745 38,848
¥530,667 ¥524,234
Certain affiliates are listed on stock exchanges. The aggregate investment in and quoted market value ofthose affiliates amounted to ¥110,121 million and ¥110,568 million, respectively, as of March 31, 2016 and¥127,121 million and ¥159,867 million, respectively, as of March 31, 2017.
In fiscal 2015, 2016 and 2017, the Company and its subsidiaries received dividends from affiliates of¥18,186 million, ¥30,063 million and ¥14,913 million, respectively.
The balance of excess of cost over the underlying equity at acquisition dates of investment in affiliatesamounted to ¥101,289 million and ¥96,649 million as of March 31, 2016 and 2017, respectively.
From fiscal 2016, the Company no longer has the ability to exercise significant influence on ORIX JREITInc., and therefore has excluded ORIX JREIT Inc. from investment in affiliates accounted for by using the equitymethod. The transactions during the period accounted for by the equity method are described below.
ORIX JREIT Inc., formerly an equity method affiliate, entered into an asset management agreement and thelike with one of the Company’s subsidiaries and paid fees of ¥2,433 million, ¥1,937 million for fiscal 2015 and2016, respectively.
In fiscal 2015 and 2016, the Company and certain subsidiaries sold to ORIX JREIT Inc., office buildings,commercial facilities other than office buildings, and condominiums mainly under operating leases. In fiscal2015 and 2016, the Company and the subsidiaries recognized gains of ¥10,473 million, ¥1,744 million,respectively in earnings as operating leases. The related intercompany profits have been eliminated based on theCompany’s proportionate share.
Combined and condensed information relating to the affiliates for fiscal 2015, 2016 and 2017 are as follows(some operation data for entities reflect only the period since the Company and its subsidiaries made theinvestment and on a lag basis):
Millions of yen
2015 2016 2017
Operations:Total revenues . . . . . . . . . . . . . . . . . . . . . . . . . . . . . . . . . . . . . . . . . . ¥1,094,317 ¥1,333,838 ¥1,394,872Income before income taxes . . . . . . . . . . . . . . . . . . . . . . . . . . . . . . . 130,799 177,535 154,162Net income . . . . . . . . . . . . . . . . . . . . . . . . . . . . . . . . . . . . . . . . . . . . 109,865 141,964 109,183
Financial position:Total assets . . . . . . . . . . . . . . . . . . . . . . . . . . . . . . . . . . . . . . . . . . . . ¥6,897,921 ¥8,350,901 ¥8,452,544Total liabilities . . . . . . . . . . . . . . . . . . . . . . . . . . . . . . . . . . . . . . . . . 5,131,402 6,206,321 6,075,513Total equity . . . . . . . . . . . . . . . . . . . . . . . . . . . . . . . . . . . . . . . . . . . . 1,766,519 2,144,580 2,377,031
The Company and its subsidiaries had no significant transactions with these companies except as describedabove.
F-82

NOTES TO CONSOLIDATED FINANCIAL STATEMENTS—(Continued)
ORIX Corporation and Subsidiaries
13. Goodwill and Other Intangible Assets
Changes in goodwill by reportable segment for fiscal 2015, 2016 and 2017 are as follows:
Millions of yen
CorporateFinancialServices
MaintenanceLeasing
RealEstate
Investmentand
Operation RetailOverseasBusiness Total
Balance at March 31, 2014Goodwill . . . . . . . . . . . . . . . . . . . . . ¥ 1,304 ¥282 ¥19,300 ¥ 26,250 ¥15,424 ¥273,643 ¥336,203Accumulated impairment losses . . . (257) 0 0 (39) 0 0 (296)
1,047 282 19,300 26,211 15,424 273,643 335,907Acquired . . . . . . . . . . . . . . . . . . . . . . . . . 53,741 0 0 17,967 0 12,043 83,751Impairment . . . . . . . . . . . . . . . . . . . . . . . (550) 0 (8,708) 0 0 (587) (9,845)Other (net)* . . . . . . . . . . . . . . . . . . . . . . . 0 0 (97) (376) 0 (36,725) (37,198)
Balance at March 31, 2015Goodwill . . . . . . . . . . . . . . . . . . . . . 55,045 282 19,203 43,841 15,424 248,961 382,756Accumulated impairment losses . . . (807) 0 (8,708) (39) 0 (587) (10,141)
54,238 282 10,495 43,802 15,424 248,374 372,615Acquired . . . . . . . . . . . . . . . . . . . . . . . . . 1,158 0 0 29,365 0 3,796 34,319Impairment . . . . . . . . . . . . . . . . . . . . . . . (30) 0 0 0 0 0 (30)Other (net)* . . . . . . . . . . . . . . . . . . . . . . . 0 0 0 (6,260) 0 (68,491) (74,751)
Balance at March 31, 2016Goodwill . . . . . . . . . . . . . . . . . . . . . 56,203 282 19,203 66,946 15,424 184,266 342,324Accumulated impairment losses . . . (837) 0 (8,708) (39) 0 (587) (10,171)
55,366 282 10,495 66,907 15,424 183,679 332,153Acquired . . . . . . . . . . . . . . . . . . . . . . . . . 0 0 0 26,316 0 7,054 33,370Impairment . . . . . . . . . . . . . . . . . . . . . . . 0 0 0 0 0 (2,785) (2,785)Other (net)* . . . . . . . . . . . . . . . . . . . . . . . 0 0 (31) (11,342) 0 (10,187) (21,560)
Balance at March 31, 2017Goodwill . . . . . . . . . . . . . . . . . . . . . 56,203 282 19,172 81,920 15,424 181,133 354,134Accumulated impairment losses . . . (837) 0 (8,708) (39) 0 (3,372) (12,956)
¥55,366 ¥282 ¥10,464 ¥ 81,881 ¥15,424 ¥177,761 ¥341,178
* Other includes foreign currency translation adjustments, decreases due to sale of ownership interest insubsidiaries and certain other reclassifications. In the Overseas Business segment, there was a decrease of¥39,694 million during fiscal 2015 due to the partial sale of shares of STX Energy, which as a result of the salechanged from a consolidated subsidiary to an equity method affiliate. In the Overseas Business segment, therewas a decrease of ¥57,153 million during fiscal 2016 due to the partial sale of shares of Houlihan Lokey,which as a result of the sale changed from a consolidated subsidiary to an equity method affiliate.
As a result of the impairment test, the Company and its subsidiaries recognized impairment losses ongoodwill of ¥550 million in Corporate Financial Services segment, ¥8,708 million on golf business included inReal Estate segment, ¥587 million in Overseas Business segment during fiscal 2015. These impairment losses areincluded in other (income) and expense, net in the consolidated statements of income. The impairment loss ongolf business was recognized as a result of reduction in estimated future cash flow due to our additional capitalinvestment in the slower market growth, which brought the fair value of the reporting unit below its carryingamount. The Company and its subsidiaries recognized an impairment loss on goodwill of ¥30 million in
F-83

NOTES TO CONSOLIDATED FINANCIAL STATEMENTS—(Continued)
ORIX Corporation and Subsidiaries
Corporate Financial Services segment during fiscal 2016. This impairment loss is included in other (income) andexpense, net in the consolidated statements of income. The fair values of the reporting units were measured usingmainly the discounted cash flow methodologies and the business enterprise value multiples methodologies. TheCompany and its subsidiaries recognized an impairment loss on goodwill of ¥2,785 million in Overseas Businesssegment during fiscal 2017. This impairment loss is included in other (income) and expense, net in theconsolidated statements of income. This impairment loss was recognized as a result of reduction in the fair valueof an overseas subsidiary due to increases in the credit losses from installment loans, which brought the fair valueof the reporting unit below its carrying amount.
Other intangible assets at March 31, 2016 and 2017 consist of the following:
Millions of yen
2016 2017
Intangible assets that have indefinite useful lives:Trade names . . . . . . . . . . . . . . . . . . . . . . . . . . . . . . . . . . . . . . . . . . . . . . . . . . . . . . . . . ¥ 75,860 ¥ 74,489Asset management contracts . . . . . . . . . . . . . . . . . . . . . . . . . . . . . . . . . . . . . . . . . . . . . 150,686 141,352Others . . . . . . . . . . . . . . . . . . . . . . . . . . . . . . . . . . . . . . . . . . . . . . . . . . . . . . . . . . . . . . 3,906 6,395
230,452 222,236
Intangible assets subject to amortization:Software . . . . . . . . . . . . . . . . . . . . . . . . . . . . . . . . . . . . . . . . . . . . . . . . . . . . . . . . . . . . 94,898 89,714Customer relationships . . . . . . . . . . . . . . . . . . . . . . . . . . . . . . . . . . . . . . . . . . . . . . . . . 125,081 117,716Others . . . . . . . . . . . . . . . . . . . . . . . . . . . . . . . . . . . . . . . . . . . . . . . . . . . . . . . . . . . . . . 32,388 73,866
252,367 281,296Accumulated amortization . . . . . . . . . . . . . . . . . . . . . . . . . . . . . . . . . . . . . . . . . . . . . . (96,485) (107,481)
Net . . . . . . . . . . . . . . . . . . . . . . . . . . . . . . . . . . . . . . . . . . . . . . . . . . . . . . . . . . . . . . . . . 155,882 173,815
¥386,334 ¥ 396,051
The aggregate amortization expenses for intangible assets are ¥23,164 million, ¥25,848 million and¥26,252 million in fiscal 2015, 2016 and 2017, respectively.
The estimated amortization expenses for each of five succeeding fiscal years are ¥23,594 million in fiscal2018, ¥22,078 million in fiscal 2019, ¥20,447 million in fiscal 2020, ¥15,877 million in fiscal 2021 and¥13,249 million in fiscal 2022, respectively.
Intangible assets subject to amortization increased during fiscal 2017 are ¥38,658 million. They mainlyconsist of ¥8,203 million of software and ¥13,036 million of license recognized in acquisitions. The weightedaverage amortization periods for the software and the license recognized in acquisitions are 7 years and 25 years,respectively.
As a result of the impairment test, the Company and its subsidiaries recognized impairment losses of¥358 million on intangible assets included in mainly Corporate Financial Services segment, during fiscal 2015.The Company and its subsidiaries recognized an impairment loss of ¥295 million on intangible assets included inInvestment and Operation segment, during fiscal 2016. The Company and its subsidiaries recognized animpairment loss of ¥411 million on intangible assets included in Overseas Business segment during fiscal 2017.These impairment losses are included in other (income) and expense, net in the consolidated statements ofincome. These impairment losses are recognized due to the reduction in the estimated future cash flow, whichbrought the fair values of the intangible assets below its carrying amount. The fair values of the intangible assetswere measured using the discounted cash flow methodologies.
F-84

NOTES TO CONSOLIDATED FINANCIAL STATEMENTS—(Continued)
ORIX Corporation and Subsidiaries
14. Short-Term and Long-Term Debt
Short-term debt consists of borrowings from financial institutions and commercial paper.
The composition of short-term debt and the weighted average contract interest rate on short-term debt atMarch 31, 2016 and 2017 are as follows:
March 31, 2016
Millions of yenWeighted
average rate
Short-term debt in Japan, mainly from banks . . . . . . . . . . . . . . . . . . . . . . . . . . . . . . . . ¥ 80,846 0.5%Short-term debt outside Japan, mainly from banks . . . . . . . . . . . . . . . . . . . . . . . . . . . . 166,417 2.2Commercial paper in Japan . . . . . . . . . . . . . . . . . . . . . . . . . . . . . . . . . . . . . . . . . . . . . . 94,786 0.1Commercial paper outside Japan . . . . . . . . . . . . . . . . . . . . . . . . . . . . . . . . . . . . . . . . . . 7,575 4.0
¥349,624 1.3
March 31, 2017
Millions of yenWeighted
average rate
Short-term debt in Japan, mainly from banks . . . . . . . . . . . . . . . . . . . . . . . . . . . . . . . . ¥ 79,494 0.8%Short-term debt outside Japan, mainly from banks . . . . . . . . . . . . . . . . . . . . . . . . . . . . 153,877 2.8Commercial paper in Japan . . . . . . . . . . . . . . . . . . . . . . . . . . . . . . . . . . . . . . . . . . . . . . 50,096 0.0Commercial paper outside Japan . . . . . . . . . . . . . . . . . . . . . . . . . . . . . . . . . . . . . . . . . . 0 0.0
¥283,467 1.7
The composition of long-term debt, the weighted average contract interest rate on long-term debt and therepayment due dates at March 31, 2016 and 2017 are as follows:
March 31, 2016
Due(Fiscal Year) Millions of yen
Weightedaverage rate
Banks:Fixed rate . . . . . . . . . . . . . . . . . . . . . . . . . . . . . . . . . . . . . . . . . . . . . 2017~2033 ¥ 521,491 1.8%Floating rate . . . . . . . . . . . . . . . . . . . . . . . . . . . . . . . . . . . . . . . . . . . 2017~2033 1,599,803 0.9
Insurance companies and others:Fixed rate . . . . . . . . . . . . . . . . . . . . . . . . . . . . . . . . . . . . . . . . . . . . . 2018~2027 342,720 1.0Floating rate . . . . . . . . . . . . . . . . . . . . . . . . . . . . . . . . . . . . . . . . . . . 2017~2026 259,306 0.8
Unsecured bonds . . . . . . . . . . . . . . . . . . . . . . . . . . . . . . . . . . . . . . . . . . . 2017~2025 875,575 1.1Unsecured notes under medium-term note program . . . . . . . . . . . . . . . . 2017~2021 62,491 2.7Payables under securitized lease receivables . . . . . . . . . . . . . . . . . . . . . 2020~2021 129,005 0.3Payables under securitized loan receivables and investment in
securities . . . . . . . . . . . . . . . . . . . . . . . . . . . . . . . . . . . . . . . . . . . . . . . 2017~2039 146,527 2.6
¥3,936,918 1.1
F-85

NOTES TO CONSOLIDATED FINANCIAL STATEMENTS—(Continued)
ORIX Corporation and Subsidiaries
March 31, 2017
Due(Fiscal Year) Millions of yen
Weightedaverage
rate
Banks:Fixed rate . . . . . . . . . . . . . . . . . . . . . . . . . . . . . . . . . . . . . . . . . . . . . . . 2018~2035 ¥ 481,959 1.7%Floating rate . . . . . . . . . . . . . . . . . . . . . . . . . . . . . . . . . . . . . . . . . . . . . 2018~2077 1,613,795 1.0
Insurance companies and others:Fixed rate . . . . . . . . . . . . . . . . . . . . . . . . . . . . . . . . . . . . . . . . . . . . . . . 2020~2027 340,265 1.0Floating rate . . . . . . . . . . . . . . . . . . . . . . . . . . . . . . . . . . . . . . . . . . . . . 2019~2077 288,837 0.6
Unsecured bonds . . . . . . . . . . . . . . . . . . . . . . . . . . . . . . . . . . . . . . . . . . . . . 2018~2027 688,488 1.0Unsecured notes under medium-term note program . . . . . . . . . . . . . . . . . . 2019~2027 196,570 3.0Payables under securitized lease receivables . . . . . . . . . . . . . . . . . . . . . . . 2021~2023 103,212 0.4Payables under securitized loan receivables and investment in
securities . . . . . . . . . . . . . . . . . . . . . . . . . . . . . . . . . . . . . . . . . . . . . . . . . 2018~2039 141,858 2.6
¥3,854,984 1.2
Note: Prior-year amounts have been adjusted for the retrospective application of Accounting Standards Update2015-03(“Simplifying the Presentation of Debt Issuance Costs”—ASC 835-30 (“Interest—Imputation ofInterest”)) on April 1, 2016.
The repayment schedule for the next five years and thereafter for long-term debt at March 31, 2017 is asfollows:
Years ending March 31, Millions of yen
2018 . . . . . . . . . . . . . . . . . . . . . . . . . . . . . . . . . . . . . . . . . . . . . . . . . . . . . . . . . . . . . . . . . . . . . . . . . . . ¥ 825,0262019 . . . . . . . . . . . . . . . . . . . . . . . . . . . . . . . . . . . . . . . . . . . . . . . . . . . . . . . . . . . . . . . . . . . . . . . . . . . 634,7322020 . . . . . . . . . . . . . . . . . . . . . . . . . . . . . . . . . . . . . . . . . . . . . . . . . . . . . . . . . . . . . . . . . . . . . . . . . . . 469,4482021 . . . . . . . . . . . . . . . . . . . . . . . . . . . . . . . . . . . . . . . . . . . . . . . . . . . . . . . . . . . . . . . . . . . . . . . . . . . 465,3842022 . . . . . . . . . . . . . . . . . . . . . . . . . . . . . . . . . . . . . . . . . . . . . . . . . . . . . . . . . . . . . . . . . . . . . . . . . . . 440,728Thereafter . . . . . . . . . . . . . . . . . . . . . . . . . . . . . . . . . . . . . . . . . . . . . . . . . . . . . . . . . . . . . . . . . . . . . . 1,019,666
Total . . . . . . . . . . . . . . . . . . . . . . . . . . . . . . . . . . . . . . . . . . . . . . . . . . . . . . . . . . . . . . . . . . . . . . ¥3,854,984
Borrowings with floating rate from banks, insurance companies and others include the amount of¥94,000 million of subordinated syndicated loan (hybrid loan, whose maturity date is fiscal 2077), and¥60,000 million and ¥34,000 million can be repaid after 5 years, and 7 years respectively.
For borrowings from banks, insurance companies and other financial institutions, for bonds, and formedium-term notes, principal repayments are made upon maturity of the loan contracts and interest payments areusually paid semi-annually.
During fiscal 2015, 2016 and 2017, the Company and certain subsidiaries recognized net amortizationexpenses of premiums and discounts of bonds and medium-term notes, and deferred issuance costs of bonds andmedium-term notes in the amount of ¥367 million, ¥1,085 million and ¥924 million, respectively.
Total committed credit lines for the Company and its subsidiaries were ¥464,677 million and¥463,643 million at March 31, 2016 and 2017, respectively, and, of these lines, ¥389,903 million and
F-86

NOTES TO CONSOLIDATED FINANCIAL STATEMENTS—(Continued)
ORIX Corporation and Subsidiaries
¥393,968 million were available at March 31, 2016 and 2017, respectively. Of the available committed creditlines, ¥380,062 million and ¥356,164 million were long-term committed credit lines at March 31, 2016 and 2017,respectively.
The agreements related to debt payable to banks provide that the banks under certain circumstances mayrequest additional security for loans and have the right to offset cash deposited against any short-term or long-term debt that becomes due and, in case of default and certain other specified events, against all other debtpayable to the banks.
Other than the assets of the consolidated VIEs pledged as collateral for financing (see Note 11 “VariableInterest Entities”), the Company and certain subsidiaries provide the following assets as collateral for the short-term and long-term debt payables to financial institutions as of March 31, 2017:
Millions of yen
Minimum lease payments, loans and investment in operating leases . . . . . . . . . . . . . . . . . . . . . . . . . ¥102,339Investment in securities . . . . . . . . . . . . . . . . . . . . . . . . . . . . . . . . . . . . . . . . . . . . . . . . . . . . . . . . . . . . 172,084Property under facility operations . . . . . . . . . . . . . . . . . . . . . . . . . . . . . . . . . . . . . . . . . . . . . . . . . . . . 7,532Other assets and other . . . . . . . . . . . . . . . . . . . . . . . . . . . . . . . . . . . . . . . . . . . . . . . . . . . . . . . . . . . . . 17,643
¥299,598
As of March 31, 2017, debt liabilities was secured by shares of subsidiaries of ¥38,562 million, which waseliminated through consolidation adjustment, and debt liabilities of affiliates was secured by investment inaffiliates of ¥37,013 million. In addition, ¥40,290 million was pledged primarily by investment in securities forcollateral deposits, deposit for real estate transaction, and assets for liquidation of future rent as of March 31,2017.
Under loan agreements relating to short-term and long-term debt from commercial banks and certaininsurance companies, the Company and certain subsidiaries are required to provide collateral against these debtsat any time if requested by the lenders. The Company and the subsidiaries did not receive any such requests fromthe lenders as of March 31, 2017.
15. Deposits
Deposits at March 31, 2016 and 2017 consist of the following:
Millions of yen
2016 2017
Time deposits . . . . . . . . . . . . . . . . . . . . . . . . . . . . . . . . . . . . . . . . . . . . . . . . . . . . . . . ¥1,093,238 ¥1,200,240Other deposits . . . . . . . . . . . . . . . . . . . . . . . . . . . . . . . . . . . . . . . . . . . . . . . . . . . . . . . 305,234 414,368
Total . . . . . . . . . . . . . . . . . . . . . . . . . . . . . . . . . . . . . . . . . . . . . . . . . . . . . . . . . . ¥1,398,472 ¥1,614,608
The balances of time deposits and certificates of deposit issued in amounts of ¥10 million or more were¥648,697 million and ¥781,516 million at March 31, 2016 and 2017, respectively.
F-87

NOTES TO CONSOLIDATED FINANCIAL STATEMENTS—(Continued)
ORIX Corporation and Subsidiaries
The maturity schedule of time deposits at March 31, 2017 is as follows:
Years ending March 31, Millions of yen
2018 . . . . . . . . . . . . . . . . . . . . . . . . . . . . . . . . . . . . . . . . . . . . . . . . . . . . . . . . . . . . . . . . . . . . . . . . . . . ¥ 818,8402019 . . . . . . . . . . . . . . . . . . . . . . . . . . . . . . . . . . . . . . . . . . . . . . . . . . . . . . . . . . . . . . . . . . . . . . . . . . . 186,1192020 . . . . . . . . . . . . . . . . . . . . . . . . . . . . . . . . . . . . . . . . . . . . . . . . . . . . . . . . . . . . . . . . . . . . . . . . . . . 82,8942021 . . . . . . . . . . . . . . . . . . . . . . . . . . . . . . . . . . . . . . . . . . . . . . . . . . . . . . . . . . . . . . . . . . . . . . . . . . . 78,1502022 . . . . . . . . . . . . . . . . . . . . . . . . . . . . . . . . . . . . . . . . . . . . . . . . . . . . . . . . . . . . . . . . . . . . . . . . . . . 33,737Thereafter . . . . . . . . . . . . . . . . . . . . . . . . . . . . . . . . . . . . . . . . . . . . . . . . . . . . . . . . . . . . . . . . . . . . . . 500
Total . . . . . . . . . . . . . . . . . . . . . . . . . . . . . . . . . . . . . . . . . . . . . . . . . . . . . . . . . . . . . . . . . . . . . . ¥1,200,240
16. Income Taxes
Income before income taxes and discontinued operations, and the provision for income taxes in fiscal 2015,2016 and 2017 are as follows:
Millions of yen
2015 2016 2017
Income before income taxes and discontinued operations:Japan . . . . . . . . . . . . . . . . . . . . . . . . . . . . . . . . . . . . . . . . . . . . . . . . . . . . . . ¥188,601 ¥228,527 ¥302,995Overseas . . . . . . . . . . . . . . . . . . . . . . . . . . . . . . . . . . . . . . . . . . . . . . . . . . . 155,416 162,775 121,970
¥344,017 ¥391,302 ¥424,965
Provision for income taxes:Current—
Japan . . . . . . . . . . . . . . . . . . . . . . . . . . . . . . . . . . . . . . . . . . . . . . . . . . . . . . ¥ 9,455 ¥ 34,866 ¥ 85,963Overseas . . . . . . . . . . . . . . . . . . . . . . . . . . . . . . . . . . . . . . . . . . . . . . . . . . . 38,264 42,918 32,758
47,719 77,784 118,721
Deferred—Japan . . . . . . . . . . . . . . . . . . . . . . . . . . . . . . . . . . . . . . . . . . . . . . . . . . . . . . 36,112 34,315 20,859Overseas . . . . . . . . . . . . . . . . . . . . . . . . . . . . . . . . . . . . . . . . . . . . . . . . . . . 5,226 8,213 4,459
41,338 42,528 25,318
Provision for income taxes . . . . . . . . . . . . . . . . . . . . . . . . . . . . . . . . . . . . . . . . . ¥ 89,057 ¥120,312 ¥144,039
In fiscal 2015, the Company and its subsidiaries in Japan are subject to a National Corporation tax ofapproximately 26%, an Inhabitant tax of approximately 5% and a deductible Enterprise tax of approximately 8%,which in the aggregate result in a statutory income tax rate of approximately 35.9%. In fiscal 2016, the Companyand its subsidiaries in Japan are subject to a National Corporation tax of approximately 25%, an Inhabitant tax ofapproximately 4% and a deductible Enterprise tax of approximately 6%, which in the aggregate result in astatutory income tax rate of approximately 33.5%. In fiscal 2017, the Company and its subsidiaries in Japan aresubject to a National Corporation tax of approximately 24%, an Inhabitant tax of approximately 4% and adeductible Enterprise tax of approximately 4%, which in the aggregate result in a statutory income tax rate ofapproximately 31.7%.
F-88

NOTES TO CONSOLIDATED FINANCIAL STATEMENTS—(Continued)
ORIX Corporation and Subsidiaries
Reconciliations of the differences between the tax provision computed at the statutory rate and theconsolidated provision for income taxes in fiscal 2015, 2016 and 2017 are as follows:
Millions of yen
2015 2016 2017
Income before income taxes and discontinued operations . . . . . . . . . . . . . . . . . ¥344,017 ¥391,302 ¥424,965
Tax provision computed at statutory rate . . . . . . . . . . . . . . . . . . . . . . . . . . . . . . ¥123,502 ¥131,086 ¥134,714Increases (reductions) in taxes due to:
Change in valuation allowance* . . . . . . . . . . . . . . . . . . . . . . . . . . . . . . . . 1,839 (1,547) 57Non-deductible expenses for tax purposes . . . . . . . . . . . . . . . . . . . . . . . . . 3,513 2,277 4,550Non-taxable income for tax purposes . . . . . . . . . . . . . . . . . . . . . . . . . . . . (7,633) (3,767) (3,504)Effect of nontaxable bargain purchase gain . . . . . . . . . . . . . . . . . . . . . . . . (12,953) 0 0Effect of lower tax rates on foreign subsidiaries and a domestic life
insurance subsidiary . . . . . . . . . . . . . . . . . . . . . . . . . . . . . . . . . . . . . . . . (8,766) (3,593) (2,780)Effect of investor taxes on earnings of subsidiaries . . . . . . . . . . . . . . . . . . 2,140 5,279 8,650Effect of the tax rate change related to the new Japanese tax law . . . . . . . (14,098) (7,468) 1,219Other, net . . . . . . . . . . . . . . . . . . . . . . . . . . . . . . . . . . . . . . . . . . . . . . . . . . 1,513 (1,955) 1,133
Provision for income taxes . . . . . . . . . . . . . . . . . . . . . . . . . . . . . . . . . . . . . . . . . ¥ 89,057 ¥120,312 ¥144,039
* In fiscal 2015 and 2016, increases in the valuation allowance of ¥1,819 million and decreases in the valuationallowance of ¥12 million due to the amendment to tax loss carryforward rules related to the new Japanese taxlaw are included in “Change in valuation allowance” in the table above.
The effective income tax rate is different from the statutory tax rate primarily because of certainnondeductible expenses for tax purposes, non-taxable income for tax purposes, changes in valuation allowance,the effect of nontaxable bargain purchase gain, the effect of lower income tax rates on foreign subsidiaries and adomestic life insurance subsidiaries, effect of investor taxes on earnings of subsidiaries, and the effect of the taxreforms as discussed in the following paragraph.
On March 31, 2015, the 2015 tax reform bill was passed by the National Diet of Japan. From fiscal yearsbeginning on April 1, 2015, the national tax rate and the local business tax rate were reduced, and as a result, thecombined statutory income tax rate for the fiscal year beginning on April 1, 2015 was reduced fromapproximately 35.9% to approximately 33.5%. The increase and decrease of the deferred tax assets and liabilitiesdue to the change in the tax rates resulted in a decrease of provision for income taxes by ¥14,098 million in theconsolidated statements of income in fiscal 2015, and the increase of the valuation allowance due to theamendment to tax loss carryforward rules resulted in an increase of provision for income taxes by ¥1,819 millionin the consolidated statements of income in fiscal 2015.
On March 29, 2016, the 2016 tax reform bill was passed by the National Diet of Japan. From fiscal yearsbeginning on April 1, 2016, the national corporate tax rate and local business tax rate were reduced and the localcorporate tax rate was increased. The net effect of those changes was a reduction in the combined statutoryincome tax rate for the fiscal year beginning on April 1, 2016 from approximately 32.9% to approximately31.7%, and a further reduction in the combined statutory income tax rate for fiscal year beginning on April 1,2017 to approximately 31.5%. For the fiscal years beginning on or after April 1, 2018, the combined statutoryincome tax rate was further reduced to approximately 31.3%. In addition, tax loss carryforward rules wereamended, and the deductible amount of tax losses carried forward for the fiscal year beginning on April 1, 2016is reduced to 60% of taxable income for the year, compared to 65% pursuant to the 2015 tax reform. From thefiscal year beginning on April 1, 2017, the deductible limit of tax losses carried forward will be increased to 55%
F-89
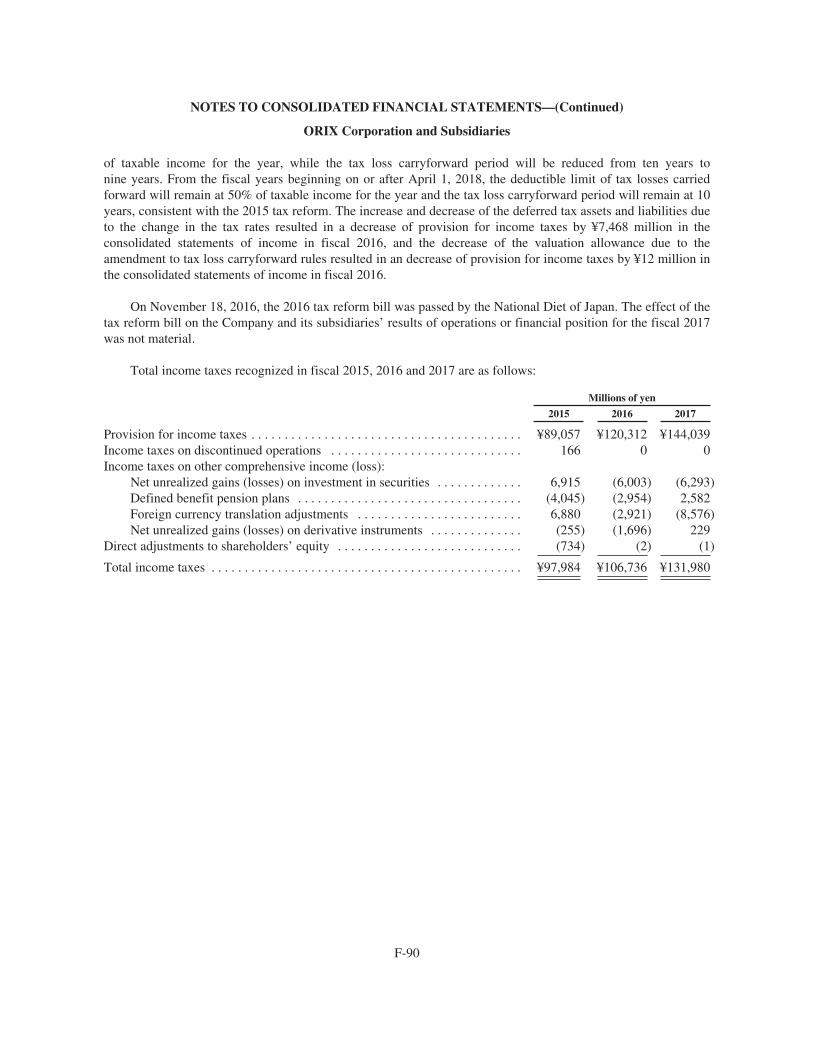
NOTES TO CONSOLIDATED FINANCIAL STATEMENTS—(Continued)
ORIX Corporation and Subsidiaries
of taxable income for the year, while the tax loss carryforward period will be reduced from ten years tonine years. From the fiscal years beginning on or after April 1, 2018, the deductible limit of tax losses carriedforward will remain at 50% of taxable income for the year and the tax loss carryforward period will remain at 10years, consistent with the 2015 tax reform. The increase and decrease of the deferred tax assets and liabilities dueto the change in the tax rates resulted in a decrease of provision for income taxes by ¥7,468 million in theconsolidated statements of income in fiscal 2016, and the decrease of the valuation allowance due to theamendment to tax loss carryforward rules resulted in an decrease of provision for income taxes by ¥12 million inthe consolidated statements of income in fiscal 2016.
On November 18, 2016, the 2016 tax reform bill was passed by the National Diet of Japan. The effect of thetax reform bill on the Company and its subsidiaries’ results of operations or financial position for the fiscal 2017was not material.
Total income taxes recognized in fiscal 2015, 2016 and 2017 are as follows:
Millions of yen
2015 2016 2017
Provision for income taxes . . . . . . . . . . . . . . . . . . . . . . . . . . . . . . . . . . . . . . . . . ¥89,057 ¥120,312 ¥144,039Income taxes on discontinued operations . . . . . . . . . . . . . . . . . . . . . . . . . . . . . 166 0 0Income taxes on other comprehensive income (loss):
Net unrealized gains (losses) on investment in securities . . . . . . . . . . . . . 6,915 (6,003) (6,293)Defined benefit pension plans . . . . . . . . . . . . . . . . . . . . . . . . . . . . . . . . . . (4,045) (2,954) 2,582Foreign currency translation adjustments . . . . . . . . . . . . . . . . . . . . . . . . . 6,880 (2,921) (8,576)Net unrealized gains (losses) on derivative instruments . . . . . . . . . . . . . . (255) (1,696) 229
Direct adjustments to shareholders’ equity . . . . . . . . . . . . . . . . . . . . . . . . . . . . (734) (2) (1)
Total income taxes . . . . . . . . . . . . . . . . . . . . . . . . . . . . . . . . . . . . . . . . . . . . . . . ¥97,984 ¥106,736 ¥131,980
F-90
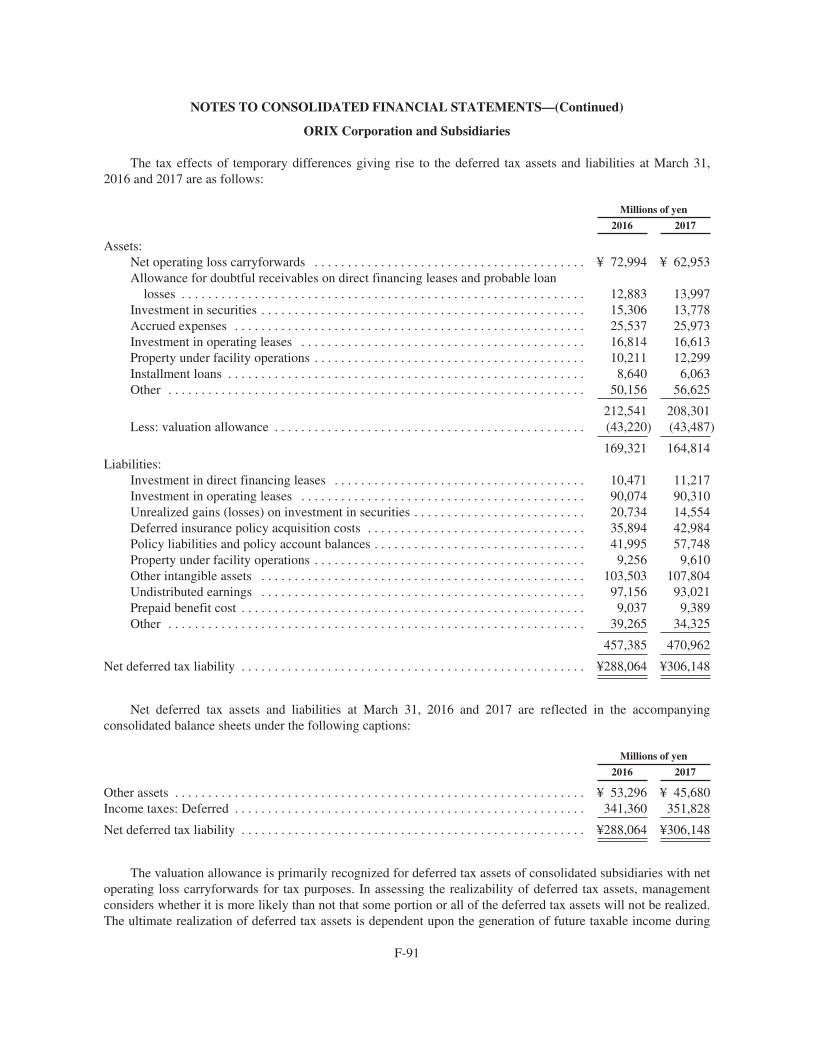
NOTES TO CONSOLIDATED FINANCIAL STATEMENTS—(Continued)
ORIX Corporation and Subsidiaries
The tax effects of temporary differences giving rise to the deferred tax assets and liabilities at March 31,2016 and 2017 are as follows:
Millions of yen
2016 2017
Assets:Net operating loss carryforwards . . . . . . . . . . . . . . . . . . . . . . . . . . . . . . . . . . . . . . . . . ¥ 72,994 ¥ 62,953Allowance for doubtful receivables on direct financing leases and probable loan
losses . . . . . . . . . . . . . . . . . . . . . . . . . . . . . . . . . . . . . . . . . . . . . . . . . . . . . . . . . . . . . 12,883 13,997Investment in securities . . . . . . . . . . . . . . . . . . . . . . . . . . . . . . . . . . . . . . . . . . . . . . . . . 15,306 13,778Accrued expenses . . . . . . . . . . . . . . . . . . . . . . . . . . . . . . . . . . . . . . . . . . . . . . . . . . . . . 25,537 25,973Investment in operating leases . . . . . . . . . . . . . . . . . . . . . . . . . . . . . . . . . . . . . . . . . . . 16,814 16,613Property under facility operations . . . . . . . . . . . . . . . . . . . . . . . . . . . . . . . . . . . . . . . . . 10,211 12,299Installment loans . . . . . . . . . . . . . . . . . . . . . . . . . . . . . . . . . . . . . . . . . . . . . . . . . . . . . . 8,640 6,063Other . . . . . . . . . . . . . . . . . . . . . . . . . . . . . . . . . . . . . . . . . . . . . . . . . . . . . . . . . . . . . . . 50,156 56,625
212,541 208,301Less: valuation allowance . . . . . . . . . . . . . . . . . . . . . . . . . . . . . . . . . . . . . . . . . . . . . . . (43,220) (43,487)
169,321 164,814Liabilities:
Investment in direct financing leases . . . . . . . . . . . . . . . . . . . . . . . . . . . . . . . . . . . . . . 10,471 11,217Investment in operating leases . . . . . . . . . . . . . . . . . . . . . . . . . . . . . . . . . . . . . . . . . . . 90,074 90,310Unrealized gains (losses) on investment in securities . . . . . . . . . . . . . . . . . . . . . . . . . . 20,734 14,554Deferred insurance policy acquisition costs . . . . . . . . . . . . . . . . . . . . . . . . . . . . . . . . . 35,894 42,984Policy liabilities and policy account balances . . . . . . . . . . . . . . . . . . . . . . . . . . . . . . . . 41,995 57,748Property under facility operations . . . . . . . . . . . . . . . . . . . . . . . . . . . . . . . . . . . . . . . . . 9,256 9,610Other intangible assets . . . . . . . . . . . . . . . . . . . . . . . . . . . . . . . . . . . . . . . . . . . . . . . . . 103,503 107,804Undistributed earnings . . . . . . . . . . . . . . . . . . . . . . . . . . . . . . . . . . . . . . . . . . . . . . . . . 97,156 93,021Prepaid benefit cost . . . . . . . . . . . . . . . . . . . . . . . . . . . . . . . . . . . . . . . . . . . . . . . . . . . . 9,037 9,389Other . . . . . . . . . . . . . . . . . . . . . . . . . . . . . . . . . . . . . . . . . . . . . . . . . . . . . . . . . . . . . . . 39,265 34,325
457,385 470,962
Net deferred tax liability . . . . . . . . . . . . . . . . . . . . . . . . . . . . . . . . . . . . . . . . . . . . . . . . . . . . ¥288,064 ¥306,148
Net deferred tax assets and liabilities at March 31, 2016 and 2017 are reflected in the accompanyingconsolidated balance sheets under the following captions:
Millions of yen
2016 2017
Other assets . . . . . . . . . . . . . . . . . . . . . . . . . . . . . . . . . . . . . . . . . . . . . . . . . . . . . . . . . . . . . . ¥ 53,296 ¥ 45,680Income taxes: Deferred . . . . . . . . . . . . . . . . . . . . . . . . . . . . . . . . . . . . . . . . . . . . . . . . . . . . . 341,360 351,828
Net deferred tax liability . . . . . . . . . . . . . . . . . . . . . . . . . . . . . . . . . . . . . . . . . . . . . . . . . . . . ¥288,064 ¥306,148
The valuation allowance is primarily recognized for deferred tax assets of consolidated subsidiaries with netoperating loss carryforwards for tax purposes. In assessing the realizability of deferred tax assets, managementconsiders whether it is more likely than not that some portion or all of the deferred tax assets will not be realized.The ultimate realization of deferred tax assets is dependent upon the generation of future taxable income during
F-91

NOTES TO CONSOLIDATED FINANCIAL STATEMENTS—(Continued)
ORIX Corporation and Subsidiaries
the periods in which those temporary differences become deductible and tax loss carryforwards are utilizable.Management considers the scheduled reversal of deferred tax liabilities, projected future taxable income, andtax-planning strategies in making this assessment. Based upon the level of historical taxable income andprojections for future taxable income over the periods in which the deferred tax assets are deductible,management believes it is more likely than not that the Company and its subsidiaries will realize the benefits ofthese deductible temporary differences and tax loss carryforwards, net of the existing valuation allowances atMarch 31, 2017. The amount of the deferred tax asset considered realizable, however, could be reduced in thenear term if estimates of future taxable income during the carryforward period are reduced. The net changes inthe total valuation allowance were increases of ¥19,945 million in fiscal 2015, decreases of ¥7,295 million infiscal 2016, and increases of ¥267 million in fiscal 2017. The adjustments to the beginning-of-the-year amount inthe total valuation allowance resulting from changes in judgment about the realizability of deferred tax assets infuture years were net decreases of ¥2,917 million in fiscal 2015 (increases of ¥5,447 million and decreases of¥8,364 million on a gross basis), net increases of ¥177 million in fiscal 2016 (increases of ¥381 million anddecreases of ¥204 million on a gross basis), and net increases of ¥2,215 million in fiscal 2017 (increases of¥2,859 million and decreases of ¥644 million on a gross basis), respectively.
The Company and certain subsidiaries have net operating loss carryforwards of ¥380,147 million atMarch 31, 2017, which expire as follows:
Year ending March 31, Millions of yen
2018 . . . . . . . . . . . . . . . . . . . . . . . . . . . . . . . . . . . . . . . . . . . . . . . . . . . . . . . . . . . . . . . . . . . . . . . . . . . ¥ 9272019 . . . . . . . . . . . . . . . . . . . . . . . . . . . . . . . . . . . . . . . . . . . . . . . . . . . . . . . . . . . . . . . . . . . . . . . . . . . 31,7962020 . . . . . . . . . . . . . . . . . . . . . . . . . . . . . . . . . . . . . . . . . . . . . . . . . . . . . . . . . . . . . . . . . . . . . . . . . . . 18,5482021 . . . . . . . . . . . . . . . . . . . . . . . . . . . . . . . . . . . . . . . . . . . . . . . . . . . . . . . . . . . . . . . . . . . . . . . . . . . 84,0462022 . . . . . . . . . . . . . . . . . . . . . . . . . . . . . . . . . . . . . . . . . . . . . . . . . . . . . . . . . . . . . . . . . . . . . . . . . . . 19,102Thereafter . . . . . . . . . . . . . . . . . . . . . . . . . . . . . . . . . . . . . . . . . . . . . . . . . . . . . . . . . . . . . . . . . . . . . . 193,216Indefinite period . . . . . . . . . . . . . . . . . . . . . . . . . . . . . . . . . . . . . . . . . . . . . . . . . . . . . . . . . . . . . . . . . 32,512
Total . . . . . . . . . . . . . . . . . . . . . . . . . . . . . . . . . . . . . . . . . . . . . . . . . . . . . . . . . . . . . . . . . . . . . . ¥380,147
The unrecognized tax benefits as of March 31, 2016 and 2017 were not material. The Company and itssubsidiaries believe that it is not reasonably possible that the total amounts of unrecognized tax benefits willsignificantly increase or decrease within 12 months of March 31, 2017.
The total amounts of penalties and interest expense related to income taxes recognized in the consolidatedbalance sheets as of March 31, 2016 and 2017, and in the consolidated statements of income for the fiscal 2015,2016 and 2017 were not material.
The Company and its subsidiaries file tax returns in Japan and certain foreign tax jurisdictions. TheCompany is no longer subject to ordinary tax examination for the tax years prior to fiscal 2016, and its majordomestic subsidiaries are no longer subject to ordinary tax examination for the tax years prior to fiscal 2010,respectively.
Subsidiaries in the United States remain subject to a tax examination for the tax years after fiscal 2009.Subsidiaries in the Netherlands remain subject to a tax examination for the tax years after fiscal 2011.
17. Pension Plans
The Company and certain subsidiaries have contributory and non-contributory pension plans coveringsubstantially all of their employees. Those contributory funded pension plans include defined benefit pension
F-92

NOTES TO CONSOLIDATED FINANCIAL STATEMENTS—(Continued)
ORIX Corporation and Subsidiaries
plans and defined contribution pension plans. Under the plans, employees are entitled to lump-sum payments atthe time of termination of their employment or pension payments. Defined benefit pension plans consist of a planof which the amounts of such payments are determined on the basis of length of service and remuneration at thetime of termination and a cash balance plan.
The Company and its subsidiaries’ funding policy is to contribute annually the amounts actuariallydetermined. Assets of the plans are invested primarily in interest-bearing securities and marketable equitysecurities.
The funded status of the defined benefit pension plans, which consists of Japanese plans and overseas plans,as of March 31, 2016 and 2017 are as follows:
Millions of yen
Japanese plans Overseas plans
2016 2017 2016 2017
Change in benefit obligation:Benefit obligation at beginning of year . . . . . . . . . . . . . . . . . . ¥ 86,793 ¥ 97,030 ¥110,521 ¥99,912Service cost . . . . . . . . . . . . . . . . . . . . . . . . . . . . . . . . . . . . . . . 4,401 5,276 3,856 3,270Interest cost . . . . . . . . . . . . . . . . . . . . . . . . . . . . . . . . . . . . . . . 995 682 1,747 1,757Actuarial loss (gain) . . . . . . . . . . . . . . . . . . . . . . . . . . . . . . . . 10,674 (1,656) (12,840) (8,893)Foreign currency exchange rate change . . . . . . . . . . . . . . . . . 0 0 (2,262) (6,226)Benefits paid . . . . . . . . . . . . . . . . . . . . . . . . . . . . . . . . . . . . . . (2,705) (2,702) (1,336) (1,190)Plan participant’s contributions . . . . . . . . . . . . . . . . . . . . . . . . 0 0 88 0Business combinations . . . . . . . . . . . . . . . . . . . . . . . . . . . . . . 0 1,455 138 0Divestitures . . . . . . . . . . . . . . . . . . . . . . . . . . . . . . . . . . . . . . . (3,396) 0 0 0Plan amendments . . . . . . . . . . . . . . . . . . . . . . . . . . . . . . . . . . . 268 (364) 0 0
Benefit obligation at end of year . . . . . . . . . . . . . . . . . . . 97,030 99,721 99,912 88,630
Change in plan assets:Fair value of plan assets at beginning of year . . . . . . . . . . . . . 115,864 113,056 87,009 85,180Actual return on plan assets . . . . . . . . . . . . . . . . . . . . . . . . . . (2,043) 987 (109) 2,780Employer contribution . . . . . . . . . . . . . . . . . . . . . . . . . . . . . . . 3,072 3,387 1,456 1,338Benefits paid . . . . . . . . . . . . . . . . . . . . . . . . . . . . . . . . . . . . . . (2,227) (2,229) (1,265) (1,086)Plan participant’s contributions . . . . . . . . . . . . . . . . . . . . . . . . 0 0 88 0Business combinations . . . . . . . . . . . . . . . . . . . . . . . . . . . . . . 0 1,789 0 0Divestitures . . . . . . . . . . . . . . . . . . . . . . . . . . . . . . . . . . . . . . . (1,610) 0 0 0Foreign currency exchange rate change . . . . . . . . . . . . . . . . . 0 0 (1,999) (4,818)
Fair value of plan assets at end of year . . . . . . . . . . . . . . 113,056 116,990 85,180 83,394
The funded status of the plans . . . . . . . . . . . . . . . . . . . . . . . . . ¥ 16,026 ¥ 17,269 ¥ (14,732) ¥ (5,236)
Amount recognized in the consolidated balance sheets consists of:Prepaid benefit cost included in other assets . . . . . . . . . . . . . . ¥ 28,848 ¥ 29,958 ¥ 0 ¥ 0Accrued benefit liability included in other liabilities . . . . . . . (12,822) ¥ (12,689) (14,732) (5,236)
Net amount recognized . . . . . . . . . . . . . . . . . . . . . . . . . . ¥ 16,026 ¥ 17,269 ¥ (14,732) ¥ (5,236)
F-93

NOTES TO CONSOLIDATED FINANCIAL STATEMENTS—(Continued)
ORIX Corporation and Subsidiaries
Amount recognized in accumulated other comprehensive income (loss), pre-tax, at March 31, 2016 and2017 consisted of:
Millions of yen
Japanese plans Overseas plans
2016 2017 2016 2017
Net prior service credit . . . . . . . . . . . . . . . . . . . . . . . . . . . . . . . . . . ¥ 4,110 ¥ 3,151 ¥ 959 ¥ 800Net actuarial loss . . . . . . . . . . . . . . . . . . . . . . . . . . . . . . . . . . . . . . . (25,125) (23,999) (17,150) (6,954)Net transition obligation . . . . . . . . . . . . . . . . . . . . . . . . . . . . . . . . . (91) (45) (14) (12)
Total recognized in accumulated other comprehensive loss,pre-tax . . . . . . . . . . . . . . . . . . . . . . . . . . . . . . . . . . . . . . . . . . . . . ¥(21,106) ¥(20,893) ¥(16,205) ¥(6,166)
The estimated portions of the net prior service credit, net actuarial loss and net transition obligation abovethat will be recognized as a component of net pension cost (gain) of Japanese pension plans in fiscal 2018 are¥(938) million, ¥842 million and ¥45 million, respectively, a component of net pension cost (gain) of overseaspension plans in fiscal 2018 are ¥(65) million, ¥4 million and ¥3 million, respectively.
The accumulated benefit obligations for all Japanese defined benefit pension plans were ¥86,744 millionand ¥87,443 million, respectively, at March 31, 2016 and 2017. The accumulated benefit obligations for alloverseas defined benefit pension plans were ¥89,425 million and ¥80,731 million, respectively, at March 31,2016 and 2017.
In Japanese pension plans, the aggregate projected benefit obligations, aggregate accumulated benefitobligations and aggregate fair values of plan assets for the plans with the accumulated benefit obligations inexcess of plan assets were ¥19,351 million, ¥18,822 million and ¥6,529 million, respectively, at March 31, 2016and ¥19,715 million, ¥19,101 million and ¥7,026 million, respectively, at March 31, 2017. In overseas pensionplans, the aggregate projected benefit obligations, aggregate accumulated benefit obligations and aggregate fairvalues of plan assets for the plans with the accumulated benefit obligations in excess of plan assets were¥99,715 million, ¥89,407 million and ¥85,151 million, respectively, at March 31, 2016 and ¥6,222 million,¥6,136 million and ¥5,111 million, respectively, at March 31, 2017.
F-94

NOTES TO CONSOLIDATED FINANCIAL STATEMENTS—(Continued)
ORIX Corporation and Subsidiaries
Net pension cost of the plans for fiscal 2015, 2016 and 2017 consists of the following:
Millions of yen
2015 2016 2017
Japanese plans:Service cost . . . . . . . . . . . . . . . . . . . . . . . . . . . . . . . . . . . . . . . . . . . . . . . . ¥ 4,415 ¥ 4,401 ¥ 5,276Interest cost . . . . . . . . . . . . . . . . . . . . . . . . . . . . . . . . . . . . . . . . . . . . . . . . 1,159 995 682Expected return on plan assets . . . . . . . . . . . . . . . . . . . . . . . . . . . . . . . . . . (2,351) (2,575) (2,566)Amortization of prior service credit . . . . . . . . . . . . . . . . . . . . . . . . . . . . . . (927) (928) (925)Amortization of net actuarial loss . . . . . . . . . . . . . . . . . . . . . . . . . . . . . . . 502 (15) 959Amortization of transition obligation . . . . . . . . . . . . . . . . . . . . . . . . . . . . . 53 49 45
Net periodic pension cost . . . . . . . . . . . . . . . . . . . . . . . . . . . . . . . . . . ¥ 2,851 ¥ 1,927 ¥ 3,471
Overseas plans:Service cost . . . . . . . . . . . . . . . . . . . . . . . . . . . . . . . . . . . . . . . . . . . . . . . . ¥ 2,460 ¥ 3,856 ¥ 3,270Interest cost . . . . . . . . . . . . . . . . . . . . . . . . . . . . . . . . . . . . . . . . . . . . . . . . 2,251 1,747 1,757Expected return on plan assets . . . . . . . . . . . . . . . . . . . . . . . . . . . . . . . . . . (3,857) (4,584) (3,581)Amortization of prior service credit . . . . . . . . . . . . . . . . . . . . . . . . . . . . . . (51) (113) (96)Amortization of net actuarial loss . . . . . . . . . . . . . . . . . . . . . . . . . . . . . . . 215 1,336 617Amortization of transition obligation . . . . . . . . . . . . . . . . . . . . . . . . . . . . . 5 3 4
Net periodic pension cost . . . . . . . . . . . . . . . . . . . . . . . . . . . . . . . . . . ¥ 1,023 ¥ 2,245 ¥ 1,971
Other changes in plan assets and benefit obligations recognized in other comprehensive income (loss) forfiscal 2015, 2016 and 2017 are summarized as follows:
Millions of yen
2015 2016 2017
Japanese plans:Current year actuarial gain (loss) . . . . . . . . . . . . . . . . . . . . . . . . . . . . . . . . ¥ 8,028 ¥(15,417) ¥ 168Amortization of net actuarial loss . . . . . . . . . . . . . . . . . . . . . . . . . . . . . . . 502 (15) 959Prior service credit due to amendments . . . . . . . . . . . . . . . . . . . . . . . . . . . 0 (88) (34)Amortization of prior service credit . . . . . . . . . . . . . . . . . . . . . . . . . . . . . . (927) (928) (925)Amortization of transition obligation . . . . . . . . . . . . . . . . . . . . . . . . . . . . . 53 49 45Plan curtailments and settlements . . . . . . . . . . . . . . . . . . . . . . . . . . . . . . . 0 (92) 0
Total recognized in other comprehensive income (loss), pre-tax . . . . . . . ¥ 7,656 ¥(16,491) ¥ 213
Overseas plans:Current year actuarial gain (loss) . . . . . . . . . . . . . . . . . . . . . . . . . . . . . . . . ¥(28,730) ¥ 7,881 ¥ 8,585Amortization of net actuarial loss . . . . . . . . . . . . . . . . . . . . . . . . . . . . . . . 215 1,336 617Prior service credit due to amendments . . . . . . . . . . . . . . . . . . . . . . . . . . . 843 0 (1)Amortization of prior service credit . . . . . . . . . . . . . . . . . . . . . . . . . . . . . . (51) (113) (96)Amortization of transition obligation . . . . . . . . . . . . . . . . . . . . . . . . . . . . . 5 3 4Foreign currency exchange rate change . . . . . . . . . . . . . . . . . . . . . . . . . . . 1,065 307 930
Total recognized in other comprehensive income (loss), pre-tax . . . . . . . ¥(26,653) ¥ 9,414 ¥10,039
The Company and certain subsidiaries use March 31 as a measurement date for all of our material plans.
F-95

NOTES TO CONSOLIDATED FINANCIAL STATEMENTS—(Continued)
ORIX Corporation and Subsidiaries
Significant assumptions of Japanese pension plans and overseas pension plans used to determine theseamounts are as follows:
Japanese plans 2015 2016 2017
Weighted-average assumptions used to determine benefit obligations atMarch 31:
Discount rate . . . . . . . . . . . . . . . . . . . . . . . . . . . . . . . . . . . . . . . . . . . . . . . 1.2% 0.7% 0.8%Rate of increase in compensation levels . . . . . . . . . . . . . . . . . . . . . . . . . . 4.8% 4.4% 4.5%
Weighted-average assumptions used to determine net periodic pension costfor years ended March 31:
Discount rate . . . . . . . . . . . . . . . . . . . . . . . . . . . . . . . . . . . . . . . . . . . . . . . 1.4% 1.2% 0.7%Rate of increase in compensation levels . . . . . . . . . . . . . . . . . . . . . . . . . . 5.1% 4.8% 4.4%Expected long-term rate of return on plan assets . . . . . . . . . . . . . . . . . . . . 2.3% 2.3% 2.2%
Overseas plans 2015 2016 2017
Weighted-average assumptions used to determine benefit obligations atMarch 31:
Discount rate . . . . . . . . . . . . . . . . . . . . . . . . . . . . . . . . . . . . . . . . . . . . . . . 1.5% 1.9% 2.1%Rate of increase in compensation levels . . . . . . . . . . . . . . . . . . . . . . . . . . 2.8% 2.8% 2.4%
Weighted-average assumptions used to determine net periodic pension costfor years ended March 31:
Discount rate . . . . . . . . . . . . . . . . . . . . . . . . . . . . . . . . . . . . . . . . . . . . . . . 3.5% 1.5% 1.9%Rate of increase in compensation levels . . . . . . . . . . . . . . . . . . . . . . . . . . 2.8% 2.8% 2.8%Expected long-term rate of return on plan assets . . . . . . . . . . . . . . . . . . . . 5.2% 5.5% 4.7%
The Company and certain subsidiaries determine the expected long-term rate of return on plan assetsannually based on the composition of the pension asset portfolios and the expected long-term rate of return onthese portfolios. The expected long-term rate of return is designed to approximate the long-term rate of returnactually earned on the plans’ assets over time to ensure that funds are available to meet the pension obligationsthat result from the services provided by employees. The Company and certain subsidiaries use a number offactors to determine the expected rate of return, including actual historical returns on the asset classes of theplans’ portfolios and independent projections of returns of the various asset classes.
The Company and certain subsidiaries’ investment policies are designed to ensure adequate plan assets areavailable to provide future payments of pension benefits to eligible participants. The Company and certainsubsidiaries formulate a policy portfolio appropriate to produce the expected long-term rate of return on planassets and to ensure that plan assets are allocated under this policy portfolio. The Company and certainsubsidiaries periodically have an external consulting firm monitor the results of actual return and revise thepolicy portfolio if necessary.
F-96

NOTES TO CONSOLIDATED FINANCIAL STATEMENTS—(Continued)
ORIX Corporation and Subsidiaries
The fair value of Japanese pension plan assets at March 31, 2016 and 2017, by asset category, are asfollows. The three levels of input used to measure fair value are described in Note 2 “Fair Value Measurement.”
Millions of yen
March 31, 2016
TotalCarryingValue in
ConsolidatedBalance Sheets
Quoted Pricesin Active
Markets forIdentical
Assets(Level 1)
SignificantOther
ObservableInputs
(Level 2)
SignificantUnobservable
Inputs(Level 3)
Equity securities:Japan
Pooled funds*1 . . . . . . . . . . . . . . . . . . . . . . . . . ¥ 15,663 ¥0 ¥ 0 ¥0Other than Japan
Pooled funds*2 . . . . . . . . . . . . . . . . . . . . . . . . . 17,829 0 0 0Debt securities:
JapanPooled funds*3 . . . . . . . . . . . . . . . . . . . . . . . . . 22,324 0 0 0
Other than JapanPooled funds*4 . . . . . . . . . . . . . . . . . . . . . . . . . 21,760 0 0 0
Other assets:Life insurance company general accounts*5 . . . . . . 26,300 0 26,300 0Others*6 . . . . . . . . . . . . . . . . . . . . . . . . . . . . . . . . . . 9,180 0 9,180 0
¥113,056 ¥0 ¥35,480 ¥0
*1 These funds invest in listed shares including shares of ORIX Corporation in the amounts of ¥42 million atMarch 31, 2016.
*2 These funds invest in listed shares.*3 These funds invest approximately 70% in Japanese government bonds, approximately 10% in Japanese
municipal bonds, and approximately 20% in Japanese corporate bonds. These funds include corporate bondsof ORIX Corporation in the amounts of ¥948 million at March 31, 2016.
*4 These funds invest entirely in foreign government bonds.*5 Life insurance company general accounts are accounts with guaranteed capital and minimum interest rate, in
which life insurance companies manage funds on several contracts.*6 Others include derivative instruments held for hedging change in the fair value of equity securities, and
short-term instruments.
F-97

NOTES TO CONSOLIDATED FINANCIAL STATEMENTS—(Continued)
ORIX Corporation and Subsidiaries
At March 31, 2016, our policy for the portfolio of plans consists of three major components: approximately30% is invested in equity securities, approximately 40% is invested in debt securities and approximately 30% isinvested in other assets, primarily consisting of investments in life insurance company general accounts.
Millions of yen
March 31, 2017
TotalCarryingValue in
ConsolidatedBalance Sheets
Quoted Pricesin Active
Markets forIdentical
Assets(Level 1)
SignificantOther
ObservableInputs
(Level 2)
SignificantUnobservable
Inputs(Level 3)
Equity securities:Japan
Pooled funds*1 . . . . . . . . . . . . . . . . . . . . . . . . . ¥ 16,902 ¥0 ¥ 0 ¥0Other than Japan
Pooled funds*2 . . . . . . . . . . . . . . . . . . . . . . . . . 18,508 0 0 0Debt securities:
JapanPooled funds*3 . . . . . . . . . . . . . . . . . . . . . . . . . 18,524 0 0 0
Other than JapanPooled funds*4 . . . . . . . . . . . . . . . . . . . . . . . . . 21,127 0 0 0
Other assets:Life insurance company general accounts*5 . . . . . . 26,731 0 26,731 0Others*6 . . . . . . . . . . . . . . . . . . . . . . . . . . . . . . . . . . 15,198 0 15,198 0
¥116,990 ¥0 ¥41,929 ¥0
*1 These funds invest in listed shares including shares of ORIX Corporation in the amounts of ¥44 million at March 31,2017.
*2 These funds invest in listed shares.*3 These funds invest approximately 60% in Japanese government bonds, approximately 10% in Japanese municipal bonds,
and approximately 30% in Japanese corporate bonds. These funds include corporate bonds of ORIX Corporation in theamounts of ¥4,873 million at March 31, 2017.
*4 These funds invest entirely in foreign government bonds.*5 Life insurance company general accounts are accounts with guaranteed capital and minimum interest rate, in which life
insurance companies manage funds on several contracts.*6 Others include derivative instruments held for hedging change in the fair value of equity securities, and short-term
instruments.
At March 31, 2017, our policy for the portfolio of plans consists of three major components: approximately30% is invested in equity securities, approximately 30% is invested in debt securities and approximately 40% isinvested in other assets, primarily consisting of investments in life insurance company general accounts.
Level 2 assets are comprised principally of investments in life insurance company general accounts.Investments in life insurance company general accounts are valued at conversion value. Pooled funds are valuedat the net asset value per share at the measurement date and they have not been classified in the fair valuehierarchy.
F-98

NOTES TO CONSOLIDATED FINANCIAL STATEMENTS—(Continued)
ORIX Corporation and Subsidiaries
The fair value of overseas pension plan assets at March 31, 2016 and 2017, by asset category, are as follows.The three levels of input used to measure fair value are described in Note 2 “Fair Value Measurement.”
Millions of yen
March 31, 2016
TotalCarryingValue in
ConsolidatedBalance Sheets
Quoted Pricesin Active
Markets forIdentical
Assets(Level 1)
SignificantOther
ObservableInputs
(Level 2)
SignificantUnobservable
Inputs(Level 3)
Equity securities:Other than Japan
Shares . . . . . . . . . . . . . . . . . . . . . . . . . . . . . . . . ¥29,367 ¥29,367 ¥ 0 ¥0Pooled funds*1 . . . . . . . . . . . . . . . . . . . . . . . . . 64 0 0 0
Debt securities:Other than Japan
Government bonds . . . . . . . . . . . . . . . . . . . . . . 46,280 46,280 0 0Municipal bonds . . . . . . . . . . . . . . . . . . . . . . . . 4,885 0 4,885 0Corporate bonds . . . . . . . . . . . . . . . . . . . . . . . . 98 98 0 0
Other assets:Life insurance company general accounts*2 . . . . . . 2,520 0 2,520 0Others*3 . . . . . . . . . . . . . . . . . . . . . . . . . . . . . . . . . . 1,966 0 1,966 0
¥85,180 ¥75,745 ¥9,371 ¥0
*1 These funds invest in listed shares.*2 Life insurance company general accounts are accounts with guaranteed capital and minimum interest rate, in
which life insurance companies manage funds on several contracts.*3 Others include derivative instruments held for hedging change in the fair value of equity securities, and
short-term instruments.
F-99

NOTES TO CONSOLIDATED FINANCIAL STATEMENTS—(Continued)
ORIX Corporation and Subsidiaries
At March 31, 2016, our policy for the portfolio of plans consists of three major components: approximately30% is invested in equity securities and approximately 60% is invested in debt securities and approximately 10%is invested in other assets, primarily consisting of investments in life insurance company general accounts.
Millions of yen
March 31, 2017
TotalCarryingValue in
ConsolidatedBalance Sheets
Quoted Pricesin Active
Markets forIdentical
Assets(Level 1)
SignificantOther
ObservableInputs
(Level 2)
SignificantUnobservable
Inputs(Level 3)
Equity securities:Other than Japan
Shares . . . . . . . . . . . . . . . . . . . . . . . . . . . . . . . . ¥34,905 ¥34,905 ¥ 0 ¥0Pooled funds*1 . . . . . . . . . . . . . . . . . . . . . . . . . 67 0 0 0
Debt securities:Other than Japan
Government bonds . . . . . . . . . . . . . . . . . . . . . . 39,969 39,969 0 0Municipal bonds . . . . . . . . . . . . . . . . . . . . . . . . 4,650 0 4,650 0Corporate bonds . . . . . . . . . . . . . . . . . . . . . . . . 0 0 0 0
Other assets:Life insurance company general accounts*2 . . . . . . 2,487 0 2,487 0Others*3 . . . . . . . . . . . . . . . . . . . . . . . . . . . . . . . . . . 1,316 0 1,316 0
¥83,394 ¥74,874 ¥8,453 ¥0
*1 These funds invest in listed shares.*2 Life insurance company general accounts are accounts with guaranteed capital and minimum interest rate, in
which life insurance companies manage funds on several contracts.*3 Others include derivative instruments held for hedging change in the fair value of equity securities, and
short-term instruments.
At March 31, 2017, our policy for the portfolio of plans consists of three major components: approximately40% is invested in equity securities and approximately 50% is invested in debt securities and approximately 10%is invested in other assets, primarily consisting of investments in life insurance company general accounts.
Each level into which assets are categorized is based on inputs used to measure the fair value of the assets.Level 1 assets are comprised principally of equity securities and debt securities, which are valued usingunadjusted quoted market prices in active markets with sufficient volume and frequency of transactions. Level 2assets are comprised principally of debt securities and investments in life insurance company general accounts.Investments in life insurance company general accounts are valued at conversion value. Pooled funds are valuedat the net asset value per share at the measurement date and they have not been classified in the fair valuehierarchy.
The Company and certain subsidiaries expect to contribute ¥3,324 million to its Japanese pension plans and¥1,570 million to its overseas pension plans during the year ending March 31, 2018.
F-100

NOTES TO CONSOLIDATED FINANCIAL STATEMENTS—(Continued)
ORIX Corporation and Subsidiaries
At March 31, 2017, the benefits expected to be paid in each of the next five fiscal years, and in theaggregate for the five years thereafter are as follows:
Millions of yen
Years ending March 31, Japanese plans Overseas plans
2018 . . . . . . . . . . . . . . . . . . . . . . . . . . . . . . . . . . . . . . . . . . . . . . . . . . . . . . . . . . . . . . ¥ 2,142 ¥ 1,2352019 . . . . . . . . . . . . . . . . . . . . . . . . . . . . . . . . . . . . . . . . . . . . . . . . . . . . . . . . . . . . . . 1,944 1,2352020 . . . . . . . . . . . . . . . . . . . . . . . . . . . . . . . . . . . . . . . . . . . . . . . . . . . . . . . . . . . . . . 2,095 1,2582021 . . . . . . . . . . . . . . . . . . . . . . . . . . . . . . . . . . . . . . . . . . . . . . . . . . . . . . . . . . . . . . 2,207 1,2532022 . . . . . . . . . . . . . . . . . . . . . . . . . . . . . . . . . . . . . . . . . . . . . . . . . . . . . . . . . . . . . . 2,390 1,2932023-2027 . . . . . . . . . . . . . . . . . . . . . . . . . . . . . . . . . . . . . . . . . . . . . . . . . . . . . . . . . . 15,151 8,096
Total . . . . . . . . . . . . . . . . . . . . . . . . . . . . . . . . . . . . . . . . . . . . . . . . . . . . . . . . . . ¥25,929 ¥14,370
The cost recognized for Japanese defined contribution pension plans of the Company and certain of itssubsidiaries for fiscal 2015, 2016 and 2017 were ¥1,248 million, ¥1,350 million and ¥1,422 million, respectively.The cost recognized for overseas defined contribution pension plans of the Company and certain of itssubsidiaries for fiscal 2015, 2016 and 2017 were ¥2,526 million, ¥2,926 million and ¥2,077 million, respectively.
18. Redeemable Noncontrolling Interests
Changes in redeemable noncontrolling interests in fiscal 2015, 2016 and 2017 are as follows:
Millions of yen
2015 2016 2017
Beginning Balance . . . . . . . . . . . . . . . . . . . . . . . . . . . . . . . . . . . . . . . . . . . . . . . ¥53,177 ¥ 66,901 ¥ 7,467Adjustment of redeemable noncontrolling interests to redemption
value . . . . . . . . . . . . . . . . . . . . . . . . . . . . . . . . . . . . . . . . . . . . . . . . . . . . 220 (7,557) (1,293)Transaction with noncontrolling interests . . . . . . . . . . . . . . . . . . . . . . . . . 2,269 (3,606) 0Comprehensive income
Net Income . . . . . . . . . . . . . . . . . . . . . . . . . . . . . . . . . . . . . . . . . . . . . 4,970 819 432Other comprehensive income (loss)
Net change of foreign currency translation adjustments . . . . . . 9,295 919 (58)Total other comprehensive income (loss) . . . . . . . . . . . . . . . . . . . . . 9,295 919 (58)
Comprehensive income . . . . . . . . . . . . . . . . . . . . . . . . . . . . . . . . . . . . . . . 14,265 1,738 374Cash dividends . . . . . . . . . . . . . . . . . . . . . . . . . . . . . . . . . . . . . . . . . . . . . . (3,030) (11,272) 0Property dividends . . . . . . . . . . . . . . . . . . . . . . . . . . . . . . . . . . . . . . . . . . . 0 (3,776) 0Partial sale of the parent’s ownership interest in subsidiaries that results
in the loss of control . . . . . . . . . . . . . . . . . . . . . . . . . . . . . . . . . . . . . . . . 0 (34,961) 0
Ending Balance . . . . . . . . . . . . . . . . . . . . . . . . . . . . . . . . . . . . . . . . . . . . . . . . . ¥66,901 ¥ 7,467 ¥ 6,548
19. Stock-Based Compensation
The Company has a number of stock-based compensation plans as incentive plans for directors, executiveofficers, corporate auditors and selected employees.
Stock-option program
Since fiscal 2007, the Company has granted stock acquisition rights with a vesting period 1.92 years and anexercise period 9.92 years from grant date. The acquisition rights were to purchase the Company’s common
F-101

NOTES TO CONSOLIDATED FINANCIAL STATEMENTS—(Continued)
ORIX Corporation and Subsidiaries
stock at a specified exercise price and were distributed to directors, executive officers, corporate auditors andcertain employees of the Company, subsidiaries and capital tie-up companies such as affiliated companies. TheCompany did not grant stock options in fiscal 2015, 2016 and 2017.
A summary of the Company’s stock acquisition rights is as follows:
Years ended March 31, Exercise periodNumber of shares
granted*
Exercise price*
Yen
2007 . . . . . . . . . . . . . . . . . . . . . . . . . . . . From June 21, 2008 to June 20, 2016 1,942,000 2,9622008 . . . . . . . . . . . . . . . . . . . . . . . . . . . . From July 5, 2009 to June 22, 2017 1,449,800 3,1012009 . . . . . . . . . . . . . . . . . . . . . . . . . . . . From July 18, 2010 to June 24, 2018 1,479,000 1,689
* The number of shares and exercise price of the granted options were adjusted for the 10-for-1 stock splitimplemented on April 1, 2013.
For the stock-option programs, the exercise prices, which are determined by a formula linked to the price ofthe Company’s common stock on the Tokyo Stock Exchange, are equal or greater than the fair market value ofthe Company’s common stock at the grant dates.
The following table summarizes information about the activity of these stock options for fiscal 2017:
Number ofshares*2
Weighted averageexercise price*1*2
Weighted averageremaining
contractual life Aggregate intrinsic value
Yen Years Millions of yen
Outstanding at beginning of the year . . . 3,080,500 ¥2,612Exercised . . . . . . . . . . . . . . . . . . . . . . . . (48,500) 1,689Forfeited or expired . . . . . . . . . . . . . . . . (1,348,800) 2,926
Outstanding at end of year . . . . . . . . . . . 1,683,200 2,386 0.67 ¥0
Exercisable at end of year . . . . . . . . . . . 1,683,200 ¥2,386 0.67 ¥0
*1 The exercise price of the granted options was adjusted in July 2009 for the issuance of new 18 millionshares.
*2 The number of shares and exercise price of the granted options were adjusted for the 10-for-1 stock splitimplemented on April 1, 2013.
The Company received ¥1,014 million, ¥822 million and ¥81 million in cash from the exercise of stockoptions during fiscal 2015, 2016 and 2017, respectively.
The total intrinsic value of options exercised during fiscal 2015, 2016 and 2017 was ¥378 million,¥39 million and ¥6 million, respectively.
In fiscal 2015, 2016 and 2017, the Company did not recognize any stock-based compensation costs of itsstock-option program. As of March 31, 2017, the Company had no unrecognized compensation costs.
Stock compensation program
The Company maintains a stock compensation program for directors, executive officers and groupexecutives of the Company. In July 2014, the company changed the way of provision of the compensation for
F-102

NOTES TO CONSOLIDATED FINANCIAL STATEMENTS—(Continued)
ORIX Corporation and Subsidiaries
retiree to provide these shares through “The Board Incentive Plan Trust (“the trust”)” by a resolution of theCompensation Committee. The trust purchases the Company’s common shares including future granting sharesby an entrusted fund which the Company set in advance. The Company holds those shares as entrusted assets,separately from other treasury stock which the Company holds.
Under the program, points are granted annually to directors, executive officers and group executives of theCompany based upon the prescribed standards of the Company. Upon retirement, eligible directors, executiveofficers and group executives receive a certain number of the Company’s common shares calculated bytranslating each point earned by that retiree to one common share.
In fiscal 2017, the Company granted 350,290 points, and 416,541 points were settled for individuals whoretired during fiscal 2017. Total points outstanding under the stock compensation program as of March 31, 2017were 1,576,708 points. The points were adjusted for the 10-for-1 stock split implemented on April 1, 2013.
During fiscal 2015, 2016 and 2017, the Company recognized stock-based compensation costs of its stockcompensation program in the amount of ¥818 million, ¥646 million and ¥611 million, respectively.
F-103

NOTES TO CONSOLIDATED FINANCIAL STATEMENTS—(Continued)
ORIX Corporation and Subsidiaries
20. Accumulated Other Comprehensive Income (Loss)
Changes in each component of accumulated other comprehensive income (loss) attributable to ORIXCorporation Shareholders in fiscal 2015, 2016 and 2017 are as follows:
Millions of yen
Net unrealizedgains (losses)on investmentin securities
Definedbenefitpensionplans
Foreigncurrency
translationadjustments
Net unrealizedgains (losses)on derivativeinstruments
Accumulatedother
comprehensiveincome (loss)
Balance at March 31, 2014 . . . . . . . . . . . . . . . . . . . . . . . . . . ¥ 38,651 ¥ (6,230) ¥(31,949) ¥ (434) ¥ 38
Net unrealized gains on investment in securities, net of taxof ¥(15,416) million . . . . . . . . . . . . . . . . . . . . . . . . . . . . . 34,914 34,914
Reclassification adjustment included in net income,net of tax of ¥8,501 million . . . . . . . . . . . . . . . . . . . . (25,047) (25,047)
Defined benefit pension plans, net of tax of ¥3,960 million . . (14,834) (14,834)Reclassification adjustment included in net income,
net of tax of ¥85 million . . . . . . . . . . . . . . . . . . . . . . (118) (118)Foreign currency translation adjustments, net of tax of
¥(7,000) million . . . . . . . . . . . . . . . . . . . . . . . . . . . . . . . . 38,309 38,309Reclassification adjustment included in net income,
net of tax of ¥120 million . . . . . . . . . . . . . . . . . . . . . (1,154) (1,154)Net unrealized losses on derivative instruments, net of tax
of ¥971 million . . . . . . . . . . . . . . . . . . . . . . . . . . . . . . . . . (2,985) (2,985)Reclassification adjustment included in net income,
net of tax of ¥(716) million . . . . . . . . . . . . . . . . . . . . 2,424 2,424
Total other comprehensive income (loss) . . . . . . . . . . . . . . . 9,867 (14,952) 37,155 (561) 31,509
Transaction with noncontrolling interests . . . . . . . . . . . . . . . 0 0 96 0 96
Less: Other Comprehensive Income (loss) Attributable tothe Noncontrolling Interest . . . . . . . . . . . . . . . . . . . . . . . . (1,812) (1,734) (4,424) (55) (8,025)
Less: Other Comprehensive Income Attributable to theRedeemable Noncontrolling Interests . . . . . . . . . . . . . . . . 0 0 9,295 0 9,295
Balance at March 31, 2015 . . . . . . . . . . . . . . . . . . . . . . . . . . ¥ 50,330 ¥(19,448) ¥ 431 ¥ (940) ¥ 30,373
Net unrealized gains on investment in securities, net of tax of¥(3,579) million . . . . . . . . . . . . . . . . . . . . . . . . . . . . . . . . . 14,593 14,593
Reclassification adjustment included in net income,net of tax of ¥9,582 million . . . . . . . . . . . . . . . . . . . . (17,714) (17,714)
Defined benefit pension plans, net of tax of¥2,969 million . . . . . . . . . . . . . . . . . . . . . . . . . . . . . . . . . . (4,440) (4,440)
Reclassification adjustment included in net income,net of tax of ¥(15) million . . . . . . . . . . . . . . . . . . . . . 317 317
Foreign currency translation adjustments, net of tax of¥2,921 million . . . . . . . . . . . . . . . . . . . . . . . . . . . . . . . . . . (27,763) (27,763)
Reclassification adjustment included in net income,net of tax of ¥0 million . . . . . . . . . . . . . . . . . . . . . . . 806 806
Net unrealized losses on derivative instruments, net of taxof ¥2,037 million . . . . . . . . . . . . . . . . . . . . . . . . . . . . . . . . (4,901) (4,901)
Reclassification adjustment included in net income, net oftax of ¥(341) million . . . . . . . . . . . . . . . . . . . . . . . . . . . . . 838 838
Total other comprehensive income (loss) . . . . . . . . . . . . . . . (3,121) (4,123) (26,957) (4,063) (38,264)
Less: Other Comprehensive Income (loss) Attributable tothe Noncontrolling Interest . . . . . . . . . . . . . . . . . . . . . . . . 24 313 (2,679) (246) (2,588)
Less: Other Comprehensive Income Attributable to theRedeemable Noncontrolling Interests . . . . . . . . . . . . . . . . 0 0 919 0 919
Balance at March 31, 2016 . . . . . . . . . . . . . . . . . . . . . . . . . . ¥ 47,185 ¥(23,884) ¥(24,766) ¥(4,757) ¥ (6,222)
F-104

NOTES TO CONSOLIDATED FINANCIAL STATEMENTS—(Continued)
ORIX Corporation and Subsidiaries
Millions of yen
Net unrealizedgains (losses)on investmentin securities
Definedbenefitpensionplans
Foreigncurrency
translationadjustments
Net unrealizedgains (losses)on derivativeinstruments
Accumulatedother
comprehensiveincome (loss)
Balance at March 31, 2016 . . . . . . . . . . . . . . . . . . . . . . . . . . ¥ 47,185 ¥(23,884) ¥(24,766) ¥(4,757) ¥ (6,222)
Net unrealized gains on investment in securities, net of taxof ¥(1,962) million . . . . . . . . . . . . . . . . . . . . . . . . . . . . . . (470) (470)
Reclassification adjustment included in net income,net of tax of ¥8,255 million . . . . . . . . . . . . . . . . . . . . (14,456) (14,456)
Defined benefit pension plans, net of tax of¥(2,422) million . . . . . . . . . . . . . . . . . . . . . . . . . . . . . . . . 7,226 7,226
Reclassification adjustment included in net income,net of tax of ¥(160) million . . . . . . . . . . . . . . . . . . . . 444 444
Foreign currency translation adjustments, net of tax of¥9,385 million . . . . . . . . . . . . . . . . . . . . . . . . . . . . . . . . . . (6,570) (6,570)
Reclassification adjustment included in net income,net of tax of ¥(809) million . . . . . . . . . . . . . . . . . . . . 602 602
Net unrealized losses on derivative instruments, net of taxof ¥(788) million . . . . . . . . . . . . . . . . . . . . . . . . . . . . . . . . 2,020 2,020
Reclassification adjustment included in net income,net of tax of ¥559 million . . . . . . . . . . . . . . . . . . . . . (1,694) (1,694)
Total other comprehensive income (loss) . . . . . . . . . . . . . . . (14,926) 7,670 (5,968) 326 (12,898)
Transaction with noncontrolling interests . . . . . . . . . . . . . . . 12 (954) (4,245) 0 (5,187)
Less: Other Comprehensive Income (loss) Attributable tothe Noncontrolling Interest . . . . . . . . . . . . . . . . . . . . . . . . (8) 162 (3,185) 52 (2,979)
Less: Other Comprehensive Income (loss) Attributable tothe Redeemable Noncontrolling Interests . . . . . . . . . . . . . 0 0 (58) 0 (58)
Balance at March 31, 2017 . . . . . . . . . . . . . . . . . . . . . . . . . . ¥ 32,279 ¥(17,330) ¥(31,736) ¥(4,483) ¥(21,270)
F-105
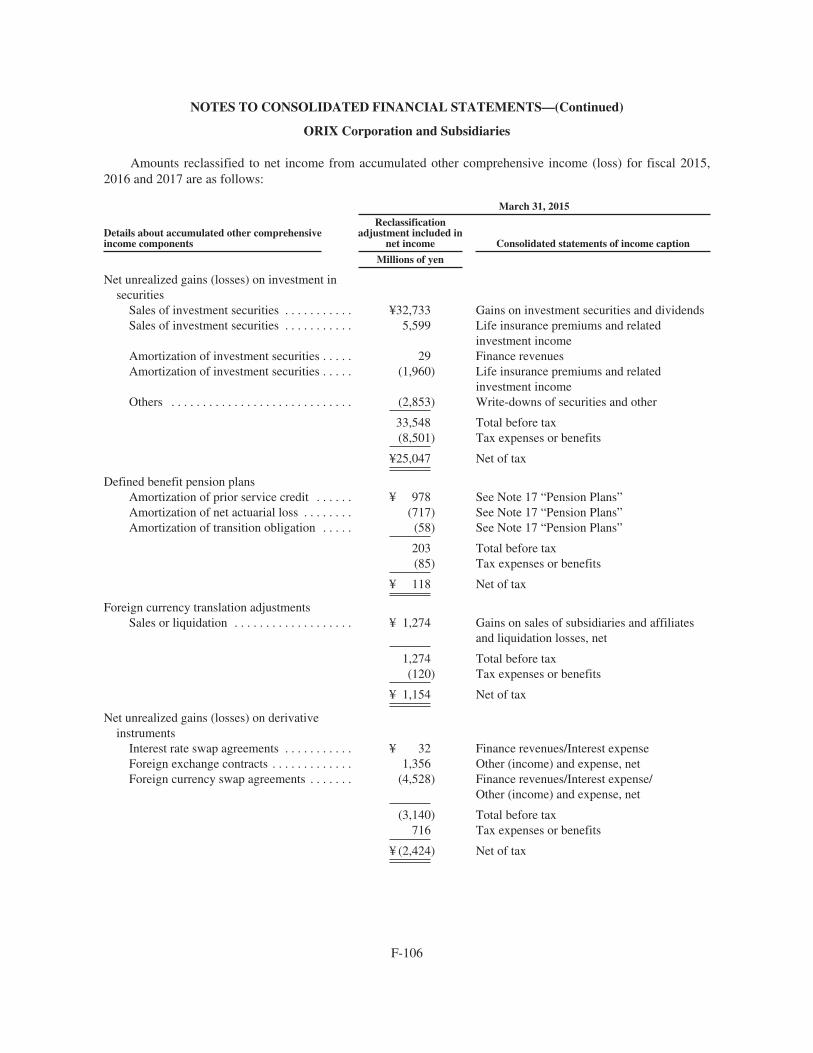
NOTES TO CONSOLIDATED FINANCIAL STATEMENTS—(Continued)
ORIX Corporation and Subsidiaries
Amounts reclassified to net income from accumulated other comprehensive income (loss) for fiscal 2015,2016 and 2017 are as follows:
March 31, 2015
Details about accumulated other comprehensiveincome components
Reclassificationadjustment included in
net income Consolidated statements of income caption
Millions of yen
Net unrealized gains (losses) on investment insecurities
Sales of investment securities . . . . . . . . . . . ¥32,733 Gains on investment securities and dividendsSales of investment securities . . . . . . . . . . . 5,599 Life insurance premiums and related
investment incomeAmortization of investment securities . . . . . 29 Finance revenuesAmortization of investment securities . . . . . (1,960) Life insurance premiums and related
investment incomeOthers . . . . . . . . . . . . . . . . . . . . . . . . . . . . . (2,853) Write-downs of securities and other
33,548 Total before tax(8,501) Tax expenses or benefits
¥25,047 Net of tax
Defined benefit pension plansAmortization of prior service credit . . . . . . ¥ 978 See Note 17 “Pension Plans”Amortization of net actuarial loss . . . . . . . . (717) See Note 17 “Pension Plans”Amortization of transition obligation . . . . . (58) See Note 17 “Pension Plans”
203 Total before tax(85) Tax expenses or benefits
¥ 118 Net of tax
Foreign currency translation adjustmentsSales or liquidation . . . . . . . . . . . . . . . . . . . ¥ 1,274 Gains on sales of subsidiaries and affiliates
and liquidation losses, net
1,274 Total before tax(120) Tax expenses or benefits
¥ 1,154 Net of tax
Net unrealized gains (losses) on derivativeinstruments
Interest rate swap agreements . . . . . . . . . . . ¥ 32 Finance revenues/Interest expenseForeign exchange contracts . . . . . . . . . . . . . 1,356 Other (income) and expense, netForeign currency swap agreements . . . . . . . (4,528) Finance revenues/Interest expense/
Other (income) and expense, net
(3,140) Total before tax716 Tax expenses or benefits
¥ (2,424) Net of tax
F-106

NOTES TO CONSOLIDATED FINANCIAL STATEMENTS—(Continued)
ORIX Corporation and Subsidiaries
March 31, 2016
Details about accumulated other comprehensiveincome components
Reclassificationadjustment included in
net income Consolidated statements of income caption
Millions of yen
Net unrealized gains (losses) on investment insecurities
Sales of investment securities . . . . . . . . . . . ¥25,673 Gains on investment securities and dividendsSales of investment securities . . . . . . . . . . . 6,453 Life insurance premiums and related
investment incomeAmortization of investment securities . . . . . (182) Finance revenuesAmortization of investment securities . . . . . (1,584) Life insurance premiums and related
investment incomeOthers . . . . . . . . . . . . . . . . . . . . . . . . . . . . . (3,064) Write-downs of securities and other
27,296 Total before tax(9,582) Tax expenses or benefits
¥17,714 Net of tax
Defined benefit pension plansAmortization of prior service credit . . . . . . ¥ 1,041 See Note 17 “Pension Plans”Amortization of net actuarial loss . . . . . . . . (1,321) See Note 17 “Pension Plans”Amortization of transition obligation . . . . . (52) See Note 17 “Pension Plans”
(332) Total before tax15 Tax expenses or benefits
¥ (317) Net of tax
Foreign currency translation adjustmentsSales or liquidation . . . . . . . . . . . . . . . . . . . ¥ (806) Gains on sales of subsidiaries and affiliates
and liquidation losses, net
(806) Total before tax0 Tax expenses or benefits
¥ (806) Net of tax
Net unrealized gains (losses) on derivativeinstruments
Interest rate swap agreements . . . . . . . . . . . ¥ (27) Finance revenues/Interest expenseForeign exchange contracts . . . . . . . . . . . . . 2,608 Other (income) and expense, netForeign currency swap agreements . . . . . . . (3,760) Finance revenues/Interest expense/
Other (income) and expense, net
(1,179) Total before tax341 Tax expenses or benefits
¥ (838) Net of tax
F-107

NOTES TO CONSOLIDATED FINANCIAL STATEMENTS—(Continued)
ORIX Corporation and Subsidiaries
March 31, 2017
Details about accumulated other comprehensiveincome components
Reclassificationadjustment included in
net income Consolidated statements of income caption
Millions of yen
Net unrealized gains (losses) on investment insecurities
Sales of investment securities . . . . . . . . . . . ¥16,404 Gains on investment securities and dividendsSales of investment securities . . . . . . . . . . . 14,297 Life insurance premiums and related
investment incomeAmortization of investment securities . . . . . (648) Finance revenuesAmortization of investment securities . . . . . (1,125) Life insurance premiums and related
investment incomeOthers . . . . . . . . . . . . . . . . . . . . . . . . . . . . . (6,217) Write-downs of securities and other
22,711 Total before tax(8,255) Tax expenses or benefits
¥14,456 Net of tax
Defined benefit pension plansAmortization of prior service credit . . . . . . ¥ 1,021 See Note 17 “Pension Plans”Amortization of net actuarial loss . . . . . . . . (1,576) See Note 17 “Pension Plans”Amortization of transition obligation . . . . . (49) See Note 17 “Pension Plans”
(604) Total before tax160 Tax expenses or benefits
¥ (444) Net of tax
Foreign currency translation adjustmentsSales or liquidation . . . . . . . . . . . . . . . . . . . ¥ (1,411) Gains on sales of subsidiaries and affiliates
and liquidation losses, net
(1,411) Total before tax809 Tax expenses or benefits
¥ (602) Net of tax
Net unrealized gains (losses) on derivativeinstruments
Interest rate swap agreements . . . . . . . . . . . ¥ 7 Finance revenues/Interest expenseForeign exchange contracts . . . . . . . . . . . . . (136) Other (income) and expense, netForeign currency swap agreements . . . . . . . 2,382 Finance revenues/Interest expense/
Other (income) and expense, net
2,253 Total before tax(559) Tax expenses or benefits
¥ 1,694 Net of tax
Comprehensive income (loss) and its components attributable to ORIX Corporation and noncontrollinginterests have been reported, net of tax, in the consolidated statements of changes in equity, and informationabout comprehensive income (loss) and its components attributable to redeemable noncontrolling interests isprovided in Note 18 “Redeemable Noncontrolling Interests.” Total comprehensive income (loss) and itscomponents have been reported, net of tax, in the consolidated statements of comprehensive income.
F-108

NOTES TO CONSOLIDATED FINANCIAL STATEMENTS—(Continued)
ORIX Corporation and Subsidiaries
21. ORIX Corporation Shareholders’ Equity
Changes in the number of shares issued in fiscal 2015, 2016 and 2017 are as follows:
Number of shares
2015 2016 2017
Beginning balance . . . . . . . . . . . . . . . . . . . . . . . . . . . . . . . . . . . 1,322,777,628 1,323,644,528 1,324,058,828Exercise of stock options . . . . . . . . . . . . . . . . . . . . . . . . . . . . . . 866,900 414,300 48,500
Ending balance . . . . . . . . . . . . . . . . . . . . . . . . . . . . . . . . . . . . . . 1,323,644,528 1,324,058,828 1,324,107,328
The Japanese Companies Act (the “Act”) provides that an amount equivalent to 10% of any dividendsresulting from appropriation of retained earnings be appropriated to the legal reserve until the aggregate amountof the additional paid-in capital and the legal reserve equals 25% of the issued capital. The Act also provides thatboth additional paid-in capital and the legal reserve are not available for dividends but may be capitalized or maybe reduced by resolution of the general meeting of shareholders. However, if specified in the Company’s articlesof incorporation, dividends can be declared by the Board of Directors instead of the general meeting ofshareholders. In accordance with this, the Board of Directors of the Company resolved in May 2017 that a totalof ¥38,162 million dividends shall be distributed to the shareholders of record as of March 31, 2017. The liabilityfor declared dividends and related impact on total equity is accounted for in the period of such Board ofDirectors’ resolution.
The Act provides that at least one-half of amounts paid for new shares are included in common stock whenthey are issued. In conformity therewith, the Company has divided the principal amount of bonds converted intocommon stock and proceeds received from the issuance of common stock, including the exercise of warrants andstock acquisition rights, equally between common stock and additional paid-in capital, and set off expensesrelated to the issuance from the additional paid-in capital.
The amount available for dividends under the Act is calculated based on the amount recorded in theCompany’s non-consolidated financial statements prepared in accordance with accounting principles generallyaccepted in Japan. As a result, the amount available for dividends is ¥597,858 million as of March 31, 2017.
Retained earnings at March 31, 2017 include ¥50,799 million relating to equity in undistributed earnings ofthe companies accounted for by the equity method.
As of March 31, 2017, the restricted net assets of certain subsidiaries, which include regulatory capitalrequirements mainly for banking operations and life insurance of ¥25,177 million, do not exceed 25% ofconsolidated net assets.
22. Gains on Investment Securities and Dividends
Gains on investment securities and dividends in fiscal 2015, 2016 and 2017 consist of the following:
Millions of yen
2015 2016 2017
Net gains on investment securities . . . . . . . . . . . . . . . . . . . . . . . . . . . . . . . . . . . . . . ¥50,617 ¥31,134 ¥27,233Dividends income, other . . . . . . . . . . . . . . . . . . . . . . . . . . . . . . . . . . . . . . . . . . . . . 5,778 4,652 3,095
¥56,395 ¥35,786 ¥30,328
F-109

NOTES TO CONSOLIDATED FINANCIAL STATEMENTS—(Continued)
ORIX Corporation and Subsidiaries
Net gains on investment securities include net trading gains of ¥2,843 million, net trading gains of¥892 million and net trading losses of ¥65 million for fiscal 2015, 2016 and 2017, respectively.
23. Life Insurance Operations
Life insurance premiums and related investment income in fiscal 2015, 2016 and 2017 consist of thefollowing:
Millions of yen
2015 2016 2017
Life insurance premiums . . . . . . . . . . . . . . . . . . . . . . . . . . . . . . . . . . . . . . . . . . ¥186,547 ¥209,120 ¥247,427Life insurance related investment income (loss) . . . . . . . . . . . . . . . . . . . . . . . . 164,946 (19,699) 48,513
¥351,493 ¥189,421 ¥295,940
Life insurance premiums include reinsurance benefits, net of reinsurance premiums. For fiscal 2015, 2016and 2017, reinsurance benefits and reinsurance premiums included in life insurance premiums are as follows:
Millions of yen
2015 2016 2017
Reinsurance benefits . . . . . . . . . . . . . . . . . . . . . . . . . . . . . . . . . . . . . . . . . . . . . . . ¥ 2,483 ¥ 2,298 ¥ 4,023Reinsurance premiums . . . . . . . . . . . . . . . . . . . . . . . . . . . . . . . . . . . . . . . . . . . . . . (11,430) (11,530) (9,657)
The benefits and expenses of life insurance operations included in life insurance costs in the consolidatedstatements of income are recognized so as to associate with earned premiums over the life of contracts. Thisassociation is accomplished by means of the provision for future policy benefits and the deferral and subsequentamortization of policy acquisition costs (principally commissions and certain other expenses directly relating topolicy issuance and underwriting). Amortization charged to income for fiscal 2015, 2016 and 2017 amounted to¥11,917 million, ¥12,585 million and ¥14,346 million, respectively.
Life insurance premiums and related investment income include net realized and unrealized gains or lossesfrom investment assets under management on behalf of variable annuity and variable life policyholders, and netgains or losses from derivative contracts, which consist of gains or losses from futures, foreign exchangecontracts and options held, entered to economically hedge a portion of the minimum guarantee risk relating tovariable annuity and variable life insurance contracts. In addition, life insurance costs include the net amount ofthe changes in fair value of the variable annuity and variable life insurance contracts elected for the fair valueoption and insurance costs recognized for insurance and annuity payouts as a result of insured events. Certainsubsidiaries have elected the fair value option for certain reinsurance contracts to partially offset the changes infair value recognized in earnings of the policy liabilities and policy account balances attributable to the changesin the minimum guarantee risks of the variable annuity and variable life insurance contracts, and the changes inthe fair value of the reinsurance contracts were recorded in life insurance costs.
F-110

NOTES TO CONSOLIDATED FINANCIAL STATEMENTS—(Continued)
ORIX Corporation and Subsidiaries
The above mentioned gains or losses relating to variable annuity and variable life insurance contracts forfiscal 2015, 2016 and 2017 are as follows:
Millions of yen
2015 2016 2017
Life insurance premiums and related investment income :Net realized and unrealized gains or losses from investment
assets . . . . . . . . . . . . . . . . . . . . . . . . . . . . . . . . . . . . . . . . . . . . . . . . ¥ 174,602 ¥ (33,318) ¥ 37,016Net gains or losses from derivative contracts : . . . . . . . . . . . . . . . . . . (28,227) 1,633 (10,568)
Futures . . . . . . . . . . . . . . . . . . . . . . . . . . . . . . . . . . . . . . . . . . . . . (10,216) 1,116 (9,118)Foreign exchange contracts . . . . . . . . . . . . . . . . . . . . . . . . . . . . . (1,680) 496 220Options held . . . . . . . . . . . . . . . . . . . . . . . . . . . . . . . . . . . . . . . . (16,331) 21 (1,670)
Life insurance costs :Changes in the fair value of the policy liabilities and policy account
balances . . . . . . . . . . . . . . . . . . . . . . . . . . . . . . . . . . . . . . . . . . . . . . ¥(510,961) ¥(459,482) ¥ (189,481)Insurance costs recognized for insurance and annuity payouts as a
result of insured events . . . . . . . . . . . . . . . . . . . . . . . . . . . . . . . . . . 611,663 418,731 185,830Changes in the fair value of the reinsurance contracts . . . . . . . . . . . . 36,072 (1,817) 15,739
24. Sales of Goods and Real Estate
The following table provides information about sales of goods and real estate and costs of goods and realestate sold for fiscal 2015, 2016 and 2017:
Millions of yen
2015 2016 2017
Sales of goods . . . . . . . . . . . . . . . . . . . . . . . . . . . . . . . . . . . . . . . . . . . . . . . ¥ 352,228 ¥ 707,502 ¥ 898,022Real estate sales . . . . . . . . . . . . . . . . . . . . . . . . . . . . . . . . . . . . . . . . . . . . . . 98,641 126,508 117,227
Sales of goods and real estate . . . . . . . . . . . . . . . . . . . . . . . . . . . . . . . ¥ 450,869 ¥ 834,010 ¥ 1,015,249
Costs of goods sold . . . . . . . . . . . . . . . . . . . . . . . . . . . . . . . . . . . . . . . . . . . ¥ 308,723 ¥ 641,715 ¥ 832,423Costs of real estate sold . . . . . . . . . . . . . . . . . . . . . . . . . . . . . . . . . . . . . . . . 93,298 106,544 96,371
Costs of goods and real estate sold . . . . . . . . . . . . . . . . . . . . . . . . . . . ¥ 402,021 ¥ 748,259 ¥ 928,794
F-111

NOTES TO CONSOLIDATED FINANCIAL STATEMENTS—(Continued)
ORIX Corporation and Subsidiaries
25. Services Income and Services Expense
The following table provides information about services income and services expense for fiscal 2015, 2016and 2017:
Millions of yen
2015 2016 2017
Revenues from asset management and servicing . . . . . . . . . . . . . . . . . . . . . . . . ¥214,372 ¥201,470 ¥190,454Revenues from automobile related business . . . . . . . . . . . . . . . . . . . . . . . . . . . 70,442 76,134 73,091Revenues from facilities management related business . . . . . . . . . . . . . . . . . . . 115,177 106,632 102,399Revenues from environment and energy related business . . . . . . . . . . . . . . . . . 62,286 85,271 100,102Revenues from real estate management and contract work . . . . . . . . . . . . . . . . 171,562 174,170 181,088Revenues from commissions for M&A advisory services, financing advice,
financial restructuring advisory services and related services . . . . . . . . . . . . 78,342 22,983 0Other . . . . . . . . . . . . . . . . . . . . . . . . . . . . . . . . . . . . . . . . . . . . . . . . . . . . . . . . . . 53,367 68,526 90,769
Services income . . . . . . . . . . . . . . . . . . . . . . . . . . . . . . . . . . . . . . . . . . . . . ¥765,548 ¥735,186 ¥737,903
Expenses from asset management and servicing . . . . . . . . . . . . . . . . . . . . . . . . ¥ 52,825 ¥ 55,283 ¥ 47,126Expenses from automobile related business . . . . . . . . . . . . . . . . . . . . . . . . . . . 43,163 46,424 44,417Expenses from facilities management related business . . . . . . . . . . . . . . . . . . . 99,582 90,949 87,709Expenses from environment and energy related business . . . . . . . . . . . . . . . . . 51,436 68,888 77,020Expenses from real estate management and contract work . . . . . . . . . . . . . . . . 152,447 156,075 160,917Other . . . . . . . . . . . . . . . . . . . . . . . . . . . . . . . . . . . . . . . . . . . . . . . . . . . . . . . . . . 26,223 27,768 34,088
Services expense . . . . . . . . . . . . . . . . . . . . . . . . . . . . . . . . . . . . . . . . . . . . ¥425,676 ¥445,387 ¥451,277
26. Write-Downs of Long-Lived Assets
The Company and its subsidiaries perform tests for recoverability on long-lived assets classified as held andused for which events or changes in circumstances indicated that the assets might be impaired. The Company andits subsidiaries consider an asset’s carrying amount as not recoverable when such carrying amount exceeds theundiscounted future cash flows estimated to result from the use and eventual disposition of the asset. The netcarrying amount of assets not recoverable is reduced to fair value if lower than the carrying amount.
As of March 31, 2016 and 2017, the long-lived assets classified as held for sale in the accompanyingconsolidated balance sheets are as follows.
Millions of yen
2016 2017
Investment in operating leases . . . . . . . . . . . . . . . . . . . . . . . . . . . . . . . . . . . . . . . . . . . . . . . ¥70,300 ¥32,283Property under facility operations . . . . . . . . . . . . . . . . . . . . . . . . . . . . . . . . . . . . . . . . . . . . . 2,811 1,977Other assets . . . . . . . . . . . . . . . . . . . . . . . . . . . . . . . . . . . . . . . . . . . . . . . . . . . . . . . . . . . . . . 9,959 2,508
The long-lived assets classified as held for sale as of March 31, 2016 are included in Real Estate segment,Investment and Operation segment and Overseas Business segment. The long-lived assets classified as held forsale as of March 31, 2017 are included in Corporate Financial Services segment, Maintenance Leasing segment,Real Estate segment, Investment and Operation segment and Overseas Business segment.
The Company and its subsidiaries determine the fair value using appraisals prepared by independent thirdparty appraisers or our own staff of qualified appraisers, based on recent transactions involving sales of similar
F-112

NOTES TO CONSOLIDATED FINANCIAL STATEMENTS—(Continued)
ORIX Corporation and Subsidiaries
assets or other valuation techniques such as discounted cash flows methodologies using future cash flowsestimated to be generated from operation of the existing assets or completion of development projects, asappropriate.
During fiscal 2015, 2016 and 2017, the Company and its subsidiaries recognized impairment losses for thedifference between carrying amounts and fair values in the amount of ¥34,887 million, ¥13,448 million and¥9,134 million, respectively, which are reflected as write-downs of long-lived assets. Breakdowns of theseamounts are as follows.
Fiscal Year endedMarch 31, 2015
Write-downs of the assetsheld for sale
Write-downs due to decline inestimated future cash flows
Amount(Millions of yen)
The number ofproperties
Amount(Millions of yen)
The number ofproperties
Office buildings . . . . . . . . . . . . . . . . . . . . . . . ¥4,805 3 ¥ 9,172 6Commercial facilities other than office
buildings . . . . . . . . . . . . . . . . . . . . . . . . . . 0 0 3,832 3Condominiums . . . . . . . . . . . . . . . . . . . . . . . . 0 0 621 1Land undeveloped or under construction . . . 586 4 2,797 4Others* . . . . . . . . . . . . . . . . . . . . . . . . . . . . . . 0 — 13,074 —
Total . . . . . . . . . . . . . . . . . . . . . . . . ¥5,391 — ¥29,496 —
Write-downs of the assetsheld for sale
Write-downs due to decline inestimated future cash flows
Fiscal Year endedMarch 31, 2016
Amount(Millions of yen)
The number ofproperties
Amount(Millions of yen)
The number ofproperties
Office buildings . . . . . . . . . . . . . . . . . . . . . . . ¥2,183 5 ¥ 5,855 6Commercial facilities other than office
buildings . . . . . . . . . . . . . . . . . . . . . . . . . . 502 2 1,559 3Condominiums . . . . . . . . . . . . . . . . . . . . . . . . 780 1 0 0Land undeveloped or under construction . . . 22 1 0 0Others* . . . . . . . . . . . . . . . . . . . . . . . . . . . . . . 2,353 — 194 —
Total . . . . . . . . . . . . . . . . . . . . . . . . ¥5,840 — ¥ 7,608 —
Write-downs of the assetsheld for sale
Write-downs due to decline inestimated future cash flows
Fiscal Year endedMarch 31, 2017
Amount(Millions of yen)
The number ofproperties
Amount(Millions of yen)
The number ofproperties
Office buildings . . . . . . . . . . . . . . . . . . . . . . . ¥ 68 1 ¥ 1,239 5Commercial facilities other than office
buildings . . . . . . . . . . . . . . . . . . . . . . . . . . 1,316 3 2,082 5Condominiums . . . . . . . . . . . . . . . . . . . . . . . . 317 1 69 1Land undeveloped or under construction . . . 0 0 786 5Others* . . . . . . . . . . . . . . . . . . . . . . . . . . . . . . 2,215 — 1,042 —
Total . . . . . . . . . . . . . . . . . . . . . . . . ¥3,916 — ¥ 5,218 —
* For the “Others”, the number of properties are omitted. Write-downs of long-lived assets for fiscal 2015include write-downs of ¥7,737 million of golf courses. Write-downs of long-lived assets for fiscal 2016include write-downs of ¥2,338 million of aircraft. Write-downs of long-lived assets for fiscal 2017 includewrite-downs of ¥1,156 million of aircraft.
F-113

NOTES TO CONSOLIDATED FINANCIAL STATEMENTS—(Continued)
ORIX Corporation and Subsidiaries
Breakdowns of these amounts by segment are provided in Note 34 “Segment Information.”
27. Discontinued Operations
In April 2014, Accounting Standards Update 2014-08 (“Reporting Discontinued Operations and Disclosuresof Disposals of Components of an Entity”—ASC 205 (“Presentation of Financial Statements”) and ASC 360(“Property, Plant, and Equipment”)) was issued. This Update requires an entity to report a disposal or aclassification as held for sale of a component of an entity or a group of components of an entity in discontinuedoperations if it represents a strategic shift that has (or will have) a major effect on an entity’s operations andfinancial results. The Company and its subsidiaries early adopted this Update on April 1, 2014. The Companyand its subsidiaries report a disposal of a component or a group of components of the Company and itssubsidiaries in discontinued operations if the disposal represents a strategic shift which has (or will have) a majoreffect on the Company and its subsidiaries’ operations and financial results when the component or group ofcomponents is disposed by sale or classified as held for sale on or after April 1, 2014.
During fiscal 2015, 2016 and 2017, there was no disposal or classification as held for sale of a component ora group of components which represents a strategic shift which has (or will have) a major effect on the Companyand its subsidiaries’ operations and financial results.
Accounting Standards Update 2014-08 does not apply retrospectively to a disposal or a classification as heldfor sale of a component or a group of components of the Company and its subsidiaries which have previouslybeen reported in the financial statements. Accordingly, during fiscal 2015, the Company and its subsidiariescontinue to report gains on sales and the results of operations of subsidiaries and business units, which wereclassified as held for sale at March 31, 2014, as income from discontinued operations in the accompanyingconsolidated statements of income.
During fiscal 2014, the Company has determined to sell the food business unit of a subsidiary, which iscomposed of the food service business unit and the food business unit. During fiscal 2015, the operating incomefrom the food business unit and the gain were ¥463 million. The Company has completed the sale of the foodbusiness unit of a subsidiary during fiscal 2015 and there are no amounts of assets or liabilities included in theaccompanying consolidated balance sheets as of March 31, 2015, 2016 and 2017.
Discontinued operations in fiscal 2015 consist of the following. During fiscal 2016 and 2017, there was noincome from discontinued operations.
Millions of yen
2015
Revenues . . . . . . . . . . . . . . . . . . . . . . . . . . . . . . . . . . . . . . . . . . . . . . . . . . . . . . . . . . . . . . . . . . . . . . . ¥2,214
Income from discontinued operations, net* . . . . . . . . . . . . . . . . . . . . . . . . . . . . . . . . . . . . . . . . . . . . 463Provision for income taxes . . . . . . . . . . . . . . . . . . . . . . . . . . . . . . . . . . . . . . . . . . . . . . . . . . . . . . . . . (166)
Discontinued operations, net of applicable tax effect . . . . . . . . . . . . . . . . . . . . . . . . . . . . . . . . . ¥ 297
* Income from discontinued operations, net includes aggregate gains on sales of subsidiaries, business units andrental properties and liquidation on losses. The amount of such gains or losses in fiscal 2015 was net gain of¥362 million.
F-114

NOTES TO CONSOLIDATED FINANCIAL STATEMENTS—(Continued)
ORIX Corporation and Subsidiaries
28. Per Share Data
Reconciliation of the differences between basic and diluted earnings per share (EPS) in fiscal 2015, 2016and 2017 is as follows:
In fiscal 2015, 2016 and 2017 the diluted EPS calculation excludes stock options for 6,499 thousand shares,4,370 thousand shares and 2,697 thousand shares, as they were antidilutive.
Millions of yen
2015 2016 2017
Net Income attributable to ORIX Corporation shareholders . . . . . . . . . . ¥ 234,651 ¥ 260,169 ¥ 273,239
Thousands of shares
2015 2016 2017
Weighted-average shares . . . . . . . . . . . . . . . . . . . . . . . . . . . . . . . . . . . . . . 1,309,144 1,309,136 1,308,105Effect of dilutive securities . . . . . . . . . . . . . . . . . . . . . . . . . . . . . . . . . . . .
Exercise of stock options . . . . . . . . . . . . . . . . . . . . . . . . . . . . . . . . . . 1,865 1,377 1,277
Weighted-average shares for diluted EPS computation . . . . . . . . . . . . . . 1,311,009 1,310,513 1,309,382
Yen
2015 2016 2017
Earnings per share for net income attributable to ORIX Corporationshareholders:
Basic . . . . . . . . . . . . . . . . . . . . . . . . . . . . . . . . . . . . . . . . . . . . . . . . . . . . . ¥ 179.24 ¥ 198.73 ¥ 208.88Diluted . . . . . . . . . . . . . . . . . . . . . . . . . . . . . . . . . . . . . . . . . . . . . . . . . . . . 178.99 198.52 208.68
Note: The Company’s shares held through the Board Incentive Plan Trust are included in the number oftreasury stock shares to be deducted in calculation of the weighted-average shares for EPS computation(1,159,738 shares, 1,984,512 shares and 2,092,595 shares in fiscal 2015, 2016 and 2017).
29. Derivative Financial Instruments and Hedging
Risk management policy
The Company and its subsidiaries manage interest rate risk through asset and liability management systems.The Company and its subsidiaries use derivative financial instruments to hedge interest rate risk and avoidchanges in interest rates that could have a significant adverse effect on the Company’s results of operations. As aresult of interest rate changes, the fair value and/or cash flow of interest sensitive assets and liabilities willfluctuate. However, such fluctuation will generally be offset by using derivative financial instruments as hedginginstruments. Derivative financial instruments that the Company and its subsidiaries use as part of the interest riskmanagement include interest rate swaps.
The Company and its subsidiaries utilize foreign currency borrowings, foreign exchange contracts andforeign currency swap agreements to hedge exchange rate risk that are associated with certain transactions andinvestments denominated in foreign currencies. Similarly, overseas subsidiaries generally structure theirliabilities to match the currency-denomination of assets in each region. A certain subsidiary holds optionagreements, futures and foreign exchange contracts for the purpose of economic hedges against minimumguarantee risk of variable annuity and variable life insurance contracts.
F-115

NOTES TO CONSOLIDATED FINANCIAL STATEMENTS—(Continued)
ORIX Corporation and Subsidiaries
By using derivative instruments, the Company and its subsidiaries are exposed to credit risk in the event ofnonperformance by counterparties. The Company and its subsidiaries attempt to manage the credit risk bycarefully evaluating the content of transactions and the quality of counterparties in advance and regularlymonitoring the amount of notional principal, fair value, type of transaction and other factors pertaining to eachcounterparty.
(a) Cash flow hedges
The Company and its subsidiaries designate interest rate swap agreements, foreign currency swapagreements and foreign exchange contracts as cash flow hedges for variability of cash flows originating fromfloating rate borrowings and forecasted transactions and for exchange fluctuations. Net gains (losses) beforededucting applicable taxes on derivative contracts were reclassified from accumulated other comprehensiveincome (loss) into earnings when earnings were affected by the variability in cash flows of the designated hedgeditem. The amounts of these net gains (losses) after deducting applicable taxes were net losses of ¥2,424 million,¥838 million and gains of ¥1,694 million during fiscal 2015, 2016 and 2017, respectively. The amount of netgains (losses), which represent the ineffectiveness of cash flow hedges, ¥510 million of gains, ¥111 million ofgains and ¥310 million of gains were recorded in earnings for fiscal 2015, 2016 and 2017, respectively. Theamount of net derivative gains, ¥3,170 million, included in accumulated other comprehensive income (loss), netof applicable income taxes at March 31, 2017 will be reclassified into earnings within fiscal 2018.
(b) Fair value hedges
The Company and its subsidiaries use financial instruments designated as fair value hedges to hedge theirexposure to interest rate risk and foreign currency exchange risk. The Company and its subsidiaries designateforeign currency swap agreements and foreign exchange contracts to minimize foreign currency exposures onlease receivables, loan receivables, borrowings and others, denominated in foreign currency. The Company andits subsidiaries designate interest rate swap to hedge interest rate exposure of the fair values of loan receivables.The Company and certain overseas subsidiaries, which issued medium-term notes or bonds with fixed interestrates, use interest rate swap agreements to hedge interest rate exposure of the fair values of these medium-termnotes or bonds. In cases where the medium-term notes were denominated in other than the subsidiaries’ localcurrencies, foreign currency swap agreements are used to hedge foreign exchange rate exposure. A certainoverseas subsidiary uses foreign currency long-term-debt to hedge foreign exchange rate exposure fromunrecognized firm commitment. For fiscal 2015, 2016 and 2017, net gains of ¥21 million, net gains of ¥1 millionand net losses of ¥2 million, respectively of hedge ineffectiveness associated with instruments designated as fairvalue hedges were recorded in earnings.
(c) Hedges of net investment in foreign operations
The Company uses foreign exchange contracts, borrowings and bonds denominated in the subsidiaries’ localcurrencies to hedge the foreign currency exposure of the net investment in overseas subsidiaries. The gains andlosses of these hedging instruments were recorded in foreign currency translation adjustments, which is a part ofother comprehensive income (loss).
(d) Derivatives not designated as hedging instruments
The Company and the subsidiaries entered into interest rate swap agreements, futures and foreign exchangecontracts for risk management purposes which are not qualified for hedge accounting. A certain subsidiary holdsoption agreements, futures and foreign exchange contracts for the purpose of economic hedges against minimumguarantee risk of variable annuity and variable life insurance contracts.
F-116

NOTES TO CONSOLIDATED FINANCIAL STATEMENTS—(Continued)
ORIX Corporation and Subsidiaries
The effect of derivative instruments on the consolidated statements of income, pre-tax, for fiscal 2015 is asfollows.
(1) Cash flow hedges
Gains (losses)recognized
in othercomprehensive
income onderivative
(effective portion)
Gains (losses) reclassified fromaccumulated other comprehensive
income (loss) into income(effective portion)
Gains (losses) recognizedin income on derivative
(ineffective portion and amountexcluded from effectiveness testing)
Millionsof yen
Consolidatedstatements of
income locationMillionsof yen
Consolidatedstatements of
income locationMillionsof yen
Interest rate swap agreements . . ¥ (610) Finance revenues/Interestexpense
¥ 32 — ¥ 0
Foreign exchange contracts . . . . (1,908) Other (income) and expense,net
1,356 — 0
Foreign currency swapagreements . . . . . . . . . . . . . . . (1,438) Finance revenues/Interest
expense/Other (income) andexpense, net
(4,528) Other (income) and expense,net
510
(2) Fair value hedges
Gains (losses) recognizedin income on derivative and other
Gains (losses) recognizedin income on hedged item
Millionsof yen
Consolidatedstatements of
income locationMillionsof yen
Consolidatedstatements of
income location
Interest rate swap agreements . . . . . . . ¥ (1,298) Finance revenues/Interest expense ¥ 1,318 Finance revenues/Interest expense
Foreign exchange contracts . . . . . . . . . (26,863) Other (income) and expense, net 26,863 Other (income) and expense, net
Foreign currency swap agreements . . . (3,398) Other (income) and expense, net 3,399 Other (income) and expense, net
Foreign currency long-term debt . . . . . (1,551) Other (income) and expense, net 1,551 Other (income) and expense, net
(3) Hedges of net investment in foreign operations
Gains (losses)recognized
in othercomprehensive
income onderivativeand others
(effective portion)
Gains (losses) reclassified fromaccumulated other comprehensive
income (loss) into income(effective portion)
Gains (losses) recognized inincome on derivative and others(ineffective portion and amount
excluded from effectiveness testing)
Millionsof yen
Consolidatedstatements of
income locationMillionsof yen
Consolidatedstatements of
income locationMillionsof yen
Foreign exchange contracts . . . . . ¥(18,670) Gains on sales of subsidiariesand affiliates and liquidationlosses, net
¥1,274 — ¥0
Borrowings and bonds in localcurrency . . . . . . . . . . . . . . . . . . (6,968) — 0 — 0
F-117

NOTES TO CONSOLIDATED FINANCIAL STATEMENTS—(Continued)
ORIX Corporation and Subsidiaries
(4) Derivatives not designated as hedging instruments
Gains (losses) recognized in income on derivative
Millionsof yen Consolidated statements of income location
Interest rate swap agreements . . . . . . . . . . . . . . . . . . . . . . . . . . . . ¥ (127) Other (income) and expense, netFutures . . . . . . . . . . . . . . . . . . . . . . . . . . . . . . . . . . . . . . . . . . . . . . (10,262) Gains on investment securities and dividends
Life insurance premiums and related investment income*Foreign exchange contracts . . . . . . . . . . . . . . . . . . . . . . . . . . . . . . (3,463) Gains on investment securities and dividends
Life insurance premiums and related investment income*Other (income) and expense, net
Credit derivatives held . . . . . . . . . . . . . . . . . . . . . . . . . . . . . . . . . 71 Other (income) and expense, netOptions held/written and other . . . . . . . . . . . . . . . . . . . . . . . . . . . (16,175) Other (income) and expense, net
Life insurance premiums and related investment income*
* Futures, foreign exchange contracts and options held/written and other in the above table include losses arising from futures, foreignexchange contracts and options held to economically hedge the minimum guarantee risk of variable annuity and variable life insurancecontracts for fiscal 2015 (see Note 23 “Life Insurance Operations”).
The effect of derivative instruments on the consolidated statements of income, pre-tax, for fiscal 2016 is asfollows.
(1) Cash flow hedges
Gains (losses)recognized
in othercomprehensive
income onderivative
(effective portion)
Gains (losses) reclassified fromaccumulated other comprehensive
income (loss) into income(effective portion)
Gains (losses) recognized inincome on derivative
(ineffective portion and amountexcluded from effectiveness testing)
Millionsof yen
Consolidatedstatements of
income locationMillionsof yen
Consolidatedstatements of
income locationMillionsof yen
Interest rate swap agreements . . . ¥ (4,463) Finance revenues/Interestexpense
¥ (27) — ¥ 0
Foreign exchange contracts . . . . . 491 Other (income) and expense,net
2,608 — 0
Foreign currency swapagreements . . . . . . . . . . . . . . . (2,786) Finance revenues/Interest
expense/Other (income) andexpense, net
(3,760) Other (income) and expense,net
111
(2) Fair value hedges
Gains (losses) recognizedin income on derivative and other
Gains (losses) recognizedin income on hedged item
Millionsof yen
Consolidatedstatements of
income locationMillionsof yen
Consolidatedstatements of
income location
Interest rate swap agreements . . . . . . . . ¥ (608) Finance revenues/Interest expense ¥ 608 Finance revenues/Interest expenseForeign exchange contracts . . . . . . . . . . 24,746 Other (income) and expense, net (24,746) Other (income) and expense, netForeign currency swap agreements . . . . 3,261 Other (income) and expense, net (3,260) Other (income) and expense, netForeign currency long-term debt . . . . . . 1,648 Other (income) and expense, net (1,648) Other (income) and expense, net
F-118

NOTES TO CONSOLIDATED FINANCIAL STATEMENTS—(Continued)
ORIX Corporation and Subsidiaries
(3) Hedges of net investment in foreign operations
Gains (losses)recognized
in othercomprehensive
income onderivativeand others
(effective portion)
Gains (losses) reclassified fromaccumulated other comprehensive
income (loss) into income(effective portion)
Gains (losses) recognizedin income on derivative and others
(ineffective portion and amountexcluded from effectiveness testing)
Millionsof yen
Consolidatedstatements of
income locationMillionsof yen
Consolidatedstatements of
income locationMillionsof yen
Foreign exchange contracts . . . . . ¥18,209 Gains on sales of subsidiariesand affiliates and liquidationlosses, net
¥(57) — ¥0
Borrowings and bonds in localcurrency . . . . . . . . . . . . . . . . . . 11,626 — 0 — 0
(4) Derivatives not designated as hedging instruments
Gains (losses) recognized in income on derivative
Millionsof yen Consolidated statements of income location
Interest rate swap agreements . . . . . . . . . . . . . . . . . . . . . . . . . . . . ¥ (95) Other (income) and expense, netFutures . . . . . . . . . . . . . . . . . . . . . . . . . . . . . . . . . . . . . . . . . . . . . . 1,092 Gains on investment securities and dividends
Life insurance premiums and related investment income*Foreign exchange contracts . . . . . . . . . . . . . . . . . . . . . . . . . . . . . . 470 Gains on investment securities and dividends
Life insurance premiums and related investment income*Other (income) and expense, net
Credit derivatives held . . . . . . . . . . . . . . . . . . . . . . . . . . . . . . . . . . 109 Other (income) and expense, netOptions held/written and other . . . . . . . . . . . . . . . . . . . . . . . . . . . (272) Other (income) and expense, net
Life insurance premiums and related investment income*
* Futures, foreign exchange contracts and options held/written and other in the above table include losses arising from futures, foreignexchange contracts and options held to economically hedge the minimum guarantee risk of variable annuity and variable life insurancecontracts for fiscal 2016 (see Note 23 “Life Insurance Operations”).
F-119

NOTES TO CONSOLIDATED FINANCIAL STATEMENTS—(Continued)
ORIX Corporation and Subsidiaries
The effect of derivative instruments on the consolidated statements of income, pre-tax, for fiscal 2017 is asfollows.
(1) Cash flow hedges
Gains (losses)recognized
in othercomprehensive
income onderivative
(effective portion)
Gains (losses) reclassified fromaccumulated other comprehensive
income (loss) into income(effective portion)
Gains (losses) recognized inincome on derivative
(ineffective portion and amountexcluded from effectiveness testing)
Millionsof yen
Consolidatedstatements of
income locationMillionsof yen
Consolidatedstatements of
income locationMillionsof yen
Interest rate swapagreements . . . . . . . . . . . . . . ¥ 1,757 Finance revenues/Interest
expense¥ 7 — ¥ 0
Foreign exchange contracts . . . (1,174) Other (income) and expense,net
(136) — 0
Foreign currency swapagreements . . . . . . . . . . . . . . 2,225 Finance revenues/Interest
expense/Other (income) andexpense, net
2,382 Other (income) and expense,net
310
(2) Fair value hedges
Gains (losses) recognized in incomeon derivative and other
Gains (losses) recognizedin income on hedged item
Millionsof yen
Consolidatedstatements of
income locationMillionsof yen
Consolidatedstatements of
income location
Interest rate swap agreements . . . . . . . . ¥ (56) Finance revenues/Interest expense ¥ 56 Finance revenues/Interest expenseForeign exchange contracts . . . . . . . . . (4,463) Other (income) and expense, net 4,463 Other (income) and expense, netForeign currency swap agreements . . . 595 Other (income) and expense, net (597) Other (income) and expense, netForeign currency long-term debt . . . . . 78 Other (income) and expense, net (78) Other (income) and expense, net
(3) Hedges of net investment in foreign operations
Gains (losses)recognized
in othercomprehensive
income onderivativeand others
(effective portion)
Gains (losses) reclassified fromaccumulated other comprehensive
income (loss) into income(effective portion)
Gains (losses) recognizedin income on derivative and others
(ineffective portion and amountexcluded from effectiveness testing)
Millionsof yen
Consolidatedstatements of
income locationMillionsof yen
Consolidatedstatements of
income locationMillionsof yen
Foreign exchange contracts . . . . . ¥2,300 Gains on sales of subsidiariesand affiliates and liquidationlosses, net
¥858 — ¥0
Borrowings and bonds in localcurrency . . . . . . . . . . . . . . . . . . 8,908 — 0 — 0
F-120

NOTES TO CONSOLIDATED FINANCIAL STATEMENTS—(Continued)
ORIX Corporation and Subsidiaries
(4) Derivatives or derivatives not designated as hedging instruments
Gains (losses) recognized in income on derivative
Millionsof yen Consolidated statements of income location
Interest rate swap agreements . . . . . . . . . . . . . . . . . . . . . . . . . . . . ¥ 634 Other (income) and expense, netFutures . . . . . . . . . . . . . . . . . . . . . . . . . . . . . . . . . . . . . . . . . . . . . . (9,104) Gains on investment securities and dividends
Life insurance premiums and related investment income*Foreign exchange contracts . . . . . . . . . . . . . . . . . . . . . . . . . . . . . . 4,602 Gains on investment securities and dividends
Life insurance premiums and related investment income*Other (income) and expense, net
Credit derivatives held . . . . . . . . . . . . . . . . . . . . . . . . . . . . . . . . . . (103) Other (income) and expense, netOptions held/written and other . . . . . . . . . . . . . . . . . . . . . . . . . . . (2,324) Other (income) and expense, net
Life insurance premiums and related investment income*
* Futures, foreign exchange contracts and options held/written and other in the above table include losses arising from futures, foreignexchange contracts and options held to economically hedge the minimum guarantee risk of variable annuity and variable life insurancecontracts for fiscal 2017 (see Note 23 “Life Insurance Operations”).
Notional amounts of derivative instruments and other, fair values of derivative instruments and other beforeoffsetting at March 31, 2016 and 2017 are as follows.
March 31, 2016
Asset derivatives Liability derivatives
Notional amount Fair value Consolidatedbalance sheets
location
Fair value Consolidatedbalance sheets
locationMillions of yenMillionsof yen
Millionsof yen
Derivatives designated as hedging instruments andother:
Interest rate swap agreements . . . . . . . . . . . . . . . . . . . . ¥ 257,700 ¥ 80 Other Assets ¥5,686 Other LiabilitiesFutures, foreign exchange contracts . . . . . . . . . . . . . . . 1,035,342 17,636 Other Assets 5,966 Other LiabilitiesForeign currency swap agreements . . . . . . . . . . . . . . . . 96,539 6,571 Other Assets 3,601 Other LiabilitiesForeign currency long-term debt . . . . . . . . . . . . . . . . . . 225,711 0 — 0 —Derivatives not designated as hedging instruments:Interest rate swap agreements . . . . . . . . . . . . . . . . . . . . ¥ 4,856 ¥ 13 Other Assets ¥ 235 Other LiabilitiesOptions held/written and other* . . . . . . . . . . . . . . . . . . 246,068 8,789 Other Assets 3,637 Other LiabilitiesFutures, foreign exchange contracts* . . . . . . . . . . . . . . 1,047,878 658 Other Assets 689 Other LiabilitiesCredit derivatives held . . . . . . . . . . . . . . . . . . . . . . . . . . 3,380 0 — 56 Other Liabilities
* The notional amounts of options held/written and other and futures, foreign exchange contracts in the above table include options held of¥46,926 million, futures contracts of ¥51,021 million and foreign exchange contracts of ¥20,884 million to economically hedge theminimum guarantee risk of variable annuity and variable life insurance contracts at March 31, 2016, respectively. Asset derivatives in theabove table include fair value of the options held, futures contracts and foreign exchange contracts before offsetting of ¥3,332 million,¥25 million and ¥568 million and liability derivatives include fair value of the futures and foreign exchange contracts before offsetting of¥417 million and ¥98 million at March 31, 2016, respectively.
F-121

NOTES TO CONSOLIDATED FINANCIAL STATEMENTS—(Continued)
ORIX Corporation and Subsidiaries
March 31, 2017
Asset derivatives Liability derivatives
Notional amount Fair value Consolidatedbalance sheets
location
Fair value Consolidatedbalance sheets
locationMillionsof yen
Millionsof yen
Millionsof yen
Derivatives designated as hedging instruments andother:
Interest rate swap agreements . . . . . . . . . . . . . . . . . . . . ¥243,197 ¥ 71 Other Assets ¥4,391 Other LiabilitiesFutures, foreign exchange contracts . . . . . . . . . . . . . . . 745,481 6,373 Other Assets 8,021 Other LiabilitiesForeign currency swap agreements . . . . . . . . . . . . . . . . 74,482 4,545 Other Assets 1,677 Other LiabilitiesForeign currency long-term debt . . . . . . . . . . . . . . . . . . 280,266 0 — 0 —Derivatives not designated as hedging instruments:Interest rate swap agreements . . . . . . . . . . . . . . . . . . . . ¥ 8,258 ¥ 233 Other Assets ¥ 176 Other LiabilitiesOptions held/written and other* . . . . . . . . . . . . . . . . . . 224,064 5,804 Other Assets 1,071 Other LiabilitiesFutures, foreign exchange contracts* . . . . . . . . . . . . . . 565,981 5,973 Other Assets 800 Other LiabilitiesCredit derivatives held . . . . . . . . . . . . . . . . . . . . . . . . . . 6,942 0 — 159 Other Liabilities
* The notional amounts of options held/written and other and futures, foreign exchange contracts in the above table include options held of¥46,063 million, futures contracts of ¥52,791 million and foreign exchange contracts of ¥16,690 million to economically hedge theminimum guarantee risk of variable annuity and variable life insurance contracts at March 31, 2017, respectively. Asset derivatives in theabove table include fair value of the options held, futures contracts and foreign exchange contracts before offsetting of ¥1,708 million,¥694 million and ¥57 million and liability derivatives include fair value of the futures and foreign exchange contracts before offsetting of¥37 million and ¥45 million at March 31, 2017, respectively.
Certain of the Company’s derivative instruments contain provisions that require the Company to maintainan investment grade credit rating from each of the major credit rating agencies. If the Company’s credit ratingwere to fall below investment grade, it would be in violation of these provisions, and the counterparties to thederivative instruments could request immediate payment on derivative instruments that are in net liabilitypositions. There are no derivative instruments with credit-risk-related contingent features that were in a netliability position on March 31, 2016 and 2017.
F-122

NOTES TO CONSOLIDATED FINANCIAL STATEMENTS—(Continued)
ORIX Corporation and Subsidiaries
30. Offsetting Assets and Liabilities
The gross amounts recognized, gross amounts offset, and net amounts presented in the consolidated balancesheet regarding to derivative assets and liabilities and other assets and liabilities as of March 31, 2016 and 2017are as follows.
March 31, 2016
Millions of yen
Grossamounts
recognized
Gross amountsoffset in theconsolidated
balance sheets
Net amountspresented in
the consolidatedbalance sheets
Gross amounts not offsetin the consolidatedbalance sheets*1
Net amountFinancial
instruments
Collateralreceived/pledged
Derivative assets . . . . . . . . . . . . . . . . . . ¥ 33,747 ¥ (5,757) ¥ 27,990 ¥ 0 ¥ (3,332) ¥ 24,658Reverse repurchase, securities
borrowing, and similararrangements*2 . . . . . . . . . . . . . . . . . 5,186 (5,186) 0 0 0 0
Total assets . . . . . . . . . . . . . . . . . . . . . . ¥ 38,933 ¥ (10,943) ¥ 27,990 ¥ 0 ¥ (3,332) ¥ 24,658
Derivative liabilities . . . . . . . . . . . . . . . ¥ 19,870 ¥ (5,757) ¥ 14,113 ¥ 0 ¥ (225) ¥ 13,888Repurchase, securities lending, and
similar arrangements*2 . . . . . . . . . . . 5,203 (5,186) 17 0 0 17
Total liabilities . . . . . . . . . . . . . . . . . . . . ¥ 25,073 ¥ (10,943) ¥ 14,130 ¥ 0 ¥ (225) ¥ 13,905
March 31, 2017
Millions of yen
Grossamounts
recognized
Gross amountsoffset in theconsolidated
balance sheets
Net amountspresented in
the consolidatedbalance sheets
Gross amounts not offsetin the consolidatedbalance sheets*1
Net amountFinancial
instruments
Collateralreceived/pledged
Derivative assets . . . . . . . . . . . . . . . . . . ¥ 22,999 ¥ (4,019) ¥ 18,980 ¥ 0 ¥ (3,132) ¥ 15,848Reverse repurchase, securities
borrowing, and similararrangements*2 . . . . . . . . . . . . . . . . . 3,582 (3,503) 79 0 0 79
Total assets . . . . . . . . . . . . . . . . . . . . . . ¥ 26,581 ¥ (7,522) ¥ 19,059 ¥ 0 ¥ (3,132) ¥ 15,927
Derivative liabilities . . . . . . . . . . . . . . . ¥ 16,295 ¥ (4,019) ¥ 12,276 ¥ (1,105) ¥ (398) ¥ 10,773Repurchase, securities lending, and
similar arrangements*2 . . . . . . . . . . . 3,503 (3,503) 0 0 0 0
Total liabilities . . . . . . . . . . . . . . . . . . . . ¥ 19,798 ¥ (7,522) ¥ 12,276 ¥ (1,105) ¥ (398) ¥ 10,773
*1 The balances related to enforceable master netting agreements or similar agreements which were not offset in the consolidated balancesheets.
*2 Reserve repurchase agreements and securities borrowing, and similar transactions are reported within other assets in the consolidatedbalance sheets. Repurchase agreements and securities lending, and similar transactions are reported within other liabilities in theconsolidated balance sheets.
31. Significant Concentrations of Credit Risk
The Company and its subsidiaries have established various policies and procedures to manage creditexposure, including initial credit approval, credit limits, collateral and guarantee requirements, obtaining rights of
F-123

NOTES TO CONSOLIDATED FINANCIAL STATEMENTS—(Continued)
ORIX Corporation and Subsidiaries
offset and continuous oversight. The Company and its subsidiaries’ principal financial instrument portfolioconsists of investment in direct financing leases which are secured by title to the leased assets and installmentloans which are secured by assets specifically collateralized in relation to loan agreements. When deemednecessary, guarantees are also obtained. The value and adequacy of the collateral are continually monitored.Consequently, the risk of credit loss from counterparties’ failure to perform in connection with collateralizedfinancing activities is believed to be minimal. The Company and its subsidiaries have access to collateral in caseof bankruptcy and other losses. However, a significant decline in real estate markets could result in a decline infair value of the collateral real estate below the mortgage setting amount, which would expose the Company andcertain subsidiaries to unsecured credit risk.
At March 31, 2016 and 2017, no concentration with a single obligor exceeded 1% of the Company’sconsolidated total assets. With respect to the Company and its subsidiaries’ credit exposures on a geographicbasis, ¥6,104 billion, or 78%, at March 31, 2016 and ¥6,072 billion, or 75%, at March 31, 2017 of the credit risksarising from all financial instruments are attributable to customers located in Japan. The largest concentration ofcredit risk outside of Japan is exposure attributable to obligors located in Americas. The gross amount of suchexposure is ¥849 billion and ¥965 billion as of March 31, 2016 and 2017, respectively.
The Company and its subsidiaries have transportation equipment such as automobile operations and aircraft.Transportation equipment is mainly recorded in investment in direct financing leases and operating leases. Inconnection with investment in direct financing leases and operating leases, the percentage of investment intransportation equipment to consolidated total assets is 11.0% and 11.4% as of March 31, 2016 and 2017,respectively.
The Company and its subsidiaries provide consumers with housing loans. In connection with installmentloans, the percentage of housing loans to consolidated total assets is 10.3% and 11.4% as of March 31, 2016 and2017, respectively.
32. Estimated Fair Value of Financial Instruments
The following information is provided to help readers gain an understanding of the relationship betweencarrying amount of financial instruments reported in the Company’s consolidated balance sheets and the relatedmarket or fair value. For derivative financial instruments, see Note 2 “Fair Value Measurements.”
The disclosures do not include investment in direct financing leases, investment in affiliates, pensionobligations and insurance contracts and reinsurance contracts except for those classified as investment contracts.
F-124

NOTES TO CONSOLIDATED FINANCIAL STATEMENTS—(Continued)
ORIX Corporation and Subsidiaries
March 31, 2016
Millions of yen
Carryingamount
Estimatedfair value Level 1 Level 2 Level 3
Assets:Trading securities . . . . . . . . . . . . . . . . . . . ¥ 725,821 ¥ 725,821 ¥ 37,592 ¥ 688,229 ¥ 0Cash and cash equivalents . . . . . . . . . . . . 730,420 730,420 730,420 0 0Restricted cash . . . . . . . . . . . . . . . . . . . . . 80,979 80,979 80,979 0 0Installment loans (net of allowance for
probable loan losses) . . . . . . . . . . . . . . 2,545,542 2,553,006 0 264,452 2,288,554Investment in securities:
Practicable to estimate fair value . . . 1,480,499 1,511,161 99,347 1,271,506 140,308Not practicable to estimate fair
value*1 . . . . . . . . . . . . . . . . . . . . . 138,472 138,472 0 0 0Other Assets:
Time deposits . . . . . . . . . . . . . . . . . . 9,843 9,843 0 9,843 0Derivative assets*2 . . . . . . . . . . . . . . 27,990 27,990 0 0 0Reinsurance recoverables
(Investment contracts) . . . . . . . . . 93,838 94,656 0 0 94,656Liabilities:
Short-term debt . . . . . . . . . . . . . . . . . . . . . ¥ 349,624 ¥ 349,624 ¥ 0 ¥ 349,624 ¥ 0Deposits . . . . . . . . . . . . . . . . . . . . . . . . . . 1,398,472 1,400,528 0 1,400,528 0Policy liabilities and Policy account
balances (Investment contracts) . . . . . . 306,058 308,064 0 0 308,064Long-term debt*3 . . . . . . . . . . . . . . . . . . . 3,936,918 3,955,178 0 1,102,332 2,852,846Other Liabilities:
Derivative liabilities*2 . . . . . . . . . . . 14,113 14,113 0 0 0
*1 The fair value of investment securities of ¥138,472 million was not estimated, as it was not practical.*2 It represents the amount after offset under counterparty netting of derivative assets and liabilities. For the
information of input level before netting, see Note 2 “Fair Value Measurements.”*3 Prior-year amounts have been adjusted for the retrospective application of Accounting Standards Update
2015-03 (“Simplifying the Presentation of Debt Issuance Costs”—ASC 835-30 (“Interest—Imputation ofInterest”)) on April 1, 2016.
F-125

NOTES TO CONSOLIDATED FINANCIAL STATEMENTS—(Continued)
ORIX Corporation and Subsidiaries
March 31, 2017
Millions of yen
Carryingamount
Estimatedfair value Level 1 Level 2 Level 3
Assets:Trading securities . . . . . . . . . . . . . . . . . . . ¥ 569,074 ¥ 569,074 ¥ 37,500 ¥ 531,574 ¥ 0Cash and cash equivalents . . . . . . . . . . . . 1,039,870 1,039,870 1,039,870 0 0Restricted cash . . . . . . . . . . . . . . . . . . . . . 93,342 93,342 93,342 0 0Installment loans (net of allowance for
probable loan losses) . . . . . . . . . . . . . . 2,767,016 2,783,466 0 254,708 2,528,758Investment in securities:
Practicable to estimate fair value . . . 1,307,618 1,332,941 93,995 1,086,629 152,317Not practicable to estimate fair
value*1 . . . . . . . . . . . . . . . . . . . . . 149,820 149,820 0 0 0Other Assets:
Time deposits . . . . . . . . . . . . . . . . . . 9,375 9,375 0 9,375 0Derivative assets*2 . . . . . . . . . . . . . . 18,980 18,980 0 0 0Reinsurance recoverables
(Investment contracts) . . . . . . . . . 72,615 73,967 0 0 73,967Liabilities:
Short-term debt . . . . . . . . . . . . . . . . . . . . . ¥ 283,467 ¥ 283,467 ¥ 0 ¥ 283,467 ¥ 0Deposits . . . . . . . . . . . . . . . . . . . . . . . . . . 1,614,608 1,615,655 0 1,615,655 0Policy liabilities and Policy account
balances (Investment contracts) . . . . . . 287,463 288,372 0 0 288,372Long-term debt . . . . . . . . . . . . . . . . . . . . . 3,854,984 3,862,815 0 1,184,261 2,678,554Other Liabilities:
Derivative liabilities*2 . . . . . . . . . . . 12,276 12,276 0 0 0
*1 The fair value of investment securities of ¥149,820 million was not estimated, as it was not practical.*2 It represents the amount after offset under counterparty netting of derivative assets and liabilities. For the
information of input level before netting, see Note 2 “Fair Value Measurements.”
Input level of fair value measurement
If active market prices are available, fair value measurement is based on quoted active market prices andclassified as Level 1. If active market prices are not available, fair value measurement is based on observableinputs other than quoted prices included within Level 1 such as quoted market prices of similar assets andclassified as Level 2. If market prices are not available and there are no observable inputs, then fair value isestimated by using valuation models including discounted cash flow methodologies, commonly used option-pricing models and broker quotes and classified as Level 3, as the valuation models and broker quotes are basedon inputs that are unobservable in the market.
F-126

NOTES TO CONSOLIDATED FINANCIAL STATEMENTS—(Continued)
ORIX Corporation and Subsidiaries
Estimation of fair value
The following methods and significant assumptions were used to estimate the fair value of each class offinancial instrument for which it is practicable to estimate a value:
Cash and cash equivalents, restricted cash, time deposits and short-term debt—The carrying amountsrecognized in the balance sheets were determined to be reasonable estimates of their fair values due to their shortmaturity.
Installment loans—The carrying amounts of floating-rate installment loans with no significant changes incredit risk and which could be repriced within a short-term period were determined to be reasonable estimates oftheir fair values. The carrying amounts of purchased loans were determined to be reasonable estimates of theirfair values because the carrying amounts (net of allowance) are considered to properly reflect the recoverabilityand value of these loans. For certain homogeneous categories of medium- and long-term fixed-rate loans, such ashousing loans, the estimated fair values were calculated by discounting the future cash flows using the currentinterest rates charged by the Company and its subsidiaries for new loans made to borrowers with similar creditratings and remaining maturities. Concerning the above, if available, estimated fair values were based on quotedmarket prices or quotations provided by dealers.
Investment in securities—For trading securities and available-for-sale securities other than specified bondsissued by SPEs and certain other mortgage-backed and asset-backed securities, the estimated fair values, whichare also the carrying amounts recorded in the balance sheets, were generally based on quoted market prices orquotations provided by dealers. As for the specified bonds issued by the SPEs and certain other mortgage-backedand asset-backed securities included in available-for-sale securities, the Company and its subsidiaries estimatedthe fair value by using valuation models including discounted cash flow methodologies and broker quotes (seeNote 2 “Fair Value Measurements”). For held-to-maturity securities, the estimated fair values were mainly basedon quoted market prices. For certain investment funds included in other securities, the fair values were estimatedbased on net asset value per share or discounted cash flow methodologies. With regard to other securities otherthan the investment funds described above, the Company and its subsidiaries have not estimated the fair value, asit is not practicable to do so. Those other securities mainly consist of non-marketable equity securities andpreferred capital shares. Because there were no quoted market prices for such other securities and each securityhas a different nature and characteristics, reasonable estimates of fair values could not be made without incurringexcessive costs.
Deposits—The carrying amounts of demand deposits recognized in the consolidated balance sheets weredetermined to be reasonable estimates of their fair values. The estimated fair values of time deposits werecalculated by discounting the future cash flows. The current interest rates offered for the deposits with similarterms and remaining average maturities were used as the discount rates.
Long-term debt—The carrying amounts of long-term debt with floating rates which could be repricedwithin short-term periods were determined to be reasonable estimates of their fair values. For medium-and long-term fixed-rate debt, the estimated fair values were calculated by discounting the future cash flows. Theborrowing interest rates that would be currently available to the Company and its subsidiaries offered byfinancial institutions for debt with similar terms and remaining average maturities were used as the discountrates. Concerning the above, if available, estimated fair values were based on quoted market prices or quotationsprovided by dealers.
Derivatives—For exchange-traded derivatives, fair value is based on quoted market prices. Fair valueestimates for other derivatives generally reflect the estimated amounts that the Company and its subsidiarieswould receive or pay to terminate the contracts at the balance sheet date, thereby taking into account the current
F-127

NOTES TO CONSOLIDATED FINANCIAL STATEMENTS—(Continued)
ORIX Corporation and Subsidiaries
unrealized gains or losses of open contracts. In estimating the fair value of most of the Company’s and itssubsidiaries’ derivatives, estimated future cash flows are discounted using the current interest rate.
Reinsurance recoverables and Policy liabilities and Policy account balances—A certain subsidiary hasfixed annuity contracts, variable annuity and variable life insurance contracts, and reinsurance contracts whichare classified as investment contracts because they do not expose the subsidiary to mortality or morbidity risks.In estimating the fair value of those contracts, estimated future cash flows are discounted using the currentinterest rate.
33. Commitments, Guarantees and Contingent Liabilities
Commitments—As of March 31, 2017, the Company and certain subsidiaries have commitments for thepurchase of equipment to be leased, having a cost of ¥706 million.
The minimum future rentals on non-cancelable operating leases are as follows:
Years ending March 31, Millions of yen
2018 . . . . . . . . . . . . . . . . . . . . . . . . . . . . . . . . . . . . . . . . . . . . . . . . . . . . . . . . . . . . . . . . . . . . . . . . . . . ¥ 6,7132019 . . . . . . . . . . . . . . . . . . . . . . . . . . . . . . . . . . . . . . . . . . . . . . . . . . . . . . . . . . . . . . . . . . . . . . . . . . . 6,3052020 . . . . . . . . . . . . . . . . . . . . . . . . . . . . . . . . . . . . . . . . . . . . . . . . . . . . . . . . . . . . . . . . . . . . . . . . . . . 5,5722021 . . . . . . . . . . . . . . . . . . . . . . . . . . . . . . . . . . . . . . . . . . . . . . . . . . . . . . . . . . . . . . . . . . . . . . . . . . . 4,5702022 . . . . . . . . . . . . . . . . . . . . . . . . . . . . . . . . . . . . . . . . . . . . . . . . . . . . . . . . . . . . . . . . . . . . . . . . . . . 4,207Thereafter . . . . . . . . . . . . . . . . . . . . . . . . . . . . . . . . . . . . . . . . . . . . . . . . . . . . . . . . . . . . . . . . . . . . . . 37,151
Total . . . . . . . . . . . . . . . . . . . . . . . . . . . . . . . . . . . . . . . . . . . . . . . . . . . . . . . . . . . . . . . . . . . . . . ¥64,518
The Company and certain subsidiaries lease office space under operating lease agreements, which areprimarily cancelable, and made rental payments totaling ¥15,782 million, ¥14,036 million and ¥13,849 million infiscal 2015, 2016 and 2017, respectively.
Certain computer systems of the Company and certain subsidiaries have been operated and maintainedunder non-cancelable contracts with third-party service providers. For such services, the Company and certainsubsidiaries made payments totaling ¥4,231 million, ¥4,754 million and ¥5,068 million in fiscal 2015, 2016 and2017, respectively. The longest contract of them will mature in fiscal 2023. As of March 31, 2017, the amountsdue are as follows:
Years ending March 31, Millions of yen
2018 . . . . . . . . . . . . . . . . . . . . . . . . . . . . . . . . . . . . . . . . . . . . . . . . . . . . . . . . . . . . . . . . . . . . . . . . . . . ¥ 5,2552019 . . . . . . . . . . . . . . . . . . . . . . . . . . . . . . . . . . . . . . . . . . . . . . . . . . . . . . . . . . . . . . . . . . . . . . . . . . . 4,2392020 . . . . . . . . . . . . . . . . . . . . . . . . . . . . . . . . . . . . . . . . . . . . . . . . . . . . . . . . . . . . . . . . . . . . . . . . . . . 3,0632021 . . . . . . . . . . . . . . . . . . . . . . . . . . . . . . . . . . . . . . . . . . . . . . . . . . . . . . . . . . . . . . . . . . . . . . . . . . . 8282022 . . . . . . . . . . . . . . . . . . . . . . . . . . . . . . . . . . . . . . . . . . . . . . . . . . . . . . . . . . . . . . . . . . . . . . . . . . . 679Thereafter . . . . . . . . . . . . . . . . . . . . . . . . . . . . . . . . . . . . . . . . . . . . . . . . . . . . . . . . . . . . . . . . . . . . . . 333
Total . . . . . . . . . . . . . . . . . . . . . . . . . . . . . . . . . . . . . . . . . . . . . . . . . . . . . . . . . . . . . . . . . . . . . . ¥14,397
The Company and certain subsidiaries have commitments to fund estimated construction costs to completeongoing real estate development projects and other commitments, totaling ¥88,447 million as of March 31, 2017.
F-128

NOTES TO CONSOLIDATED FINANCIAL STATEMENTS—(Continued)
ORIX Corporation and Subsidiaries
The Company and certain subsidiaries have agreements to commit to execute loans for customers, and toinvest in funds, as long as the agreed-upon terms are met. As of March 31, 2017, the total unused credit andcapital amount available is ¥333,540 million.
Guarantees—At the inception of a guarantee, the Company and its subsidiaries recognize a liability in theconsolidated balance sheets at fair value for the guarantee within the scope of ASC460 (“Guarantees”). Thefollowing table represents the summary of potential future payments, book value recorded as guarantee liabilitiesof the guarantee contracts outstanding and maturity of the longest guarantee contracts as of March 31, 2016 and2017:
2016 2017
Millions of yen Fiscal year Millions of yen Fiscal year
Guarantees
Potentialfuture
payment
Bookvalue of
guaranteeliabilities
Maturityof the
longestcontract
Potentialfuture
payment
Bookvalue of
guaranteeliabilities
Maturityof the
longestcontract
Corporate loans . . . . . . . . . . . . . . . . . . . . . ¥396,340 ¥ 5,875 2023 ¥451,597 ¥ 7,274 2024Transferred loans . . . . . . . . . . . . . . . . . . . . 174,322 1,587 2046 167,799 1,300 2047Consumer loans . . . . . . . . . . . . . . . . . . . . . 179,225 21,748 2018 249,719 29,641 2018Housing loans . . . . . . . . . . . . . . . . . . . . . . 28,919 5,853 2051 26,448 5,362 2048Other . . . . . . . . . . . . . . . . . . . . . . . . . . . . . 482 179 2024 935 307 2025
Total . . . . . . . . . . . . . . . . . . . . . . . . . . . . . ¥779,288 ¥35,242 — ¥896,498 ¥43,884 —
Guarantee of corporate loans: The Company and certain subsidiaries mainly guarantee corporate loansissued by financial institutions for customers. The Company and the subsidiaries are obliged to pay theoutstanding loans when the guaranteed customers fail to pay principal and/or interest in accordance with thecontract terms. In some cases, the corporate loans are secured by the guaranteed customers’ assets. Once theCompany and the subsidiaries assume the guaranteed customers’ obligation, the Company and the subsidiariesobtain a right to claim the collateral assets. In other cases, certain contracts that guarantee corporate loans issuedby financial institutions for customers include contracts that the amounts of performance guarantee are limited toa certain range of guarantee commissions. As of March 31, 2016 and 2017, total notional amount of the loanssubject to such guarantees are ¥1,278,000 million and ¥1,326,000 million, respectively, and book value ofguarantee liabilities are ¥1,080 million and ¥1,722 million, respectively. The potential future payment amountsfor these guarantees are limited to a certain range of the guarantee commissions, which are less than the totalnotional amounts of the loans subject to these guarantees. The potential future payment amounts for the contractperiod are calculated from the guarantee limit which is arranged by financial institutions in advance as tocontracts that the amounts of performance guarantee are unlimited to a certain range of guarantee commissions.For this reason, the potential future payment amounts for these guarantees include the amount of the guaranteewhich may occur in the future, which is larger than the balance of guarantee executed as of the end of the fiscalyear. The executed guarantee balance includes defrayment by financial institutions which we bear temporarily atthe time of execution, and credit risk for financial institutions until liquidation of this guarantee. Our substantialamounts of performance guarantee except credit risk for financial institutions are limited to our defraymentwhich is arranged by financial institutions in advance.
Payment or performance risk of the guarantees is considered based on the historical experience of creditevents. There have been no significant changes in the payment or performance risk of the guarantees in fiscal2017.
F-129

NOTES TO CONSOLIDATED FINANCIAL STATEMENTS—(Continued)
ORIX Corporation and Subsidiaries
Guarantee of transferred loans: A subsidiary in the United States is authorized to underwrite, originate,fund, and service multi-family and seniors housing loans without prior approval from Fannie Mae under FannieMae’s Delegated Underwriting and Servicing program. As part of this program, Fannie Mae provides acommitment to purchase the loans.
In return for the delegated authority, the subsidiary guarantees the performance of certain housing loanstransferred to Fannie Mae and has the payment or performance risk of the guarantees to absorb some of thelosses when losses arise from the transferred loans.
There were no significant changes in the payment or performance risk of these guarantees in fiscal 2017.
Guarantee of consumer loans: A certain subsidiary guarantees consumer loans, typically card loans, issuedby Japanese financial institutions. The subsidiary is obligated to pay the outstanding obligations when these loansbecome delinquent generally a month or more.
Payment or performance risk of the guarantees is considered based on the historical experience of creditevents.
There were no significant changes in the payment or performance risk of the guarantees in fiscal 2017.
Guarantee of housing loans: The Company and certain subsidiaries guarantee housing loans issued byJapanese financial institutions to third party individuals. The Company and the subsidiaries are typically obligedto pay the outstanding loans when these loans become delinquent three months or more. The housing loans areusually secured by the real properties. Once the Company and the subsidiaries assume the guaranteed parties’obligation, the Company and the subsidiaries obtain a right to claim the collateral assets.
Payment or performance risk of the guarantees is considered based on the historical experience of creditevents.
There were no significant changes in the payment or performance risk of the guarantees in fiscal 2017.
Other guarantees: Other guarantees include the guarantees to financial institutions and the guaranteesderived from collection agency agreements. Pursuant to the contracts of the guarantees to financial institutions, acertain subsidiary pays to the financial institutions when customers of the financial institutions become debtorsand default on the debts. Pursuant to the agreements of the guarantees derived from collection agencyagreements, the Company and certain subsidiaries collect third parties’ debt and pay the uncovered amounts.
Litigation—The Company and certain subsidiaries are involved in legal proceedings and claims in theordinary course of business. In the opinion of management, none of such proceedings and claims will have asignificant impact on the Company’s financial position or results of operations.
34. Segment Information
Financial information about the operating segments reported below is that which is available by segmentand evaluated regularly by the management in deciding how to allocate resources and in assessing performance.
F-130

NOTES TO CONSOLIDATED FINANCIAL STATEMENTS—(Continued)
ORIX Corporation and Subsidiaries
An overview of operations for each of the six segments follows below.
Corporate Financial Services : Lending, leasing and fee business
Maintenance Leasing : Automobile leasing and rentals, car sharing, and test and measurementinstruments and IT-related equipment rentals and leasing
Real Estate : Real estate development and rental, facility operation, REIT assetmanagement and real estate investment advisory services
Investment and Operation : Environment and energy business, principal investment, loan servicing(asset recovery), and concession business
Retail : Life insurance, banking and card loan business
Overseas Business : Leasing, lending, investment in bonds, asset management and ship- andaircraft-related operations
Financial information of the segments for fiscal 2015, 2016 and 2017 is as follows:
Year ended March 31, 2015
Millions of yen
CorporateFinancialServices
MaintenanceLeasing
RealEstate
Investmentand
Operation RetailOverseasBusiness Total
Revenues . . . . . . . . . . . . . . . . . . . . . . . ¥ 85,502 ¥263,499 ¥182,321 ¥ 666,120 ¥ 425,977 ¥ 561,893 ¥2,185,312Finance revenues . . . . . . . . . . . . . . . . . 35,624 11,103 4,057 15,650 52,510 63,259 182,203Interest expense . . . . . . . . . . . . . . . . . . 8,627 3,690 6,968 3,609 5,669 29,989 58,552Depreciation and amortization . . . . . . 3,373 125,013 16,900 5,919 15,190 47,397 213,792Other significant non-cash items:
Provision for doubtful receivablesand probable loan losses . . . . . . . 597 372 (85) (296) 3,975 8,086 12,649
Write-downs of long-lived assets . . 653 0 29,418 211 0 4,605 34,887Decrease in policy liabilities and
policy account balances . . . . . . . . 0 0 0 0 (506,043) 0 (506,043)Equity in net income (loss) of
affiliates and gains (losses) on salesof subsidiaries and affiliates andliquidation losses, net . . . . . . . . . . . 740 59 9,633 11,985 633 28,433 51,483
Bargain Purchase Gain . . . . . . . . . . . . 0 0 0 0 36,082 0 36,082Discontinued operations . . . . . . . . . . . 0 0 0 463 0 0 463Segment profits . . . . . . . . . . . . . . . . . . 25,519 40,366 3,484 42,414 120,616 104,143 336,542Segment assets . . . . . . . . . . . . . . . . . . . 1,132,468 662,851 835,386 660,014 3,700,635 2,178,895 9,170,249Long-lived assets . . . . . . . . . . . . . . . . . 35,470 450,099 652,524 145,153 49,838 289,097 1,622,181Expenditures for long-lived assets . . . 8,717 162,323 45,019 70,616 144 106,338 393,157Investment in affiliates . . . . . . . . . . . . 20,875 2,074 91,275 51,108 3,785 209,027 378,144
F-131

NOTES TO CONSOLIDATED FINANCIAL STATEMENTS—(Continued)
ORIX Corporation and Subsidiaries
Year ended March 31, 2016
Millions of yen
CorporateFinancialServices
MaintenanceLeasing
RealEstate
Investmentand
Operation RetailOverseasBusiness Total
Revenues . . . . . . . . . . . . . . . . . . . . . . . ¥ 107,150 ¥271,662 ¥191,540 ¥1,028,355 ¥ 254,289 ¥ 526,008 ¥2,379,004Finance revenues . . . . . . . . . . . . . . . . . 34,215 12,067 6,720 12,625 55,318 75,004 195,949Interest expense . . . . . . . . . . . . . . . . . . 7,214 3,545 4,676 3,539 4,654 33,356 56,984Depreciation and amortization . . . . . . 4,764 127,862 15,908 8,836 17,489 52,606 227,465Other significant non-cash items:
Provision for doubtful receivablesand probable loan losses . . . . . . . (701) 24 (110) (940) 7,370 7,277 12,920
Write-downs of long-lived assets . . 0 0 8,036 214 0 4,978 13,228Decrease in policy liabilities and
policy account balances . . . . . . . . 0 0 0 0 (405,014) 0 (405,014)Equity in net income (loss) of
affiliates and gains (losses) on salesof subsidiaries and affiliates andliquidation losses, net . . . . . . . . . . . 1,064 191 6,048 18,822 796 76,747 103,668
Segment profits . . . . . . . . . . . . . . . . . . 42,418 42,935 42,902 57,220 51,756 142,879 380,110Segment assets . . . . . . . . . . . . . . . . . . . 1,049,867 731,329 739,592 704,156 3,462,772 2,284,733 8,972,449Long-lived assets . . . . . . . . . . . . . . . . . 41,170 479,619 600,693 193,970 52,359 386,950 1,754,761Expenditures for long-lived assets . . . 14,180 151,330 49,858 74,645 439 272,315 562,767Investment in affiliates . . . . . . . . . . . . 22,755 1,996 91,010 108,237 911 305,674 530,583
Year ended March 31, 2017
Millions of yen
CorporateFinancialServices
MaintenanceLeasing
RealEstate
Investmentand
Operation RetailOverseasBusiness Total
Revenues . . . . . . . . . . . . . . . . . . . . . . . ¥ 102,979 ¥270,615 ¥212,050 ¥1,271,973 ¥ 368,665 ¥ 458,912 ¥2,685,194Finance revenues . . . . . . . . . . . . . . . . . 30,153 13,029 2,319 10,680 59,177 81,251 196,609Interest expense . . . . . . . . . . . . . . . . . . 6,032 3,360 3,085 4,870 4,041 36,535 57,923Depreciation and amortization . . . . . . 6,517 130,272 15,169 13,176 18,914 50,960 235,008Other significant non-cash items:
Provision for doubtful receivablesand probable loan losses . . . . . . . (96) 210 33 (1,047) 10,109 13,959 23,168
Write-downs of long-lived assets . . 0 46 3,353 1,569 0 3,908 8,876Decrease in policy liabilities and
policy account balances . . . . . . . . 0 0 0 0 (103,878) 0 (103,878)Equity in net income (loss) of
affiliates and gains (losses) on salesof subsidiaries and affiliates andliquidation losses, net . . . . . . . . . . . 3,354 178 4,160 39,750 14 42,470 89,926
Bargain Purchase Gain . . . . . . . . . . . . 0 0 0 5,802 0 0 5,802Segment profits . . . . . . . . . . . . . . . . . . 38,032 39,787 72,841 85,000 72,865 112,312 420,837Segment assets . . . . . . . . . . . . . . . . . . . 1,032,152 752,513 657,701 768,675 3,291,631 2,454,200 8,956,872Long-lived assets . . . . . . . . . . . . . . . . . 42,337 452,840 512,930 269,515 45,267 435,368 1,758,257Expenditures for long-lived assets . . . 8,330 164,486 32,875 74,787 276 196,451 477,205Investment in affiliates . . . . . . . . . . . . 18,392 1,880 99,347 71,481 810 332,154 524,064
Segment figures reported in these tables include operations classified as discontinued operations in theaccompanying consolidated statements of income.
F-132

NOTES TO CONSOLIDATED FINANCIAL STATEMENTS—(Continued)
ORIX Corporation and Subsidiaries
The accounting policies of the segments are almost the same as those described in Note 1 “SignificantAccounting and Reporting Policies” except for the treatment of income tax expenses, net income attributable tothe noncontrolling interests, net income attributable to the redeemable noncontrolling interests, income fromdiscontinued operations and the consolidation of certain variable interest entities (VIEs). Income taxes are notincluded in segment profits or losses because the management evaluates segments’ performance on a pre-taxbasis. Also, net income attributable to noncontrolling interests and redeemable noncontrolling interests are notincluded in segment profits or losses because the management evaluates segments’ performance based on profitsor losses (pre-tax) attributable to ORIX Corporation Shareholders. On the other hand, income from discontinuedoperations is included in segment profits or losses because the management considers such disposal activities aspart of the ordinary course of business. Net income attributable to the noncontrolling interests, net incomeattributable to the redeemable noncontrolling interests and income from discontinued operations, which arerecognized net of tax in the accompanying consolidated statements of income, are adjusted to profit or lossbefore income taxes, when calculating segment profits or losses. Most of selling, general and administrativeexpenses, including compensation costs that are directly related to the revenue generating activities of eachsegment, have been accumulated by and charged to each segment. Gains and losses that management does notconsider for evaluating the performance of the segments, such as write-downs of certain securities, write-downsof certain long-lived assets and certain foreign exchange gains or losses (included in other (income) and expense,net) are excluded from the segment profits or losses, and are regarded as corporate items.
Assets attributed to each segment are investment in direct financing leases, installment loans, investment inoperating leases, investment in securities, property under facility operations, investment in affiliates, inventories,advances for investment in operating leases (included in other assets), advances for investment in property underfacility operations (included in other assets) and goodwill and other intangible assets recognized as a result ofbusiness combination (included in other assets). This has resulted in the depreciation of office facilities beingincluded in each segment’s profit or loss while the carrying amounts of corresponding assets are not allocated toeach segment’s assets. However, the effect resulting from this allocation is not significant.
For those VIEs that are used for securitization and are consolidated, for which the VIE’s assets can be usedonly to settle related obligations of those VIEs and the creditors (or beneficial interest holders) do not haverecourse to other assets of the Company or its subsidiaries, segment assets are measured based on the amount ofthe Company and its subsidiaries’ net investments in the VIEs, which is different from the amount of total assetsof the VIEs, and accordingly, segment revenues are also measured at a net amount representing the revenuesearned on the net investments in the VIEs.
Certain gains or losses related to assets and liabilities of consolidated VIEs, which are not ultimatelyattributable to the Company and its subsidiaries, are excluded from segment profits.
The reconciliation of segment totals to consolidated financial statement amounts is as follows. Significantitems to be reconciled are segment revenues, segment profits and segment assets. Other items do not have asignificant difference between segment amounts and consolidated amounts.
Prior-year amounts have been adjusted for the retrospective application of Accounting Standards Update2015-03 (“Simplifying the Presentation of Debt Issuance Costs”—ASC 835-30 (“Interest—Imputation ofInterest”)) on April 1, 2016.
F-133

NOTES TO CONSOLIDATED FINANCIAL STATEMENTS—(Continued)
ORIX Corporation and Subsidiaries
Millions of yen
2015 2016 2017
Segment revenues:Total revenues for segments . . . . . . . . . . . . . . . . . . . . . . . . . . . . . . . . . . . . . . . ¥ 2,185,312 ¥ 2,379,004 ¥ 2,685,194Revenues related to corporate assets . . . . . . . . . . . . . . . . . . . . . . . . . . . . . . . . 6,531 9,230 9,244Revenues related to assets of certain VIEs . . . . . . . . . . . . . . . . . . . . . . . . . . . . 6,356 5,455 4,513Revenues from inter-segment transactions . . . . . . . . . . . . . . . . . . . . . . . . . . . . (21,702) (24,487) (20,292)Revenues from discontinued operations . . . . . . . . . . . . . . . . . . . . . . . . . . . . . . (2,214) 0 0
Total consolidated revenues . . . . . . . . . . . . . . . . . . . . . . . . . . . . . . . . . . . . . . . ¥ 2,174,283 ¥ 2,369,202 ¥ 2,678,659
Segment profits:Total segment profits . . . . . . . . . . . . . . . . . . . . . . . . . . . . . . . . . . . . . . . . . . . . ¥ 336,542 ¥ 380,110 ¥ 420,837Corporate losses . . . . . . . . . . . . . . . . . . . . . . . . . . . . . . . . . . . . . . . . . . . . . . . . (15,638) (5,261) (3,634)Gains related to assets or liabilities of certain VIEs . . . . . . . . . . . . . . . . . . . . . 3,267 5,632 75Discontinued operations, pre-tax . . . . . . . . . . . . . . . . . . . . . . . . . . . . . . . . . . . (463) 0 0Net income attributable to the noncontrolling interests and net income
attributable to the redeemable noncontrolling interests, net of applicabletax effect . . . . . . . . . . . . . . . . . . . . . . . . . . . . . . . . . . . . . . . . . . . . . . . . . . . . 20,309 10,821 7,687
Total consolidated income before income taxes and discontinuedoperations . . . . . . . . . . . . . . . . . . . . . . . . . . . . . . . . . . . . . . . . . . . . . . . . . . . ¥ 344,017 ¥ 391,302 ¥ 424,965
Segment assets:Total segment assets . . . . . . . . . . . . . . . . . . . . . . . . . . . . . . . . . . . . . . . . . . . . . ¥ 9,170,249 ¥ 8,972,449 ¥ 8,956,872Cash and cash equivalents, restricted cash . . . . . . . . . . . . . . . . . . . . . . . . . . . . 913,079 811,399 1,133,212Allowance for doubtful receivables on direct financing leases and probable
loan losses . . . . . . . . . . . . . . . . . . . . . . . . . . . . . . . . . . . . . . . . . . . . . . . . . . . (72,326) (60,071) (59,227)Trade notes, accounts and other receivable . . . . . . . . . . . . . . . . . . . . . . . . . . . 348,404 294,638 283,427Other corporate assets . . . . . . . . . . . . . . . . . . . . . . . . . . . . . . . . . . . . . . . . . . . . 785,882 700,612 672,562Assets of certain VIEs . . . . . . . . . . . . . . . . . . . . . . . . . . . . . . . . . . . . . . . . . . . 294,586 273,891 245,049
Total consolidated assets . . . . . . . . . . . . . . . . . . . . . . . . . . . . . . . . . . . . . . . . . ¥11,439,874 ¥10,992,918 ¥11,231,895
The following information represents geographical revenues and income before income taxes, which areattributed to geographic areas, based on the country location of the Company and its subsidiaries.
Millions of yen
Year Ended March 31, 2015
Japan The Americas*2 Other*3*4Difference between Geographic Total
and Consolidated Amounts Total
Total Revenues . . . . . . . . . . ¥1,602,610 ¥209,923 ¥363,964 ¥(2,214) ¥2,174,283Income before Income
Taxes*1 . . . . . . . . . . . . . . 228,063 32,382 84,035 (463) 344,017
Millions of yen
Year Ended March 31, 2016
Japan The Americas*2 Other*3*4Difference between Geographic Total
and Consolidated Amounts Total
Total Revenues . . . . . . . . . . ¥1,827,582 ¥186,186 ¥355,434 ¥ 0 ¥2,369,202Income before Income
Taxes . . . . . . . . . . . . . . . . 241,794 74,546 74,962 0 391,302
F-134

NOTES TO CONSOLIDATED FINANCIAL STATEMENTS—(Continued)
ORIX Corporation and Subsidiaries
Millions of yen
Year Ended March 31, 2017
Japan The Americas*2 Other*3*4Difference between Geographic Total
and Consolidated Amounts Total
Total Revenues . . . . . . . . . . ¥2,195,389 ¥142,430 ¥340,840 ¥0 ¥2,678,659Income before Income
Taxes . . . . . . . . . . . . . . . . 313,175 44,083 67,707 0 424,965
*1 Results of discontinued operations pre-tax are included in each amount attributed to each geographic area.*2 Mainly the United States*3 Mainly Asia, Europe, Australasia and Middle East*4 Robeco, one of the Company’s subsidiaries domiciled in the Netherlands, conducts principally an asset
management business. Due to the integrated nature of such business with its customer base spread across theworld, “Other” locations include the total revenues and the income before income taxes of Robeco for fiscal2015, 2016 and 2017, respectively. The revenues of Robeco aggregated on a legal entity basis were ¥99,059,million in the Americas and ¥96,966 million in other for fiscal 2015, ¥108,446 million in the Americas and¥76,726 million in other for fiscal 2016, and ¥96,157 million in the Americas and ¥76,012 million in otherfor fiscal 2017.
No single customer accounted for 10% or more of the Company’s total revenues for fiscal 2015, 2016 and2017.
35. Subsequent Events
The share repurchase based on the resolution at the Board of Directors meeting held on October 26, 2016and February 16, 2017 was completed. The details of share repurchasing subsequent to the balance sheet date areas follows.
• Classification of shares acquired Common shares• Total number of shares acquired 23,448,500 shares• Total value of shares acquired ¥39,108,901,400• Acquisition period April 1, 2017 – April 21, 2017• Acquisition method Open market purchase on the Tokyo Stock Exchange
(Reference)
Cumulative number of own shares acquired based on the above resolution at the Board of Directors meetingas of April 21, 2017
• Classification of shares acquired Common shares• Total number of shares acquired 29,993,100 shares• Total value of shares acquired ¥49,999,872,350• Acquisition period October 27, 2016 – April 21, 2017• Acquisition method Open market purchase on the Tokyo Stock Exchange
F-135

Schedule II.—Valuation and Qualifying Accounts and Reserves
ORIX Corporation and Subsidiaries
Description
Millions of yen
Year Ended March 31, 2015
Balance atbeginningof period Acquisitions
Addition:Charged tocosts andexpenses Deduction
Translationadjustment
Balance atend of period
Restructuring cost:Severance and other benefits to
terminated employees . . . . . . . . . . . . . . ¥ 1,932 ¥ 0 ¥ 0 ¥(1,474) ¥ (66) ¥ 392
Total . . . . . . . . . . . . . . . . . . . . . . . . . ¥ 1,932 ¥ 0 ¥ 0 ¥(1,474) ¥ (66) ¥ 392
Description
Millions of yen
Year Ended March 31, 2016
Balance atbeginningof period Acquisitions
Addition:Charged tocosts andexpenses Deduction
Translationadjustment
Balance atend of period
Restructuring cost:Severance and other benefits to
terminated employees . . . . . . . . . . . . . . ¥ 392 ¥ 0 ¥ 0 ¥ (237) ¥ 1 ¥ 156
Total . . . . . . . . . . . . . . . . . . . . . . . . . ¥ 392 ¥ 0 ¥ 0 ¥ (237) ¥ 1 ¥ 156
Description
Millions of yen
Year Ended March 31, 2017
Balance atbeginningof period Acquisitions
Addition:Charged tocosts andexpenses Deduction
Translationadjustment
Balance atend of period
Restructuring cost:Severance and other benefits to
terminated employees . . . . . . . . . . . . . . ¥ 156 ¥ 0 ¥ 86 ¥ (91) ¥ (7) ¥ 144
Total . . . . . . . . . . . . . . . . . . . . . . . . . ¥ 156 ¥ 0 ¥ 86 ¥ (91) ¥ (7) ¥ 144
Description
Millions of yen
Balance atbeginningof period Acquisitions
Addition:Charged tocosts andexpenses Deduction*1 Other*2
Balance atend of period
Deferred tax assets:Valuation allowanceYear ended March 31, 2015 . . . . . . . . . . . ¥30,570 ¥22,563 ¥9,591 ¥(9,944) ¥(2,265) ¥50,515Year ended March 31, 2016 . . . . . . . . . . . ¥50,515 ¥ 419 ¥2,936 ¥(4,622) ¥(6,028) ¥43,220Year ended March 31, 2017 . . . . . . . . . . . ¥43,220 ¥ 1,606 ¥2,043 ¥(2,104) ¥(1,278) ¥43,487
*1 The amount of deduction includes benefits recognized in earnings, expiry of loss carryforwards and sales of subsidiaries.*2 The amount of other includes translation adjustment, the effect of changes in statutory tax rate and the effect of the
amendment to tax loss carryforward rules.
F-136

EXHIBIT INDEX
Exhibit Number Description
Exhibit 1.1* Articles of Incorporation of ORIX Corporation, as amended on June 27, 2017.
Exhibit 1.2 Regulations of the Board of Directors of ORIX Corporation, as amended on June 1, 2015(Incorporated by reference from the annual report on Form 20-F filed on June 25, 2015,commission file number 001-14856).
Exhibit 1.3 Share Handling Regulations of ORIX Corporation, as amended on October 7, 2013(Incorporated by reference from the annual report on Form 20-F filed on June 26, 2014,commission file number 001-14856).
Exhibit 7.1* A statement explaining in reasonable detail how ratios in the annual report were calculated.
Exhibit 8.1* List of subsidiaries.
Exhibit 11.1 Code of Ethics, as amended on April 18, 2014 (Incorporated by reference from the annualreport on Form 20-F filed on June 26, 2014, commission file number 001-14856).
Exhibit 12.1* Certifications required by Rule 13a-14(a) (17 CFR 240.13a-14(a)) or Rule 15d-14(a) (17 CFR240.15d 14(a)).
Exhibit 12.2 Certifications required by Rule 13a-14(a) (17 CFR 240.13a-14(a)) or Rule 15d-14(a) (17 CFR240.15d 14(a)).
Exhibit 13.1* Certifications required by Rule 13a-14(b) (17 CFR 240.13a-14(b)) or Rule 15d-14(b) (17 CFR240.15d 14(b)) and Section 1350 of Chapter 63 of Title 18 of the United States Code(18 U.S.C. 1350).
Exhibit 13.2 Certifications required by Rule 13a-14(b) (17 CFR 240.13a-14(b)) or Rule 15d-14(b) (17 CFR240.15d 14(b)) and Section 1350 of Chapter 63 of Title 18 of the United States Code(18 U.S.C. 1350).
Exhibit 15.1* Consent of independent registered public accounting firm
Exhibit 15.2 Consent of independent registered public accounting firm
Exhibit 101* Instance Document.
Exhibit 101* Schema Document.
Exhibit 101* Calculation Linkbase Document.
Exhibit 101* Definition Linkbase Document.
Exhibit 101* Labels Linkbase Document.
Exhibit 101* Presentation Linkbase Document.
* Filed with the Original Form 20-F and incorporated by reference therefrom

Exhibit 12.2
CERTIFICATIONS PURSUANT TO SECTION 302 OF THE SARBANES-OXLEY ACT
I, Makoto Inoue, certify that:
1. I have reviewed this annual report on Form 20-F/A of ORIX KABUSHIKI KAISHA (the “company”);
2. Based on my knowledge, this report does not contain any untrue statement of a material fact or omit to statea material fact necessary to make the statements made, in light of the circumstances under which suchstatements were made, not misleading with respect to the period covered by this report; and
3. Based on my knowledge, the financial statements, and other financial information included in this report,fairly present in all material respects the financial condition, results of operations and cash flows of thecompany as of, and for, the periods presented in this report.
Date: July 5, 2017
By: /s/ MAKOTO INOUE
Name: Makoto InoueTitle: Chief Executive Officer
12.2-1

CERTIFICATIONS PURSUANT TO SECTION 302 OF THE SARBANES-OXLEY ACT
I, Kazuo Kojima, certify that:
1. I have reviewed this annual report on Form 20-F/A of ORIX KABUSHIKI KAISHA (the “company”);
2. Based on my knowledge, this report does not contain any untrue statement of a material fact or omit to statea material fact necessary to make the statements made, in light of the circumstances under which suchstatements were made, not misleading with respect to the period covered by this report; and
3. Based on my knowledge, the financial statements, and other financial information included in this report,fairly present in all material respects the financial condition, results of operations and cash flows of thecompany as of, and for, the periods presented in this report.
Date: July 5, 2017
By: /s/ KAZUO KOJIMA
Name: Kazuo KojimaTitle: Chief Financial Officer
12.2-2

Exhibit 13.2
CERTIFICATION PURSUANT TO SECTION 906 OF THE SARBANES-OXLEY ACT
The certification set forth below is being submitted in connection with the annual report of ORIXKABUSHIKI KAISHA on Form 20-F/A for the year ended March 31, 2017 (the “Report”) for the purpose ofcomplying with Rule 13a-14(b) or Rule 15d-14(b) of the United States Securities Exchange Act of 1934 (the“Exchange Act”) and Section 1350 of Chapter 63 of Title 18 of the United States Code.
Makoto Inoue, the Chief Executive Officer and Kazuo Kojima, the Chief Financial Officer of ORIXKABUSHIKI KAISHA, each certifies that, to the best of his knowledge:
1. the Report fully complies with the requirements of Section 13(a) or 15(d) of the Exchange Act; and
2. the information contained in the Report fairly presents, in all material respects, the financial condition andresults of operations of ORIX KABUSHIKI KAISHA.
Date: July 5, 2017
By: /s/ MAKOTO INOUE
Name: Makoto InoueTitle: Chief Executive Officer
By: /s/ KAZUO KOJIMA
Name: Kazuo KojimaTitle: Chief Financial Officer
13.2-1

Exhibit 15.2
Consent of Independent Registered Public Accounting Firm
The Board of DirectorsORIX Corporation:
We consent to the incorporation by reference in the registration statements (No. 333-197721) on Form F-3of ORIX Corporation of our reports dated June 29, 2017, with respect to the consolidated balance sheets of ORIXCorporation and its subsidiaries as of March 31, 2016 and 2017, and the related consolidated statements ofincome, comprehensive income, changes in equity and cash flows for each of the years in the three-year periodended March 31, 2017, and the related financial statement schedule, and the effectiveness of internal control overfinancial reporting as of March 31, 2017, which reports appear in the March 31, 2017 annual report on Form20-F/A of ORIX Corporation. Our report dated June 29, 2017, on the consolidated financial statements, containsan explanatory paragraph that states that the share repurchase based on the resolution at the Board of Directorsmeeting held on October 26, 2016 and February 16, 2017 was completed.
KPMG AZSA LLCTokyo, JapanJuly 5, 2017
15.2-1