orographic precipitation patterns resulting from … · orographic precipitation patterns resulting...
TRANSCRIPT
Orographic Precipitation Patterns Resulting from the Canadian River Valley
Chris A. Kimble
National Weather Service – Amarillo, Texas
ABSTRACT This report will show that the Canadian River Valley can have a significant effect on precipitation
patterns in the Texas Panhandle, especially during the cold season. Although the principles and physics associated with air flow across the valley are not new, the effect on precipitation in the Texas Panhandle has not yet been studied. This report will serve to document the effect that the Canadian River Valley has on cold season precipitation, and to recommend the use of orographic forecasting principles to forecasters in the entire High Plains region.
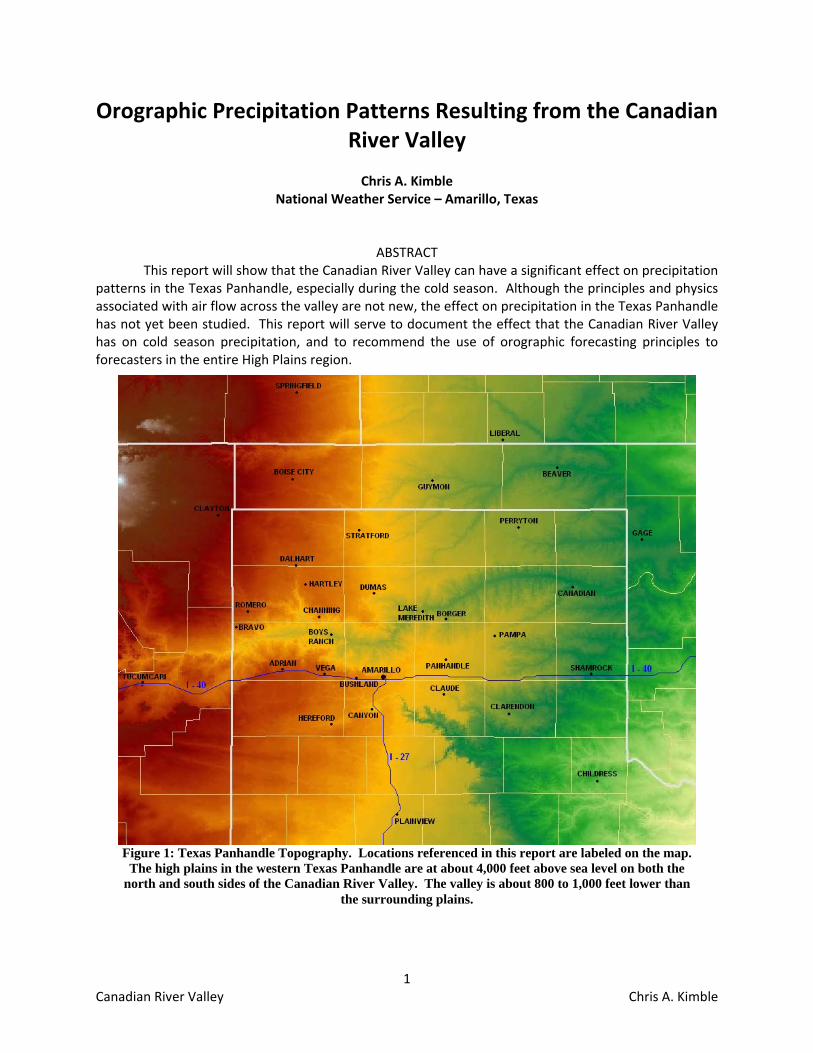
Figure 1: Texas Panhandle Topography. Locations referenced in this report are labeled on the map. The high plains in the western Texas Panhandle are at about 4,000 feet above sea level on both the
north and south sides of the Canadian River Valley. The valley is about 800 to 1,000 feet lower than the surrounding plains.
1 Canadian River Valley Chris A. Kimble
1.0 Introduction
Forecasters have long been aware of the effects that terrain can have on precipitation patterns. Precipitation on the windward side of mountain ranges is much greater than that on the leeward side and in mountain valleys. The physical processes are well understood and applied operationally in forecasting in mountainous regions. Similar processes have also been observed to take place in other regions of the country not typically known for orographic precipitation.
The Texas Panhandle is often thought of as a vast treeless plain. Flat grasslands extend as far as the eye can see. In reality, the terrain in this region is much more complicated. The “flat” terrain itself is actually gradually sloping with higher terrain to the west. To the east, the Caprock Escarpment is a rather abrupt 1000 foot drop which separates the high plains of the Llano Estacado from the rolling plains of Central Texas and Western Oklahoma. River valleys and canyons also create dramatic drops in elevation. The most notable of these are the Palo Duro Canyon and the Canadian River Valley. These sometimes subtle and often overlooked features play a role in precipitation patterns especially in the cold season.
The largest of these terrain features is the Canadian River Valley. This valley is roughly 800 to 1000 feet deep, 30 miles wide, and stretches east‐west across virtually all of the Texas Panhandle and into Northeastern New Mexico. Precipitation on the windward side of this valley has been observed to be significantly higher during strong winter storms. Because strong winter storms are often accompanied by brisk northerly winds, the windward enhanced precipitation often occurs along the southern rim region including high impact areas of the Texas Panhandle such as along Interstate 40 and greater Amarillo.
This report will serve as a means of documenting this phenomenon which has been observed by forecasters in the Panhandle for many years, and to offer suggestions on ways forecasters can apply these observations to future forecasts. 2.0 Physical Processes
To understand the physical processes which lead to enhanced precipitation in certain parts of the Texas Panhandle, a basic knowledge of the geography of the region must be obtained. Although popular culture often views this region as flat and featureless, in reality the terrain is much more dramatic (see topographic map Figure 1). In fact, low level upslope and downslope winds are a dominant factor in the weather for the area.
The Ogallala formation encompasses much of what is commonly referred to as the “High Plains.” This formation stretches from Wyoming southward to the Pecos River in Texas and is characterized by terrain which gradually slopes upward to the west towards the Rocky Mountains. This slope is a significant factor in several phenomena including the dryline, upslope fog and precipitation, and downslope wind events.
The Llano Estacado is a smaller scale formation within the Ogallala and it encompasses much of West Texas and Eastern New Mexico. The region was first given its name by Francisco Coronado in 1541 while exploring along the Canadian River. The name is Spanish for “palisaded plains” and refers to the dramatic drop in elevation along the edge of the formation, though the plains above are generally flat.
2 Canadian River Valley Chris A. Kimble
The Llano Estacado is bordered on the east by the Caprock Escarpment, an area of rugged terrain which quickly drops several hundred feet to the rolling plains to the east.
The northern boundary of the Llano Estacado is the Canadian River Valley. The Canadian River flows generally west to east across the west‐central Texas Panhandle and has cut a broad, deep valley as much as 1000 feet below the surrounding plains. The river turns northeastward near Lake Meridith several miles north of Amarillo. Although the valley continues to be a distinct feature of the topography, the elevation difference is not as dramatic with eastward extent and blends in with the lower rolling plains near the Oklahoma border. 2.1 Valley Rain Shadow
The Canadian River Valley can cause many of the same weather features that can be expected along a mountain range. But with the Canadian River Valley, the high plains act as mountain ridges on either side of this broad valley. It would be expected that with an inter‐mountain valley, precipitation at the valley floor will be less than that at the peaks of the mountains in many weather situations. And although the Canadian River Valley is not sandwiched between mountain ranges and is only 800 to 1000 feet deep, it is a valley nonetheless and would be expected to also lead to lower precipitation at the valley floor under certain circumstances.
As winds cross over a mountain ridge and into a lee side valley, the air descends into the valley causing adiabatic warming and drying of the air. This leads to evaporation of clouds and precipitation and is the meteorological reasoning for the effect commonly known as a “rain shadow.” The similar rain shadow occurs with surface winds which flow across the Canadian River Valley. The air descends into the valley, leading to the evaporation of clouds and precipitation. This effect is most dramatic in the cold season when surface winds are both stronger and more often out of the north during winter storms which provide the majority of the cold season precipitation events.
The extent to which this effect will be realized depends on several factors. Strong cross‐valley surface winds will lead to a more dramatic effect than light winds. With nearly calm winds the downsloping component would be much less significant.
Another factor which can impact how dramatic the rain shadow effect will be is the height of the cloud layer which is forming the majority of the precipitation. If precipitation is falling through a large vertical column of moist air, heavier precipitation would be expected overall. The total precipitation then observed in the valley may be only slightly less than what is observed on the high plains. If the forcing is primarily near the surface or perhaps even entirely terrain induced, then light precipitation may fall on the high plains while virtually no precipitation falls in the valley as it would only take a slight downsloping component to evaporate the already minimal amount of precipitation.
Temperature may also play a role in some winter storms which demonstrate this effect. Under downsloping conditions, temperatures in the valley would be warmer than on the high plains. Temperatures will be 3 to 6 degrees warmer in the valley depending on whether the moist (heavy precipitation and saturated air mass) or dry adiabat (light precipitation and dry air mass) is used. If temperatures on the high plains are near freezing, this may cause the precipitation type to change from snow on the high plains to rain in the valley. It may also remain as snow in the valley, but due to the warmer temperatures the snow will melt rather than accumulate.
3 Canadian River Valley Chris A. Kimble
Although the existence of a rain shadow in a valley as deep as the Canadian River Valley is not a novel idea, it is a factor that is routinely overlooked in forecasting and often leads to a dramatic over‐forecast of precipitation in this valley. The effect is noticeable in most winter storms in the Texas Panhandle due to the strong northerly winds which often accompany winter storms in this region. 2.2 Enhanced Downwind Precipitation
As would be expected with moist air flowing over a mountain range, precipitation will be enhanced along the windward slope of any substantial ridge. The North and South rims of the Canadian River Valley act as mountain ridges during winter precipitation events. With northerly winds, the northern slope and the valley will be in the “rain shadow” while the southern slope and rim will see the enhanced precipitation associated with air flowing up the terrain and back onto the high plains.
The elevation of the plains to the north of the valley is almost identical to that of the plains to the south. Because of this, it could be theorized that under ideal conditions air would descend dry adiabatically down the valley and cool dry adiabatically back to the same temperature and dewpoint as it rises up the southern slope, not yielding any terrain enhanced precipitation. But this would be an idealized situation which neglects an important factor: precipitation. As precipitation falls across the entire region from a synoptic storm system, the air which flows down into the valley would not warm dry adiabatically. The evaporation from the precipitation in the valley would lead to cooling, and the actual warming could be much less and even near the moist adiabatic lapse rate. This evaporation adds moisture to the air in the valley which must then condense again as it rises up the southern slope onto the plains of the Llano Estacado. Essentially the precipitation which evaporates in the valley falls on the southern slope.
Precipitation would also be enhanced downstream from the southern rim of the Canadian River Valley. Because air is moving up the slope, it continues moving slantwise upward even after the terrain levels out again. This causes air to continue to rise and condense, generating enhanced precipitation on the flat terrain of the northern Llano Estacado. The rising air would gradually level out with time as the synoptic forcing becomes more dominant. Another factor which causes enhanced snowfall downwind from the slope is the wind itself. Due to the low terminal velocity of snowflakes, snow which falls from the clouds in one location may be blown several miles downwind before reaching the ground and accumulating. 3.0 Observed Events
The enhanced snowfall on the southern rim of the Canadian River Valley has been observed by local forecasters for several years, and this effect has been noticeable in a large majority of winter storms which impact this area. The effect is very often evident in the snow cover viewed on visible satellite after winter weather events, even events which brought less than an inch of total snowfall. The effect is noticeable in the final snowfall total reports primarily on the more significant winter storms which drop heavy snow over a period of many hours or a few days. A few significant winter storms from the past have been selected for detailed analysis in this report, although there are many other storms which demonstrate the effects of the Canadian River Valley on area snowfall than what are presented here.
4 Canadian River Valley Chris A. Kimble
3.1 March 26‐28, 2009
The March 2009 Blizzard was one of the most significant late season winter storms ever to occur in the Texas Panhandle. As often is the case in spring storms, abundant moisture existed ahead of the system. Dewpoint temperatures were in the 50s and 60s across central Texas, with 40s across the Texas Panhandle. The strong mid‐level low pressure dropped southward through the Rockies and then turned eastward through West Texas south of the Texas Panhandle, allowing the system to take advantage of the abundant moisture.
As diffluence ahead of the system began to bring clouds and light precipitation to parts of the area, a strong cold front pushed southward through the High Plains. Temperatures dropped sharply into the 20s behind the front. Thunderstorms producing small hail developed in some locations ahead of the front, with thundersnow occurring also as temperatures dropped. Precipitation across the Canadian River Valley was initially light outside of convective activity. The cold front passed through Vega by 03Z on March 27 and Amarillo by 06Z with light snow beginning as the front moved through. Figure 1 on Page 1 provides a reference map of the terrain and cities of the Texas Panhandle.
The center of the 500mb low pressure passed near Plainview, TX by 00Z on March 28. The heavy snow did not arrive in the vicinity of the Canadian River Valley until the late morning and into the evening of March 27 as the low tracked just south of the area. By this time temperatures had fallen into the upper 10s and low 20s, with winds out of the North at 25 to 35 knots and gusting over 50 knots. Through the early morning hours of March 28, the heaviest snow shifted east and northeast with a band of 12 to 24 inches of snow falling from Amarillo to Pampa to Lipscomb. New all time 24‐hour snowfall records were set for the states of Texas and Oklahoma as more than two feet of snow fell in some locations.
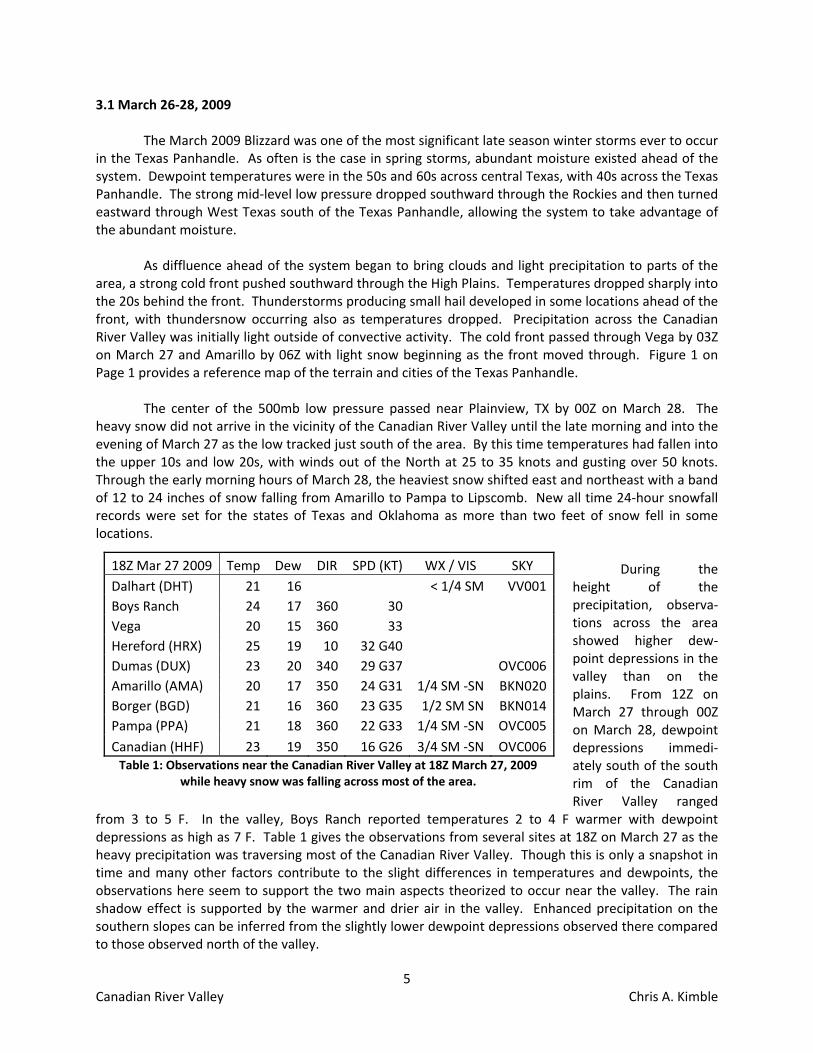
18Z Mar 27 2009 Temp Dew DIR SPD (KT) WX / VIS SKY Dalhart (DHT) 21 16 < 1/4 SM VV001Boys Ranch 24 17 360 30 Vega 20 15 360 33 Hereford (HRX) 25 19 10 32 G40 Dumas (DUX) 23 20 340 29 G37 OVC006Amarillo (AMA) 20 17 350 24 G31 1/4 SM ‐SN BKN020Borger (BGD) 21 16 360 23 G35 1/2 SM SN BKN014Pampa (PPA) 21 18 360 22 G33 1/4 SM ‐SN OVC005Canadian (HHF) 23 19 350 16 G26 3/4 SM ‐SN OVC006Table 1: Observations near the Canadian River Valley at 18Z March 27, 2009
while heavy snow was falling across most of the area.
During the height of the precipitation, observa‐tions across the area showed higher dew‐point depressions in the valley than on the plains. From 12Z on March 27 through 00Z on March 28, dewpoint depressions immedi‐ately south of the south rim of the Canadian River Valley ranged
from 3 to 5 F. In the valley, Boys Ranch reported temperatures 2 to 4 F warmer with dewpoint depressions as high as 7 F. Table 1 gives the observations from several sites at 18Z on March 27 as the heavy precipitation was traversing most of the Canadian River Valley. Though this is only a snapshot in time and many other factors contribute to the slight differences in temperatures and dewpoints, the observations here seem to support the two main aspects theorized to occur near the valley. The rain shadow effect is supported by the warmer and drier air in the valley. Enhanced precipitation on the southern slopes can be inferred from the slightly lower dewpoint depressions observed there compared to those observed north of the valley.
5 Canadian River Valley Chris A. Kimble
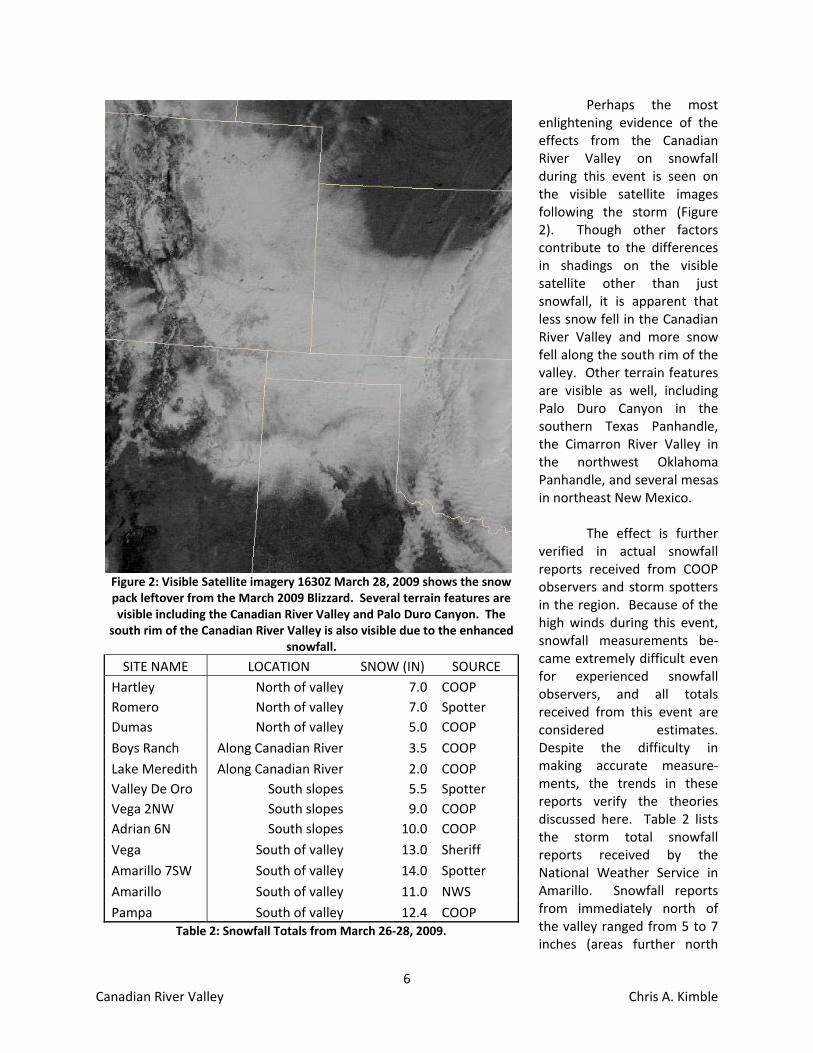
Perhaps the most enlightening evidence of the effects from the Canadian River Valley on snowfall during this event is seen on the visible satellite images following the storm (Figure 2). Though other factors contribute to the differences in shadings on the visible satellite other than just snowfall, it is apparent that less snow fell in the Canadian River Valley and more snow fell along the south rim of the valley. Other terrain features are visible as well, including Palo Duro Canyon in the southern Texas Panhandle, the Cimarron River Valley in the northwest Oklahoma Panhandle, and several mesas in northeast New Mexico.
The effect is further verified in actual snowfall reports received from COOP observers and storm spotters in the region. Because of the high winds during this event, snowfall measurements be‐came extremely difficult even for experienced snowfall observers, and all totals received from this event are considered estimates. Despite the difficulty in making accurate measure‐ments, the trends in these reports verify the theories discussed here. Table 2 lists the storm total snowfall reports received by the National Weather Service in Amarillo. Snowfall reports from immediately north of the valley ranged from 5 to 7 inches (areas further north
Figure 2: Visible Satellite imagery 1630Z March 28, 2009 shows the snow pack leftover from the March 2009 Blizzard. Several terrain features are visible including the Canadian River Valley and Palo Duro Canyon. The
south rim of the Canadian River Valley is also visible due to the enhanced snowfall.
SITE NAME LOCATION SNOW (IN) SOURCE Hartley North of valley 7.0 COOP Romero North of valley 7.0 Spotter Dumas North of valley 5.0 COOP
Boys Ranch Along Canadian River 3.5 COOP Lake Meredith Along Canadian River 2.0 COOP Valley De Oro South slopes 5.5 Spotter Vega 2NW South slopes 9.0 COOP Adrian 6N South slopes 10.0 COOP
Vega South of valley 13.0 Sheriff Amarillo 7SW South of valley 14.0 Spotter
Amarillo South of valley 11.0 NWS Pampa South of valley 12.4 COOP
Table 2: Snowfall Totals from March 26‐28, 2009.
6 Canadian River Valley Chris A. Kimble
including Dalhart and the Oklahoma Panhandle received more than 12 inches). Snowfall in the valley ranged from 2 to 4 inches. Immediately to the south of the valley, snowfall ranged from 9 to 14 inches including in the cities of Vega, Amarillo, and Pampa.
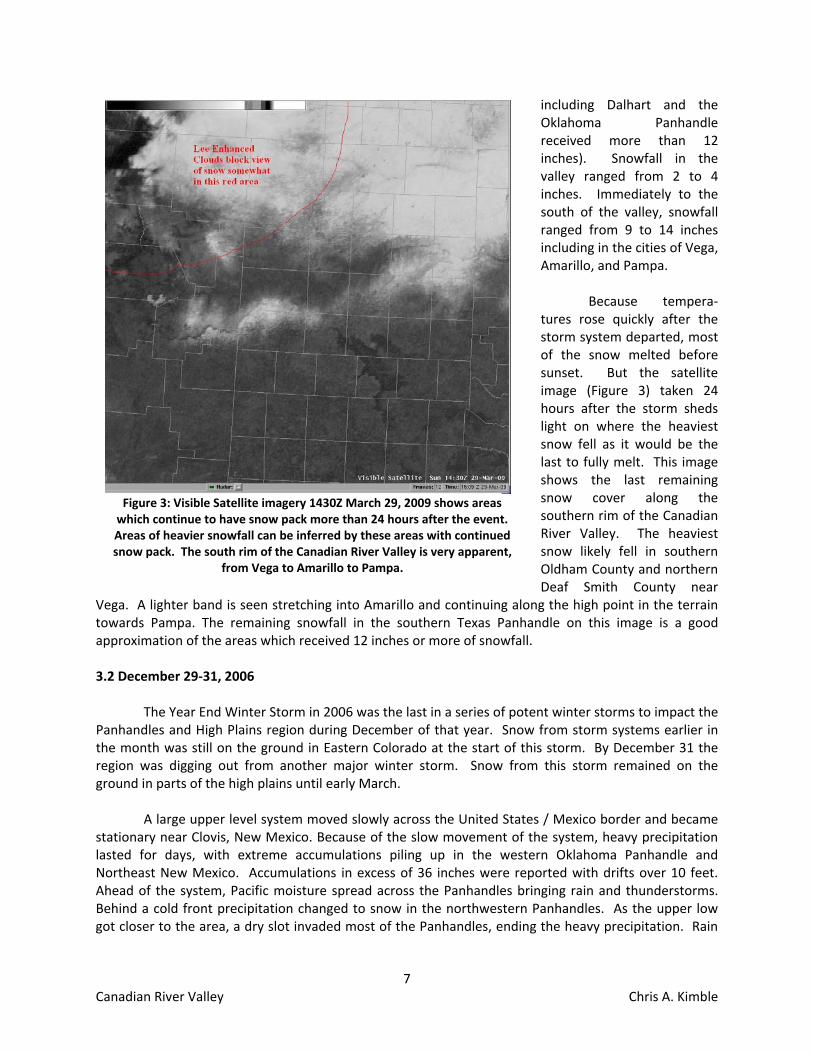
Figure 3: Visible Satellite imagery 1430Z March 29, 2009 shows areas which continue to have snow pack more than 24 hours after the event. Areas of heavier snowfall can be inferred by these areas with continued snow pack. The south rim of the Canadian River Valley is very apparent,
from Vega to Amarillo to Pampa.
Because tempera‐
tures rose quickly after the storm system departed, most of the snow melted before sunset. But the satellite image (Figure 3) taken 24 hours after the storm sheds light on where the heaviest snow fell as it would be the last to fully melt. This image shows the last remaining snow cover along the southern rim of the Canadian River Valley. The heaviest snow likely fell in southern Oldham County and northern Deaf Smith County near
Vega. A lighter band is seen stretching into Amarillo and continuing along the high point in the terrain towards Pampa. The remaining snowfall in the southern Texas Panhandle on this image is a good approximation of the areas which received 12 inches or more of snowfall. 3.2 December 29‐31, 2006
The Year End Winter Storm in 2006 was the last in a series of potent winter storms to impact the Panhandles and High Plains region during December of that year. Snow from storm systems earlier in the month was still on the ground in Eastern Colorado at the start of this storm. By December 31 the region was digging out from another major winter storm. Snow from this storm remained on the ground in parts of the high plains until early March.
A large upper level system moved slowly across the United States / Mexico border and became stationary near Clovis, New Mexico. Because of the slow movement of the system, heavy precipitation lasted for days, with extreme accumulations piling up in the western Oklahoma Panhandle and Northeast New Mexico. Accumulations in excess of 36 inches were reported with drifts over 10 feet. Ahead of the system, Pacific moisture spread across the Panhandles bringing rain and thunderstorms. Behind a cold front precipitation changed to snow in the northwestern Panhandles. As the upper low got closer to the area, a dry slot invaded most of the Panhandles, ending the heavy precipitation. Rain
7 Canadian River Valley Chris A. Kimble
and freezing drizzle occurred in some areas, with snow continuing in the northwest where deeper moisture remained in place.
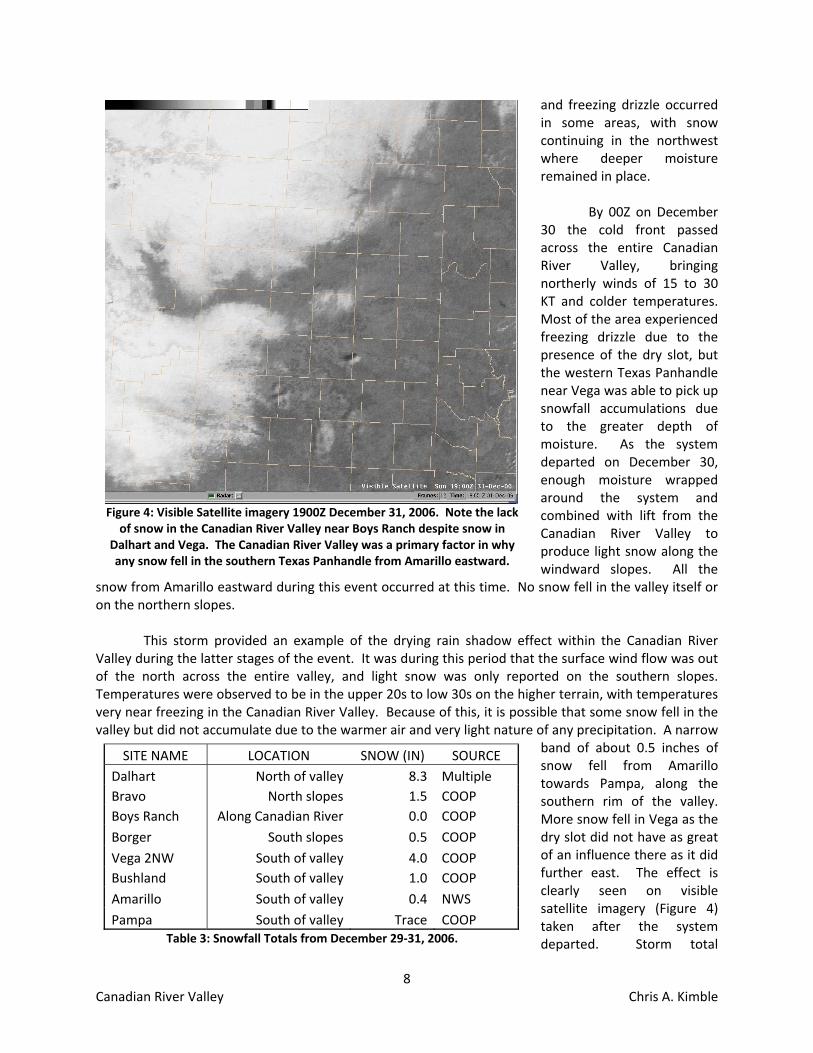
Figure 4: Visible Satellite imagery 1900Z December 31, 2006. Note the lack of snow in the Canadian River Valley near Boys Ranch despite snow in
Dalhart and Vega. The Canadian River Valley was a primary factor in why any snow fell in the southern Texas Panhandle from Amarillo eastward.
By 00Z on December 30 the cold front passed across the entire Canadian River Valley, bringing northerly winds of 15 to 30 KT and colder temperatures. Most of the area experienced freezing drizzle due to the presence of the dry slot, but the western Texas Panhandle near Vega was able to pick up snowfall accumulations due to the greater depth of moisture. As the system departed on December 30, enough moisture wrapped around the system and combined with lift from the Canadian River Valley to produce light snow along the windward slopes. All the
snow from Amarillo eastward during this event occurred at this time. No snow fell in the valley itself or on the northern slopes.
SITE NAME LOCATION SNOW (IN) SOURCE Dalhart North of valley 8.3 Multiple Bravo North slopes 1.5 COOP Boys Ranch Along Canadian River 0.0 COOP
Borger South slopes 0.5 COOP Vega 2NW South of valley 4.0 COOP Bushland South of valley 1.0 COOP
Amarillo South of valley 0.4 NWS Pampa South of valley Trace COOP
Table 3: Snowfall Totals from December 29‐31, 2006.
This storm provided an example of the drying rain shadow effect within the Canadian River Valley during the latter stages of the event. It was during this period that the surface wind flow was out of the north across the entire valley, and light snow was only reported on the southern slopes. Temperatures were observed to be in the upper 20s to low 30s on the higher terrain, with temperatures very near freezing in the Canadian River Valley. Because of this, it is possible that some snow fell in the valley but did not accumulate due to the warmer air and very light nature of any precipitation. A narrow
band of about 0.5 inches of snow fell from Amarillo towards Pampa, along the southern rim of the valley. More snow fell in Vega as the dry slot did not have as great of an influence there as it did further east. The effect is clearly seen on visible satellite imagery (Figure 4) taken after the system departed. Storm total
8 Canadian River Valley Chris A. Kimble
snowfall observations (Table 3) taken from NWS, COOP Observers, and Storm Spotters also confirm that outside of the northwestern Panhandles, the only areas to receive snowfall were along the southern slopes or south rim of the Canadian River Valley. 4.0 Observed Non‐Events
Although the majority of winter storms in the Texas Panhandle are impacted by the Canadian River Valley, some storms are not. In most cases where the Canadian River Valley does not have an impact on snowfall accumulation, wind speeds are light and out of a direction other than the north. It is rare to have a significant winter storm impact the area without bringing strong northerly winds, but it can occur. One such case is documented in this section. 4.1 January 19‐20, 2007
A few weeks after the Year End Winter Storm in 2006, another significant snowfall occurred across the entire Texas and Oklahoma Panhandles region including the Canadian River Valley. Snow from the previous winter storm still remained on the ground in Colorado and Kansas as well as northeast New Mexico and the western Oklahoma Panhandle. But what distinguished the January 20 heavy snowfall was the absence of a strong northerly wind.
Initially on the evening of January 19 high pressure was centered over the Colorado and Kansas state line in the general vicinity of the remaining snowpack from the Year End Winter Storm in 2006. The surface cold front had pushed well south into Texas while the main 500mb low tracked across northern Mexico and southern Arizona. Moisture streamed northeastward from the Pacific Ocean into the western Great Plains. Temperatures were in the mid 30s but dewpoints were primarily in the teens across the Texas Panhandle by 00Z January 20. Precipitation began as light rain or freezing rain by 03Z across the Canadian River Valley as temperatures continued to cool with evaporation from the precipitation. Winds were light generally from the southeast through the entire night. In fact, all observations across the Canadian River Valley remained below 10 knots from 03Z to 15Z. With evaporative cooling and moistening of the atmosphere from the top down, precipitation changed to snow and accumulated primarily during the overnight and morning hours. The accumulations were almost over when winds finally increased to a mere 10 to 15 knots out of the southeast by 18Z. All snow had ended across the region by around 00Z January 21 as the 500mb low tracked northeast across west Texas.
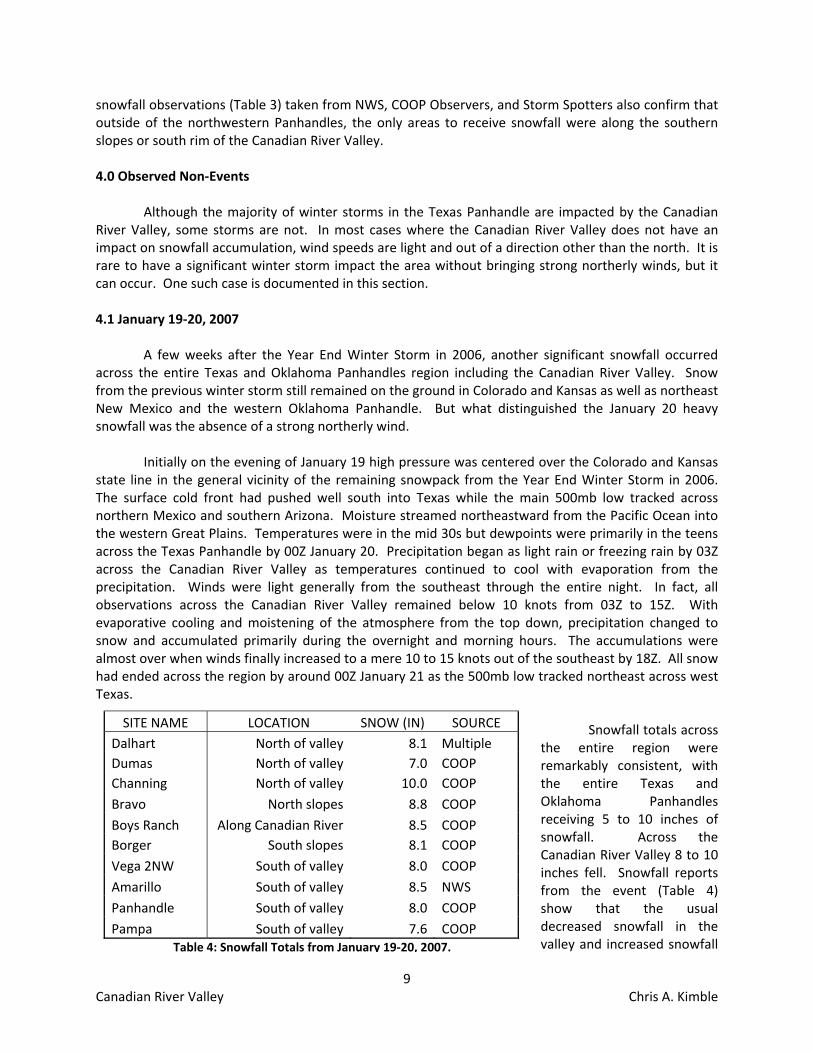
SITE NAME LOCATION SNOW (IN) SOURCE Snowfall totals across
the entire region were remarkably consistent, with the entire Texas and Oklahoma Panhandles receiving 5 to 10 inches of snowfall. Across the Canadian River Valley 8 to 10 inches fell. Snowfall reports from the event (Table 4) show that the usual decreased snowfall in the valley and increased snowfall
Dalhart North of valley 8.1 Multiple Dumas North of valley 7.0 COOP Channing North of valley 10.0 COOP Bravo North slopes 8.8 COOP
Boys Ranch Along Canadian River 8.5 COOP Borger South slopes 8.1 COOP Vega 2NW South of valley 8.0 COOP
Amarillo South of valley 8.5 NWS Panhandle South of valley 8.0 COOP
Pampa South of valley 7.6 COOP Table 4: Snowfall Totals from January 19‐20, 2007.
9 Canadian River Valley Chris A. Kimble
on the southern rim is not apparent. The reason for this notable absence is that there were not strong cross valley winds during the snow event. Winds were less than 10 knots during a large part of the event. And when winds finally increased to 10 to 15 knots toward the end of the event they were out of the southeast which is opposite to the usual flow during winter storms in the region. Due to the lighter winds, the primary forcing for the snowfall was with the synoptic system rather than with low level terrain influences.
It can be argued that there still was a slight enhancement on the upwind side of the valley (in this case the north side). Population is sparse both in the valley and on the northern rim of the valley, and thus snowfall observations were hard to come by. One observation came in from the town of Channing of 10.0 inches. This is the largest reported snowfall amount in the area for this storm. Channing lies directly at the north rim of the Canadian River Valley, and is the only observation received from the north rim area. The Bravo ranch, located on the northern slopes of the valley reported 8.8 inches of snow, with Boys Ranch at the bottom of the valley reporting slightly less: 8.5 inches. This shows a gradual progression of slightly heavier snowfall along the northern slope and culminating at the north rim. More observations would be needed to distinguish this from standard error due to varying snowfall observation techniques. But the trend represented in the available data does seem to support a slight enhancement on the north side of the river valley, the reverse of what is normally observed. The difference in snowfall from Boys Ranch to Channing was only 1.5 inches (15%). If winds were stronger out of the south, it is likely that the variation would be much more significant and much more apparent (provided southerly winds did not bring warm air and a change in precipitation type). In general for this event, the winds remained 10 knots or less during the majority of the accumulations. 5.0 Forecast Improvements
Forecasters in the Texas Panhandle have long been aware of general rules of thumb for using terrain in forecasting. The principles of upsloping winds being cool and moist and downsloping winds being warm and dry can be applied on more than just a broad scale. The terrain variations are much more complex than the generalized west to east drop in elevation. The Canadian River Valley has a significant effect on the weather in situations where low level winds are strong. Other terrain features that are not as dramatic also have similar effects on a lesser scale.
It is possible for the vertical velocity associated with air rising up the slope of the valley to be greater than the vertical velocity generated from synoptic forcing alone. The vertical velocity generated by cross valley winds can be determined by the following equation:
w = v∆z / ∆x
In this equation, w is the vertical velocity, v is the cross‐valley component of the wind speed, ∆z
is the elevation change from the valley floor to the rim, and ∆x is the horizontal width of the valley. Using the values ∆z = 300m and ∆x = 40km for an idealized valley slope, the horizontal wind needed to generate a vertical velocity equal to 6 cm/s (sufficient for precipitation) is approximately 15KT. This means that with a surface cross‐valley wind of greater than 15KT, the primary forcing for upward vertical motion in the low levels would be the cross‐valley flow itself rather than the synoptic scale lift. This 15KT criterion could be used as an approximation for when the Canadian River Valley begins to generate a noticeable effect on precipitation. Under stronger synoptic forcing, stronger surface winds would be needed. But strong synoptic forcing rarely lasts for more than a few hours. Weaker forcing
10 Canadian River Valley Chris A. Kimble
often dominates for several hours during a snow event, allowing the Canadian River Valley to have a significant effect for a long period of time, generating greater storm total snowfall variations.
In some situations it has been observed that the Canadian River Valley serves as a starting point for snowfall accumulations. This is meant to say that when surface cross valley wind flow is strong, and the synoptically induced snow/no snow line would naturally fall in the vicinity of the Canadian River Valley, the observed snow/no snow line will be along the upwind slope. This has been observed in a few cases where accumulating snow fell along the south rim of the Canadian River Valley and southward, with the snow line following the twists and turns of the valley. This has also been observed on the Arkansas River Valley in western Kansas. This can be a useful point to consider in forecasting which areas will see snow at all.
The simplest way to describe the forecasting take away points from this report is to always be
knowledgeable of the terrain, and factor into all forecasts any impact that the terrain would have. This includes more than just high impact forecasts like snowfall, but also temperature, dewpoint, ceilings, and precipitation type and intensity.
For the sake of snowfall forecasting, it is strongly encouraged that forecasters consider the Canadian River Valley in every forecast, and apply any adjustments as appropriate. When cross valley winds are strong (generally > 15KT), decrease snowfall in the valley and increase snowfall proportionally on the downwind side. The stronger the winds, the greater the effect becomes apparent. When winds are light, synoptic forcing will dominate and the effect may not be apparent.
Forecasters often find flow charts useful in applying meteorological rules of thumb to everyday hazard forecasting. To facilitate this, a flow chart is available in Appendix A. This chart should be considered as rough guidance for use in winter forecasting using effects from the Canadian River Valley.
Using the Canadian River Valley as a forecasting tool is especially important considering the high impact areas that are most often affected. If forecast snowfall amounts can be improved along Interstate 40 and near the cities of Amarillo and Pampa, the public will be better prepared for hazardous (and non‐hazardous) snowfall events. Depicting this effect in graphical forecasts and explicitly mentioning the areas of greater or lesser snowfall in conference calls with local decision makers will better enable local officials to deploy resources where they are most needed. For example, if the Potter or Oldham County officials know ahead of time that more snow is expected to fall along I‐40 than in the Canadian River Valley in the northern part of their counties, they will be able to focus more plow units and emergency vehicles in the area that sees the most impact.
Similar effects have been noted in post storm satellite imagery in and near Palo Duro Canyon, the Cimarron River Valley (near Kenton, OK), the Caprock Escarpment (Briscoe and Floyd Counties in Texas), the Arkansas River Valley (western Kansas and Colorado), and several mesas and ridges in northeast New Mexico. All locations in the high plains which have even minor terrain features could benefit from applying these principles to forecasting. 6.0 Conclusions
The Canadian River Valley is a significant terrain feature to consider in weather forecasting in the Texas Panhandle. The principles behind the effects this valley would have are not novel, but should be applied in daily forecasts even in the Texas Panhandle.
11 Canadian River Valley Chris A. Kimble
When strong, moist, cross‐valley winds are forecast, it can be expected that a rain shadow will occur in the Canadian River Valley itself. On the downwind slope, precipitation will be enhanced due to the increased vertical velocity generated by the terrain. A general observation is that wind speeds of 15KT or greater are needed for a noticeable effect to be observed. However, this speed criterion may vary depending on specific conditions.
This report has documented two cases where the Canadian River Valley had a noticeable effect on precipitation totals, and one null case where the effects were not significant. Although only two supporting cases were used in this report, many other cases are also available for study and documentation. In a typical winter, the Canadian River Valley will have an observed effect on precipitation patterns on several occasions.
There are many opportunities for future research to be conducted by other interested parties. Actual real‐time documentation of the Canadian River Valley having an effect on precipitation would be useful in demonstrating the effect and promoting its use in local forecasting. This would require significant pre‐storm planning and would require several trained snowfall observers stationed in strategic points across the valley. More detailed research from a more extensive database of archived snow events could also generate more specific and useful correlations between cross‐valley wind speed and snowfall variations. This correlation would be very helpful to forecasters in determining a quantitative snowfall forecast value for the valley and areas downwind. In addition, it has been theorized that the Canadian River Valley may have an impact on thunderstorm development, maturation, decay, and even tornado‐genesis. This is another topic that would make an excellent case for future study. 7.0 Acknowledgments
Special thanks go to many forecasters on the staff at WFO Amarillo for assistance in recognizing this effect and providing assistance in preparing this report. Thanks also go to David Hennig ‐ WFO Midland, Jason Jordan ‐ WFO Lubbock, and Richard Wynne – SOO WFO Amarillo for technical assistance and guidance during the entire process. Also, Dan St. Jean – SOO WFO Gray, Maine provided valuable guidance during the review process. 8. Resources Used Anonymous, 2009: Llano Estacado. Wikipedia. http://en.wikipedia.org/wiki/Llano_estacado. Colton, D. E., 1976: Numerical Simulation of Orographically Induced Precipitation Distribution for Use in Hydrologic Analysis. Journal of Applied Meteorology. Vol 15, Num 12, 1241‐1251. Elliot, R. D., and R.W. Shaffer, 1962: The Development of Quantitative Relationships between Orographic Precipitation and Air‐Mass Parameters for Use in Forecasting and Cloud Seeding Evaluation. Journal of Applied Meteorology, Vol 1, 218‐228. Fulks, J.R., 1935: Rate of Precipitation from Adiabatically Ascending Air. Monthly Weather Review, Vol 63, Num 10, 291‐294. KVII School NET, 2009: Real‐time temperature, dewpoint, and wind data from local observing platforms. KVII Amarillo. http://www.connectamarillo.com
12 Canadian River Valley Chris A. Kimble
Thompson, J.C. and G.O. Collins, 1953: A Generalized Study of Precipitation Forecasting Part 1: Computation of Precipitation from the Fields of Moisture and Wind. Monthly Weather Review. Vol 81, Num 4, 91‐100. Thompson, J.C., 1956: Quantitative Precipitation Forecasting. Weather Analysis and Forecasting Volume II. Petterssen, S. McGraw‐Hill Book Company.
13 Canadian River Valley Chris A. Kimble
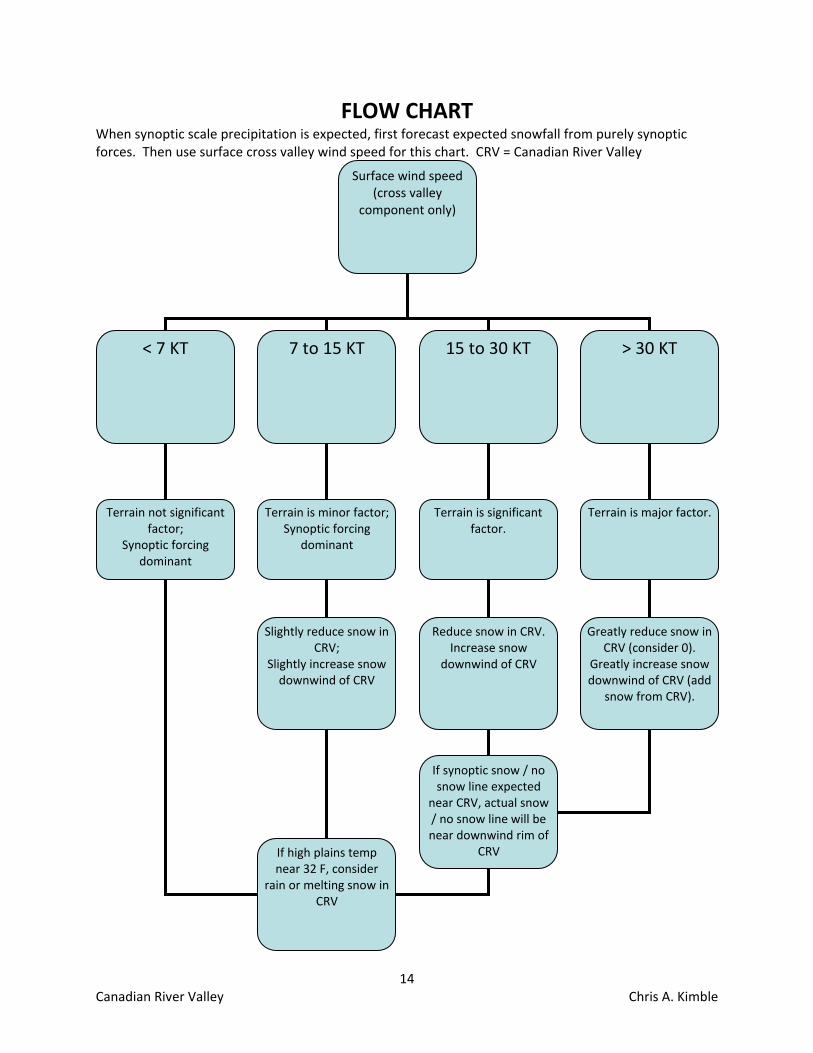
FLOW CHART When synoptic scale precipitation is expected, first forecast expected snowfall from purely synoptic forces. Then use surface cross valley wind speed for this chart. CRV = Canadian River Valley
Surface wind speed(cross valley
component only)
< 7 KT 7 to 15 KT 15 to 30 KT
14 Canadian River Valley Chris A. Kimble
Terrain not significant factor;
Synoptic forcing dominant
Terrain is minor factor;Synoptic forcing
dominant
Slightly reduce snow in CRV;
Slightly increase snow downwind of CRV
Terrain is significant factor.
If high plains temp near 32 F, consider
rain or melting snow in CRV
Reduce snow in CRV. Increase snow
downwind of CRV
> 30 KT
Terrain is major factor.
Greatly reduce snow in CRV (consider 0).
Greatly increase snow downwind of CRV (add
snow from CRV).
If synoptic snow / no snow line expected
near CRV, actual snow / no snow line will be near downwind rim of
CRV