research on increased winter orographic precipitation by
TRANSCRIPT
Utah State UniversityDigitalCommons@USU
Reports Utah Water Research Laboratory
January 1980
Research on Increased Winter OrographicPrecipitation by Cloud Seeding (FY 1980)Geoffrey E. Hill
Follow this and additional works at: https://digitalcommons.usu.edu/water_rep
Part of the Civil and Environmental Engineering Commons, and the Water ResourceManagement Commons
This Report is brought to you for free and open access by the Utah WaterResearch Laboratory at DigitalCommons@USU. It has been accepted forinclusion in Reports by an authorized administrator ofDigitalCommons@USU. For more information, please [email protected].
Recommended CitationHill, Geoffrey E., "Research on Increased Winter Orographic Precipitation by Cloud Seeding (FY 1980)" (1980). Reports. Paper 421.https://digitalcommons.usu.edu/water_rep/421
RESEARCH ON INCREASED WINTER OROGRAPHIC PRECIPITATION BY CLOUD SEEDING (FY 1980)
DEVELOPMENT OF CLOUD LIQUID WATER INSTRUMENTATION
AND APPLICATION TO CLOOD SEEDING TECHNOLOGY
FINAL REPORT
Cooperative Agreement No. 80-5052
July 1979 - June 1980
for the
Division of Water Resources Empire Building, Suite 300
231 East 400 South Salt Lake City, Utah 84111
by
Geoffrey E.Hill
December, 1980
UWRL/A-80/01
Utah Water Research Laboratory Utah State University
Logan, Utah 84322

ABSTRACT
This research continues the development of new instru
mentation relevant to the advancement of cloud seeding
technology and the analysis of data collected to better
understand cloud seeding potential in winter orographic
clouds. Instrumentation development included the start of
construction of a NOAA type dual frequency radiometer for the
continuous measurement of supercooled liquid water and the
completion of an expendable balloon-borne system for mea
suring vertical profiles of supercooled liquid water.
The analysis of data collected on the project was
directed primarily at the interpretation of the vertical
profiles of supercooled liquid water and vertical motion.
Results indicate that sharp vertical gradients of supercooled
liquid water often exist in winter orographic clouds. The
relationships between measured supercooled liquid water
and other variables strongly support previous findings that
the precipitation augmentation potential of winter orographic
clouds is substantial when the cloud top temperature is -22°C
or warmer and the cross-barrier wind speed (at mountaintop
levels) is 8 m s-l or greater.
iii

ACKNOWLEDGMENTS
Appreciation is expressed to the University of North
Dakota for making several cloud physics flights during
periods of other measurements. Appreciation is also expressed
for the contributions and participation of the following
individuals: Duard Woffinden, electronics engineer; Brad
Miller, meteorologist; Martin Miller, meteorologist; and VerI
Bindrup, field technician. Section 3.1.2 of this report was
written with the assistance of Mr. Woffinden.
v

ABSTRACT
ACKNOWLEDGMENTS
LIST OF FIGURES
LIST OF TABLES
1 0 0 INTRODUCTION
TABLE OF CONTENTS
1.1 Recent exploratory research at UWRL . 1.2 Present directions in research at UWRL
2.0 SUMMARY OF RESEARCH OBJECTIVES AND FINDINGS
Page
iii
v
ix
xi
1
1 2
5
2.1 Cloudsonde instrument development. 5 2.2 Radiometer instrument development. . .. 6 2.3 Comparison of J-W and Rosemount supercooled
liquid water measurements . . . . 6 2.4 Cloud seeding opportunity recognition 8
3.0 DEVELOPMENT OF EQUIPMENT
3.1 Cloudsonde instrument
3.101 3.1.2 3.1.3
Concept. . . . . . . Mechanical/electronic design . Application
3Q2 Radiometer instrument.
4.0 DATA ACQUISITION AND OPERATIONS .
4.1 Precipitation ...... . 4.2 Airborne cloud physics measurements . 4.3 Upper level soundings.
5.0 DEVELOPMENT OF CLOUD SEEDING TECHNOLOGY
501 Airborne measurements of supercooled liquid water.
5.1.1 Comparison of J-W and RLW measurement
11
11
11 14 18
21
25
25 28 28
31
31
of supercooled liquid water . 31 5.1.2 Evaluation of the instruments. 35
vii
TABLE OF CONTENTS (CONTINUED)
5.2 Cloudsonde measurements.
5.2.1 Standard measurements. 5.2.2 Vertical profiles of supercooled
liquid water .
5.3 Analysis of seedability
5.3.1 Cloud modification potential. . 5.3.2 Data for preliminary verification
of hypothesis. 5.3.3 Analysis of icing data . . 5.3.4 Results of preliminary test of
seedability criteria 5.3.5 Analysis of seedability by use of
cloudsonde data . 5.3.6 Summary of seedability analysis
6.0 CONCLUSIONS AND RECOMMENDATIONS
6.1 Conclusions 6.2 Recommendations
REFERENCES
viii
Page
37
37
37
42
42
45 48
52
62 66
69
69 69
71
LIST OF FIGURES
Figure
Illustration of ice-loaded wire 1
2 Block diagram of modified rawinsonde for measurement of SLWC
3 Block diagram of modified rawinsonde receiver f'or obtaining SLWC data .
4 Skew-T diagram of temperature and dew for February 7, 1980 at 1710 MST .
5 Radiometer outside reflector
6 Radiometer power supply .
7 Radiometer antenna and electronics
8 Radiometer power supply, antenna and electronics .
9 Precipitation network, FY80
point
10 Sample liquid water raw data for JohnsonWilliams vs Rosemount devices with moderate
Page
12
15
17
19
23
23
24
24
26
concentration of liquid water . 27
11 Same as Fig. 10, except for heavy concentration of liquid water 32
12 Sample output of Rosemount device in and out of cloud . 34
13 Liquid water concentrations measured by Johnson-Williams and Ros·emount devices for 6 events in FY78 and 79 . 36
14 Skew-T diagram of temperature and dew point for March 12, 1980, 1140 MST 38
15 Vertical profile of supercooled liquid water for March 12, 1980, 1140 MST 39
16 Seedability ratios for available FY78 and 79 airborne and ground based data. 44
17 Chart of icing reports 1400-2000 MST 6 Feb., 1979 47
ix
Figure
18
19
20
21
22
23
24
25
26
LIST OF FIGURES (CONTINUED)
Six-hour total aircraft icing expressed in mm per 100 km according to FAA definitions versus cloud top temperature and 700 mb cross-barrier wind speed
Histogram of supercooled water parameter versus cross-barrier wind speed (700 mb level)
Histogram of supercooled water parameter versus cloud top temperature
Histograms of (average) supercooled water parameter versus cross-barrier wind speed for warm and cold cloud top temperatures.
Precipitation rate averaged over six hours at Silver Lake Brighton versus cloud top temperature and 700 mb cross-barrier wind speed .
Seedability ratios versus cloud top temperature and 700 mb cross-barrier wind speed
Supercooled liquid water (g m- 3) measured by cloudsondes (FY80) versus cloud top temperature and 2700 m (9000 ft) crossbarrier wind speed.
Precipitation rate (cm h- l ) at Smithfield Canyon versus cloud top temperature and 2700 m (9000 ft) cross-barrier wind speed
Seedability ratios versus cloud top temperature and 2700 m (9000 ft) cross-barrier wind speed
x
Page
53
54
55
57
59
60
63
64
65
Table
1
2
3
4
5
LIST OF TABLES
Change in vibration frequency versus height and time
List of events according to date and time along with parameters measured .
FY80 c1oudsonde and precipitation data
Classification of aircraft icing reports.
Tabulation of data (winter 1978-1979) for seedabi1ity verification .
xi
Page
20
29
41
48
49

1.0 INTRODUCTION
1.1 Recent exploratory research at UWRL
To obtain the kind of physical understanding believed
necessary to develop a sound as well as efficient seeding
technology, a widely based program of inquiry is underway at
UWRL. Considerable progress has been made, and our recent
progress and plans for the future are presented in this
report.
Our recent work has been directed at finding out the
detailed sequence of events resulting from the addition of
seeding material upwind of a mountain barrier during periods
of winter storms. This inquiry includes aspects of the
problem such as the transport and diffusion of seeding
material, in-cloud effects of seeding as well as the natural
distribution and climatology of supercooled water, ice
particles and their relationship to other more readily
measured parameters such as cloud top temperature. We are
interested in finding out the conditions under which super
cooled water is found. Such conditions may be related to
parameters not so easily measured, such as vertical motion,
background ice nuclei concentrations or other factors.
In addition the measurement of precipitation on a space
and time scale appropriate to the seeding delivery system and
in-cloud responses is required. Furthermore, suitable
covariates to precipitation are needed if the natural vari
ability of precipitation is to be partially accounted for.
I
We believe that the time required in an experiment conducted
later to prove a promising hypothesis of seedability could
be reduced by a factor of around 3 or 4 by use of suitable
covariates.
Thus, the recent research at UWRL represents a marked
shift in emphasis from a primarily statistical approach to
one stressing physical understanding. Such understanding
requires adequate data to verify or modify physical reasoning.
In this way, a conceptual framework supported by physical
evidence may be developed for the reliable and efficient
augmentation of winter snowpack.
1.2 Present directions in research at UWRL
During this past year, research in weather modification
of winter orographic clouds was directed along two main
lines. One was the development of new instrumentation for
measuring critical meteorological parameters relevant to
cloud seeding, in particular, for the measurement of super
cooled liquid water. The other was the continuation of the
measurement of various meteorological parameters during the
presence of winter orographic clouds.
The development of two new instruments was undertaken
during this year; construction of a dual frequency NOAA type
radiometer was in progress, and an expendable balloon-borne
sensor for the measurement of vertical profiles of supercooled
liquid water was developed.
2
Measurements made during the winter field season were
similar to previous seasons except that supercooled liquid
water measurements were also made with the new "cloudsondes."
Other measurements included precipitation, vertical motion,
rawinsonde data and aircraft measurements of supercooled
liquid water and other parameters.
3

2.0 SUMMARY OF RESEARCH OBJECTIVES AND FINDINGS
2.1 Cloudsonde instrument development
A vibrating wire placed in the humidity duct of a
standard u.S. rawinsonde is used to measure vertical pro
files of the concentration of supercooled liquid water in
clouds. The natural frequency of vibration varies according
to the mass of ice accumulated by contact freezing. By
monitoring the natural frequency and the airspeed relative to
the wire, the supercooled liquid water concentration can be
found.
Suitable electronics are developed for both individual
expendable rawinsonde units and a ground based receiver so
that the vibration frequency can be recorded. Calibration of
the frequency change versus mass accumulation is done theo
retically along with measurements made in a wind tunnel with
supercooled water present. Further verification is found by
the use of paint, uniformly sprayed on the "upwind" side
of an exposed wire.
Sixteen soundings were made during February and March,
1980. Although no very strong episodes of supercooled clouds
were found, some very interesting vertical profiles of
supercooled liquid water were measured. These will be
discussed in a later section.
5
2.2 Radiometer instrument development
A dual-frequency radiometer developed recently by NOAA
yields continuous readings of vapor and liquid water inte
grated along a vertical path through the atmosphere. Because
of the likelihood of a great benefit to research on winter
orographic cloud seeding, it was decided to construct a
nearly identical system at UWRL.
It was expected at the outset that the construction of
this instrument would take more than one year to complete.
In fact, during the first year most of the effort was direct-
ed at obtaining components and studying or evaluating system
components. (Substantial construction did not actually begin
until after this reporting period, but at present only minor
tasks remain before the total system is completed.)
2.3 Comparison of J-W and Rosemount supercooled liquid water measurements
Probably the most widely used LWC measuring device is
the one described by Neel and Steinmetz (1952) and is gener
ally known as the Johnson-Williams (J-W) hot wire liquid
water content meter. At subfreezing temperatures the J-W
device measures supercooled liquid water concentrations.
Another device available to measure supercooled LWC is
the "Rosemount Ice Detector."l The instrument was developed
IManufactured by Rosemount, Inc., Minneapolis, Minn. (Our mention of manufacturer does not constitute endorsement.)
6
in response to a widespread requirement for a reliable
aircraft warning system. However, inasmuch as its meteoro
logical use would emphasize the cause of aircraft icing,
i.e., supercooled liquid water, identification of the device
by the name of Ros'emount liquid water (RLW) meter will be
used in this report.
The purpose of this phase of our research is to compare
supercooled LWC measurements with each of the instruments and
to assess their comparative usefulness in cloud physics
studies. In particular, our measurements with these instru
ments were made in winter orographic clouds, but the results
should be applicable to supercooled liquid water measure
ments in general.
The comparison of the Johnson-Williams hot wire device
and the Rosemount icing rate meter shows that supercooled
liquid water measurements can be made effectively by both
instruments subject to certain significant limitations.
The primary well-known limitations of the J-W instrument
are the underestimated LWC for droplet sizes exceeding 30 ~m
and the drift of the zero value, which in winter orographic
or cyclonic storms can lead to substantial uncertainty in the
readings.
The primary limitations of the Rosemount device are the
reduced collection efficiency at droplet sizes less than 10
~m diameter, possible runoff (partial freezing) at warmer
7
temperatures (> -SOC) and aperiodic data gaps due to the
brief heating cycle of the instrument.
2.4 Cloud seeding opportunity recognition
One of the main objectives of weather modification
research at UWRL is to develop improved seeding criteria for
precipitation augmentation of winter orographic clouds. In
this study detailed measurements of supercooled cloud water,
precipitation, cloud top temperature and vertical air motion
in winter orographic clouds are used to develop criteria
for the seedability of those clouds. Winter orographic
clouds over the upwind mountain base with cloud top tempera
tures between aoc and -22°C are found to be primarily com
posed of supercooled water and are therefore seedable. The
supercooled water concentration is empirically found to
depend upon the updraft velocity. The potential precipita
tion yield is dependent upon the flux of supercooled water
over the barrier. Because the updraft velocity is approxi
mately proportional to the cross-barrier wind, the potential
precipitation yield is approximately proportional to the
square of the cross-barrier wind, provided that the cloud top
temperature is in the seedable range of temperatures.
These findings are strongly substantiated by systematic
use of aircraft icing reports over a full winter season
(November-March, 1978-79). It is Shown that a cloud top
8
temperature of about -22°C separates clouds with a precipita
tion enhancement potential from those without such a poten
tial. It is found that aircraft icing is approximately
proportional to the cross-barrier wind, and that the flux of
supercooled water over the barrier for cloud top temperatures
warmer than -22°C is (as derived from the research data)
approximately proportional to the square of the cross-barrier
wind.
About 20 percent of cloud episodes over the mountains of
Northern Utah may be expected to have a high modification
potential.
9

3.0 DEVELOPMENT OF EQUIPMENT
3.1 Cloudsonde instrument
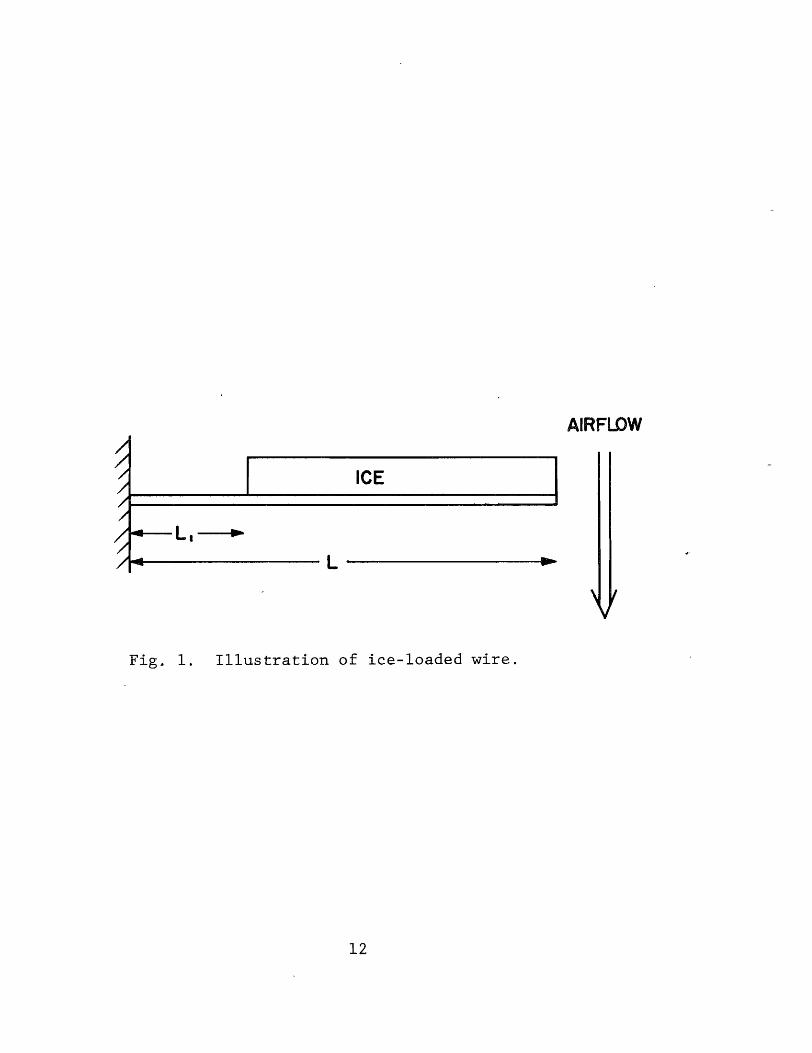
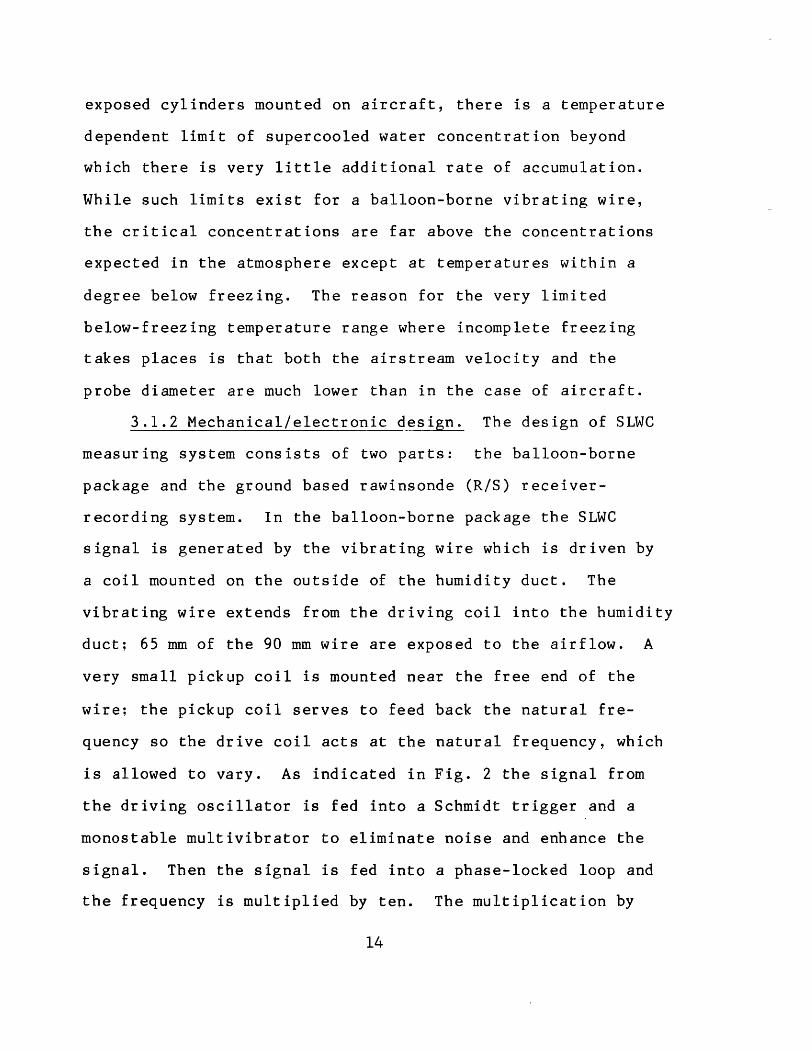
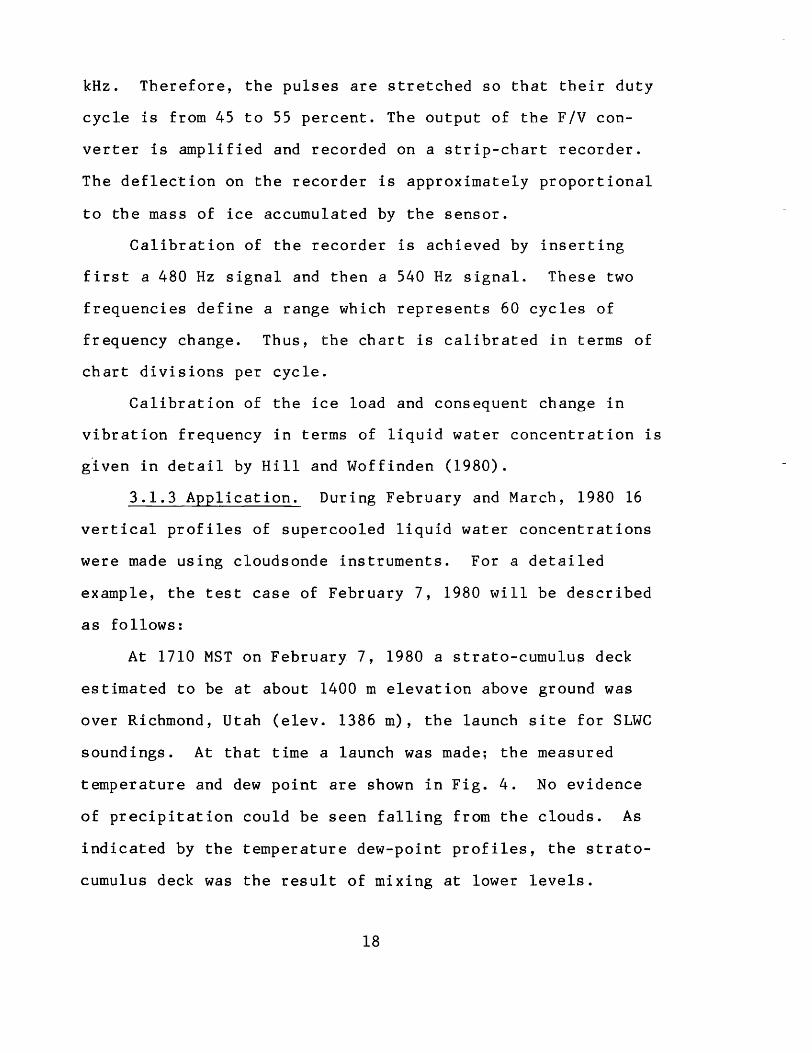
3.1.1 Concept. The basic concept utilized for measuring
supercooled liquid water concentration (SLWC) is a vibrating
wire exposed to the airstream during ascent of a balloon
borne package. The wire is fixed at one end and free at the
other as indicated schematically on Fig. 1. The package
consists of a standard NWS rawinsonde, modified to accommo
date the vibrating wire and related electronics. The natural
frequency of vibration varies according to the mass of ice
accumulated by contact freezing. Thus, by monitoring the
rate of change of the natural frequency and the airspeed
relative to the wire, the supercooled liquid water concen
tration can be determined.
In selecting a suitable ice collector, an important
consideration is the collection efficiency. It is desirable
to choose a collector of sufficiently small diameter so that
the collection efficiency does not vary much for the drop
sizes encountered. Collection efficiencies for various drop
sizes and collector diameters were calculated according to
Langmuir and Blodgett (1946). Based upon these calculations,
a (piano) wire of 0.60 mm diameter was chosen. Slightly
smaller diameters would have been acceptable but the stiff
ness and vibration properties were not as suitable as the
value chosen. The length of the wire was set at 90 mm, so
11
AIRFLDW
) / ICE / / /
.-
'/ L . ~
... L - II-
Fig. 1. Illustration of ice-loaded wire.
12
the natural vibration frequency is around 53 Hz. The collec-
tion efficiencies for the wire as a function of droplet size
with an airspeed of 5 m s-1 approach unity above droplet
sizes of about 10 ~m. Because the bulk of SLWC is expected
to be found with diameters in excess of 10 ~m a correction
factor of a few percent could be added to the measurements to
compensate for slightly reduced efficiencies from unity.
In interpreting the droplet collection efficiencies we
may expect that supercooled water will be underestimated when
the predominant droplet diameters are less than about 10 ~m.
Such conditions might be found in heavily polluted continental
clouds. Problems with collection of larger droplets such as
encountered with the Johnson-Williams (J-W) device would not
be expected with the vibrating wire. When large super-
cooled water droplets impinge on the J-W hot wire not all of
the droplet contributes to cooling because heated droplets
flow past the wire. With a relatively slow airflow past the
vibrating wire and no heating externally applied, we may
expect little problem in measuring supercooled water at large
cloud droplet sizes.
In addition to the collection efficiency, consideration
must also be given to the heat economy of the collecting wire
for reasons discussed by Ludlam (1951) and others. 2 In
2For example, see Brun, R. J., W. Lewis, P. J. Perkins, and S. J. Serafini, 1955: Impingement of cloud droplets on a cylinder and procedure for measuring liquid-water content and droplet sizes in supercooled clouds by rotating multicylinder method. N.A.C.A. Report No. 1215. 43 pp.
13
exposed cylinders mounted on aircraft, there is a temperature
dependent limit of supercooled water concentration beyond
which there is very little additional rate of accumulation.
While such limits exist for a balloon-borne vibrating wire,
the critical concentrations are far above the concentrations
expected in the atmosphere except at temperatures within a
degree below freezing. The reason for the very limited
below-freezing temperature range where incomplete freezing
takes places is that both the airstream velocity and the
probe diameter are much lower than in the case of aircraft.
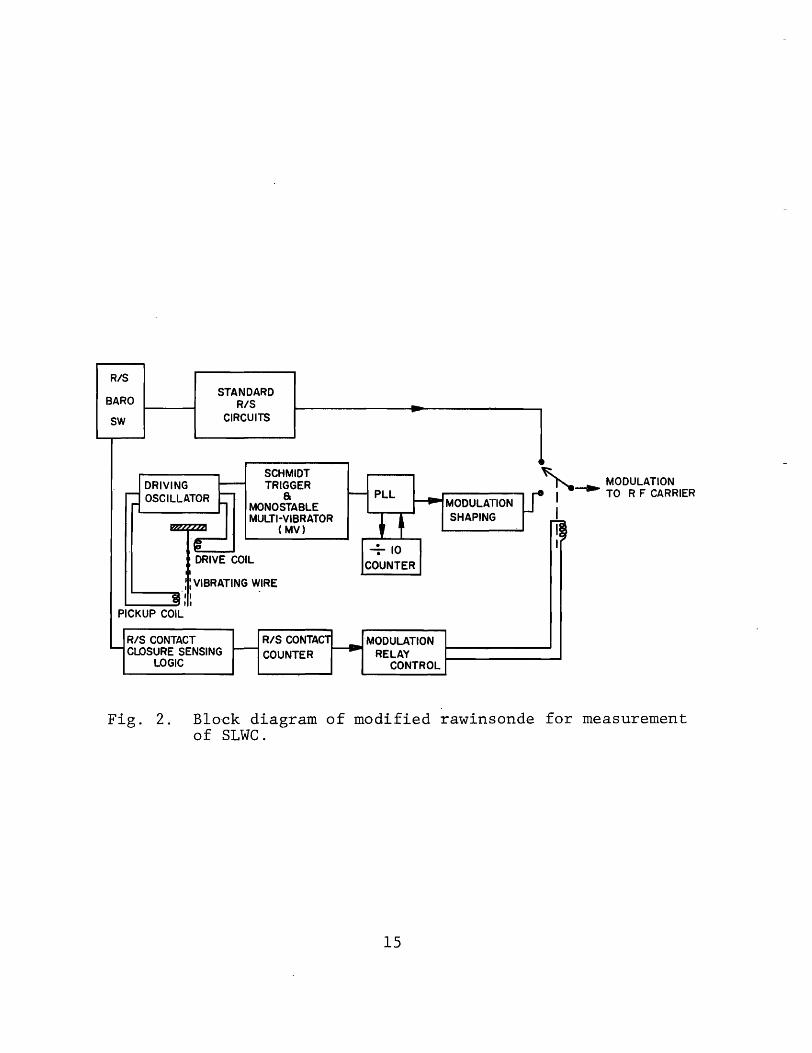
3.1.2 Mechanical/electronic design. The design of SLWC
measuring system consists of two parts: the balloon-borne
package and the ground based rawinsonde (R/S) receiver
recording system. In the balloon-borne package the SLWC
signal is generated by the vibrating wire which is driven by
a coil mounted on the outside of the humidity duct. The
vibrating wire extends from the driving coil into the humidity
duct; 65 mm of the 90 mm wire are exposed to the airflow. A
very small pickup coil is mounted near the free end of the
wire; the pickup coil serves to feed back the natural fre
quency so the drive coil acts at the natural frequency, which
is allowed to vary. As indicated in Fig. 2 the signal from
the driving oscillator is fed into a Schmidt trigger and a
monostable multivibrator to eliminate noise and enhance the
signal. Then the signal is fed into a phase-locked loop and
the frequency is mUltiplied by ten. The multiplication by
14
RIS
BARO
SW
STANDARD RIS
CIRCUITS
SCHMIDT TRIGGER
a MONOSTABLE MULTI-VIBRATOR
( MV)
,: VIBRATING ~IRE 1...-_ ......... "
L.....-_......"I
PICKUP COIL
RIS CONTACT CLOSURE SENSING
LOGIC
RIS CONTAC COUNTER
MODULATION RELAY
CONTROL
MODULATION SHAPING
~ MODULATION I ....... TO R F CARRIER
I I I
Fig. 2. Block diagram of modified rawinsonde for measurement of SLWC.
15
ten not only separates the received signal from other parame-
ters, but amplifies the response to collected ice prior to
transmission. After multiplication the signal is passed
through a modulation shaping circuit to properly modulate the
radio frequency (rf) carrier.
The remaining circuits act to intersperse the liquid
water measurements in place of alternate temperature samples.
This is done by sensing each baroswitch closure and actuating
the modulation control relay just after every other closure.
Each closure represents either humidity, low reference or
high reference and, because a temperature sample normally
follows each, it is necessary to sense and count all three
types of closures so the liquid water samples can be ade
quately monitored.3
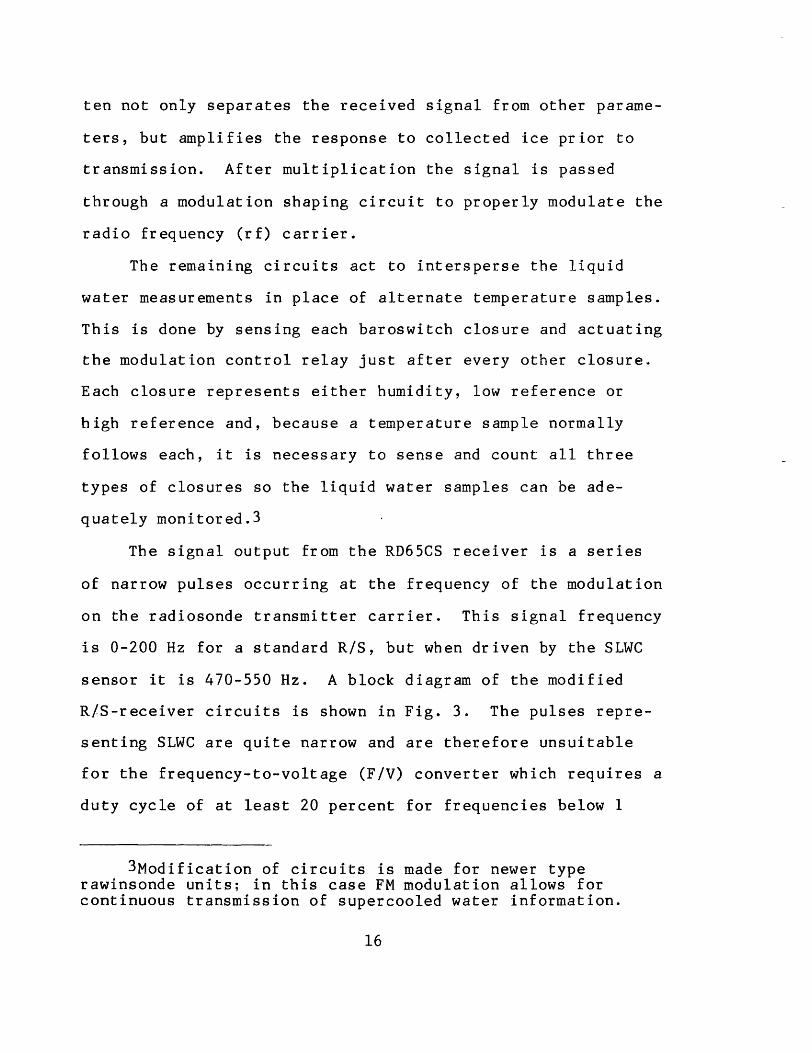
The signal output from the RD65CS receiver is a series
of narrow pulses occurring at the frequency of the modulation
on the radiosonde transmitter carrier. This signal frequency
is 0-200 Hz for a standard R/S, but when driven by the SLWC
sensor it is 470-550 Hz. A block diagram of the modified
R/S-receiver circuits is shown in Fig. 3. The pulses repre
senting SLWC are quite narrow and are therefore unsuitable
for the frequency-to-voltage (F/V) converter which requires a
duty cycle of at least 20 percent for frequencies below 1
3Modification of circuits is made for newer type rawinsonde units; in this case FM modulation allows for continuous transmission of supercooled water information.
16
DIGITAL FREQUENCY MONITOR
60 HZ INPUT
RD 65 CS RADIOSONDE RECIEVER DC TO RIS STANDARD RECORDER
AMPLIFIER
AMPLIFIER
480HZ DUTY FREQUENCY CYCLE t--~.~ ___ "'" TO VOLTAGE
CONTROL CONVERTER
I
480 HZ OP I FREQUENCY :;:e,:::" E-...... _
MULTIPLIER ~~~~~~5~4~OHZ
DC TO SLWC RECORDER
Fig. 3. Block diagram of modified rawinsonde receiver for obtaining SLWC data.
17
kHz. Therefore, the pulses are stretched so that their duty
cycle is from 45 to 55 percent. The output of the F/V con
verter is amplified and recorded on a strip-chart recorder.
The deflection on the recorder is approximately proportional
to the mass of ice accumulated by the sensor.
Calibration of the recorder is achieved by inserting
first a 480 Hz signal and then a 540 Hz signal. These two
frequencies define a range which represents 60 cycles of
frequency change. Thus, the chart is calibrated in terms of
chart divisions per cycle.
Calibration of the ice load and consequent change in
vibration frequency in terms of liquid water concentration is
g~ven in detail by Hill and Woffinden (1980).
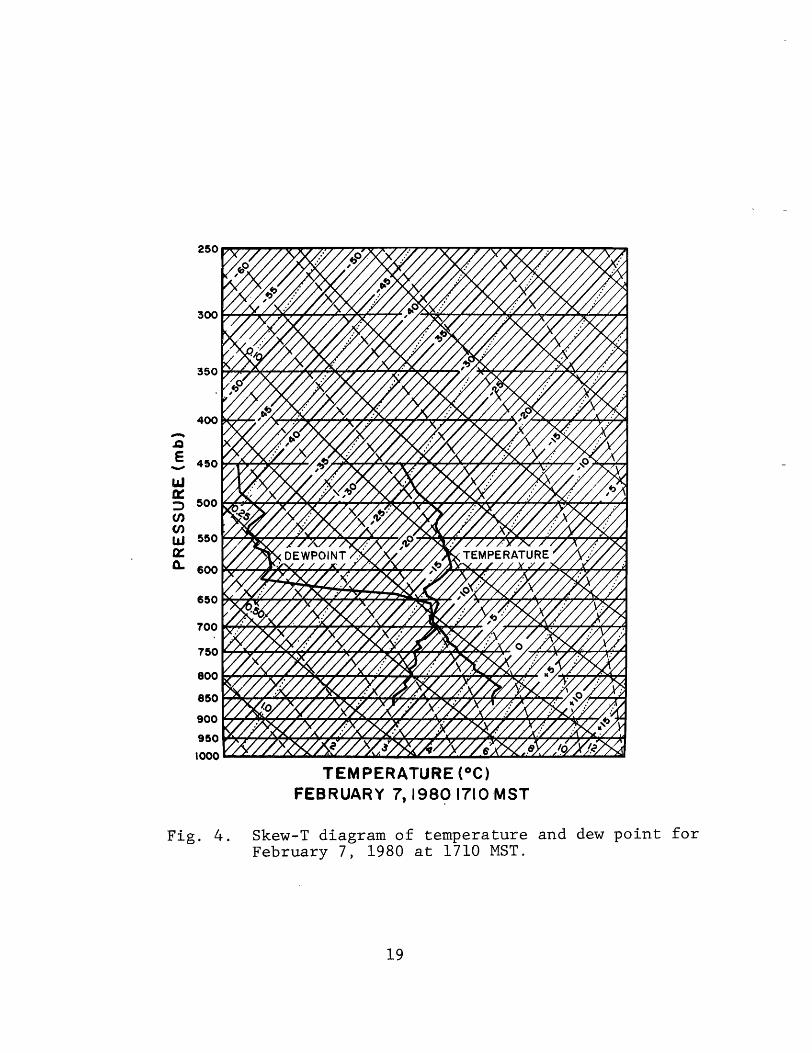
3.1.3 Application. During February and March, 1980 16
vertical profiles of supercooled liquid water concentrations
were made using cloudsonde instruments. For a detailed
example, the test case of February 7, 1980 will be described
as follows:
At 1710 MST on February 7, 1980 a strato-cumulus deck
estimated to be at about 1400 m elevation above ground was
over Richmond, Utah (elev. 1386 m), the launch site for SLWC
soundings. At that time a launch was made; the measured
temperature and dew point are shown in Fig. 4. No evidence
of precipitation could be seen falling from the clouds. As
indicated by the temperature dew-point profiles, the strato
cumulus deck was the result of mixing at lower levels.
18
-.Q
E -LIJ 0:: ::> C/) (f)
LtJ a:: Q.
450
500
550
600
650
700
750
800
850
900
950
1000
TEMPERATURE (OC) FEBRUARY 7, 198C;> 17l0MST
Fig. 4. Skew-T diagram of temperature and dew point for February 7, 1980 at 1710 MST.
19
Adiabatic values of liquid water would not be expected to
exceed 0.3 g m- 3 . In fact, due to mixing the actual SLWC
would be expected to be somewhat lower.
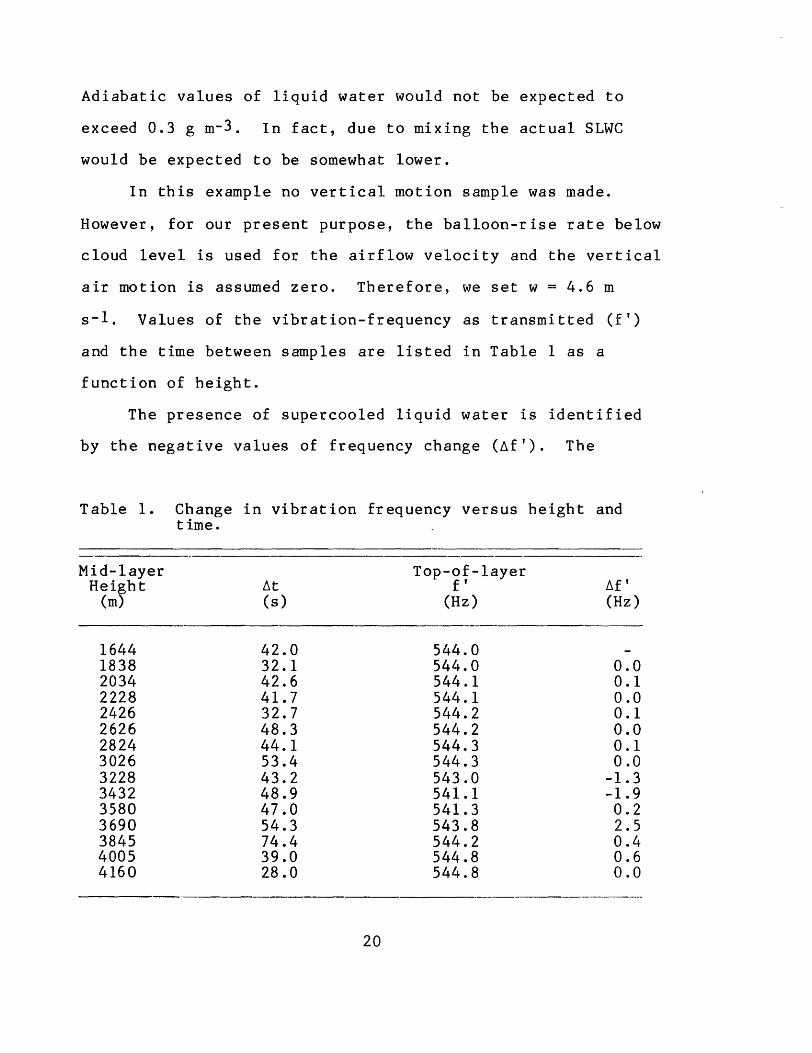
In this example no vertical motion sample was made.
However, for our present purpose, the balloon-rise rate below
cloud level is used for the airflow velocity and the vertical
air motion is assumed zero. Therefore, we set w = 4.6 m
s-l. Values of the vibration-frequency as transmitted (ft)
and the time between samples are listed in Table 1 as a
function of height.
The presence of supercooled liquid water is identified
by the negative values of frequency change (~f'). The
Table 1. Change in vibration frequency versus height and time.
Mid-layer Top-of-layer L\f' Height L\t . f'
(m) (s) (Hz) (Hz)
1644 42.0 544.0 1838 32.1 544.0 0.0 2034 42.6 544.1 0.1 2228 41.7 544.1 0.0 2426 32.7 544.2 0.1 2626 48.3 544.2 0.0 2824 44.1 544.3 0.1 3026 53.4 544.3 0.0 3228 43.2 543.0 -1.3 3432 48.9 541.1 -1.9 3580 47.0 541.3 0.2 3690 54.3 543.8 2.5 3845 74.4 544.2 0.4 4005 39.0 544.8 0.6 4160 28.0 544.8 0.0
20
relatively strong positive changes in f' above the cloud
layer are due to sublimation. The amount of sublimation
depends upon prior ice accumulation and the relative humidity
of the ambient air. In this case the air above the cloud was
very dryas shown in the sounding. In addition to these
variations in f' there is a very small temperature effect
(0.053 Hz per °C reduction).
According to the measured frequency changes, the SLWC
is 0.10 g m- 3 over a 204 m layer (694-676 mb) centered at
3228 m and 0.13 g m- 3 over a 205 m layer (676-658 mb) centered
at 3432 m. Thus, the cloud thickness as determined by SLWC
measurements is no more than 409 m, probably about 350 m, and
the supercooled liquid water concentration is in the vicinity
of a tenth g m- 3 .
Other soundings recently made show examples of much
larger amounts of supercooled water and others show a virtual
absence of supercooled water, especially in the presence of
snowfall. These will be described in Section 5.2.
3.2 Radiometer instrument
To obtain continuous measurements of supercooled liquid
water the construction of a NOAA type dual frequency radi
ometer was undertaken. This radiometer is nearly identical
to the one developed by Guiraud et ale (1979). The two
frequencies are 20.6 GHz and 31.6 GHz. One specially de
signed horn antenna (NOAA) is used. A flat reflector outside
21
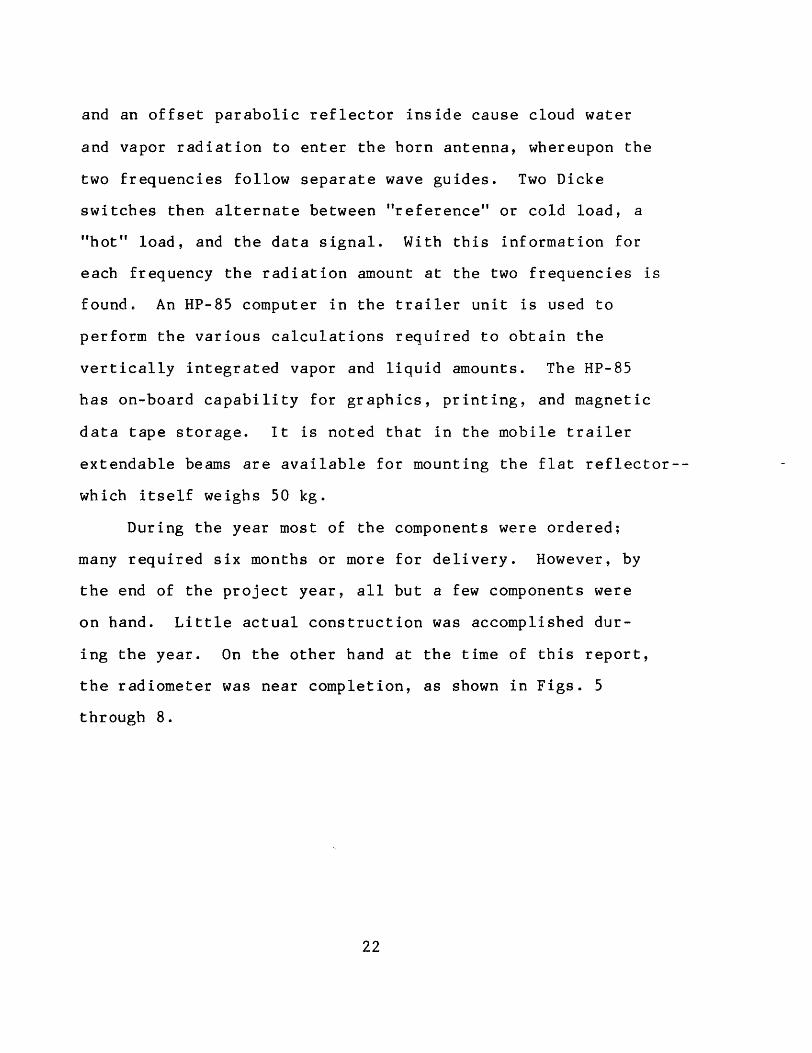
and an offset parabolic reflector inside cause cloud water
and vapor radiation to enter the horn antenna, whereupon the
two frequencies follow separate wave guides. Two Dicke
switches then alternate between "reference" or cold load, a
"hot" load, and the data signal. With this information for
each frequency the radiation amount at the two frequencies is
foundo An HP-85 computer in the trailer unit is used to
perform the various calculations required to obtain the
vertically integrated vapor and liquid amounts. The HP-B5
has on-board capability for graphics, printing, and magnetic
data tape storage. It is noted that in the mobile trailer
extendable beams are available for mounting the flat reflector-
which itself weighs 50 kg.
During the year most of the components were ordered;
many required six months or more for delivery. However, by
the end of the project year, all but a few components were
on hand. Little actual construction was accomplished dur
ing the year. On the other hand at the time of this report,
the radiometer was near completion, as shown in Figs. 5
through B.
22
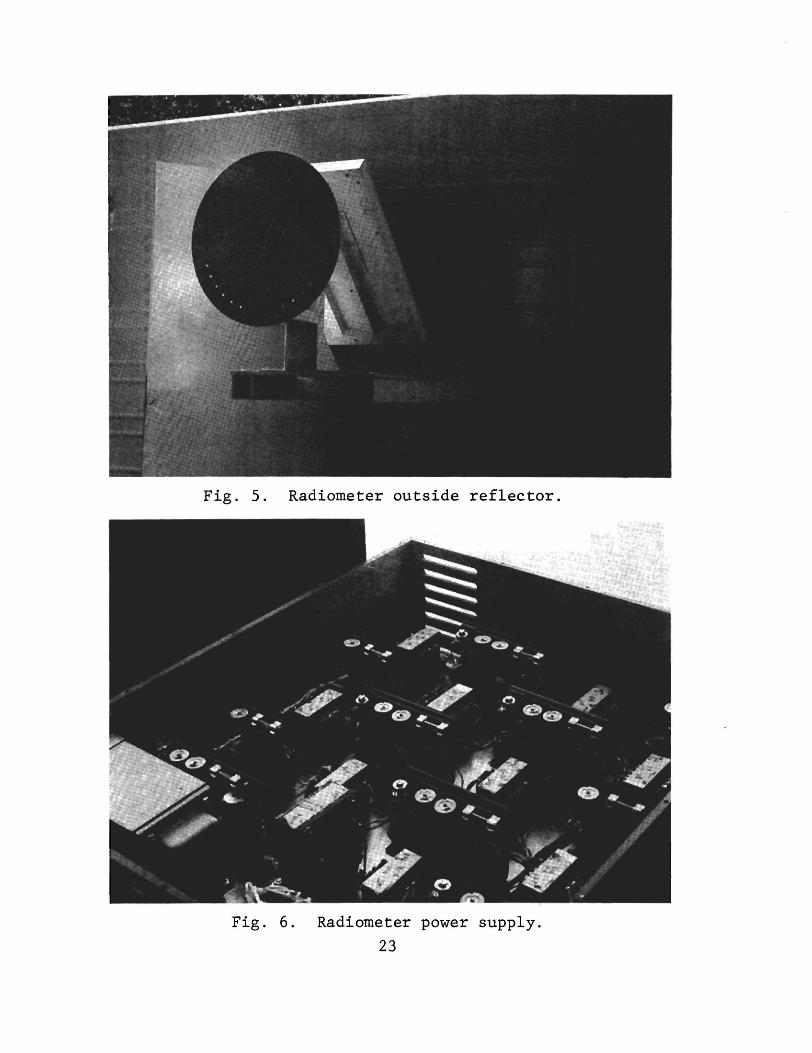
Fig. 5. Radiometer outside reflector.
Fig. 6. Radiometer power supply.
23
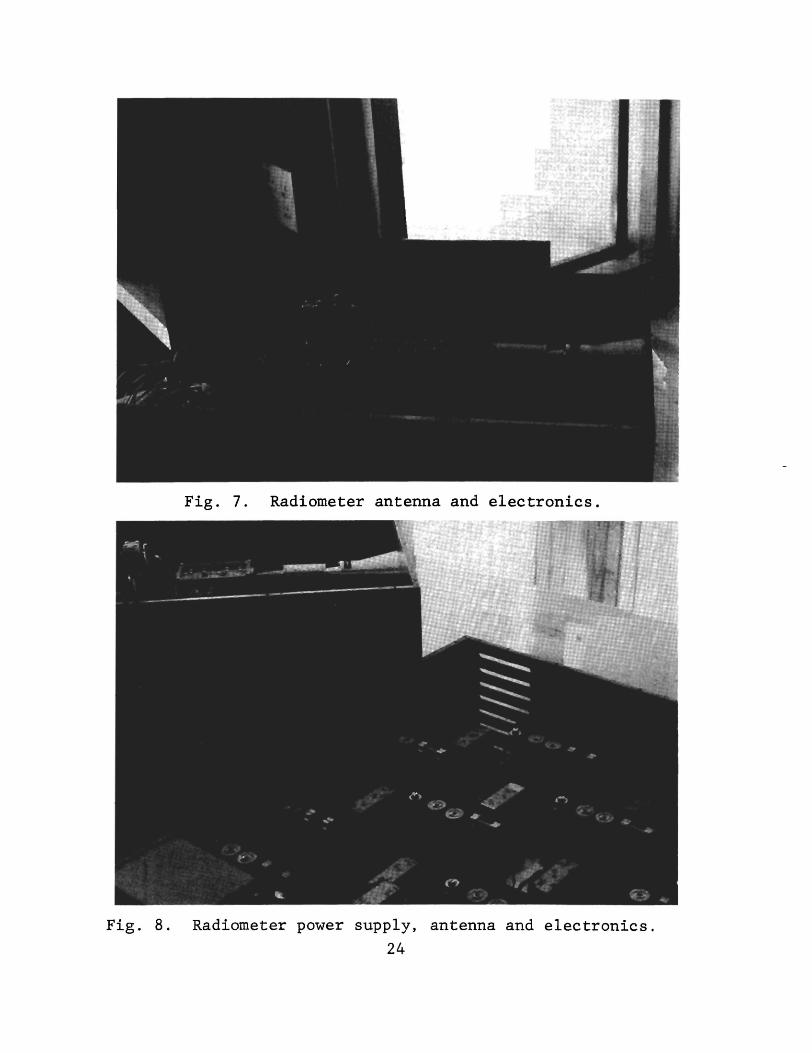
Fig. 7. Radiometer antenna and electronics.
Fig. 8. Radiometer power supply, antenna and electronics.
24
4.0 DATA ACQUISITION AND OPERATIONS
During the 1979-80 winter season no seeding was planned.
Emphasis was placed upon making liquid water measurements and
determining seedability rather than attempting to find
seeding effects. This choice was made because it has been
found in our research that airborne released silver iodide
generally does not mix very much within a period of an hour
or so after release. On the other hand our previous data
indicated that seedability could be identified by cloud top
temperature and the cross-barrier wind speed. Therefore, the
field research undertaken in the 1979-80 winter season was
directed toward obtaining data related to seedability.
During February and March eight periods (events) of
special study were used for making surface and upper level
measurements when winter orographic clouds were present. The
length of the events varied because of the many technical
problems encountered in the first operational use of the USU
cloudsondes.
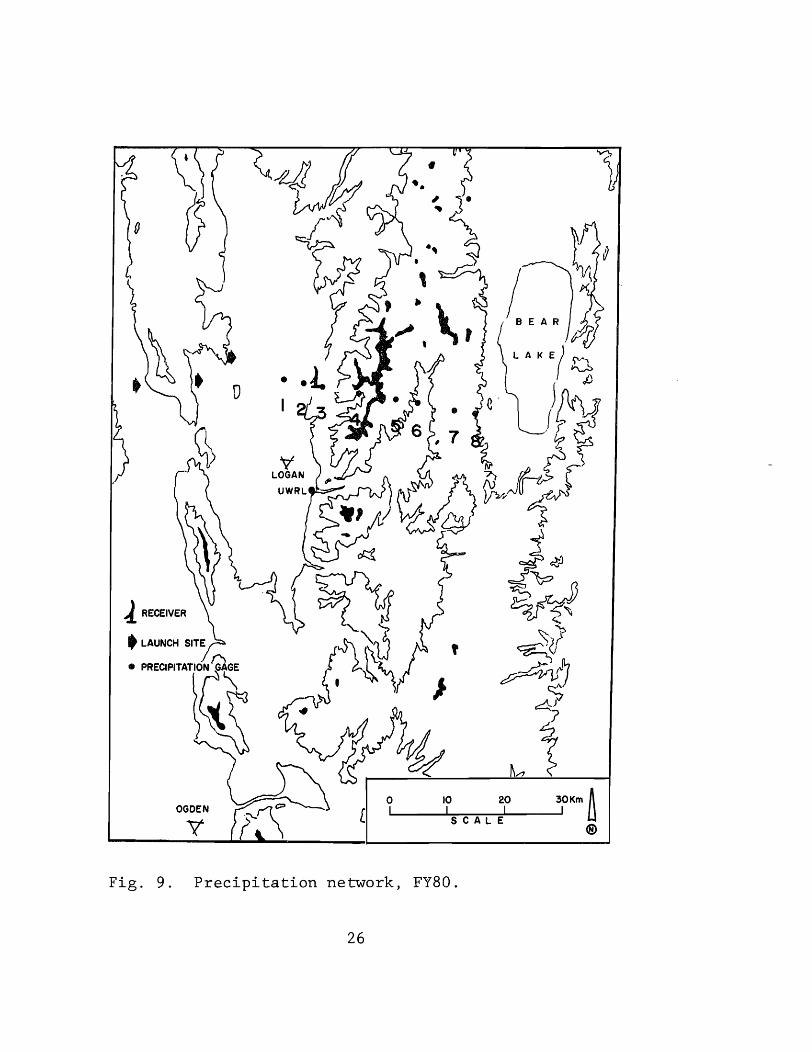
4.1 Precipitation
Precipitation measurements were made over the period
from mid January through the end of March, 1980. The layout
of the precipitation network for the 1979-80 winter season is
shown in Fig. 9. Precipitation at Smithfield Canyon is shown
in Fig. 10 along with the periods of field operations. Further
analysis of these data will be described in Section 5.
25
J. RECEIVER
o [
I _ ~IO ~20---.-.J30Km~ I I SCALE I
Fig. 9. Pr .. eClpltation network, FY80.
26
-tOe e 3 JOHNSON - WILLIAMS
C1I -z o I- 2 <[ a::: Iz LLJ U Z o U 0:: W
~ 0 3: o :::> o ~ -IT----------.--------~~--------~--------~-------
o 2 3 4
TIME (minJ
ROSEMOUNT 5
4
O;----------r--------~~---------------------------o 2 4
TIME (min.)
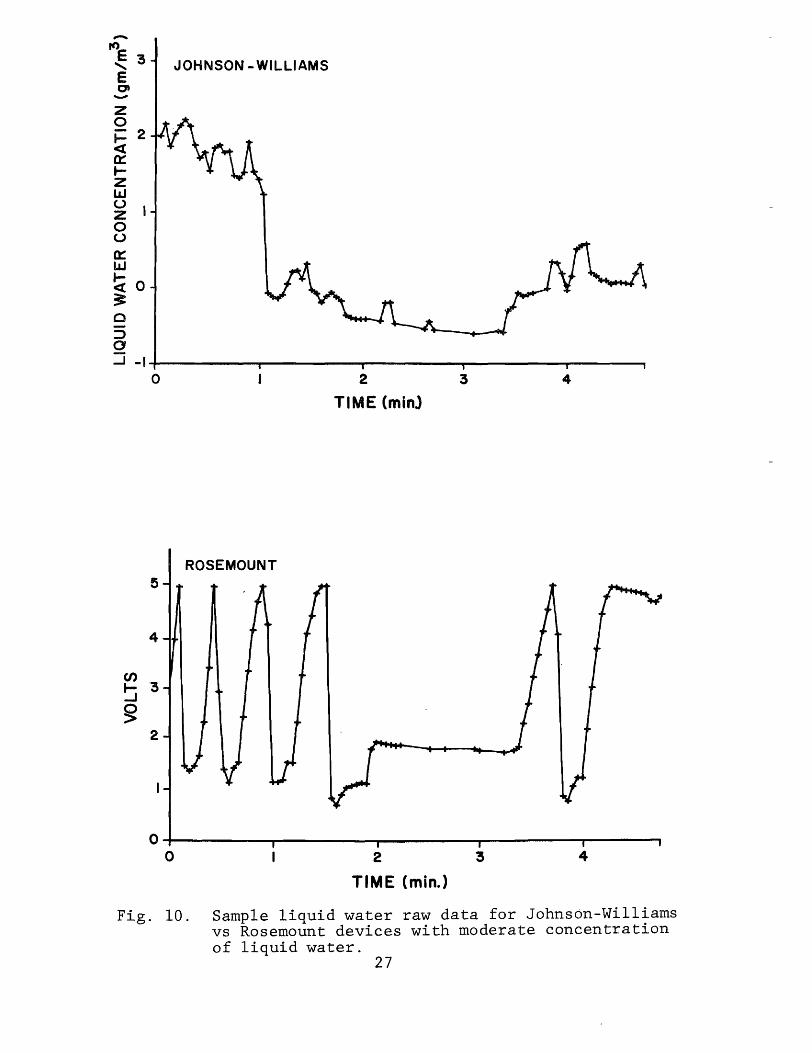
Fig. 10. Sample liquid water raw data for Johnson-Williams vs Rosemount devices with moderate concentration of liquid water.
27
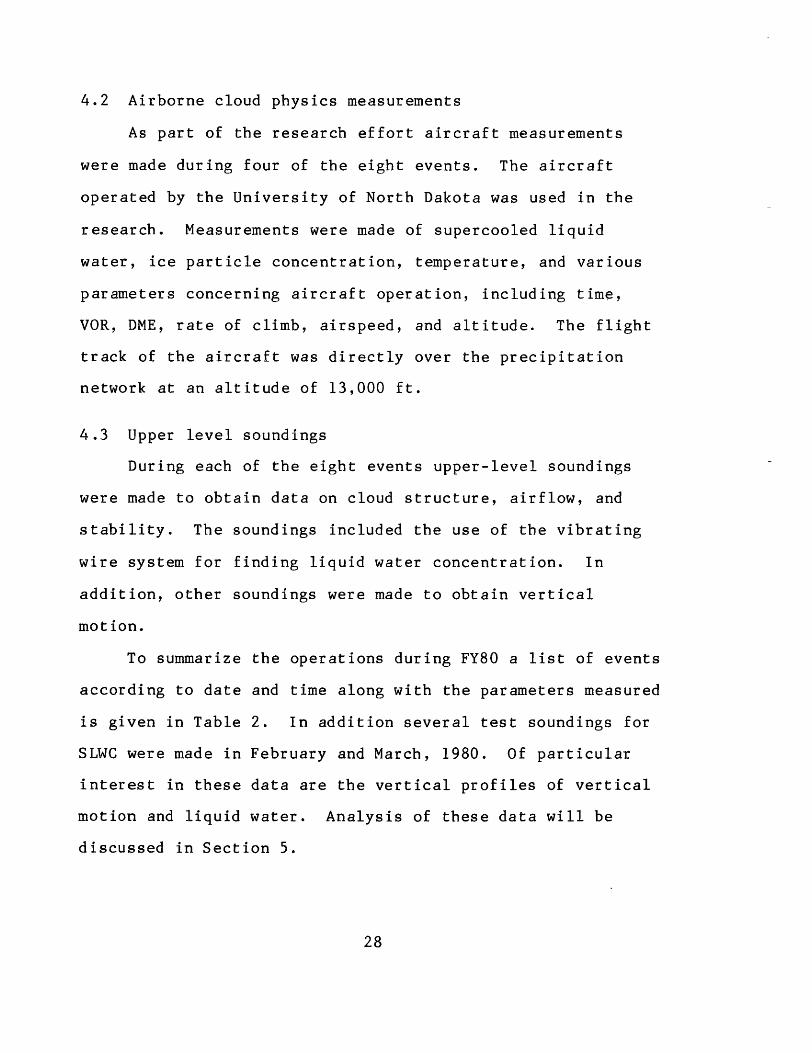
4.2 Airborne cloud physics measurements
As part of the research effort aircraft measurements
were made during four of the eight events. The aircraft
operated by the University of North Dakota was used in the
research. Measurements were made of supercooled liquid
water, ice particle concentration, temperature, and various
parameters concerning aircraft operation, including time,
VOR, DME, rate of climb, airspeed, and altitude. The flight
track of the aircraft was directly over the precipitation
network at an altitude of 13,000 ft.
4.3 Upper level soundings
During each of the eight events upper-level soundings
were made to obtain data on cloud structure, airflow, and
stability. The soundings included the use of the vibrating
wire system for finding liquid water concentration. In
addition, other soundings were made to obtain vertical
motion.
To summarize the operations during FY80 a list of events
according to date and time along with the parameters measured
is given in Table 2. In addition several test soundings for
SLWC were made in February and March, 1980. Of particular
interest in these data are the vertical profiles of vertical
motion and liquid water. Analysis of these data will be
discussed in Section 5.
28
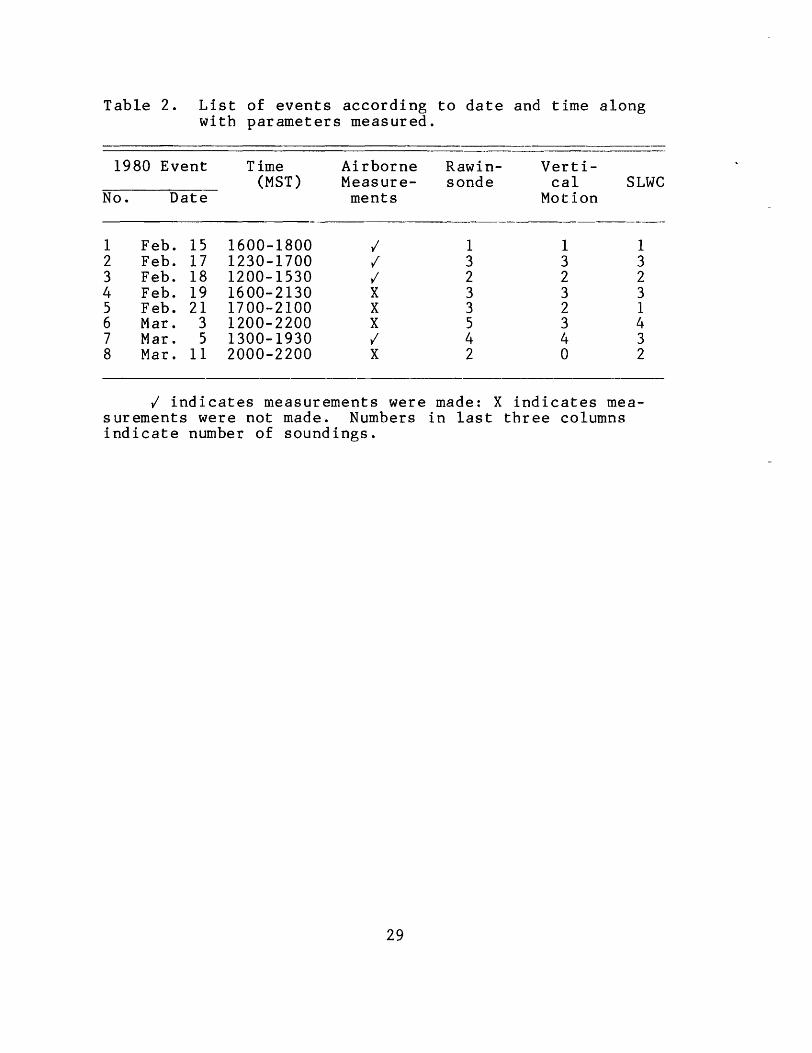
Table 2. List of events according to date and time along with parameters measured.
1980 Event Time Airborne Rawin- Verti-(MST) Measure- sonde cal SLWC
No. Date ments Motion
1 Feb. 15 1600-1800 I 1 1 1 2 Feb. 17 1230-1700 I 3 3 3 3 Feb. 18 1200-1530 I 2 2 2 4 Feb. 19 1600-2130 X 3 3 3 5 Feb. 21 1700-2100 X 3 2 1 6 Mar. 3 1200-2200 X 5 3 4 7 Mar. 5 1300-1930 I 4 4 3 8 Mar. 11 2000-2200 X 2 0 2
I indicates measurements were made: X indicates mea-surements were not made. Numbers in last three columns indicate number of soundings.
29

5.0 DEVELOPMENT OF CLOUD SEEDING TECHNOLOGY
5.1 Airborne measurements of supercooled liquid water
5.1.1 Comparison of J-W and RLW measurement of supercooled
liquid water. During water years 1978 and 1979, 20 flights
over the Northern Wasatch Mountains were made when orographic
clouds were present. In several cases the liquid water
concentration was essentially zero, or at least below the
level of detectability. In other cases the J-W device was
not operating properly. On the other hand the Rosemount
device operated without trouble. Of the remaining cases with
both significant concentrations of supercooled liquid water
and the two instruments operative, data were available from 3
cases in 1978 and 3 in 1979.
Before comparing these six cases it is useful to display
samples for each measuring device. In Fig. 10 the J-W and
Rosemount output every 2.8 s is shown for a moderate concentra
tion of LWC and in Fig. 11 for a heavy concentration. The
J-W values are read directly in g m- 3 ; the Rosemount
values are proportional to the average ice thickness on
the probe and conversion is needed to express in an LWC
concentration.
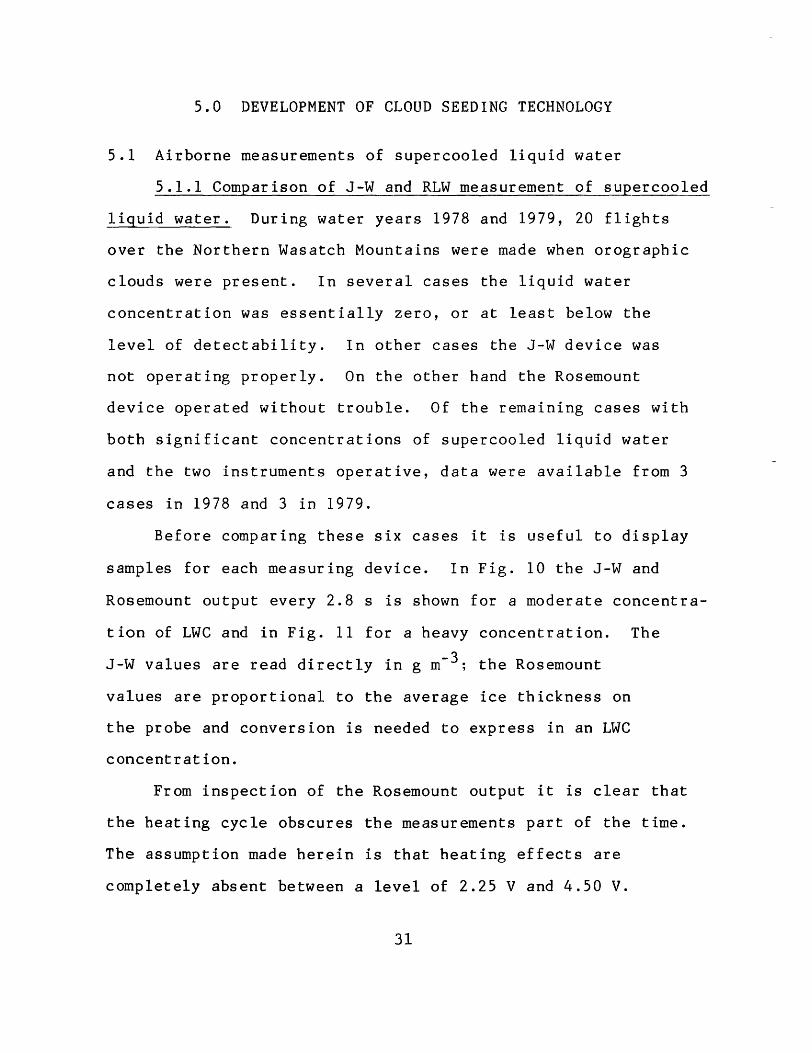
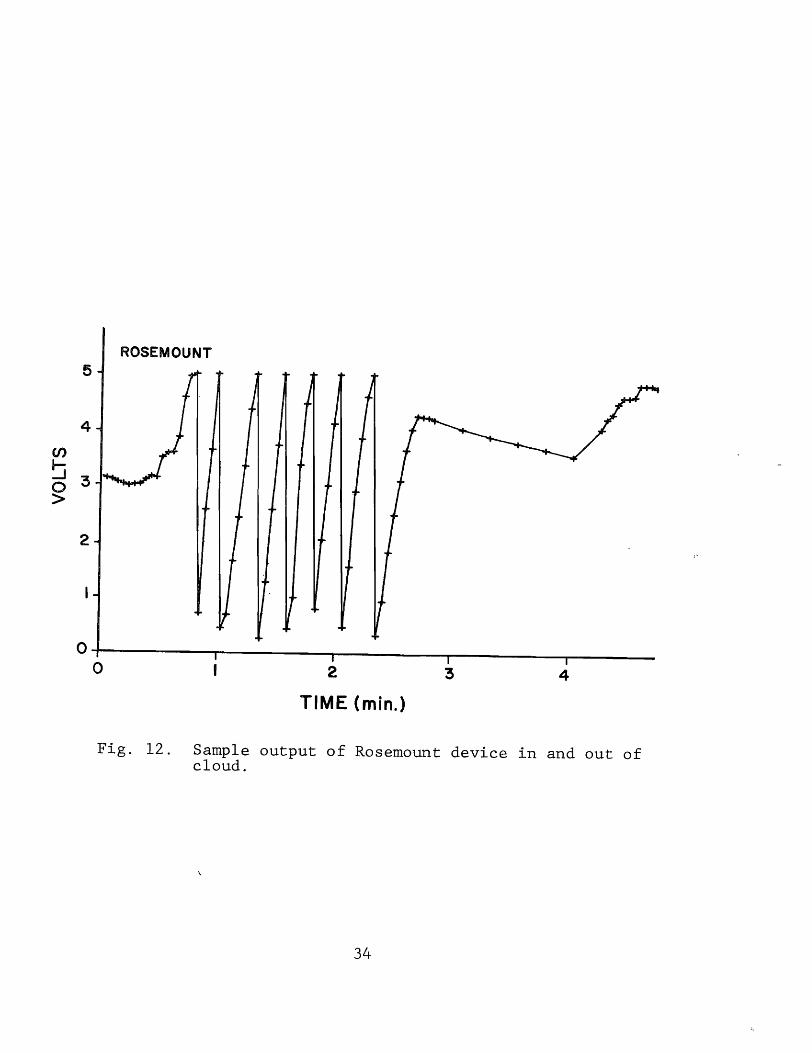
From inspection of the Rosemount output it is clear that
the heating cycle obscures the measurements part of the time.
The assumption made herein is that heating effects are
completely absent between a level of 2.25 V and 4.50 V.
31
ROSEMOUNT 5
4
en ~ o :3 >
2
OT----------,------____ ~--------~~--------~--------o 2 3 4
TIME (min.)
Fig. 12. Sample output of Rosemount device in and out of cloud.
34
altitudinal effects on the J-W measurements not fully elimi
nated by the instrument design.
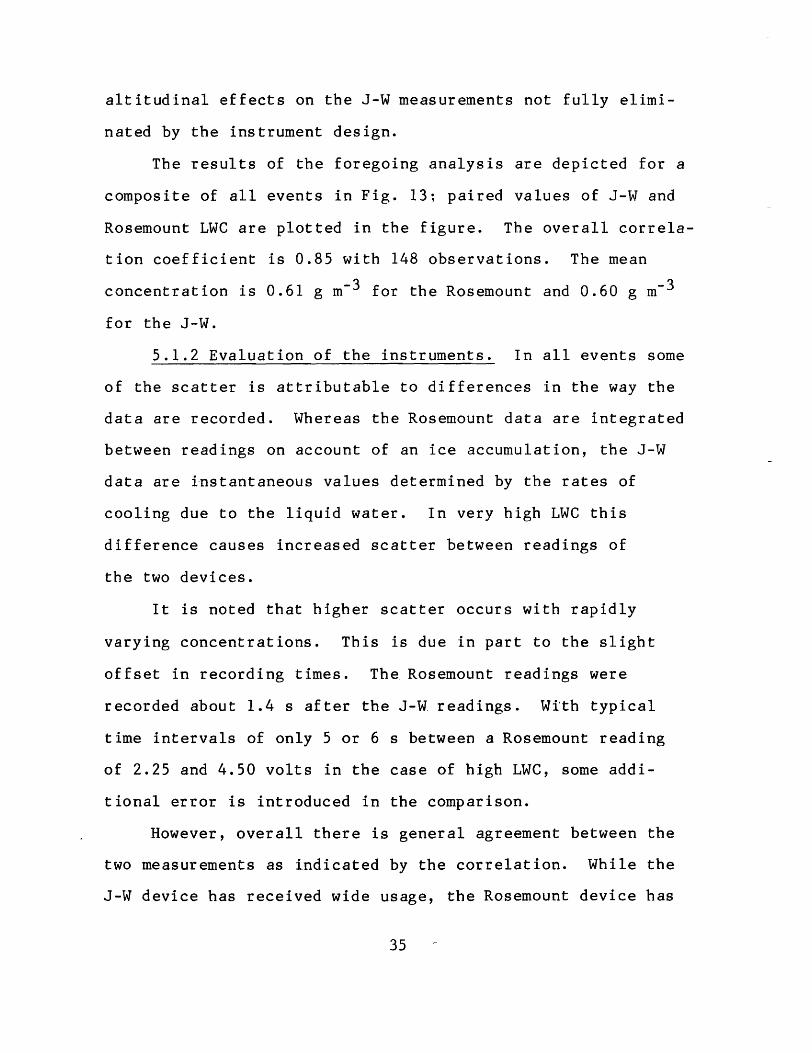
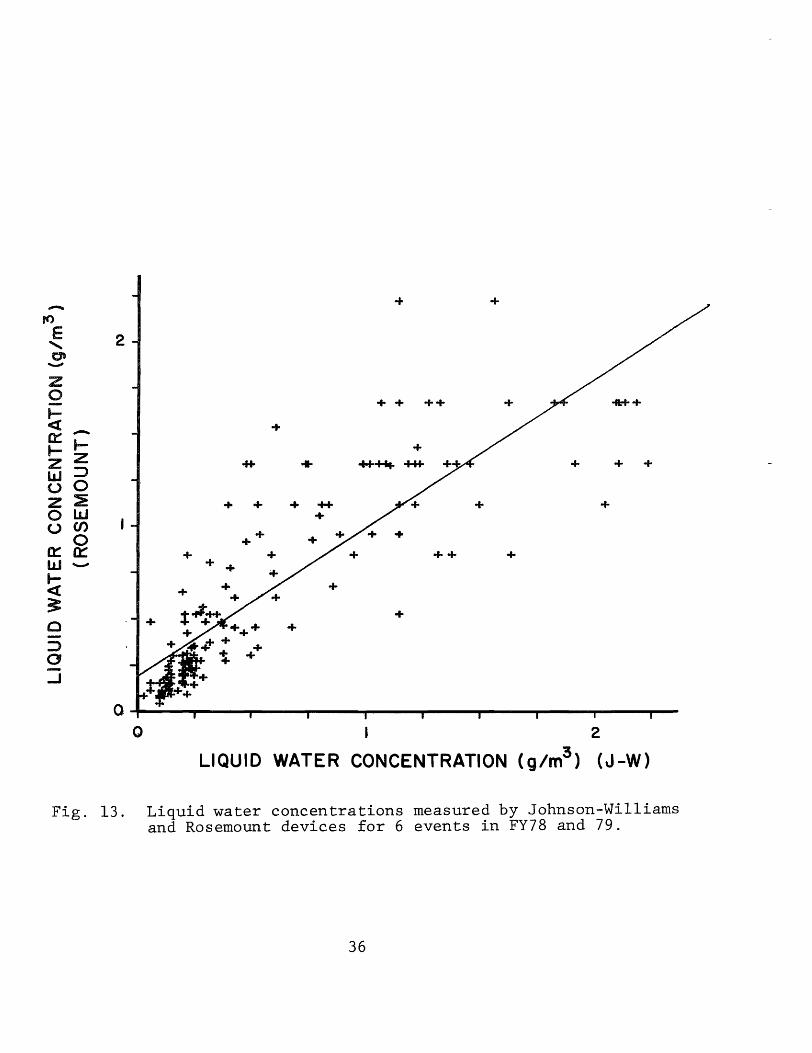
The results of the foregoing analysis are depicted for a
composite of all events in Fig. 13; paired values of J-W and
Rosemount LWC are plotted in the figure. The overall correla
tion coefficient is 0.85 with 148 observations. The mean
concentration is 0.61 g m- 3 for the Rosemount and 0.60 g m- 3
for the J-W.
5.1.2 Evaluation of the instruments. In all events some
of the scatter is attributable to differences in the way the
data are recorded. Whereas the Rosemount data are integrated
between readings on account of an ice accumulation, the J-W
data are instantaneous values determined by the rates of
cooling due to the liquid water. In very high LWC this
difference causes increased scatter between readings of
the two devices.
It is noted that higher scatter occurs with rapidly
varying concentrations. This is due in part to the slight
offset in recording times. The Rosemount readings were
recorded about 1.4 s after the J-W readings. With typical
time intervals of only 5 or 6 s between a Rosemount reading
of 2.25 and 4.50 volts in the case of high LWC, some addi
tional error is introduced in the comparison.
However, overall there is general agreement between the
two measurements as indicated by the correlation. While the
J-W device has received wide usage, the Rosemount device has
35
+ + -rt> E 2 "'" 0' ......, Z 0 + + ++ + ofH-+ t-<t ~ +
0:: i-t- + Z Z .... + * ...... ++fo + + + IJJ ~ U 0 Z ::;! + + + ++ + + 0 W + u en
++ 0 a:: a::: + + ++ + W ........ + + I- + + « + ~
+ :r:-t¥+fa +
0 + + + + - + + ::l + ~.p- + + 0 t of.
....J
0 0 I 2
LIQUID WATER CONCENTRATION (g/m3) (J-W)
Fig. 13. Liquid water concentrations measured by Johnson-Williams and Rosemount devices for 6 events in FY78 and 79.
36
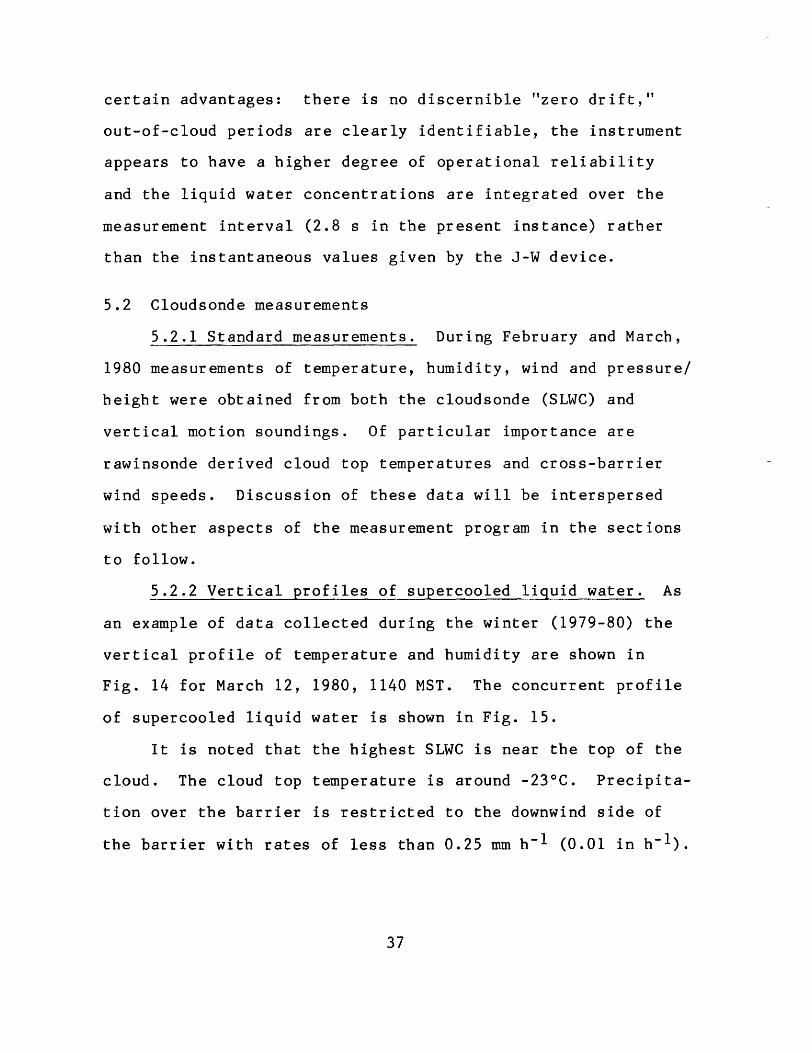
certain advantages: there is no discernible "zero drift,"
out-of-cloud periods are clearly identifiable, the instrument
appears to have a higher degree of operational reliability
and the liquid water concentrations are integrated over the
measurement interval (2.8 s in the present instance) rather
than the instantaneous values given by the J-W device.
5.2 Cloudsonde measurements
5.2.1 Standard measurements. During February and March,
1980 measurements of temperature, humidity, wind and pressure/
height were obtained from both the cloudsonde (SLWC) and
vertical motion soundings. Of particular importance are
rawinsonde derived cloud top temperatures and cross-barrier
wind speeds. Discussion of these data will be interspersed
with other aspects of the measurement program in the sections
to follow.
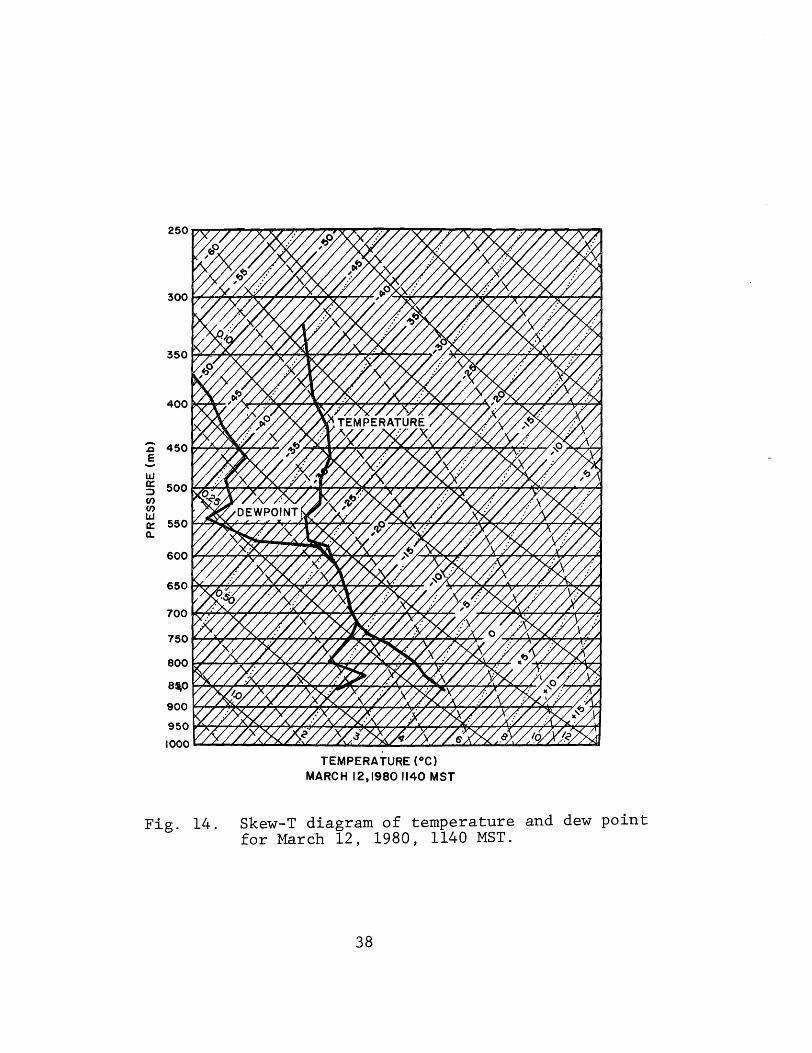
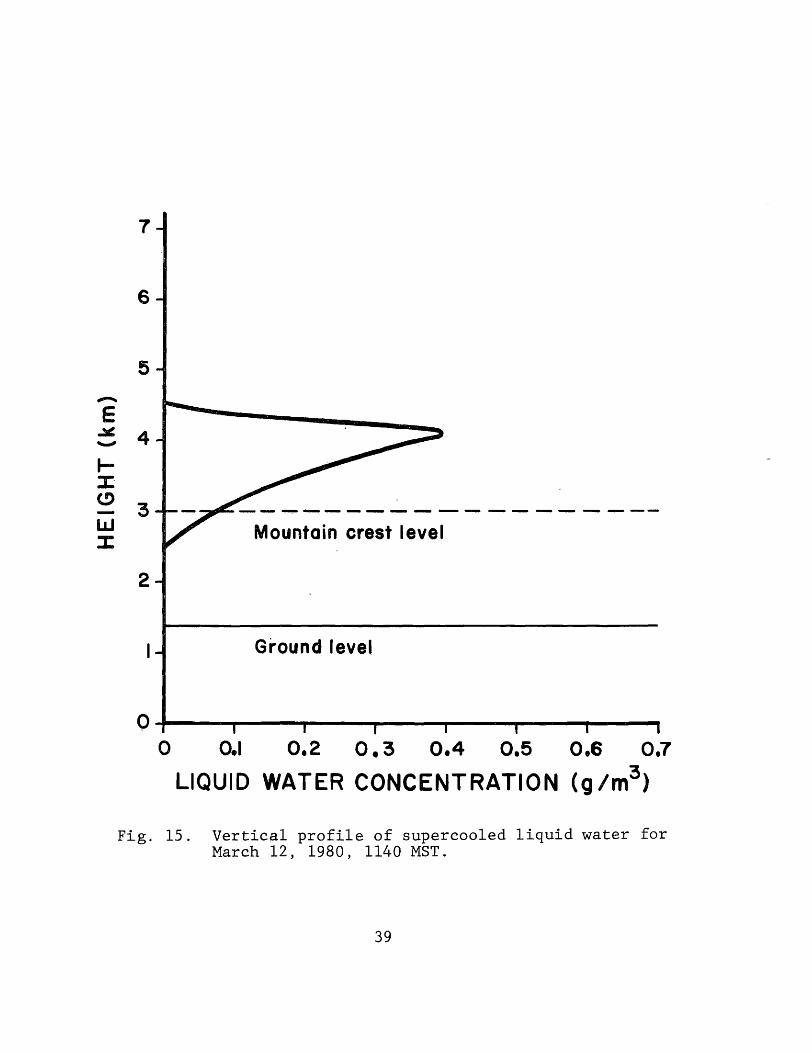
5.2.2 Vertical profiles of supercooled liquid ~ater. As
an example of data collected during the winter (1979-80) the
vertical profile of temperature and humidity are shown in
Fig. 14 for March 12, 1980, 1140 MST. The concurrent profile
of supercooled liquid water is shown in Fig. 15.
It is noted that the highest SLWC is near the top of the
cloud. The cloud top temperature is around -23°C. Precipita
tion over the barrier is restricted to the downwind side of
the barrier with rates of less than 0.25 mm h- 1 (0.01 in h- 1).
37
-.Q E
lIJ a::: :;) (f) (f)
lIJ a::: a..
500
600
8~0~~~~r7~~~~~~~~~~~~~~~/
900~~~T7~~~~~~~~~~~~~~~~~~~~
950~~~76~79~~~~~~~~~~~~~~~~~~~
1000~"~~~~~~~~~~~~~~~~~~~~~~~
TEMPERATURE (OC) MARCH 12,19801140 MST
Fig. 14. Skew-T diagram of temperature and dew point for March 12, 1980, 1140 MST.
38
7
6
5
----" ---------------Mountain crest level
2
Ground level
o~----~--~~--~----~----~----~--~ o 0.1 0.2 O. 3 0.4 0.5 0.6 0.7
LIQUID WATER CONCENTRATION (g 1m3 )
Fig. 15. Vertical profile of supercooled liquid water for March 12, 1980, 1140 MST.
39
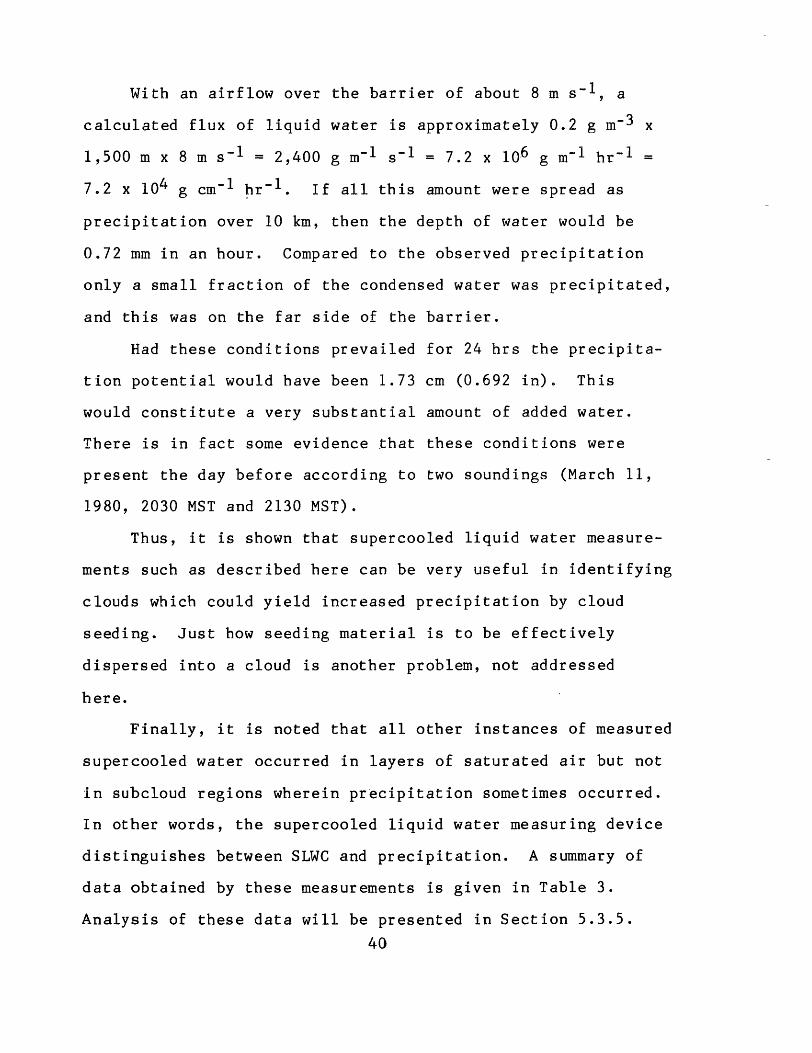
With an airflow over the barrier of about 8 m s-l, a
calculated flux of liquid water is approximately 0.2 g m- 3 x
1,500 m x 8 m s-1 = 2,400 g m- l s-1 = 7.2 x 10⁶ g m- 1 hr-l =
7.2 x 10⁴ g cm- l hr-l. If all this amount were spread as
precipitation over 10 km, then the depth of water would be
0.72 mm in an hour. Compared to the observed precip.itation
only a small fraction of the condensed water was precipitated,
and this was on the far side of the barrier.
Had these conditions prevailed for 24 hrs the precipita
tion potential would have been 1.73 cm (0.692 in). This
would constitute a very substantial amount of added water.
There is in fact some evidence that these conditions were
present the day before according to two soundings (March 11,
1980, 2030 MST and 2130 MST).
Thus, it is shown that supercooled liquid water measure-
ments such as described here can be very useful in identifying
clouds which could yield increased precipitation by cloud
seeding. Just how seeding material is to be effectively
dispersed into a cloud is another problem, not addressed
here.
Finally, it is noted that all other instances of measured
supercooled water occurred in layers of saturated air but not
in subcloud regions wherein precipitation sometimes occurred.
In other words, the supercooled liquid water measuring device
distinguishes between SLWC and precipitation. A summary of
data obtained by these measurements is given in Table 3.
Analysis of these data will be presented in Section 5.3.5.
40
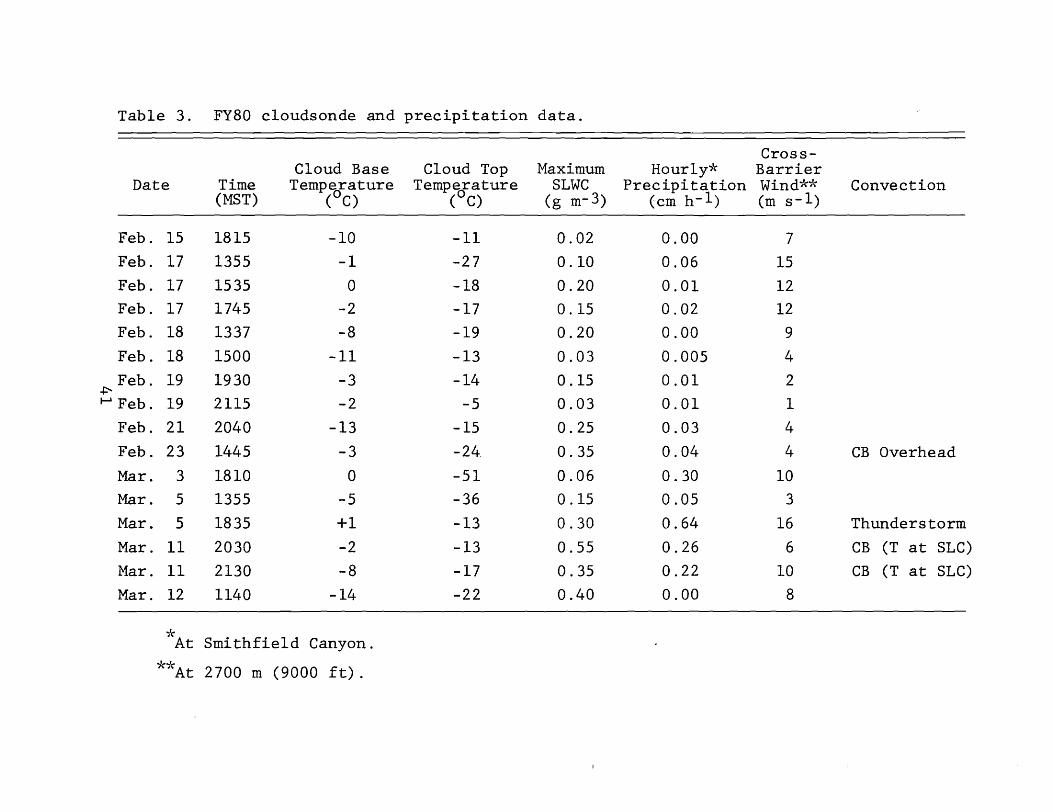
Table 3. FY80 c1oudsonde and precipitation data.
Cross-Cloud Base Cloud Top Maximum Hour1y"1c Barrier
Date Time Temperature Tempeorature SLWC Precipi tation Wind;'d( Convection (MST) (oC) ( C) (g m- 3) (cm h- 1) (m s-l)
Feb. 15 1815 -10 -11 0.02 0.00 7 Feb. 17 1355 -1 -27 0.10 0.06 15 Feb. 17 1535 0 -18 0.20 0.01 12 Feb. 17 1745 -2 -17 0.15 0.02 12 Feb. 18 1337 -8 -19 0.20 0.00 9
Feb. 18 1500 -11 -13 0.03 0.005 4 Feb. 19 1930 -3 -14 0.15 0.01 2
+:--t-J Feb. 19 2115 -2 -5 0.03 0.01 1
Feb. 21 2040 -13 -15 0.25 0.03 4 Feb. 23 1445 -3 -24. 0.35 0.04 4 CB Overhead
Mar. 3 1810 0 -51 0.06 0.30 10 Mar. 5 1355 -5 -36 0.15 0.05 3 Mar. 5 1835 +1 -13 0.30 0.64 16 Thunderstorm
Mar. 11 2030 -2 -13 0.55 0.26 6 CB (T at SLC) Har. 11 2130 -8 -17 0.35 0.22 10 CB (T at SLC) Mar. 12 1140 -14 -22 0.40 0.00 8
.J(
'At Smithfield Canyon.
**At 2700 m (9000 ft).
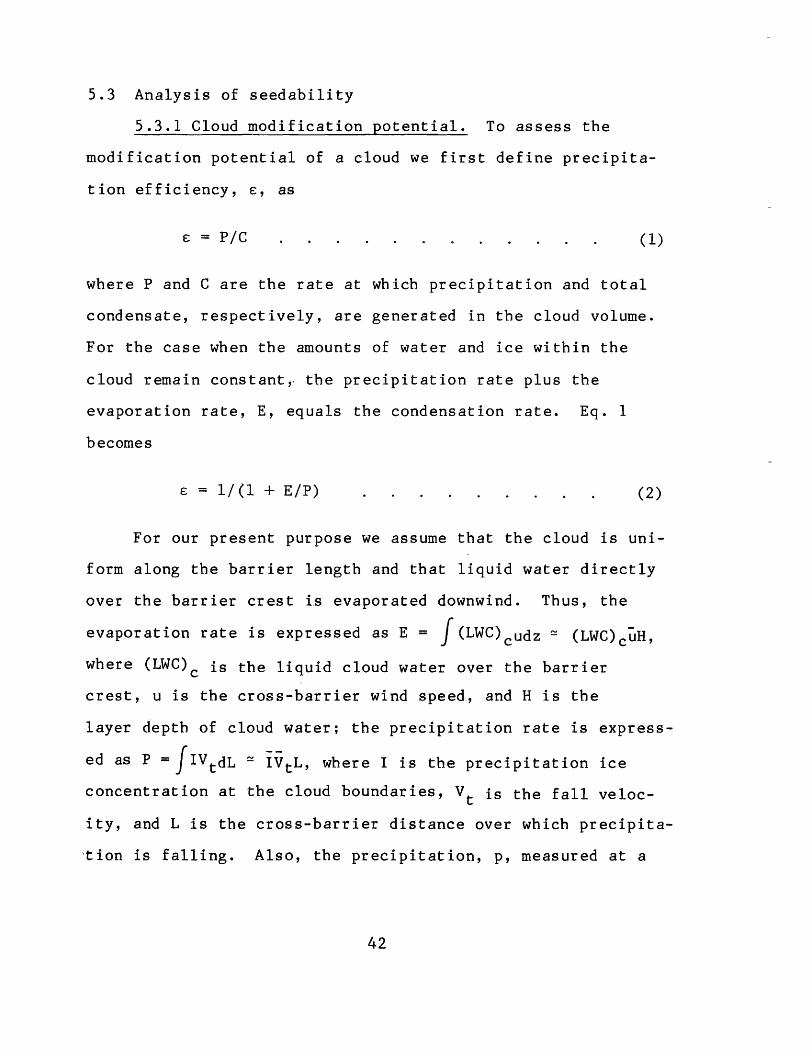
5.3 Analysis of seedability
5.3.1 Cloud modification potential. To assess the
modification potential of a cloud we first define precipita-
tion efficiency, E, as
E = PIC ( 1)
where P and C are the rate at which precipitation and total
condensate, respectively, are generated in the cloud volume.
For the case when the amounts of water and ice within the
cloud remain constant,- the precipitation rate plus the
evaporation rate, E, equals the condensation rate. Eq. 1
becomes
E = 1/(1 + E/P) (2)
For our present purpose we assume that the cloud is uni-
form along the barrier length and that liquid water directly
over the barrier crest is evaporated downwind. Thus, the
evaporation rate is expressed as E = J (LWC)cudz!::: (LWC)cuH , where (LWC)c is the liquid cloud water over the barrier
crest, u is the cross-barrier wind speed, and H is the
layer depth of cloud water; the precipitation rate is express-
ed as P = J1VtdL !::: IVtL, where I is the precipitation ice
concentration at the cloud boundaries, Vt is the fall veloc-
ity, and L is the cross-barrier distance over which precipita-
,tion is falling. Also, the precipitation, p, measured at a
42
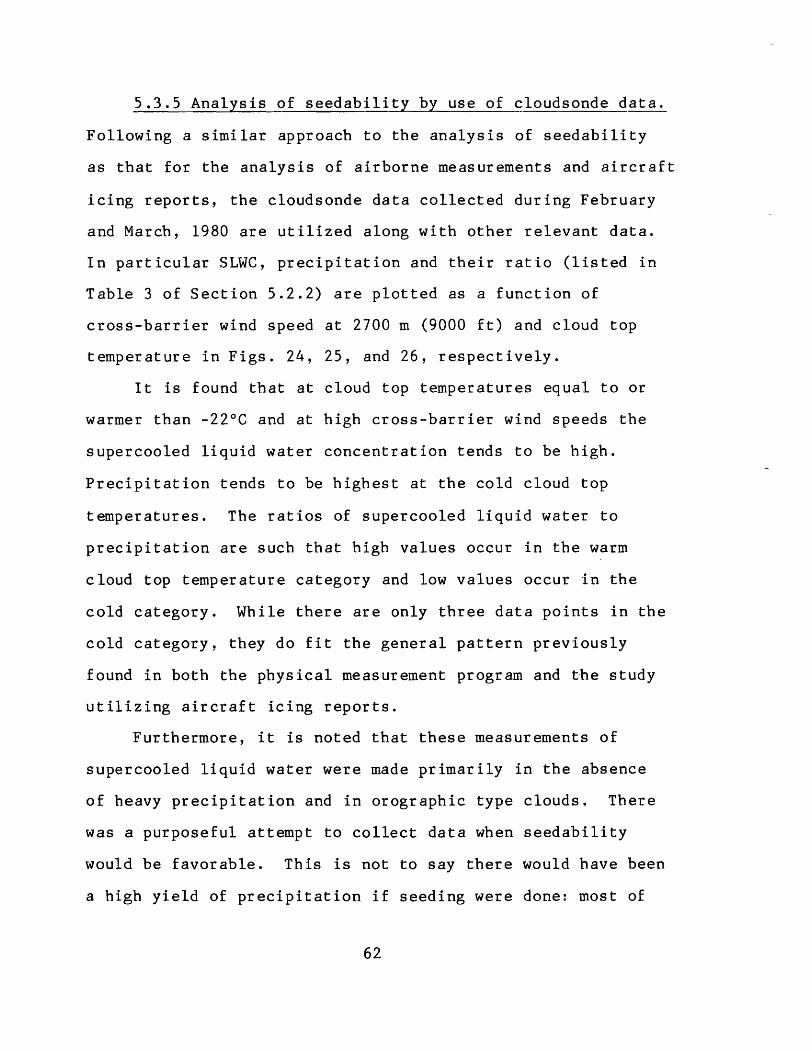
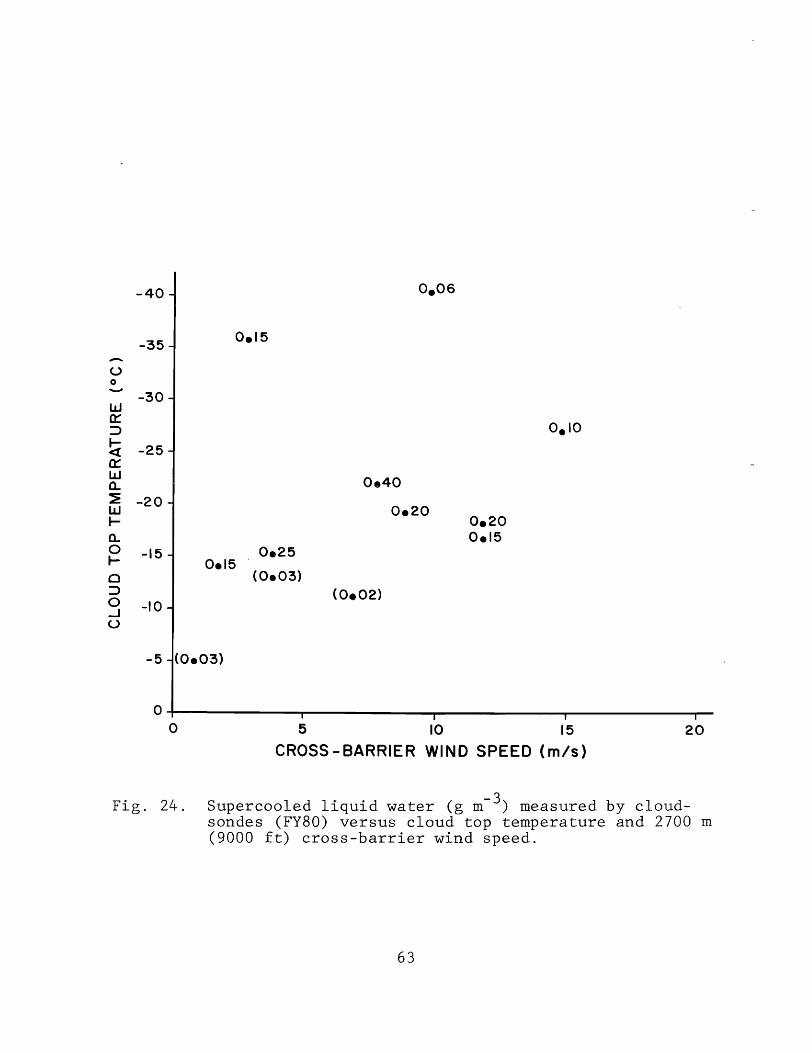
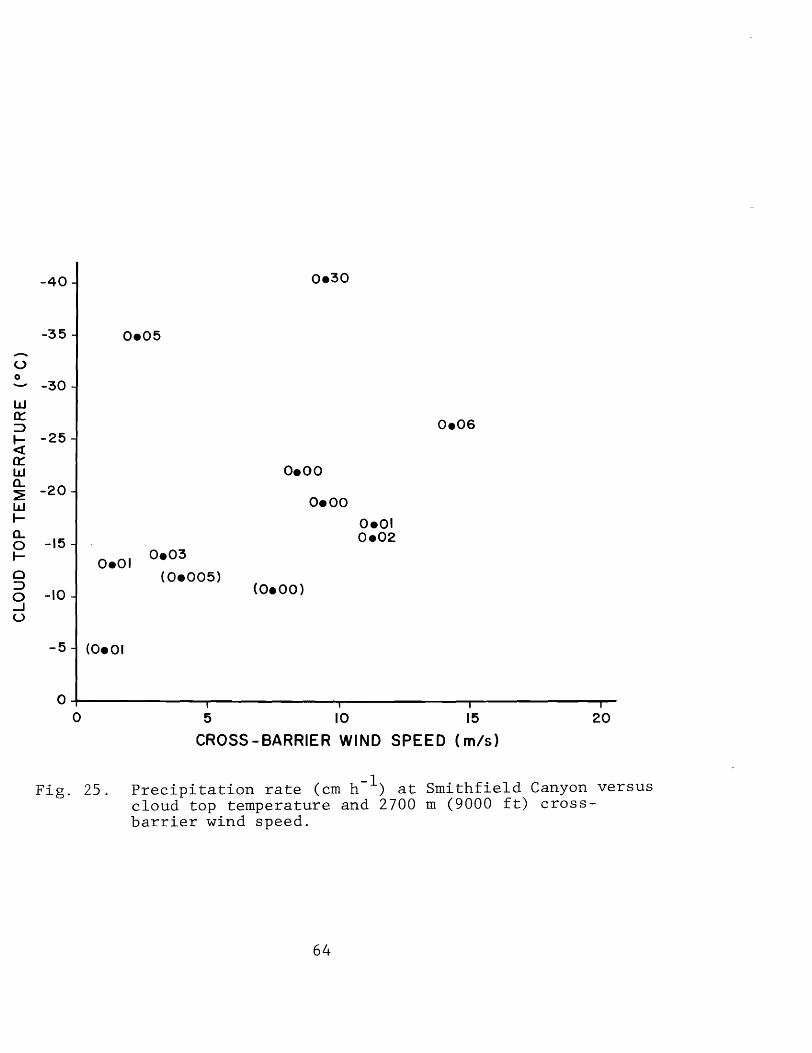
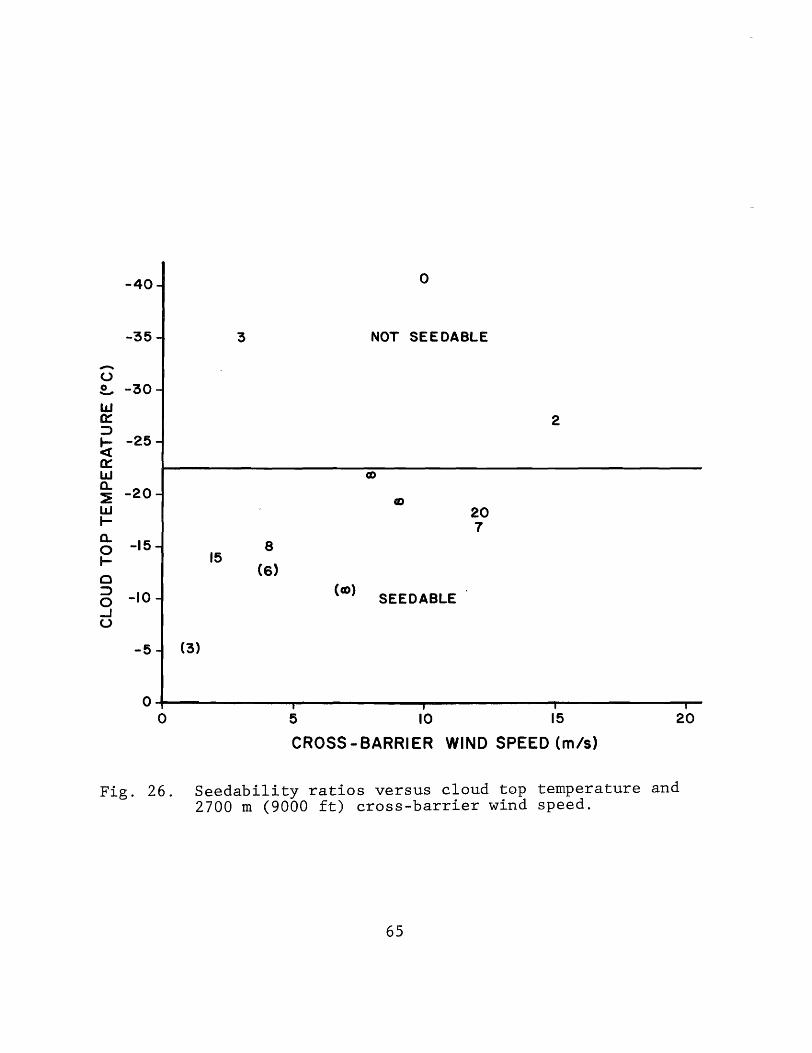
5.3.5 Analysis of seedability by use of cloudsonde data.
Following a similar approach to the analysis of seedability
as that for the analysis of airborne measurements and aircraft
icing reports, the cloudsonde data collected during February
and March, 1980 are utilized along with other relevant data.
In particular SLWC, precipitation and their ratio (listed in
Table 3 of Section 5.2.2) are plotted as a function of
cross-barrier wind speed at 2700 m (9000 ft) and cloud top
temperature in Figs. 24, 25, and 26, respectively.
It is found that at cloud top temperatures equal to or
warmer than -22°C and at high cross-barrier wind speeds the
supercooled liquid water concentration tends to be high.
Precipitation tends to be highest at the cold cloud top
temperatures. The ratios of supercooled liquid water to
precipitation are such that high values occur in the warm
cloud top temperature category and low values occur in the
cold category. While there are only three data points in the
cold category, they do fit the general pattern previously
found in both the physical measurement program and the study
utilizing aircraft icing reports.
Furthermore, it is noted that these measurements of
supercooled liquid water were made primarily in the absence
of heavy precipitation and in orographic type clouds. There
was a purposeful attempt to collect data when seedability
would be favorable. This is not to say there would have been
a high yield of precipitation if seeding were done: most of
62
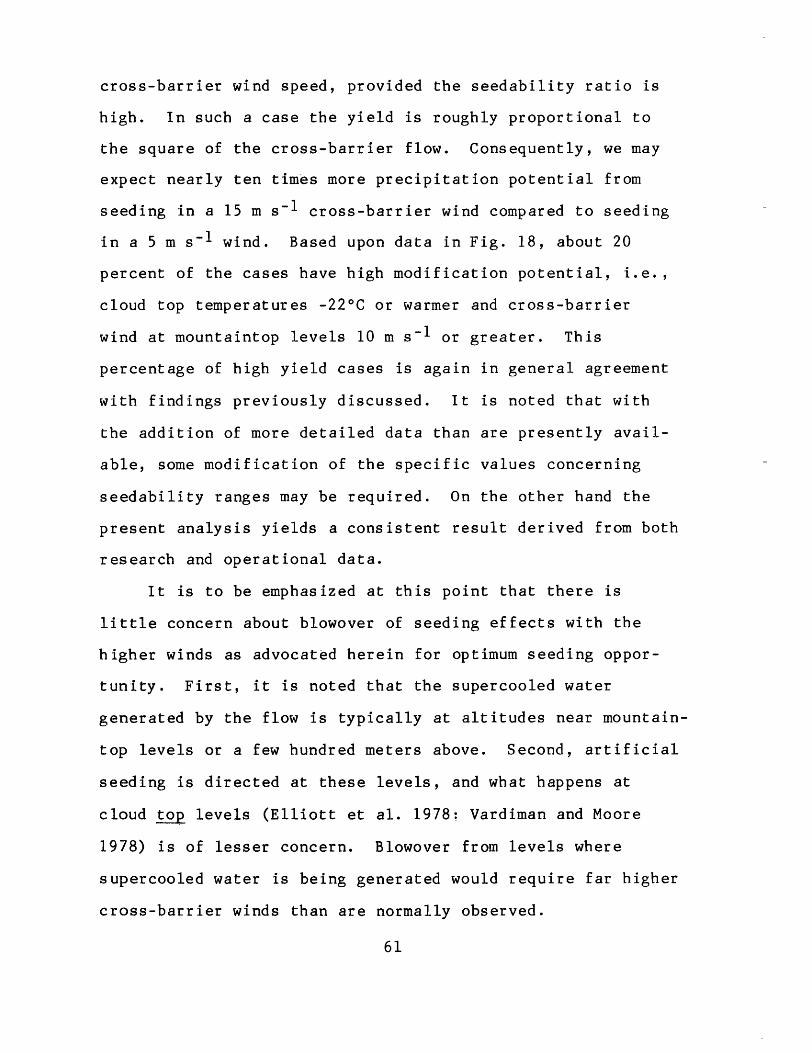
cross-barrier wind speed, provided the seedability ratio is
high. In such a case the yield is roughly proportional to
the square of the cross-barrier flow. Consequently, we may
expect nearly ten times more precipitation potential from
seeding in a 15 m s-l cross-barrier wind compared to seeding
in a 5 m s-l wind. Based upon data in Fig. 18, about 20
percent of the cases have high modification potential, i.e.,
cloud top temperatures -22°C or warmer and cross-barrier
wind at mountaintop levels 10 m s-l or greater. This
percentage of high yield cases is again in general agreement
with findings previously discussed. It is noted that with
the addition of more detailed data than are presently avail
able, some modification of the specific values concerning
seedability ranges may be required. On the other hand the
present analysis yields a consistent result derived from both
research and operational data.
It is to be emphasized at this point that there is
little concern about blowover of seeding effects with the
higher winds as advocated herein for optimum seeding oppor
tunity. First, it is noted that the supercooled water
generated by the flow is typically at altitudes near mountain
top levels or a few hundred meters above. Second, artificial
seeding is directed at these levels, and what happens at
cloud top levels (Elliott et ale 1978: Vardiman and Moore
1978) is of lesser concern. Blowover from levels where
supercooled water is being generated would require far higher
cross-barrier winds than are normally observed.
61
-<.) 0 -W 0:: :::::>
~ a::: w 0.. ::;E w l-e. g 0 :::::>
9 <.)
0* 1/ P -40 "* 0
-35 0 NOT SEEDABLE
0* <X> -30 0 0*
0* 0
-25
0* OJ
* 2
-20 000* en
ro (()
I <0 7
5 <Xl 0* (X)
-15 0* *2 000
* 0 0 00 8
-10 ro SEEDABLE
-05
00 00 5 10 15 ,20
WEST WIND COMPONENT AT 700 mb (m S-I),
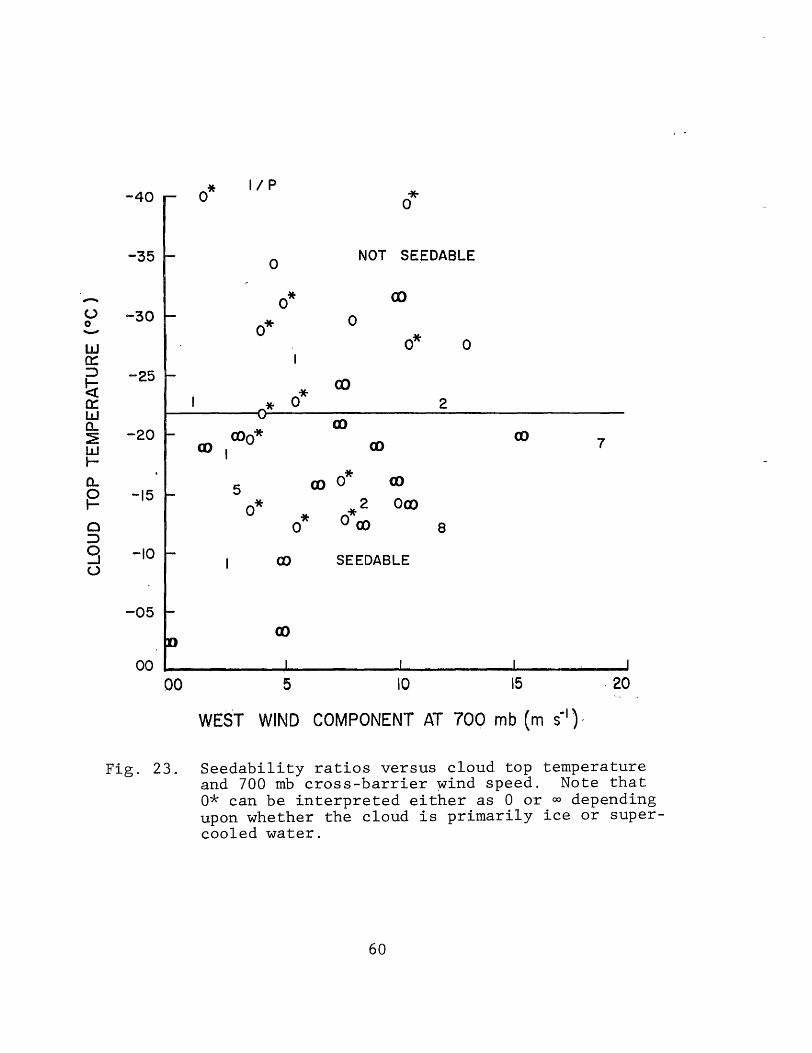
Fig. 23. Seedability ratios versus cloud top temperature and 700 mb cross-barrier ~ind speed. Note that 0* can be interpreted either as a or 00 depending upon whether the cloud is primarily ice or supercooled water.
60
-40
-35
-(.) -30 o -w a: ::l -25 ~ 0:: W
~ -20 w .-
-15·
-10
-05
00
o
00
o o
SILVER LAKE - BRIGHTON
8 AVERAGE PRECIPITATION (tenths mm h-')
o o 17 o
o 17 13
o 4 0 8 o o
00 ·0 8
o 4 o
4 0 0 0
o 4 17 0 o 0 0 4
13 0
o
5 10 15 20
WEST WIND COMPONENT AT 700 mb (m 5")
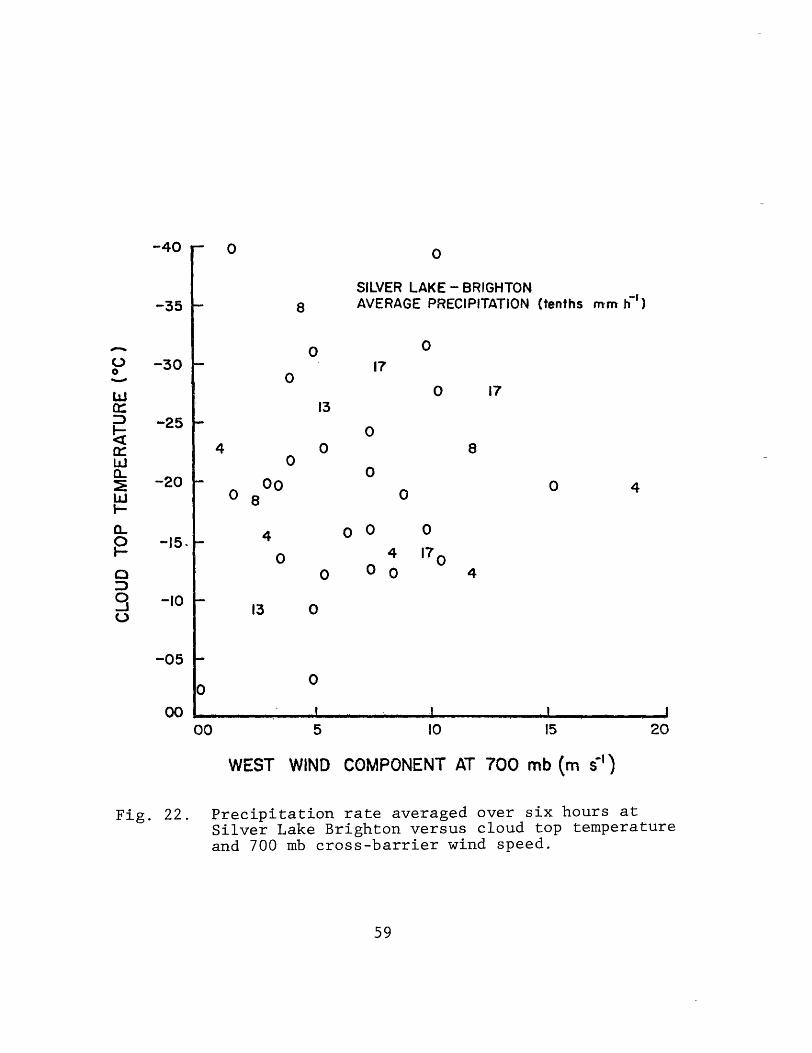
Fig. 22. Precipitation rate averaged over six hours at Silver Lake Brighton versus cloud top temperature and 700 mb cross-barrier wind speed.
59
and the supercooled water it'self is roughly proportional to
the wind speed, the flux of supercooled water is on an
empirical basis approximately proportional to the square of
the wind speed.
To assess seedability, the precipitation and seedability
ratios are shown in Figs. 22 and 23, respectively. The
seedability ratio shows a marked change on either side of a
cloud top temperature of about -22°C. At warmer temperatures
the ratio is high; at lower temperatures the ratio is low.
The zeros marked with asterisks indicate neither icing nor
precipitation was observed. However, either supercooled
water or ice crystals could be present, depending upon the
composition of the cloud.
Standardization of icing rates according to the number
of daily takeoffs and landings at Salt Lake City resulted in
very little change in the results. In particular, four of
the values on Fig. 23 would be changed by 1 unit, e.g. ~ 5
becomes 6; thus the air traffic is rather consistent within
the days considered herein.
As indicated previously there are two considerations in
establishing seeding opportunities. One is the seedability
ratio, which is indicated by the total supercooled water
compared to the precipitating ice; the other consideration is
the total yield of precipitation if seeding were completely
effective. The first quantity is determined solely by cloud
top temperature. The second quantity is determined by the
58
o w -' o o U 0:: W a.. :::> CI)
CTT ~ -22°C
25 ~ (23) (9) 25 ~
(13) (6)
20 f- 20 I-
15 I- 15 I-
10 f- 10 I-
5 f- 5 f-
o L..-__ --" ___ --'-___ o L...-__ ----L.. ___ -'-_
o 10 20 0 10 20
CROSS BARRIER WIND SPEED (m 5-1)
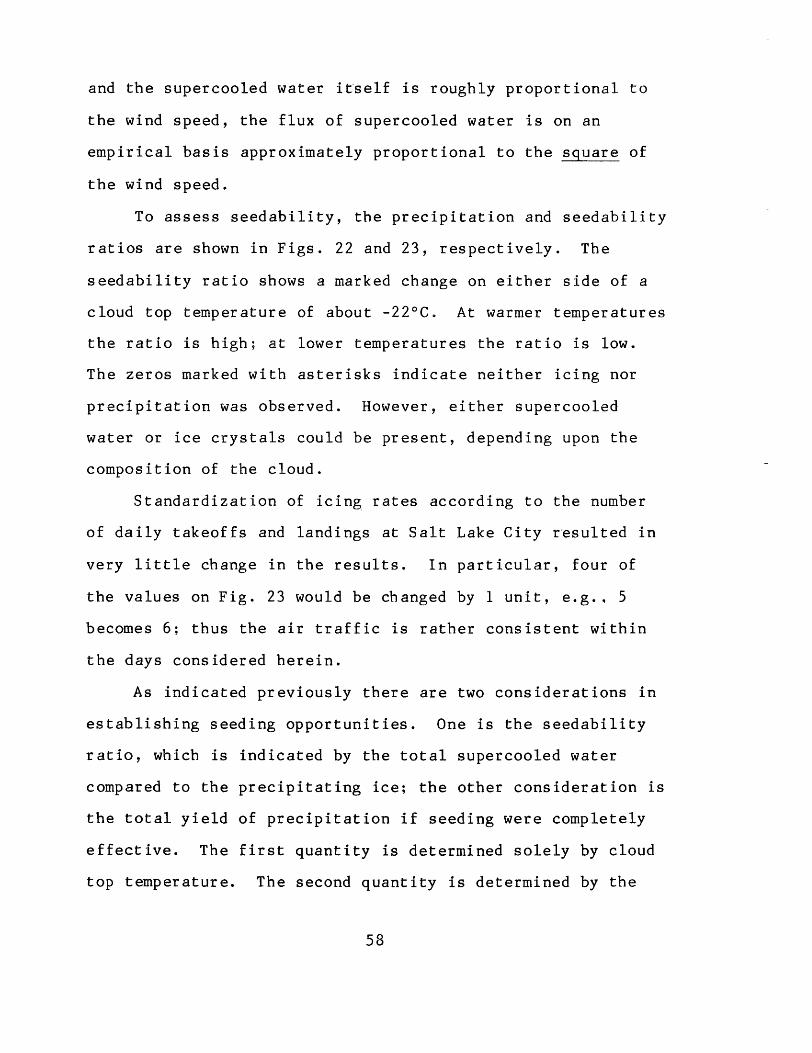
Fig. 21. Histograms of (average) supercooled water parameter versus cross-barrier wind speed for warm and cold cloud top temperatures.
57
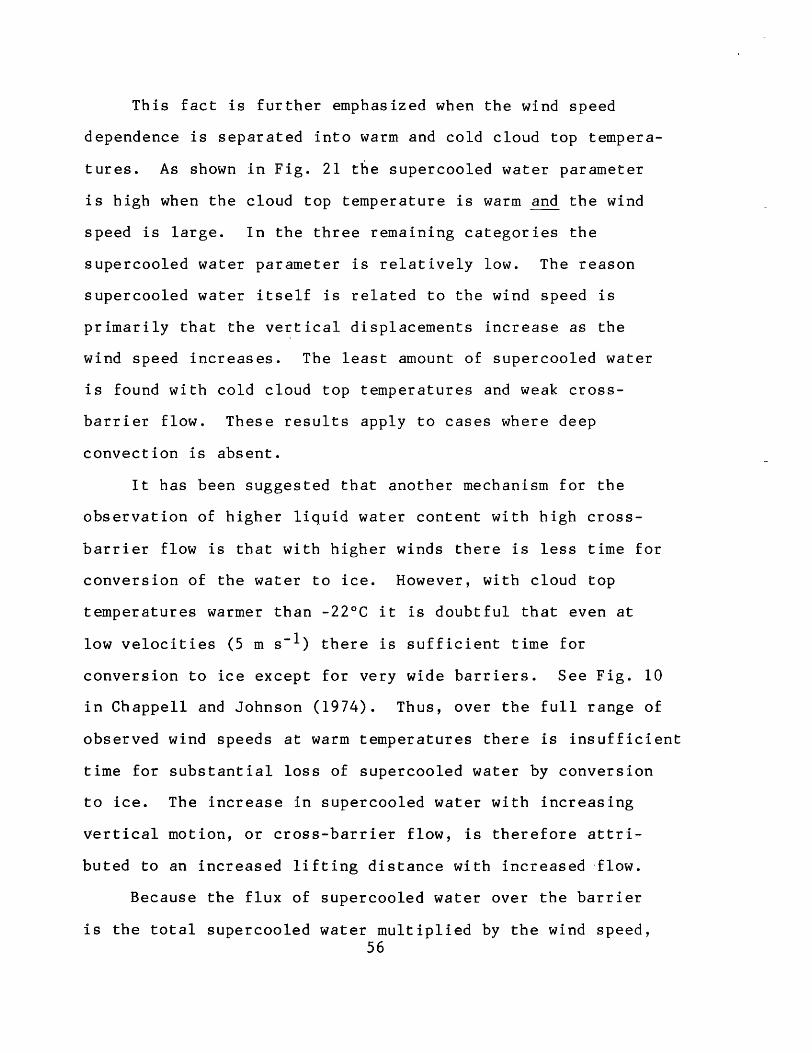
This fact is further emphasized when the wind speed
dependence is separated into warm and cold cloud top tempera
tures. As shown in Fig. 21 the supercooled water parameter
is high when the cloud top temperature is warm and the wind
speed is large. In the three remaining categories the
supercooled water parameter is relatively low. The reason
supercooled water itself is related to the wind speed is
primarily that the vertical displacements increase as the
wind speed increases. The least amount of supercooled water
is found with cold cloud top temperatures and weak cross
barrier flow. These results apply to cases where deep
convection is absent.
It has been suggested that another mechanism for the
observation of higher liquid water content with high cross-
barrier flow is that with higher winds there is less time for
conversion of the water to ice. However, with cloud top
temperatures warmer than -22°C it is doubtful that even at
low velocities (5 m s-l) there is sufficient time for
conversion to ice except for very wide barriers. See Fig. 10
in Chappell and Johnson (1974). Thus, over the full range of
observed wind speeds at warm temperatures there is insufficient
time for substantial loss of supercooled water by conversion
to ice. The increase in supercooled water with increasing
vertical motion, or cross-barrier flow, is therefore attri-
buted to an increased lifting distance with increased -flow.
Because the flux of supercooled water over the barrier
is the total supercooled water multiplied by the wind speed, 56
20 a:: w r-w ~ « a::: 15 ~ (4) (20 ) ( 19 ) ( 8 )
0:: W
~ :: 10 0 W -.J 0 0 U a::: 5 w Cl.. ::J en
o -10 -20 -30 -40
CLOUD-TOP TEMPERATURE (OC)
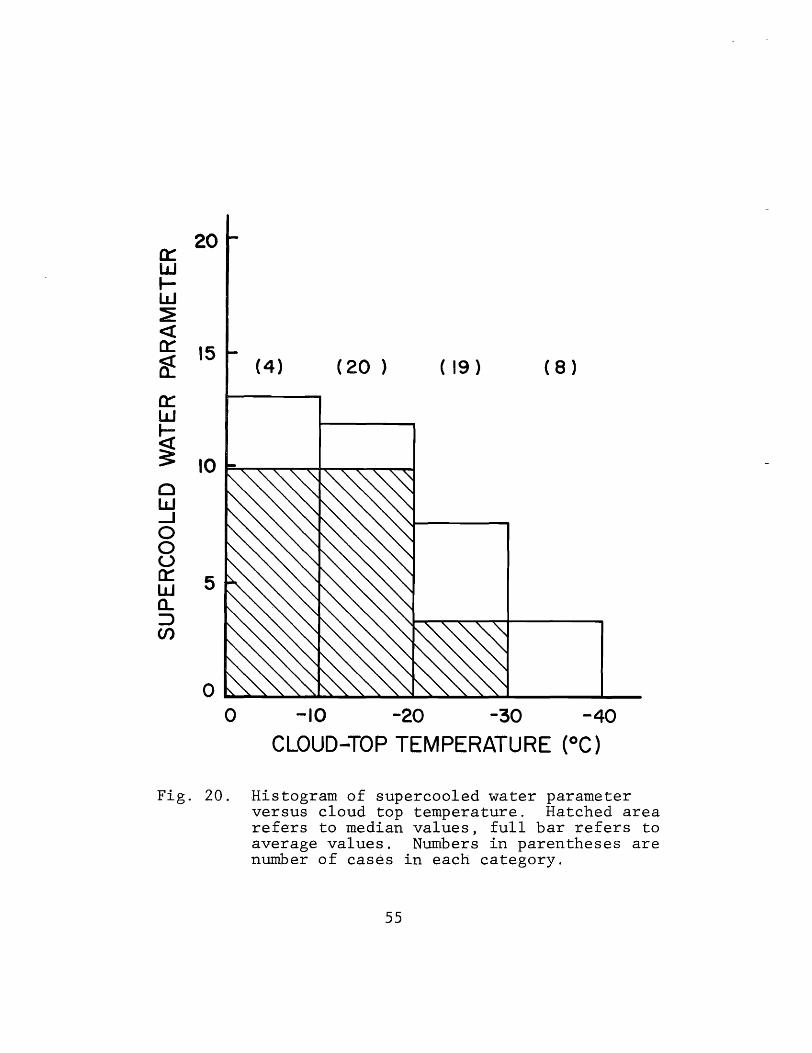
Fig. 20. Histogram of supercooled water parameter versus cloud top temperature. Hatched area refers to median values, full bar refers to average values. Numbers in parentheses are number of cases in each category.
55
a::: w
20
r- 15 w ~ « a:: ~ a:: 10 w ~ ~ Cl w 6 5 o u a:: w a.. :::> CJ) 0
( 17) (19 ) (II) (4 )
o 5 10 15 20
CROSS-BARRIER WIND SPEED (m 5-1)
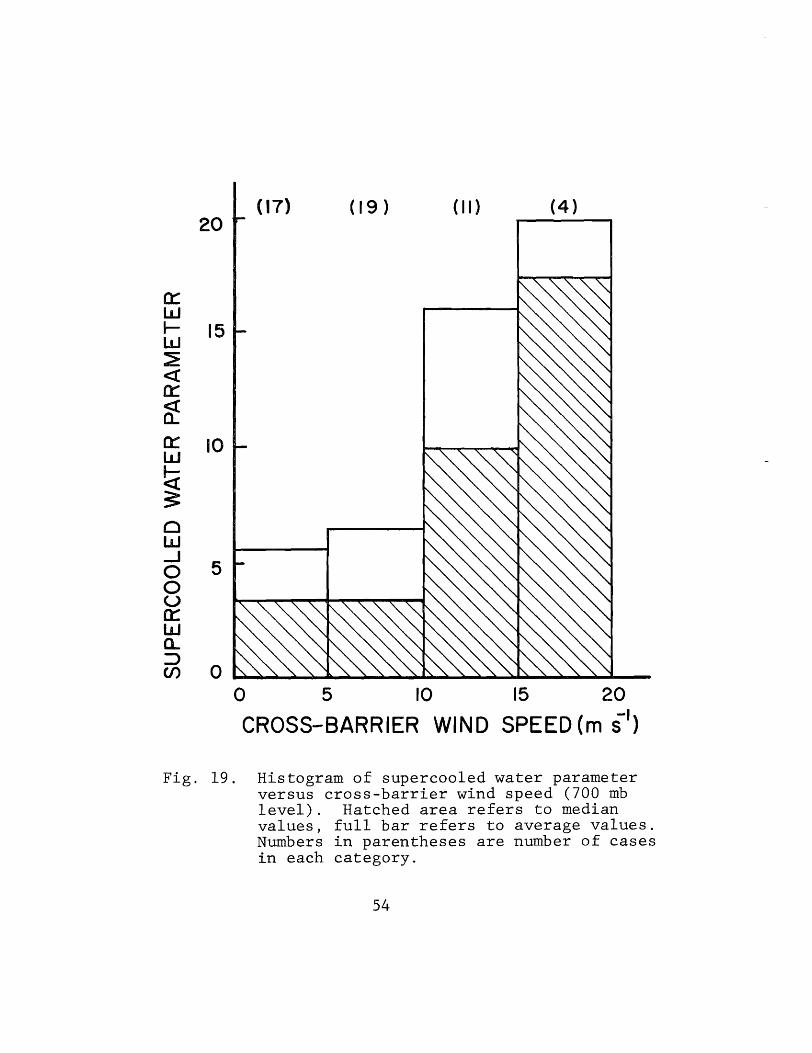
Fig. 19. Histogram of supercooled water parameter versus cross-barrier wind speed (700 mb level). Hatched area refers to median values, full bar refers to average values. Numbers in parentheses are number of cases in each category.
54
-40
-35
-U -30 o -LaJ 0:: :::> ~ 0::: W 0.. :?! w I-0.. g I
C :::> 9 u
-25
-20
-15-
-10
-05
00 3
00
o
17
AVERAGE ICING (mm 100 Km-I h-I)
o
o 3
o
o
I~ o
7
7
15 0
o 17
7 o 0 3
3
5
o 3
18
7
10
7
38
15
WEST WIND COMPONENT AT 700 mb (m 5')
20
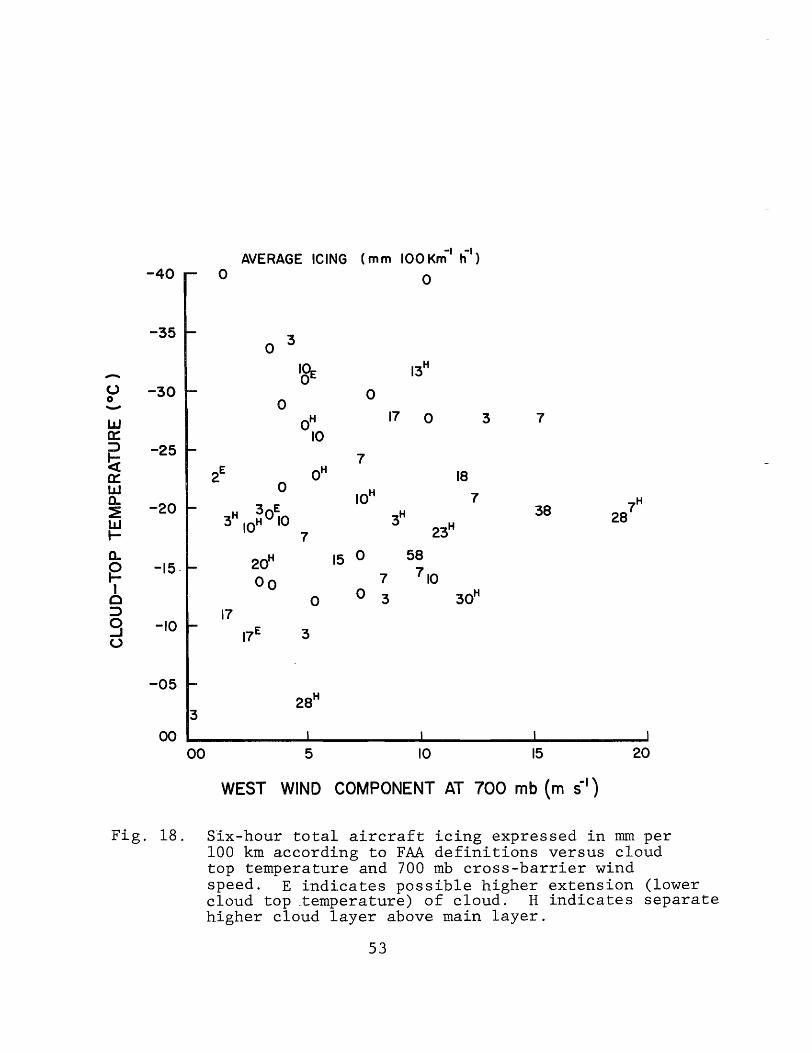
Fig. 18. Six-hour total aircraft icing expressed in mm per 100 km according to FAA definitions versus cloud top temperature and 700 mb cross-barrier wind speed. E indicates possible higher extension (lower cloud top .temperature) of cloud. H indicates separate higher cloud layer above main layer.
53
percent r.h. criteria are used to find the base and top of a
layer. A 50 mb separation is required for a separate layer,
otherwise the cloud is treated as a single entity.
5.3.4 Results of preliminary test of seedability criteria.
The results for aircraft icing are shown in Fig. 18. The
cloud top temperatures used in this figure are those for the
main layer based upon 100 percent r.h. If the cloud top
temperature decreases by more than 3°e when a 90 percent r.h.
criterion is used the data entered on the graph are marked
with an liE," for possible extension of the cloud top. Clouds
with a higher layer above are marked with an H. Also, all
convection cases are omitted. However, the full data are
available for inspection from Table 5; even when such data
are included, the results are not substantially changed,
though a more clear-cut distribution of supercooled water is
obtained with convection cases omitted.
A histogram of supercooled water as indicated by aircraft
icing is shown in Fig. 19 according to cross-barrier wind
speed at 700 mb without regard for cloud top temperature. In
Fig. 20 a histogram of supercooled water is shown according
to cloud top temperature without regard for wind speed. In
both of these figures a strong dependence of the supercooled
water parameter with the other variable is evident. The
greatest amount of supercooled water is found when the cloud
top temperature is relatively warm and the cross-barrier flow
at mountaintop is strong.
52
temperatures are found for both a 100 percent and a 90
percent relative humidity (r.h.) with respect to ice. If the
cloud top temperature derived on the basis of a 90 percent
r.h. is substantially different from one derived using 100
percent r.h., then such a case is specially identified. As
will be shown later, in some instances even a substantial
difference in cloud top temperature will have little effect
on whether a cloud is seedab1e or not.
The representativeness in time and space of rawinsonde
determined cloud top temperatures is certainly affected by
whether or not cellular convection is present. In the
vicinity of cumulonimbus clouds, a sounding mayor may not
penetrate a deep cloud: the resulting cloud top temperature
may therefore depart greatly from the coldest cloud top
temperature. Furthermore, the occurrence of supercooled
water in deep convection is related to the stage of develop
ment of the cloud rather than factors related to orographic
flow. Consequently, cases with cumulonimbus clouds are
identified in Table 5. To do this hourly and sp~cia1 reports
from Salt Lake City during the six hour period centered on
0000 GMT are used. Any single report of CB or thunderstorm
reported at or within observing distance of Salt Lake City
results in a classification of convective activity. Twenty
two such cases were found.
The occurrence of multiple layers is found in a similar
way as with the main cloud layer. Both 90 percent and 100
51
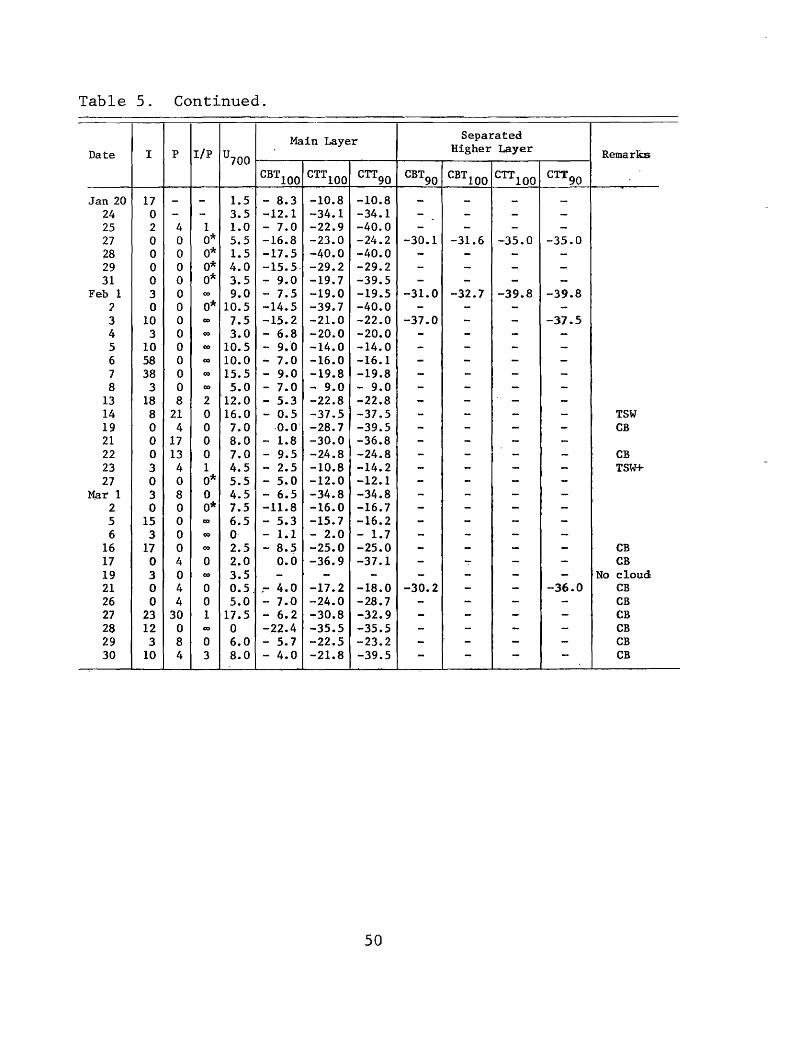
Table 5. Continued.
Main Layer Separated
Date I P lip U700 Higher Layer Remarks
CBT100 CTTIOO CTT90 CBT90 CBT100 CTT100 CTT90
Jan 20 17 - - 1.5 - 8.3 -10.8 -10.8 - - - -24 0 - - 3.5 -12.1 -34.1 -34.1 - - - --25 2 4 1 1.0 - 7.0 -22.9 -40.0 - - - -27 0 0 0* 5.5 -16.8 -23.0 -24.2 -30 .. 1 -31.6 -35.0 -35.0 28 0 0 0* 1.5 -17.5 -40.0 -40.0 - - - -29 0 0 0* 4.0 -15.5· -29.2 -29.2 - - - -31 0 0 0* 3.5 - 9.0 -19.7 -39.5 - - - -
Feb 1 3 0 (0 9.0 - 7.5 -19.0 -19 .. 5 -31.0 -32.7 -39.8 -39.8 ') 0 0 0* 10.5 -14.5 -39.7 -40.0 - - - -3 10 0 (0 7.5 -15.2 --21.0 -22.0 -37.0 - - -37.5 4 3 0 00 3.0 - 6.8 -20.0 -20.0 - - - -5 10 0 co 10.5 - 9."0 -14.0 -14.0 - - - -6 58 0 co 10.0 - 7.0 -16.0 -16.1 - - - -7 38 0 co 15.5 - 9.0 -19.8 -19.8 - - - -8 3 0 co 5.0 - 7.0 - 9.0 - 9.0 - - - -
13 18 . 8 2 12.0 - 5.3 -22.8 -22.8 - - - -14 8 21 0 16.0 - 0.5 -37.5 -37.5 - - - - TSW 19 0 4 0 7.0 ·0.0' -28.7 -39.5 - - - - CB 21 0 17 0 8.0 -. 1.8 -30.0 -36.8 - - - -22 0 13 0 7.0 - 9.5 -24.8 -24.8 - - - - CB 23 3 4 1 4.5. - 2.5 -10.8 -14.2 - - - - TSW+ 27 0 0 0* 5.5 - 5.0 -12.0 -12.1 - - - -
Mar 1 3 8 0 4.5 - 6.5 -34.8 -34.8 - - - -2 0 0 0* 7.5 -11.8 -16.0 -16.7 - - - -5 15 0 co 6.5 - 5.3 -15.7 -16.2 - - - -6 3 0 co 0 - 1.1 - 2.0 - 1.7 - - - -
16 17 0 00 2.5 - 8.,? -25.0 -25.0 - - - - CB 17 0 4 0 2.0 0.0 -36.9 -37.1 - -:- - - CB 19 3 0 co 3.5 - - - - - - - No cloud 21 0 4 0 0.5. .- 4.0 -17.2 -18.0 -30.2 - - -36.0 CB 26 0 4 0 5.0 - 7.0 -24.0 -28.7 - - - - CB 27 23 30 1 17.5 - 6.2 -30.8 -32.9 - - - - CB 28 12 0 co 0 -22.4 -35.5 -35.5 - - - - CB 29 3 8 0 6.0 - 5.7 -22,,5 -23.2 - - - - CB 30 10 4 3 8.0 - 4.0 -21.8 -39.5 - - - - CB
50
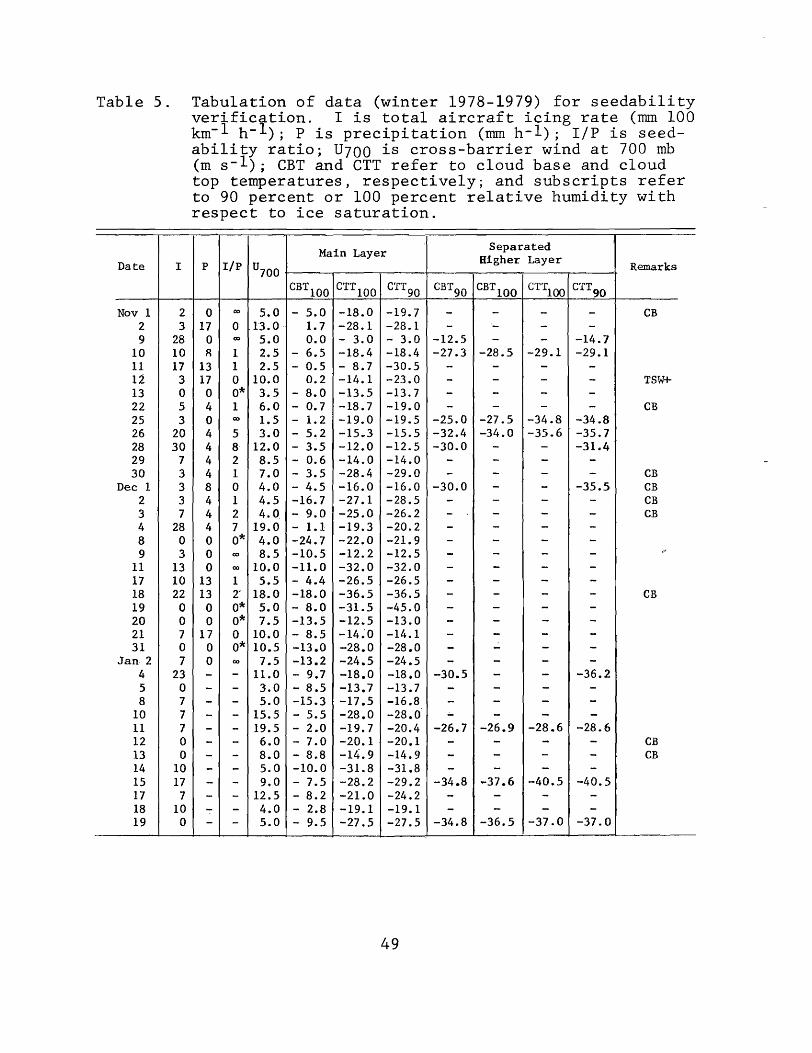
Table 5. Tabulation of data (winter 1978-1979) for seedability verification. I is total aircraft icing rate (mm 100 km-l h- l ); P is precipitation (mm h-l); liP is seedability ratio; U700 is cross-barrier wind at 700 rob (m s-l); CBT and CTT refer to cloud base and cloud top temperatures, respectively; and subscripts refer to 90 percent or 100 percent relative humidity with respect to ice saturation.
Separated I
Main Layer Date I p IIp U700
Higher Layer Remarks
CBT100 CTT 100 CT!90 CBT90 CBT100 CTT100 CTT90
Nov 1 2 0 00 5.0 - 5.0 -18.0 -19.7 - - - - CB 2 3 17 0 13.0· 1.7 -28.1 -28.1 - - - -9 28 0 00 5.0 0.0 - 3.0 - 3.0 -12.5 - - -14.1
10 10 R 1 2.5 - 6.5 -18.4 -18.4 -27.3 -28.5 -29.1 -29.1 11 17 13 1 2.5 - 0.5 - 8.7 -30.5 - - - -12 3 17 0 10.0 0.2 -14.1 -23.0 - - - - TSW+ 13 0 0 0* 3.5 - 8.0 -13.5 -13.7 - - - -22 5 4 1 6.0 - 0.7 -18.7 -19.0 - - - - CB 25 3 0 00 1.5 - 1.2 -19.0 -19.5 -25.0 -27.5 -34.8 -34.8 26 20 4 5 3.0 - 5~2 -15.3 -15.5 -32.4 -34.0 -35.6 -35.7 28 30 4 B- 12.0 - 3.5 -12.0 -12.5 -30.0 - - -31.4 29 7 4 2 8.5 - 0.6 -14.0 -14.0 - - - -30 3 4 1 7.0 - 3.5 -28.4 -29.0 - - - - CB
Dec 1 3 8 0 4.0 - 4.5 -16.0 -16.0 -30.0 - - -35.5 CB 2 3 4 1 4.5 -16.7 -27.1 -28.5 - - - - CB 3 7 4 2 4.0 - 9.0 -25.0 -26.2 - - - - CB 4 28 4 7 19.0 - 1.1 -19.3 -20.2 - - - -8 0 0 0* 4.0 -24.7 -22.0 -21. 9 - - - -9 3 0 00 8.5 -10.5 -12.2 -12.5 - - - - ,-
II 13 0 00 10.0 -11.0 -32.0 -32.0 . - - - -17 10 13 1 5.5 - 4.4 -26.5 -26.5 - - - -18 22 13 2' 18.0 -18.0 -36.5 -36.5 - - - - CB 19 0 0 0* 5.0 - 8.0 -31.5 -45.0 - - - -20 0 0 0* 1.5 -13.5 -12.5 -13.0 - - - -21 7 17 0 10.0 - 8.5 -14~0 -14.1 - - - -31 0 0 0* 10.5 -13.0 -28.0 -28.0 - - - -
Jan 2 7 0 00 7.5 -13.2 -24.5 -24.5 - - - -4 23 - - 11.0 - 9.7 -18.0 -18.0 -30.5 - - -36.2 5 0 - - 3.0 - 8.5 -13.1 -13.7 - - - -8 7 - - 5.0 -15.3 -17.5 -16.8 - - - -
10 7 - - 15.5 - 5.5 -28.0 -28.0 .;.. - - -11 7 - - 19.5 - 2.0 -19.7 -20.4 -26.7 -26.9 -28.6 -28.6 12 0 - - 6.0 - 7.0 -20.1 . -20.1 - - - - CB 13 O· - - 8.0 - 8.8 -14.9 -14.9 - - - - CB 14 10 - - 5.0 -10.0 -31.8 -31.8 - - - -15 17 - - 9.0 - 7.5 -28.2 -29.2 -34.8 -37.6 -40.5 -40.5 17 7 - - 12.5 - 8.2 -21.0 -24.2 - - - -18 10 - - 4.0 - 2.8 -19.1 -19.1 - - - -19 0 - - 5.0 - 9.5 -27.5 -27.5 -34.8 -36.5 -37.0 -37.0
49
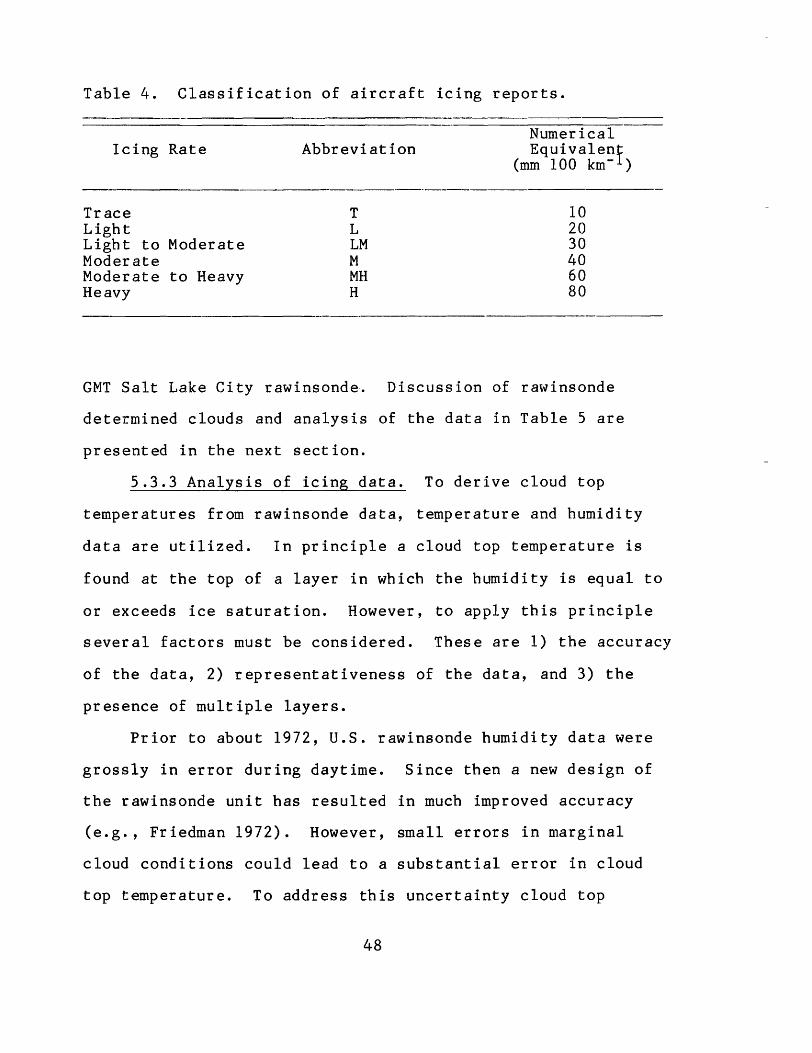
Table 4. Classification of aircraft icing reports.
Icing Rate
Trace Light Light to Moderate Moderate Moderate to Heavy Heavy
Abbreviation
T L LM M MH H
Numerical Equivalen£
(mm 100 km- )
10 20 30 40 60 80
GMT Salt Lake City rawinsonde. Discussion of rawinsonde
determined clouds and analysis of the data in Table 5 are
presented in the next section.
5.3.3 Analysis of icing data. To derive cloud top
temperatures from rawinsonde data, temperature and humidity
data are utilized. In principle a cloud top temperature is
found at the top of a layer in which the humidity is equal to
or exceeds ice saturation. However, to apply this principle
several factors must be considered. These are 1) the accuracy
of the data, 2) representativeness of the data, and 3) the
presence of mUltiple layers.
Prior to about 1972, u.S. rawinsonde humidity data were
grossly in error during daytime. Since then a new design of
the rawinsonde unit has resulted in much improved accuracy
(e.g., Friedman 1972). However, small errors in marginal
cloud conditions could lead to a substantial error in cloud
top temperature. To address this uncertainty cloud top
48
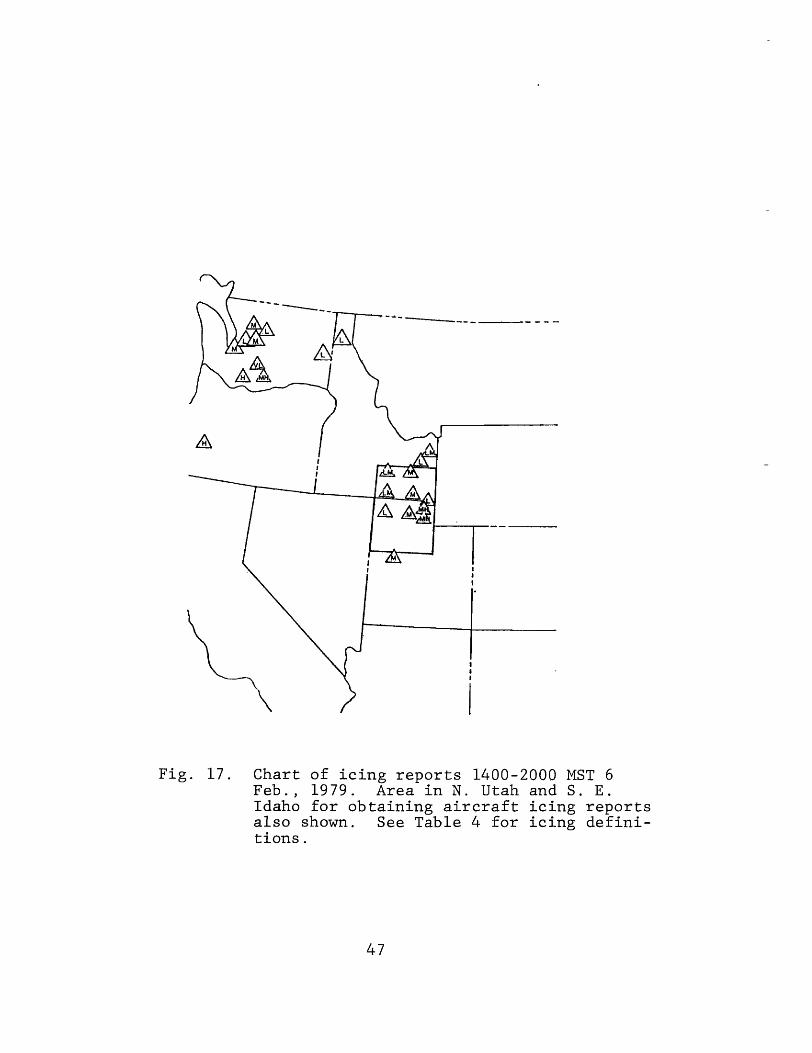
Fig. 17. Chart of icing reports 1400-2000 MST 6 Feb., 1979. Area in N. Utah and S. E. Idaho for obtaining aircraft ~c~ng reports also shown. See Table 4 for icing definitions.
47

In view of the foregoing, an area in the vicinity of N.
Utah has been selected for obtaining aircraft icing reports
to be used in the analysis. The area was chosen as small as
possible for suitable representativeness, but large enough to
obtain adequate sample sizes. For each day during winter
period, November 1978 through March 1979, aircraft icing
reports were tabulated for a period three hours before
and three hours after the 0000 GMT Salt Lake City rawinsonde.
The 1200 GMT soundings were not evaluated because there are
very few aircraft reports at that time. A chart of aircraft
icing reports in a highly seedable situation is shown for the
six hour period on 6 February, 1979 in Fig. 17.
In processing the aircraft reports a standard method was
adopted to quantify them. First, the icing rate designation
for an individual report was established according to Federal
Aviation Administration guidelines. These are listed in
Table 4 (in metric units). Next, the icing rates were summed
for all reports within the designated area and within the six
hour period, so one value per day is found. All icing
reports were quantified and an overall sum obtained for each
six hour period, prior to any other data analysis.
Then the 700 mb wind, precipitation at Silver Lake
Brighton over the same six hour period and cloud temperatures
were tabulated; the relevant data are listed in Table 5. In
this table, all dates are listed when either aircraft icing
is reported or a cloud is present as determined by the 0000
46
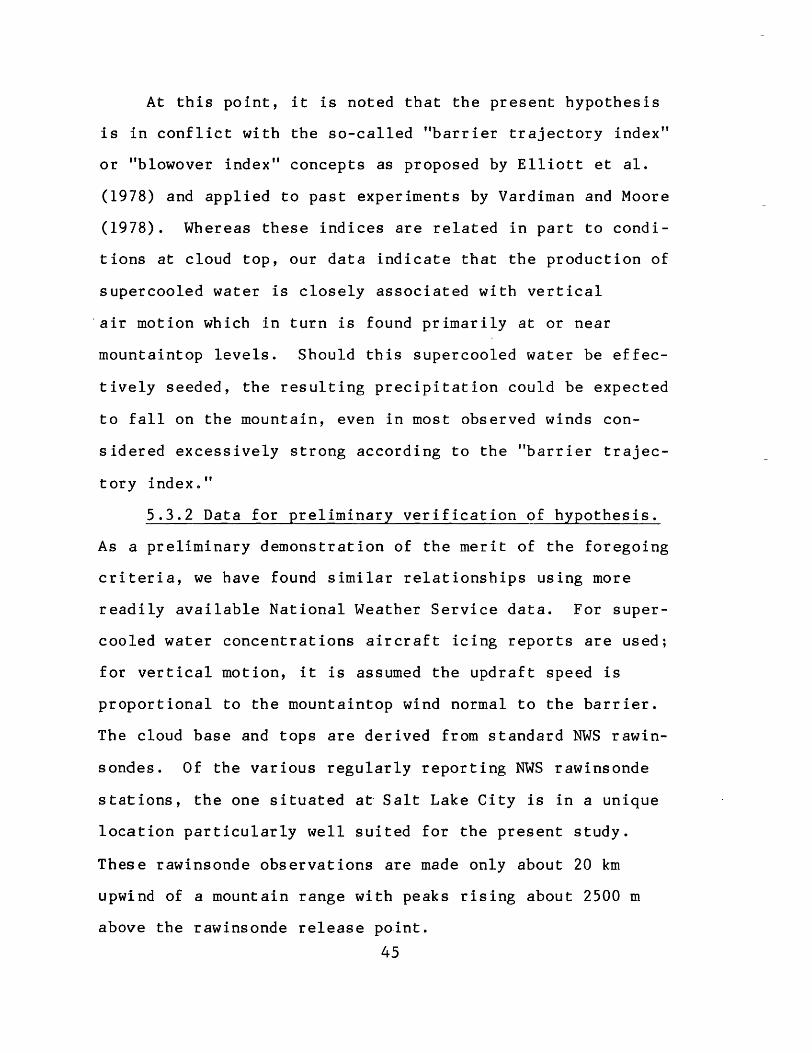
At this point, it is noted that the present hypothesis
is in conflict with the so-called "barrier trajectory index"
or "blowover index" concepts as proposed by Elliott et al.
(1978) and applied to past experiments by Vardiman and Moore
(1978). Whereas these indices are related in part to condi
tions at cloud top, our data indicate that the production of
supercooled water is closely associated with vertical
'air motion which in turn is found primarily at or near
mountaintop levels. Should this supercooled water be effec
tively seeded, the resulting precipitation could be expected
to fallon the mountain, even in most observed winds con
sidered excessively strong according to the "barrier trajec-
tory index."
5.3.2 Data for preliminary verification ~f hypothesis.
As a preliminary demonstration of the merit of the foregoing
criteria, we have found similar relationships using more
readily available National Weather Service data. For super
cooled water concentrations aircraft icing reports are used;
for vertical motion, it is assumed the updraft speed is
proportional to the mountaintop wind normal to the barrier.
The cloud base and tops are derived from standard NWS rawin
sondes. Of the various regularly reporting NWS rawinsonde
s tat ions, the one situated at· Salt Lake Ci ty is in a unique
location particularly well suited for the present study.
These rawinsonde observations are made only about 20 km
upwind of a mountain range with peaks rising about 2500 m
above the rawinsonde release po.int.
45
o 2 UPDRAFT (m 5·)
3
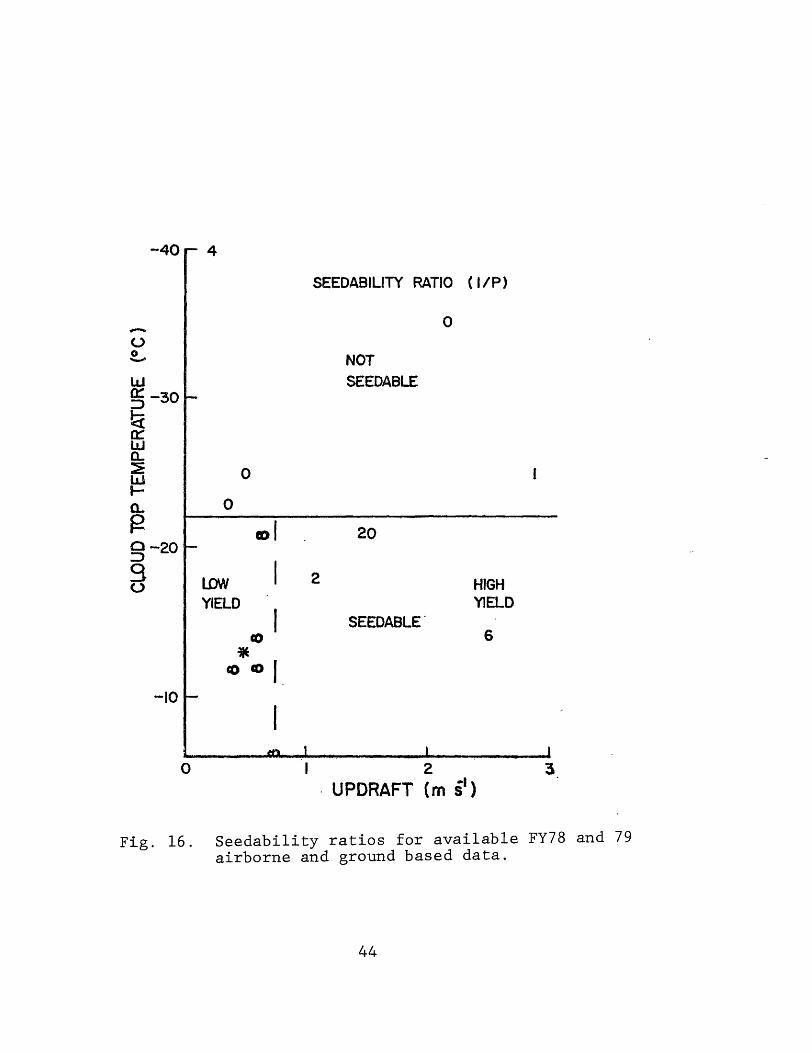
Fig. 16. Seedability ratios for available FY78 and 79 airborne and ground based data.
44
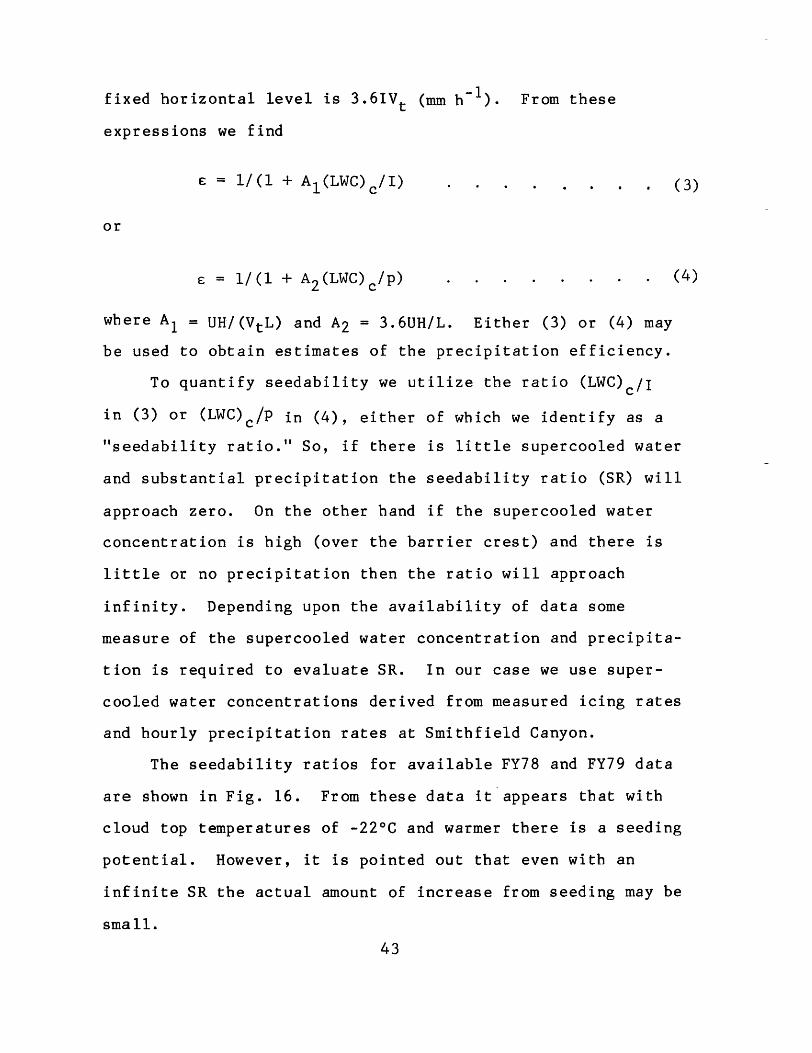
fixed horizontal level is 3.6IVt (mm h- 1). From these
expressions we find
or
£ = 1/(1 + A2 (LWC)c/ p)
where Al = UH/(VtL) and A2 = 3.6UH/L. Either (3) or (4) may
be used to obtain estimates of the precipitation efficiency.
To quantify seedability we utilize the ratio (LWC)c/ I
( 3)
(4)
in (3) or (LWC)c/P in (4), either of which we identify as a
"seedability ratio." So, if there is little supercooled water
and substantial precipitation the seedability ratio (SR) will
approach zero. On the other hand if the supercooled water
concentration is high (over the barrier crest) and there is
little or no precipitation then the ratio will approach
infinity. Depending upon the availability of data some
measure of the supercooled water concentration and precipita
tion is required to evaluate SR. In our case we use super
cooled water concentrations derived from measured icing rates
and hourly precipitation rates at Smithfield Canyon.
The seedability ratios for available FY78 and FY79 data
are shown in Fig. 16. From these data it"appears that with
cloud top temperatures of -22°C and warmer there is a seeding
potential. However, it is pointed out that even with an
infinite SR the actual amount of increase from seeding may be
small.
43
-40 0.06
-35 0.15
u 0 - -30 w 0:::
0.10 ::::>
~ -25 0::: w
0.40 a.. ~ -20 w 0.20 ~ 0.20 a.. 0.15 0 -15 0.25 ~ 0.15 0 (0.03) ::::> (0.02) 0 -10 -.J u
-5 (0.03)
07-------------T-------------~------------~------------~ o 5 10 15 20
CROSS-BARRIER WIND SPEED (m/s)
Fig. 24. Supercooled liquid water (g m- 3) measured by cloudsondes (FY80) versus cloud top temperature and 2700 m (9000 ft) cross-barrier wind speed.
63
u 0 -W 0:: => ..... « 0:: W a.. ~ w ..... a.. 0 ..... 0 => 0 -.J u
-40 0.30
-35 0.05
-30
0.06 -25
0.00 -20
0.00
0.01 -15 0.02
0.01 0.03
(0.005) -10 (0.00)
-5 (0.01
O~-----------.------------~------------__ ----------~ __ a 5 10 15 20
CROSS-BARRIER WIND SPEED (m/s)
Fig. 25. Precipitation rate (em h- l ) at Smithfield Canyon versus cloud top temperature and 2700 m (9000 ft) crossbarrier wind speed.
64
-40 o
-35 3 NOT SEEDABLE
-u 0 -30 -w 0::: 2 ::> I- -25 « 0::: W CD 0-
-20 ~ CD LLI 20 I- 7 0-0 -15 8 I- 15
0 (6)
::> -10 (CD)
0 SEEDABLE ..J u
-5 (3)
O~-----------r----------~----------~~----------~ o 5 10 15 20
CROSS-BARRIER WIND SPEED (m/s)
Fig. 26. Seedability ratios versus cloud top temperature and 2700 m (9000 ft) cross-barrier wind speed.
65
the clouds were relatively thin. Clouds with a tempera-
ture difference between cloud base and cloud top of 3°C or
less are indicated by parentheses on Fig. 26. Precipitation.
associated with these cases is very low, and probably close
to or below the detection limit of the weighing gage system.
Thus, it would be appropriate to place greatest emphasis
on the remaining cases. The remaining pattern of seedability
as a function of cloud top temperature becomes quite clear:
at cold cloud top temperatures there is little potential for
precipitation augmentation; at warm cloud top temperatures
the precipitation efficiency is low; and if both the super
cooled liquid water concentration and cross-barrier wind
speed are high, a substantial precipitation augmentation
potential exists.
5.3.6 Summary of seedability analysis. Analysis of
supercooled water concentrations and precipitation as func
tions of cloud top temperature and orographic updraft speeds
indicates that seedability is marked (in N. Utah) by cloud
top temperatures -22°C or warmer, but below QOC, and updraft
speeds of 1 m s-l or greater (Hill 1979). This hypothesis is
further substantiated in the present work by aircraft icing
reports as a substitute for supercooled water concentrations
and cross-barrier flow as a substitute for vertical motion.
Still further verification of these criteria are obtained by
use of the new cloudsonde measurements of supercooled liquid
water.
66
Within the suitable cloud top temperature range, the
potential precipitation yield increases as sguare of the
cross-barrier wind speed increases. About 20 percent of
winter orographic clouds offer such high potential.
According to our present seedability criteria, we would
expect high seedability to be associated with a) post frontal
conditions, where i) the cross-barrier flow is strong, ii)
high level subsidence is occurring, and iii) moisture is
still high at mountaintop levels, and b) weak low level
moisture systems with strong airflow (and perhaps weak
subsidence aloft). Both types of seedable conditions are
very similar and may be distinguished only by the presence or
absence of a prior cyclonic system. We believe, as a corollary
to the present hypothesis, that excepting possibly for
convection, there is generally an absence of seeding oppor
tunities in other cloud systems, especially well developed
cyclonic storms.
67

6.0 CONCLUSIONS AND RECOMMENDATIONS
6.1 Conclusions
The following conclusions are derived from the foregoing
research:
1. A cloudsonde instrument has been developed to
measure vertical profiles of supercooled liquid water (and
vertical motion). The first season's data indicate the
supercooled liquid water measurements are very useful in
assessing seeding potential.
2. The development of a dual frequency radiometer is
underway and may be expected to play an important role in
research on winter orographic cloud seeding.
3. Measurements of supercooled liquid water by the
Johnson-Williams device are subject to large errors in winter
orographic clouds, and the use of a Rosemount icing rate
meter gives more reliable data.
4. Aircraft icing reports may be effectively used to
provide information on cloud seedability, and these data
reinforce previous findings. Briefly, it is found that a
substantial cloud seeding opportunity is present if the cloud
top temperature just upwind of the barrier is warmer than
about -22°C and the cross-barrier wind speed is greater than
8 (or 10) m -1 s .
6.2 Recommendations
The following recommendations are derived from the
foregoing work:
69
1. Further development, testing and operation of the
cloudsonde units are strongly recommended. It is likely that
data obtained from these soundings will provide heretofore
unavailable information critical to the development of cloud
seeding technology.
2. Completion and operation of the dual frequency radi
ometer (for continuous measurement of supercooled liquid water
--vertically integrated) is also strongly recommended. These
data will also provide previously unavailable measurements.
3. Collection of additional data for assessing cloud
seeding opportunity recognition is recommended. These data
include cloud top temperature, vertical motion, cross-barrier
wind speed, supercooled liquid water and precipitation.
70
REFERENCES
Chappell, C. F., and F. L. Johnson, 1974: Potential for snow augmentation in cold orographic clouds. J. Appl. Meteor., 11, 374-382.
Elliott, R. D., R. W. Shaffer, A. Court, and J. F. Hannaford, 1978: Randomized cloud seeding in the San Juan Mountains, Colorado. J. Appl. Meteor., lZ, 1298-1318.
Friedman, M., 1972: the solution.
A new radiosonde case: The problem and Bull. Amer. Meteor. So~, 53, 884-887.
Guiraud, Fe 0., J. Howard, and D. C. Hogg, 1979: A dualchannel microwave radiometer for measurement of precipitable water vapor and liquid. I.E.E.E. Trans. Geosc. Electron., GE-17, 129-136.
Hill, G. E., 1979: Research on increased winter orographic precipitation by cloud seeding (FY1979): Development of cloud seedability criteria. Atmospheric Water Resources Series UWRL/A-79/01, Utah Water Research Laboratory, Utah State University, Logan, Utah. 73 pp.
Hill, G. E., and D. S. Woffinden, 1980: A balloonborne instrument for the measurement of vertical profiles of supercooled liquid water concentration. ~_~~l. Meteor.,~. 8 pp.
Langmuir I., and K. B. Blodgett, 1946: A mathematical investigation of water droplet trajectories. Army Air Forces Tech. Rep. No. 5418. 68 pp.
Ludlam, F. H., 1951: The best economy of a rimed cylinder. Quart. J. Roy. Meteor. Soc., 77, 663-666.
Neel, C. B., Jr., and C. P. Steinmetz, 1952: The calculated and measured performance characteristics of a heated-wire liquid-water content meter for measuring icing severity. NACA Tech. Note 2615. 37 pp.
Vardiman, L., and J. A. Moore, 1978: Generalized criteria for seeding winter orographic clouds. ~~pl. Meteor., 1I, 1769-1777.
71