osr final report 2 report provides detailed physical and financial information on the economics of...
TRANSCRIPT

ISBN: 0 903698 49 8
The Economics of Oilseed Rape in England, 2004
May 2006
Farm Business Survey
School of Agriculture, Food and Rural Development
University of Newcastle upon Tyne
Report No.65 £20.00


i
CONTENTS
Special Studies in Agricultural Economics iii
Foreword and Acknowledgements v
List of Table and Figures vii
Summary xv
Chapter 1 Oilseed Rape in the UK, EU and World 1
1.1 Introduction 1
1.2 Oilseed rape in the UK 1
1.3 Oilseed rape in the EU 4
1.4 The global situation 6
Chapter 2 Survey and Sample Characteristics 9
2.1 Introduction 9
2.2 The sample 9
2.3 Sample weighting 10
Chapter 3 Economic Results and Margins 11
3.1 Introduction 11
3.2 Growing conditions 11
3.3 Costs and returns 11
3.4 Economies of size 27
Chapter 4 Management Practices 31
4.1 Introduction 31
4.2 Seed 31
4.3 Fertiliser 36
4.4 Chemicals 40
4.5 Marketing 44
Chapter 5 Supplementary Questionnaire Results 51
References 57
Appendix 1 Standard costs and coefficients 59
Appendix 2 The weather 67
Appendix 3 Recent reports: Special Studies in Agricultural Economics 69
Appendix 4 Centres involved in Special Studies 75

ii

iii
Special Studies in Agricultural Economics
University departments of agricultural economics in England and Wales have, for
many years, undertaken economic studies of crop and livestock enterprises, receiving
financial and technical support from the Department for Environment, Food and
Rural Affairs and previously the Ministry of Agriculture, Fisheries and Food. Since
April 1978 this work has been supported in Wales by the Welsh Office following the
transfer of responsibilities for agriculture to the Secretary of State for Wales.
The departments in different regions conduct joint studies of those enterprises in
which they have a particular interest. This community of interest is recognised by
issuing reports prepared and published by individual Departments in a common series
entitled Special Studies in Agricultural Economics. Titles of recent publications in
this series are given in Appendix 3.
The addresses of all departments involved in the collection of data in the Special
Studies Programme are given in Appendix 4.

iv

v
Foreword and Acknowledgements
This report is the sixth in a series of studies commissioned by the Department for
Environment, Food and Rural Affairs (Defra), and formerly by the Ministry of
Agriculture, Fisheries and Food (MAFF), concerned with the economics of oilseed
rape production. The report provides detailed physical and financial information on
the economics of oilseed rape production in England for the 2004 harvest year.
Separate results are shown for the winter and spring sown crops, and for the three
European Union regions in England – the North, West and East.
In undertaking and preparing this report thanks are due to many people: to the staff at
the Economics and Statistics (Farm Business) division at Defra for help at the
planning stage and for commenting on an earlier draft of the report; to the local co-
ordinators and colleagues at university and college centres who carried out the
fieldwork; to the farmers who took part in the survey; and to staff of the Farm
Business Survey and School of Agriculture, Food and Rural Development at
Newcastle University.
Copyright
The basic information on which this report is based was originally collected on behalf
of, and was largely financed by, the Department for Environment, Food and Rural
Affairs, and is Crown Copyright.

vi

vii
List of Tables Page
Table 1.1 Area, yield and production of oilseed rape in the UK, 1997-2005 1
Table 1.2 Value of production of oilseed rape, UK 1997-2005 3
Table 1.3 Supply and use of oilseed rape, UK 4
Table 1.4 Rapeseed production in the EU, 2004 4
Table 1.5 EU Producer Support Estimates (PSEs) 5
Table 1.6 World Production, Imports and Exports of Oilseed Rape, 2004 6
Table 2.1 Oilseed rape businesses by EU region and band size
- target and actual sample, 2004 9
Table 2.2 Oilseed rape area (ha) by EU region and band size - sample data,
2004 9
Table 2.3 Oilseed rape growers by EU region and band size
- census data, 2004 10
Table 2.4 Oilseed rape area (ha) by EU region and band size - census data,
2004 10
Table 2.5 Oilseed rape area by EU region and band size
- sample share (%) of population, 2004 10
Table 3.1 Output, costs and margins for oilseed rape on sample farms
in England, 2004 13
Table 3.2 Output, costs and margins for oilseed rape, weighted results
for England, 2004 15
Table 3.3 Output, costs and margins for winter oilseed rape by EU region,
2004 17
Table 3.4 Output, costs and margins for spring oilseed rape by EU region,
2004 18
Table 3.5 Output, costs and margins for winter oilseed rape by
rotational area, 2004 20
Table 3.6 Output, costs and margins for winter oilseed rape by area grown,
2004 21
Table 3.7 Results for winter oilseed rape by margin over materials quartile
groups in England, 2004 23

viii

ix
List of Tables (continued) Page
Table 3.8 Results for spring oilseed rape by margin over materials quartile
groups in England, 2004 24
Table 3.9 Comparison of performance by age of manager, winter oilseed
rape, 2004 25
Table 3.10 Comparison of performance by training of manager,
winter oilseed rape, 2004 25
Table 3.11 Comparison between means for winter oilseed rape,
1975 to 2004 26
Table 3.12 Comparison between means for spring oilseed rape,
1975 to 2004 27
Table 4.1 Seed rate, winter sown 31
Table 4.2 Seed cost, winter sown 32
Table 4.3 Seed rate, yield & profitability - winter sown 33
Table 4.4 Winter rape varieties 34
Table 4.5 Spring oilseed rape varieties 35
Table 4.6 Performance by main winter rape varieties 36
Table 4.7 Fertiliser rates, Nitrogen, winter sown 36
Table 4.8 Nitrogen rate, yield and profitability - winter sown 37
Table 4.9 Fertiliser rates, Phosphate, winter sown 38
Table 4.10 Phosphate rate, yield and profitability - winter sown 38
Table 4.11 Fertiliser rates, Potash, winter sown 39
Table 4.12 Potash rate, yield and profitability - winter sown 40
Table 4.13 All fertilisers, yield and profitability - winter sown 40
Table 4.14 Trace elements, yield & profitability - winter sown 40
Table 4.15 Marketing - winter sown 45

x

xi
List of Tables (continued) Page
Table 4.16 Marketing - spring sown 48
Table 5.1 Reasons for growing winter sown oilseed rape 51
Table 5.2 Reasons for growing spring sown oilseed rape 52
Table 5.3 Intentions for 2005 52
Table 5.4 Reasons for not growing spring sown oilseed rape in 2005 52
Table 5.5 Minimum price 53
Table 5.6 Energy crop area payment 53
Table 5.7 Growing on set-aside land 54
Table 5.8 Reasons for not growing winter sown oilseed rape on set-aside land 54
Table 5.9 Reasons for not growing spring sown oilseed rape on set-aside land 54
Table 5.10 Intention of growing oilseed rape on set-aside land in 2005 55
List of Figures
Figure 1.1 Oilseed rape in the UK, 2003 2
Figure 1.2 Value of production, oilseed rape, UK 3
Figure 1.3 EU PSE for rapeseed and all agriculture 5
Figure 1.4 World's main producers 6
Figure 1.5 Main importers 7
Figure 1.6 Main exporters 7
Figure 3.1 Actual average costs 29
Figure 3.2 Long run average cost curve 29
Figure 4.1 Seed Rate, winter sown 32
Figure 4.2 Seed cost, winter sown 33
Figure 4.3 Winter rape varieties 34

xii

xiii
List of Figures (continued) Page
Figure 4.4 Spring varieties 35
Figure 4.5 Nitrogen rates, winter sown 37
Figure 4.6 Phosphate rates, winter sown 38
Figure 4.7 Potash rates, winter sown 39
Figure 4.8 Herbicide use, winter sown 41
Figure 4.9 Insecticide use, winter sown 41
Figure 4.10 Slug pellets, winter sown 42
Figure 4.11 Dessicant use, winter sown 42
Figure 4.12 Fungicide use, winter sown 43
Figure 4.13 All chemical use, winter sown 43
Figure 4.14 Quality - winter sown 46
Figure 4.15 Buyer - winter sown 46
Figure 4.16 Contract type - winter sown 47
Figure 4.17 Date of sale - winter sown 47
Figure 4.18 Quality – spring sown 49
Figure 4.19 Buyer - spring sown 49
Figure 4.20 Contract type - spring sown 50
Figure 4.21 Date of sale - spring sown 50

xiv

xv
Summary
Oilseed Rape in the UK, EU and World
• The total area sown to oilseed rape in the UK over the nine years since the last
special study has varied between 400,000 and 600,000 hectares. Yield per
hectare has averaged slightly over three tonnes, and the value of production
has fluctuated from a low of £249 million in 2000 to over £400 million in
1997, 1998 and 2003. The share of the subsidy in the value of the crop has
been falling, prior to replacement of the area payment by the single farm
payment.
• The majority of the UK’s trade in oilseed rape is with other member states of
the EU, although imports and exports have been less important in recent years.
As a measure of self-sufficiency, the share of domestic production in total
supply has risen from a low of 66% in 2001 to over 100% in 2003 and 2005.
• Within the EU, Germany and France are the largest producers, as a
consequence of having the largest areas sown and above average yields. The
UK and Poland were the next largest producers in 2004, though both had
yields below the EU average.
• As a measure of total support resulting from the various policy measures that
affect producers’ revenue, the PSE for rapeseed in the EU peaked at 50% in
2000, falling to 34% in 2004. Since 2002, the level of support for oilseed rape
has been somewhat less than that for cereals, but comparable to the level of
support for agriculture in total.
• The EU-25 is the world’s largest producer of rapeseed, followed by China and
then Canada and India. Japan is by far the world’s largest importer, followed
by Mexico, Pakistan and the United States. Canada and Australia are the
world’s largest exporters.
Survey and Sample Characteristics
• The target sample was stratified by EU region and area of oilseed rape grown,
according to Defra guidelines, based on census data. The number of farms
sampled was 212, accounting for 11,600 hectares of oilseed rape, almost half
of which was grown on large enterprises (>50 hectares) in the East region.
Census data show that there were 8,700 growers of oilseed rape in England in
2004 and that the total area grown was 361,000 hectares. Thus, the sample
represented 2.4% of those that grew the crop, and 3.2% of the total area
grown.
• The 2003/04 growing season was poor for oilseed rape. Although
temperatures and sunshine hours were close to average, rainfall was well
below average during the autumn sowing period and well above average in
August, 2004 during harvest.

xvi
Economic Results and Margins
• The average area of the winter sown crop was 59 hectares per farm, almost
50% higher than in the 1996 study. However, the average yield, 3.24 tonnes
per hectare, and the average price, £146 per tonne, were both lower. Thus, the
value of output, £708, was only 59% of the 1996 figure. Of this, £235 or 33%
was the area payment under the Common Agricultural Policy, compared to
£448 in 1996. The average net margin was £72 per hectare, rising to £75 when
agri-environment scheme payments are included. This compares with a net
margin in 1996 of £476 per hectare.
• Compared to the winter sown crop, the average area of spring sown oilseed
rape was considerably lower at 32 hectares per farm, as was the average yield
of 1.99 tonnes per hectare. The average price of £142 per tonne was only
slightly lower. The value of output of the crop was £521 per hectare, about
three-quarters of the value of the winter sown crop, with 46% attributable to
the area payment. Fixed costs and overheads were higher than for the winter
sown crop, leaving a negative net margin of -£55 per hectare, excluding agri-
environment scheme payments of £4 per hectare. This compares with a net
margin of £304 in 1996.
• For the winter sown crop, yields were highest in the North at 3.80 tonnes per
hectare, which meant that despite having the lowest price this region had the
highest value of output at £774 per hectare. Total costs in each of the three
regions were broadly similar. There was no significant difference in net
margin between the East (£58 per hectare) and the West (£57 per hectare), but
in the North it was much higher (£138 per hectare) due to the higher yield.
Though of a different magnitude, the agri-environment scheme payments
varied between £3.41 per hectare in the East and £1.18 per hectare in the
West.
• Overall, the greater profitability of farms in the North region was due almost
entirely to the better yield, an outcome that accords with the results of the
1996 survey. The financial performance of farms in the East and the West in
2004 was broadly similar. The relative position of farms in the East, in terms
of net margin, worsened compared with 1996, due to poorer yields.
• Based on rotational area, there are no significant differences in yield between
farms of different size. Although the average price achieved by the largest
farms (>450 hectares) is significantly greater than that achieved by the
smallest (<150 hectares), there are no significant differences in total returns.
Similarly, seed cost is significantly lower on the largest farms, but there are no
differences in margin-over-materials across farms of different size.
• For the winter sown crop, the top 25 per cent of farms, based on margin-over-
materials, had yields of 3.96 tonnes per hectare compared to 2.10 tonnes per
hectare for the bottom 25 per cent. Coupled with a higher price (£151 versus
£141 per tonne), this resulted in an average output per hectare for the best
performing farms of £834 compared to £523 for the poorest performers.
Material costs were similar across the two groups, meaning that margin-over-

xvii
materials was twice as high for the best performers. Indeed, other variable
costs, fixed costs and overheads were also similar for the two groups of farms,
but the difference in value of output meant that the worst performing farms
had a negative net margin, excluding agri-environment scheme payments, of -
£105 per hectare, whilst for the best performing farms it was £217 per hectare,
compared to the average of all farms of £72.
• In terms of age of manager, the over 55 years group under-performed younger
managers in yield, margin-over-materials and gross margin. Those managers
with a college education performed better than those with only schooling in
terms of gross margin. More convincingly, those with a college education out-
performed those with a degree in terms of yield, margin-over-materials and
gross margin. Not the best advert for a university education!
• A comparison of the costs and returns recorded in the last five special studies
on oilseed rape shows that market price has fallen dramatically in real terms
over the last 30 years. This has been compensated somewhat in the two most
recent survey years by the area payment, following changes to the Common
Agricultural Policy. Over the five survey years, value of output, margin-over
materials, gross margin and net margin have all see-sawed, in real terms,
being at their highest in 1982 and 1996.
• In exploring the possibility of economies of size in oilseed rape production, a
long-run average cost curve, which relates average (unit) cost of production
per tonne to size of enterprise, was estimated from the survey data. The result
suggests that any economies of size are quickly exhausted at a fairly low level
of output, around 75 tonnes, or 25 hectares.
Management Practices
• The most popular rate of seeding for the winter sown crop is around 5.5
kilograms per hectare, and the most usual cost of seed is around £40 per
hectare. In terms of performance, yield per hectare on the farms in this survey
falls as the seed rate increases, although statistically this is only significant at
seed rates of up to 6 kilograms per hectare.
• The three most popular varieties of winter oilseed rape in this survey were
Winner, accounting for 25% of the tonnage harvested, Recital (7%) and
Canberra (6%). For the spring crop, the three most popular varieties were
Senator (28% of tonnage harvested), Mozart (22%) and Tambora (19%).
• The most common rates of application for nitrogen fertiliser on those farms
sampled were between 200 and 250 kilograms per hectare. In terms of
performance, these rates produced statistically significant higher yields than
on those farms applying lower rates. However, these higher yields were not
translated into a higher margin-over-materials or gross margin.
• Of the farms surveyed, 50 did not apply any phosphates to the winter sown
crop. Of those that did, the most popular rates of application were between 50
and 80 kilograms per hectare. There were no significant differences in terms

xviii
of performance by rate of phosphate application, including those growers who
applied none.
• The pattern for potassium applications to the winter sown crop was similar to
that for phosphates. Fifty-three growers applied none at all. Of those that did,
the most common rates of application were between 50 and 90 kilograms.
These rates of application produced significantly higher yields than those
farms that used lower rates or no potassium at all.
• All growers in the sample used herbicides on the winter sown crop, with £60
per hectare being the most usual cost. Thirty-eight growers used no insecticide
at all, and for the majority of the rest the cost was between £5 -10 per hectare.
Slug pellets were used by less than a third of growers and dessicants by less
than half. Although 24 growers used no fungicides, most of the rest were
using up to £50 per hectare. On all chemicals, the majority of growers were
spending between £75 and £125 per hectare.
• The majority of the winter sown crop is sold for crushing (93% of harvest
tonnage) to merchants (87%). Spot and forward sales account for almost 70%,
with 44% of the crop sold in August.
Supplementary Questionnaire Results
• Over three-quarters of the farmers surveyed chose ‘break crop’ as the most
important reason for growing oilseed rape. This was followed, in importance,
by profit-generation, spreading the workload, weed control and area payment.
• To grow oilseed rape in the future, at least 50% of growers would require a
minimum price of £140 per tonne. A minimum price of £150 per tonne would
include 80% of growers.

1
Chapter 1
Oilseed Rape in the UK, EU and World
1.1 Introduction
This chapter provides a background to the production of oilseed rape in England.
Previous special studies have reported on the situation in the 1970s, 1980s and 1990s,
the most recent by Askham Bryan College in 1996. In general, the data presented in
this chapter cover the nine years since this last Special Study. The chapter begins with
an overview of oilseed rape production in the UK, followed by brief overviews of the
situation in the EU and the world.
1.2 Oilseed rape in the UK
The geographical distribution of oilseed rape in England in 2003 is shown in Figure
1.1. The map shows that the crop is concentrated in a central and eastern belt running
the length of the country, with little in the western areas.
The area, yield and production of oilseed rape in the UK over the nine years since the
last Special Study are shown in Table 1.1. The total area sown has varied between
400,000 and 600,000 hectares, the highest recorded area being the provisional figure
for 2005. Yield per hectare has averaged slightly over three tonnes, with a high of 3.4
tonnes in 2002 and a low of 2.6 tonnes in 2001. Harvested production has varied from
just under 1,200 thousand tonnes in 2000 and 2001, due to a combination of a lower
area sown and below average yield, to 1,900 thousand tonnes in 2005, as a result of a
larger area sown and above average yield.
Table 1.1 Area, yield and production of oilseed rape in the UK, 1997-2005
1997 1998 1999 2000 2001 2002 2003 2004 2005
Area ('000 ha) 473 534 537 402 451 432 542 558 593
Yield (tonnes per ha) 3.2 2.9 3.2 2.9 2.6 3.4 3.3 2.9 3.2
Production ('000 tonnes) 1,527 1,568 1,733 1,157 1,157 1,468 1,771 1,609 1,902
Source: Defra

2
Figure 1.1 Oilseed rape in the UK, 2003

3
The value of production has fluctuated considerably from a low of £249 million in
2000 to over £400 million in 1997, 1998 and 2003 (Table 1.2). The subsidy accounted
for almost half of the value of the crop in 1999. However, this share has been falling
prior to replacement of the area payment by the single farm payment (Table 1.2 and
Figure 1.2).
Table 1.2 Value of production of oilseed rape, UK 1997-2005
1997 1998 1999 2000 2001 2002 2003 2004 2005
Value of production (£m) 406 417 371 249 276 298 417 375 263
of which:
sales 227 259 202 158 167 205 283 262 250
subsidies* 167 155 175 110 104 80 113 118 . .
change in stocks 12 3 -6 -19 4 12 21 -5 13
Source: Defra * includes arable area payments but excludes set-aside payments.
Figure 1.2 Value of production, oilseed rape, UK
0
100
200
300
400
500
1997 1998 1999 2000 2001 2002 2003 2004 2005
Year
£ m Subsidies
Sales
The situation regarding supply and use of oilseed rape in the UK is shown in Table
1.3. Imports and exports have been less important in recent years; the majority of
trade is with other member states of the EU. As a measure of self-sufficiency in
oilseed rape, the share of domestic production in total supply has risen from a low of
66% in 2001 to over 100% in 2003 and 2005.

4
Table 1.3 Supply and use of oilseed rape, UK
1997 1998 1999 2000 2001 2002 2003 2004 2005
Production 1,527 1,568 1,733 1,157 1,157 1,468 1,771 1,609 1,902
Imports from:
the EU 274 303 218 273 530 265 136 198 52
the rest of the world 3 23 105 15 75 62 - - -
Exports to:
the EU 162 244 126 50 16 162 271 101 150
the rest of the world 24 32 149 - - 45 1 3 5
Total new supply 1,617 1,618 1,781 1,396 1,746 1,587 1,634 1,703 1,800
Production as % of supply 94 97 97 83 66 92 108 94 106
Source: Defra
1.3 Oilseed rape in the EU
The production of oilseed rape in the EU is shown in Table 1.4. Germany and France
are the largest producers, as a consequence of having the largest areas sown and
above average yields. The UK and Poland were the next largest producers in 2004,
though both had yields below the EU average.
Table 1.4 Rapeseed production in the EU, 2004
Country Area Yield Production
('000 ha) (t/ha) ('000 t)
Austria 35 3.4 121
Belgium 6 4.1 23
Czech Republic 259 3.6 930
Denmark 122 3.8 468
Estonia 53 1.4 73
Finland 68 1.1 75
France 1,121 3.5 3,969
Germany 1,283 4.1 5,277
Hungary 104 2.2 232
Ireland 2 4.0 9
Italy 3 2.2 6
Latvia 55 1.9 105
Lithuania 101 2.0 205
Luxembourg 4 3.9 17
Netherlands 2 4.6 8
Poland 538 3.0 1,633
Slovakia 92 2.8 263
Slovenia 2 2.8 5
Spain 5 1.8 8
Sweden 84 2.7 230
United Kingdom 558 2.9 1,609
EU-25 4,497 3.4 15,266
Source: http://europa.eu.int/comm/agriculture/agrista/2005/table_en/4411.pdf

5
The level of support provided to producers of oilseed rape in the EU is shown in
Table 1.5 and Figure 1.3. This is measured in terms of the Producer Support Estimate
(PSE) as calculated by the OECD (Organisation for Economic Cooperation and
Development) for the EU. (The OECD does not calculate PSEs for individual member
states of the EU.) The PSE is a measure of total support resulting from the various
policy measures that affect producers’ revenue. Thus, it captures the subsidy (area)
payments reported in Table 1.2 and Figure 1.2. In Table 1.5 and Figure 1.3 the PSE is
expressed as a percentage of the value of output. The PSE for rapeseed peaked at 50%
in 2000, falling to 34% in 2004. For comparison, Table 1.5 also shows PSEs for other
oilseed crops, cereals and total agricultural output (all crop and livestock products).
Since 2002, the level of support for oilseed rape has been somewhat less than that for
cereals, but comparable to the level of support for agriculture in total.
Table 1.5 EU Producer Support Estimates (PSEs)
(% of output value)
1997 1998 1999 2000 2001 2002 2003 2004
Wheat 37 49 55 46 47 43 48 42
Barley 45 65 61 46 50 49 51 48
Maize 33 40 43 41 37 30 44 46
Rapeseed 46 43 40 50 47 36 38 34
Soybeans 46 51 44 48 48 42 45 39
Sunflower 48 43 40 49 45 35 42 38
All agriculture 34 37 39 33 32 34 36 34
Source: OECD
Figure 1.3 EU PSE for rapeseed and all agriculture
0
10
20
30
40
50
60
1997 1998 1999 2000 2001 2002 2003 2004
%
Rapeseed
All agriculture
Source: OECD

6
1.4 The global situation
The world’s major producers, importers and exporters of oilseed rape in 2004 are
shown in Table 1.6 and Figures 1.4, 1.5 and 1.6. The EU-25 is the largest producer,
followed by China and then Canada and India. In terms of international trade, Japan is
by far the world’s largest importer of oilseed rape, followed by Mexico, Pakistan and
the United States. Canada and Australia are the world’s largest exporters.
Table 1.6
World Production, Imports and Exports of Oilseed Rape, 2004
('000 tonnes)
Country Production Imports Exports
Australia 1,533 0 1,080
Bangladesh 230 175 0
Canada 7,700 170 3,400
China 13,182 350 1
EU-25 15,290 168 412
India 7,000 0 0
Japan 1 2,300 0
Mexico 0 880 0
Pakistan 241 500 0
Romania 101 5 26
Russia 120 0 20
Ukraine 149 0 80
United States 613 470 134
Others 202 25 0
Total 46,362 5,043 5,153
Source: USDA
Figure 1.4 World's main producers
Australia, 3%
Canada, 17%
China, 28%EU-25, 33%
India, 15%
Others, 4%

7
Figure 1.5 Main importers
China, 7%
EU-25, 3%
Japan, 46%
Mexico, 17%
Pakistan, 10%
United States, 9% Canada, 3%
Others, 1% Bangladesh, 3%
Figure 1.6 Main exporters
Australia, 21%
Canada, 66%
EU-25, 8%
Ukraine, 2%
United States, 3%
Others, 1%

8
9
Chapter 2
Survey and sample characteristics
2.1 Introduction
This chapter describes the sample farms selected for the survey and their
characteristics in relation to the overall population of growers of oilseed rape.
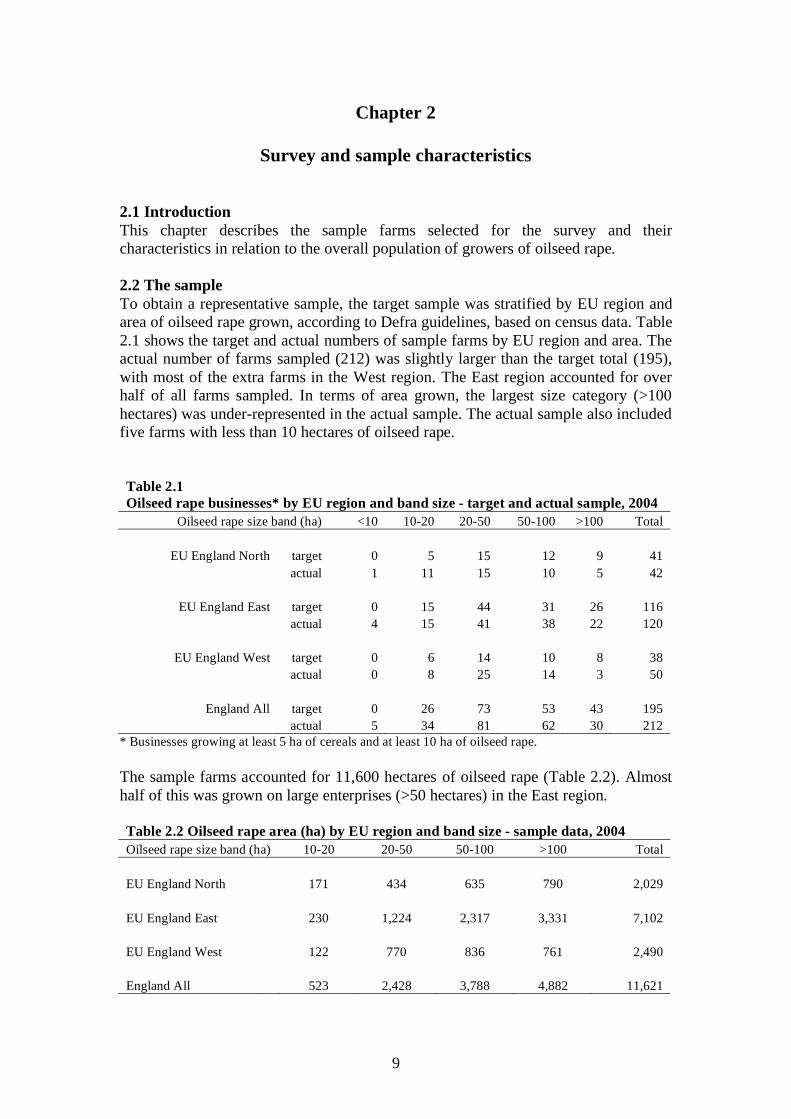
2.2 The sample
To obtain a representative sample, the target sample was stratified by EU region and
area of oilseed rape grown, according to Defra guidelines, based on census data. Table
2.1 shows the target and actual numbers of sample farms by EU region and area. The
actual number of farms sampled (212) was slightly larger than the target total (195),
with most of the extra farms in the West region. The East region accounted for over
half of all farms sampled. In terms of area grown, the largest size category (>100
hectares) was under-represented in the actual sample. The actual sample also included
five farms with less than 10 hectares of oilseed rape.
Table 2.1
Oilseed rape businesses* by EU region and band size - target and actual sample, 2004
Oilseed rape size band (ha) <10 10-20 20-50 50-100 >100 Total
EU England North target 0 5 15 12 9 41
actual 1 11 15 10 5 42
EU England East target 0 15 44 31 26 116
actual 4 15 41 38 22 120
EU England West target 0 6 14 10 8 38
actual 0 8 25 14 3 50
England All target 0 26 73 53 43 195
actual 5 34 81 62 30 212
* Businesses growing at least 5 ha of cereals and at least 10 ha of oilseed rape.
The sample farms accounted for 11,600 hectares of oilseed rape (Table 2.2). Almost
half of this was grown on large enterprises (>50 hectares) in the East region.
Table 2.2 Oilseed rape area (ha) by EU region and band size - sample data, 2004
Oilseed rape size band (ha) 10-20 20-50 50-100 >100 Total
EU England North 171 434 635 790 2,029
EU England East 230 1,224 2,317 3,331 7,102
EU England West 122 770 836 761 2,490
England All 523 2,428 3,788 4,882 11,621

10
Census data show that there were 8,700 growers of oilseed rape in England in 2004
(Table 2.3) and that the total area grown was 361,000 hectares (Table 2.4). Thus, the
sample represented 2.4% of those that grew the crop, and 3.2% of the total area
grown. A breakdown, by region and size category, of the percentage area covered by
the actual sample is given in Table 2.5.
Table 2.3 Oilseed rape growers by EU region and band size - census data, 2004
Oilseed rape size band (ha) 10-20 20-50 50-100 >100 Total
EU England North 833 977 257 85 2,152
EU England East 1,330 2,162 1,019 405 4,916
EU England West 601 756 247 77 1,681
England All 2,764 3,895 1,523 567 8,749
Table 2.4 Oilseed rape area (ha) by EU region and band size - census data, 2004
Oilseed rape size band (ha) 10-20 20-50 50-100 >100 Total
EU England North 12,117 30,464 17,311 13,527 73,418
EU England East 19,696 69,575 69,824 65,526 224,620
EU England West 8,719 24,037 16,886 13,194 62,836
England All 40,532 124,076 104,021 92,247 360,874
Table 2.5
Oilseed rape area by EU region and band size - sample share (%) of population, 2004
Oilseed rape size band (ha) 10-20 20-50 50-100 >100 Total
EU England North 1.4 1.4 3.7 5.8 2.8
EU England East 1.2 1.8 3.3 5.1 3.2
EU England West 1.4 3.2 5.0 5.8 4.0
England All 1.3 2.0 3.6 5.3 3.2
2.3 Sample weighting
On the occasions when weighted means are presented in this report, these means have
been weighted on the basis of area grown. That is, the sample area data given in
Table 2.2 and the population area data in Table 2.4 have been used to derive
weighting factors which ‘raise’ the sample results to the level of the population. (See
also Table 2.5.)

11
Chapter 3
Economic Results and Margins
3.1 Introduction
The economic results of the survey of the 2004 harvested crop are presented in this
chapter. These include margin over materials, gross margin and net margin analysis.
The results are presented mainly on a per hectare basis, for both the winter sown and
spring sown crops. The number of farms growing the spring crop included in the
sample was not large and these results therefore should be treated with some caution.
Results are decomposed by EU region, rotational area, area of oilseed rape grown, and
by quartiles, showing the top and bottom 25 per cent of farmers. There is also some
analysis of performance by age and training of manager, and the chapter concludes
with an overview of the economic results from the five oilseed rape surveys
conducted since 1975.
3.2 Growing conditions
The 2003/04 growing season was poor for oilseed rape. Although temperatures and
sunshine hours were close to average, rainfall was well below average during the
autumn sowing period and well above average in August, 2004 during harvest (see the
weather data in Appendix 2).
3.3 Costs and returns
Of the total farms sampled, seven had winter sown crops which failed and one had a
spring crop which failed. Since these crops were not harvested, they have been
excluded from the analysis. This leaves effective samples of 195 farms with winter
sown crops and 30 farms with spring sown crops.
The overall results for England for both winter and spring sown crops are shown in
Table 3.1.
Standard errors
The average results in this and other tables are presented with their associated
standard errors. The standard error provides an indication of the range within which
we can expect the true average of all farms (i.e., including those not surveyed) to lie.
For example, the average yield of winter sown oilseed rape on the 195 farms reported
in Table 3.1 was 3.24 tonnes per hectare, with a standard error of 0.06 tonnes. This
means there is a 90% chance that the average yield on all farms in England that grew
the winter sown crop was within the range of 1.65 standard errors of the sampled
mean, i.e. 3.24 ± (1.65 x 0.06) tonnes, or between 3.14 and 3.34 tonnes per hectare.
The size of the standard error is related to the number of farms included in the sample,
to the size of the sample in proportion to the total number of farms, and to variability
of the data – in general, the larger the sample, the smaller the standard error.
Similarly, when we sub-divide our overall sample, for example to examine regional
differences (see Table 3.3), the number of farms in each sub-sample becomes smaller,
and the associated standard errors become correspondingly larger. In this situation,

12
the average of the farms included in the sample becomes a less reliable measure of the
true average of all farms in that particular category.
Unweighted sample averages
Winter sown
The average area of the winter sown crop was 59 hectares per farm, almost 50%
higher than in the 1996 study. However, the average yield, 3.24 tonnes per hectare,
and the average price, £146 per tonne, were both lower. Thus, the value of output of
the crop was £708, only 59% of the value of output in 1996. Of this, £235 or 33% was
the area payment under the Common Agricultural Policy, compared to £448 in 1996.
(A detailed comparison with earlier years is presented later in the chapter.)
Material costs (seed, fertiliser and crop protection) totalled £220 per hectare, giving a
margin over materials of £488 per hectare. With other variable costs of £44 per
hectare, the gross margin was £444 per hectare. Fixed costs and overheads totalled
£372 per hectare, of which the largest item was rent, leaving a net margin of £72 per
hectare, which rises to £75 when agri-environment scheme payments are included.
This compares with a net margin in 1996 of £476 per hectare.
Spring sown
Compared to the winter sown crop, the average area of spring sown oilseed rape was
considerably lower at 32 hectares per farm, as was the average yield of 1.99 tonnes
per hectare (Table 3.1). The average price of £142 per tonne was only slightly lower.
The value of output of the crop was £521 per hectare, about three-quarters of the
value of the winter sown crop, with 46% attributable to the area payment. Although
variable costs were also lower, the gross margin was smaller at £333 per hectare.
Fixed costs and overheads were higher than for the winter sown crop, at £389 per
hectare, largely because of higher general overheads, leaving a negative net margin of
-£55 per hectare, excluding agri-environment scheme payments of £4 per hectare.
This compares with a net margin of £304 in 1996.
For both the winter and spring sown crops, the contrast with margins in 1996 is due to
the lower value of output in 2004, owing to lower yields, lower prices and reduced
area payments. Costs in 2004 were, in general, similar to those in 1996.

13
Table 3.1
Output, costs and margins for oilseed rape on sample farms in England, 2004
(Unweighted) Winter Spring
Number of observations 195 30
CROP YIELD AND OUTPUT s.e. s.e.
Average area grown (ha) 59 4.6 32 4.7
Yield (tonnes/ha) 3.2 0.1 2.0 0.1
Sale price (£/tonne) 146 1.0 142 2.6
RETURNS £/ ha £/ha
Area payment 235 1.3 237 0.3
Output - OSR 473 9.5 284 21.8
Output - straw 0 0.1 0 0.0
Total 708 10.0 521 21.8
MATERIAL COSTS
Seed 30 1.0 28 3.3
Fertiliser 94 2.4 72 6.6
Crop protection materials 96 2.3 50 6.2
Total 220 3.7 151 10.6
MARGIN OVER MATERIALS 488 9.7 370 21.9
OTHER VARIABLE COSTS
Casual labour 2 0.2 2 0.6
Contract 27 4.7 24 14.5
Fuel for drying 4 0.3 3 0.5
Marketing Costs 4 0.4 3 0.3
Miscellaneous 7 0.6 6 0.9
Total 44 4.8 37 14.5
GROSS MARGIN 444 10.7 333 25.9
FIXED COSTS
Labour - Farmer & Spouse 8 1.2 7 2.5
Labour - unpaid 2 0.6 6 1.6
Labour - paid 19 1.4 16 3.1
Machinery - Tractors 43 2.2 38 4.1
Machinery - Implements 62 5.4 53 11.3
Specific Machinery - Unused 0 0.1 0 0.0
Combine Crop Storage Equipm't Charge 3 0.6 2 1.1
Combine Crop Storage B'dings Charge 3 0.6 1 0.4
Rent 149 4.2 134 11.9
Drainage Charges 2 0.3 3 0.9
Total 293 8.2 261 16.8
OVERHEADS
Overheads - Labour 8 0.4 8 0.9
Overheads - Machinery 12 0.8 10 1.7
Overheads - Buildings 0 0.1 0 0.1
Overheads - General 59 2.8 108 15.4
Total 80 3.2 127 15.4
TOTAL COSTS 636 10.0 576 24.8
NET MARGIN 72 13.1 -55 27.7
Agri-environment payments (H) 3 0.8 4 2.6
NET MARGIN (including H) 75 13.2 -51 27.5

14
Weighted sample averages1
Winter sown
Weighted averages for England for the winter and spring sown crops are shown in
Table 3.2. Compared to the unweighted averages presented in Table 3.1, the weighted
averages for the winter sown crop show slightly lower returns and higher costs,
resulting in a net margin, before agri-environment scheme payments, of £54 per
hectare, compared to £75 per hectare in the unweighted sample.
Spring sown
For the spring sown crop, differences between the weighted and unweighted averages
are much smaller, with a weighted net margin, before agri-environment scheme
payments, of -£59 compared to the unweighted average of -£55.
1 These averages are weighted on the basis of the area of oilseed rape grown in each of four size
categories (see Chapter 2).

15
Table 3.2
Output, costs and margins for oilseed rape, weighted results for England, 2004
Winter Spring
Number of observations 195 30
CROP YIELD AND OUTPUT s.e. s.e.
Average area grown (ha) 42 4.6 31 4.7
Yield (tonnes/ha) 3.2 0.1 2.0 0.1
Sale price (£/tonne) 145 1.0 143 2.6
RETURNS £/ha £/ha
Area payment 235 1.3 237 0.3
Output - OSR 468 9.5 283 21.8
Output - straw 0 0.1 0 0.0
Total 703 10.0 520 21.8
MATERIAL COSTS
Seed 31 1.0 29 3.3
Fertiliser 95 2.4 72 6.6
Crop protection materials 94 2.3 49 6.2
Total 221 3.7 149 10.6
MARGIN OVER MATERIALS 482 9.7 371 21.9
OTHER VARIABLE COSTS
Casual labour 2 0.2 2 0.6
Contract 35 4.7 27 14.5
Fuel for drying 3 0.3 3 0.5
Marketing Costs 5 0.4 2 0.3
Miscellaneous 7 0.6 6 0.9
Total 51 4.8 40 14.5
GROSS MARGIN 431 10.7 331 25.9
FIXED COSTS
Labour - Farmer & Spouse 11 1.2 8 2.5
Labour - unpaid 3 0.6 5 1.6
Labour - paid 17 1.4 15 3.1
Machinery - Tractors 45 2.2 37 4.1
Machinery - Implements 63 5.4 55 11.3
Specific Machinery - Unused 0 0.1 0 0.0
Combine Crop Storage Equipm't Charge 4 0.6 2 1.1
Combine Crop Storage Buildings Charge 3 0.6 1 0.4
Rent 147 4.2 133 11.9
Drainage Charges 2 0.3 3 0.9
Total 294 8.2 259 16.8
OVERHEADS
Overheads - Labour 9 0.4 8 0.9
Overheads - Machinery 13 0.8 10 1.7
Overheads - Buildings 0 0.1 0 0.1
Overheads - General 61 2.8 112 15.4
Total 83 3.2 131 15.4
TOTAL COSTS 649 10.0 579 24.8
NET MARGIN 54 13.1 -59 27.7
Agri-environmental payments (H) 3 0.8 5 2.6
NET MARGIN (including H) 56 13.2 -55 27.5

16
Comparison by EU region
Winter sown
For the winter sown crop, yields were highest in the North at 3.80 tonnes per hectare,
which meant that despite having the lowest price this region had the highest value of
output at £774 per hectare (Table 3.3). Material costs were broadly similar. In the
East, other variable costs were also lower, due to less contract work, but fixed costs
were higher than in the other two regions, due to higher machinery costs. Total costs
in each of the three regions were broadly similar, ranging from £631 in the East to
£650 in the West. There was no significant difference in net margin between the East
(£58 per hectare) and the West (£57 per hectare), but in the North it was much higher
(£138 per hectare) due to the higher yield. Though of a different magnitude, the agri-
environment scheme payments varied between £3.41 per hectare in the East and £1.18
per hectare in the West.
Overall, the greater profitability of farms in the North region was due almost entirely
to the better yield, an outcome that accords with the results of the 1996 survey. The
financial performance of farms in the East and the West in 2004 was broadly similar.
The relative position of farms in the East, in terms of net margin, worsened compared
with 1996, due to poorer yields.
Spring sown
With only 30 farms in the total sample growing the spring sown crop, the number of
farms in the regional sub-samples is small. No figures for the North have been
reported as there is only a single sampled farm in this region growing the spring sown
crop. The figures for the other two regions, reported in Table 3.4, should be treated
with a degree of circumspection. Yields and price, and therefore value of output, were
similar in the East and West regions. Material costs in the West were higher due to
higher crop protection costs, but net margin-over-materials across the two regions was
similar. There are some differences in other costs between the two regions, for
example, contract, machinery, rent and general overheads, causing total costs to be
£23 per hectare higher in the West (£597 per hectare versus £574). The average net
margin per hectare, excluding agri-environment scheme payments, was negative in
both regions, -£54 in the East and -£64 in the West. As with the winter sown crop,
agri-environment scheme payments were considerably higher on farms in the East
(£5.48 per hectare versus £2.22).

17
Table 3.3 Output, costs and margins for winter oilseed rape by EU region, 2004
North East West
Number of observations 41 107 47
CROP YIELD AND OUTPUT s.e. s.e. s.e.
Area grown (ha) 50 7.3 65 5.5 53 13.2
Yield (tonnes/ha) 3.8 0.1 3.1 0.1 3.1 0.1
Sale price (£/tonne) 141 2.3 146 1.4 150 1.7
RETURNS £/ha £/ha £/ha
Area payment 237 0.1 234 2.2 236 1.8
Output - OSR 538 17.7 455 13.3 470 16.9
Output - straw 0 0.0 0 0.1 0 0.4
Total 774 17.6 689 14.2 707 17.8
MATERIAL COSTS
Seed 32 2.1 29 1.4 30 2.0
Fertiliser 104 4.7 88 3.4 102 4.9
Crop protection materials 92 5.0 95 2.8 102 5.2
Total 229 8.0 212 5.2 235 6.3
MARGIN OVER MATERIALS 546 18.4 477 13.3 472 17.8
OTHER VARIABLE COSTS
Casual labour 1 0.3 2 0.4 3 0.4
Contract 37 11.5 22 5.8 35 10.1
Fuel for drying 4 0.6 3 0.4 5 0.6
Marketing Costs 5 0.8 5 0.6 4 0.7
Miscellaneous 5 1.0 7 0.8 7 1.0
Total 51 11.3 38 6.1 53 10.3
GROSS MARGIN 495 20.0 439 14.9 419 20.2
FIXED COSTS
Labour - Farmer & Spouse 10 2.1 7 1.7 8 2.5
Labour - unpaid 5 1.6 2 0.7 1 0.8
Labour - paid 17 2.6 20 2.0 19 2.3
Machinery - Tractors 46 3.4 43 3.5 39 3.1
Machinery - Implements 53 3.5 70 9.5 50 4.8
Specific Machinery - Unused 0 0.2 0 0.0 0 0.1
Crop Storage Equipm't Charge 5 0.9 3 0.9 4 0.9
Crop Storage Build'g Charge 2 0.5 3 1.0 3 1.2
Rent 143 3.9 150 7.3 154 4.5
Drainage Charges 1 0.3 3 0.4 0 0.1
Total 281 8.1 301 13.7 279 10.4
OVERHEADS
Overheads - Labour 9 0.7 8 0.7 8 0.7
Overheads - Machinery 12 0.6 13 1.3 10 1.0
Overheads - Buildings 0 0.1 0 0.1 0 0.2
Overheads - General 56 1.4 58 4.5 64 5.6
Total 76 1.9 80 5.2 83 5.9
TOTAL COSTS 637 11.2 631 17.0 650 11.2
NET MARGIN 138 18.1 58 20.3 57 19.4
Agri-environment payments (H) 1 2.7 3 1.0 1 0.5
NET MARGIN (including H) 139 18.3 62 20.4 58 19.4

18
Table 3.4 Output, costs and margins for spring oilseed rape by EU region, 2004
East West
Number of observations 20 9
CROP YIELD AND OUTPUT s.e. s.e.
Average area grown (hectares/farm) 29 4.9 37 11.5
Yield (tonnes/ha) 2.0 0.2 2.1 0.1
Sale price (£/tonne) 141 3.2 144 5.0
RETURNS £/ha £/ha
Area payment 237 0.5 237 0.1
Output - OSR 283 30.9 296 24.7
Output – straw 0 0.0 0 0.0
Total 520 31.1 533 24.7
MATERIAL COSTS
Seed 28 4.4 26 5.4
Fertiliser 73 9.5 72 6.4
Crop protection materials 43 8.7 65 7.7
Total 145 15.9 163 3.8
MARGIN OVER MATERIALS 375 31.4 370 23.3
OTHER VARIABLE COSTS
Casual labour 2 0.9 1 0.6
Contract 18 16.0 34 33.3
Fuel for drying 2 0.6 4 0.9
Marketing Costs 3 0.4 2 0.2
Miscellaneous 5 1.2 7 1.8
Total 31 15.9 47 33.7
GROSS MARGIN 345 36.8 323 29.5
FIXED COSTS
Labour - Farmer & Spouse 5 2.1 8 6.1
Labour - unpaid 3 1.6 13 4.2
Labour - paid 21 4.0 10 4.3
Machinery - Tractors 35 4.5 41 9.4
Machinery - Implements 66 15.9 35 8.9
Specific Machinery - Unused 0 0.0 0 0.0
Combinable Crop Storage Equipment Charge 1 0.7 4 3.2
Combinable Crop Storage Buildings Charge 1 0.5 2 0.7
Rent 126 17.0 156 9.1
Drainage Charges 5 1.3 0 0.0
Total 261 23.4 270 22.5
OVERHEADS
Overheads - Labour 8 1.1 9 2.0
Overheads - Machinery 11 2.1 9 3.7
Overheads - Buildings 0 0.1 0 0.1
Overheads - General 118 18.5 98 30.1
Total 137 18.0 117 32.0
TOTAL COSTS 574 31.6 596 39.2
NET MARGIN -54 37.1 -64 41.1
AGRI-ENVIRONMENT SCHEME PAYMENTS (H) 5 3.7 2 2.7
NET MARGIN (including H) -48 37.0 -62 40.6

19
Comparison by size of enterprise2
A breakdown of the costs and returns of the winter oilseed rape crop by size of
holding is given in Tables 3.5 and 3.6. Size of holding is defined in terms of rotational
area in Table 3.5, and in terms of area of oilseed rape grown in Table 3.6. Any
differences reported are significant at the 10% level, which means we can be fairly
confident (90%) that a difference exists between the corresponding groups of all
farms growing winter oilseed rape. The size of the sample for the spring sown crop
was not sufficiently large to allow a corresponding breakdown.
Winter sown
Based on rotational area, there are no significant differences in yield between the four
size groups (Table 3.5). Although the average price achieved by the largest farms
(>450 hectares) is significantly greater than that achieved by the smallest (<150
hectares), there are no significant differences in total returns. Similarly, seed cost is
significantly lower on the largest farms, but there are no differences in margin-over-
materials across the four groups. Lower contract labour costs on the two largest farm
groups lead to higher gross margins on these farms. Similarly, there are clear
differences in the costs of the different types of labour that are categorised under fixed
costs, but these cancel out such that there are no significant differences in total fixed
costs. However, the farms with a rotational area of more than 450 hectares have lower
total costs, and higher net margins, than farms with less than 250 hectares. Although
the sample data suggest that average production costs per tonne fall across all four
groups as rotational area increases, these differences are not significant. However,
average costs of production and economies of size are examined in greater detail in
section 3.4.
Based on area of oilseed rape grown, there are again no significant differences in
yield across the four groups (Table 3.6). The price obtained on the smallest
enterprises (10-20 hectares) was significantly less than the prices obtained by the
other three groups, but this was insufficient to generate differences in total returns.
There are differences in costs of seed and crop protection materials, but again not
sufficient to cause any significant differences in margin-over-materials. However,
differences in other variable costs, particularly for contract labour, lead to higher
gross margins for the larger enterprises (50-100 and >100 hectares). As with the
breakdown based on rotational area, differences in some of the elements of fixed
costs, particularly labour and rent, cancel out, resulting in no significant differences
across the four groups in total fixed costs. Lower overheads on the larger enterprises
contribute to higher net margins on these farms. Again, no significant differences are
recorded in average costs of production per tonne across the four groups.
2 A detailed analysis of economies in costs of production is presented in section 3.4.

20
Table 3.5 Output, costs and margins for winter oilseed rape by rotational area, 2004
1 2 3 4
<150 ha 150-250 ha 250-450 ha >450 ha Significant
Number observations 52 54 47 42
CROP YIELD & OUTPUT se se se se
Area grown (ha) 20 1.4 35 1.9 60 3.4 138 15.3 1<2,3,4; 2<3,4; 3<4
Yield (tonnes/ha) 3 0.1 3 0.1 3 0.1 3 0.1
Sale price (£/tonne) 141 2.4 144 1.5 146 2.2 148 2.0 1<4
RETURNS £/ha £/ha £/ha £/ha
Area payment 235 1.6 237 1.6 229 4.7 237 0.3 3<4
Output – OSR 446 19.1 465 16.5 483 20.7 475 19.1
Output - straw 0 0.3 0 0.4 0 0.0 0 0.0
Total 681 19.7 703 17.2 712 23.4 712 19.1
MATERIAL COSTS
Seed 32 2.3 34 1.8 33 2.0 27 2.0 1,2,3>4
Fertiliser 92 5.6 104 3.8 96 5.0 90 4.7 1<2; 2>4
Crop protection materials 93 5.8 93 3.2 95 3.9 98 4.7
Total 217 9.3 231 5.1 225 6.6 214 7.8 2>4
MARGIN OVER MATERIALS 464 19.1 472 17.6 487 21.8 498 18.0
OTHER VARIABLE COSTS
Casual labour 1 0.3 1 0.3 1 0.5 3 0.7 1,2,3<4
Contract 58 11.7 50 8.5 31 8.1 12 5.8 1>3,4; 2,3>4
Fuel for drying 3 0.5 4 0.5 3 0.5 4 0.7
Marketing Costs 6 1.1 5 0.7 5 0.7 4 0.5
Miscellaneous 9 1.4 6 0.9 5 1.1 7 1.0 1>3
Total 76 12.0 66 8.6 46 8.2 30 6.0 1>3,4; 2>3,4
GROSS MARGIN 387 20.5 406 20.3 442 23.0 468 18.1 1<3,4; 2<4
FIXED COSTS
Labour - Farmer & Spouse 28 3.0 18 1.7 6 0.8 2 0.8 1>2,3,4; 2>3,4; 3>4
Labour - unpaid 5 1.3 4 1.1 2 1.1 1 0.9 1>3,4; 2>4
Labour - paid 3 1.2 15 2.3 21 2.2 23 3.9 1<2,3,4; 2<3,4
Machinery - Tractors 48 4.0 51 3.9 44 3.2 39 6.5
Machinery - Implements 48 7.7 53 8.6 72 17.4 64 6.5
Specific Machinery - Unused 0 0.1 0 0.0 0 0.2 0 0.0
Crop Storage Equip't Charge 4 0.7 5 0.8 4 0.8 3 2.2
Crop Storage Build'g Charge 2 0.8 4 1.2 6 2.0 1 0.3 2,3>4
Rent 141 4.1 142 4.3 145 13.9 155 9.3
Drainage Charges 1 0.4 1 0.4 2 0.6 2 0.7 2<4
Total 281 13.5 292 11.6 301 23.6 291 15.3
OVERHEADS
Overheads - Labour 11 0.9 10 0.8 8 0.6 8 1.2 1>3,4; 2>3,4
Overheads - Machinery 14 1.4 13 1.7 12 1.8 12 1.2
Overheads - Buildings 1 0.2 1 0.2 1 0.2 0 0.0 1,2,3>4
Overheads - General 69 4.9 62 1.9 55 1.4 58 11.2 1,2>3
Total 95 5.1 85 3.1 76 2.0 77 12.7 1, 2>3
TOTAL COSTS 669 16.9 674 13.6 648 23.8 612 26.8 1,2>4
NET MARGIN 12 20.8 29 21.4 64 28.2 100 35.3 1,2<4
Agri-environm't payments (H) 4 2.3 3 1.1 2 1.1 2 1.2
NET MARGIN (including H) 15 21.3 32 21.5 67 28.3 103 35.2 1,2<4
PRODUCTION COSTS (£/t) 211 21.7 208 10.6 196 60.9 190 16.7

21
Table 3.6 Output, costs and margins for winter oilseed rape by area grown, 2004
1 2 3 4
10-20 ha 20-50 ha 50-100 ha >100 ha Significant
Number of observations 33 74 55 27
CROP YIELD AND OUTPUT s.e. s.e. s.e. s.e.
Area grown (ha) 15 0.5 31 0.9 69 2.0 181 19.1 1<2,3,4; 2<3,4; 3<4
Yield (tonnes/ha) 3 0.2 3 0.1 3 0.1 3 0.1
Sale price (£/tonne) 137 3.4 144 1.7 147 1.3 147 1.7 1<2,3,4
RETURNS £/ha £/ha £/ha £/ha
Area payment 233 2.6 236 1.1 232 4.0 237 0.5
Output - OSR 428 30.0 462 14.2 483 17.1 475 22.5
Output - straw 1 0.6 0 0.2 0 0.0 0 0.0
Total 662 31.4 698 14.3 715 19.4 713 22.4
MATERIAL COSTS
Seed 33 2.9 35 1.8 31 1.6 26 2.3 1,2>4; 2>3
Fertiliser 93 8.1 99 3.6 97 4.2 89 6.3
Crop protection materials 82 6.1 95 3.7 93 3.8 101 5.5 1<2,4
Total 209 12.9 229 5.0 220 6.0 216 10.5
MARGIN OVER
MATERIALS 453 30.2 470 15.3 494 16.9 497 21.3
OTHER VARIABLE COSTS
Casual labour 0 0.1 2 0.4 1 0.4 3 0.8 1<2,3,4; 3<4
Contract 68 16.7 47 7.3 29 6.6 13 8.6 1,2>3,4
Fuel for drying 3 0.7 3 0.4 3 0.5 4 0.9
Marketing Costs 6 1.4 5 0.8 4 0.4 4 0.6
Miscellaneous 8 1.8 8 1.0 5 0.7 7 1.5 1,2>3
Total 85 17.1 66 7.4 42 6.8 31 8.9 1,2>3,4
GROSS MARGIN 368 31.0 404 17.7 452 17.4 466 21.7 1,2<3,4
FIXED COSTS
Labour - Farmer & Spouse 24 4.1 17 1.8 7 1.4 3 1.0 1>2,3,4; 2>3,4; 3>4
Labour - unpaid 4 1.6 3 0.9 3 1.1 1 0.6 1,2>4
Labour - paid 9 3.8 14 1.9 20 1.9 23 5.0 1<3,4; 2<3
Machinery - Tractors 50 9.1 50 3.2 44 2.6 38 4.3 2>4
Machinery - Implements 51 11.2 66 11.2 66 9.8 59 4.9
Specific Machinery - Unused 0 0.0 0 0.1 0 0.0 0 0.0
Crop Storage Equip't Charge 4 2.8 4 0.6 4 0.8 3 0.9
Crop Storage Build'gs Charge 1 0.4 3 0.8 6 1.9 1 0.4 1<2,3; 2,3>4
Rent 131 4.6 151 9.2 137 7.1 160 6.6 1<2,4; 3<4
Drainage Charges 1 0.6 2 0.5 1 0.2 2 1.0
Total 275 22.7 311 16.3 288 12.0 290 9.6
OVERHEADS
Overheads - Labour 11 1.7 10 0.6 8 0.5 7 1.3 1,2>3,4
Overheads - Machinery 13 2.1 15 1.6 12 1.0 11 1.2
Overheads - Buildings 0 0.1 1 0.1 1 0.2 0 0.0 1<2,3; 2,3>4
Overheads - General 77 12.5 62 1.6 56 1.2 56 1.4 1,2>3,4
Total 102 14.6 87 2.7 77 1.6 75 2.7 1,2>3,4
TOTAL COSTS 671 35.7 693 16.1 627 14.1 612 17.2 2>3,4
NET MARGIN -9 45.6 5 18.6 87 21.1 101 26.6 1,2<3,4
Agri-environ payments (H) 4 3.3 2 1.0 3 1.2 2 1.6
NET MARGIN (including H) -5 46.1 8 18.7 91 21.2 103 26.4 1,2<3,4
PRODUCTION COSTS (£/t) 216 36.7 216 8.4 190 52.1 190 14.0

22
Distribution of results
Underlying the averages for England presented in Table 3.1 is a range of performance
across individual farms. As an indication of the extent of this range, the top 25 per
cent (upper quartile) and bottom 25 per cent (lower quartile) of farms in the sample
were separated in terms of margin-over-materials. The averages of these sub-samples
are presented, along with the means, in Tables 3.7 and 3.8.
Winter sown
In terms of value of output, the most noticeable difference between these two groups
is in yield; 3.96 tonnes per hectare for the top 25 per cent of farms and 2.10 tonnes per
hectare for the bottom 25 per cent (Table 3.7). Coupled with a higher price (£151
versus £141 per tonne), this resulted in an average output per hectare for the best
performing farms of £834 compared to £523 for the poorest performers. Material
costs were similar across the two groups, meaning that margin-over-materials was
twice as high for the best performers. Indeed, other variable costs, fixed costs and
overheads were also similar for the two groups of farms, but the difference in value of
output meant that the worst performing farms had a negative net margin, excluding
agri-environment scheme payments, of -£105 per hectare, whilst for the best
performing farms it was £217 per hectare, compared to the average of all farms of
£72.
Spring sown
The picture is similar for the spring grown crop in terms of yield, price and value of
output (Table 3.8). However, material costs for the bottom 25 per cent were
considerably higher than for the top 25 per cent, accentuating the difference in
margin-over-materials between the two groups. There are some further differences in
other costs, but the sample sizes in this breakdown are small and the analysis needs to
be treated accordingly. Net margin of the eight poorest performers averaged -£265 per
hectare, compared to £13 per hectare for the eight best performers.

23
Table 3.7
Results for winter oilseed rape by margin over materials quartile groups, England, 2004
Bottom 25% Mean Top 25%
Number of observations 49 195 49
CROP YIELD AND OUTPUT s.e. s.e. s.e.
Area grown (ha) 46 6.0 59 4.6 59 6.7
Yield (tonnes/ha) 2 0.1 3 0.1 4 0.1
Sale price (£/tonne) 141 2.0 146 1.0 151 2.4
RETURNS £/ha £/ha £/ha
Area payment 227 4.9 235 1.3 237 0.1
Output - OSR 296 15.5 473 9.5 597 11.4
Output - straw 0 0.0 0 0.1 0 0.4
Total 523 18.4 708 10.0 834 11.4
MATERIAL COSTS
Seed 27 2.4 30 1.0 28 1.9
Fertiliser 93 6.3 94 2.4 92 4.5
Crop protection materials 93 5.5 96 2.3 92 4.6
Total 213 9.7 220 3.7 212 6.4
MARGIN OVER MATERIALS 310 13.1 488 9.7 622 10.7
OTHER VARIABLE COSTS
Casual labour 1 0.3 2 0.2 1 0.3
Contract 27 10.6 27 4.7 26 10.1
Fuel for drying 2 0.4 4 0.3 5 0.7
Marketing Costs 3 0.8 4 0.4 4 0.4
Miscellaneous 6 0.9 7 0.6 5 0.9
Total 39 10.8 44 4.8 41 10.1
GROSS MARGIN 272 15.5 444 10.7 580 15.3
FIXED COSTS
Labour - Farmer & Spouse 11 2.2 8 1.2 7 1.7
Labour - unpaid 0 0.7 2 0.6 4 1.4
Labour - paid 19 3.8 19 1.4 19 2.3
Machinery - Tractors 40 6.1 43 2.2 43 3.2
Machinery - Implements 75 12.9 62 5.4 58 4.2
Specific Machinery - Unused 0 0.2 0 0.1 0 0.0
Crop Storage Equipment Charge 2 1.9 3 0.6 5 1.0
Crop Storage Buildings Charge 1 0.7 3 0.6 3 0.7
Rent 135 7.9 149 4.2 148 13.4
Drainage Charges 4 0.7 2 0.3 2 0.3
Total 288 18.9 293 8.2 288 15.8
OVERHEADS
Overheads - Labour 9 1.2 8 0.4 9 0.7
Overheads - Machinery 15 1.8 12 0.8 11 0.7
Overheads - Buildings 0 0.1 0 0.1 0 0.1
Overheads - General 65 9.5 59 2.8 55 1.0
Total 89 10.7 80 3.2 75 1.6
TOTAL COSTS 628 27.2 636 10.0 617 17.1
NET MARGIN -105 26.3 72 13.1 217 14.8
Agri-environment payments (H) 4 1.1 3 0.8 3 2.4
NET MARGIN (including H) -101 26.4 75 13.2 221 14.8

24
Table 3.8
Results for spring oilseed rape by margin over materials quartile groups in England, 2004
Bottom 25% Mean Top 25%
Number of observations 8 30 8
CROP YIELD AND OUTPUT s.e. s.e. s.e.
Area grown (ha) 17 3.7 32 4.7 31 9.8
Yield (tonnes/ha) 1 0.1 2 0.1 3 0.2
Sale price (£/tonne) 145 2.1 142 2.6 154 3.9
RETURNS £/ha £/ha £/ha
Area payment 237 0.1 237 0.3 238 1.2
Output - OSR 150 15.4 284 21.8 410 31.8
Output - straw 0 0.0 0 0.0 0 0.0
Total 387 15.4 521 21.8 647 32.0
MATERIAL COSTS
Seed 42 5.0 28 3.3 19 8.6
Fertiliser 79 6.4 72 6.6 66 3.7
Crop protection materials 64 13.0 50 6.2 52 13.7
Total 185 13.5 151 10.6 137 15.1
MARGIN OVER MATERIALS 202 22.5 370 21.9 510 25.7
OTHER VARIABLE COSTS
Casual labour 0 0.0 2 0.6 5 2.0
Contract 29 30.5 24 14.5 28 38.5
Fuel for drying 0 0.5 3 0.5 2 0.6
Marketing Costs 1 0.1 3 0.3 5 0.9
Miscellaneous 5 1.8 6 0.9 8 2.1
Total 36 29.9 37 14.5 48 39.2
GROSS MARGIN 166 33.0 333 25.9 462 53.6
FIXED COSTS
Labour - Farmer & Spouse 2 6.0 7 2.5 6 5.2
Labour - unpaid 1 2.3 6 1.6 3 3.2
Labour - paid 20 5.2 16 3.1 29 8.6
Machinery - Tractors 35 8.6 38 4.1 45 9.0
Machinery - Implements 65 17.5 53 11.3 73 33.3
Specific Machinery - Unused 0 0.0 0 0.0 0 0.0
Crop Storage Equipment Charge 0 0.3 2 1.1 3 1.7
Crop Storage Buildings Charge 1 0.4 1 0.4 1 0.7
Rent 89 41.3 134 11.9 144 10.2
Drainage Charges 4 1.7 3 0.9 7 2.7
Total 218 38.1 261 16.8 313 39.3
OVERHEADS
Overheads - Labour 7 1.8 8 0.9 11 2.6
Overheads - Machinery 12 4.1 10 1.7 13 3.7
Overheads - Buildings 0 0.0 0 0.1 0 0.1
Overheads - General 194 27.7 108 15.4 113 28.9
Total 213 30.5 127 15.4 137 24.9
TOTAL COSTS 651 49.8 576 24.8 635 35.1
NET MARGIN -265 44.2 -55 27.7 13 46.8
Agri-environment payments (H) 9 7.3 4 2.6 4 5.0
NET MARGIN (including H) -256 47.1 -51 27.5 16 44.0

25
Comparison of performance by manager
Dividing the sample of the winter sown crop into three sub-samples according to age
of the manager shows that the over 55 years of age group under-performs both groups
of younger managers in terms of yield, margin-over-materials and gross margin
(Table 3.9). Although the youngest group, under 46 years of age, appears to manage a
larger area of the crop than the other two groups, this difference is not statistically
significant. There are no other statistically significant differences between the under
46, and 46 to 55, age groups.
Table 3.9 Comparison of performance by age of manager, winter oilseed rape, 2004
Age band 1 2 3
Significant
Age range (years) < 46 46 to 55 > 55
Observations number 71 s.e. 72 s.e. 52 s.e.
Area Oilseeds ha 70 10.1 56 5.5 57 7.7
Yield t/ha 3.1 0.1 3.3 0.1 2.9 0.1 2>3
Margin over Materials £/ha 481 17 478 14 432 21.0 1,2>3
Gross Margin £/ha 445 18 434 16 382 23.3 1,2>3
Dividing the sample on the basis of training and education, those managers with a
college education perform better than those with only schooling in terms of gross
margin (Table 3.10). More convincingly, those with a college education out-perform
those with a degree over all three measures - yield, margin-over-materials and gross
margin. Not the best advert for a university education! Those with a college or
university education manage significantly larger areas planted to oilseed rape.
Table 3.10
Comparison of performance by training of manager, winter oilseed rape, 2004
Training band 1 2 3
Significant
Description A level College Degree
Observations number 45 s.e. 117 s.e. 30 s.e.
Area Oilseeds ha 44.7 6.4 66.5 6.8 71.5 10.0 1<2,3
Yield t/ha 3.1 0.1 3.2 0.1 2.8 0.1 2>3
Margin over Materials £/ha 451 19.2 486 12.9 419 24.3 2>3
Gross Margin £/ha 393 22.5 448 13.6 377 28.1 1,3<2
Historical comparison of costs and returns
A comparison of the costs and returns recorded in the last five special studies on
oilseed rape is given in Tables 3.11 and 3.12. For ease of comparison, all prices have
been expressed in 2004 values using agricultural price indices for outputs and inputs.
Winter sown
Market price has fallen dramatically over the last 30 years. This has been
compensated somewhat in the two most recent survey years by the area payment,
following changes to the Common Agricultural Policy. Over the five survey years,

26
value of output, margin-over materials, gross margin and net margin have all see-
sawed, being at their highest, in 2004 prices, in 1982 and 1996. Fertiliser costs have
halved in real terms over the period. A low yield led to an unusually high cost per
tonne (£378) in 1975, and likewise, a high yield led to unusually low cost per tonne
(£190) in 1996.
Table 3.11 Comparison between means for winter oilseed rape, 1975 to 2004
Year 1975 1982 1990 1996 2004
Sample size 61 147 201 242 195
Yield (tonnes/ha) 1.9 3.3 3 3.9 3.2
Price (£/tonne) 400 370 261 160 146
Area payment (£/ha) 376 235
Oilseed output (£/ha) 773 1207 784 625 473
Total Output (£/ha) 773 1207 784 1000 708
Seed (£/ha) 36 31 34 39 30
Fertiliser (£/ha) 203 202 120 113 94
Crop protection materials (£/ha) 44 108 95 109 96
Margin over Materials (£/ha) 490 866 535 739 488
Other variable costs (£/ha) 64 52 44 49 44
Gross Margin (£/ha) 426 815 492 691 444
Labour (£/ha) 46 34 46 43 29
Machinery (£/ha) 109 188 122 125 106
Storage (£/ha) 0 0 19 5 6
Rent (£/ha) 134 157 135 142 151
Overheads (£/ha) 94 63 122 115 80
Net Margin† (£/ha) 44 373 48 261 72
Average production cost (£/tonne) 378 256 245 190 196
Note: values adjusted to 2004 using agricultural price indices.
† excludes environmental payments.
Spring sown
Survey results for the spring sown crop are not available for 1975 and 1982, and the
sample for 1990 is small. Notwithstanding, some comparisons can be made. Value of
output was higher in 1996 than in 1990, with the area payment more than
compensating for the fall in price (Table 3.12). With costs being similar, net margin
per hectare, in 2004 prices, was £146 in 1996 compared with only £35 in 1990. In
contrast, value of output was considerably lower in 2004, due to a combination of
lower yield, lower price and lower area payment. Most costs in this year were also
higher, leading to the negative net margin per hectare of -£51.

27
Table 3.12 Comparison between means for spring oilseed rape, 1975 to 2004
Year 1975 1982 1990 1996 2004
Sample size n.a 2 13 54 30
Yield (tonnes/ha) n.a n.a 2.4 2.3 2.0
Price (£/tonne) n.a n.a 258 163 142
Area payment (£/ha) 369 237
Oilseed output (£/ha) 627 364 284
Total Output (£/ha) n.a n.a 627 734 521
Seed (£/ha) n.a n.a 43 40 28
Fertiliser (£/ha) n.a n.a 86 70 72
Crop protection materials (£/ha) n.a n.a 38 42 50
Margin over Materials (£/ha) n.a n.a 460 582 370
Other variable costs (£/ha) n.a n.a 41 40 37
Gross Margin (£/ha) n.a n.a 419 542 333
Labour (£/ha) n.a n.a 33 35 30
Machinery (£/ha) n.a n.a 94 99 91
Storage (£/ha) n.a n.a 24 4 4
Rent (£/ha) n.a n.a 123 148 137
Overheads (£/ha) n.a n.a 111 111 127
Net Margin† (£/ha) n.a n.a 35 146 -51
Average production cost (£/tonne) n.a n.a 249 256 289
Note: values adjusted to 2004 using agricultural price indices.
n.a. not available. † excludes environmental payments.
3.4 Economies of size
The 1996 oilseed rape study contained a note on economies of scale.3 This notion is
concerned with what happens to unit costs of production as the level of output is
varied. The earlier report of 1991 indicated that there was evidence of correlation
between net margin and size of enterprise or farm, due to a combination of lower
yields on the smaller farms and lower costs per hectare on the larger farms. In cereal
and sugar reports from the University of Cambridge there is also some evidence,
albeit slight, of higher unit costs on smaller enterprises. As various reports have noted,
some of the costs recorded in these surveys are imputed and therefore mask possible
differences between small and large enterprises. The 1996 oilseed rape report
concluded that “… there is no relationship between size of farm or enterprise and
levels of output or margins as far as oilseed rape is concerned”, although “… there is
scope here for further research and analysis” (p.34).
3 Economies of scale is a special case of economies of size. The former relates to the effect on
production of a proportionate change in all inputs, whereas the latter is less restrictive and relates to
variation in some or all inputs. In this section we focus on economies of size.

28
In this section we take the opportunity to explore further the possibility of economies
of size in oilseed rape production. We estimate a long-run average cost (LAC) curve,
which relates average (unit) cost of production per tonne to size of enterprise or farm.
Economic theory postulates that the LAC curve shows the minimum unit cost of
producing every feasible level of output. Traditionally, the curve is assumed to be U-
shaped, reflecting economies of size (falling unit costs) up to a certain level of
production and then diseconomies of size (rising unit costs) at higher levels of output.
However, empirical studies have often failed to detect diseconomies of size even at
very high levels of output. This causes the LAC curve to be more of an L-shape, i.e.
unit costs initially falling as level of output increases, but then remaining fairly
constant.
As a starting point, recall the results for winter oilseed rape presented by size of
enterprise in section 3.3 and Tables 3.5 and 3.6. The averages for the four sub-
samples showed that cost per tonne decreased as enterprise size increased. However,
these differences were not statistically significant, which means we cannot be
confident that such differences actually exist amongst all farms growing the crop. A
scatter plot of average cost per tonne (i.e., total cost divided by total output in terms of
oilseed rape) against level of output is shown in Figure 3.1. This scatter plot shows
that the costs on some smaller enterprises are indeed higher, but that diseconomies of
size (i.e., rising average costs) are not discernible at higher levels of output. This
suggests that an L-shaped curve would seem more appropriate than the traditional U-
shaped curve.
We use an econometric approach4 to estimate the line (LAC) that best represents the
relationship between average cost and level of output, as depicted in the scatter plot.
This could be done by relating average cost to actual output (as in Figure 3.1), but
previous research in this area has argued that it is better to relate average cost to
planned output, on the basis that costs are more likely to reflect what the farmer plans
or expects his output to be. With this in mind, a two-step procedure is adopted. In the
first step, the farmer’s planned output is determined by estimating a production
function based on the farmer’s actual use of inputs (seed, fertiliser, labour, land, etc.).
In the second step, the LAC curve is estimated using this planned output rather than
the farmer’s actual output; thus, average cost is calculated as total cost divided by
planned output and then related to the level of planned output. The resulting LAC
curve is shown in Figure 3.2, superimposed on the scatter plot of average cost against
planned output. It would seem that any economies of size are quickly exhausted at a
fairly low level of output, around 75 tonnes, or 25 hectares.
4 We would like to thank Phil Dawson for undertaking the econometrics in this part of the report.

29
Figure 3.1 Actual Average Costs
0
100
200
300
400
500
600
700
0
100
200
300
400
500
600
700
800
900
Actual Output (tonnes)
Act
ual
Av
erag
e C
ost
s (£
/to
nn
e)
Figure 3.2 Long-run average cost curve
0
50
100
150
200
250
0
100
200
300
400
500
600
700
800
Planned Output (tonnes)
Pla
nn
ed A
ver
age
Co
st (
£/t
on
ne)

30

31
Chapter 4
Management practices
4.1 Introduction
This chapter presents some results from the sampled farms relating to the use of seed,
fertilisers and chemicals, and to performance measures of different management
practices. As in the previous chapter, any differences reported are significant at the
10% level, which means we can be fairly confident (90%) that a difference exists
between the corresponding groups of all farms growing oilseed rape.
4.2 Seed
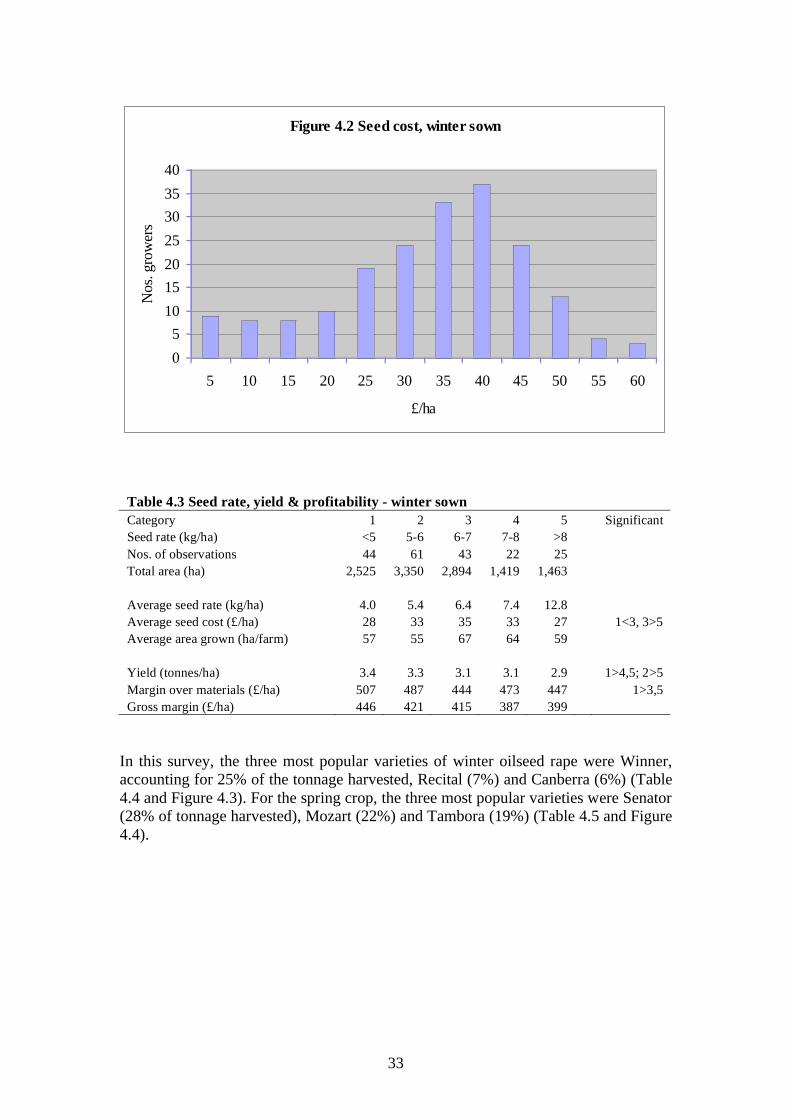
The most popular rate of seeding for the winter sown crop is around 5.5 kilograms per
hectare (see Table 4.1 and Figure 4.1) and the most usual cost of seed is around £40
per hectare (see Table 4.2 and Figure 4.2). In terms of performance, yield per hectare
in this survey falls as seed rate increases, although statistically this is only significant
at seed rates of up to 6 kilograms per hectare (Table 4.3). Margin-over-materials is
also significantly higher at a seed rate of up to 5 kilograms per hectare.
Table 4.1 Seed rate, winter sown
Seed Rate
(kg/ha)
Number of
growers
% of
growers
3 6 3
3.5 3 2
4 5 3
4.5 15 8
5 15 8
5.5 34 17
6 27 14
6.5 28 14
7 15 8
7.5 12 6
8 10 5
8.5 5 3
9 4 2
9.5 1 1
>9.5 15 8
All 195 100

32
Figure 4.1 Seed rate, winter sown
0
5
10
15
20
25
30
35
40
3
3.5 4
4.5 5
5.5 6
6.5 7
7.5 8
8.5 9
9.5
>9
.5
kg/ha
Nos.
gro
wer
s
Table 4.2 Seed cost, winter sown
£/ha
Number
of growers
% of
growers
5 9 5
10 8 4
15 8 4
20 10 5
25 19 10
30 24 13
35 33 17
40 37 19
45 24 13
50 13 7
55 4 2
60 3 2
All 192 100
33
Figure 4.2 Seed cost, winter sown
0
5
10
15
20
25
30
35
40
5 10 15 20 25 30 35 40 45 50 55 60
£/ha
Nos.
gro
wer
s
Table 4.3 Seed rate, yield & profitability - winter sown
Category 1 2 3 4 5 Significant
Seed rate (kg/ha) <5 5-6 6-7 7-8 >8
Nos. of observations 44 61 43 22 25
Total area (ha) 2,525 3,350 2,894 1,419 1,463
Average seed rate (kg/ha) 4.0 5.4 6.4 7.4 12.8
Average seed cost (£/ha) 28 33 35 33 27 1<3, 3>5
Average area grown (ha/farm) 57 55 67 64 59
Yield (tonnes/ha) 3.4 3.3 3.1 3.1 2.9 1>4,5; 2>5
Margin over materials (£/ha) 507 487 444 473 447 1>3,5
Gross margin (£/ha) 446 421 415 387 399
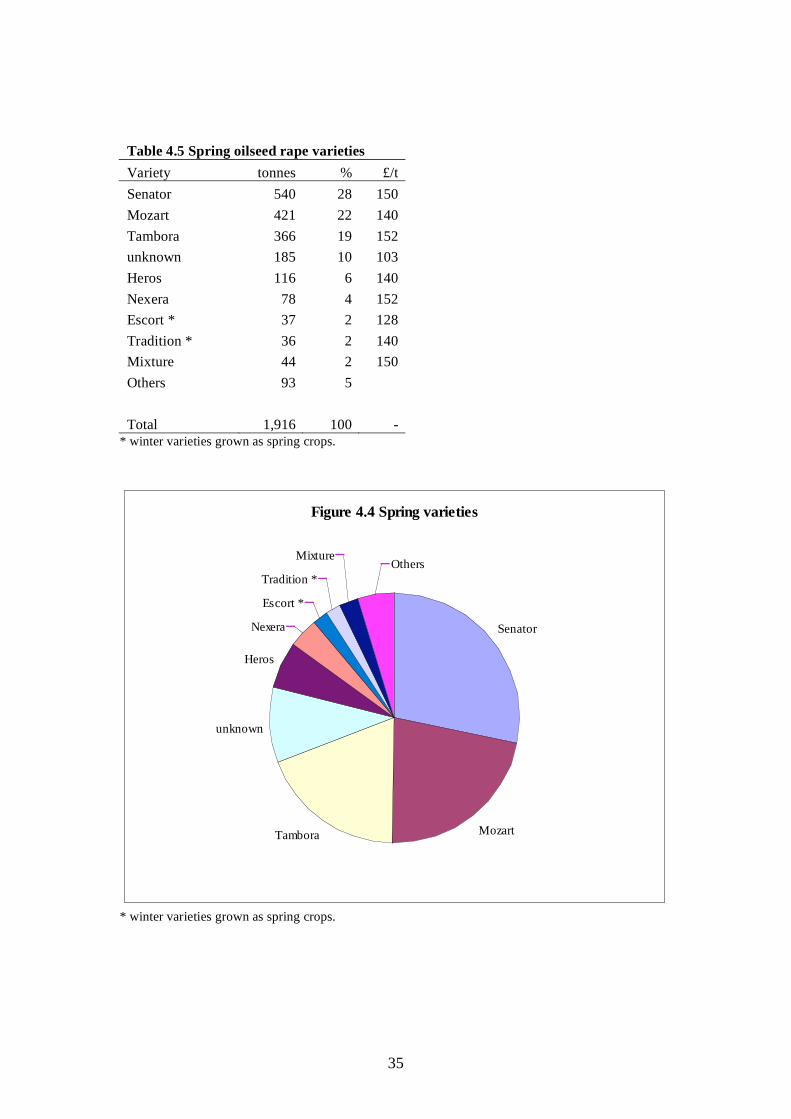
In this survey, the three most popular varieties of winter oilseed rape were Winner,
accounting for 25% of the tonnage harvested, Recital (7%) and Canberra (6%) (Table
4.4 and Figure 4.3). For the spring crop, the three most popular varieties were Senator
(28% of tonnage harvested), Mozart (22%) and Tambora (19%) (Table 4.5 and Figure
4.4).

34
Table 4.4 Winter rape varieties
Variety tonnes % £/t
Mixture 15,608 42 145
Winner 9,151 25 144
Recital 2,505 7 147
Canberra 2,094 6 144
Pollen 1,386 4 151
Unknown 1,574 4 149
Fortis 998 3 155
Courage 581 2 145
Escort 732 2 147
Others 2,583 7 150
Total 37,212 100 146
Figure 4.3 Winter rape varieties
Mixture
Winner
Recital
Canberra
Pollen
Unknown
Fortis
Courage
EscortOthers
35
Table 4.5 Spring oilseed rape varieties
Variety tonnes % £/t
Senator 540 28 150
Mozart 421 22 140
Tambora 366 19 152
unknown 185 10 103
Heros 116 6 140
Nexera 78 4 152
Escort * 37 2 128
Tradition * 36 2 140
Mixture 44 2 150
Others 93 5
Total 1,916 100 - * winter varieties grown as spring crops.
Figure 4.4 Spring varieties
Senator
MozartTambora
unknown
Heros
Nexera
Escort *
Tradition *
MixtureOthers
* winter varieties grown as spring crops.
36
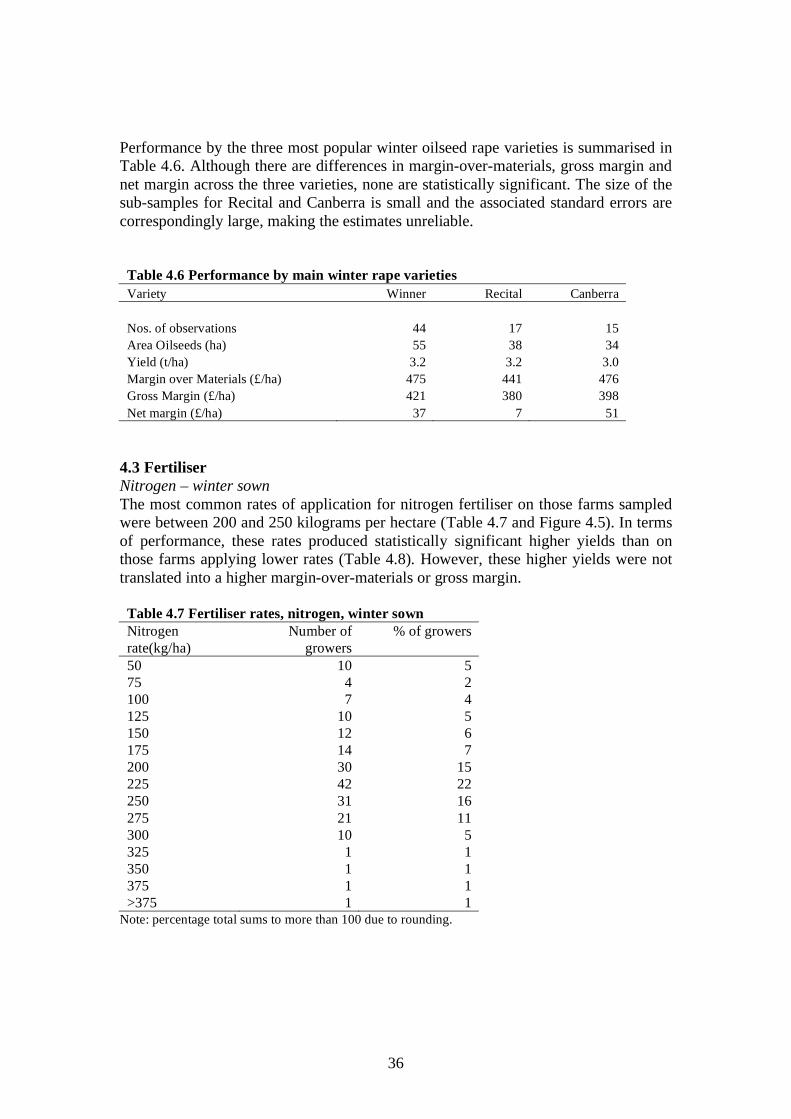
Performance by the three most popular winter oilseed rape varieties is summarised in
Table 4.6. Although there are differences in margin-over-materials, gross margin and
net margin across the three varieties, none are statistically significant. The size of the
sub-samples for Recital and Canberra is small and the associated standard errors are
correspondingly large, making the estimates unreliable.
Table 4.6 Performance by main winter rape varieties
Variety Winner Recital Canberra
Nos. of observations 44 17 15
Area Oilseeds (ha) 55 38 34
Yield (t/ha) 3.2 3.2 3.0
Margin over Materials (£/ha) 475 441 476
Gross Margin (£/ha) 421 380 398
Net margin (£/ha) 37 7 51
4.3 Fertiliser
Nitrogen – winter sown
The most common rates of application for nitrogen fertiliser on those farms sampled
were between 200 and 250 kilograms per hectare (Table 4.7 and Figure 4.5). In terms
of performance, these rates produced statistically significant higher yields than on
those farms applying lower rates (Table 4.8). However, these higher yields were not
translated into a higher margin-over-materials or gross margin.
Table 4.7 Fertiliser rates, nitrogen, winter sown
Nitrogen
rate(kg/ha)
Number of
growers
% of growers
50 10 5
75 4 2
100 7 4
125 10 5
150 12 6
175 14 7
200 30 15
225 42 22
250 31 16
275 21 11
300 10 5
325 1 1
350 1 1
375 1 1
>375 1 1 Note: percentage total sums to more than 100 due to rounding.

37
Figure 4.5 Nitrogen rates, winter sown
05
101520
253035
4045
50 75 100
125
150
175
200
225
250
275
300
325
350
375
>375
kg/ha
Nos.
gro
wer
s
Table 4.8 Nitrogen rate, yield and profitability - winter sown
Category 1 2 3 4 5 Significant
Application rate (kg/ha) <150 150-200 200-225 225-250 >250
Nos. of observations 43 44 42 31 35
Average area grown (ha) 62 70 49 46 69 3,4<5
Yield (tonnes/ha) 3.0 3.1 3.4 3.3 3.2 1<3,4; 2<3
Margin over materials (£/ha) 479 465 483 485 466
Gross margin (£/ha) 429 400 427 426 412
Phosphate – winter sown
Of the 195 farms surveyed, 50 did not apply any phosphates. Of the remainder, the
most popular rates of application were between 50 and 80 kilograms per hectare
(Table 4.9 and Figure 4.6). There were no significant differences in terms of
performance by rate of phosphate application, including those growers who applied
none (Table 4.10).

38
Table 4.9 Fertiliser rates, phosphate, winter sown
Phosphate (kg/ha)
Number of
growers
% of growers
0 50 26
10 2 1
20 8 4
30 10 5
40 9 5
50 27 14
60 25 13
70 22 11
80 20 10
90 11 6
100 4 2
110 3 2
120 2 1
130 1 1
140 1 1
Figure 4.6 Phosphate rates, winter sown
0
10
20
30
40
50
60
0 10 20 30 40 50 60 70 80 90 100 110 120 130 140
kg/ha
Nos.
gro
wer
s
Table 4.10 Phosphate rate, yield and profitability - winter sown
Category 1 2 3 4 5 Significant
Application rate (kg/ha) Zero <30 30-50 50-70 >70
Nos. observations 43 44 42 31 35
Average area grown (ha) 65 57 67 57 52
Yield (tonnes/ha) 3.1 3.1 3.2 3.2 3.4
Margin over materials (£/ha) 484 494 483 457 470
Gross margin (£/ha) 410 426 417 427 418

39
Potassium – winter sown
The pattern for potassium applications is similar to that for phosphates. Fifty-three
growers applied none at all. Of those that did, the most common rates of application
were between 50 and 90 kilograms (Table 4.11 and Figure 4.7). These rates of
application produced significantly higher yields than those farms that used lower rates
or no potassium at all (Table 4.12).
Table 4.11 Fertiliser rates, potash, winter sown
Potash (kg/ha)
Number of
growers
% of growers
0 53 27
10 4 2
20 6 3
30 8 4
40 7 4
50 17 9
60 16 8
70 17 9
80 19 10
90 15 8
100 9 5
110 4 2
120 9 5
130 2 1
140 3 2
150 2 1
160 0 0
170 3 2
Figure 4.7 Potash rates, winter sown
0
10
20
30
40
50
60
0 10 20 30 40 50 60 70 80 90 100 110 120 130 140 150 160 170
Kg/ha
Nos
. gro
wer
s

40
Table 4.12 Potash rate, yield and profitability - winter sown
Category 1 2 3 4 5 Significant
Application rate (kg/ha) zero <40 40-60 60-80 >80
Nos. observations 43 44 42 31 35
Average area grown (ha) 63 71 67 52 52
Yield (tonnes/ha) 2.9 2.9 3.3 3.3 3.5 1<3,4,5; 2<5
Margin over materials (£/ha) 461 454 485 489 484
Gross margin (£/ha) 401 398 419 436 435
All fertilisers – winter sown
Performance by the total amount spent on all fertilisers is summarised in Table 4.13.
Yield per hectare increases with the amount spent on fertilisers, but while this is
significant in this survey, it does not translate into a significantly higher margin-over-
materials or gross margin.
Table 4.13 All fertilisers, yield and profitability - winter sown
Category 1 2 3 4 5 Significant
Expenditure (£/ha) <60 60-80 80-100 100-120 >120
Nos. observations 43 44 42 31 35
Average area grown (ha) 71 43 70 58 44 1>2,5; 3>5
Yield (tonnes/ha) 2.8 3.2 3.2 3.3 3.6 1<3,4,5; 2,3<5
Margin over materials (£/ha) 471 485 475 472 477
Gross margin (£/ha) 407 427 413 426 425
A similar pattern applies to the use of trace elements (Table 4.14).
Table 4.14 Trace elements, yield & profitability - winter sown
Category 1 2 3 4 Significant
Expenditure (£/ha) 0 0-5 5-10 >10
Nos. of observations 143 22 18 12
Average area grown (ha) 54 98 50 67
Yield (tonnes/ha) 3.2 2.9 3.5 3.5 1,2<3; 2<4
Margin over materials (£/ha) 476 445 505 482
Gross margin (£/ha) 414 414 453 436
4.4 Chemicals
The use of various chemicals on the winter sown crop is summarised in Figures 4.8 to
4.13. All growers in the sample used herbicides, with £60 per hectare being the most
usual cost (Figure 4.8). A considerable number of growers, 38, used no insecticide at
all, and for the majority of the rest the cost was between £5 -10 per hectare (Figure
4.9). Slug pellets were used by less than a third of growers (Figure 4.10) and
dessicants by less than half (Figure 4.11). Although 24 growers used no fungicides,
most of the rest were using up to £50 per hectare (Figure 4.12). On all chemicals, the
majority of growers were spending between £75 and £125 per hectare (Figure 4.13).

41
Figure 4.8 Herbicide use, winter sown
0
10
20
30
40
50
60
70
80
0 20 40 60 80 100 120 140 160 180
£/ha
Nos.
gro
wer
s
Figure 4.9 Insecticide use, winter sown
0
10
20
30
40
50
60
70
0 5 10 15 20 25 30 35 40 45 50 55 60 65 70 75 80
£/ha
Nos.
gro
wer
s

42
Figure 4.10 Slug pellets, winter sown
0
20
40
60
80
100
120
140
0 5 10 15 20 25 30 35 40 45 50 55
£/ha
Nos.
gro
wer
s
Figure 4.11 Dessicant use, winter sown
0
20
40
60
80
100
120
0 5 10 15 20 25 30 35
£/ha
Nos.
gro
wer
s

43
Figure 4.12 Fungicide use, winter sown
0
5
10
15
20
25
30
35
40
0 10 20 30 40 50 60 70 80 90 100
£/ha
Nos.
gro
wer
s
Figure 4.13 All chemical use, winter sown
0
10
20
30
40
50
60
0 25 50 75 100 125 150 175 200 225 250
£/ha
Nos.
gro
wer
s

44
4.5 Marketing
Winter sown
A breakdown of the winter sown crop by quality, buyer, contract type and date of sale
is summarised in Table 4.15 and Figures 4.14-4.17. The majority of the crop is sold
for crushing (93% of harvest tonnage) to merchants (87%). Spot and forward sales
account for almost 70%, with 44% of the crop sold in August.

45
Table 4.15 Marketing - winter sown
tonnes % £/t
Quality
Crushing 34,441 93 145
Biofuel 1,341 4 148
unallocated 629 2 150
Other 802 2
Total 37,212 100
Buyer
Merchant 32,195 87 146
Farmer Controlled Business 4,584 12 148
Other 433 1
Total 37,212 100
Contract type
Spot /intervention 16,655 45 144
Forward Sale 8,902 24 153
January to June Pool 3,176 9 141
unallocated 2,205 6 148
July to September Pool 1,791 5 145
January to March Pool 1,538 4 141
Managed Fund 648 2 149
October to December Pool 885 2 145
April to June Pool 881 2 138
Other 532 1
Total 37,212 100
Date of Sale
Aug 04 16,428 44 150
Sept 04 2,839 8 145
Oct 04 2,075 6 154
Nov 04 3,553 10 144
Dec 04 1,971 5 142
Jan 05 1,497 4 142
Feb 05 2,617 7 137
Mar 05 1,504 4 138
Apr 05 1,519 4 138
May 05 855 2 139
June 05 1,249 3 137
July 05 371 1 146
Aug 05 76 0 144
unknown 158 0 145
unallocated 501 1 169
Total 37,212 100

46
Figure 4.14 Quality - winter sown
Crushing
Biofuel
unallocated
Other
Figure 4.15 Buyer - winter sown
Merchant
Farmer Controlled
BusinessOther

47
Figure 4.16 Contract type - winter sown
Spot /intervention
Forward Sale
January to June
Pool
unallocated
July to September
Pool
April to June Pool
OtherJanuary to March
Pool
Managed Fund
October to
December Pool
Figure 4.17 Date of sale - winter sown
0
2,000
4,000
6,000
8,000
10,000
12,000
14,000
16,000
18,000
Aug
04
Sept 0
4
Oct 0
4
Nov
04
Dec
04
Jan
05
Feb 0
5
Mar
05
Apr
05
May
05
June
05
July
05
Aug
05
unkn
own
unal
loca
ted
ton
nes

48
Spring
The situation for the spring sown crop is similar (Table 4.16 and Figures 4.18 to
4.21).
Table 4.16 Marketing - spring sown
tonnes % £/t
Quality
Crushing 1,839 96 142
Other 1 0 147
Seed 1 0 140
Feed 48 3 128
Industrial 28 1 171
Total 1,916 100 -
Buyer
Merchant 1,488 78 141
Farmer Controlled Business 362 19 146
End User 65 3 147
Home Use 1 0 144
Total 1,916 100
Contract type
Spot /intervention 766 40 136
Forward Sale 617 32 147
July to September Pool 112 6 140
January to March Pool 236 12 150
January to June Pool 183 10 144
Consumer-Grower 1 0 144
Total 1,916 100
Date of Sale
Aug 04 550 29 149
Sept 04 378 20 144
Oct 04 303 16 121
Nov 04 10 1 155
Dec 04 172 9 160
Jan 05 219 11 139
Feb 05 19 1 125
Mar 05 49 3 144
Apr 05 22 1 146
May 05 156 8 143
June 05 0 0 -
July 05 0 0 -
Aug 05 0 0 -
unknown 38 2 135
unallocated 0 0 -
Total 1,916 100

49
Figure 4.18 Quality - spring sown
Crushing
Seed
Other
FeedIndustrial
Figure 4.19 Buyer - spring sown
Merchant
Farmer Controlled
Business
End User
Home Use

50
Figure 4.20 Contract type - spring sown
Spot
/intervention
Forward Sale
July to September
Pool
January to March
Pool
January to June
Pool Consumer-Grower
Figure 4.21 Date of sale - spring sown
0
100
200
300
400
500
600
Aug
04
Sept 0
4
Oct
04
Nov
04
Dec
04
Jan
05
Feb 0
5
Mar
05
Apr
05
May
05
June
05
July
05
Aug
05
unkn
own
unal
loca
ted
tonnes

51
Chapter 5
Supplementary questionnaire results
This chapter reports the results of a supplementary questionnaire that sought to
explore farmers’ reasons for growing oilseed rape in 2004 and their intentions for the
2005 harvest year.
Q1. Why did you grow oilseed rape in 2004?
Farmers were asked their reasons for growing oilseed rape in the current harvest year.
They were offered a choice of selecting and ranking up to five specified reasons, plus
‘other’ to allow for reasons not otherwise specified.
Winter sown
The responses of the 201 growers that planted the winter sown crop are given in Table
5.1. The five specified reasons and ‘other’ are listed in approximate order of
importance, based on farmers’ responses. One hundred and fifty-seven farmers chose
‘break crop’ as the most important reason. This was followed in importance by profit-
generation, spreading the workload, weed control, area payment and other.
Table 5.1 Reasons for growing winter sown oilseed rape
Most important Least important
Score 1 2 3 4 5 6
Reason:
Break crop 157 29 5 1 3
Profit generating crop 51 67 20 12 6 2
Spread workload 18 46 52 19 3
Weed control 15 17 37 32 9
Area payment 9 12 11 11 32
Other* 3
* cash flow; spread harvest.

52
Spring sown
The pattern of responses from the 31 growers of the spring sown crop was similar to
that for the winter sown crop, with ‘break crop’ as the most important reason (Table
5.2).
Table 5.2 Reasons for growing spring sown oilseed rape
Most important Least important
Score 1 2 3 4 5 6
Reason:
Break crop 20 1 2 1
Profit generating crop 1 6 2 2 4
Spread workload 2 7 6 4
Weed control 2 2 3 8 1
Area payment 1 4 2 5 1
Other* 3
* replaced failed winter sown crop; use of former set-aside land.
Q2. Will you grow oilseed rape in 2005?
A large majority of farmers said that they intended to grow winter sown oilseed rape
in 2005, and a large majority said that they did not intend to grow the spring sown
crop (Table 5.3). When the latter group were asked why, the most important reasons
given were greater profitability of other crops, and planting and establishment
problems (Table 5.4).
Table 5.3 Intentions for 2005
Winter sown Spring sown
Yes 192 6
No 11 65
Table 5.4 Reasons for not growing spring sown oilseed rape in 2005
Most important Least important
Score 1 2 3 4 5 6
Reason:
Greater profitability of other crops 43 9 3 1
Planting & establishment problems 14 6 3 2 1
Harvesting difficulties 2 3 5 3 2
Oilseed rape price too low 8 4 2 4 2 1
Marketing difficulties 1 2 2 7 1
Other* 12 1
* poor yield; doesn't suit rotation; prefers winter crop; workload conflict; doesn't like crop.

53
Q3. What is the minimum price that oilseed rape must achieve in order that you
continue to grow the crop?
The minimum price necessary to satisfy at least 50% of growers is £140 per tonne
(Table 5.5). A minimum price of £150 per tonne would satisfy 80% of growers.
Table 5.5 Minimum price
£/t Nos. growers %
130 44 21
140 63 30
150 62 30
>160 40 19
All 209 100
Q4. If an energy crop area payment supplement is paid on top of the Single Farm
Payment, and assuming £140/t for oilseed rape and current local yields, at what
level must the payment be for you to grow the crop?
An energy crop area payment of £20 per hectare would be sufficient for almost 50%
of growers, whilst a payment of £30 per hectare would be sufficient for almost 80% of
growers (Table 5.6).
Table 5.6 Energy crop area payment
£/ha Nos. growers %
10 37 19
20 59 30
30 54 28
40 21 11
>50 25 13
All 196 100

54
Q5. Have you grown on set-aside land in the past? If not, why not?
Of 214 growers of oilseed rape, 96 said that they had not grown the winter sown crop
on set-aside land in the past. Of the same growers, 190 had not grown the spring sown
crop on set-aside land (Table 5.7). In the supplementary question as to why not, the
most important reasons, for both winter and spring sown crops, were that the oilseed
rape price was too low and the greater profitability of other crops (Tables 5.8 and 5.9).
Table 5.7 Growing on set-aside land
Winter sown Spring sown
Yes 118 24
No 96 190
Table 5.8 Reasons for not growing winter sown oilseed rape on set-aside land
Most important Least important
Score 1 2 3 4 5 6
Reason:
Oilseed rape price too low 20 10 5 1
Greater profitability of other crops 16 8 1 1
Planting & establishment problems 14 4 4 4 1
Harvesting difficulties 5 3 2 2 4 1
Marketing difficulties 12 3 3 1 1 1
Other* 24
* rotation difficulties; workload difficulties; conservation schemes; unsuitable land; fallow requirement.
Table 5.9 Reasons for not growing spring sown oilseed rape on set-aside land
Most important Least important
Score 1 2 3 4 5 6
Reason:
Greater profitability of other crops 33 10 2 1
Oilseed rape price too low 13 6 5 1 3
Planting & establishment problems 8 9 8 1
Marketing difficulties 9 5 4 3 3 1
Harvesting difficulties 4 1 1 6 4 1
Other* 31 1
* poor yields; rotation difficulties; workload difficulties; don't like crop; conservation schemes.

55
Q6. Are you growing/will you grow oilseed rape on set-aside land in 2005?
Farmers’ intentions regarding the growing of oilseed rape on set-aside land in 2005
are summarised in Table 5.10. In general, farmers that have not used set-aside land in
the past for oilseed rape intended to maintain that position in 2005, whilst of those
that have used set-aside land in the past, the majority did not plan to use it again for
oilseed rape in 2005.
Table 5.10 Intention of growing oilseed rape on set-aside land in 2005
Winter sown Spring sown
Never grown it and will not this year 94 189
Have grown it before and will again this year 51 1
Have grown it before and will not this year 67 23
Have not grown it before but will this year 2 1

56

57
References
Askham Bryan (1996). The Economics of Oilseed Rape 1996, Askham Bryan
College, York.
Baker, G.E.A., Gay, D.J.M. and Lewis, M.R. (1991). Oilseed Rape: 1990,
Special Studies in Agricultural Economics Report No. 17, Farm
Management Survey Unit, Askham Bryan College, York.

58

59
Appendix 1
Standard Costs and Coefficients used in the 2004 Oilseed Rape Study

60

61
Tractors lookup table DEFRA 26.3.04
HP Annual
Use
hrs/yr £/hr Code
1 TRACTOR (2WD) 2 <60 low use <500 6.15
2 TRACTOR (2WD) 2 <60 med use 500-700 5.40
3 TRACTOR (2WD) 2 <60 high use >700 4.62
4 TRACTOR (2WD) 2 60-79.9 low use <500 7.15
5 TRACTOR (2WD) 2 60-79.9 med use 500-700 6.30
6 TRACTOR (2WD) 2 60-79.9 high use >700 5.41
7 TRACTOR (2WD) 2 80-106.9 low use <500 9.09
8 TRACTOR (2WD) 2 80-106.9 med use 500-700 8.08
9 TRACTOR (2WD) 2 80-106.9 high use >700 7.00
10 TRACTOR (4WD) 4 < 100 low use <500 9.53
11 TRACTOR (4WD) 4 < 100 med use 500-700 8.33
12 TRACTOR (4WD) 4 < 100 high use >700 7.46
13 TRACTOR (Fastrac 4WD) 4 100-140 low use <500 15.86
14 TRACTOR (Fastrac 4WD) 4 100-140 med use 500-700 13.59
15 TRACTOR (Fastrac 4WD) 4 100-140 high use >700 11.95
16 TRACTOR (4WD) 4 100-140 low use <500 16.73
17 TRACTOR (4WD) 4 100-140 med use 500-700 14.35
18 TRACTOR (4WD) 4 100-140 high use >700 12.62
19 TRACTOR (4WD) 4 140-180 low use <500 18.12
20 TRACTOR (4WD) 4 140-180 med use 500-700 15.63
21 TRACTOR (4WD) 4 140-180 high use >700 13.84
22 TRACTOR (4WD) 4 180 - 200 low use <500 22.87
23 TRACTOR (4WD) 4 180 - 200 med use 500-700 19.72
24 TRACTOR (4WD) 4 180 - 200 high use >700 17.44
25 TRACTOR (4WD) 4 200+ low use <500 25.52
26 TRACTOR (4WD) 4 200+ med use 500-700 22.15
27 TRACTOR (4WD) 4 200+ high use >700 19.70
28 TRACK LAYER/CRAWLER crawler 80 - 100 low use <500 7.09
29 TRACK LAYER/CRAWLER crawler 80 - 100 med use 500-700 6.22
30 TRACK LAYER/CRAWLER crawler 80 - 100 high use >700 5.60
31 TRACK LAYER/CRAWLER crawler 100 - 140 low use <500 16.13
32 TRACK LAYER/CRAWLER crawler 100 - 140 med use 500-700 13.79
33 TRACK LAYER/CRAWLER crawler 100 - 140 high use >700 12.08
34 TRACK LAYER/CRAWLER crawler 200 + low use <500 35.15
35 TRACK LAYER/CRAWLER crawler 200 + med use 500-700 30.25
36 TRACK LAYER/CRAWLER crawler 200 + high use >700 26.59
37 A.T.V. A.T.V. 300cc (2 WD) 600 1.66
38 A.T.V. A.T.V. 400cc (4 WD) 600 2.31
39 MATERIALS HANDLING MACHINES handler 70hp, Mast type, 2.6t lift, (eg JCB 926 F) 800 6.13
40 MATERIALS HANDLING MACHINES handler 65hp, 4 wheel steer loader 1.7 t lift 800 6.78
41 MATERIALS HANDLING MACHINES handler 106hp, Loading Shovel, up to 3 t lift (eg TM 300) 800 8.85
42 MATERIALS HANDLING MACHINES handler 71hp, Telescopic handler, 2.0 t lift (eg JCB 520 - 50) 800 6.21
43 MATERIALS HANDLING MACHINES handler 101hp, Telescopic handler, 2.6 t lift (eg Manitou MLT 526) 800 8.04
44 MATERIALS HANDLING MACHINES handler 100hp, Telescopic handler, 3 t lift (eg JCB 530-FS) 800 8.35
45 MATERIALS HANDLING MACHINES handler 100hp, Telescopic handler, 4 t lift (eg JCB 540 -FS) 800 8.86
46 MATERIALS HANDLING MACHINES handler 16hp, Skid steer loader, 272 kg lift (eg Bobcat 450) 800 1.99
47 MATERIALS HANDLING MACHINES handler 19hp, Skid steer loader, 415kg lift, (eg Bobcat 553) 800 2.52
48 MATERIALS HANDLING MACHINES handler 47hp, Skid steer loader, 600 kg lift, (eg JCB 160 robot) 800 3.76
49 MATERIALS HANDLING MACHINES handler 73hp, Skid steer loader, 1043 kg lift (eg Bobcat 873) 800 5.50
o1 old TRACTOR (2WD) 2 <60 low use <500 4.73
o10 old TRACTOR (4WD) 4 < 100 low use <500 7.03
o11 old TRACTOR (4WD) 4 < 100 med use 500-700 6.41
o12 old TRACTOR (4WD) 4 < 100 high use >700 6.00
o13 old TRACTOR (Fastrac 4WD) 4 100-140 low use <500 11.24
o14 old TRACTOR (Fastrac 4WD) 4 100-140 med use 500-700 10.03
o15 old TRACTOR (Fastrac 4WD) 4 100-140 high use >700 9.24
o16 old TRACTOR (4WD) 4 100-140 low use <500 11.88
o17 old TRACTOR (4WD) 4 100-140 med use 500-700 10.62
o18 old TRACTOR (4WD) 4 100-140 high use >700 9.78
o19 old TRACTOR (4WD) 4 140-180 low use <500 13.06
o2 old TRACTOR (2WD) 2 <60 med use 500-700 4.28
o20 old TRACTOR (4WD) 4 140-180 med use 500-700 11.74
o21 old TRACTOR (4WD) 4 140-180 high use >700 10.88
o22 old TRACTOR (4WD) 4 180 - 200 low use <500 16.37
o23 old TRACTOR (4WD) 4 180 - 200 med use 500-700 14.72
o24 old TRACTOR (4WD) 4 180 - 200 high use >700 13.63
o25 old TRACTOR (4WD) 4 200+ low use <500 18.47
o26 old TRACTOR (4WD) 4 200+ med use 500-700 16.74

62
o27 old TRACTOR (4WD) 4 200+ high use >700 15.58
o28 old TRACK LAYER/CRAWLER crawler 80 - 100 low use <500 5.35
o29 old TRACK LAYER/CRAWLER crawler 80 - 100 med use 500-700 4.88
o3 old TRACTOR (2WD) 2 <60 high use >700 3.69
o30 old TRACK LAYER/CRAWLER crawler 80 - 100 high use >700 4.58
o31 old TRACK LAYER/CRAWLER crawler 100 - 140 low use <500 10.96
o32 old TRACK LAYER/CRAWLER crawler 100 - 140 med use 500-700 9.83
o33 old TRACK LAYER/CRAWLER crawler 100 - 140 high use >700 9.06
o34 old TRACK LAYER/CRAWLER crawler 200 + low use <500 23.79
o35 old TRACK LAYER/CRAWLER crawler 200 + med use 500-700 21.51
o36 old TRACK LAYER/CRAWLER crawler 200 + high use >700 19.95
o37 old A.T.V. A.T.V. 300cc (2 WD) 600 1.45
o38 old A.T.V. A.T.V. 400cc (4 WD) 600 2.00
o39 old MATERIALS HANDLING MACHINES handler 70hp, Mast type, 2.6t lift, (eg JCB 926 F) 800 5.25
o4 old TRACTOR (2WD) 2 60-79.9 low use <500 5.53
o40 old MATERIALS HANDLING MACHINES handler 65hp, 4 wheel steer loader 1.7 t lift 800 5.73
o41 old MATERIALS HANDLING MACHINES handler 106hp, Loading Shovel, up to 3 t lift (eg TM 300) 800 7.56
o42 old MATERIALS HANDLING MACHINES handler 71hp, Telescopic handler, 2.0 t lift (eg JCB 520 - 50) 800 5.32
o43 old MATERIALS HANDLING MACHINES handler 101hp, Telescopic handler, 2.6 t lift (eg Manitou MLT 526) 800 6.91
o44 old MATERIALS HANDLING MACHINES handler 100hp, Telescopic handler, 3 t lift (eg JCB 530-FS) 800 7.14
o45 old MATERIALS HANDLING MACHINES handler 100hp, Telescopic handler, 4 t lift (eg JCB 540 -FS) 800 7.54
o46 old MATERIALS HANDLING MACHINES handler 16hp, Skid steer loader, 272 kg lift (eg Bobcat 450) 800 1.71
o47 old MATERIALS HANDLING MACHINES handler 19hp, Skid steer loader, 415kg lift, (eg Bobcat 553) 800 2.13
o48 old MATERIALS HANDLING MACHINES handler 47hp, Skid steer loader, 600 kg lift, (eg JCB 160 robot) 800 3.26
o49 old MATERIALS HANDLING MACHINES handler 73hp, Skid steer loader, 1043 kg lift (eg Bobcat 873) 800 4.75
o5 old TRACTOR (2WD) 2 60-79.9 med use 500-700 5.02
o6 old TRACTOR (2WD) 2 60-79.9 high use >700 4.34
o7 old TRACTOR (2WD) 2 80-106.9 low use <500 7.10
o8 old TRACTOR (2WD) 2 80-106.9 med use 500-700 6.50
o9 old TRACTOR (2WD) 2 80-106.9 high use >700 5.69
Non-specific machinery costs lookup table
Annual Use
Machine New/Old hrs/yr £/ha £/hr
Code
20 Plough (mounted 3 - 4 furrow) new low use <40 9.33
21 Plough (mounted 3 - 4 furrow) new med use 40-80 6.59
22 Plough (mounted 3 - 4 furrow) new high use >80 5.61
23 Plough (mounted 3 - 4 furrow) old low use <40 6.03
24 Plough (mounted 3 - 4 furrow) old med use 40-80 4.97
25 Plough (mounted 3 - 4 furrow) old high use >80 4.01
26 Plough (mounted 4 furrow) new low use <70 6.47
27 Plough (mounted 4 furrow) new med use 70-150 4.45
28 Plough (mounted 4 furrow) new high use >150 3.75
29 Plough (mounted 4 furrow) old low use <70 4.18
30 Plough (mounted 4 furrow) old med use 70-150 3.36
31 Plough (mounted 4 furrow) old high use >150 2.68
32 Plough (reversible 3 - 4 furrow) new low use <100 7.79
33 Plough (reversible 3 - 4 furrow) new med use 100-150 5.19
34 Plough (reversible 3 - 4 furrow) new high use >150 4.42
35 Plough (reversible 3 - 4 furrow) old low use <100 5.03
36 Plough (reversible 3 - 4 furrow) old med use 100-150 3.91
37 Plough (reversible 3 - 4 furrow) old high use >150 3.15
38 Plough (reversible 6 furrow) new low use <100 8.38
39 Plough (reversible 6 furrow) new med use 100-250 6.16
40 Plough (reversible 6 furrow) new high use >250 5.08
41 Plough (reversible 6 furrow) old low use <100 5.42
42 Plough (reversible 6 furrow) old med use 100-250 4.65
43 Plough (reversible 6 furrow) old high use >250 3.63
44 Plough (reversible 8 furrow) new low use <150 8.74
45 Plough (reversible 8 furrow) new med use 150-250 6.61
46 Plough (reversible 8 furrow) new high use >250 5.07
47 Plough (reversible 8 furrow) old low use <150 5.65
48 Plough (reversible 8 furrow) old med use 150-250 4.99
49 Plough (reversible 8 furrow) old high use >250 3.62
50 Furrow press (1.3 - 2.0m, double row) new low use <70 5.42
51 Furrow press (1.3 - 2.0m, double row) new med use 70-150 3.73
52 Furrow press (1.3 - 2.0m, double row) new high use >150 3.14
53 Furrow press (1.3 - 2.0m, double row) old low use <70 3.50
54 Furrow press (1.3 - 2.0m, double row) old med use 70-150 2.81
55 Furrow press (1.3 - 2.0m, double row) old high use >150 2.24
56 Furrow press (3.2 - 3.6 m, double row) new low use <70 5.06
57 Furrow press (3.2 - 3.6 m, double row) new med use 70-150 3.48

63
58 Furrow press (3.2 - 3.6 m, double row) new high use >150 2.93
59 Furrow press (3.2 - 3.6 m, double row) old low use <70 3.27
60 Furrow press (3.2 - 3.6 m, double row) old med use 70-150 2.62
61 Furrow press (3.2 - 3.6 m, double row) old high use >150 2.09
62 Front press (1.5 - 3.0 m, single row) new low use <70 3.85
63 Front press (1.5 - 3.0 m, single row) new med use 70-150 2.65
64 Front press (1.5 - 3.0 m, single row) new high use >150 2.23
65 Front press (1.5 - 3.0 m, single row) old low use <70 2.49
66 Front press (1.5 - 3.0 m, single row) old med use 70-150 2.00
67 Front press (1.5 - 3.0 m, single row) old high use >150 1.59
68 Front press (4.0 m, single row, folding) new low use <70 3.79
69 Front press (4.0 m, single row, folding) new med use 70-150 2.61
70 Front press (4.0 m, single row, folding) new high use >150 2.20
71 Front press (4.0 m, single row, folding) old low use <70 2.45
72 Front press (4.0 m, single row, folding) old med use 70-150 1.97
73 Front press (4.0 m, single row, folding) old high use >150 1.57
74 spring tine cultivator, 5-6 m new low use <40 2.89
75 spring tine cultivator, 5-6 m new med use 40-80 2.12
76 spring tine cultivator, 5-6 m new high use >80 1.83
77 spring tine cultivator, 5-6 m old low use <40 1.87
78 spring tine cultivator, 5-6 m old med use 40-80 1.60
79 spring tine cultivator, 5-6 m old high use >80 1.30
80 Straw incorporating cultivator new low use <70 6.07
81 Straw incorporating cultivator new med use 70-130 4.59
82 Straw incorporating cultivator new high use >130 3.84
83 Straw incorporating cultivator old low use <70 3.92
84 Straw incorporating cultivator old med use 70-130 3.46
85 Straw incorporating cultivator old high use >130 2.74
86 Stubble cultivator 2.5 - 3 m new low use <70 3.57
87 Stubble cultivator 2.5 - 3 m new med use 70-130 2.70
88 Stubble cultivator 2.5 - 3 m new high use >130 2.21
89 Stubble cultivator 2.5 - 3 m old low use <70 2.31
90 Stubble cultivator 2.5 - 3 m old med use 70-130 2.04
91 Stubble cultivator 2.5 - 3 m old high use >130 1.58
92 disc harrows (2.7-3.6m trailed) new low use <40 13.10
93 disc harrows (2.7-3.6m trailed) new med use 40-70 7.93
94 disc harrows (2.7-3.6m trailed) new high use >70 6.75
95 disc harrows (2.7-3.6m trailed) old low use <40 8.47
96 disc harrows (2.7-3.6m trailed) old med use 40-70 5.98
97 disc harrows (2.7-3.6m trailed) old high use >70 4.82
98 disc harrows (4.5 - 6.0m trailed) new low use <70 9.33
99 disc harrows (4.5 - 6.0m trailed) new med use 70 -130 6.28
100 disc harrows (4.5 - 6.0m trailed) new high use >130 5.41
101 disc harrows (4.5 - 6.0m trailed) old low use <70 6.03
102 disc harrows (4.5 - 6.0m trailed) old med use 70 -130 4.74
103 disc harrows (4.5 - 6.0m trailed) old high use >130 3.86
104 combination harrows (2.5-4m) new low use <70 4.33
105 combination harrows (2.5-4m) new med use 70-130 2.92
106 combination harrows (2.5-4m) new high use >130 2.51
107 combination harrows (2.5-4m) old low use <70 2.80
108 combination harrows (2.5-4m) old med use 70-130 2.20
109 combination harrows (2.5-4m) old high use >130 1.79
110 Power harrow or rotavator 2-3 m new low use <70 6.07
111 Power harrow or rotavator 2-3 m new med use 70-130 4.59
112 Power harrow or rotavator 2-3 m new high use >130 3.91
113 Power harrow or rotavator 2-3 m old low use <70 3.92
114 Power harrow or rotavator 2-3 m old med use 70-130 3.46
115 Power harrow or rotavator 2-3 m old high use >130 2.79
116 Power harrow or rotavator 3 - 4 m new low use <70 6.80
117 Power harrow or rotavator 3 - 4 m new med use 70-130 4.67
118 Power harrow or rotavator 3 - 4 m new high use >130 4.64
119 Power harrow or rotavator 3 - 4 m old low use <70 4.39
120 Power harrow or rotavator 3 - 4 m old med use 70-130 3.53
121 Power harrow or rotavator 3 - 4 m old high use >130 3.31
122 Power harrow or rotavator 4-5 m with crumbler roller new low use <70 7.35
123 Power harrow or rotavator 4-5 m with crumbler roller new med use 70-130 6.12
124 Power harrow or rotavator 4-5 m with crumbler roller new high use >130 5.52
125 Power harrow or rotavator 4-5 m with crumbler roller old low use <70 4.75
126 Power harrow or rotavator 4-5 m with crumbler roller old med use 70-130 4.62
127 Power harrow or rotavator 4-5 m with crumbler roller old high use >130 3.94
128 Subsoiler (2-3 leg) new low use <50 4.27
129 Subsoiler (2-3 leg) new med use 50-100 3.23
130 Subsoiler (2-3 leg) new high use >100 2.64
131 Subsoiler (2-3 leg) old low use <50 2.76
132 Subsoiler (2-3 leg) old med use 50-100 2.44

64
133 Subsoiler (2-3 leg) old high use >100 1.88
134 Vibrating compaction breakers/soil looseners new low use <50 6.42
135 Vibrating compaction breakers/soil looseners new med use 50-100 4.86
136 Vibrating compaction breakers/soil looseners new high use >100 3.97
137 Vibrating compaction breakers/soil looseners old low use <50 4.15
138 Vibrating compaction breakers/soil looseners old med use 50-100 3.66
139 Vibrating compaction breakers/soil looseners old high use >100 2.83
140 FYM Spreaders (4 - 6 cu m) new low use <70 3.65
141 FYM Spreaders (4 - 6 cu m) new med use 70-150 3.11
142 FYM Spreaders (4 - 6 cu m) new high use >150 2.33
143 FYM Spreaders (4 - 6 cu m) old low use <70 1.98
144 FYM Spreaders (4 - 6 cu m) old med use 70-150 1.84
145 FYM Spreaders (4 - 6 cu m) old high use >150 1.30
146 FYM Spreaders (6 - 8 cu m) new low use <70 5.05
147 FYM Spreaders (6 - 8 cu m) new med use 70-150 4.31
148 FYM Spreaders (6 - 8 cu m) new high use >150 3.22
149 FYM Spreaders (6 - 8 cu m) old low use <70 2.74
150 FYM Spreaders (6 - 8 cu m) old med use 70-150 2.54
151 FYM Spreaders (6 - 8 cu m) old high use >150 1.80
152 Tanker-Spreaders 4000-5000 litres new low use <100 3.53
153 Tanker-Spreaders 4000-5000 litres new med use 100-200 2.76
154 Tanker-Spreaders 4000-5000 litres new high use >200 2.44
155 Tanker-Spreaders 4000-5000 litres old low use <100 1.91
156 Tanker-Spreaders 4000-5000 litres old med use 100-200 1.63
157 Tanker-Spreaders 4000-5000 litres old high use >200 1.36
158 Tanker-Spreaders 6000-10000 litres new low use <100 6.62
159 Tanker-Spreaders 6000-10000 litres new med use 100-200 5.17
160 Tanker-Spreaders 6000-10000 litres new high use >200 4.57
161 Tanker-Spreaders 6000-10000 litres old low use <100 3.59
162 Tanker-Spreaders 6000-10000 litres old med use 100-200 3.05
163 Tanker-Spreaders 6000-10000 litres old high use >200 2.55
164 Slurry Stirrer (PTO driven) new low use <100 1.85
165 Slurry Stirrer (PTO driven) new med use 100-200 1.45
166 Slurry Stirrer (PTO driven) new high use >200 1.28
167 Slurry Stirrer (PTO driven) old low use <100 1.01
168 Slurry Stirrer (PTO driven) old med use 100-200 0.85
169 Slurry Stirrer (PTO driven) old high use >200 0.71
170 Bale Trailer 5-8 tonne, new low use <100 2.09
171 Bale Trailer 5-8 tonne, new med use 100-150 1.70
172 Bale Trailer 5-8 tonne, new high use >150 1.49
173 Bale Trailer 5-8 tonne, old low use <100 1.19
174 Bale Trailer 5-8 tonne, old med use 100-150 0.90
175 Bale Trailer 5-8 tonne, old high use >150 0.71
176 Trailer: 4 tonne, tipping, grain new low use <100 1.25
177 Trailer: 4 tonne, tipping, grain new med use 100-150 1.02
178 Trailer: 4 tonne, tipping, grain new high use >150 0.89
179 Trailer: 4 tonne, tipping, grain old low use <100 0.71
180 Trailer: 4 tonne, tipping, grain old med use 100-150 0.54
181 Trailer: 4 tonne, tipping, grain old high use >150 0.42
182 Trailer: 6 tonne, tipping, grain new low use <150 1.62
183 Trailer: 6 tonne, tipping, grain new med use 150-200 1.19
184 Trailer: 6 tonne, tipping, grain new high use >200 1.15
185 Trailer: 6 tonne, tipping, grain old low use <150 0.92
186 Trailer: 6 tonne, tipping, grain old med use 150-200 0.63
187 Trailer: 6 tonne, tipping, grain old high use >200 0.55
188 Fore-end loader (fitted to front of conventional tractor) new low use <600 0.85
189 Fore-end loader (fitted to front of conventional tractor) new med use 600-800 0.63
190 Fore-end loader (fitted to front of conventional tractor) new high use >800 0.53
191 Fore-end loader (fitted to front of conventional tractor) old low use <600 0.64
192 Fore-end loader (fitted to front of conventional tractor) old med use 600-800 0.42
193 Fore-end loader (fitted to front of conventional tractor) old high use >800 0.32
195 Balers (small rectangular bales) new low use <40 10.15
196 Balers (small rectangular bales) new med use 40-80 7.67
197 Balers (small rectangular bales) new high use >80 6.23
198 Balers (small rectangular bales) old low use <40 6.33
199 Balers (small rectangular bales) old med use 40-80 4.51
200 Balers (small rectangular bales) old high use >80 4.35
201 Balers (big round bales) new low use <60 9.95
202 Balers (big round bales) new med use 60-100 7.25
203 Balers (big round bales) new high use >100 5.76
204 Balers (big round bales) old low use <60 6.21
205 Balers (big round bales) old med use 60-100 4.27
206 Balers (big round bales) old high use >100 4.02
207 Balers high density rectangular bales new low use <125 8.91
208 Balers high density rectangular bales new med use 125-250 6.34
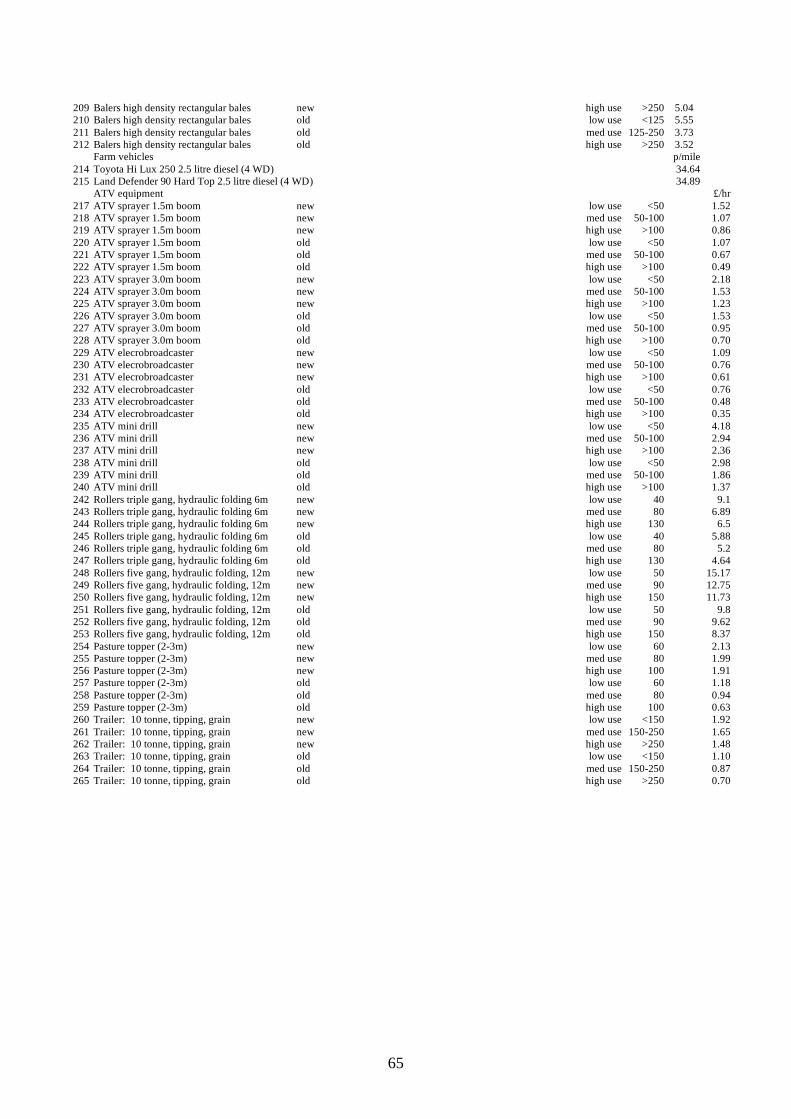
65
209 Balers high density rectangular bales new high use >250 5.04
210 Balers high density rectangular bales old low use <125 5.55
211 Balers high density rectangular bales old med use 125-250 3.73
212 Balers high density rectangular bales old high use >250 3.52
Farm vehicles p/mile
214 Toyota Hi Lux 250 2.5 litre diesel (4 WD) 34.64
215 Land Defender 90 Hard Top 2.5 litre diesel (4 WD) 34.89
ATV equipment £/hr
217 ATV sprayer 1.5m boom new low use <50 1.52
218 ATV sprayer 1.5m boom new med use 50-100 1.07
219 ATV sprayer 1.5m boom new high use >100 0.86
220 ATV sprayer 1.5m boom old low use <50 1.07
221 ATV sprayer 1.5m boom old med use 50-100 0.67
222 ATV sprayer 1.5m boom old high use >100 0.49
223 ATV sprayer 3.0m boom new low use <50 2.18
224 ATV sprayer 3.0m boom new med use 50-100 1.53
225 ATV sprayer 3.0m boom new high use >100 1.23
226 ATV sprayer 3.0m boom old low use <50 1.53
227 ATV sprayer 3.0m boom old med use 50-100 0.95
228 ATV sprayer 3.0m boom old high use >100 0.70
229 ATV elecrobroadcaster new low use <50 1.09
230 ATV elecrobroadcaster new med use 50-100 0.76
231 ATV elecrobroadcaster new high use >100 0.61
232 ATV elecrobroadcaster old low use <50 0.76
233 ATV elecrobroadcaster old med use 50-100 0.48
234 ATV elecrobroadcaster old high use >100 0.35
235 ATV mini drill new low use <50 4.18
236 ATV mini drill new med use 50-100 2.94
237 ATV mini drill new high use >100 2.36
238 ATV mini drill old low use <50 2.98
239 ATV mini drill old med use 50-100 1.86
240 ATV mini drill old high use >100 1.37
242 Rollers triple gang, hydraulic folding 6m new low use 40 9.1
243 Rollers triple gang, hydraulic folding 6m new med use 80 6.89
244 Rollers triple gang, hydraulic folding 6m new high use 130 6.5
245 Rollers triple gang, hydraulic folding 6m old low use 40 5.88
246 Rollers triple gang, hydraulic folding 6m old med use 80 5.2
247 Rollers triple gang, hydraulic folding 6m old high use 130 4.64
248 Rollers five gang, hydraulic folding, 12m new low use 50 15.17
249 Rollers five gang, hydraulic folding, 12m new med use 90 12.75
250 Rollers five gang, hydraulic folding, 12m new high use 150 11.73
251 Rollers five gang, hydraulic folding, 12m old low use 50 9.8
252 Rollers five gang, hydraulic folding, 12m old med use 90 9.62
253 Rollers five gang, hydraulic folding, 12m old high use 150 8.37
254 Pasture topper (2-3m) new low use 60 2.13
255 Pasture topper (2-3m) new med use 80 1.99
256 Pasture topper (2-3m) new high use 100 1.91
257 Pasture topper (2-3m) old low use 60 1.18
258 Pasture topper (2-3m) old med use 80 0.94
259 Pasture topper (2-3m) old high use 100 0.63
260 Trailer: 10 tonne, tipping, grain new low use <150 1.92
261 Trailer: 10 tonne, tipping, grain new med use 150-250 1.65
262 Trailer: 10 tonne, tipping, grain new high use >250 1.48
263 Trailer: 10 tonne, tipping, grain old low use <150 1.10
264 Trailer: 10 tonne, tipping, grain old med use 150-250 0.87
265 Trailer: 10 tonne, tipping, grain old high use >250 0.70

66
2004 Cereal and Oilseed Drying costs by Drier Category and Fuel Source
Drying cost (fuel cost only) per 1% moisture content removal per tonne of grain
Fuel Source
Drier Category Electric Fan
Only
Electric Fan and
Propane Burner
for relative
humidity control
Diesel Propane
Bulk - i.e. ventilated floors/bins £0.89 £0.82 in bottles - -
Heated Air - i.e. oil/propane burning - - £0.55 £0.50 in bulk
batch/continuous flow drier £0.78 in bottles
Notes
Electricity has been taken as an average of 8p/unit.
Diesel at 25p/litre
Propane at 28.1p/kg in bulk
at 50.66p/kg in bottles
2004 Fuel Costs for Self-Propelled Machinery
(data source: ADAS for 1998, thereafter revised using observed annual movements in fuel prices)
Machine Fuel costs (£
per ha pass)
Combine harvester 4.44
Self propelled sprayer 0.36
Self propelled fertiliser spreader 0.44
Diesel prices 26.08
Overhead Coefficients
ESU 0 - 39.99 40 - 99.99 100 +
Buildings 0.239 0.217 0.124
Labour 0.297 0.318 0.280
Machinery 0.287 0.140 0.103
General Overhead Coefficients
ESU 0 - 39.99 40 - 99.99 100 +
North 79 67 53
East 87 60 53
West 97 76 58

67
Appendix 2
* Source the Met Office
The Weather
England North England South
Average Monthly Temperature
0
5
10
15
20
Aug
Oct
Dec
Feb
Apr
Jun
Aug
Aug 2003 - Sep 2004
Mean Temp oC
Av(1961-90)
oC
Average Monthly Rainfall
0
50
100
150
200
Aug
Oct
Dec
Feb
Apr
Jun
Aug
Aug 2003 - Sep 2004
mm
Av(1961-90)
mm
Average Monthly Hours of
Sunshine
0
50
100
150
200
250
Aug
Oct
Dec
Feb
Apr
Jun
Aug
Aug 2003 - Sep 2004
hrs
Av(1961-90)
hrs

68

69
Appendix 3
Recent reports: Special Studies in Agricultural Economics
No. 1 Very Small Farms: An Economic Study by D J Ansell, A K Giles
and J R Rendell, University of Reading, May 1988, £6.00
No. 2 Pig Management Scheme Results for 1988 by R F Ridgeon,
University of Cambridge, January 1989, £4.00
No. 3 Profits and Losses from Beef Production 1986/87: An Economic
Survey of Lowland Beef Enterprises by J Farrar, D R Colman and W
W Richardson, University of Manchester, February 1989, £7.50
No. 4 Pig Production in South -West England 1987/88 by A Sheppard,
University of Exeter, February 1989, £4.00
No. 5 Very Small Farms: A Neglected Component? by D J Ansell, A K
Giles and J R Rendell, University of Reading, May 1989, £6.00
No. 6 UK Cereals, 1985/86: Part II - Marketing and Further Analysis of
Production Economics by J G Davidson, University of Cambridge,
May 1989, £6.00
No. 7 Pig Management Scheme Results 1989 by R F Ridgeon, University
of Cambridge, December 1989, £5.00
No. 8 Pig Production in South West England 1988/89 by A Sheppard,
University of Exeter, February 1990, £5.00
No. 9 The Economics of Very Small Farms: A Further Look by D J
Ansell, A K Giles and J R Rendell, University of Reading, May 1990,
£6.00
No. 10 The Economics of Beef Production: A Survey of Lowland Beef
Enterprises 1987/88 by J Farrar, University of Manchester, May 1990,
£7.50
No. 11 Lowland Sheep Production 1988: An Economic Perspective by M
Turner with M W Fogerty, University of Exeter, September 1990,
£5.00
No. 12 The Economics of Harvested Peas and Field Beans by J G Davidson
and I M Sturgess, University of Cambridge, December 1990, £6.00

70
No. 13 Pig Management Scheme Results 1990 by R F Ridgeon, University
of Cambridge, January 1991, £6.00
No. 14 Marketing and Processing Activities on Farms in England and
Wales by N P Russell, D R Colman and W W Richardson, University
of Manchester, April 1991, £7.50
No. 15 Pig Production in South West England 1989/90 by A Sheppard,
University of Exeter, February 1991, £5.00
No. 16 Very Small Farms: A Distinctive Role? by D J Ansell, A K Giles and
J R Rendell, University of Reading, May 1991, £6.00
No. 17 Oilseed Rape 1990 by G E A Baker, D J M Gay and M R Lewis,
Askham Bryan College, York, September 1991, £6.00
No. 18 Pig Management Scheme Results 1991 by R F Ridgeon, University
of Cambridge, January 1992, £6.00
No. 19 Pig Production in South West England 1990/91 by A Sheppard,
University of Exeter, February 1992, £6.00
No. 20 Pig Production 1991/92 by A Sheppard, University of Exeter, March
1993, £7.00
No. 21 Agricultural Contracting in the United Kingdom by J Wright and R
Bennett, University of Reading, August 1993, £8.00
No. 22 The Economics of Egg Production by Deborah Roberts and John
Farrar, University of Manchester, September 1993, £10.00
No. 23 Hardy Nursery Stock Production in England and Wales by R
Crane, A Errington and P Woodlock, University of Reading, October
1993, £9.50
No. 24 Labour Use on UK Farms: a Pilot Study by Martin Turner and Mark
Fogerty, University of Exeter, March 94, £8.00
No. 25 Pig Production - 1992/93 by A Sheppard, University of Exeter, March
1994, £8.00
No. 26 Field Scale Vegetables: A Survey of Large-scale Vegetable
Production on General Cropping Farms 1990-1992 by N Williams,
Wye College, University of London, December 1994, £15.00

71
No. 27 The Economics of Potato Production in the United Kingdom (1991
and 1992 Crops) by Kim Claydon, University of Nottingham, July
1995, £10.00
No. 28 UK Cereals, 1993/94 - The Impact of the CAP Reform on
Production Economics and Marketing by G Davidson and Carol
Asby, University of Cambridge, July 1995, £12.00
No. 29 Wheat and Barley Production in Great Britain: 1994/95 -Year
Two of the CAP Reform by G Davidson, University of Cambridge,
March 1996, £12.00
No. 30 Linseed by M R Lewis, Askham Bryan College of Agriculture and
Horticulture, April 1996, £10.00
No. 31 Lowland Sheep 1994: Production Economics and Management by
Mark Fogerty and Martin Turner, University of Exeter, April 1996,
£10.00
No. 32 Hardy Nursery Stock Production in England and Wales by R
Crane and C Barahona, University of Reading, March 1996, £12.50
No. 33 The Structure of Pig Production in England and Wales: The
results of the National survey of Pig Production Systems, February
1996 by Andrew Sheppard, University of Exeter, June 1996, £8.00
No. 34 Economics of Wheat and Barley Production in Great Britain:
1995/96 by Carol Asby and Ian Sturgess, University of Cambridge,
January 1997, £13.00
No. 35 Economics of the UK Sugar Beet Industry by Alan Renwick,
University of Cambridge, June 1997, £15.00
No. 36 The Economics of Lowland Beef Production: 1995 and 1996 by
Tim Jenkins, Euryn Jones, Iain McDougall and Huw Williams,
University of Wales, Aberystwyth, May 1998, £13.00
No. 37 Economics of Wheat and Barley Production in Great Britain:
1996/97 by Carol Asby, University of Cambridge, January 1998,
£13.00
No. 38 Economics of Oilseed Rape 1996 by M R Lewis, Askham Bryan
College of Agriculture and Horticulture, February 1998, £12.00
No. 39 Pig Production 1996/97 by Andrew Sheppard, University of Exeter,
June 1998, £8.00

72
No. 40 The Structure of Pig Production in England and Wales: The
Results of the National Survey of Pig Production Systems, 1
February 1998 by Andrew Sheppard, University of Exeter, June 1998,
£8.00
No. 41 Economics of Milk Production, England and Wales 1996/97 by
John Farrar and Jeremy Franks, University of Manchester, July 1998,
£18.00
No. 42 Economics of Wheat and Barley Production in Great Britain,
1997/98 by Carol Asby, University of Cambridge, January 1999,
£13.50
No. 43 Economics of Mushroom Production Crop Year 1997 by Jeremy
Franks and John Farrar, University of Manchester, January 1999,
£15.00
No. 44 Pig Production 1997/98 by Andrew Sheppard, University of Exeter,
July 1999, £8.00
No. 45 Dairy Enterprise Cost Survey: A Review of the Structure and
Economics of Milk Production 1987/88 to 1996/97 by Jeremy
Franks, University of Manchester, August 1999, £15.00
No. 46 The Economics of Combinable Peas and Field Beans 1998 by Paul
Wilson and Philip Robertson, University of Nottingham, March 2000,
£18.00
No. 47 Farmers' Intentions Survey, 1994 - 1997: Final Report by David
Harvey, University of Newcastle upon Tyne, April 2000, at cost5
No. 48 Economics of Cereal Production, 1998/99 by Carol Asby and Alan
Renwick, University of Cambridge, April 2000, £15.00
No. 49 Hill Cattle and Sheep Farming in England and Wales: An
Economic Review 1989/90 to 1997/98 by Martin Turner, Donald Barr
and Mark Fogerty, University of Exeter, April 2000, £10.00
No. 50 Pig Production, 1998-99 by Andrew Sheppard, University of Exeter,
August 2000, £8.00
5 Available on the Provincial Web Site; hard copies available from the Provincial Centres at cost of
copying and postage.

73
No. 51 What’s the Damage? A study of the farm level costs of managing
and maintaining the countryside by John McInerney, Donald Barr,
Greg MacQueen and Martin Turner, University of Exeter, December
2000, £10.00
No. 52 Lowland Sheep 1999: The economics and management of lamb
production by Mark Fogerty, Martin Turner and Donald Barr,
University of Exeter, January 2001, £10.00
No. 53 The Economics of Potato Production in England and Wales (1999
crop) by Paul Wilson and Philip Robertson, University of Nottingham,
January 2001, £25.00
No. 54 Machinery, Buildings and Overhead costs and Agricultural
Contracting on farms in England and Wales, 2000/01 by Abigail
Tifffin, University of Reading, August 2002, £15.00
No. 55 The Structure of Pig Production in England: The Results of the
National Survey of Pig Production Systems, 1 March 2002 by
Andrew Sheppard, University of Exeter, December 2002, £8.00
No. 56 The Structure of the Egg Industry: by Noel Russell and Yaqin
Zhuang, University of Manchester, April 2003, £10.00
No. 57 Economics of Horticulture Production under glass 2000-2002: by
Alan Renwick, Sarah Wilshin, and Sheryl Coombe, University of
Cambridge, September 2003, £15.00
ISBN 186190 129 1
No. 58 Economics of Milk Production: England and Wales 2002/03 by
John Farrar, David Coleman and Yaqin Zhuang, University of
Manchester, January 2004, £25.00
ISBN 1871542 44 8
No. 59 The Structure and Economics of Broiler Production in England by
Andrew Sheppard, University of Exeter, June 2004, £15.00
ISBN 187055878 2
No. 60 Pig Production 2002-03 by Andrew Sheppard, University of Exeter,
October 2004, £15.00
ISBN 187055878 3
No. 61 The Pig Production Sector in England and Wales by Andrew
Sheppard, University of Exeter, October 2004, £15.00
ISBN 187055881 2

74
No. 62 The Economics of Lowland Beef Production in England, 2003 by
Huw Williams, Nick Reeves, Dylan Jones and Wyn Morris, University
of Wales, Aberystwyth, February 2005, £10.00
ISBN 090212495 1
No. 63 The Economics of Egg Production in England, 2003 by John Farrar,
Noel Russell, Marie Clare and Yaqin Zhuang, University of
Manchester, February 2005, £25.00
ISBN 1871542 47 2

75
Appendix 4
Centres involved in Special Studies
Northern (Newcastle) School of Agriculture Food & Rural Development
University of Newcastle upon Tyne
NE1 7RU
Telephone: 0191 2226902
http://www.ncl.ac.uk/afrd/research/fbs/
North Eastern (Askham Bryan)
Rural Business Research Unit
Askham Bryan College
North Yorkshire
YO23 3FR
Telephone: 01904 772219
http://www.askham-bryan.ac.uk/rbru
East Midland (Nottingham)
Rural Business Research Unit
University of Nottingham
The School of Biosciences
Sutton Bonington Campus
Leicestershire
LE12 5RD
Telephone: 0115 951 6070
http://www.nottingham.ac.uk/rbru/
Eastern (Cambridge)
The Rural Business Unit
Department of Land Economy
University of Cambridge
19 Silver Street
Cambridge CB3 9EP
Telephone: 01223 337166
http://www.landecon.cam.ac.uk/environ_econ_grp/rbu/rbu_farm.htm
South Eastern (Wye)
Farm Survey Section
Department of Agricultural Sciences
Imperial College at Wye
Ashford, Kent TN25 5AH
Telephone: 020 7594 2687
http://www.imperial.ac.uk/ agriculturalsciences/research/sections/aebm/themes/fbm/survey.htm
Southern (Reading)
Dept. of Agriculture & Food Economics
University of Reading
PO Box 237
Reading RG6 6AR
Telephone: 01189 314037
http://www.apd.rdg.ac.uk/AgEcon/research/afit/index.htm

76
South Western (Exeter)
Centre for Rural Research
University of Exeter
Lafrowda House
St. German's Road
Exeter EX4 6TL
Telephone: 01392 263836
http://www.centres.ex.ac.uk/crr/