outlook on the attractions industry
TRANSCRIPT

University of Massachusetts Amherst University of Massachusetts Amherst
ScholarWorks@UMass Amherst ScholarWorks@UMass Amherst
Travel and Tourism Research Association: Advancing Tourism Research Globally
Outlook on the Attractions Industry Outlook on the Attractions Industry
Jerry Henry H2R Market Research
Follow this and additional works at: https://scholarworks.umass.edu/ttra
Henry, Jerry, "Outlook on the Attractions Industry" (2016). Travel and Tourism Research Association: Advancing Tourism Research Globally. 20. https://scholarworks.umass.edu/ttra/2013marketing/Presentations/20
This Event is brought to you for free and open access by ScholarWorks@UMass Amherst. It has been accepted for inclusion in Travel and Tourism Research Association: Advancing Tourism Research Globally by an authorized administrator of ScholarWorks@UMass Amherst. For more information, please contact [email protected].
October 28-30, 2013 ~ The Drake Hotel ~ Chicago, Illinois, USA
Outlook on the Attractions Industry
Presented by: Jerry Henry, President and CEO, H2R Market Research
For more information, contact Jerry at [email protected]
TTRA OUTLOOK FORUM:
Outlook on the Attractions Industry
Prepared by Jerry Henry | H2R Market Research | October 2013

3
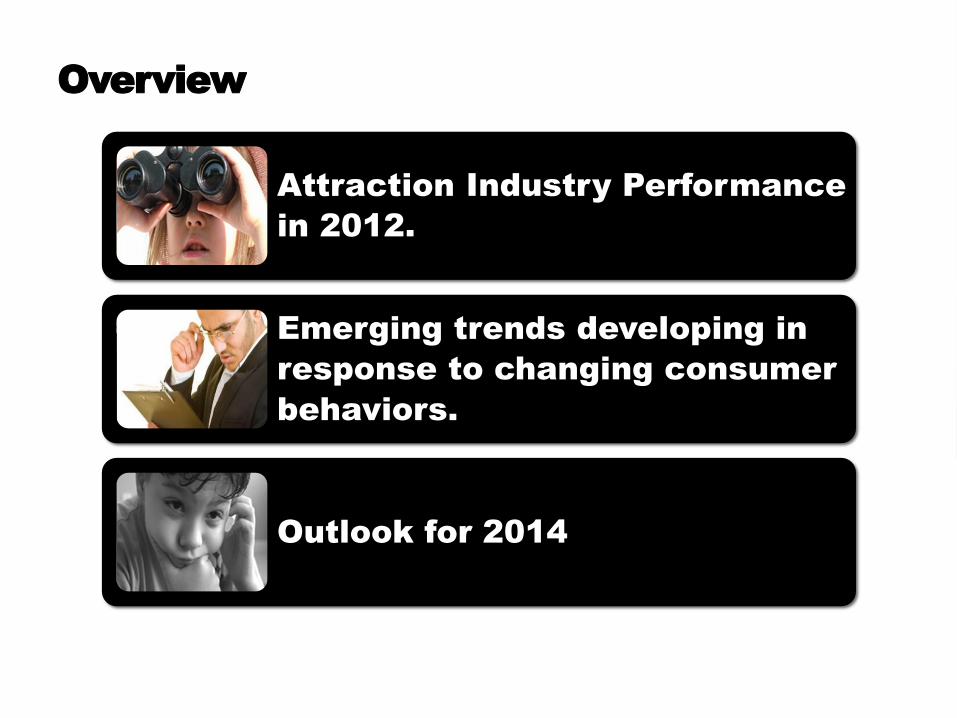
Attraction Industry Performance
in 2012.
Emerging trends developing in
response to changing consumer
behaviors.
Outlook for 2014
Overview

Aggregate U.S.
Attractions
visitation was
up 2.4% in
2012…
…much better
than the 0.7%
decrease in
2011.
RE
SU
LT
S
Source: H2R Market Research

Most Segments of the Attractions Industry
Posted Increases in 2012
-4.0% -2.0% 0.0% 2.0% 4.0% 6.0% 8.0% 10.0%
Art Museums
Musical theater
Historic sites
Major sporting events
Museums
State/national park
Water Parks
Theme Parks
Science Centers
Aquariums
Botanical Garden
Zoos
Source: TEA/AECOM, Morey & Associates, Broadway League, ESPN, NPS, H2R Market Research

Source: TEA/AECOM 2012 Global Attendance
Worldwide Theme Park & Museum Attendance
Category Variance 2012 2011
Theme Park Groups Worldwide +6.7% 357.8M 335.2M
Top 25 Theme Parks Worldwide +5.2% 205.9M 195.7M
Top 20 Water Parks Worldwide +5.4% 25.0M 23.7M
Top 20 North American Theme Parks +3.6% 131.5M 127.0M
Top 10 Latin American Theme Parks +2.6% 13.2M 12.9M
Top 20 Asian-Pacific Theme Parks +5.8% 108.7M 103.2M
Top 20 European Theme Parks -0.3% 58.0M 58.2M
Top 20 North American Water Parks +2.2% 15.4M 15.1M
Top 15 Asian-Pacific Water Parks +7.4% 16.0M 14.9M
Top 20 Museums Worldwide 98.5M
Top 20 Museums in North America 57.0M
Top 20 Museums in Asia-Pacific 41.6M
Top 20 Museums in Europe 71.5M
Source: TEA/AECOM 2012 Global Attendance

Destination vs Regional Park Performance
2.8%
4.6%
0.0%
1.0%
2.0%
3.0%
4.0%
5.0%
Destination Parks Regional Parks
$83.26 $57.70
Source: TEA/AECOM 2012 Global Attendance; H2R Market Research

2013 figures
will not be out
until June
2014.
But, early
indicators are
strong.

2013 YTD Snap Shot: Attendance Trends at
Attractions I’m Working With This Year
-5.0% -4.0% -3.0% -2.0% -1.0% 0.0% 1.0% 2.0% 3.0%
Water Parks
Aquariums/Zoos
Excursions/Sightseeing
Shows/Theaters
Theme/Amusement Parks
State/National Parks

2013 YTD Snap Shot: Performance Trends
at Attractions I’m Working With This Year
1.6%
0.4%
0.0%
0.5%
1.0%
1.5%
2.0%
Urban Attractions Rural Attractions
Source:H2R Market Research
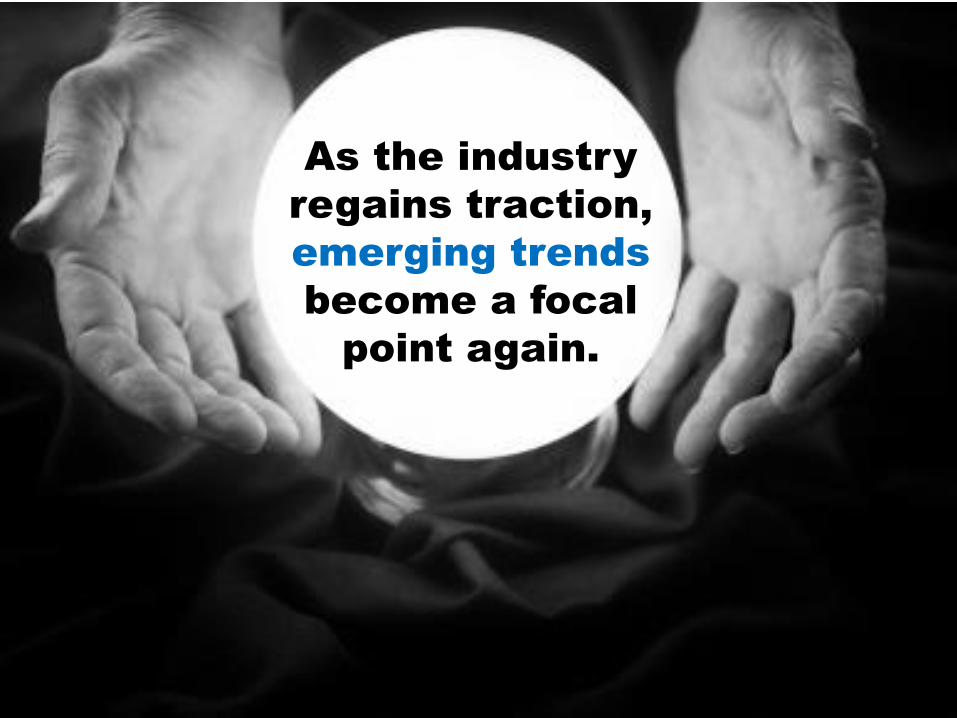
As the industry
regains traction,
emerging trends
become a focal
point again.

TR
EN
DS
9 EMERGING GLOBAL
ATTRACTION TRENDS
1. Reinvestment.2. Blurred Lines.3. Architectural Facelifts.4. Optimizing the GX.5. Entertaining Queue Lines.6. Demographics7. VIP Experiences.8. Technology.9. Leveraging Guest Information.

It takes money to make money.
TR
EN
D 1
REINVESTMENT
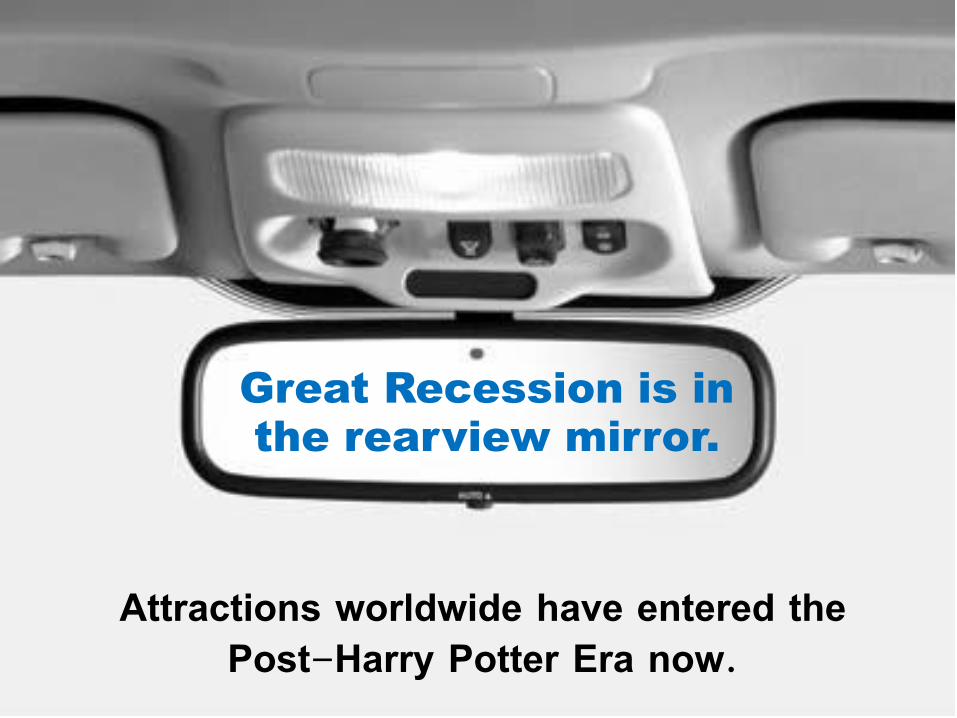
Great Recession is in
the rearview mirror.
Attractions worldwide have entered the Post-Harry Potter Era now.

Rijksmuseum Natural History Museum MD Science Center

New capital is not just delivering more of the same.
BLURRED LINEST
RE
ND
2

• Experiences are
becoming deeper,
more enhanced-
and blurred.
• Zoos are adding rides.• Theme parks are
adding animals.• Museums are adding 4D movie experiences.
• .
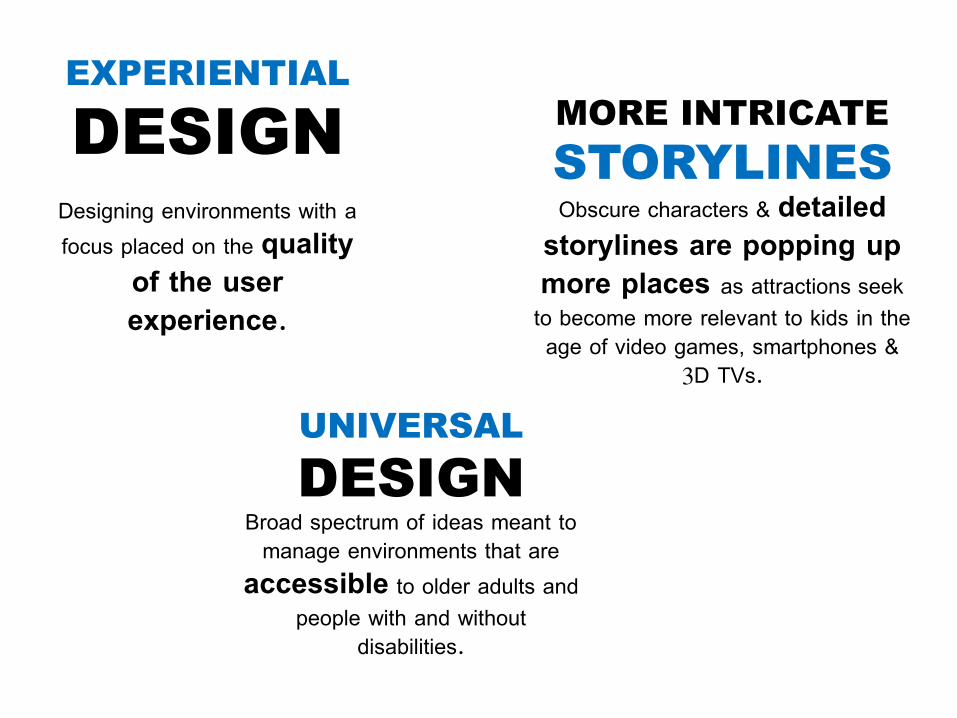
EXPERIENTIAL
DESIGN
Designing environments with a focus placed on the quality
of the user experience.
UNIVERSAL
DESIGN
Broad spectrum of ideas meant to manage environments that are
accessible to older adults and people with and without
disabilities.
MORE INTRICATE
STORYLINES
Obscure characters & detailed storylines are popping up more places as attractions seek to become more relevant to kids in the age of video games, smartphones &
3D TVs.

TR
EN
D 3
ARCHITECTURAL FACELIFTS
Some capital is just surface deep.

McDonalds $ 1 Billion makeover.
Attractions soon joined in.

Even those with iconic facades have upgraded.
Bigger, Better and More Eye Catching
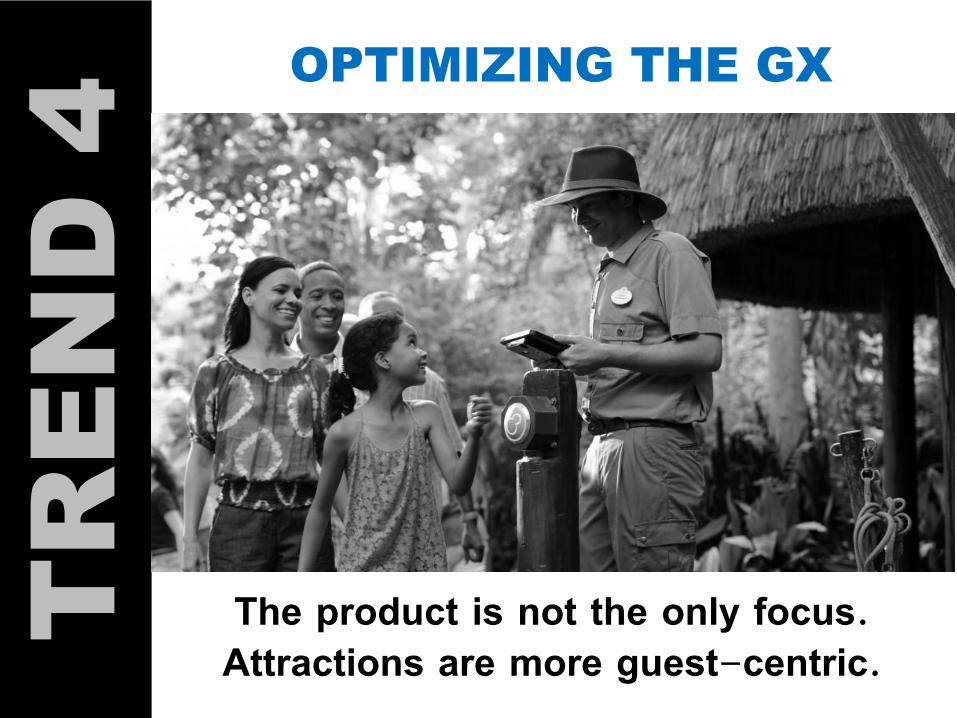
The product is not the only focus.Attractions are more guest-centric.
OPTIMIZING THE GX
TR
EN
D 4

• The experience is becoming the marketing.
• But, “good” is not good enough. Must be share worthy.
• Retention is
the new
acquisition.
Traditional marketing
is dying
Source: Purple GoldFish, Stan Phelps

• Pain points
negatively impact
the guest
experience.
• Biggest pain points across industry are:• Rude or indifferent
employees• Dirty restrooms• Rides/exhibits not
operational• Overly aggressive tour
guides/sales people• Long lines/waitsSource: PGAV Destinology; H2R Market Research

Test before you
invest.
• New product concept testing is the norm.
• Enlist consumer input before ideation, during concept vetting and in the selection process.
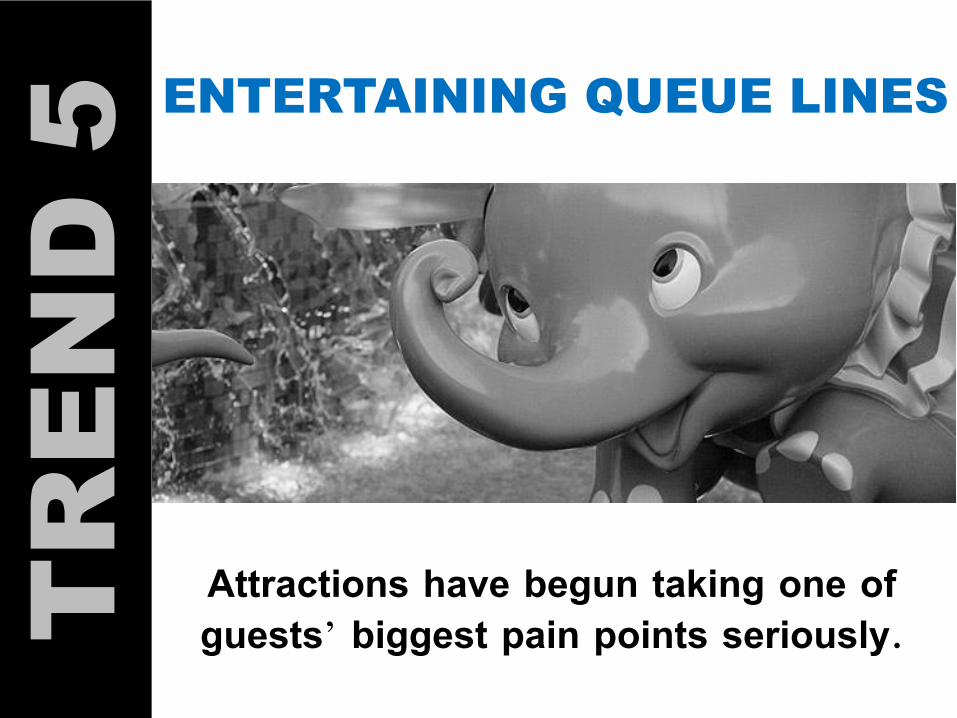
Attractions have begun taking one of guests’ biggest pain points seriously.
ENTERTAINING QUEUE LINEST
RE
ND
5

• Queue lines at U.S. attractions are getting longer.
• Some are
investing big
money to
make wait
time less
boring, more
comfortable.

Fact is, guests
expect lines.
• They just want to know management is doing everything they can to alleviate the situation.

DEMOGRAPHICS
TR
EN
D 6
A sea change is upon us that is going to impact every attraction.

Changing faces.
• Older.• More Diverse.• Fewer Family HHs.
• More Multi-generational HH Trips.
• More Travelers, Fewer Locals in 2013.
• Higher Incomes.
Source: U.S. Census Bureau; H2R Market Research
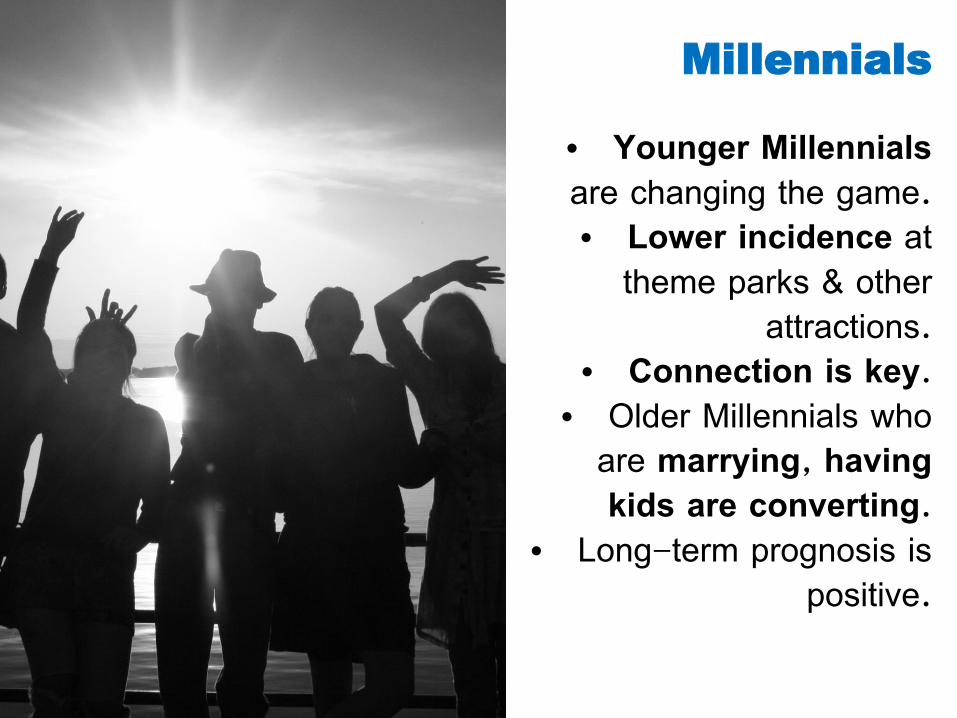
Millennials
• Younger Millennialsare changing the game.• Lower incidence at
theme parks & other attractions.
• Connection is key.• Older Millennials who
are marrying, having kids are converting.
• Long-term prognosis is positive.

• Bulk of
visitors are
middle class.
• But, there’s been a shift toward providing those with money even more ...
• Innovative,
unique and
luxurious
experiences.

VIP EXPERIENCES
TR
EN
D 7
Wealthier visitors have the money and desire for upscale
experiences.

Splurge travel is back to
pre-recession levels.
• But, the inspiration is different this time.
• More about stressreduction & control.
• Less about personal enrichment.
• Recent data suggests the trends will only grow larger.
Source: PGAV Destinology, H2R Market Research

VIP Tours
• Tour Guide Facilitates Entire Visit• Exclusive front-of-the-line ride
access• Priority parking• VIP admission & badge• 2 complimentary on-ride photos• Lunch or Dinner• Unlimited Soft Drinks• Priority live show seating

Lujan ZooArgentina
(US $84 pp)
Museum VIP Tours
Europe(Starting at
$332 pp)
NAQ Penguin
EncounterCincinnati($25 pp)
American Museum of
Natural HistoryNew York
($500 for up to 5 people)San Diego Zoo
San Diego($599 for up to 5 hours)

TECHNOLOGY
TR
EN
D 8
Influencing both front stage & back stage consumer environments.
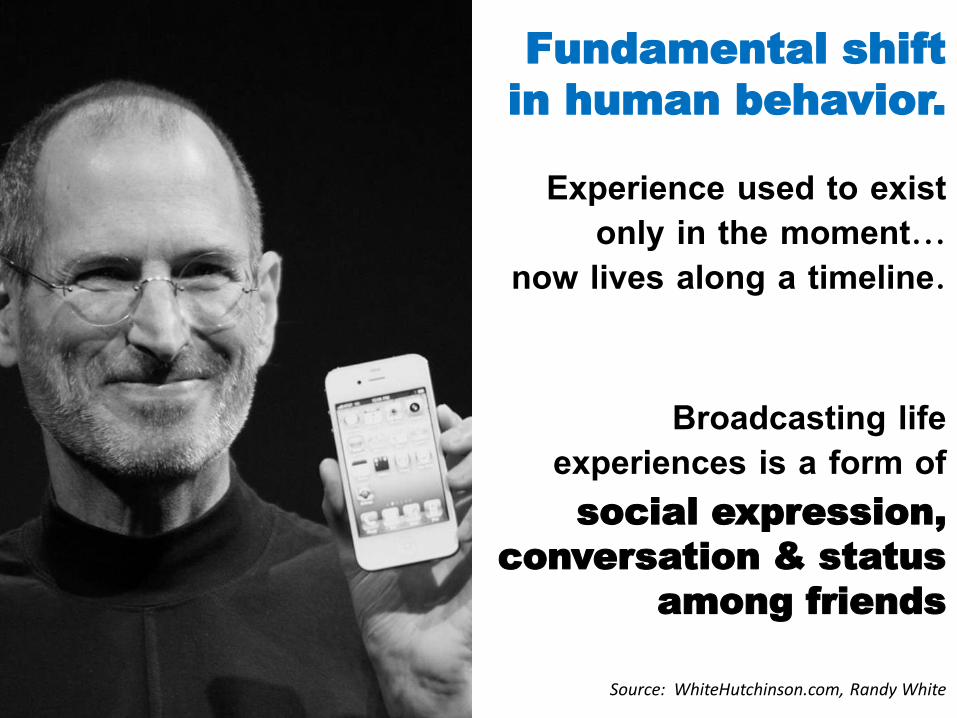
Fundamental shift
in human behavior.
Experience used to exist only in the moment...
now lives along a timeline.
Broadcasting life experiences is a form of social expression,
conversation & status
among friends
Source: WhiteHutchinson.com, Randy White

Dynamic Pricing being
used to help optimize
revenue management
• Variable pricing by season, week of month or day of week.
• Make big days bigger revenue days
• Day-part pricing• Higher prices as
new products are introduced
• Guest segmentation & targeting.
Source: Magellan Strategy Group, Chris Cavanaugh
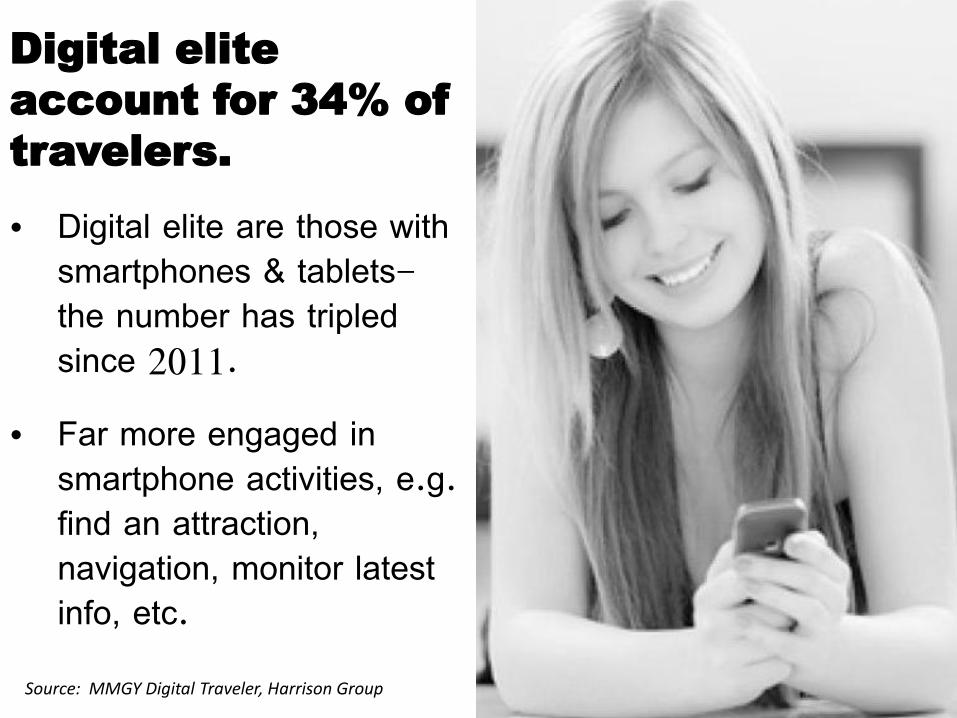
Digital elite
account for 34% of
travelers.
• Digital elite are those with smartphones & tablets-the number has tripled since 2011.
• Far more engaged in smartphone activities, e.g. find an attraction, navigation, monitor latest info, etc.
Source: MMGY Digital Traveler, Harrison Group

Technology is also impacting the GX
• Abraham Lincoln Presidential Library & Museum.
• Ghosts in the Library. Dramatic & magical special effects using Hologram technology.
• Union Theater- multi-venue special effects.”
• Live Performances

High Museum of Art:
ArtClix!
• Explore art from Picasso to Warhol on your High Museum’s Smartphone app, ArtClix!
• Integration of photo-recognition and social media -total interactive experience.
• Snap images of artwork to access text and audio.
• Create personalized post cards to share with friends.
• Engage with museum staff about the exhibition.

LEVERAGING GUEST INFOT
RE
ND
9
Leveraging guest insight & personal information to provide better experiences.

Disney’s $1 Billion+ MyMagic Program
• MagicBands are rubber bracelets that are:
• All-in-one theme park tickets
• Room Keys• Credit Cards• FastPass+• RFID sensors
trigger unique moments at attractions.
• Spend larger share of wallet at Disney, • Spur incremental spending on-park, and • Cull far more personal data about its
guests to enable it to customize more sales offers.
Source: Orlando Sentinel, 8.23.13

Not Just Disney.
Big Data is Revolutionizing Business.
• The NSA is not the only one recording your every move.
• Big business tracks your every move, keystroke, transaction, etc.

VOC Programs
are using many new tools to
dig deeper.
• Online triads/quads
• Online bulletin boards
• Online video diaries
• Social listening

Net Promoter Score
• Measure of customer happiness.
• Subtract brand detractors (0-6) from promoters (9-10) to get a net score.
• NPS is one of the only KPI’s you need to track.
• It correlates closely with corporate growth rates.
Source: Fred Reichfield

The aggregate attractions industry has a
Net Promoter Score of 43%.
49%
45%
6%
Promoters (9-10) Neutral (7-8) Detractors (0-6)
NPS:
43%
75%63%
60%57%57%
53%50%
47%45%44%43%42%40%
36%33%33%
26%9%
47%
PlanetariumWater Parks
Botanical GardenMuseums
State/national parkZoos
Art GalleriesTheme Parks
AquariumsSymphony/opera/concertSpecial events or festivals
Historic sitesScience CentersCasino/gaming
Old homes/mansionsFamily Entertainment…Major sporting events
Live music theaterOther
NPS by Consumer Segment
Source: PGAV Destinology, H2R Market Research
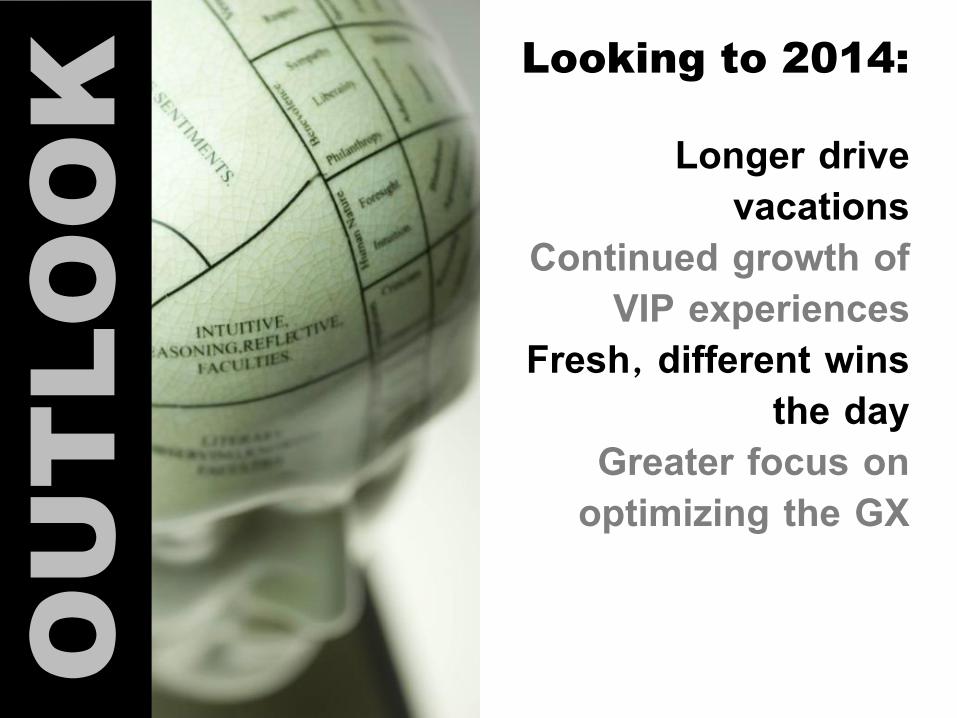
Looking to 2014:
Longer drive vacations
Continued growth of VIP experiences
Fresh, different wins the day
Greater focus on optimizing the GX
OU
TLO
OK

H2R Market Research
Attraction’s Industry Forecast
0.5%
0.9%0.7%
-0.7%
2.4%2.7%
3.0%
-1.0%
-0.5%
0.0%
0.5%
1.0%
1.5%
2.0%
2.5%
3.0%
3.5%
2008 2009 2010 2011 2012 2013f 2014p
Annual Aggregate Variance
Source: H2R Market Research
Summary of Emerging Global
Attraction Industry Trends
1. Reinvestment2. Blurred Lines3. Architectural Facelifts4. Optimizing the GX5. Entertaining Queue Lines6. Demographics7. VIP Experiences8. Technology9. Leveraging Guest Information

Key Takeaways
1. Aggregate attraction industry performance is improving.
2. Changing demographics are causing a sea change.3. The composition of attraction experiences is evolving rapidly to provide more immersive, deeper
connections with guests. 4. The industry is becoming far more consumer-centric– optimizing the guest experience, minimizing
pain points & leveraging information.

541717 East Republic Road, Suite C ● Springfield, MO 65804 ● 417.877.7808