overview of energy scenario - dsm -...
TRANSCRIPT

Rangan Banerjee
Forbes Marshall Chair Professor
Department of Energy Science and Engineering
IIT Bombay
DSM Workshop at IIT Bombay December 7. 2016
Overview of Energy Scenario

2http://www.sankey-diagrams.com/wp-content/gallery/o_gallery_202/global-energy-conversion-to-economic-services1.png
Cullen and Allwood, 2010
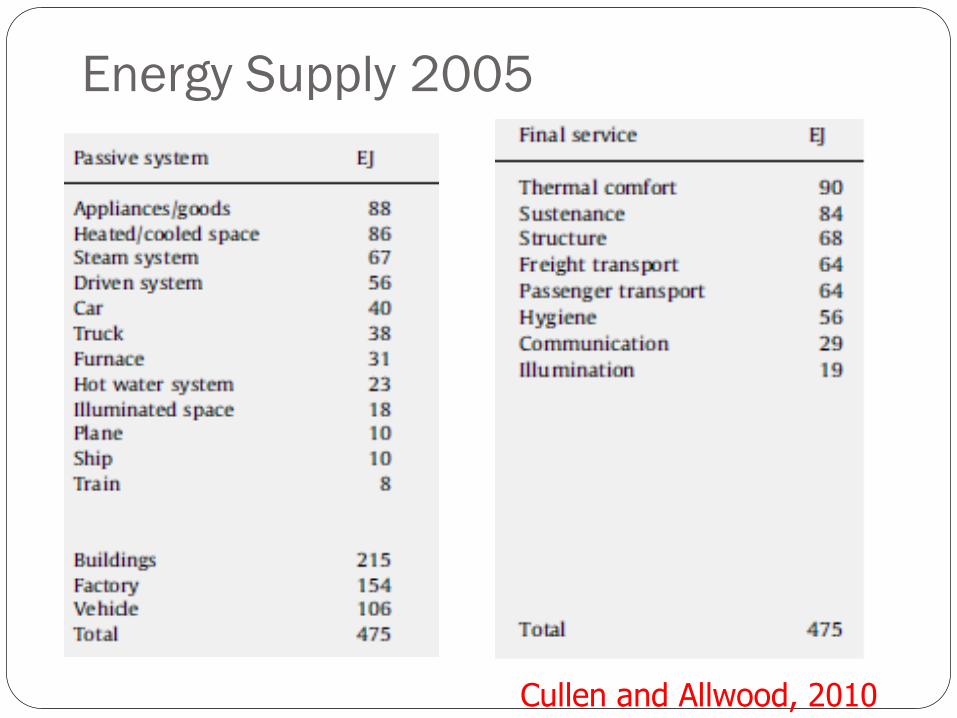
Energy Supply 2005
3Cullen and Allwood, 2010

India and World (Selected Indicators for 2012)
Source: IEA, Key World Energy Statistics 2014
Population 1237 million 7037 million
GDP (PPP) 5567 Billion 2005 US$
(4500 $/person)
82901 Billion 2005 US$
(11780 $/person)
Primary Energy 33 EJ 559 EJ
Energy/person 26.6 GJ/person/year 84.4 GJ/person/year
Electricity/person 760 kWh/capita/year 2972 kWh/capita/year
CO2 emissions
Per person
Per GDP
1626 Million tonnes 31734 Million tonnes
1.58 tonnes /capita/year 4.51 tonnes /capita/year
0.35 kg /US$ ppp 0.38 kg /US$ ppp
5

6
Are our electricity supply systems sustainable?

Global Trends – Unbounded Growth?
GEA Ch 3 7

Rockstrom et al, Nature 2009 4

Long term global temperature record
Rockstrom et al, Nature 2009 5

Carbon Dioxide Concentrations
http://cdiac.ornl.gov/trends/co2/graphics/lawdome.gif 6

Recent Carbon dioxide concentrations
11https://scripps.ucsd.edu/programs/keelingcurve/
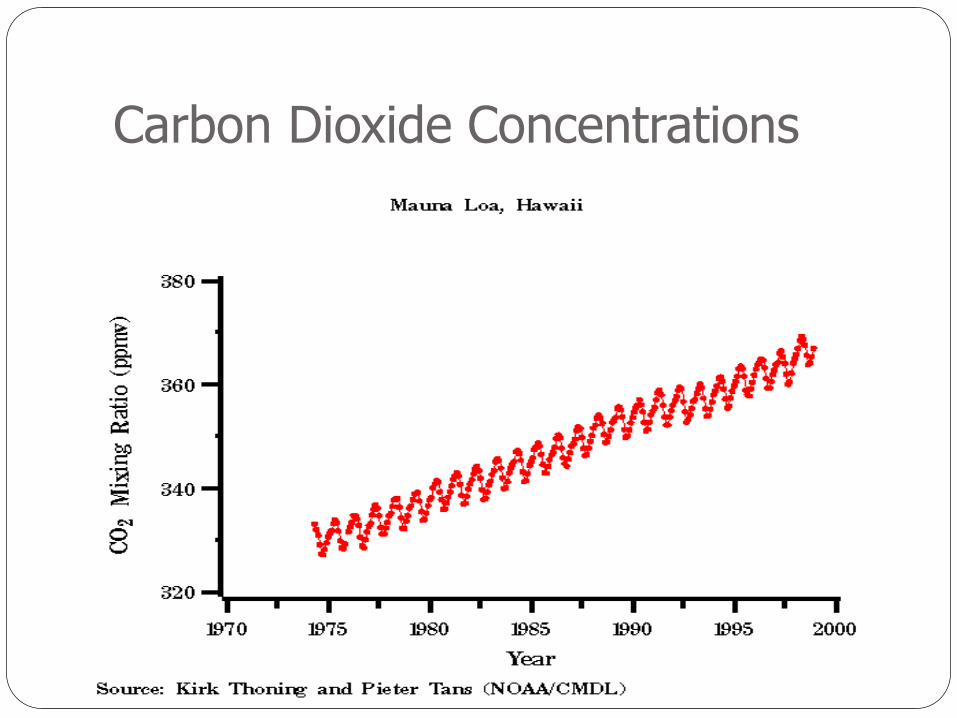
Carbon Dioxide Concentrations

Carbon Dioxide Emissions
Kaya identity: Total CO2 Emissions
= (CO2/E)(E/GDP)(GDP/Pop)Pop
CO2/E – Carbon Intensity
E/GDP- Energy Intensity of Economy
Mitigation – increase sinks, reduce sources- aforestation, fuel mix,energy efficiency, renewables,nuclear, carbon sequestration
Adaptation

Source: IPCC, 2011 14
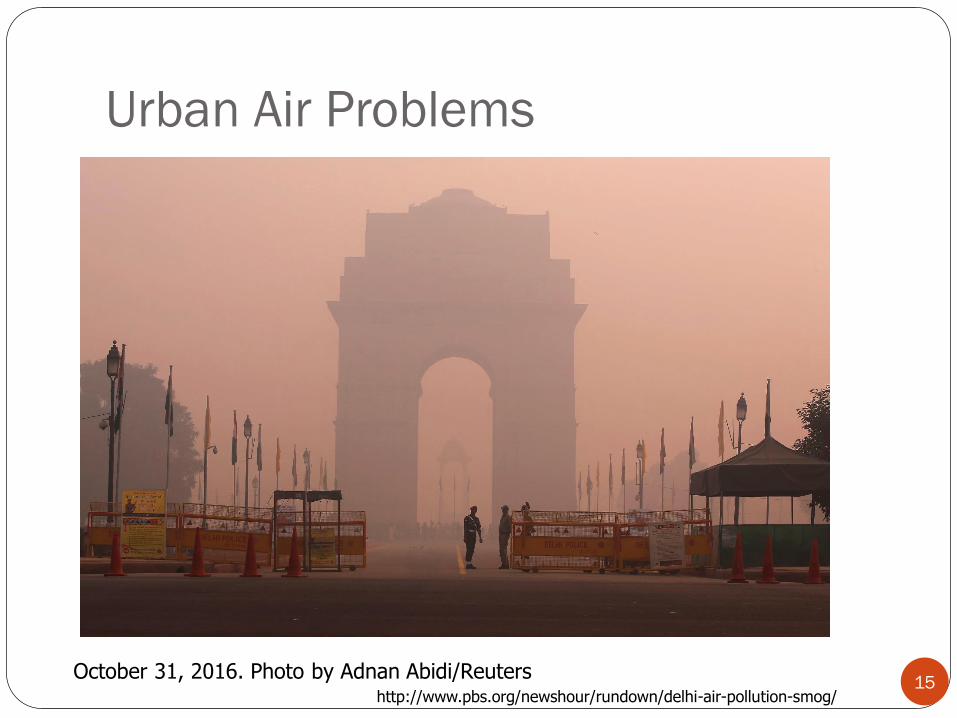
Urban Air Problems
15October 31, 2016. Photo by Adnan Abidi/Reuters
http://www.pbs.org/newshour/rundown/delhi-air-pollution-smog/

History Of Electric Power Generation
100 kW DC
Power
Systems
Edison
1880
1882
Darjeeling Power
Station 13 kW
Hydro power
station
1896
1948
2015
1914
19811
900
1931
1965
2000
1895
Emambagh
Power Station –
CESC – Thermal
power station
1,362
MW
19471899
1964-69
Tarapur –
1st Nuclear
power plant
(2x160MW
=320MW)
Westinghouse,
Tesla-AC
power plant
TATA
Power
4000 MW
Power
plant,
Gujarat
2013
Damodar
Valley
Corporation &
Electricity
Supply Act
formed by
Govt. of India
Total
Installed
capacity-
1713MW
(15kWh/
capita)
1950
JNNSM
2010
Rajastan –
Atomic Power
Plant(300MW
+4x220MW)
Kaiga
Generating
Station-
(4x220MW
)
Kudankulam
-1000 MW
2014
7

Historical Household Electrification
Rates
GEA, Chapter 19
17

Installed Capacity - India
303070 MW All India installed capacity
Source: GOI, Ministry of Power, India (powermin.nic.in)
43086 MW Total Renewable installed capacity
2016 (as on 30.04.16)
Coal, 185993Nuclear,
5780
Natural Gas, 24509
Hydro (Res.), 41267
Diesel, 919
Renewables (Res.), 43086
Wind power, 26867
Small Hydro power, 4275
Biomass & Bagasse,
4831
Waste to Power, 115
Solar Power , 6998
Source: MNRE, Govt. of India (www.mnre.gov.in)
8

9
AustraliaSwitzerland
2013 India
United States
0.000
0.100
0.200
0.300
0.400
0.500
0.600
0.700
0.800
0.900
1.000
0 5000 10000 15000
Hum
an D
evelo
pm
en
t In
dex (
HD
I)
Annual Electricity consumption/ capita (kWh)
HDI and Electricity consumption (2013)
World
2035 India
1980 India
Netherlands
Russia
Pakistan
0.80-0.93
0.71 - 0.8
Very High HDI
High HDI
Medium HDI
Low HDI
0.57 - 0.70
0.41 - 0.55
Renewable share?
20
What will be the future supply mix for the Electricity sector ?
How much can renewables and nuclear supply?

India’s INDC
#1 Reduce Emissions Intensity of GDP by 33-35% of
2005 level in 2030
#2 Create 40% cumulative non fossil power by
installed capacity by 2030 (using finance from Green
Climate Fund)
#3 Create an additional carbon sink of 2.5 to 3 billion
tonnes of CO2 equivalent through additional tree
cover and forest
21

Renewable Energy Options
Wind
Solar Small
Hydro Biomass
Tidal
Energy
Wave Energy
Ocean Thermal
Energy
Solar Thermal
Solar
Photovoltaic
Geothermal*

0
2
4
6
8
10
12
14
2001 2002 2003 2004 2005 2006 2007 2008 2009 2010 2011 2012 2013
Renewable Installed Capacity
Renewable Generation
Nuclear generation Nuclear Installed Capacity
Renewable Share in Power
12

24
Renewable installed capacity and generation
*as on 28.02.2016 MNRE website: www.mnre.gov.in
Installed
Capacity*
Estimated
Capacity factor
Estimated
Generation
(GWh) (MW)
Wind 25217 14% 30926
Biomass & Bagasse 4827 70% 29596
Small Hydro 4194 40% 14697
Waste to Energy 115 50% 504
Solar PV 5547 19% 9233
Total 39901 25% 84957
13

Power Generation – Supply mix
Thermal
Nuclear
Renewables and Hydro
14

Power Generation – Supply mix
Thermal
Nuclear
Renewables and Hydro
15

Power Generation – Supply mix
Thermal
Nuclear
Renewables and Hydro
16

Cost of Electricity ($/MWh)
3 R
s./k
Wh
6 R
s./k
Wh
9 R
s./k
Wh
Bloomberg, 2015 17

29
Comparison of Supply technologies
GenerationTechnology
SIZERANGE(GW)
COSTCrores/ MW
Rs/kWh
CAPACITY FACTOR
AREA(m2/GWh)
CO2
Equivalent(gC02/kWh)
WATERl/MWh
COAL 0.1-4 5-6 3.5 0.8-0.9 200-400 820 1000
CCGT 0.1-1.5 4-5 3 0.5 -0.8 100 490 500
SOLAR PV 0.001-0.75
5-7 5.5 0.25 385 48 100
SOLARTHERMAL
0.01-0.5 10-15 12 0.25-0.29 300 48 3500
HYDRO 2.4-0.1 5-6 2.5-3.0
0.38-0.5 1374 24 17000
NUCLEAR 9.9-0.44 6.5-8 6-7 0.8-0.9 120 12 1000
WIND 1-0.1 6 4.5 -5.0
0.25 125 11 0
http://www.indiaenvironmentportal.org.in/files/file/solar%20energy%20in%20India.pdf

World’s largest solar power plant
30
648 MW 4654 crore ~ Rs 7.2 crores/ MWArea 10 km2 Kamothi, Tamil NaduRobotics for automatic panel cleaningPlant built in 8 months
http://www.indiatimes.com/news/india/india-is-now-home-to-the-world-s-largest-solar-power-plant-it-s-big-enough-to-power-150-000-homes-266449.html

1 MW Solar Plant – IIT Bombay
http://www.indiaprwire.com/pressrelease/education/20140128287038.htm19

Building Integrated PV
32
Roofed walkway with HeliaFilm® at the Seletar
Airport Singapore
Entrance canopy of CleanTech Park 2,
Singapore
30 m2
flexible 7%
Organic PV 12%

33

Printed PV
34
VICOSC’s new solar cell printer installed at CSIRO
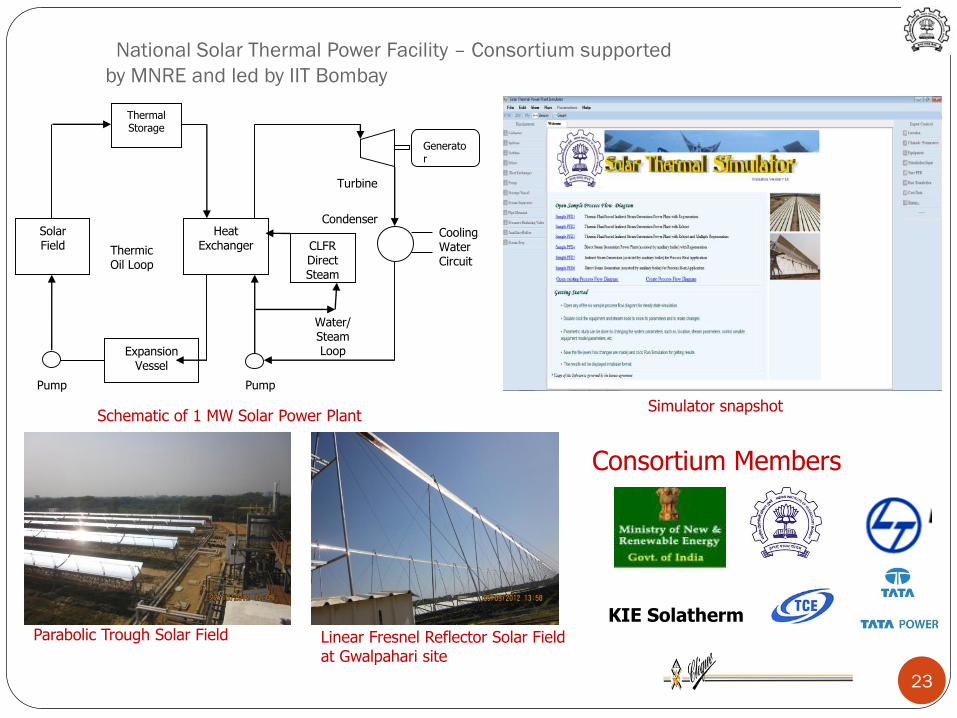
National Solar Thermal Power Facility – Consortium supported
by MNRE and led by IIT Bombay
Thermal Storage
Solar Field
Expansion Vessel
Heat Exchanger
Generator
Condenser
Turbine
PumpPump
Cooling Water Circuit
Water/ Steam Loop
ThermicOil Loop
CLFR Direct Steam
Schematic of 1 MW Solar Power PlantSimulator snapshot
Parabolic Trough Solar Field Linear Fresnel Reflector Solar Field at Gwalpahari site
Consortium Members
KIE Solatherm
23

3
6
24

3
7
25

Prototype for 24 x 7 Solar Thermal Power
Development of indigenous heliostat
Development of improved LFR with
steam storage using PCM
Development of molten salt loop and
stratified storage
Temperature
°C
1 290 Flow
2 550 Flow
3 550 No Flow
4 290 No Flow
Heat transfer fluid is molten salt
flow
condition
Heat Exchanger
Stratifiedmolten salt
Storage
Solar tower
1
2
3
4
Molten saltPump for tower
Molten saltPump for H.X
Water
Superheatedsteam
DESE- IIT Bombay
Partners: Clique Consultants, Mumbai
KGDS Renewable Energy, Coimbatore
Sponsored by NETRA –NTPC Ltd
26

Share of Energy Imports - India
39
0.0
5.0
10.0
15.0
20.0
25.0
30.0
1970
1972
1974
1976
1978
1980
1982
1984
1986
1988
1990
1992
1994
1996
1998
2000
2002
2004
2006
2008
2010
Import Share (INDIA)

0
50
100
150
200
250
300
350
20
00
20
02
20
04
20
06
20
08
20
10
20
12
20
14
20
16
20
18
20
20
Tota
l In
stal
led
Cap
acit
y o
f So
lar
and
Win
d E
ne
rgy
(GW
)
China USA India Japan Germany
Existing Capacity (GW) Targets for the Future (GW)
31

Plan Layout
41
32

A portion of the ELU map of Ward A of MCGM
Corresponding Satellite Imagery for the area from Google Earth
Analyzed in QGIS 1.8.0To determine-Building Footprint Ratios- Usable PV AreasFor Sample Buildings
Source: R. Singh and Banerjee, 2015 33

0
0.5
1
1.5
2
2.5
0:0
1-
1:0
0
1:0
1-
2:0
0
2:0
1-
3:0
0
3:0
1-
4:0
0
4:0
1-
5:0
0
5:0
1-
6:0
0
6:0
1-
7:0
0
7:0
1-
8:0
0
8:0
1-
9:0
0
9:0
1-1
0:0
0
10:0
1-1
1:0
0
11:0
1-1
2:0
0
12:0
1-1
3:0
0
13:0
1-1
4:0
0
14:0
1-1
5:0
0
15:0
1-1
6:0
0
16:0
1-1
7:0
0
17:0
1-1
8:0
0
18:0
1-1
9:0
0
19:0
1-2
0:0
0
20:0
1-2
1:0
0
21:0
1-2
2:0
0
22:0
1-2
3:0
0
23:0
1-2
4:0
0
MU
s
Jan, 2014 Typical Load Profile vsPV Generation
1-AxisTracking @Highest eff.
1-AxixTracking @Median eff.
19 deg. FixedTilt @ Highesteff.
19 deg. FixedTilt @ Medianeff.
0.115
0.125
0.135
0.145
0.155
0.165
0.175
0.185
Jan Feb Mar Apr May Jun Jul Aug Sep Oct Nov Dec
Capacity Factor for Mumbai
1-Axis Tracking
Fixed Tilt @ 19deg.
Annual Averagewith 1-AxisTracking
34Source: R. Singh and Banerjee, 2015
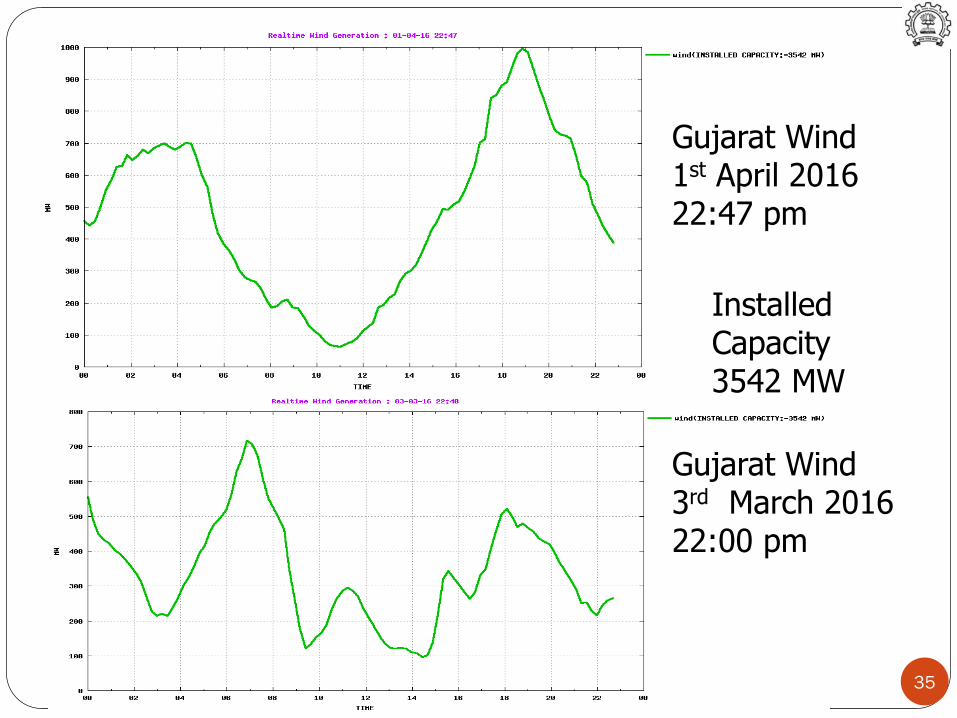
35
Gujarat Wind1st April 201622:47 pm
Gujarat Wind3rd March 201622:00 pm
Installed Capacity 3542 MW

A.Dave, T.Kanitkar and R.Banerjee Analysing Implications of India's Renewable Energy Targets, 2016 - draft 36

37
SAM
Intermediate
ConsumptionFinal Demand
EndogenousExog
enou
s
SAM Coefficients
Multiplier Decomposition
Δf
New Production
New SAM
Scenarios for
Sectoral Growth
Energy Demand
Energy Supply
Constraints –
Resource,
Emissions
Investment
Analysis using SAM From Decomposition Analysis
Δx = MA*Δf
From Optimisation
or Manual

Summary
India – low energy use, high growth, predominantlt fossil based
INDC targets -achievable
Low Capacity factors- High daily and seasonal variability
Financing issues – Initial capital – Reduction in GDP, Equity impacts
Storage costs – problems with high penetration -Capacity credit?
Need for R&D and indigenization
Impact on Employment
Need for alternatives – Energy Efficiency and Demand Side Management
47
References
48
GEA, 2012 Chapter 3 : Global Energy Assessment - Toward a Sustainable Future,
Cambridge University Press, Cambridge, UK and New York, NY, USA and the
International Institute for Applied Systems Analysis, Laxenburg, Austria.
T. Kanitkar et al 2015: Tejal Kanitkar, Banerjee, R. Banerjee and T. Jayaraman,
Impact of economic structure on mitigation targets for developing countries,
Volume 26, June 2015, 56–61, June 2015.
Ministry of New and Renewable Energy (MNRE), Government of India, New
Delhi, website: www.mnre.gov.in
Ministry of Power, Government of India, http://powermin.nic.in/
R. Singh and Banerjee, 2015: Singh, R., and Banerjee, R., Estimation of rooftop
solar photovoltaic potential of a city, Solar Energy, Vol. 115, 589-602, May 2015.
Rockstrom et al, Nature 2009
http://cdiac.ornl.gov/trends/co2/graphics/lawdome.gif
http://www.indiaenvironmentportal.org.in/files/file/solar%20energy%20in%20India.
http://www.indiaprwire.com/pressrelease/education/20140128287038.htm
Bloomberg New Energy Finance, 2016: Global Trends in Renewable Energy
Investment 2016
A.Dave, T.Kanitkar and R.Banerjee Analysing Implications of India's Renewable Energy Targets,
2016 - draft

41
Acknowledgment
Balkrishna SurveTejal Kanitkar
Thank [email protected]@gmail.com
Solar power team+ Team Shunya
Rhythm Singh Pankaj Kumar
Jani Das Ajit Paul Abraham