overview of graduation rate, sat, act, advanced placement ... · •earned a score of 3 on an ap...
TRANSCRIPT

Overview of Graduation Rate, SAT, ACT,
Advanced Placement, and Dual Credit
Gregg ColschenNovember 19, 2019

Special Thanks to the Team Dr. Chris Hines – Deputy Superintendent
Dr. Debbie Phillips – Assistant Superintendent of Elementary Education
James Kacur – Assistant Superintendent of Operations
Dr. Shellie Winkler – Director of Elementary Education
Dr. Tamika Taylor – Director of Assessment and Evaluation
Greg Shipp – Director of Career and Technical Education
Denise Cipolla – Coordinator of Guidance and Counseling
Debbie McNeely – Coordinator for Advanced Academic Programs
Laura Willard – College Readiness Specialist
Tracy Petersen– Secretary for the Assistant Superintendent for Secondary Education

College Career Military Readiness (State)
% 2018-19 Graduates who met any of the following criteria:• Earned a score of 3 on an AP exam• Met TSI criteria in Reading and Math (SAT/ACT/TSIA/College Prep course)• Met dual credit course requirements (≥3 hours in English or Mathematics or ≥9
hours total)• Earned an Associate’s Degree• Earned one of the Industry-Based Certifications specified in 19 TAC §74.1003• A student receiving special education services who graduated with a completed
IEP and workforce readiness (graduation type code of 04, 05, 54 or 55)• Enlisted in US Armed Forces (including documentation of an expressed
intention to enlist)

Graduation Rate Trend
92.30% 92.50%
94.20%
95.50%95.10%
94.70%
95.70% 95.50% 95.60%95.30%
80.60%
84.30%
85.90%
87.70%88.00%
88.30%
89.00% 89.10%89.70%
90.00%
80.00%
82.00%
84.00%
86.00%
88.00%
90.00%
92.00%
94.00%
96.00%
98.00%
2009 2010 2011 2012 2013 2014 2015 2016 2017 2018
CISD Texas

Endorsements
0.00%
10.00%
20.00%
30.00%
40.00%
50.00%
60.00%
70.00%
80.00%
90.00%
100.00%
STEM Business and Industry Public Service Arts and Humanities Multidisciplinary Studies
18.20%
6.90%4.00%
22.70%
48.20%
35.00%
16.65%10.42%
43.08%
96.28%
2018 2019

Class of 2018
0.00%
10.00%
20.00%
30.00%
40.00%
50.00%
60.00%
70.00%
80.00%
90.00%
100.00%
Graduated Received GED Continued Dropped Out
Conroe ISD 95.30% 1.00% 2.80% 0.90%
Texas 90.00% 0.40% 3.80% 5.70%
Conroe ISD Texas

National Merit Competition: National Merit Semifinalists 2015-2019
0
10
20
30
40
50
60
70
80
90
2015-16 2016-17 2017-18 2018-19 2019-20
23
27
24
40 38
79
86 85
59
80
32
43
36 37
44
Semi-finalist Commended Hispanic

0%
10%
20%
30%
40%
50%
60%
70%
80%
90%
Met EBRW CollegeReady Benchmark
Met Math CollegeReady Benchmark
Met Both CollegeReady Benchmarks
Neither Benchmark
68%
48%
45%
26%
62%
39%37%
36%
82%
63%60%
15%
National Texas Conroe ISD
2019 College Readiness 2019 SAT Performance
0
200
400
600
800
1000
1200
Evidence BasedReading & Writing
Math Total 2 TestsCombined
531 528
1059
515507
1022
570 565
1,135
National Texas Conroe ISD
0
5
10
15
20
25
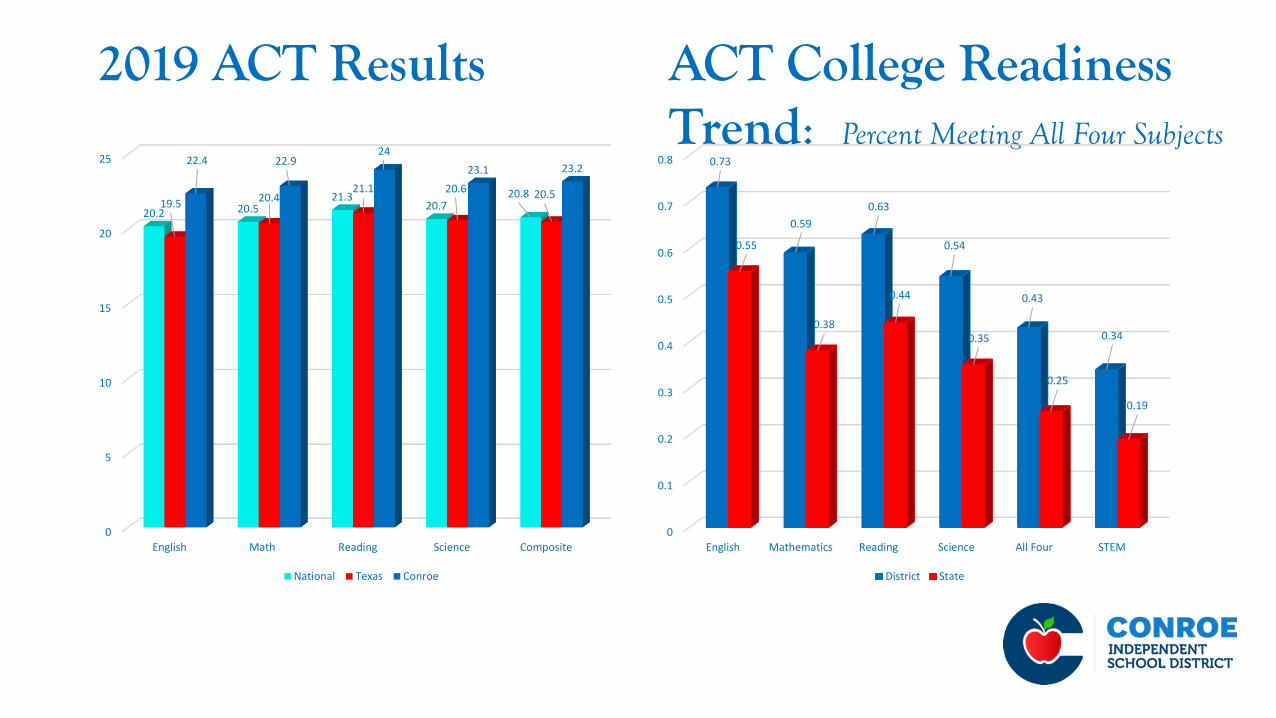
English Math Reading Science Composite
20.2 20.521.3
20.720.8
19.520.4
21.1 20.6 20.5
22.4 22.924
23.1 23.2
National Texas Conroe
2019 ACT Results ACT College Readiness Trend: Percent Meeting All Four Subjects
0
0.1
0.2
0.3
0.4
0.5
0.6
0.7
0.8
English Mathematics Reading Science All Four STEM
0.73
0.59
0.63
0.54
0.43
0.34
0.55
0.38
0.44
0.35
0.25
0.19
District State

3-Year SAT Score Trend 2-Test Combined (Test Changed 2017)
5-Year ACT Subject Test Trend 2015-2019
English Reading Math Science Composite
2015 23.3 24.3 24.4 23.8 24.1
2016 22.1 23.3 23.7 23.1 23.2
2017 22.7 23.4 24.1 23.4 23.5
2018 22.4 23.1 23.8 23.1 23.2
2019 22.4 22.9 24 23.1 23.2
20.5
21
21.5
22
22.5
23
23.5
24
24.5
25
National Texas Conroe ISD
2017 1060 1020 1143
2018 1049 1043 1177
2019 1088 1036 1182
900
950
1000
1050
1100
1150
1200
ACT ParticipationSAT Participation Trend: Number of Students Tested
0
500
1000
1500
2000
2500
3000
2014-2015 2015-2016 2016-2017 2017-2018 2018-2019
2129 2165
2308
2454
2617
0
200
400
600
800
1000
1200
1400
1600
1800
2000
2014-2015 2015-2016 2016-2017 2017-2018 2018-2019
1406
1606
1,793
1,890
1,657

0
500
1000
1500
2000
2500
SAT ACT Both ACT Only
2477
1162
958
204
CISD Testing TrendsTotal of One-Type Test Takers: 2,681

Advanced Placement ExamsCISD Five Year AP Trend: Students and Tests
0
2000
4000
6000
8000
10000
12000
2015 2016 2017 2018 2019
9155 9386 9367
9969
10552
4121 43774544 4812 4997
Number of Tests Number of Students Taking AP Exams

2019 AP Exam Scores of 3 and Above
0%
10%
20%
30%
40%
50%
60%
70%
2015 2016 2017 2018 2019
60% 59% 60%
65%
62%
46% 46% 46%48% 49%
57% 57% 57% 58%60%
CISD Texas National

Top Ten AP Exams Taken -Score of 3 and above
CISD 2019 Top Ten AP Exams
% of 3 and Above
Course # exams % 3’s and above
World History 965 61%
Human Geography 901 60%
U.S. Government & Politics 671 59%
Macroeconomics 662 50%
U.S. History 618 56%
English Language 610 61%
Statistics 576 63%
Physics 1 574 47%
Psychology 533 55%
English Literature 521 66%
0
200
400
600
800
1,000
1,200
1,400
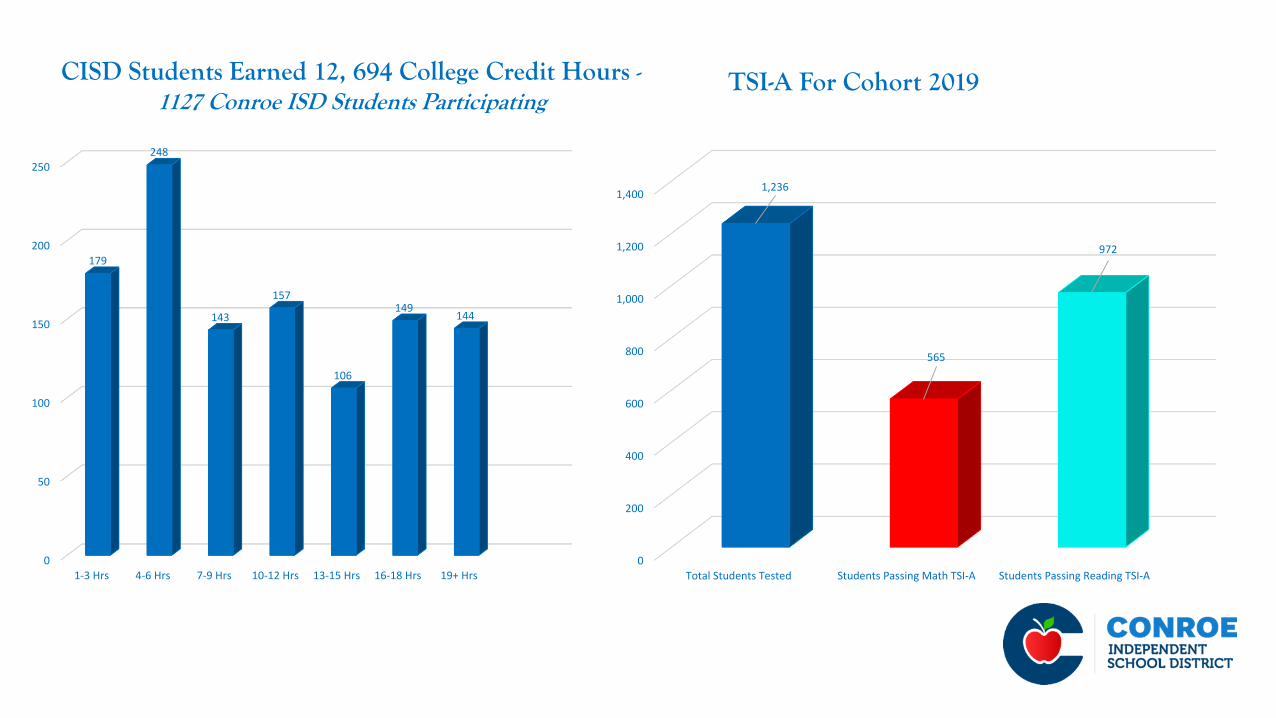
Total Students Tested Students Passing Math TSI-A Students Passing Reading TSI-A
1,236
565
972
TSI-A For Cohort 2019CISD Students Earned 12, 694 College Credit Hours -1127 Conroe ISD Students Participating
0
50
100
150
200
250
1-3 Hrs 4-6 Hrs 7-9 Hrs 10-12 Hrs 13-15 Hrs 16-18 Hrs 19+ Hrs
179
248
143
157
106
149144

Dual Credit / Work Force Programs With Lone Star College
Dual Credit / Work Force
English 1301 753
English 132 746
English 2332 491
English 2333 434
History 1301 581
History 1302 456
Math 1314 273
Govt. 2305 151
Spaniish 2311 11
Auto Tech 6
Emergency Medical Technician 9
Campus Totals
Fall/Spring 1996/1951

2019 CTE Industry Based Certifications Earned Industry Based Certifications Earned
Adobe Certified Associate (ACA) - Flash Professional 0
Adobe Certified Associate (ACA) - Illustrator 25
Adobe Certified Associate (ACA) - Photoshop 14
Adobe Certified Associate (ACA) - Premiere Professional 2
Adobe Certified Associate (ACA) - Print & Digital Media Publication InDesign 0
Adobe Certified Expert (ACE) - Adobe Illustrator 2
American Hotel and Lodging: Certified Guest Service Professional 12
AutoCAD Certified Associate 2
AutoCAD Certified User 90
Autodesk 3D Max Design Certified Associate 3
Autodesk Maya Certified Associate 19
Autodesk Revit Architecture Certified Associate 5
AWS - D1.1 Certification 1
AWS - D9.1 Certification 3
Certified Clinical Medical Assistant 212
Certified SolidWorks Associate (CSWA) 23
Certified SolidWorks Professional (CSWP) 0
Certified Veterinary Assistant 27
Child Care Education Institute 331
Cosmetology Operator License (TX Dept. Of Licensing and Regulation) 9
CPR 406
Entrepreneurship and Small Business 16
Microsoft Office Specialist (MOS) - Access 42
Microsoft Office Specialist (MOS) - Excel 232
Microsoft Office Specialist (MOS) - Master 1
Microsoft Office Specialist (MOS) - PowerPoint 162
Microsoft Office Specialist (MOS) - SharePoint 1
Microsoft Office Specialist (MOS) - Word 390
Microsoft Technology Associate (MTA) - Networking Fundamentals 0
Microsoft Office Expert - Excel 25
Microsoft Office Expert - Word 64
NCCER - Core Level 1 56
NCCER - Carpentry Fundamentals 16
OSHA 293
Outlook Certification 38
Pharmacy Technician Certified (CPhT) 10
ServSafe Food Handlers 432
ServSafe Food Managers 2
Texas Beef Quality Assurance 25
Total Certifications 3025

Military Enlistments / Associate’s Degrees
23
45
2
32
17
119
0
20
40
60
80
100
120
140
1
Air Force Army Coast Guard Marines Navy Total Enlistments0
1
2
3
4
5
6
7
8
2017 2018 2019
8
7
5
First Year of Program’s Cohort is 2017

2019 College, Career, and Military ReadinessTotal Graduates 3953 / Total credit for CCMR criteria 2801 (71%)
Texas Success Initiative (TSI) Criteria
Met TSI Criteria in Both ELA/Reading and Mathematics 2281 58%
ELA/Reading
Met TSI Criteria for ELA/Reading 2784 70%
Mathematics
Met TSI Criteria for Math 2377 60%
AP / IB Examinations 1297 33%
Dual Course Credit 966 24%
Industry-Based Certifications 105 3%
Associate’s Degree 7 0%
U.S. Armed Forces 39 1%