overview of the team software processsm - … · navair july 2004 psm presentation – slide 1...
TRANSCRIPT
NAVAIR July 2004 PSM Presentation – Slide 1
Overview of theTeam Software ProcessSM
&Personal Software ProcessSM
Jeff SchwalbNAWCWD
(760) 939-6226DSN 437-6226
Capability Maturity ModelSM, CMMSM, PSPSM, Personal Software ProcessSM, TSPSM, and Team Software ProcessSM are service marks of Carnegie Mellon University.

NAVAIR July 2004 PSM Presentation – Slide 2
What is Software ProcessDetailed scriptsForms and templatesChecklistsData and information• Measures• Metrics
Supporting tools• Only after the process is understood
NAVAIR July 2004 PSM Presentation – Slide 3
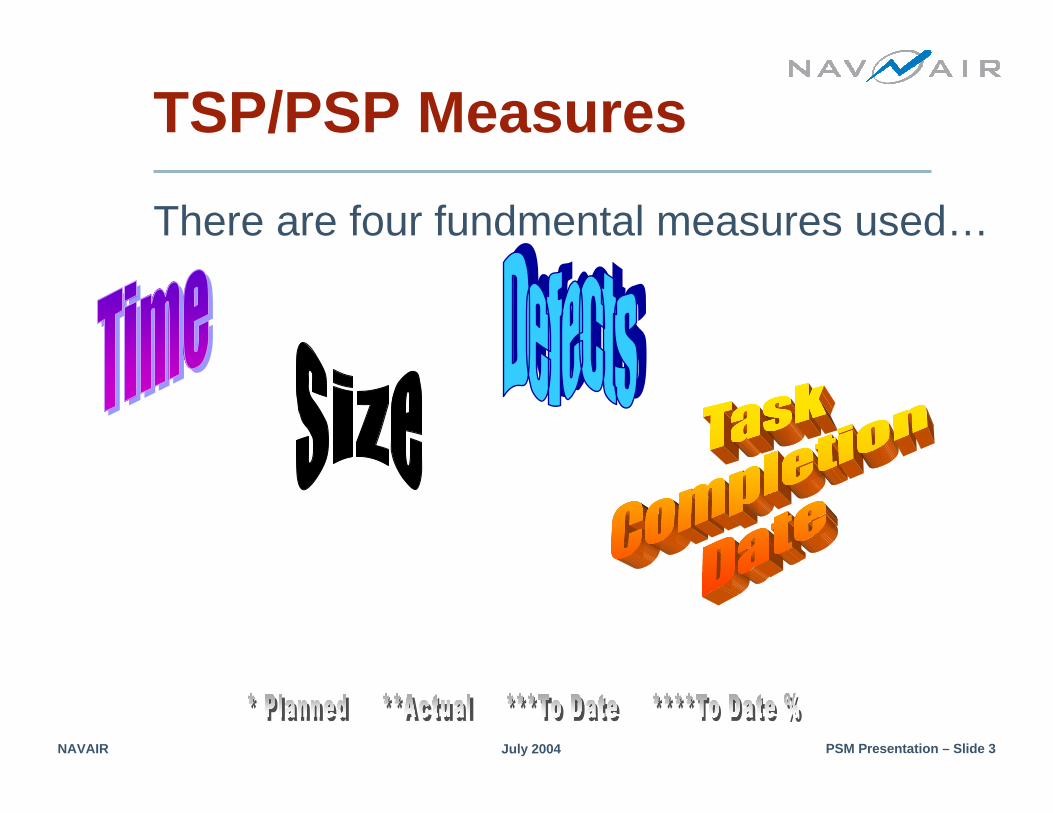
TSP/PSP Measures
There are four fundmental measures used…

NAVAIR July 2004 PSM Presentation – Slide 4
TSP/PSP Metrics
NAVAIR July 2004 PSM Presentation – Slide 5
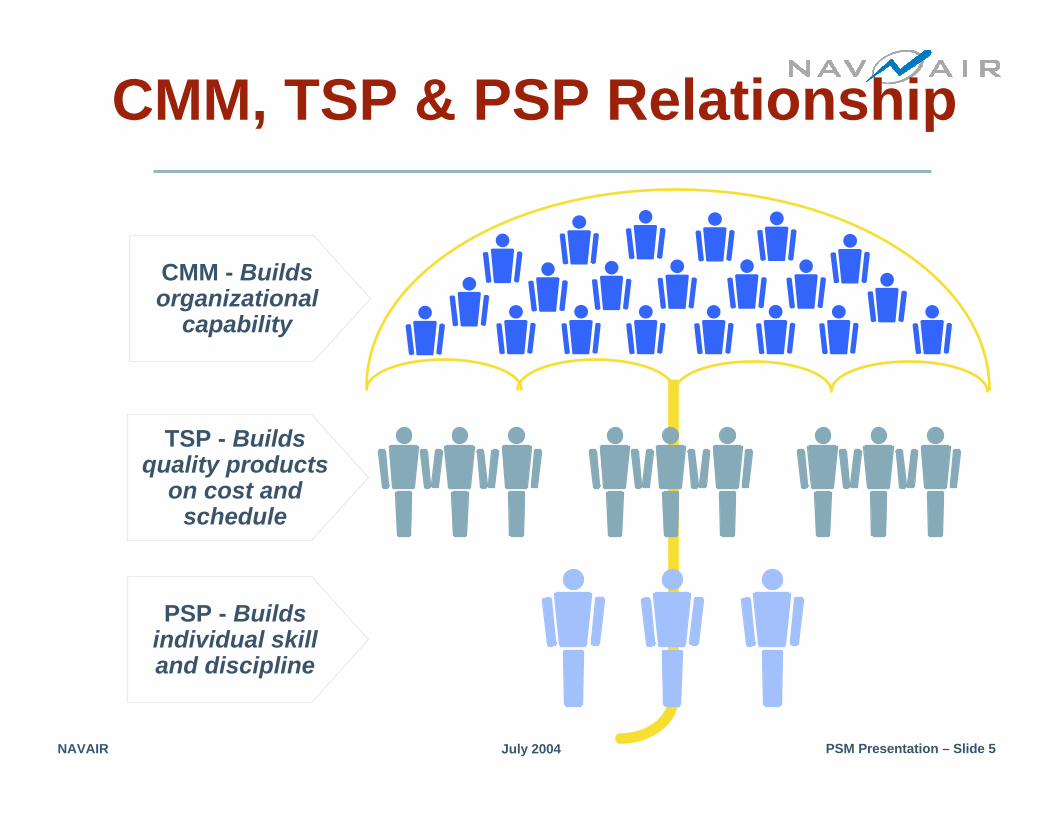
CMM, TSP & PSP Relationship
CMM - Buildsorganizational
capability
TSP - Buildsquality products
on cost and schedule
PSP - Buildsindividual skill and discipline
NAVAIR July 2004 PSM Presentation – Slide 6
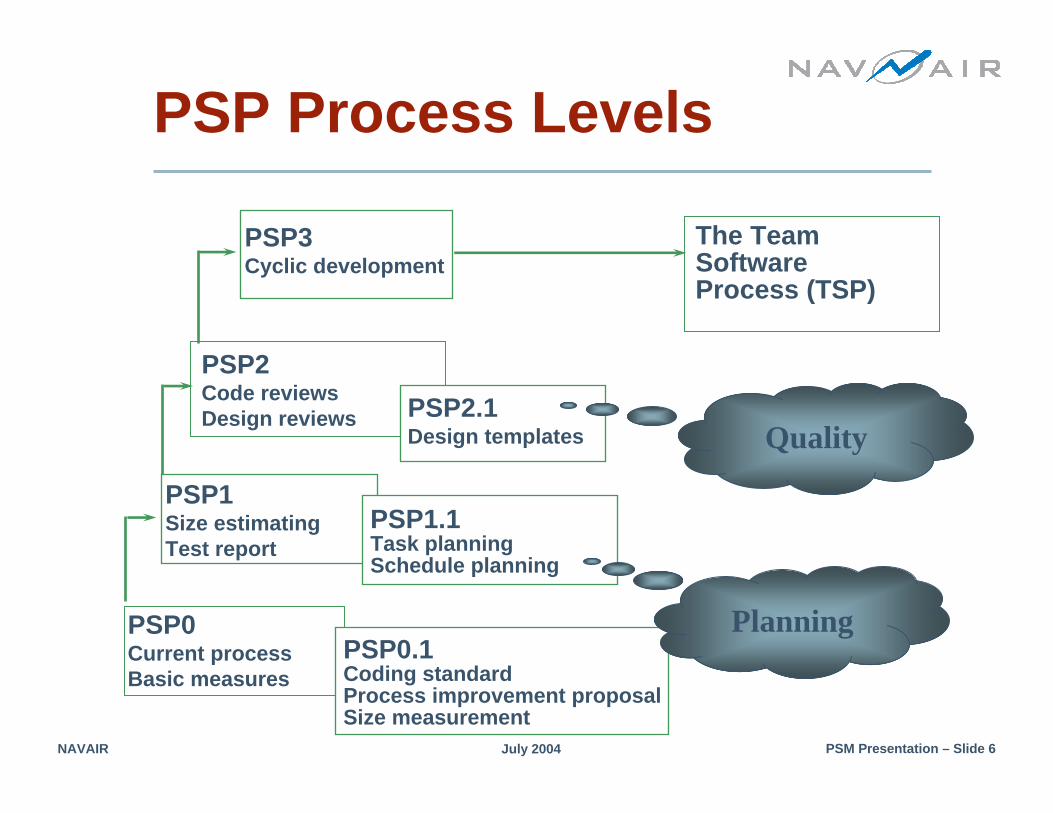
PSP Process Levels
PSP3Cyclic development
The Team Software Process (TSP)
PSP2Code reviewsDesign reviews
PSP1Size estimatingTest report
PSP0Current processBasic measures
PSP2.1Design templates
PSP0.1Coding standardProcess improvement proposal Size measurement
PSP1.1Task planning Schedule planning
Planning
Quality

NAVAIR July 2004 PSM Presentation – Slide 7
Requirements
Processscripts
Projectplan
summary
Finished productProject and processdata summary report
Timeand
defectlogs
Development Process
Development
Planning
Design
Code
Compile Test
Design review
Code review
Postmortem
guide
Process Flow

NAVAIR July 2004 PSM Presentation – Slide 8
PROBE Method
The Planning Framework
Definerequirements
Produceconceptual
design
Estimatesize
Estimateresources
Produceschedule
Developproduct
Size, resource,schedule
data
Processanalysis
Resourcesavailable
Productivitydatabase
Sizedatabase
Customerneed
Productdelivery
Trackingreports
Customer
Management
Items
Tasks
NAVAIR July 2004 PSM Presentation – Slide 9
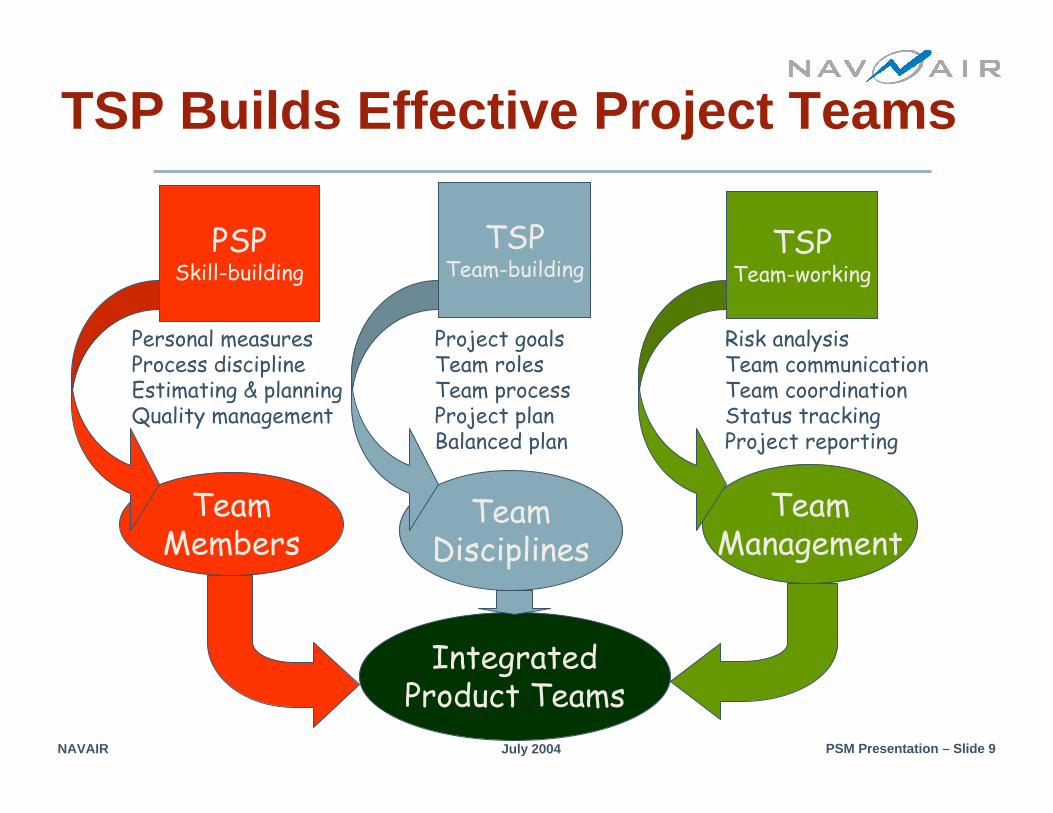
PSPSkill-building
TSPTeam-building
TSPTeam-working
TeamManagement
TeamMembers
TeamDisciplines
Personal measuresProcess disciplineEstimating & planningQuality management
Project goalsTeam rolesTeam processProject planBalanced plan
Risk analysisTeam communicationTeam coordinationStatus trackingProject reporting
IntegratedProduct Teams
TSP Builds Effective Project Teams
NAVAIR July 2004 PSM Presentation – Slide 10
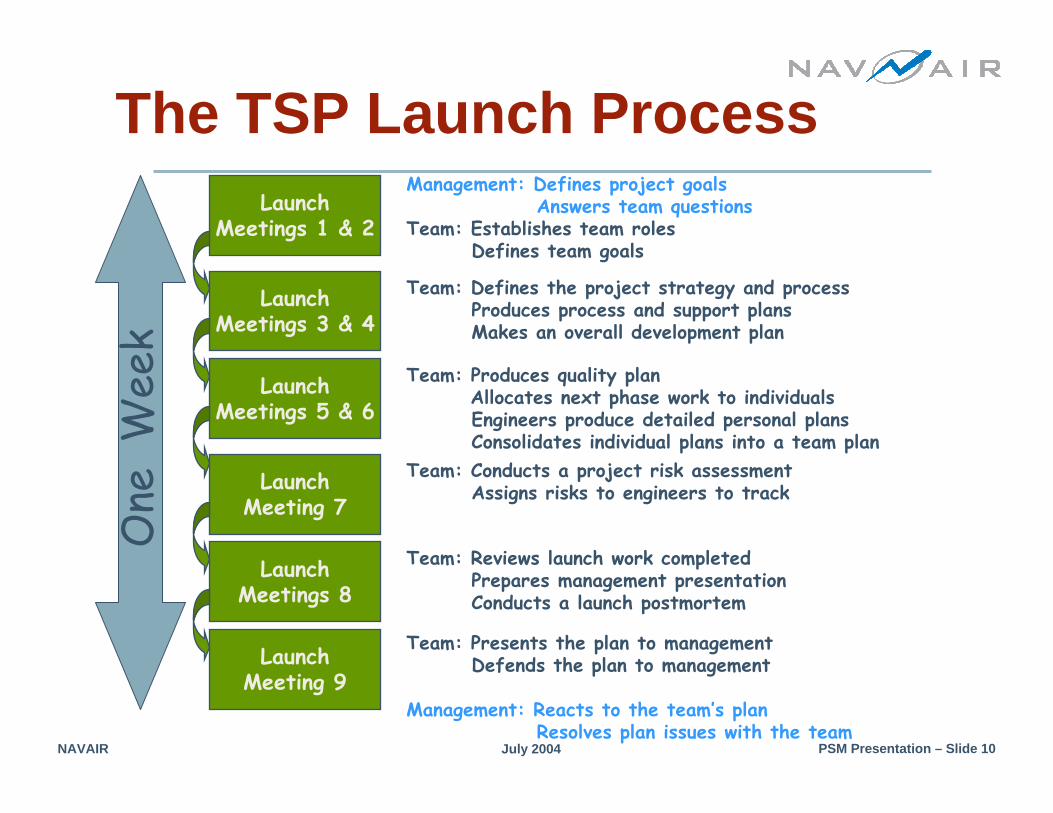
The TSP Launch ProcessLaunch
Meetings 1 & 2
Management: Defines project goalsAnswers team questions
Team: Establishes team rolesDefines team goals
LaunchMeetings 3 & 4
Team: Defines the project strategy and processProduces process and support plansMakes an overall development plan
Team: Produces quality planAllocates next phase work to individualsEngineers produce detailed personal plansConsolidates individual plans into a team plan
LaunchMeetings 5 & 6
LaunchMeeting 7
LaunchMeetings 8
LaunchMeeting 9
Team: Conducts a project risk assessmentAssigns risks to engineers to track
Team: Reviews launch work completedPrepares management presentationConducts a launch postmortem
Team: Presents the plan to managementDefends the plan to management
Management: Reacts to the team’s planResolves plan issues with the team
One
Wee
k
NAVAIR July 2004 PSM Presentation – Slide 11
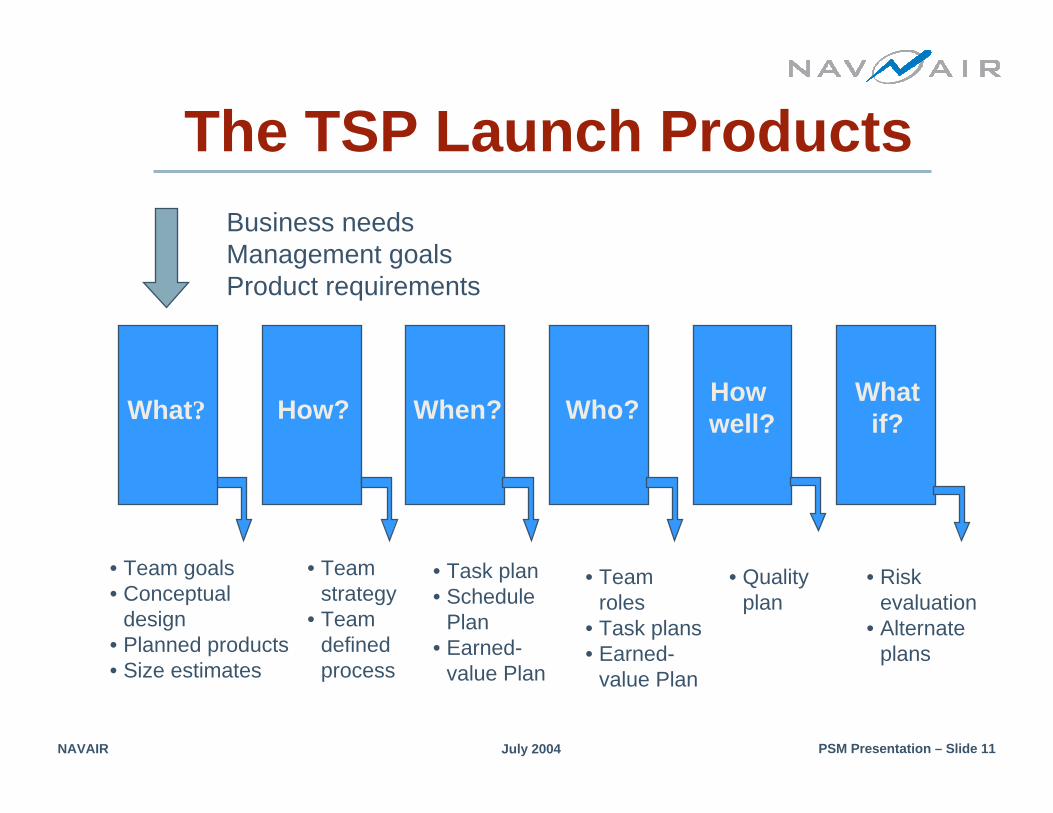
The TSP Launch Products
What? How? When? Who? Howwell?
Whatif?
Business needsManagement goalsProduct requirements
• Team goals• Conceptual
design• Planned products• Size estimates
• Teamstrategy
• Teamdefinedprocess
• Teamroles
• Task plans• Earned-
value Plan
• Task plan• Schedule
Plan• Earned-
value Plan
• Qualityplan
• Risk evaluation
• Alternate plans
NAVAIR July 2004 PSM Presentation – Slide 12
The Team-working FrameworkThe TSP team-working framework helps the project move forward.
Each engineer collects data on product size, development resources, defects, and schedule.
These data are summarized and tracked.• each team member tracks his/her own work• the team tracks progress at the weekly meeting• management tracks progress at a monthly management
review

NAVAIR July 2004 PSM Presentation – Slide 13
Personal Tracking
Each team member gathers data on size, time, defects and schedule.
These data are used for tracking at the personal level.• plan vs. actual hours• plan vs. actual earned value• predicted earned value• plan vs. actual product size• plan vs. actual product and
process quality
Plan Summary (SUMP)
Quality summary (SUMQ)
Size Summary (SUMS)
Task planning template
Defect recording
log
Time recording
log
Schedule planning template

NAVAIR July 2004 PSM Presentation – Slide 14
Team Tracking
Summary data from team members is rolled-up to produce team status.
The team reviews status at the weekly team meeting.• plan vs. actual hours• plan vs. actual earned value• predicted earned value• plan vs. actual product size• plan vs. actual product and
process quality• risks and issues Team
SCHEDULETeamTASK
TeamSUMS
TeamSUMP
TeamSUMQ
SUMPSSUMS
SUMS
SUMPSUMP
SUMP
SUMQSUMQ
SUMQ
TeamEarned Value
SCHEDULETASKTASK
TASKSCHEDULE
SCHEDULE

NAVAIR July 2004 PSM Presentation – Slide 15
The Weekly Team MeetingThe weekly team meeting is a principal means of communicating and tracking team status.The meeting objective is to ensure that all team members• understand current project status• know what tasks are next• are aware of everyone’s status and progress• understand the key issues and risks• participate in key team decisions
All team members attend.The team meeting follows a defined weekly meeting process.• prepare and distribute the meeting planning form in advance• assign meeting roles• prepare a meeting report• distribute the report to all attendees
Concentrates on the data and key issues.Most important, the meeting is brief.

NAVAIR July 2004 PSM Presentation – Slide 16
The Management MeetingThis meeting is needed to• update management on project status and progress• describe outstanding risks or exposures• ask for management help where needed• build and maintain management confidence that the team is
managing itselfThe meeting should be held regularly.The team leader conducts the meeting.The principal topics to cover are composite team data on• schedule and earned value status• schedule projections• hours spend versus planned• status against quality goals• key issues and risks
Concentrate on the data and key issues.
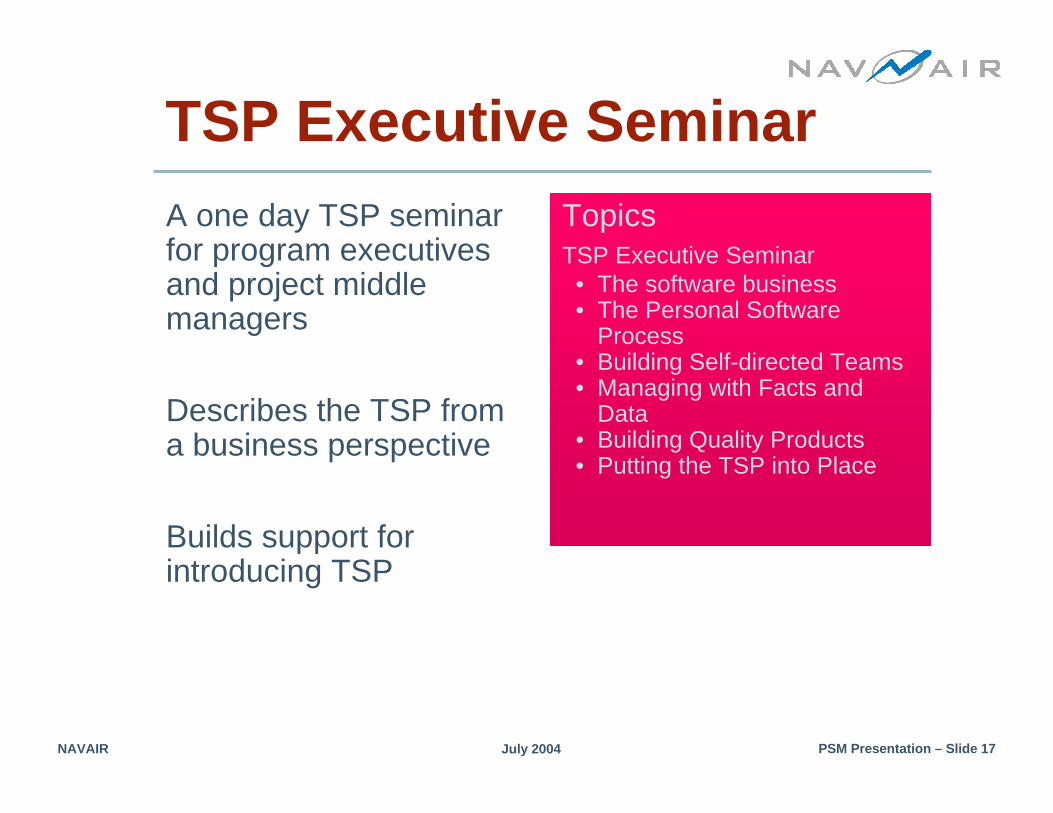
NAVAIR July 2004 PSM Presentation – Slide 17
TSP Executive SeminarA one day TSP seminar for program executives and project middle managers
Describes the TSP from a business perspective
Builds support for introducing TSP
TopicsTSP Executive Seminar
• The software business• The Personal Software
Process• Building Self-directed Teams• Managing with Facts and
Data• Building Quality Products• Putting the TSP into Place
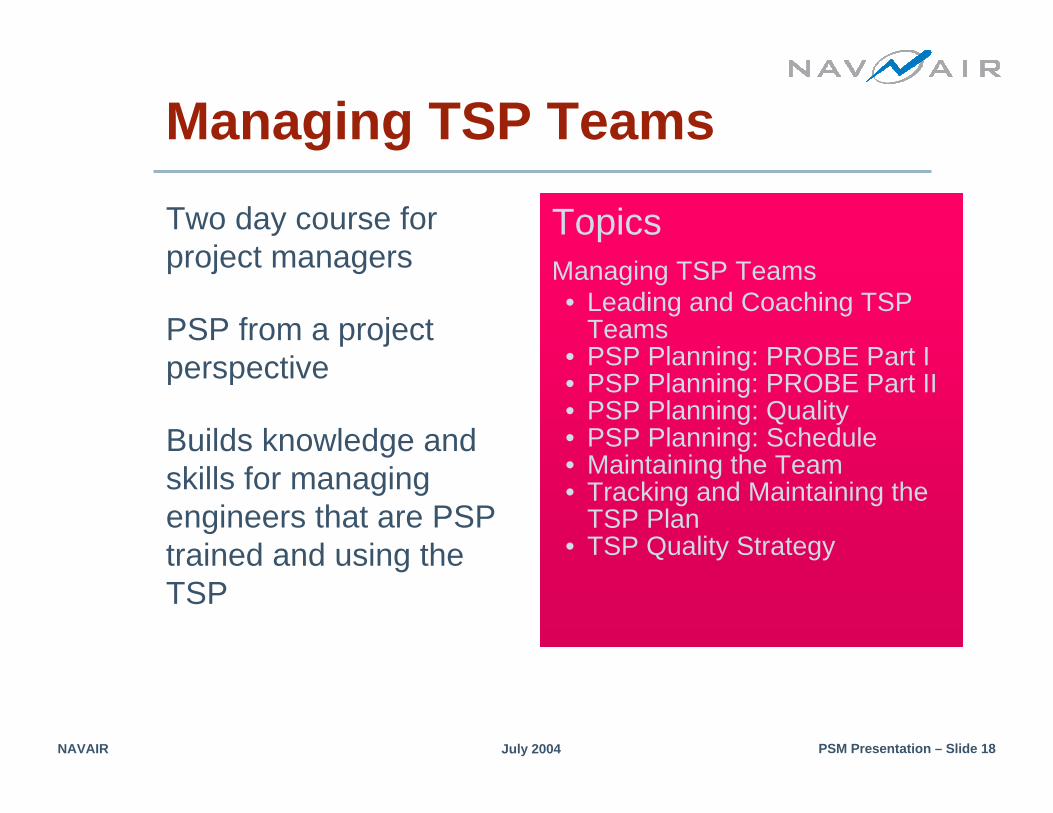
NAVAIR July 2004 PSM Presentation – Slide 18
Managing TSP TeamsTwo day course for project managers
PSP from a project perspective
Builds knowledge and skills for managing engineers that are PSP trained and using the TSP
TopicsManaging TSP Teams• Leading and Coaching TSP
Teams• PSP Planning: PROBE Part I• PSP Planning: PROBE Part II• PSP Planning: Quality• PSP Planning: Schedule• Maintaining the Team• Tracking and Maintaining the
TSP Plan• TSP Quality Strategy
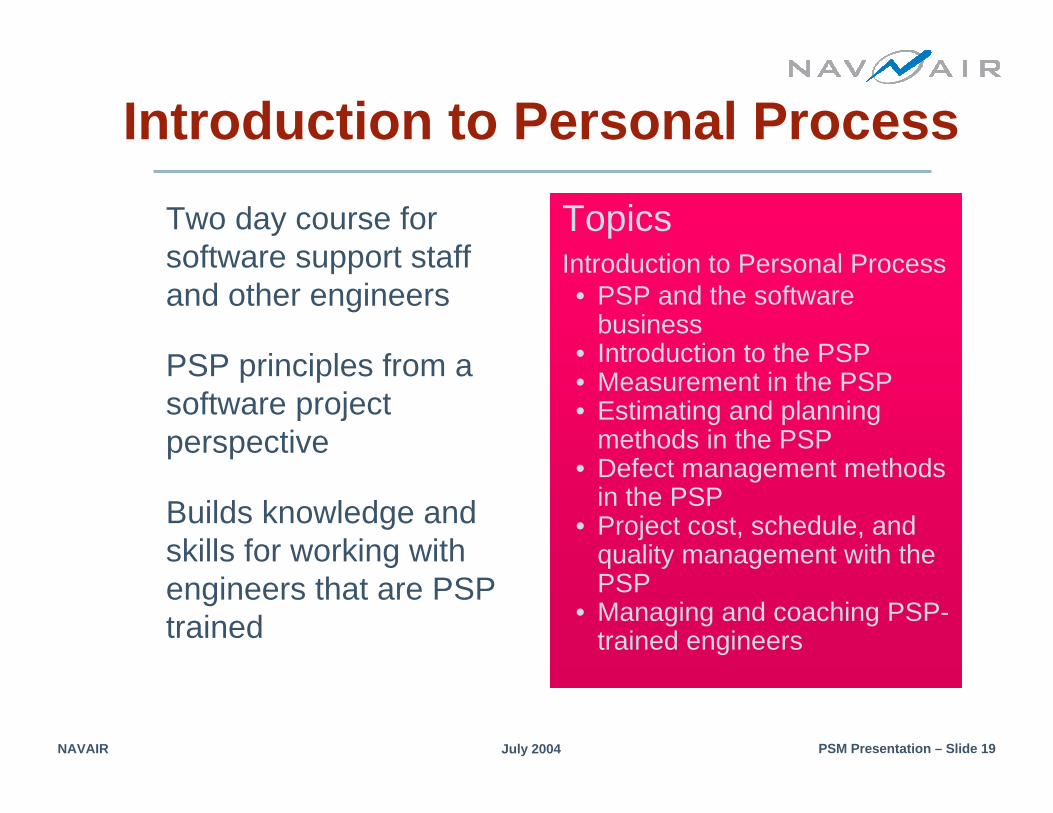
NAVAIR July 2004 PSM Presentation – Slide 19
Introduction to Personal ProcessTwo day course for software support staff and other engineers
PSP principles from a software project perspective
Builds knowledge and skills for working with engineers that are PSP trained
TopicsIntroduction to Personal Process• PSP and the software
business• Introduction to the PSP• Measurement in the PSP• Estimating and planning
methods in the PSP• Defect management methods
in the PSP• Project cost, schedule, and
quality management with the PSP
• Managing and coaching PSP-trained engineers
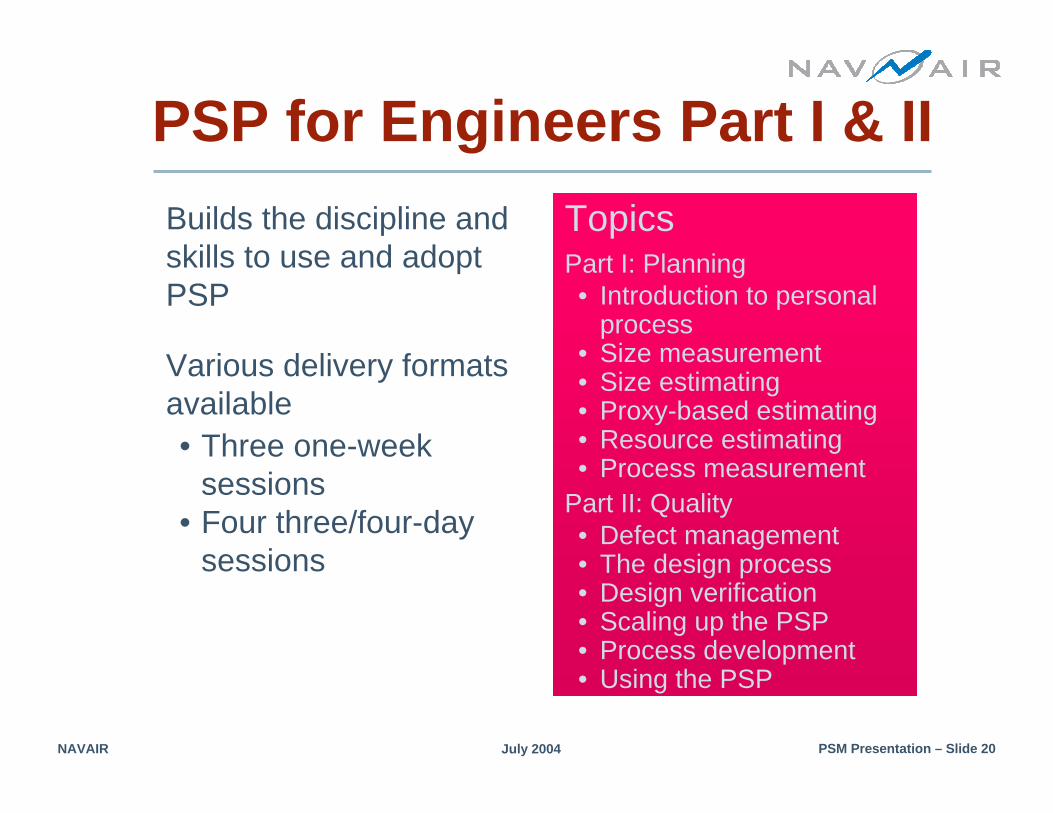
NAVAIR July 2004 PSM Presentation – Slide 20
PSP for Engineers Part I & IIBuilds the discipline and skills to use and adopt PSP
Various delivery formats available• Three one-week
sessions• Four three/four-day
sessions
TopicsPart I: Planning• Introduction to personal
process• Size measurement• Size estimating• Proxy-based estimating• Resource estimating• Process measurement
Part II: Quality• Defect management• The design process• Design verification• Scaling up the PSP• Process development• Using the PSP
NAVAIR July 2004 PSM Presentation – Slide 21
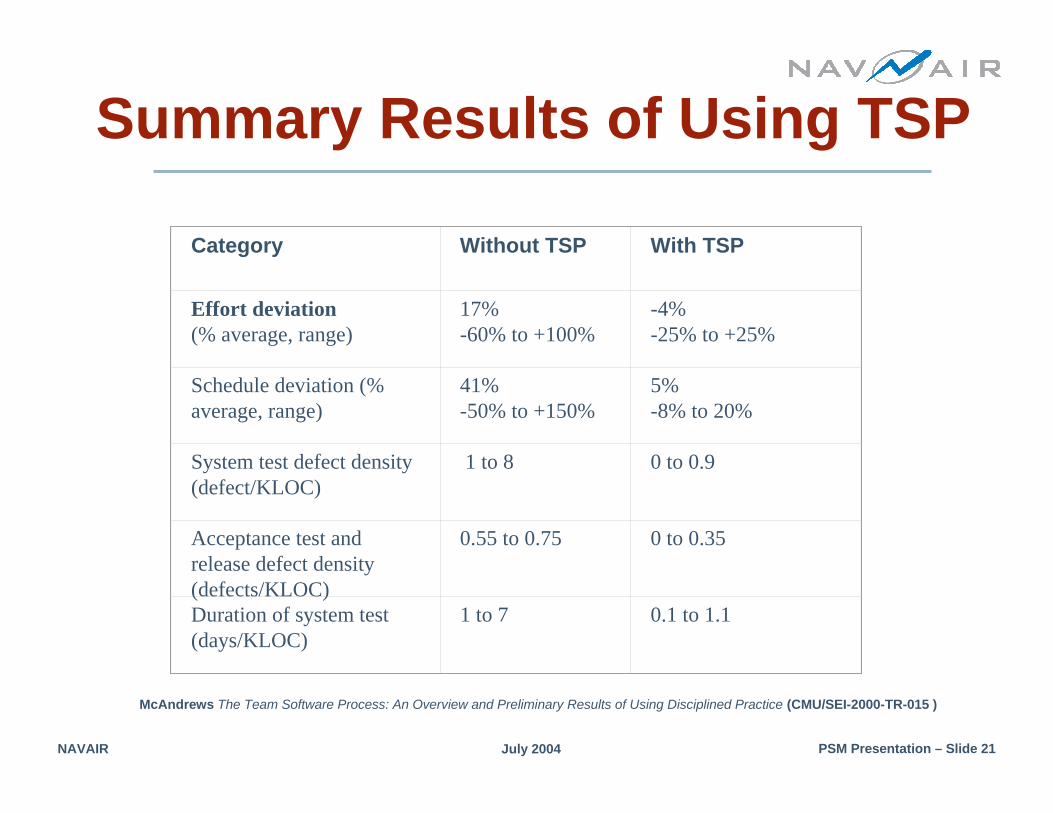
Summary Results of Using TSP
Category Without TSP With TSP
Effort deviation(% average, range)
17%-60% to +100%
-4%-25% to +25%
Schedule deviation (% average, range)
41%-50% to +150%
5%-8% to 20%
System test defect density (defect/KLOC)
1 to 8 0 to 0.9
Acceptance test and release defect density (defects/KLOC)
0.55 to 0.75 0 to 0.35
Duration of system test (days/KLOC)
1 to 7 0.1 to 1.1
McAndrews The Team Software Process: An Overview and Preliminary Results of Using Disciplined Practice (CMU/SEI-2000-TR-015 )

NAVAIR July 2004 PSM Presentation – Slide 22
NAVAIR TSP StatusOrganization Completed Using PreparingAV-8B 2 2 1Depots 1E-2C Hawkeye 3 6 2+EA-6B 1F/A-18 2F-14 1H-1 Cobra 1HARM 1P3-C 1 2 1Software Engineering Branches 1 2+Weapons 1
Totals 8 14 9+
NAVAIR July 2004 PSM Presentation – Slide 23
Message to RememberEffective measures and metrics require established goals and engineering processes• TSP starts with four measures and 20+ metrics• These can/should be evolved
The CMM builds management capability
The PSP develops software engineering skills and disciplines
The TSP shows PSP-trained teams how to use quality processes to build superior systems.
Metrics collection and feedback is essential to process improvement