owez r 112 t1 20100114 biofouling -...
TRANSCRIPT
KEMA Nederland B.V. Utrechtseweg 310, 6812 AR Arnhem P.O. Box 9035, 6800 ET Arnhem The Netherlands
T +31 26 3 56 91 11 F +31 26 3 89 24 77 [email protected] www.kema.com Registered Arnhem 09080262
50863231-TOS/MEC 08-9096
Biological Fouling
OWEZ_R_112_T1_20100114_biofouling
Survey of marine fouling on turbine
support structures of the Offshore
Windfarm Egmond aan Zee
Arnhem, January 14 2010
Author M.C.M. Bruijs KEMA Technical & Operational Services
Prepared for Noordzeewind
author : Maarten C.M. Bruijs 06-06-16 reviewed : Henk A. Jenner 06-06-
B 36 pages 1 annex WSc approved : M. de Jong 06-06-
© KEMA Nederland B.V., Arnhem, the Netherlands. All rights reserved. It is prohibited to change any and all versions of this document in any manner whatsoever, including but not limited to dividing it into parts. In case of a conflict between the electronic version (e.g. PDF file) and the original paper version provided by KEMA, the latter will prevail. KEMA Nederland B.V. and/or its associated companies disclaim liability for any direct, indirect, consequential or incidental damages that may result from the use of the information or data, or from the inability to use the information or data contained in this document. The contents of this report may only be transmitted to third parties in its entirety and provided with the copyright notice, prohibition to change, electronic versions’ validity notice and disclaimer.
OWEZ_R_112_T1_20100114 -3- 50863231-TOS/MEC 08-9096
CONTENTS
page
SUMMARY............................................................................................................................ 4
1 Introduction .......................................................................................................... 6
1.0 Operation of the ROV system for monitoring fouling............................................. 7
1.1 Planned monitoring campaign for 1.1.2 biological fouling....................................12
2 Monitoring by KEMA, February 2008 ..................................................................13
2.0 Wednesday February 13 2008: monitoring WTG-07 ...........................................13
2.1 Thursday February 14 2008: monitoring MetMast ...............................................17
2.2 Thursday February 14 2008: monitoring WTG-08 ...............................................20
3 Comparison of the OWEZ fouling with Shell/NAM and Horns Rev offshore
constructions.......................................................................................................24
3.0 Fouling at the Shell/NAM.....................................................................................24
3.1 Comparison fouling OWEZ with NAM..................................................................25
3.2 Comparison fouling OWEZ with the Horns Rev offshore wind farm.....................26
4 Discussion and conclusions ................................................................................28
4.0 Comparison of observed fouling at WTG-07, WTG-08 and the MetMast .............28
4.1 Fouling development and it's effects on corrosion ...............................................29
4.2 Effect of accumulation of biomass on the drag coefficient of the monopile cylinder
............................................................................................................................30
4.3 Conclusions ........................................................................................................31
REFERENCES.....................................................................................................................32
ANNEX A Species observed by Bureau Waardenburg ........................................................33
ANNEX B Observations by Wals Diving during the yearly construction monitoring WTG-07,
WTG-08 and the MetMast, May / June 2007.......................................................34
ANNEX C ROV technical information...................................................................................35
OWEZ_R_112_T1_20100114 -4- 50863231-TOS/MEC 08-9096
SUMMARY
This survey report on biological fouling (NZW-MEP task 1.1.2) describes the findings during
the monitoring of marine fouling in the NZW windfarm during the first year of operation in
2007. This monitoring however had to be postponed until February 2008 due to less optimal
weather conditions in 2007 during the planned survey period and unavailability of suitable
vessels when the weather was suitable again. This has not interfered with the results.
The goal of the monitoring is to investigate if biological fouling on the OWEZ windfarm has a
different pattern in time and space, compared to what can be expected based on existing
knowledge. This report is a first description of the fouling in the OWEZ windfarm. The aim is
to deliver information on the nature and thickness of the fouling on turbine support
constructions, as a function of time. It concerns the assessment of the (succession of)
species composition and the expected biomass through the successive years. The
monitoring details for the biological fouling monitoring are linked to the existing inspection
procedures (inspection of monopile construction) and with the inspection activities regarding
the corrosion monitoring activities.
In order to characterise the biological fouling, two variables have been assessed from the
video-survey recordings and are used for the comparison with recordings of existing offshore
constructions:
- Species composition: An analysis will be made of the different species that are present
and recognised on the video recordings
- Covering percentage: From the video it will be estimated what the total covering
percentage is during the successive years.
It has been observed that there is a clear zonation in fouling communities, which is found at
the three monitored monopiles of WTG-07, WTG08 and the MetMast. The upper zone is
dominated by mussel fouling community down to a depth of ~7 m, which exists in a relative
thick layer. Below 7 m to the bottom, the biofouling community mainly exists in soft fouling
species, forming a relatively thin layer. These findings are similar to the experiences at the
Shell/NAM installations, although there are differences, mainly caused by different depths,
distances from the shore and local abiotic factors.
The mussel fouling may have consequences for increased drag, however, this fouling layer
seems to be self regulating, i.e. in time clusters of mussels get loose from the surface. No
significant effects on vibration in the masts are expected since the thickness of this layer is
limited. The soft fouling community is not expected to have a significant effect on the drag.
OWEZ_R_112_T1_20100114 -5- 50863231-TOS/MEC 08-9096 The increase in drag coefficient of the hard fouling (i.e. mussel fouling) on the upper part of
the monopile is calculated to be a factor of 2.4, between smooth and rough (roughness ~10
cm). The increase of effective diameter has only a small effect compared to the roughness
effect. If the effective diameter increases by 45 cm, this would correspond to an increase of
only 10% in the drag force. The effect of soft fouling is nihil since this layer is very thin and
has a very low roughness.
There might be an influence on corrosion, if the coating is damaged due to
manual/mechanical removal of fouling species that have a strong adhesion to surfaces (e.g.
Japanese oyster and barnacles). During the monitoring no signs of coating damage and no
significant corrosion, like tubercles, have been observed.
Acknowledgement
The Offshore wind Farm Egmond aan Zee has a subsidy from the Ministry of Economic
Affairs under the CO2 Reduction Scheme of the Netherlands.
OWEZ_R_112_T1_20100114 -6- 50863231-TOS/MEC 08-9096
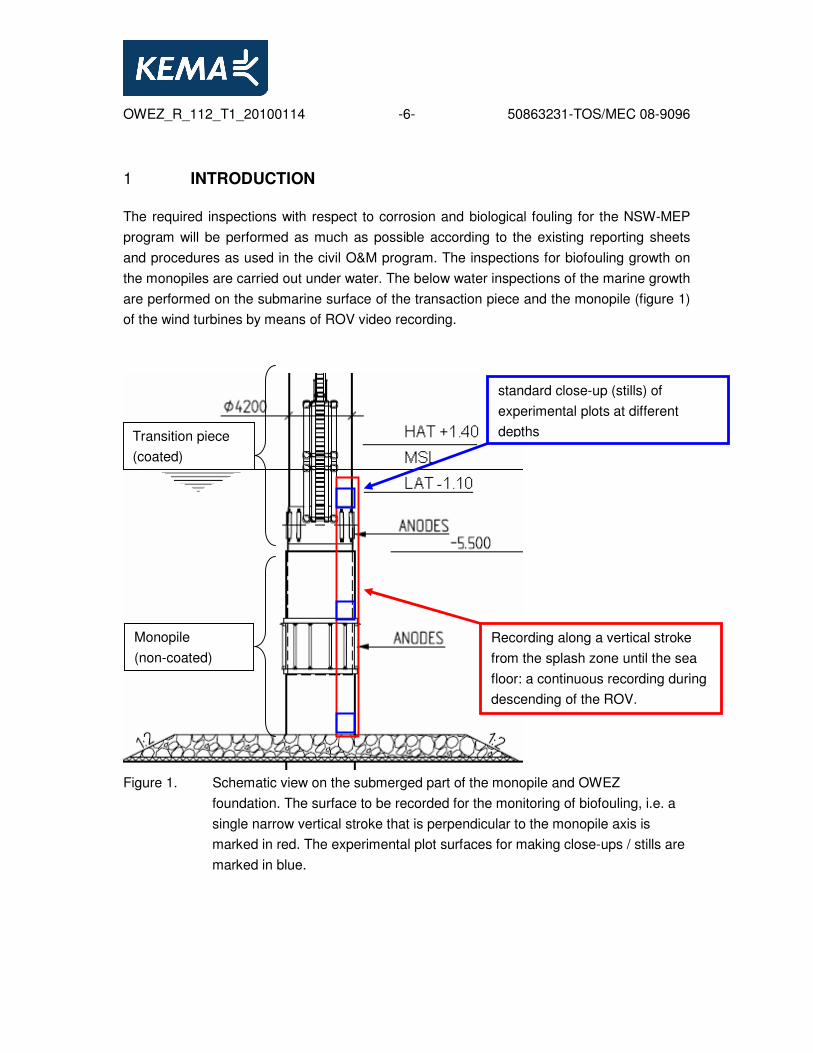
1 INTRODUCTION
The required inspections with respect to corrosion and biological fouling for the NSW-MEP
program will be performed as much as possible according to the existing reporting sheets
and procedures as used in the civil O&M program. The inspections for biofouling growth on
the monopiles are carried out under water. The below water inspections of the marine growth
are performed on the submarine surface of the transaction piece and the monopile (figure 1)
of the wind turbines by means of ROV video recording.
Figure 1. Schematic view on the submerged part of the monopile and OWEZ
foundation. The surface to be recorded for the monitoring of biofouling, i.e. a
single narrow vertical stroke that is perpendicular to the monopile axis is
marked in red. The experimental plot surfaces for making close-ups / stills are
marked in blue.
standard close-up (stills) of
experimental plots at different
depths
Recording along a vertical stroke
from the splash zone until the sea
floor: a continuous recording during
descending of the ROV.
Transition piece
(coated)
Monopile
(non-coated)
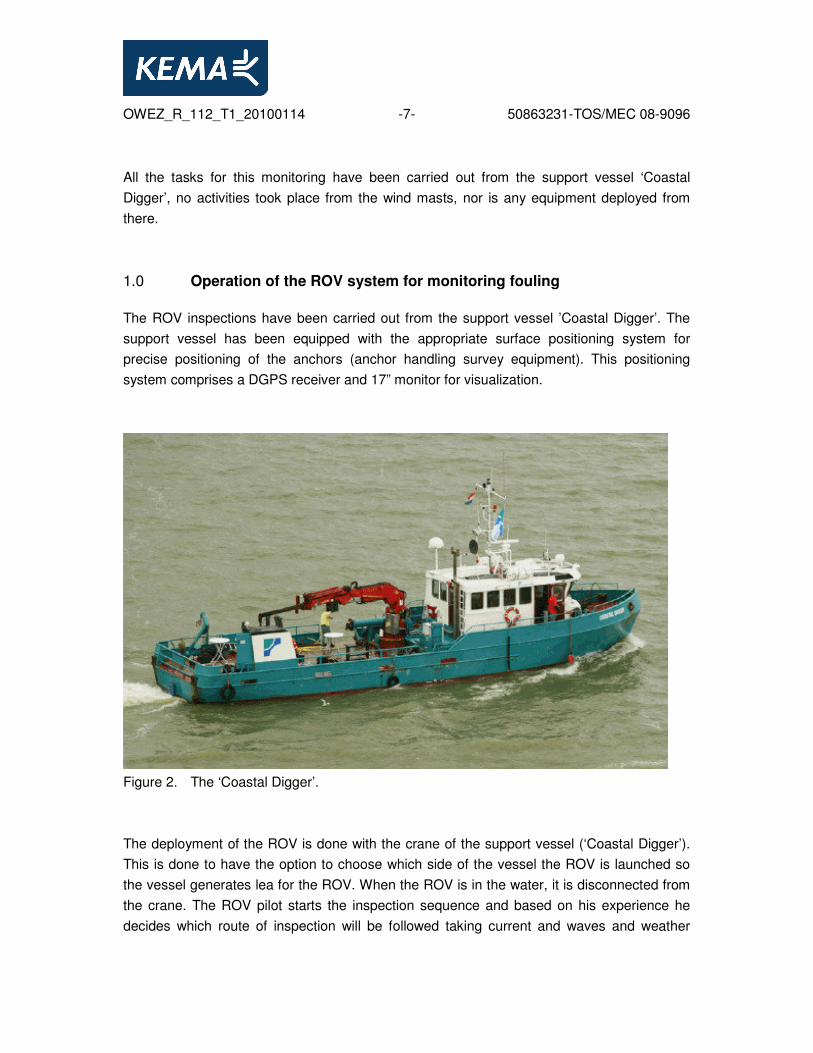
OWEZ_R_112_T1_20100114 -7- 50863231-TOS/MEC 08-9096 All the tasks for this monitoring have been carried out from the support vessel ‘Coastal
Digger’, no activities took place from the wind masts, nor is any equipment deployed from
there.
1.0 Operation of the ROV system for monitoring fouling
The ROV inspections have been carried out from the support vessel ’Coastal Digger’. The
support vessel has been equipped with the appropriate surface positioning system for
precise positioning of the anchors (anchor handling survey equipment). This positioning
system comprises a DGPS receiver and 17” monitor for visualization.
Figure 2. The ‘Coastal Digger’.
The deployment of the ROV is done with the crane of the support vessel (‘Coastal Digger’).
This is done to have the option to choose which side of the vessel the ROV is launched so
the vessel generates lea for the ROV. When the ROV is in the water, it is disconnected from
the crane. The ROV pilot starts the inspection sequence and based on his experience he
decides which route of inspection will be followed taking current and waves and weather
OWEZ_R_112_T1_20100114 -8- 50863231-TOS/MEC 08-9096 predictions into consideration. After the inspection the ROV is connected to the crane to
recover the ROV.
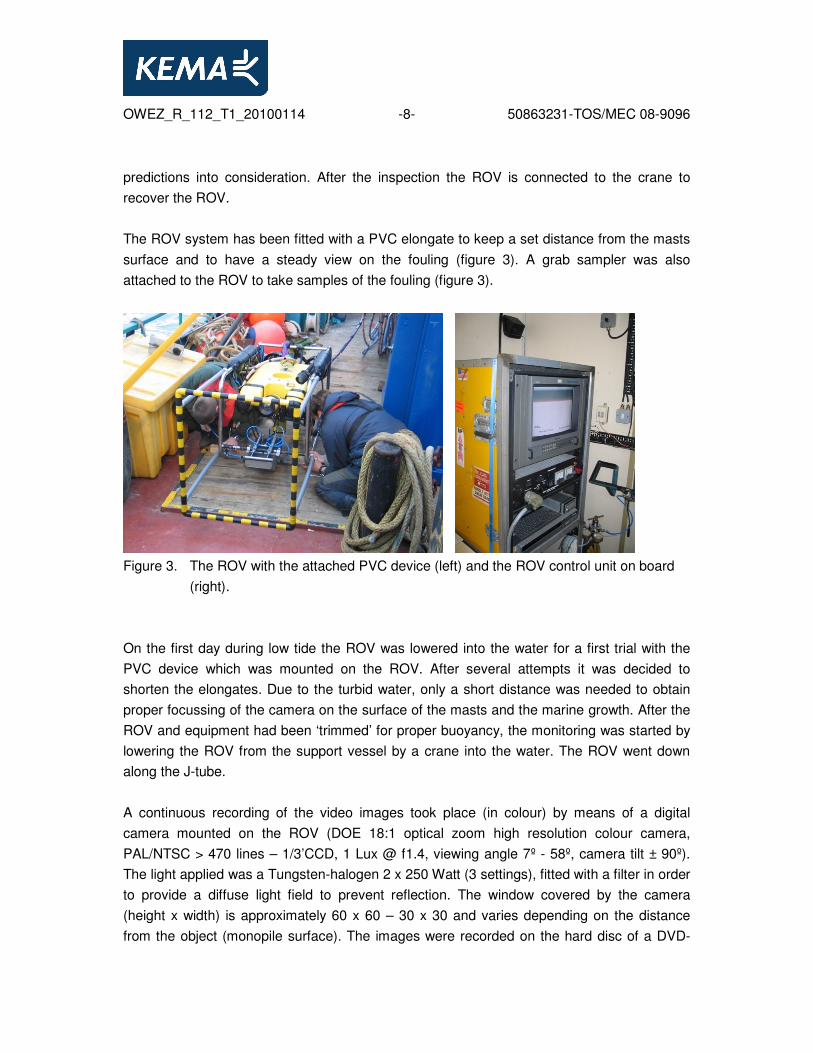
The ROV system has been fitted with a PVC elongate to keep a set distance from the masts
surface and to have a steady view on the fouling (figure 3). A grab sampler was also
attached to the ROV to take samples of the fouling (figure 3).
Figure 3. The ROV with the attached PVC device (left) and the ROV control unit on board
(right).
On the first day during low tide the ROV was lowered into the water for a first trial with the
PVC device which was mounted on the ROV. After several attempts it was decided to
shorten the elongates. Due to the turbid water, only a short distance was needed to obtain
proper focussing of the camera on the surface of the masts and the marine growth. After the
ROV and equipment had been ‘trimmed’ for proper buoyancy, the monitoring was started by
lowering the ROV from the support vessel by a crane into the water. The ROV went down
along the J-tube.
A continuous recording of the video images took place (in colour) by means of a digital
camera mounted on the ROV (DOE 18:1 optical zoom high resolution colour camera,
PAL/NTSC > 470 lines – 1/3’CCD, 1 Lux @ f1.4, viewing angle 7º - 58º, camera tilt ± 90º).
The light applied was a Tungsten-halogen 2 x 250 Watt (3 settings), fitted with a filter in order
to provide a diffuse light field to prevent reflection. The window covered by the camera
(height x width) is approximately 60 x 60 – 30 x 30 and varies depending on the distance
from the object (monopile surface). The images were recorded on the hard disc of a DVD-
OWEZ_R_112_T1_20100114 -9- 50863231-TOS/MEC 08-9096 recorder. At several depths, where significant changes in fouling where visually observed or
other interesting and notable observations were made, the ROV was held still for a few
minutes to get a still-view at one location. The stills as mentioned in Figure 1 are made as
well. After reaching the bottom, the ROV was raised again with continuous recording of the
images.
The depth recorded is the water column above the ROV. During the monitoring it appeared
that the depth on the screen, and as recorded on the DVD, was not correct. Therefore the
depth at specific clock times in the recording was noted manually in the logbook. During
viewing of the DVD images, the depth could be assessed and compared with the notes and
remarks in the logbook.
In order to characterise the biological fouling, two main variables have been assessed from
the video-survey recordings and have been used for the comparison with recordings of
existing offshore constructions:
- Species composition: An analyses will be made of the different species that are present
and recognised on the video recordings
- Covering percentage: From the video it will be estimated what the total covering
percentage is during the successive years.
Coverage and thickness are estimated by means of expert judgement of the footage material
(video analyses). It was not possible to make video images around the entire circumference
of the monopile, as the water velocity from the tidal current did not allow to steer the ROV
fully around the monopile. However, during lowering of the ROV, in general 25 – 50 % of the
masts circumference along the vertical stroke could be observed. No significant differences
in fouling are found in this area and it is therefore assumed that the images of the observed
area are representative for the fouling around the monopile. At the OWEZ wind farm, the
direction of water velocities will have influence on the fouling. As this differs in time, during
different types of weather and the tidal schemes, flow conditions will be relatively similar
around the masts. However, a main flow direction during the tidal scheme is present,
resulting in higher flow rates on the ‘sides’ of the mast, perpendicular to the flow direction.
Also, the video recording is largely dependent on the turbidity. To get a proper sharp view of
the fouling, the camera needs to be very close to the surface of the monopile. At longer
distances the image did not show any recognisable details. The estimate is based on the
surface that was videoed.
The main differences in species composition and structure in the fouling community exists
between different depths, i.e. depth zonation of fouling. Whomersly & Picken (2003)
OWEZ_R_112_T1_20100114 -10- 50863231-TOS/MEC 08-9096 observed different factors that determined the composition and structure of the fouling
community. For example, the mussel zone (at the shallowest depths) was probably
structured by wave action. Other structuring forces such as predation were unlikely, since
few predators (e.g. Asterias rubens Linnaeus) were observed in their study. The middle
zones on all the platforms were dominated by M. senile. No physical disturbance was
observed or recorded here, and so the factors structuring this zone were thought to be
primarily biological, including competition for space and food. The deepest zone was the
most diverse on all of the platforms and was possibly structured by physical factors such as
scour, and a reduction in the efficiency of filter feeding mechanisms because of re-
suspended sediments near the seabed. The structural complexity and composition of the
substratum may also have an effect on the structuring of fouling communities.
The thickness of the biological fouling is estimated by expert judgement according to the
images. The shell size of the mussels and the formation of colonies give an idea of the
thickness. The thickness is given in a range, not in exact measurements. The size of the
mussels was checked by the mussels that had been sampled by means of the grab sampler.
The depth of the fouling and the changes in fouling community structure are different at each
monopile. The data provides information about the extent of different fouling communities,
i.e. zonation. It is then possible to compare the results of each monopile.
Only three samples were taken at locations where it seemed interesting to get more details
of the observed specimens. The grab sampler is mounted on the ROV but due to movement
in the water current it is rather difficult to position the ROV against the monopile and remove
all specimens from the surface in a specific area. The grab sampler does not fully clean the
surface where it takes the sample, only a small part of the fouling was removed and most
specimens remained on the surface. Also, the dimension of the sampled area is therefore
difficult to estimate.
An overview of the different fouling species is provided as well, refer to annex A. The species
tell a lot about the specifications of the fouling community and potential effects. There is
seasonal succession in fouling in time. Each fouling species has a specific habitat,
morphology and strategy for settlement. For example, mussels form large clumps in colonies
that make thick layers, other species like Jassia form a relatively thin layer. In a few years,
the biodiversity may have changed completely due to competition and/or changing
environmental conditions, resulting in a different fouling community. This is important to
monitor. Also, each species has a specific manner in which it settles and attaches to
surfaces. For example, mussels use byssus threads and the Japanese oyster and barnacles
OWEZ_R_112_T1_20100114 -11- 50863231-TOS/MEC 08-9096 cement themselves to a surface. This may have consequences for removal of the biological
fouling and the protection against corrosion as well, as parts of the coating may be removed
with the fouling species due to attachment. The list of species is therefore relevant. When the
adhesion of the coating to the monopile surface is stronger than the attachment of the fouling
species, the coating will remain on the monopile. NB, only at WTG-07 and WTG-08 is a
coating is applied on the monopile, the MetMast has no coating. During the monitoring
attention was paid to the specific areas where the patches of fouling had fallen from the
surface to check if these bare areas showed damage and/or corrosion. Only the uncoated
MetMast has been manually cleaned so far. The observation on damages and corrosion was
depending on the quality of the images produced by means of the camera, i.e. depending on
the general visibility and video image quality. It was observed that the coating showed no
damages and no signs of corrosion. The fouling species observed by the ROV video
recording are checked with the results of the monitoring of WTG-07 by means of divers as
performed by Bureau Waardenburg (BuWa, 2008).
OWEZ_R_112_T1_20100114 -12- 50863231-TOS/MEC 08-9096
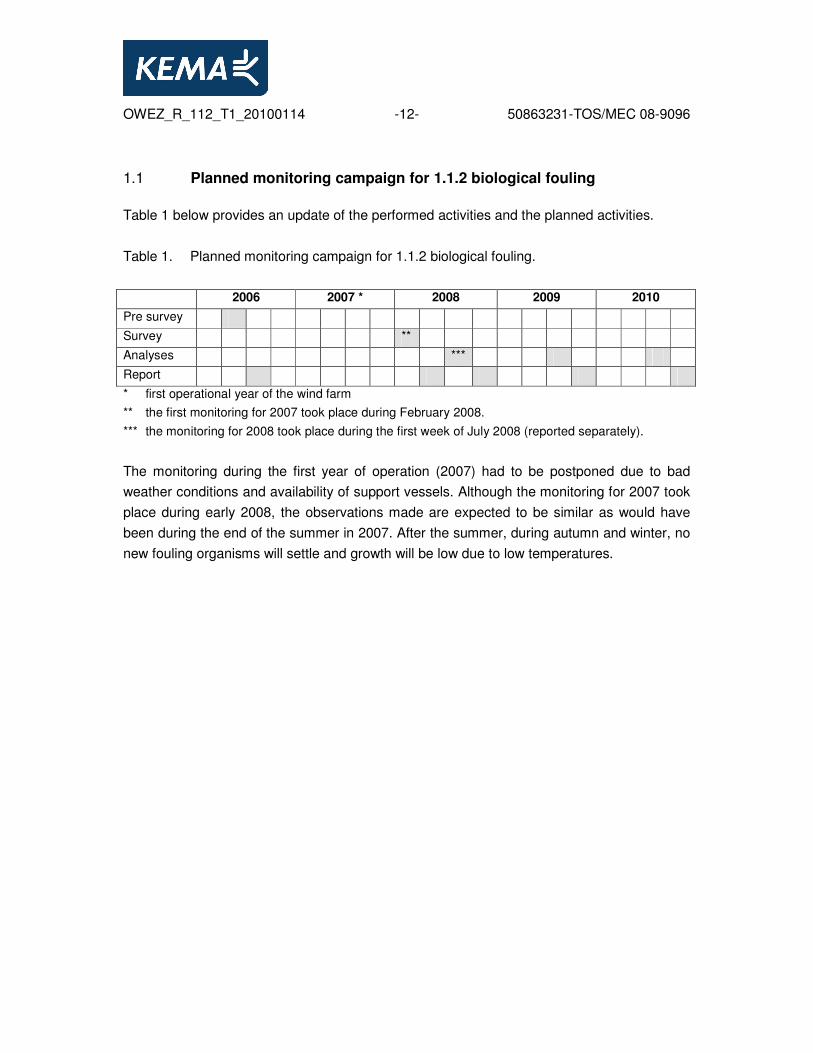
1.1 Planned monitoring campaign for 1.1.2 biological fouling
Table 1 below provides an update of the performed activities and the planned activities.
Table 1. Planned monitoring campaign for 1.1.2 biological fouling.
2006 2007 * 2008 2009 2010
Pre survey
Survey **
Analyses ***
Report
* first operational year of the wind farm
** the first monitoring for 2007 took place during February 2008.
*** the monitoring for 2008 took place during the first week of July 2008 (reported separately).
The monitoring during the first year of operation (2007) had to be postponed due to bad
weather conditions and availability of support vessels. Although the monitoring for 2007 took
place during early 2008, the observations made are expected to be similar as would have
been during the end of the summer in 2007. After the summer, during autumn and winter, no
new fouling organisms will settle and growth will be low due to low temperatures.
OWEZ_R_112_T1_20100114 -13- 50863231-TOS/MEC 08-9096
2 MONITORING BY KEMA, FEBRUARY 2008
2.0 Wednesday February 13 2008: monitoring WTG-07
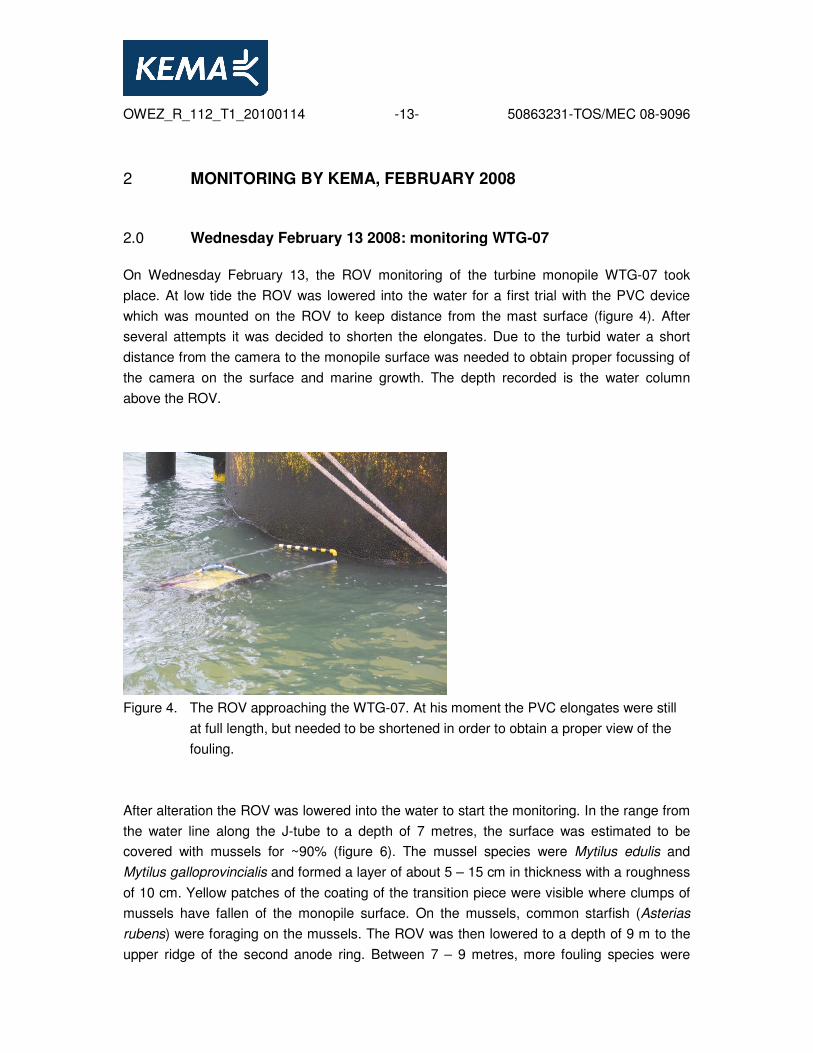
On Wednesday February 13, the ROV monitoring of the turbine monopile WTG-07 took
place. At low tide the ROV was lowered into the water for a first trial with the PVC device
which was mounted on the ROV to keep distance from the mast surface (figure 4). After
several attempts it was decided to shorten the elongates. Due to the turbid water a short
distance from the camera to the monopile surface was needed to obtain proper focussing of
the camera on the surface and marine growth. The depth recorded is the water column
above the ROV.
Figure 4. The ROV approaching the WTG-07. At his moment the PVC elongates were still
at full length, but needed to be shortened in order to obtain a proper view of the
fouling.
After alteration the ROV was lowered into the water to start the monitoring. In the range from
the water line along the J-tube to a depth of 7 metres, the surface was estimated to be
covered with mussels for ~90% (figure 6). The mussel species were Mytilus edulis and
Mytilus galloprovincialis and formed a layer of about 5 – 15 cm in thickness with a roughness
of 10 cm. Yellow patches of the coating of the transition piece were visible where clumps of
mussels have fallen of the monopile surface. On the mussels, common starfish (Asterias
rubens) were foraging on the mussels. The ROV was then lowered to a depth of 9 m to the
upper ridge of the second anode ring. Between 7 – 9 metres, more fouling species were
OWEZ_R_112_T1_20100114 -14- 50863231-TOS/MEC 08-9096 observed including plumose and other anemones (small clusters and individuals randomly
spread over the surface), bryozoans, barnacles, hydroids, tube worms and some oysters
(specifically the Japanese oyster, Crassostrea gigas). However, less mussels were present
here with only small clusters scattered over the surface. It was however not possible to
distinguish between the two mussel species based on the video images as the images did
not allow observation of the specific features of each species. In principle the total surface
was covered by this fouling community (with the tube worms and hydroids as the main
species) and no fouling-free surfaces were observed. The thickness was estimated between
1 and 5 cm, depending on the species (roughness is very limited).
In the area below 12 – 13 metres, (the lower ridge of the anode ring) the same fouling
community as at a depth of 7 – 9 m was observed, covering the monopile surface 100%
(roughness is very limited).At lower depth the water was very turbid and the view on the
fouling community was not optimal. The total depth was 15 metres down to the scour
protection stones.
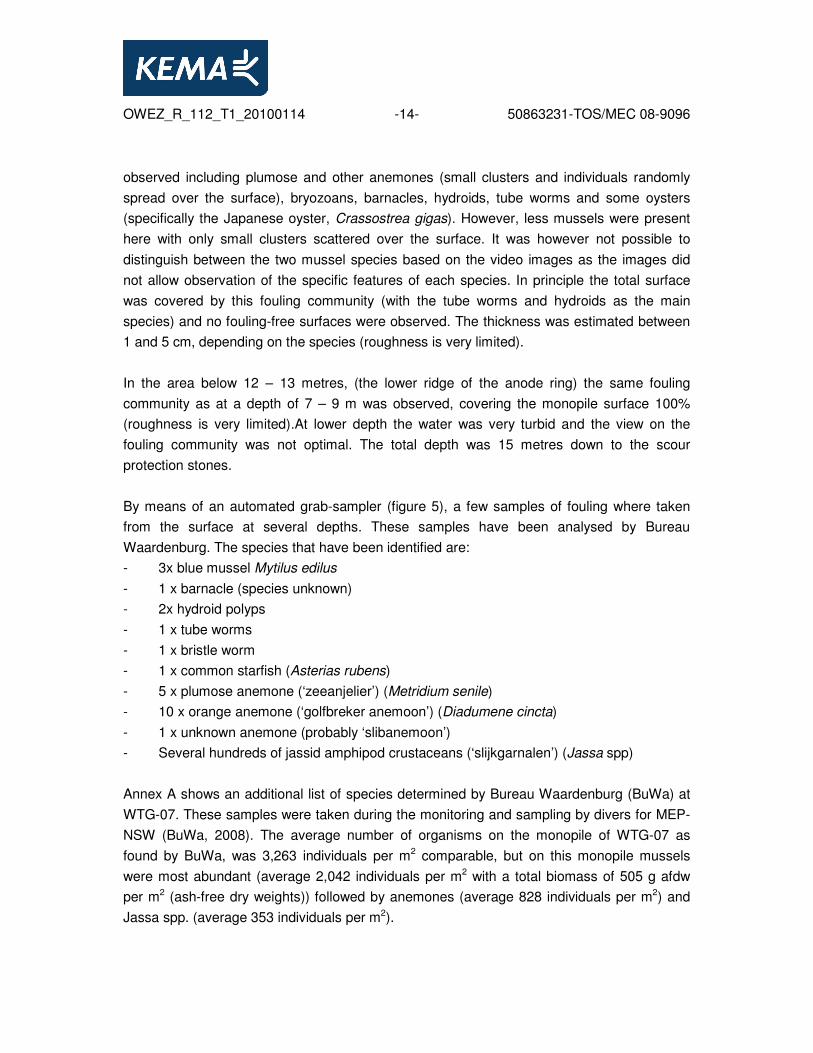
By means of an automated grab-sampler (figure 5), a few samples of fouling where taken
from the surface at several depths. These samples have been analysed by Bureau
Waardenburg. The species that have been identified are:
- 3x blue mussel Mytilus edilus
- 1 x barnacle (species unknown)
- 2x hydroid polyps
- 1 x tube worms
- 1 x bristle worm
- 1 x common starfish (Asterias rubens)
- 5 x plumose anemone (‘zeeanjelier’) (Metridium senile)
- 10 x orange anemone (‘golfbreker anemoon’) (Diadumene cincta)
- 1 x unknown anemone (probably ‘slibanemoon’)
- Several hundreds of jassid amphipod crustaceans (‘slijkgarnalen’) (Jassa spp)
Annex A shows an additional list of species determined by Bureau Waardenburg (BuWa) at
WTG-07. These samples were taken during the monitoring and sampling by divers for MEP-
NSW (BuWa, 2008). The average number of organisms on the monopile of WTG-07 as
found by BuWa, was 3,263 individuals per m2 comparable, but on this monopile mussels
were most abundant (average 2,042 individuals per m2 with a total biomass of 505 g afdw
per m2 (ash-free dry weights)) followed by anemones (average 828 individuals per m2) and
Jassa spp. (average 353 individuals per m2).
OWEZ_R_112_T1_20100114 -15- 50863231-TOS/MEC 08-9096
Figure 5. The grab sampler mounted on the ROV (left) and the fouling grabbed from the
surface of WTG-07 (right).
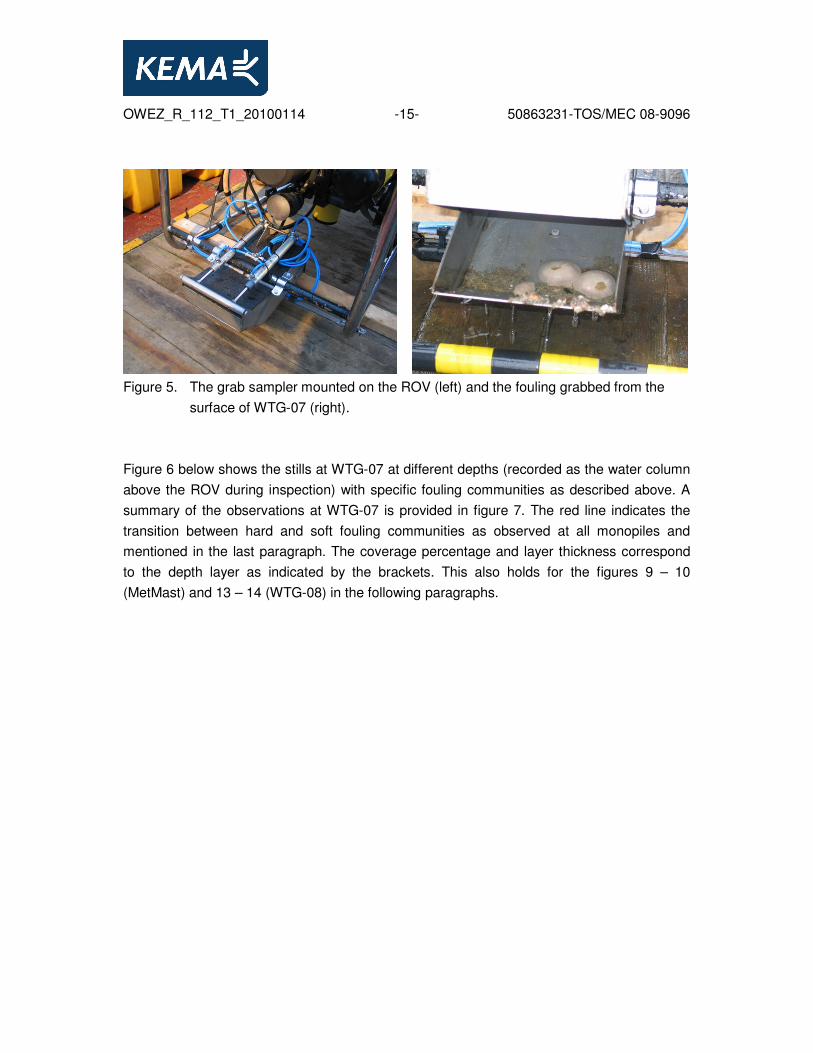
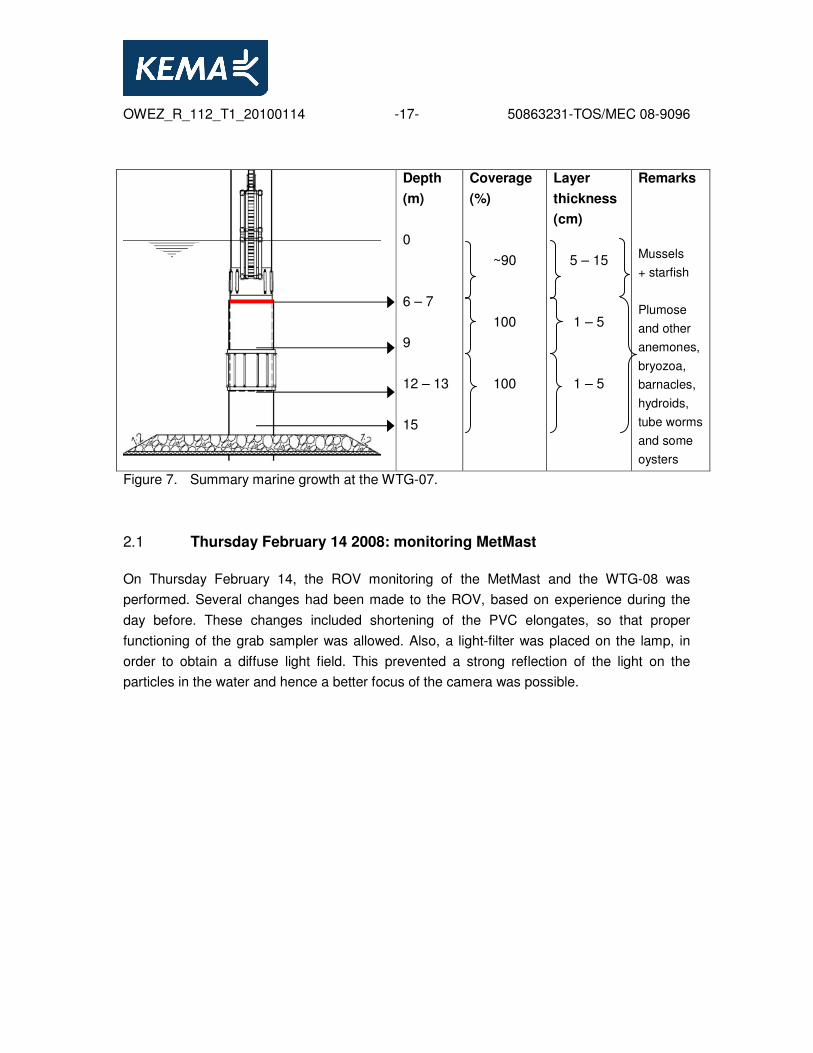
Figure 6 below shows the stills at WTG-07 at different depths (recorded as the water column
above the ROV during inspection) with specific fouling communities as described above. A
summary of the observations at WTG-07 is provided in figure 7. The red line indicates the
transition between hard and soft fouling communities as observed at all monopiles and
mentioned in the last paragraph. The coverage percentage and layer thickness correspond
to the depth layer as indicated by the brackets. This also holds for the figures 9 – 10
(MetMast) and 13 – 14 (WTG-08) in the following paragraphs.
OWEZ_R_112_T1_20100114 -16- 50863231-TOS/MEC 08-9096
Figure 6. Pictures of the fouling by means of the ROV recording at WTG-07.
OWEZ_R_112_T1_20100114 -17- 50863231-TOS/MEC 08-9096
Depth
(m)
0
6 – 7
9
12 – 13
15
Coverage
(%)
~90
100
100
Layer
thickness
(cm)
5 – 15
1 – 5
1 – 5
Remarks
Mussels
+ starfish
Plumose
and other
anemones,
bryozoa,
barnacles,
hydroids,
tube worms
and some
oysters
Figure 7. Summary marine growth at the WTG-07.
2.1 Thursday February 14 2008: monitoring MetMast
On Thursday February 14, the ROV monitoring of the MetMast and the WTG-08 was
performed. Several changes had been made to the ROV, based on experience during the
day before. These changes included shortening of the PVC elongates, so that proper
functioning of the grab sampler was allowed. Also, a light-filter was placed on the lamp, in
order to obtain a diffuse light field. This prevented a strong reflection of the light on the
particles in the water and hence a better focus of the camera was possible.
OWEZ_R_112_T1_20100114 -18- 50863231-TOS/MEC 08-9096
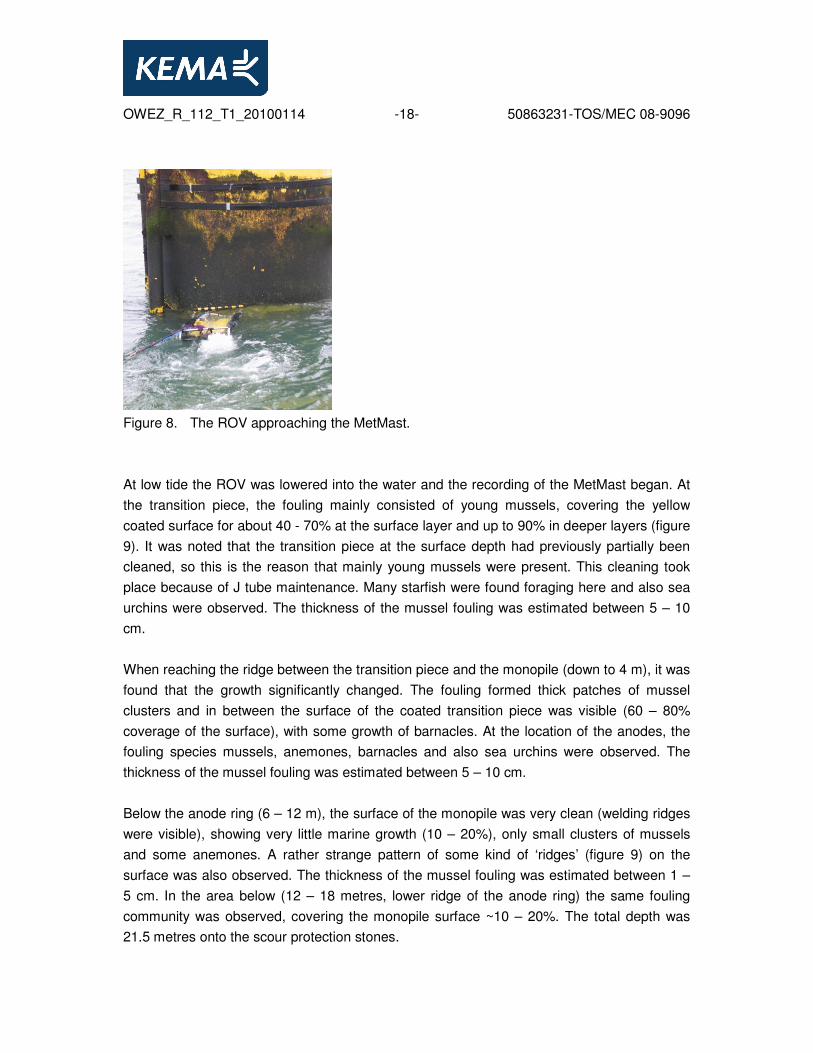
Figure 8. The ROV approaching the MetMast.
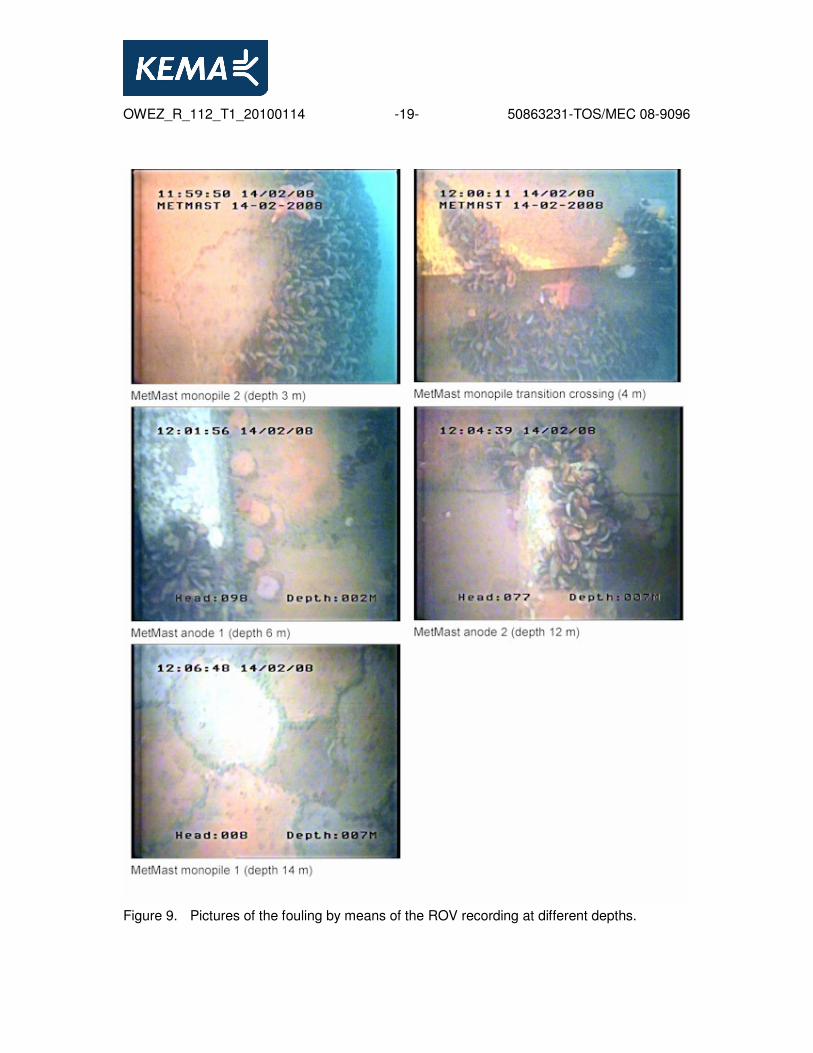
At low tide the ROV was lowered into the water and the recording of the MetMast began. At
the transition piece, the fouling mainly consisted of young mussels, covering the yellow
coated surface for about 40 - 70% at the surface layer and up to 90% in deeper layers (figure
9). It was noted that the transition piece at the surface depth had previously partially been
cleaned, so this is the reason that mainly young mussels were present. This cleaning took
place because of J tube maintenance. Many starfish were found foraging here and also sea
urchins were observed. The thickness of the mussel fouling was estimated between 5 – 10
cm.
When reaching the ridge between the transition piece and the monopile (down to 4 m), it was
found that the growth significantly changed. The fouling formed thick patches of mussel
clusters and in between the surface of the coated transition piece was visible (60 – 80%
coverage of the surface), with some growth of barnacles. At the location of the anodes, the
fouling species mussels, anemones, barnacles and also sea urchins were observed. The
thickness of the mussel fouling was estimated between 5 – 10 cm.
Below the anode ring (6 – 12 m), the surface of the monopile was very clean (welding ridges
were visible), showing very little marine growth (10 – 20%), only small clusters of mussels
and some anemones. A rather strange pattern of some kind of ‘ridges’ (figure 9) on the
surface was also observed. The thickness of the mussel fouling was estimated between 1 –
5 cm. In the area below (12 – 18 metres, lower ridge of the anode ring) the same fouling
community was observed, covering the monopile surface ~10 – 20%. The total depth was
21.5 metres onto the scour protection stones.
OWEZ_R_112_T1_20100114 -19- 50863231-TOS/MEC 08-9096
Figure 9. Pictures of the fouling by means of the ROV recording at different depths.
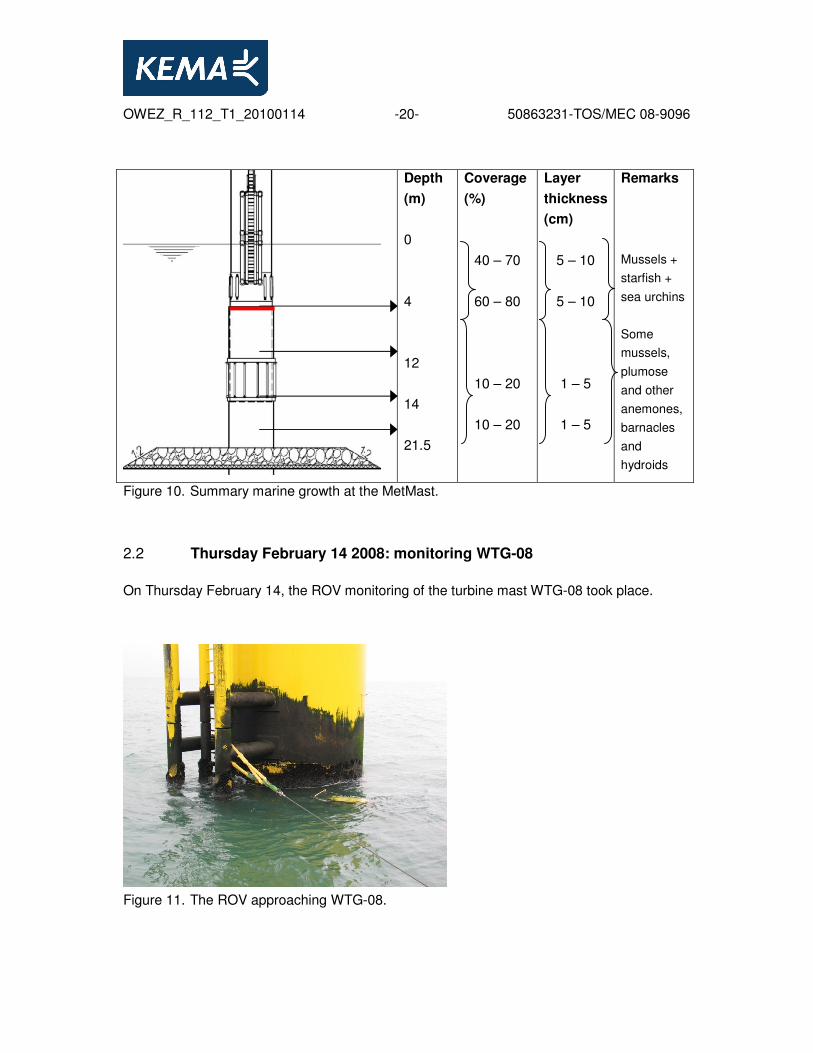
OWEZ_R_112_T1_20100114 -20- 50863231-TOS/MEC 08-9096
Depth
(m)
0
4
12
14
21.5
Coverage
(%)
40 – 70
60 – 80
10 – 20
10 – 20
Layer
thickness
(cm)
5 – 10
5 – 10
1 – 5
1 – 5
Remarks
Mussels +
starfish +
sea urchins
Some
mussels,
plumose
and other
anemones,
barnacles
and
hydroids
Figure 10. Summary marine growth at the MetMast.
2.2 Thursday February 14 2008: monitoring WTG-08
On Thursday February 14, the ROV monitoring of the turbine mast WTG-08 took place.
Figure 11. The ROV approaching WTG-08.
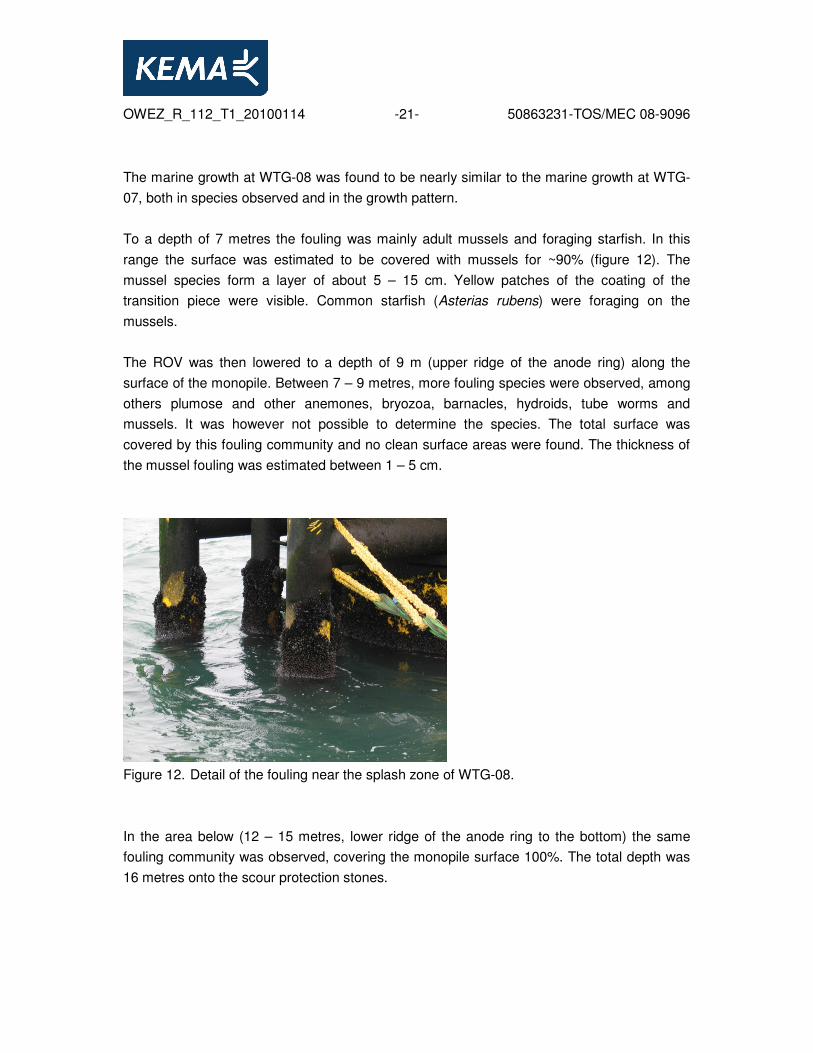
OWEZ_R_112_T1_20100114 -21- 50863231-TOS/MEC 08-9096 The marine growth at WTG-08 was found to be nearly similar to the marine growth at WTG-
07, both in species observed and in the growth pattern.
To a depth of 7 metres the fouling was mainly adult mussels and foraging starfish. In this
range the surface was estimated to be covered with mussels for ~90% (figure 12). The
mussel species form a layer of about 5 – 15 cm. Yellow patches of the coating of the
transition piece were visible. Common starfish (Asterias rubens) were foraging on the
mussels.
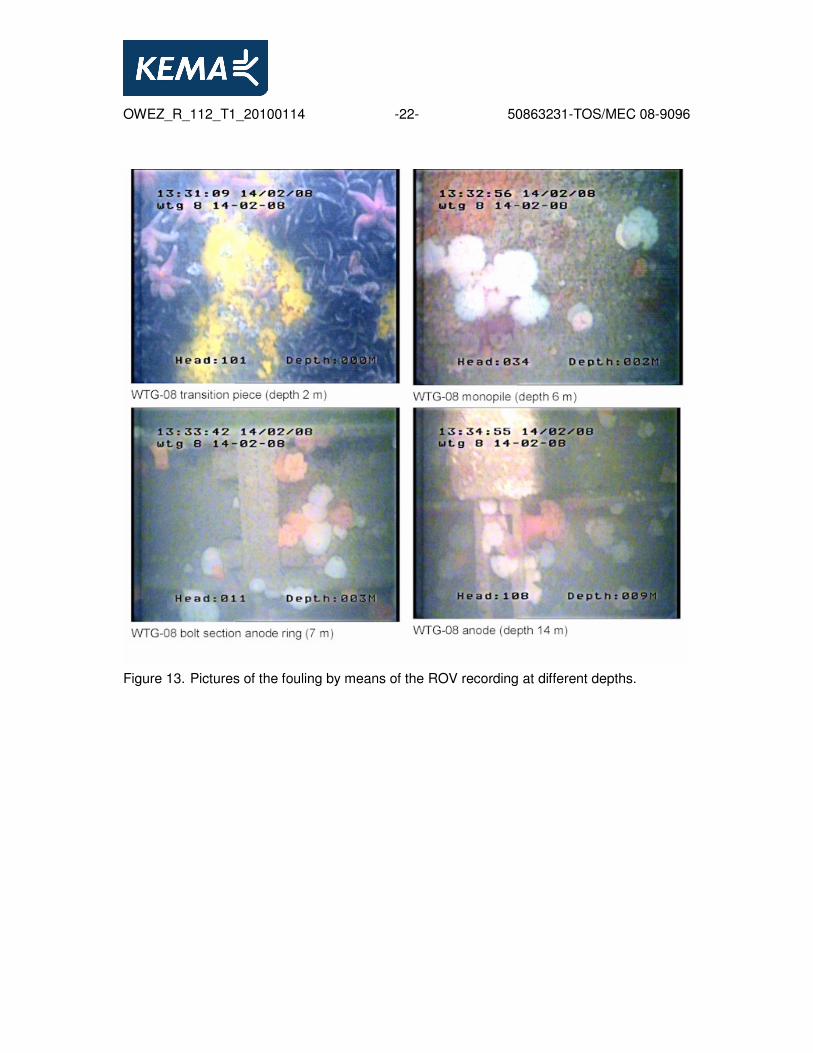
The ROV was then lowered to a depth of 9 m (upper ridge of the anode ring) along the
surface of the monopile. Between 7 – 9 metres, more fouling species were observed, among
others plumose and other anemones, bryozoa, barnacles, hydroids, tube worms and
mussels. It was however not possible to determine the species. The total surface was
covered by this fouling community and no clean surface areas were found. The thickness of
the mussel fouling was estimated between 1 – 5 cm.
Figure 12. Detail of the fouling near the splash zone of WTG-08.
In the area below (12 – 15 metres, lower ridge of the anode ring to the bottom) the same
fouling community was observed, covering the monopile surface 100%. The total depth was
16 metres onto the scour protection stones.
OWEZ_R_112_T1_20100114 -22- 50863231-TOS/MEC 08-9096
Figure 13. Pictures of the fouling by means of the ROV recording at different depths.
OWEZ_R_112_T1_20100114 -23- 50863231-TOS/MEC 08-9096
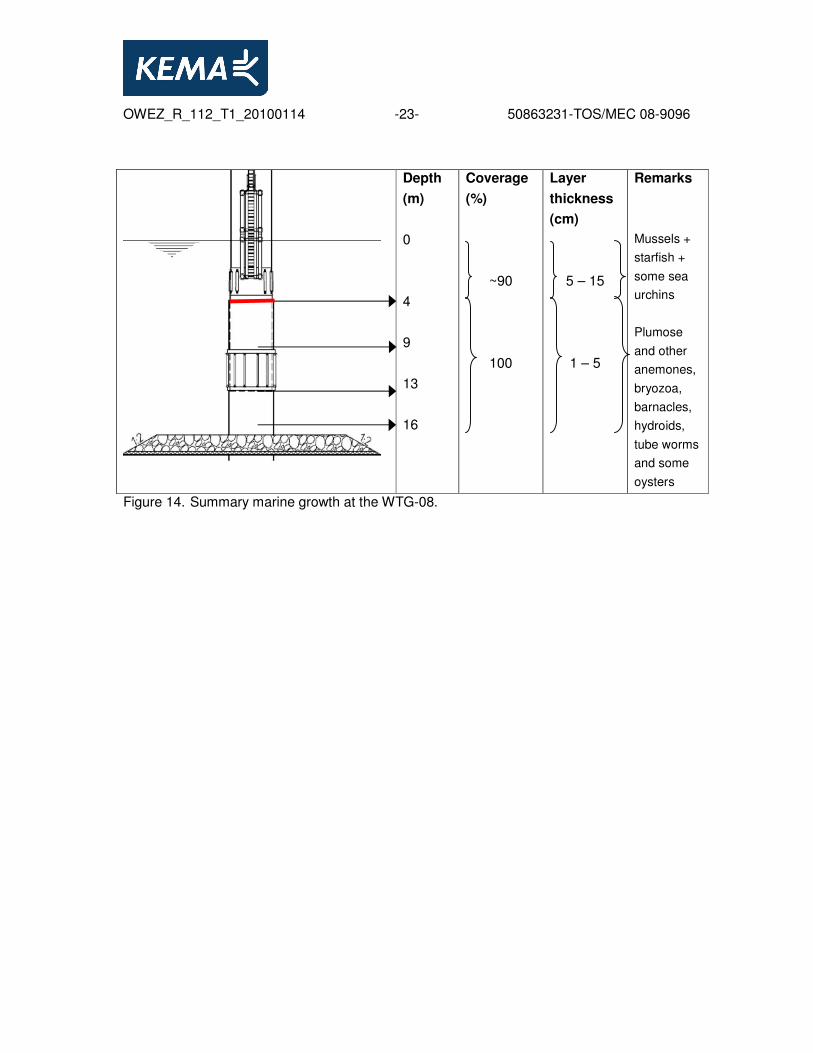
Depth
(m)
0
4
9
13
16
Coverage
(%)
~90
100
Layer
thickness
(cm)
5 – 15
1 – 5
Remarks
Mussels +
starfish +
some sea
urchins
Plumose
and other
anemones,
bryozoa,
barnacles,
hydroids,
tube worms
and some
oysters
Figure 14. Summary marine growth at the WTG-08.
OWEZ_R_112_T1_20100114 -24- 50863231-TOS/MEC 08-9096
3 COMPARISON OF THE OWEZ FOULING WITH SHELL/NAM AND HORNS REV OFFSHORE CONSTRUCTIONS
3.0 Fouling at the Shell/NAM
The NAM (Nederlandse Aardolie Maatschappij) has had regular monitoring throughout
multiple years that is aimed at inspection of the technical integrity and not fouling. During
2002 the NAM has performed a video survey study concerning the fouling on three
production platforms in the North Sea, K15, L15 and F3. Platforms K15 and L15 are located
at 53 º20’ N (L15 closest to the coast). Platform F3 is the most northern platform and is
located at about 54º 50’ N. The study investigated the geographical distribution and vertical
zonation of the fouling species. This study was based on video recordings of the fouling at
different installation parts of the platforms. The video recordings concerned a survey of about
6 years after installation of the structures and thus were not part of a monitoring program
throughout multiple years.
The mussel Mytilus edulis was present on all three platforms, but only at L15 did it reach a
depth of 14 m. Metridium senile had a good growth on all platforms, showing highest
coverage at K15. At L15 it only grew near the bottom. Obelia spp was not present at L15,
while at K15 no Tubularia spp was present. At F3 some growth of Alcyonium and
Pomatoceros were found. The average trend found at all three platforms, was that the layer
with hard fouling was followed by layer of soft fouling, mostly anemones that stretches to the
bottom.
Furthermore, it was observed that the fouling community at the surfaces was mostly
dominated by one species, either mussels, hydroids or anemones. Structures closer to the
shoreline were dominated by barnacles. Other observed fouling species were tube worms,
barnacles, sponges and sea squirts. At shallow depths, the mussels were the dominant
species. The fouling existed in patches on the surfaces, showing dense areas and empty
areas. These empty areas could be fouled by bryozoans, but the recordings did not allow to
determine this as no close-ups were made.
The fouling communities observed were dense with an estimated thickness between 5 and
20 cm, depending on the dominant species.
A clear vertical zonation was observed. Not all zones found were at similar depths or
abundant in similar extent. This could indicate differences in abiotic factors between the
locations. The first (upper) zone was fouled with hard fouling, dominated by the mussel M.
OWEZ_R_112_T1_20100114 -25- 50863231-TOS/MEC 08-9096 edulis. The characteristic of this zone was temporary exposure to the air during tides.
Mussels are capable of surviving these periods. Also, the wave movement provides a proper
supply of nutrients for M. edulis. Algae are also found at this zone. At lower zones soft fouling
is dominant, existing in anemones and hydroids.
Differences in geographical distribution of species have been observed, however, the quality
of the video recordings did not allow analysis at a smaller scale so differences between the
NAM-platforms were difficult to make.
3.1 Comparison fouling OWEZ with NAM
In the pre-survey report by KEMA (KEMA, 2006, reference 1), based on the findings at the
Shell/NAM offshore structures (Van der Laan, 2003a and b) and other relevant examples, it
was concluded that the fouling community that might develop on the offshore structures of
the OWEZ windfarm could be as follows: the first colonisers after installation are expected to
be hydroids (within several weeks), followed by mussels, barnacles and anemones. Surface
coverage of these species will increase during the first growth season (i.e. first year). More
species will settle during time: mussels (Mytilus edulis and M. galloprovincialis), anemones
Metridium senile, Obelia spp and Tubularia spp. Also a clear vertical zonation of the fouling
species is expected. The first (upper) zone was expected to be fouled with hard fouling,
probably dominated by a single species, likely by the mussel M. edulis. At lower zones soft
fouling is dominant, consisting of anemones and hydroids, although growth of soft fouling
species might be limited by any sand scour.
It can be concluded from this first field monitoring of the fouling in the OWEZ windfarm, that
the development of the fouling community was as expected, i.e. forecasted. A clear zonation
has been found. The change in fouling community at a depth most likely determined by
abiotic factors, shows a change from a hard fouling community in the upper zone, to the
lower zone that is dominated by soft fouling species.
The upper zone consisting of a community dominated by the common mussel (Mytilus
edulis) and associated species like barnacles (Balanus crenatus and Balanus balanoides),
the common starfish (Asterias rubens), several species of worms and crabs and the
encrusting sea mat (Conopeum reticulum). Covering percentages of mussels within the first
few metres from the surface were between 80-100%. Bare patches in between the mussels
were colonised by anemones (mainly Metridium senile and Sargartia spp.) and (tubes of) the
small crustacean Jassa spp.
OWEZ_R_112_T1_20100114 -26- 50863231-TOS/MEC 08-9096 The deeper zone was dominated by a community consisting of (tubes of) Jassa spp., several
species of anemones (mainly Metridium senile and Sargartia spp.; and less abundant
Diadumene cincta) and patches of the ringed tubularia Tubularia larynx. Green sea urchins
(Psammechinus miliaris) and common starfish (Asterias rubens) were also present in this
zone, but occured in low numbers. This community occupied the entire surface of the
monopiles (covering percentage 100%) from the zone below the mussels till the sea floor.
The observations made during this first monitoring provide the basis for the monitoring of the
marine fouling succession during the coming years. The succession in species composition
and coverage percentage will be analysed in time.
3.2 Comparison fouling OWEZ with the Horns Rev offshore wind farm
As also mentioned in the BuWa report (2008), great variations were found in the Horns Rev
offshore wind farm between surveys carried out in 2003 and 2004 and in spatial and
temporal distribution between species and communities (Leonhard et al., 2005). These
findings are an indication for the process of ecological succession. In the splash zone, an
almost monoculture population of the giant midge Telmatogeton japonicus is present. This
population increased significantly between 2003 and 2004. In general the vegetation was
very scarce. There was a zonation found in the abundance of algae, brown algae and red
algae seemed to be typical for the monopiles till approximately 4 m depth, whereas different
species of the green algae Ulva spp. seemed to be typical for the scour-protections. In the
sublitoral on the monopiles, just beneath the surface dense aggregations of either spat or
larger individuals of the common mussel (Mytilus edulis), including associated species like
the crenate barnacle (Balanus crenatus) and common starfish (Asterias rubens). - In the
lower zone the plumose anemone Metridium senile, Sargartia spp. anemones and the
crustacean Jassa marmorata were very abundant (Jassa marmorata was dominant in terms
of both numbers and biomass at all turbines sites and on both the monopiles and the scour
protection rocks). Less abundant, but common species in the lower zone were the keelworm
(Pomatoceros triqueter) and the hydroid (Tubularia indivisa). During the surveys in 2004 14
new epifaunal species were recorded that were not present in 2003. Notable species
included the bristle worm Sabellaria (presumably Sabellaria spinnulosa) and the white weed
Sertularia cupressina, which in the Wadden Sea are regarded as threatened or red list
species.
BuWa (2008) mentions that a full comparison between results of surveys carried out in the
Horns Rev offshore windfarm and the OWEZ offshore windfarm is not possible at this stage.
Surveys in the Horns Rev windfarm have been carried out three times and during two times
OWEZ_R_112_T1_20100114 -27- 50863231-TOS/MEC 08-9096 of the year (end of winter period (March) and end of summer period (September)). In the
OWEZ only one survey was carried out in February (end of winter period). However, the
preliminary analyses indicated that the growth on the hard structures of the turbines in the
OWEZ is comparable with the growth on the hard structures in the Horns Rev offshore wind
farm. This is also indicated by the results of the video recordings by KEMA as described in
this report.
OWEZ_R_112_T1_20100114 -28- 50863231-TOS/MEC 08-9096
4 DISCUSSION AND CONCLUSIONS
4.0 Comparison of observed fouling at WTG-07, WTG-08 and the MetMast
The growth at WTG-07 and WTG-08 is found to be very similar. Both monopiles are located
relatively close to each other in the wind park, thus it can be expected that the conditions to
which both are exposed, as well as the abundance of fouling species (larvae that settle on
the structures surfaces) are similar. A clear zonation, i.e. vertical pattern in fouling
composition is observed, in general due to particular abiotic conditions. The transition piece
and anode ring location show large growth of dominantly mussels and little number of other
species. At lower depths the marine growth shows more variety, with abundance of
anemones, barnacles, bryozoans and tube worms. The transition piece showed ~90%
coverage by marine growth, the monopiles showed nearly 100% coverage.
The marine growth on the MetMast differs from WTG-07 and WTG-08. Because of J tube
maintenance requiring cleaning, the MetMast had partially been cleaned and the mussels are
smaller (younger specimens). Probably these are the result of a second spat-fall during
September 2007, possible because of higher water temperatures at the end of the summer.
At lower depths, on the monopile, it was observed that the metal surface was largely ‘clean’,
free from extensive marine growth and the bare material of the monopile was visible. The
images do not indicate that this could be caused by physical stress on the fouling community
by for example sandblasts during ‘sand storms’ during storms at sea. Such sandblast may
remove specimens from the surface of the lower parts of the monopiles. However, the visual
impact of such effects should be visible at the other monopiles as well. As the MetMast was
installed during 2003, and therefore has a longer fouling history, it was expected that the
marine growth would be more extensive than at WTG-07 and WTG-08. It was mentioned by
Nuon (personal communication Martin Dekker, 2008) that during construction it was found
more difficult to weld the material of the MetMast, which is an indication that there can be
significant differences in surface characteristics or the material. As some growth is present
and a specific pattern has formed (presumably unaffected by sand scour), it is hypothesised
that the difference in fouling can be explained by potential differences between the
monopiles with respect to the material used, or different treatment of the raw material of
which the monopile is made.
The fouling community found during the OWEZ monitoring shows a similar distribution
(zonation), as observed at installations of the NAM and the Horns Rev wind park. During
future monitoring the succession of the fouling community will become more clear, i.e. if
OWEZ_R_112_T1_20100114 -29- 50863231-TOS/MEC 08-9096 other species will develop within the OWEZ wind park and species currently found will
decrease in number.
4.1 Fouling development and it's effects on corrosion
Fouling starts with the development of a biofilm. After the biofilm has set, it becomes possible
for macrofouling species to settle. This macrofouling forms a thick layer, depending on the
species size and characteristics of growth and attachment. In general, at the surface side of
a fouling layer, underneath the biofilm, an anaerobic environment develops because of the
absence of oxygen. The oxygen is used up by the organisms on the upper side of the biofilm.
Within the anaerobic environment, organisms like sulphate reducing bacteria (SRB’s) may
enhance the development of MIC (Microbial Influenced Corrosion). In order to protect the
transition piece, the surface is coated.
The main macrofouling (hard fouling) community observed are mussels. With respect to the
structural integrity of the transition piece and the monopile, it can be noted that there is an
strong indication that the marine growth regulates itself. Within the mussel community, the
mussels at the lower side, i.e. the specimens that attach to the surface, will have less fresh
water to filter for oxygen and nutrients that the mussels on the outer side of the layer which
are exposed to the aquatic environment. The mussels that provide the attachment of the
layer to the coated surface are thereby expected to have a higher mortality rate. As soon as
mussels die, the shells open and the inner body tissue goes out of the shells quickly. The
byssus threads by which they attach are lost as well, leaving no connection. Therefore, when
the mussels die the connection to the surface is lost and hence it becomes easier to remove
this layer by means of the water velocity. Foremost the mussels are able to form thick layers
of fouling, at this moment, as assessed from the video images, up to 15 cm in thickness. The
other, soft fouling species do not form thick layers as these do not cluster. When the clusters
of mussels are > 15 cm thick, due to currents during the tides (up to 3 m/s) and mortality of
the specimens attached to the surface (underneath), patches and clusters of mussels are
expected to come loose from the surface, leaving open spaces where new marine growth
can develop It was indeed observed that patches of mussel fouling had fallen off, whereby no
indication of coating damage has been observed. It was also observed that small, young
mussels have settled in these 'empty' areas. Based on the observed surfaces, no signs of
material degradation of the transition pieces due to fouling have been observed during this
monitoring session.
Several species like the Japanese oyster and barnacles cement themselves to a surface.
These species are difficult to remove due to a very tight adhesion. When being removed
OWEZ_R_112_T1_20100114 -30- 50863231-TOS/MEC 08-9096 (only manually), the chance exists that the coating becomes damaged. However, only very
small numbers of these species have been observed so far.
4.2 Effect of accumulation of biomass on the drag coefficient of the monopile cylinder
With respect to the roughness and thickness of the biofouling layer and its effect on drag
forces on the monopile, the most important area is the upper 7 metres below water level.
Here the hard fouling community, dominated by mussels, formed a relatively thick layer (up
to 20 cm). This layer has a specific roughness, i.e. the thickness of the mussel fouling varies
locally (thick and thin areas are recognised). This roughness has an effect on the drag
forces. The layer of other fouling species below 7 m and deeper, form rather thin layers and
no significant effect on surface roughness and increased drag would be expected.
For the calculation of drag it is important to mention that it only concerns an increase of the
drag on the upper layer of the masts (until the fouling layer changes from mussel fouling to
soft body fouling species which form a relatively thin layer).
The hydrodynamic drag force D on a cylinder in steady flow is given by:
DLCVDD
2
2
1 ρ=
Where ρ is the density of the medium (1000 kg/m3), V is the flow velocity CD is the drag
coefficient, D is the diameter of the cylinder and L its length. L >> D will be assumed. For
unsteady flow, like wave induced flow, this is still an important part of the force, but there is
an additional frequency dependent part.
The drag coefficient in general depends on the Reynolds number Re = VD/ν and the surface
roughness k/D. ν is the kinematic viscosity, approximately equal to 10-6 m2/s in water. In the
case of the monopile for the V90 turbines (diameter approximately 4.5 m) the Reynolds
number exceeds 106 for flow velocities higher than a few decimeters a second. For this range
of Reynolds numbers (Re > 5 105) the flow is ‘supercritical’ and the drag coefficient depends
only on the surface roughness (Sarpkaya and Isaacson, 1981).
With an estimated average surface roughness of 10 cm, k/D is approximately equal to 1/50,
which corresponds to a CD value of approximately 1.9. For the smooth cylinder the CD value
OWEZ_R_112_T1_20100114 -31- 50863231-TOS/MEC 08-9096 would be approximately 0.8. Hence the increase in drag coefficient is a factor of 2.4, between
smooth and rough.
The increase of effective diameter has only a small effect compared to the roughness effect.
If the effective diameter increases by 45 cm, this would correspond to an increase of only
10% in the drag force.
4.3 Conclusions
A clear zonation has been observed by the presence of different fouling communities at
different depths. The existing fouling community has settled formed on the coated surface.
During the visual observations of the recordings, it iswas observed that the thickest fouling
layers are formed by mussels, forming a relatively thick layer. The mussels are presentwhich
extend to a depth of 4 – 7 metres. At lower depths far less mussels are present. It was
observed that clumps of mussels had fallen off, leaving a surface free for new settlement. At
this stage, there is no indication found of coating damage or corrosion. The thickness of the
fouling layer varies between 1 and 15 cm. With an average surface roughness of 10 cm, the
increase in drag coefficient is a factor of 2.4, between smooth and rough, as calculated by
ECN. The observed roughness has aan relative small effect on the drag. The effect of the
thickness itself is small.
OWEZ_R_112_T1_20100114 -32- 50863231-TOS/MEC 08-9096
REFERENCES
1: KEMA, 2006. Biological Fouling. Pre-survey of marine fouling on turbine support structures
of the Offshore Windfarm Egmond aan Zee. OWEZ_R_112_July 19 2006. 50562062-
TOS/MEC 06-9409.
2: BUWA, 2008. Development of underwater flora- and fauna communities on hard
substrates of the offshore wind farm Egmond aan Zee (OWEZ). 24 April 2008. BuWa Report
nr 08-079.
3. VAN DER LAAN B.B.P.A., 2003a. Biological Issues regarding Production Activities on the
Dutch Continental Shelf of the North Sea. Containing A Preliminary Study on Biofouling.
Student report RUG, Department of Marine Biology.
4. VAN DER LAAN B.B.P.A., 2003b. De Geografische Verspreiding van Biologische
Aangroei op Productieplatformen en in Koelwatersystemen. Studentverslag RUG, Afdeling
Mariene Biologie.
5. LEONHARD S.B. & PEDERSEN J., 2005. Hard bottom substrate monitoring Horns Rev
offshore windfarm. Annual status report 2004. Elsam Engineering, May 2005.
6. WHOMERSLEY P. & PICKEN G.B. 2003. Long-term dynamics of fouling communities
found on offshore installations in the North Sea. J. Mar. Biol. Ass. U.K. 83, 4288/1 – 5.
7. SARPKAYA, T AND ISAACSON, I. 1981. Mechanics of Wave Forces on Offshore
Structures. Van Nostrand Reinhold Company Inc.
OWEZ_R_112_T1_20100114 -33- 50863231-TOS/MEC 08-9096
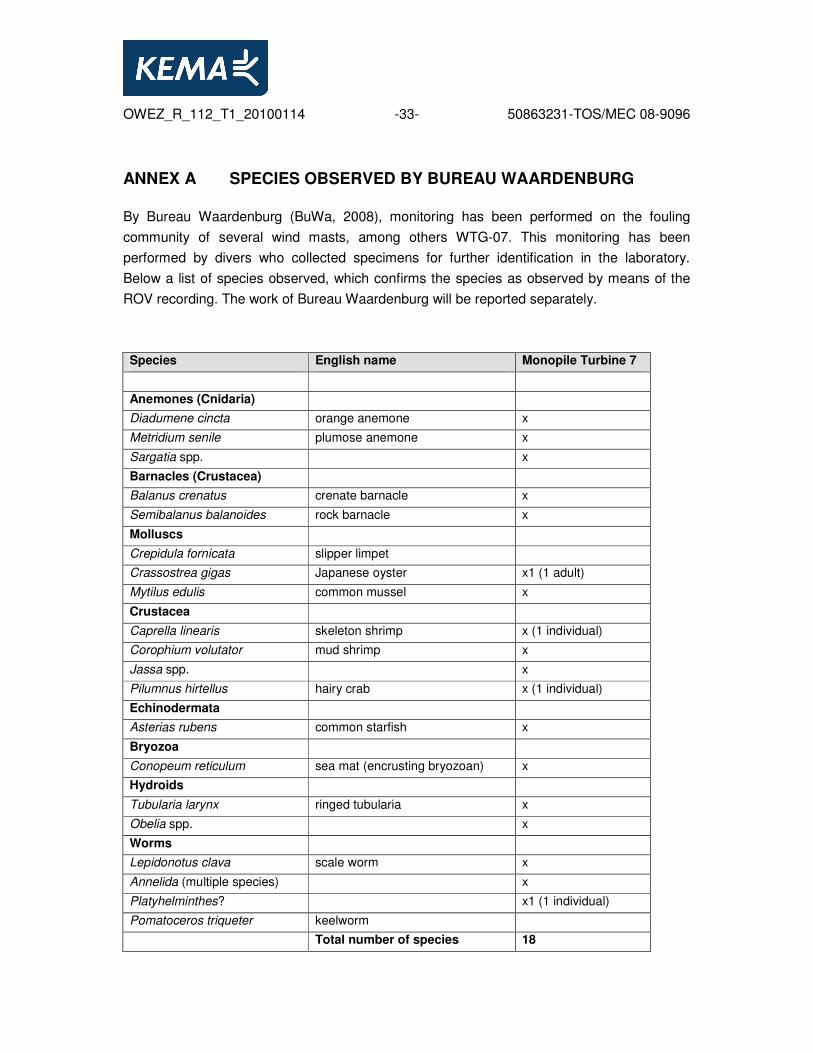
ANNEX A SPECIES OBSERVED BY BUREAU WAARDENBURG
By Bureau Waardenburg (BuWa, 2008), monitoring has been performed on the fouling
community of several wind masts, among others WTG-07. This monitoring has been
performed by divers who collected specimens for further identification in the laboratory.
Below a list of species observed, which confirms the species as observed by means of the
ROV recording. The work of Bureau Waardenburg will be reported separately.
Species English name Monopile Turbine 7
Anemones (Cnidaria)
Diadumene cincta orange anemone x
Metridium senile plumose anemone x
Sargatia spp. x
Barnacles (Crustacea)
Balanus crenatus crenate barnacle x
Semibalanus balanoides rock barnacle x
Molluscs
Crepidula fornicata slipper limpet
Crassostrea gigas Japanese oyster x1 (1 adult)
Mytilus edulis common mussel x
Crustacea
Caprella linearis skeleton shrimp x (1 individual)
Corophium volutator mud shrimp x
Jassa spp. x
Pilumnus hirtellus hairy crab x (1 individual)
Echinodermata
Asterias rubens common starfish x
Bryozoa
Conopeum reticulum sea mat (encrusting bryozoan) x
Hydroids
Tubularia larynx ringed tubularia x
Obelia spp. x
Worms
Lepidonotus clava scale worm x
Annelida (multiple species) x
Platyhelminthes? x1 (1 individual)
Pomatoceros triqueter keelworm
Total number of species 18

OWEZ_R_112_T1_20100114 -34- 50863231-TOS/MEC 08-9096
ANNEX B OBSERVATIONS BY WALS DIVING DURING THE YEARLY CONSTRUCTION MONITORING WTG-07, WTG-08 AND THE METMAST, MAY / JUNE 2007
During May and June 2007, inspections of the wind turbine support structures, among others
the turbines WTG-07, WTG-08 and the MetMast, took place. These monitorings were carried
out by means of ROV and were intended to observe any abnormalities of the submerged
support structures. During these inspections, also some observations and remarks were
made by Wals Diving and Marine in their report with respect to marine fouling. The remarks
described in the monitoring reports are listed below. Although these observations are rough
indications, they are the first estimates of fouling made in the wind farm. These observations
are no part of the monitoring program, but still are interesting to mention.
Remarks during inspection WTG-07 at May 23, 2007
Marine growth on transition from main sea level till Grout annulus has a thickness of
approximately 2 cm and a coverage of 80% on the structure, the gradation of the marine
growth is 30% hard marine growth 1,4 gr/cm² and 70% soft marine growth 1,2 gr/cm². The
marine growth on the monopile has a thickness of approximately 3 cm and a coverage of
80% the gradation is soft marine growth.
Remarks during inspection WTG-08 at May 23, 2007
Marine growth on transition from main sea level till Grout annulus has a thickness of
approximately 2 cm and a coverage of 80% on the structure, the gradation of the marine
growth is 30% hard marine growth 1,4 gr/cm² and 70% soft marine growth 1,2 gr/cm². The
marine growth on the monopile has a thickness of approximately 3 cm and a coverage of
80% the gradation is soft marine growth.
Remarks during inspection MetMast at June 7, 2007
The marine growth on the MetMast varies from all the WTG foundations. There is less
marine growth on the MetMast, which is strange due to the fact that this structure is in the
field since 2003. The marine growth on the transition piece from the main sea level till
monopile has a coverage of 90%, existing in 20% hard marine growth and 80% soft marine
growth. The marine growth on the monopile has a coverage of 40% what has mainly
concentrated on the north of the structure. The gradation is soft marine growth.
OWEZ_R_112_T1_20100114 -35- 50863231-TOS/MEC 08-9096
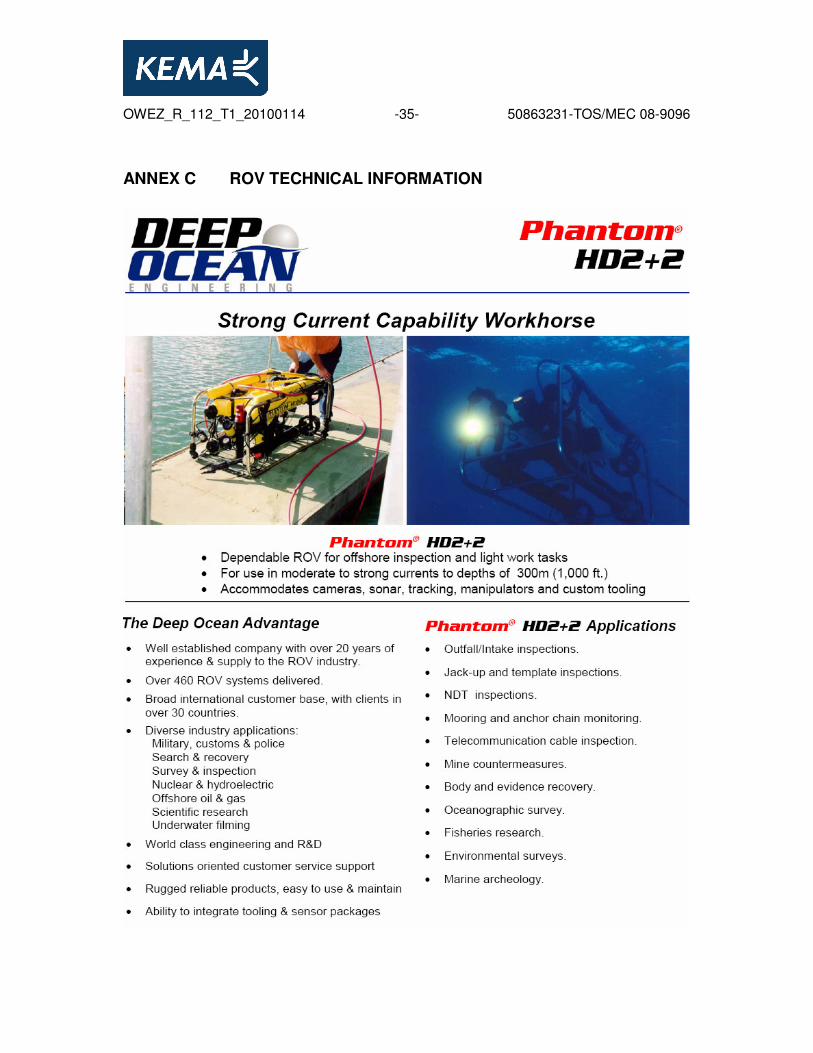
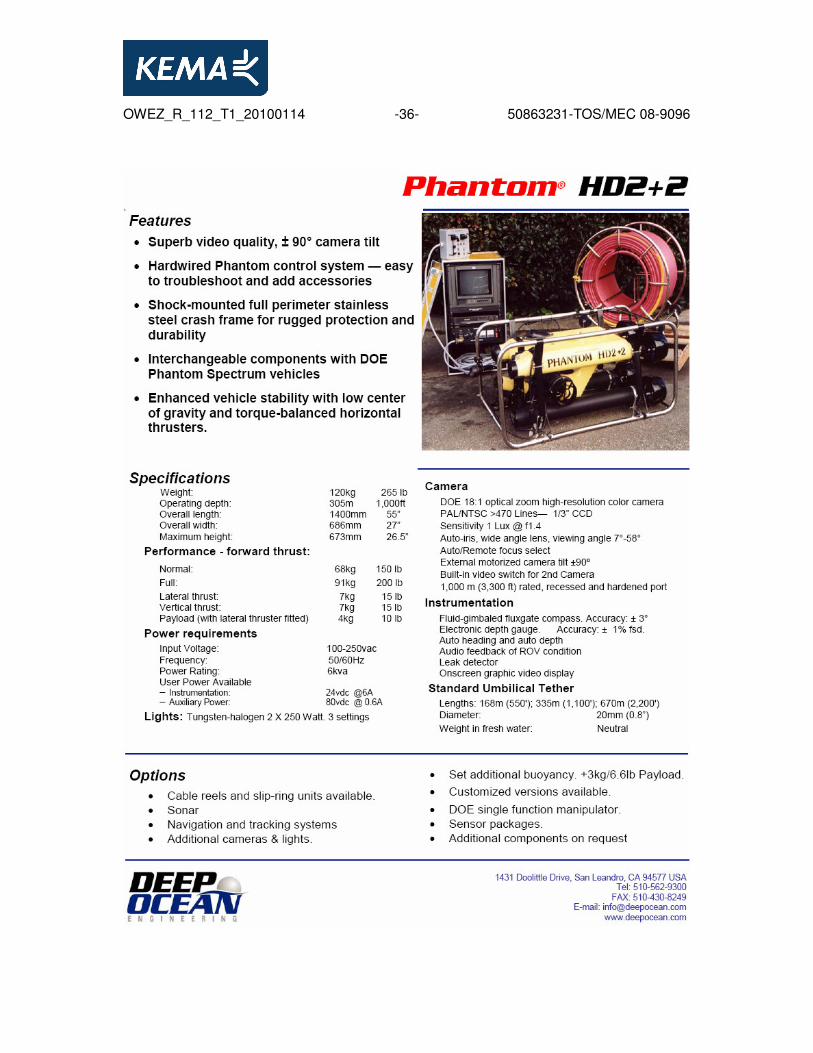
ANNEX C ROV TECHNICAL INFORMATION
OWEZ_R_112_T1_20100114 -36- 50863231-TOS/MEC 08-9096