p2 results data system richard yoder, pe tyler rubach r5/r7 p2 roundtable march 13, 2007 epa region...
TRANSCRIPT
P2 Results Data System
Richard Yoder, PETyler RubachR5/R7 P2 RoundtableMarch 13, 2007EPA Region 5
Thanks to:
Ken Grimm, PPRC
Prabin Kanel, P2RIC

Putt’s Law
Those who understand information technology don’t manage it;
Those who manage information technology don’t manage it.

Northeast Waste Management Officials’ AssociationRegions 1 & 2 - CT, ME, MA, NH, RI, VT, NJ, NYwww.newmoa.org / 617-367-8558
Waste Reduction Resource CenterRegions 3 & 4 - DE, MD, PA, VA, WV, DC, AL, FL,
GA, KY, MS, NC, SC,TNwrrc.p2pays.org / 919-715-6534
Great Lakes Regional P2 RoundtableRegion 5 - IL, IN, MI, MN, NY,OH, PA, WI, Ontariowww.glrppr.org / 630-472-5019
P2 Regional Information CenterRegion 7 - IA, KS, MO, NBwww.p2ric.org / 402-554-6257
Southwest P2 Information CenterRegion 6 - AK, LA, NM, OK, TXwww.zerowastenetwork.org / 512-232-7149
Peaks to Prairies P2 Information CenterRegion 8 - CO, MT, ND, SD, UT, WYwww.peakstoprairies.org / 406-994-3451
Western Regional P2 NetworkRegion 9 - AZ, CA, HI, NVwww.wrppn.org / 775-689-6688
Pacific Northwest P2 Resource CenterRegion 10 - AK, ID, OR, WA www.pprc.org / 206-352-2050
www.p2rx.org

P2 Results Data System:A dream

P2 Results Measurement
• Worries:– Double counting, info quality, info use/abuse
• System issues– UP, NFM; Jevons Paradox
• Environmental outcomes of measurement system

P2 Results Measurement
If you must tell me your opinions, tell me what you believe in. I have plenty of doubts of my own.
~ Goethe

Overview
• Background & structure of P2 Results Data System
• Your opportunity for action

National P2 Results Task Force
• Joint Project: NPPR & P2Rx
• Includes representatives of states in every EPA Region, P2Rx Centers, EPA HQs & Regional Offices
• Has been meeting for over 2 years
• Focused on developing core national P2 measures, data aggregation tool, & report on the results

• Help sell the economic and environmental value of P2 and consequently….. YOUR program
• Promotes new opportunities and connection with clients
• Help policy makers assess P2 efforts and determine funding
• Provide (EPA) quality data regarding P2 efforts
Purpose

Current Accomplishments
Designed Framework
Developed a Data Dictionary for a set of core metrics – Behavioral, Activity and Outcome
MOA with P2 programs – 35 signatories, 31 states
Programmed regional aggregation modules that reside at P2Rx Centers

The Framework
Customers
DataCollection
DesktopTracking
RegionalAggregation
NationalRoll-up
Of Results

Data Dictionary
Defines:
• Data elements for reporting
• Units to be used
• Categories of Core Elements
• Crosswalk with other EPA/State Programs
• Addresses EPA P2 Strategic Targets
• Helps meet accountability and budget needs

Core Measures
Activity Measures
Behavioral Measures
Outcome Measures

Activity Measures (Level 1)
• Trainings, workshops, meetings, conferences and roundtables
• P2 Plans• Site visits• Brief assistance• P2 information developed• P2 information distributed• Grants awarded• Web visitors to online information• Awards Programs• Leadership Programs

Behavioral Measures (Level 2)
• Clients reporting adoption of P2 policies• People trained in P2 by clients• Clients developing EMSs• Clients that have developed a P2 Team• Clients that have mapped their processes• Clients reporting compliance improvements• Clients reporting implemented P2 suggestions• Clients reporting increased understanding of P2
Opportunities
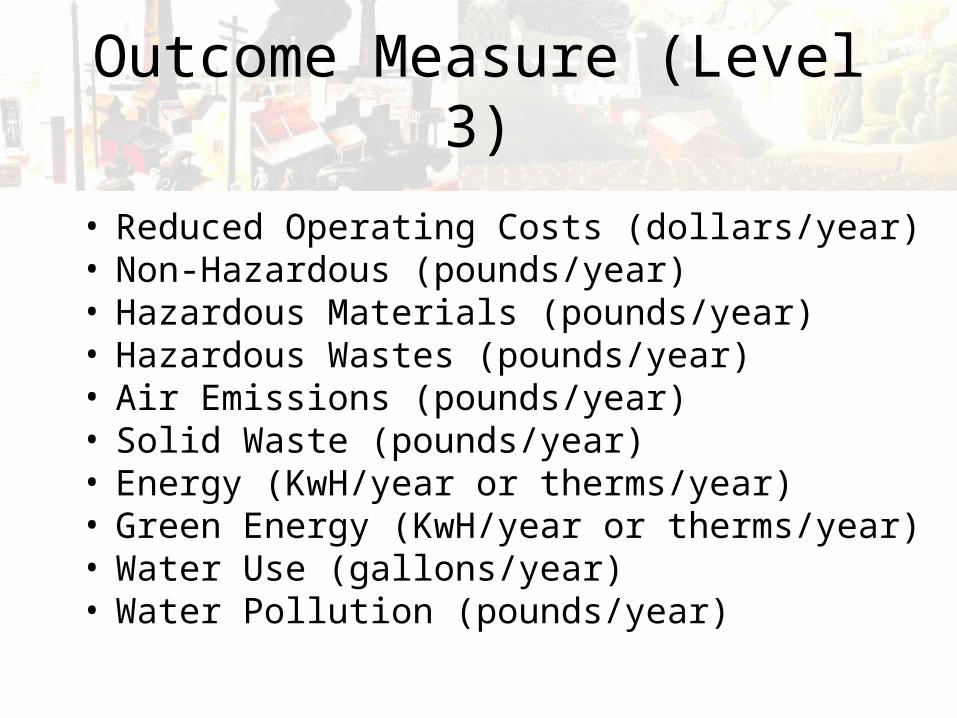
Outcome Measure (Level 3)
• Reduced Operating Costs (dollars/year)• Non-Hazardous (pounds/year)• Hazardous Materials (pounds/year)• Hazardous Wastes (pounds/year)• Air Emissions (pounds/year)• Solid Waste (pounds/year)• Energy (KwH/year or therms/year)• Green Energy (KwH/year or therms/year)• Water Use (gallons/year)• Water Pollution (pounds/year)


Regional Aggregation Modules
• Key component of the “framework”• Tell the Regional “P2 Story”• Can provide local program anonymity &
control• Can provide reports for individual
programs• Helps sell the value of programs to
regional, state and local decision makers• Feeds the National Report

Current Action Opportunity(NEIEN Funded Effort)
• “Call for Data” for years 2004 and 2005 (October 2006)
• P2Rx Centers organize regional measurement stakeholder workgroups (September 2006)
• Submit regional measurement needs and changes to regional module (January 2007)
• Program changes to all regional modules (March-May 2007)

Current Action Opportunity(NEIEN Funded Effort)
• Data entry training for P2 programs (January – June 2007): Today it’s Tyler
• Regional Module Version 2.1 released to P2Rx Centers (May 2007)– Recent Improvements– Next Round of Improvements

Future Action Opportunity(NEIEN Funded Effort)
• Regional Measurement Workgroups to discuss Version 2.1 (May-July 2007)
• “Call for Data” - Calendar Year 2006 (July 2007)
• Version 2.1 modifications (July-September 2007)– Regional Reporting– National Reportiing

Data Entry
• The bucket is built; we’re ready for programs to fill it!
• So what’s next?

Workgroups
• Regional workgroups developed to discuss data collection, metrics, calculators, reports and user interface of the Regional P2 Results Aggregation Module.

Questions?
• Contact Info
• 206-352-2050
• 402-554-6263
Useful Links…
• http://www.p2rx.org/services/measurement.cfm– Regional contact person information
• http://www.p2rx.org/measurement/info/FINAL_user_guide.pdf– User Guide
• http://www.p2rx.org/measurement/info/FINAL_meas_background.pdf– Background About the National P2 Results Data
System • http://www.p2rx.org/measurement/info/
– Technical Documents

One More Useful Link
• http://lib.wmrc.uiuc.edu/np2rds/index.php– A WIKI-style storehouse of information,
questions and tips on using and improving the P2 Results Data System.


Workgroup Tasks
• Identify current P2 data management systems in use in the region
• Develop regional or state-specific cost calculators (16 currently)
• Identify additional regional metrics (may not be reported nationally)
• Identify data collection barriers and needs from regional P2 programs

Other Issues - Next Steps
• What is context, bigger picture?– UP freight: total tonnage & revenues up
• % of total freight transport down
• System issues – what is total impact?– NFM: game between service & warehouse

Next Steps
• What will happen to the information?– What can it be used for?
• Funding justification. – Baseline & improvement – or – compare approaches?
• Impact in the field?– Can it be used for environmental improvement?
Next Steps
• Feedback mechanism– How can the information influence action?
• Possibilities for repurposing information?
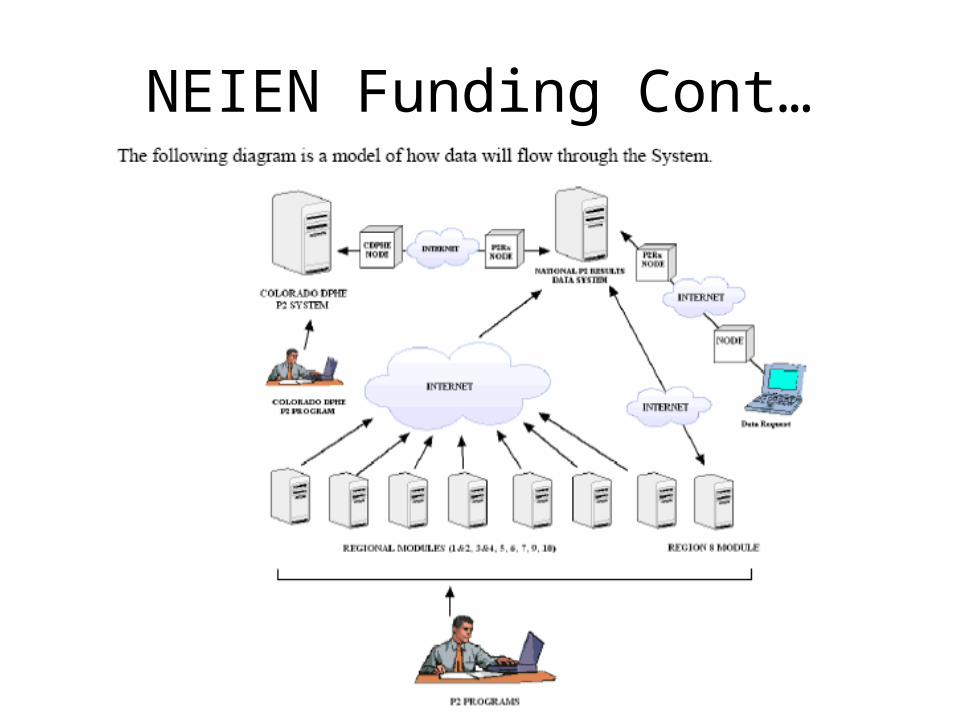
NEIEN Funding Cont…
