pacific windows in new zealand’s permanent migration scheme
TRANSCRIPT
Pacific windows in New Zealand’s permanent
migration scheme
Sankar Ramasamy
Labour and Immigration Research Centre
Department of Labour, New Zeland
Canberra, 3 April, 2012
Outline
• Then and now – a brief history
• Pacific people in NZ
• Permanent migration from the Pacific
• Settlement outcomes
• Pacific futures
Migration from the Pacific
• Pre and post 1970s - what's the difference?
• Policy changes in recent times
New Zealand’s Pacific people
• 6.9% of NZ’s population – strong growth projection
• A diverse population – 13 distinct languages and cultural groups, and 60% born in NZ
• Young - median age 21, compares to 35 for total population
• Auckland has the largest Pacific population in the world – 27% of NZ Pacific people live in Auckland
• A major part of future workforce, but challenges of high youth unemployment and under achievement.
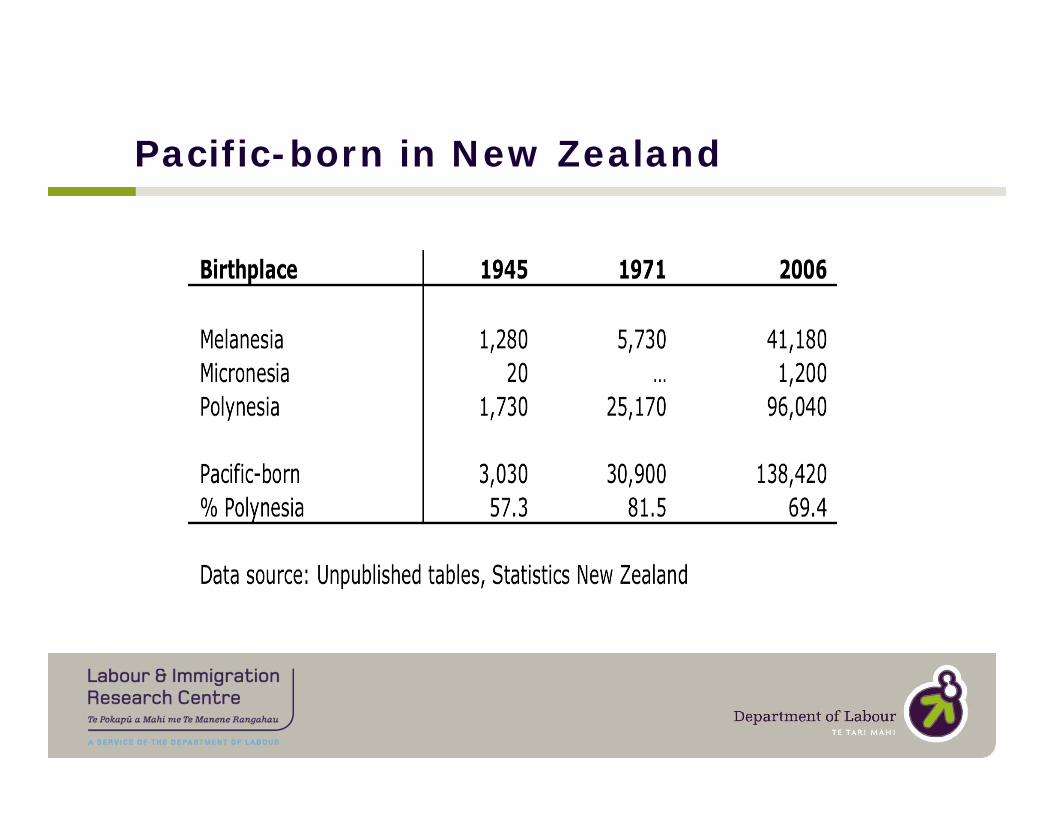
Pacific-born in New Zealand
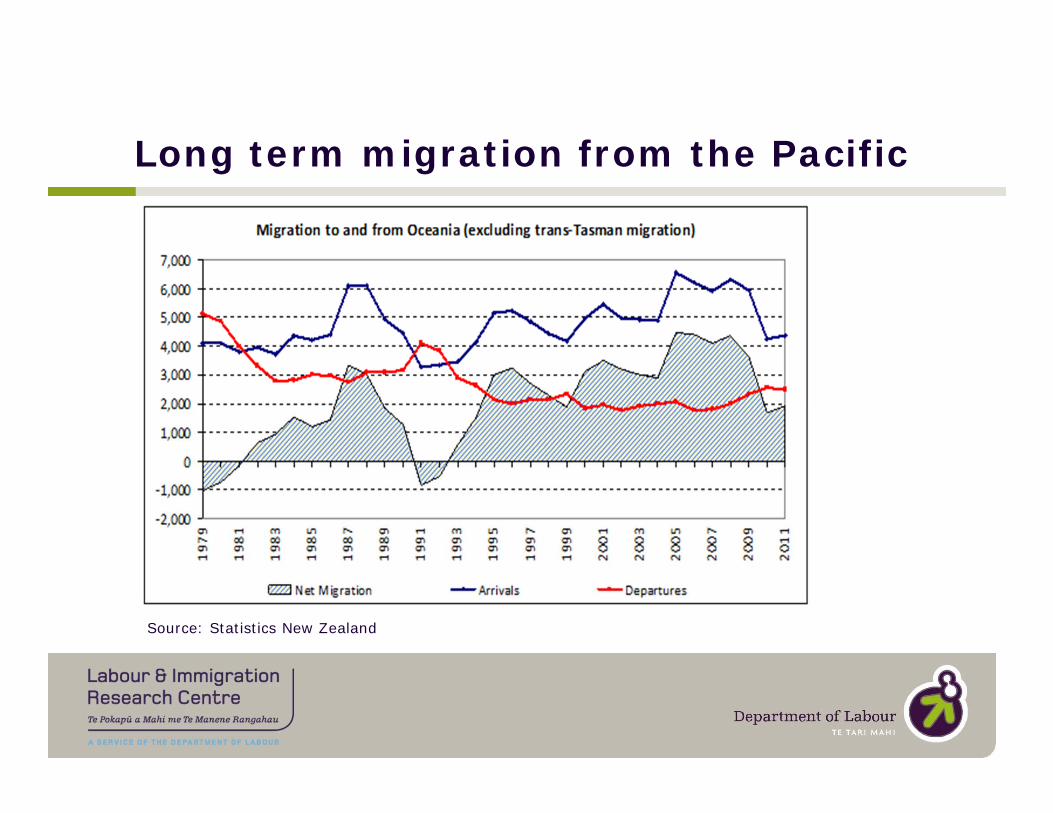
Long term migration from the Pacific
Source: Statistics New Zealand
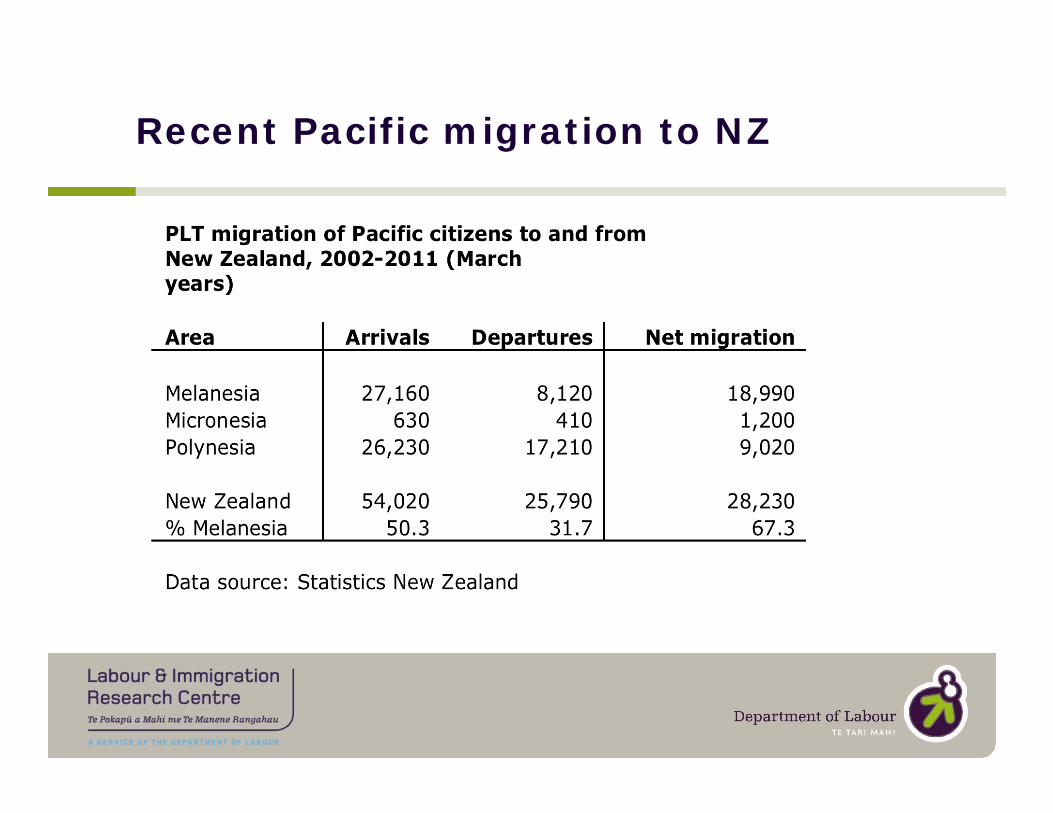
Recent Pacific migration to NZ
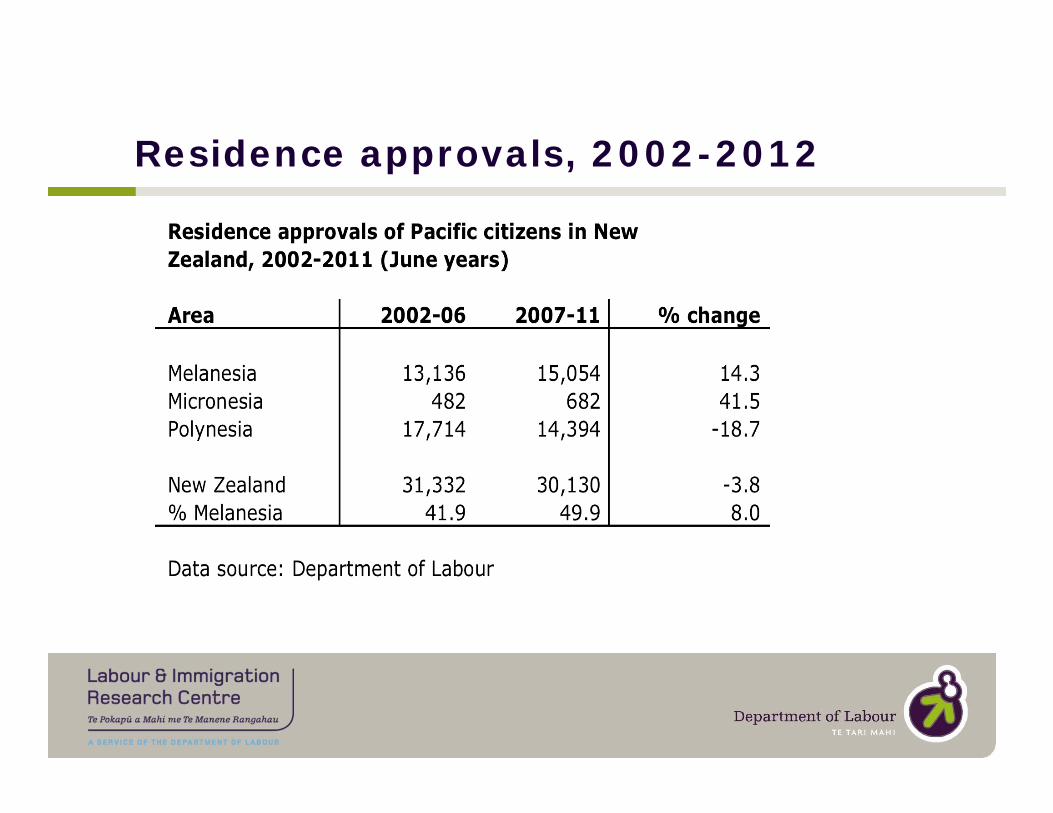
Residence approvals, 2002-2012
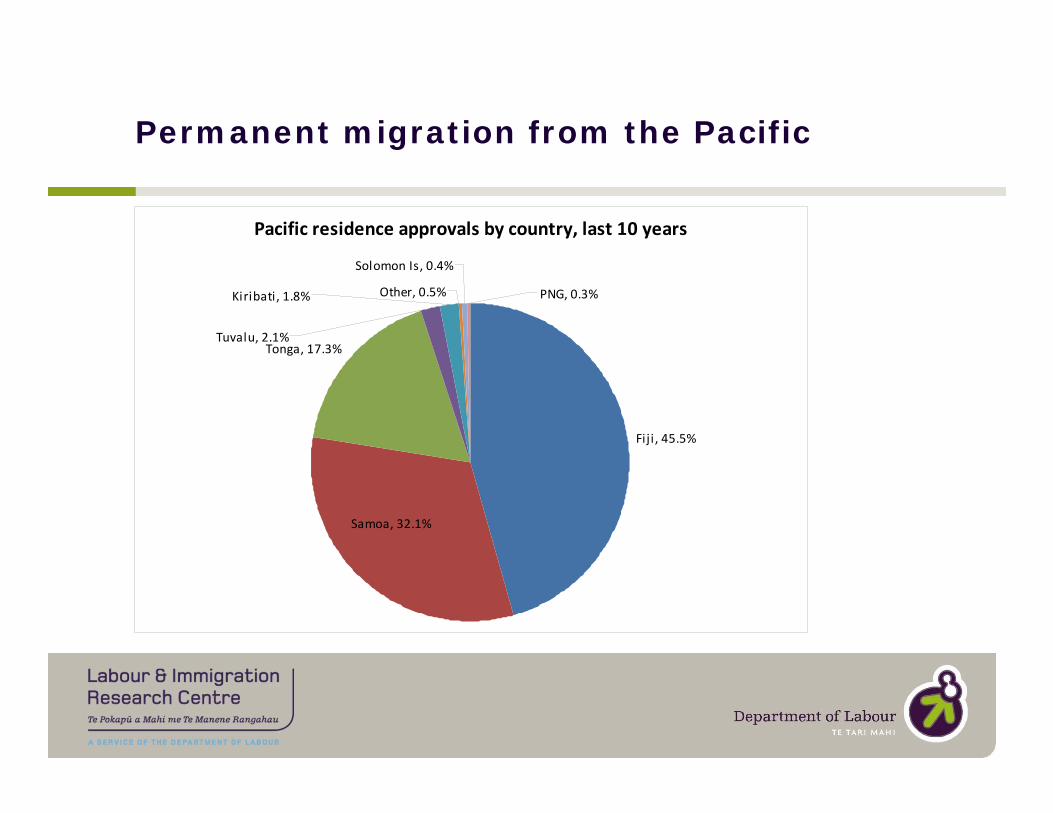
Pacific residence approvals by country, last 10 years
Fiji , 45.5%
Tonga, 17.3%
Other, 0.5%
Solomon Is, 0.4%
Samoa, 32.1%
Tuvalu, 2.1%
Kiribati, 1.8% PNG, 0.3%
Permanent migration from the Pacific
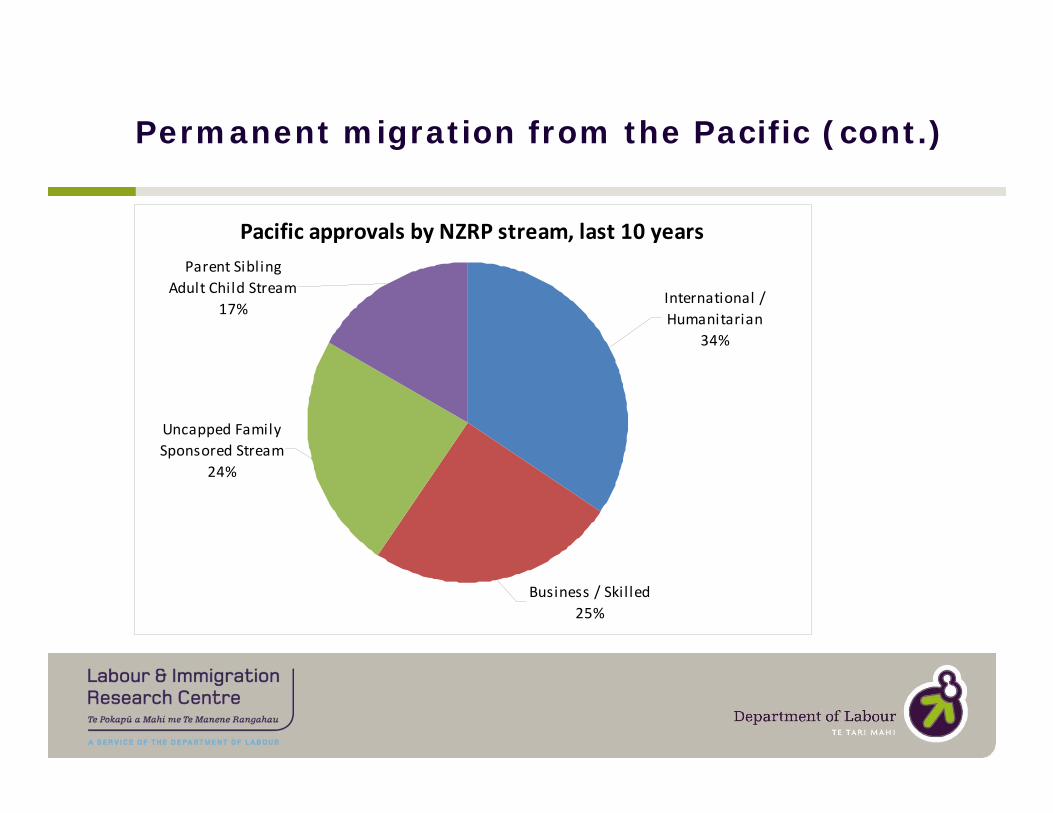
Pacific approvals by NZRP stream, last 10 years
International / Humanitarian
34%
Business / Skil led25%
Uncapped Family Sponsored Stream
24%
Parent Sibling Adult Child Stream
17%
Permanent migration from the Pacific (cont.)
Settlement outcomes for Pacific Category Migrants using the LisNZ
• The Longitudinal Immigration Survey: New Zealand (LisNZ) is a key source of information about migrants’ outcomes and experiences in New Zealand.
• Provides key information on Pacific and other groups of migrants.
• Data is available from Wave 1 - Wave 3 (based on interviews 6, 18 & 36 months after taking up permanent residence).
• The LisNZ results for the Pacific have generally been positive.
Early outcomes for Pacific Category Migrants
Pacific Category (SQ
and PAC)
FamilyPartner
FamilyParent
Skilled Principal
Skilled Secondary
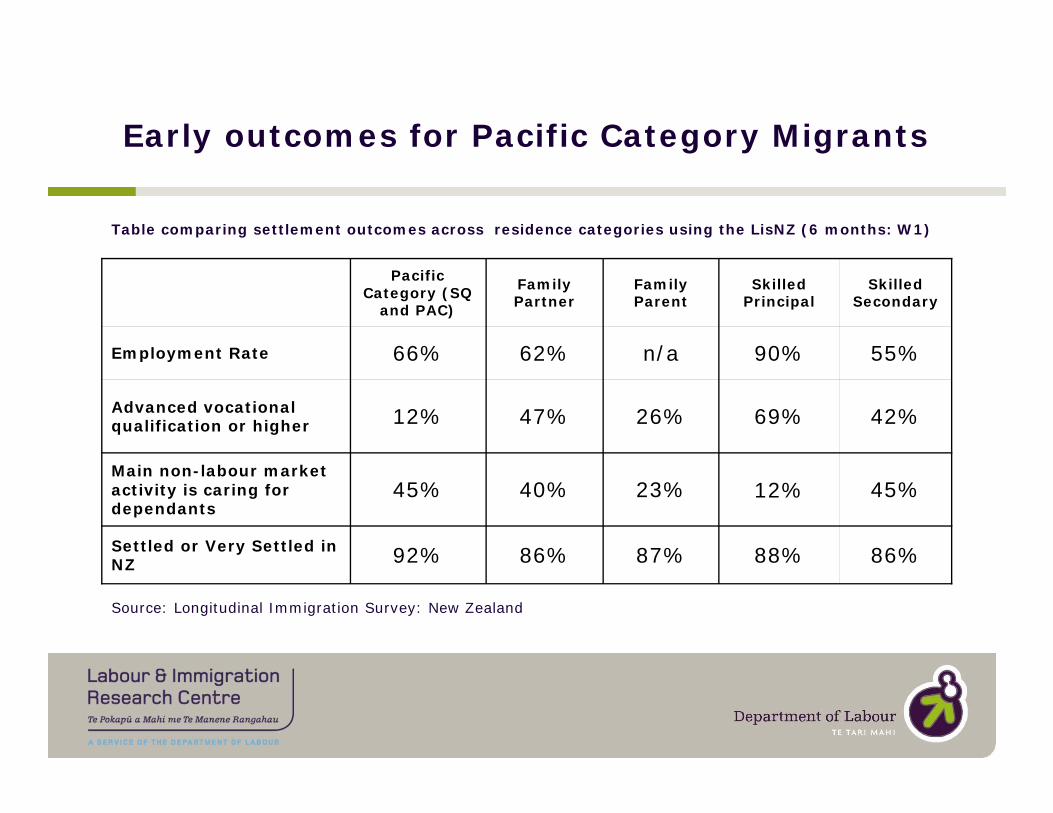
Employment Rate 66% 62% n/a 90% 55%
Advanced vocational qualification or higher 12% 47% 26% 69% 42%
Main non-labour market activity is caring for dependants
45% 40% 23% 12% 45%
Settled or Very Settled in NZ 92% 86% 87% 88% 86%
Table comparing settlement outcomes across residence categories using the LisNZ (6 months: W1)
Source: Longitudinal Immigration Survey: New Zealand
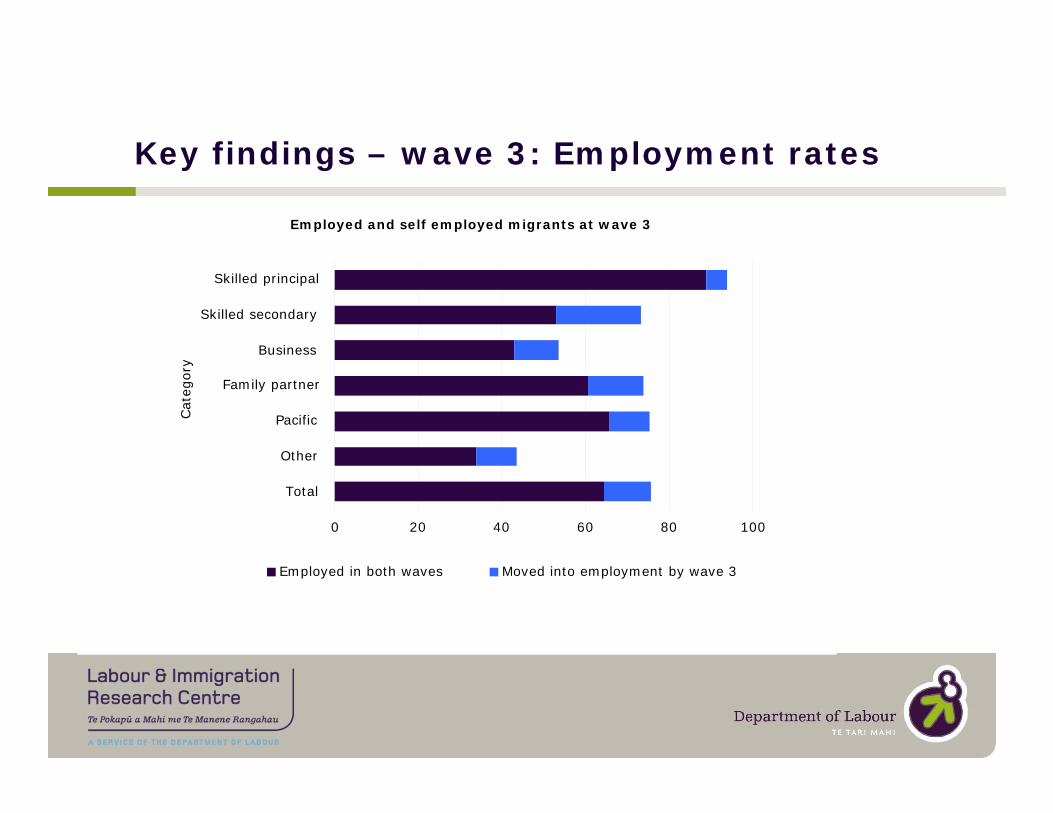
Key findings – wave 3: Employment rates
Employed and self employed migrants at wave 3
0 20 40 60 80 100
Total
Other
Pacific
Family partner
Business
Skilled secondary
Skilled principal
Cat
egory
Employed in both waves Moved into employment by wave 3
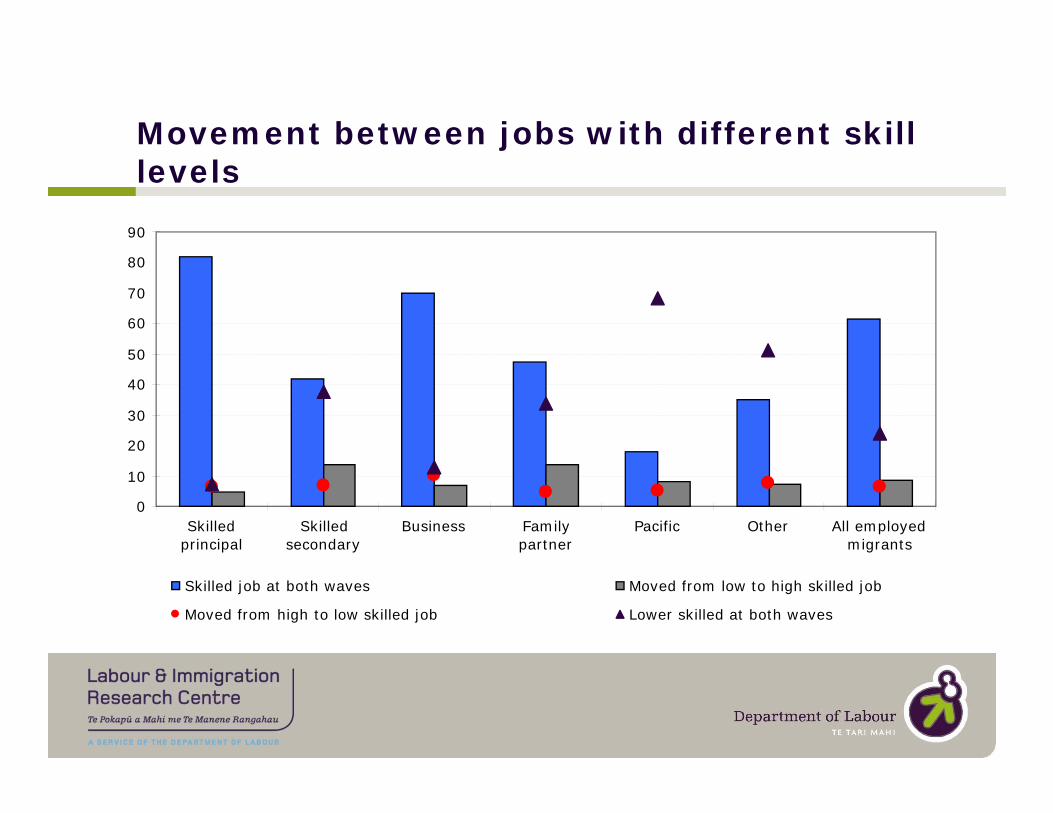
Movement between jobs with different skill levels
0
10
20
30
40
50
60
70
80
90
Skilledprincipal
Skilledsecondary
Business Familypartner
Pacific Other All employedmigrants
Skilled job at both waves Moved from low to high skilled job
Moved from high to low skilled job Lower skilled at both waves
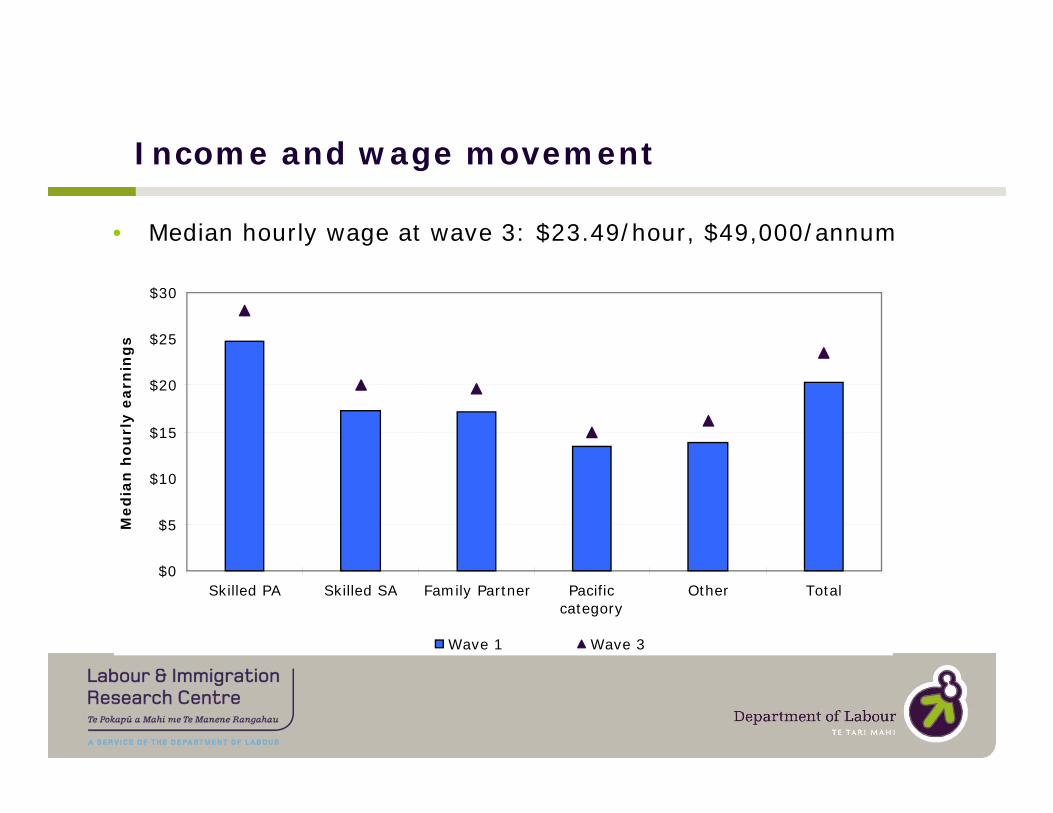
Income and wage movement
• Median hourly wage at wave 3: $23.49/hour, $49,000/annum
$0
$5
$10
$15
$20
$25
$30
Skilled PA Skilled SA Family Partner Pacificcategory
Other Total
Med
ian
ho
url
y e
arn
ing
s
Wave 1 Wave 3
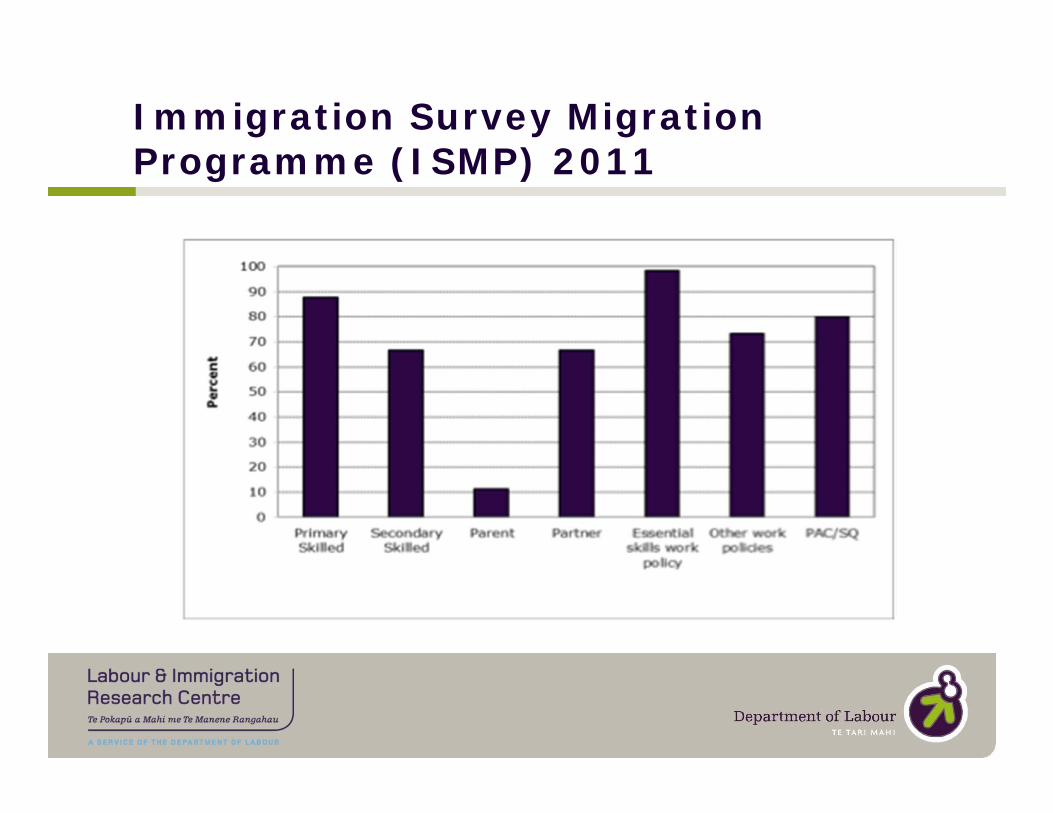
Immigration Survey Migration Programme (ISMP) 2011
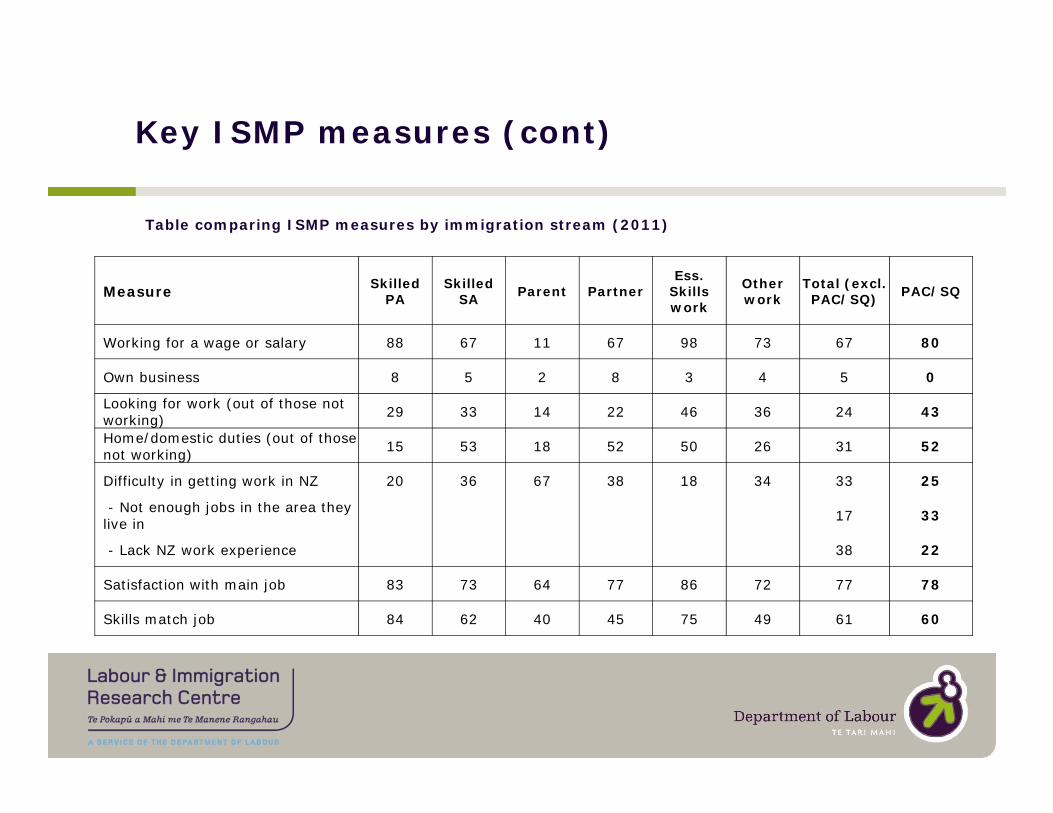
Key ISMP measures (cont)
Measure Skilled PA
Skilled SA Parent Partner
Ess. Skills work
Other work
Total (excl.PAC/SQ) PAC/SQ
Working for a wage or salary 88 67 11 67 98 73 67 80
Own business 8 5 2 8 3 4 5 0
Looking for work (out of those not working) 29 33 14 22 46 36 24 43
Home/domestic duties (out of those not working) 15 53 18 52 50 26 31 52
Difficulty in getting work in NZ 20 36 67 38 18 34 33 25
- Not enough jobs in the area they live in 17 33
- Lack NZ work experience 38 22
Satisfaction with main job 83 73 64 77 86 72 77 78
Skills match job 84 62 40 45 75 49 61 60
Table comparing ISMP measures by immigration stream (2011)
Pacific futures
• Demographic changes
• By 2050 NZ could reach 5.2 million, 90% urban
• Another 8 million in the Pacific Islands
• Main forces likely to impact mobility:
• Urbanisation (especially Melanesia)
• Demand for skilled labour in PNG’s resource extraction industry
• Environmental deterioration
• Youth bulge and increasing levels of education
Pacific migration: a watershed?
• Arrival cities in the Pacific and on the Pacific Rim
• Re-emergence of Melanesia
• New research - Pacific futures scenarios –Oxford:IMI
• www.imi.ox.ac.uk/research-projects/global-migration-futures

Further information
• Visit our research page:www.immigration.govt.nz/research
• LisNZ research page:www.immigration.govt.nz/lisnz
• Contact us:[email protected]