package ‘pcapp’ - the comprehensive r archive … · package ‘pcapp ’ january 14, 2018 ......
TRANSCRIPT
Package ‘pcaPP’January 14, 2018
Version 1.9-73
Date 2018-01-04
Title Robust PCA by Projection Pursuit
Author Peter Filzmoser, Heinrich Fritz, Klaudius Kalcher
Maintainer Valentin Todorov <[email protected]>
Imports mvtnorm
Description Provides functions for robust PCA by projection pursuit. The methods are de-scribed in Croux et al. (2006) <doi:10.2139/ssrn.968376>, Croux et al. (2013) <doi:10.1080/00401706.2012.727746>, Todorov and Filz-moser (2013) <doi:10.1007/978-3-642-33042-1_31>.
License GPL (>= 3)
NeedsCompilation yes
Repository CRAN
Date/Publication 2018-01-14 18:27:29 UTC
R topics documented:cor.fk . . . . . . . . . . . . . . . . . . . . . . . . . . . . . . . . . . . . . . . . . . . . 2covPC . . . . . . . . . . . . . . . . . . . . . . . . . . . . . . . . . . . . . . . . . . . . 3covPCA . . . . . . . . . . . . . . . . . . . . . . . . . . . . . . . . . . . . . . . . . . . 4data.Zou . . . . . . . . . . . . . . . . . . . . . . . . . . . . . . . . . . . . . . . . . . . 6l1median . . . . . . . . . . . . . . . . . . . . . . . . . . . . . . . . . . . . . . . . . . 7l1median_NLM . . . . . . . . . . . . . . . . . . . . . . . . . . . . . . . . . . . . . . . 8objplot . . . . . . . . . . . . . . . . . . . . . . . . . . . . . . . . . . . . . . . . . . . . 10opt.TPO . . . . . . . . . . . . . . . . . . . . . . . . . . . . . . . . . . . . . . . . . . . 11PCAgrid . . . . . . . . . . . . . . . . . . . . . . . . . . . . . . . . . . . . . . . . . . . 14PCAproj . . . . . . . . . . . . . . . . . . . . . . . . . . . . . . . . . . . . . . . . . . . 17PCdiagplot . . . . . . . . . . . . . . . . . . . . . . . . . . . . . . . . . . . . . . . . . 19plot.opt.TPO . . . . . . . . . . . . . . . . . . . . . . . . . . . . . . . . . . . . . . . . 21plotcov . . . . . . . . . . . . . . . . . . . . . . . . . . . . . . . . . . . . . . . . . . . 23qn . . . . . . . . . . . . . . . . . . . . . . . . . . . . . . . . . . . . . . . . . . . . . . 24ScaleAdv . . . . . . . . . . . . . . . . . . . . . . . . . . . . . . . . . . . . . . . . . . 26
Index 28
1

2 cor.fk
cor.fk Fast estimation of Kendall’s tau rank correlation coefficient
Description
Calculates Kendall’s tau rank correlation coefficient in O (n log (n)) rather than O (n\^2) as in thecurrent R implementation.
Usage
cor.fk (x, y = NULL)
Arguments
x A vector, a matrix or a data frame of data.
y A vector of data.
Details
The code of this implementation of the fast Kendall’s tau correlation algorithm has originally beenpublished by David Simcha. Due to it’s runtime (O(n log n)) it’s essentially faster than the currentR implementation (O (n^2)), especially for large numbers of observations. The algorithm goesback to Knight (1966) and has been described more detailed by Abrevaya (1999) and Christensen(2005).
Value
The estimated correlation coefficient.
Author(s)
David Simcha, Heinrich Fritz, Christophe Croux, Peter Filzmoser <<[email protected]>>
References
Knight, W. R. (1966). A Computer Method for Calculating Kendall’s Tau with Ungrouped Data.Journal of the American Statistical Association, 314(61) Part 1, 436-439.Christensen D. (2005). Fast algorithms for the calculation of Kendall’s Tau. Journal of Computa-tional Statistics 20, 51-62.Abrevaya J. (1999). Computation of the Maximum Rank Correlation Estimator. Economic Letters62, 279-285.
See Also
cor
covPC 3
Examples
set.seed (100) ## creating test datan <- 1000x <- rnorm (n)y <- x+ rnorm (n)
tim <- proc.time ()[1] ## applying cor.fkcor.fk (x, y)cat ("cor.fk runtime [s]:", proc.time ()[1] - tim, "(n =", length (x), ")\n")
tim <- proc.time ()[1] ## applying cor (standard R implementation)cor (x, y, method = "kendall")cat ("cor runtime [s]:", proc.time ()[1] - tim, "(n =", length (x), ")\n")
## applying cor and cor.fk on data containing
Xt <- cbind (c (x, as.integer (x)), c (y, as.integer (y)))
tim <- proc.time ()[1] ## applying cor.fkcor.fk (Xt)cat ("cor.fk runtime [s]:", proc.time ()[1] - tim, "(n =", nrow (Xt), ")\n")
tim <- proc.time ()[1] ## applying cor (standard R implementation)cor (Xt, method = "kendall")cat ("cor runtime [s]:", proc.time ()[1] - tim, "(n =", nrow (Xt), ")\n")
covPC Covariance Matrix Estimation from princomp Object
Description
computes the covariance matrix from a princomp object. The number of components k can be givenas input.
Usage
covPC(x, k, method)
Arguments
x an object of class princomp.
k number of PCs to use for covariance estimation (optional).
method method how the PCs have been estimated (optional).

4 covPCA
Details
There are several possibilities to estimate the principal components (PCs) from an input data matrix,including the functions PCAproj and PCAgrid. This function uses the estimated PCs to reconstructthe covariance matrix. Not all PCs have to be used, the number k of PCs (first k PCs) can be givenas input to the function.
Value
cov the estimated covariance matrix
center the center of the data, as provided from the princomp object.
method a string describing the method that was used to calculate the PCs.
Author(s)
Heinrich Fritz, Peter Filzmoser <<[email protected]>>
References
C. Croux, P. Filzmoser, M. Oliveira, (2007). Algorithms for Projection-Pursuit Robust PrincipalComponent Analysis, Chemometrics and Intelligent Laboratory Systems, Vol. 87, pp. 218-225.
See Also
PCAgrid, PCAproj, princomp
Examples
# multivariate data with outlierslibrary(mvtnorm)x <- rbind(rmvnorm(200, rep(0, 6), diag(c(5, rep(1,5)))),
rmvnorm( 15, c(0, rep(20, 5)), diag(rep(1, 6))))pc <- princomp(x)covPC(pc, k=2)
covPCA Robust Covariance Matrix Estimation
Description
computes the robust covariance matrix using the PCAgrid and PCAproj functions.
Usage
covPCAproj(x, control)covPCAgrid(x, control)
covPCA 5
Arguments
x a numeric matrix or data frame which provides the data.
control a list whose elements must be the same as (or a subset of) the parameters of theappropriate PCA function (PCAgrid or PCAproj).
Details
The functions covPCAproj and covPCAgrid use the functions PCAproj and PCAgrid respectivelyto estimate the covariance matrix of the data matrix x.
Value
cov the actual covariance matrix estimated from x
center the center of the data x that was substracted from them before the PCA algo-rithms were run.
method a string describing the method that was used to calculate the covariance matrixestimation
Author(s)
Heinrich Fritz, Peter Filzmoser <<[email protected]>>
References
C. Croux, P. Filzmoser, M. Oliveira, (2007). Algorithms for Projection-Pursuit Robust PrincipalComponent Analysis, Chemometrics and Intelligent Laboratory Systems, Vol. 87, pp. 218-225.
See Also
PCAgrid, ScaleAdv, princomp
Examples
# multivariate data with outlierslibrary(mvtnorm)x <- rbind(rmvnorm(200, rep(0, 6), diag(c(5, rep(1,5)))),
rmvnorm( 15, c(0, rep(20, 5)), diag(rep(1, 6))))covPCAproj(x)# compare with classical covariance matrix:cov(x)

6 data.Zou
data.Zou Test Data Generation for Sparse PCA examples
Description
Draws a sample data set, as introduced by Zou et al. (2006).
Usage
data.Zou (n = 250, p = c(4, 4, 2), ...)
Arguments
n The required number of observations.
p A vector of length 3, specifying how many variables shall be constructed usingthe three factors V1, V2 and V3.
... Further arguments passed to or from other functions.
Details
This data set has been introduced by Zou et al. (2006), and then been referred to several times, e.g.by Farcomeni (2009), Guo et al. (2010) and Croux et al. (2011).
The data set contains two latent factors V1 ~ N(0, 290) and V2 ~ N(0, 300) and a third mixedcomponent V3 = -0.3 V1 + 0.925V2 + e; e ~ N(0, 1).The ten variables Xi of the original data set are constructed the following way:Xi = V1 + ei; i = 1, 2, 3, 4Xi = V2 + ei; i = 5, 6, 7, 8Xi = V3 + ei; i = 9, 10whereas ei ~ N(0, 1) is indepependent for i = 1 , ..., 10
Value
A matrix of dimension n x sum (p) containing the generated sample data set.
Author(s)
Heinrich Fritz, Peter Filzmoser <<[email protected]>>
References
C. Croux, P. Filzmoser, H. Fritz (2011). Robust Sparse Principal Component Analysis Based onProjection-Pursuit, ?? To appear.
A. Farcomeni (2009). An exact approach to sparse principal component analysis, ComputationalStatistics, Vol. 24(4), pp. 583-604.
J. Guo, G. James, E. Levina, F. Michailidis, and J. Zhu (2010). Principal component analysis withsparse fused loadings, Journal of Computational and Graphical Statistics. To appear.
l1median 7
H. Zou, T. Hastie, R. Tibshirani (2006). Sparse principal component analysis, Journal of Computa-tional and Graphical Statistics, Vol. 15(2), pp. 265-286.
See Also
sPCAgrid, princomp
Examples
## data generationset.seed (0)x <- data.Zou ()
## applying PCApc <- princomp (x)
## the corresponding non-sparse loadingsunclass (pc$load[,1:3])pc$sdev[1:3]
## lambda as calculated in the opt.TPO - examplelambda <- c (0.23, 0.34, 0.005)
## applying sparse PCAspc <- sPCAgrid (x, k = 3, lambda = lambda, method = "sd")unclass (spc$load)spc$sdev[1:3]
## comparing the non-sparse and sparse biplotpar (mfrow = 1:2)biplot (pc, main = "non-sparse PCs")biplot (spc, main = "sparse PCs")
l1median Multivariate L1 Median
Description
Computes the multivariate L1 median (also called spatial median) of a data matrix.
Usage
l1median(X, MaxStep = 200, ItTol = 10^-8, trace = 0, m.init = .colMedians (X))
Arguments
X A matrix containing the values whose multivariate L1 median is to be computed.
MaxStep The maximum number of iterations.
ItTol Tolerance for convergence of the algorithm.
trace The tracing level.
m.init An initial estimate.

8 l1median_NLM
Value
returns the vector of the coordinates of the L1 median.
Author(s)
Heinrich Fritz, Peter Filzmoser <<[email protected]>>
References
C. Croux, P. Filzmoser, M. Oliveira, (2007). Algorithms for Projection-Pursuit Robust PrincipalComponent Analysis, Chemometrics and Intelligent Laboratory Systems, Vol. 87, pp. 218-225.
See Also
median
Examples
l1median(rnorm(100), trace = -1) # this returns the median of the sample
# multivariate data with outlierslibrary(mvtnorm)x <- rbind(rmvnorm(200, rep(0, 4), diag(c(1, 1, 2, 2))),
rmvnorm( 50, rep(3, 4), diag(rep(2, 4))))l1median(x, trace = -1)# compare with coordinate-wise median:apply(x,2,median)
l1median_NLM Multivariate L1 Median
Description
Computes the multivariate L1 median (also called spatial median) of a data matrix X.
Usage
l1median_NM (X, maxit = 200, tol = 10^-8, trace = 0,m.init = .colMedians (X), ...)
l1median_CG (X, maxit = 200, tol = 10^-8, trace = 0,m.init = .colMedians (X), ...)
l1median_BFGS (X, maxit = 200, tol = 10^-8, trace = 0,m.init = .colMedians (X), REPORT = 10, ...)
l1median_NLM (X, maxit = 200, tol = 10^-8, trace = 0,m.init = .colMedians (X), ...)
l1median_HoCr (X, maxit = 200, tol = 10^-8, zero.tol = 1e-15, trace = 0,m.init = .colMedians (X), ...)
l1median_VaZh (X, maxit = 200, tol = 10^-8, zero.tol = 1e-15, trace = 0,m.init = .colMedians (X), ...)

l1median_NLM 9
Arguments
X a matrix of dimension n x p.
maxit The maximum number of iterations to be performed.
tol The convergence tolerance.
trace The tracing level. Set trace > 0 to retrieve additional information on the singleiterations.
m.init A vector of length p containing the initial value of the L1-median.
REPORT A parameter internally passed to optim.
zero.tol The zero-tolerance level used in l1median_VaZh and l1median_HoCr for deter-mining the equality of two observations (i.e. an observation and a current centerestimate).
... Further parameters passed from other functions.
Details
The L1-median is computed using the built-in functions optim and nlm. These functions are a tran-script of the L1median method of package robustX (available at ftp://stat.ethz.ch/U/maechler/R/),porting as much code as possible into C++.
Value
par A vector of length p containing the L1-median.
value The value of the objective function ||X - l1median|| which is minimized forfinding the L1-median.
code The return code of the optimization algorithm. See optim and nlm for furtherinformation.
iterations The number of iterations performed.
iterations_gr When using a gradient function this value holds the number of times the gradienthad to be computed.
time The algorithms runtime in milliseconds.
Note
See the vignette "Compiling pcaPP for Matlab" which comes with this package to compile and usesome of these functions in Matlab.
Author(s)
Heinrich Fritz, Peter Filzmoser <<[email protected]>>
See Also
median

10 objplot
Examples
# multivariate data with outlierslibrary(mvtnorm)x <- rbind(rmvnorm(200, rep(0, 4), diag(c(1, 1, 2, 2))),
rmvnorm( 50, rep(3, 4), diag(rep(2, 4))))
l1median_NM (x)$parl1median_CG (x)$parl1median_BFGS (x)$parl1median_NLM (x)$parl1median_HoCr (x)$parl1median_VaZh (x)$par
# compare with coordinate-wise median:apply(x,2,median)
objplot Objective Function Plot for Sparse PCs
Description
Plots an objective function (TPO or BIC) of one or more sparse PCs for a series of lambdas.
Usage
objplot (x, k, ...)
Arguments
x An opt.TPO or opt.BIC object.
k This function displays the objective function’s values of the k-th component foropt.TPO-objects, or the first k components for opt.BIC-objects.
... Further arguments passed to or from other functions.
Details
This function operates on the return object of function opt.TPO or opt.BIC. The model (lambda)selected by the minimization of the corresponding criterion is highlighted by a dashed vertical line.
The component the argument k refers to, corresponds to the $pc.noord item of argument x. Formore info on the order of sparse PCs see the details section of opt.TPO.
Author(s)
Heinrich Fritz, Peter Filzmoser <<[email protected]>>

opt.TPO 11
References
C. Croux, P. Filzmoser, H. Fritz (2011). Robust Sparse Principal Component Analysis Based onProjection-Pursuit, ?? To appear.
See Also
sPCAgrid, princomp
Examples
set.seed (0)## generate test data
x <- data.Zou (n = 250)
k.max <- 3 ## max number of considered sparse PCs
## arguments for the sPCAgrid algorithmmaxiter <- 25 ## the maximum number of iterationsmethod <- "sd" ## using classical estimations
## Optimizing the TPO criterionoTPO <- opt.TPO (x, k.max = k.max, method = method, maxiter = maxiter)
## Optimizing the BIC criterionoBIC <- opt.BIC (x, k.max = k.max, method = method, maxiter = maxiter)
## Objective function vs. lambdapar (mfrow = c (2, k.max))for (i in 1:k.max) objplot (oTPO, k = i)for (i in 1:k.max) objplot (oBIC, k = i)
opt.TPO Model Selection for Sparse (Robust) Principal Components
Description
These functions compute a suggestion for the sparseness parameter lambda which is required byfunction sPCAgrid. A range of different values for lambda is tested and according to an objectivefunction, the best solution is selected. Two different approaches (TPO and BIC) are available,which is further discussed in the details section. A graphical summary of the optimization can beobtained by plotting the function’s return value (plot.opt.TPO, plot.opt.BIC for tradeoff curvesor objplot for an objective function plot).
Usage
opt.TPO (x, k.max = ncol (x), n.lambda = 30, lambda.max, ...)opt.BIC (x, k.max = ncol (x), n.lambda = 30, lambda.max, ...)
12 opt.TPO
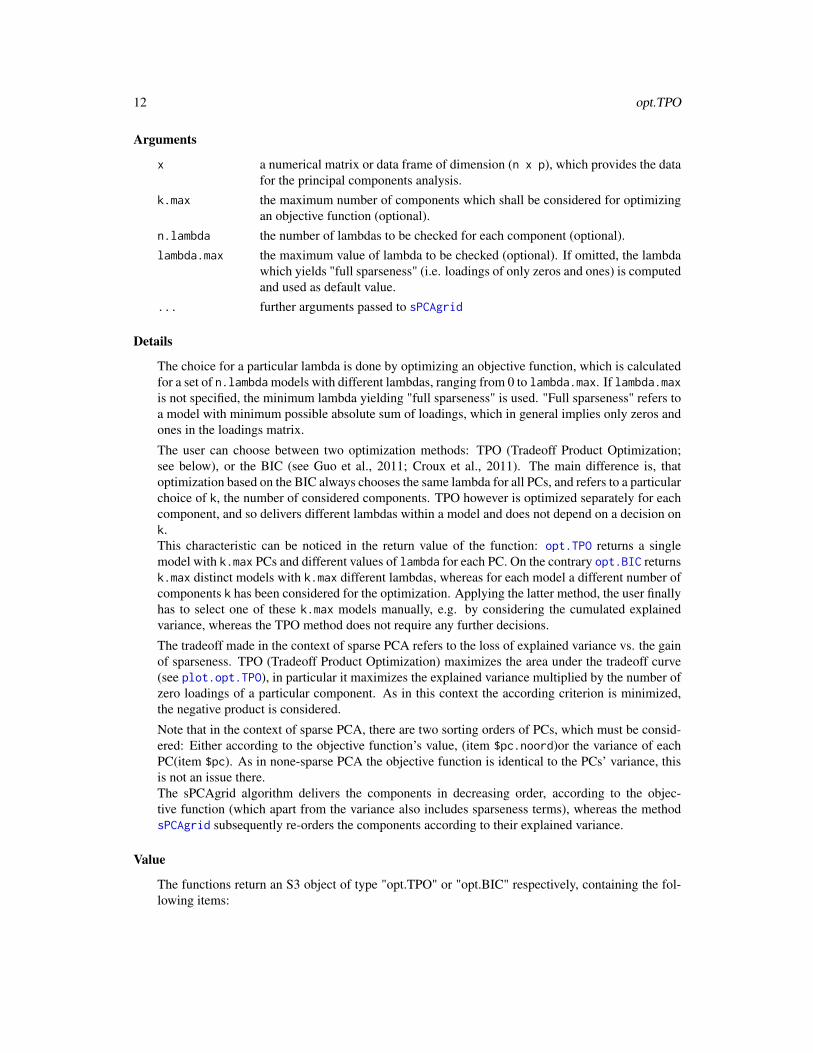
Arguments
x a numerical matrix or data frame of dimension (n x p), which provides the datafor the principal components analysis.
k.max the maximum number of components which shall be considered for optimizingan objective function (optional).
n.lambda the number of lambdas to be checked for each component (optional).lambda.max the maximum value of lambda to be checked (optional). If omitted, the lambda
which yields "full sparseness" (i.e. loadings of only zeros and ones) is computedand used as default value.
... further arguments passed to sPCAgrid
Details
The choice for a particular lambda is done by optimizing an objective function, which is calculatedfor a set of n.lambda models with different lambdas, ranging from 0 to lambda.max. If lambda.maxis not specified, the minimum lambda yielding "full sparseness" is used. "Full sparseness" refers toa model with minimum possible absolute sum of loadings, which in general implies only zeros andones in the loadings matrix.
The user can choose between two optimization methods: TPO (Tradeoff Product Optimization;see below), or the BIC (see Guo et al., 2011; Croux et al., 2011). The main difference is, thatoptimization based on the BIC always chooses the same lambda for all PCs, and refers to a particularchoice of k, the number of considered components. TPO however is optimized separately for eachcomponent, and so delivers different lambdas within a model and does not depend on a decision onk.This characteristic can be noticed in the return value of the function: opt.TPO returns a singlemodel with k.max PCs and different values of lambda for each PC. On the contrary opt.BIC returnsk.max distinct models with k.max different lambdas, whereas for each model a different number ofcomponents k has been considered for the optimization. Applying the latter method, the user finallyhas to select one of these k.max models manually, e.g. by considering the cumulated explainedvariance, whereas the TPO method does not require any further decisions.
The tradeoff made in the context of sparse PCA refers to the loss of explained variance vs. the gainof sparseness. TPO (Tradeoff Product Optimization) maximizes the area under the tradeoff curve(see plot.opt.TPO), in particular it maximizes the explained variance multiplied by the number ofzero loadings of a particular component. As in this context the according criterion is minimized,the negative product is considered.
Note that in the context of sparse PCA, there are two sorting orders of PCs, which must be consid-ered: Either according to the objective function’s value, (item $pc.noord)or the variance of eachPC(item $pc). As in none-sparse PCA the objective function is identical to the PCs’ variance, thisis not an issue there.The sPCAgrid algorithm delivers the components in decreasing order, according to the objec-tive function (which apart from the variance also includes sparseness terms), whereas the methodsPCAgrid subsequently re-orders the components according to their explained variance.
Value
The functions return an S3 object of type "opt.TPO" or "opt.BIC" respectively, containing the fol-lowing items:
opt.TPO 13
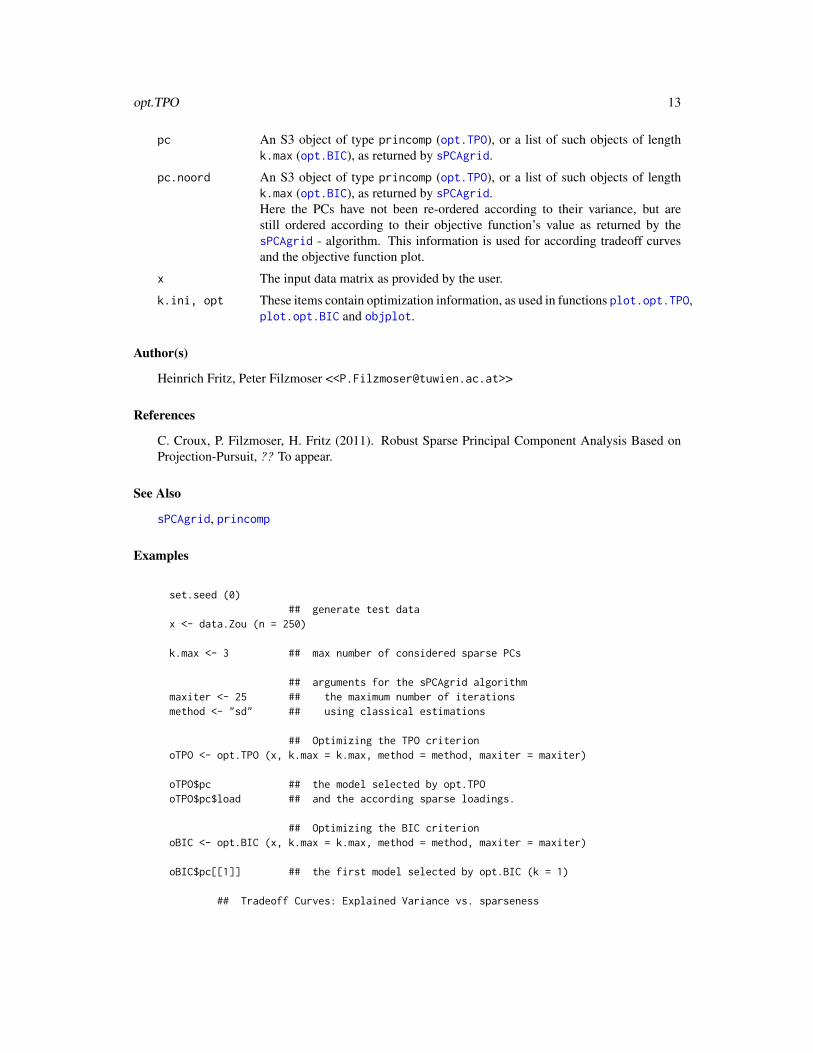
pc An S3 object of type princomp (opt.TPO), or a list of such objects of lengthk.max (opt.BIC), as returned by sPCAgrid.
pc.noord An S3 object of type princomp (opt.TPO), or a list of such objects of lengthk.max (opt.BIC), as returned by sPCAgrid.Here the PCs have not been re-ordered according to their variance, but arestill ordered according to their objective function’s value as returned by thesPCAgrid - algorithm. This information is used for according tradeoff curvesand the objective function plot.
x The input data matrix as provided by the user.
k.ini, opt These items contain optimization information, as used in functions plot.opt.TPO,plot.opt.BIC and objplot.
Author(s)
Heinrich Fritz, Peter Filzmoser <<[email protected]>>
References
C. Croux, P. Filzmoser, H. Fritz (2011). Robust Sparse Principal Component Analysis Based onProjection-Pursuit, ?? To appear.
See Also
sPCAgrid, princomp
Examples
set.seed (0)## generate test data
x <- data.Zou (n = 250)
k.max <- 3 ## max number of considered sparse PCs
## arguments for the sPCAgrid algorithmmaxiter <- 25 ## the maximum number of iterationsmethod <- "sd" ## using classical estimations
## Optimizing the TPO criterionoTPO <- opt.TPO (x, k.max = k.max, method = method, maxiter = maxiter)
oTPO$pc ## the model selected by opt.TPOoTPO$pc$load ## and the according sparse loadings.
## Optimizing the BIC criterionoBIC <- opt.BIC (x, k.max = k.max, method = method, maxiter = maxiter)
oBIC$pc[[1]] ## the first model selected by opt.BIC (k = 1)
## Tradeoff Curves: Explained Variance vs. sparseness

14 PCAgrid
par (mfrow = c (2, k.max))for (i in 1:k.max) plot (oTPO, k = i)for (i in 1:k.max) plot (oBIC, k = i)
## Tradeoff Curves: Explained Variance vs. lambdapar (mfrow = c (2, k.max))for (i in 1:k.max) plot (oTPO, k = i, f.x = "lambda")for (i in 1:k.max) plot (oBIC, k = i, f.x = "lambda")
## Objective function vs. lambdapar (mfrow = c (2, k.max))for (i in 1:k.max) objplot (oTPO, k = i)for (i in 1:k.max) objplot (oBIC, k = i)
PCAgrid (Sparse) Robust Principal Components using the Grid search algo-rithm
Description
Computes a desired number of (sparse) (robust) principal components using the grid search algo-rithm in the plane. The global optimum of the objective function is searched in planes, not in thep-dimensional space, using regular grids in these planes.
Usage
PCAgrid (x, k = 2, method = c ("mad", "sd", "qn"),maxiter = 10, splitcircle = 25, scores = TRUE, zero.tol = 1e-16,
center = l1median, scale, trace = 0, store.call = TRUE, control, ...)
sPCAgrid (x, k = 2, method = c ("mad", "sd", "qn"), lambda = 1,maxiter = 10, splitcircle = 25, scores = TRUE, zero.tol = 1e-16,
center = l1median, scale, trace = 0, store.call = TRUE, control, ...)
Arguments
x a numerical matrix or data frame of dimension (n x p)which provides the datafor the principal components analysis.
k the desired number of components to compute
method the scale estimator used to detect the direction with the largest variance. Possiblevalues are "sd", "mad" and "qn", the latter can be called "Qn" too. "mad" is thedefault value.
lambda the sparseness constraint’s strength(sPCAgrid only). A single value for all com-ponents, or a vector of length k with different values for each component can bespecified. See opt.TPO for the choice of this argument.
maxiter the maximum number of iterations.

PCAgrid 15
splitcircle the number of directions in which the algorithm should search for the largestvariance. The direction with the largest variance is searched for in the directionsdefined by a number of equally spaced points on the unit circle. This argumentdetermines, how many such points are used to split the unit circle.
scores A logical value indicating whether the scores of the principal component shouldbe calculated.
zero.tol the zero tolerance used internally for checking convergence, etc.
center this argument indicates how the data is to be centered. It can be a function likemean or median or a vector of length ncol(x) containing the center value ofeach column.
scale this argument indicates how the data is to be rescaled. It can be a function like sdor mad or a vector of length ncol(x) containing the scale value of each column.
trace an integer value >= 0, specifying the tracing level.
store.call a logical variable, specifying whether the function call shall be stored in theresult structure.
control a list which elements must be the same as (or a subset of) the parameters above.If the control object is supplied, the parameters from it will be used and anyother given parameters are overridden.
... further arguments passed to or from other functions.
Details
In contrast to PCAgrid, the function sPCAgrid computes sparse principal components. The strengthof the applied sparseness constraint is specified by argument lambda.
Similar to the function princomp, there is a print method for the these objects that prints the resultsin a nice format and the plot method produces a scree plot (screeplot). There is also a biplotmethod.
Angle halving is an extension of the original algorithm. In the original algorithm, the search direc-tions are determined by a number of points on the unit circle in the interval [-pi/2 ; pi/2). Anglehalving means this angle is halved in each iteration, eg. for the first approximation, the above men-tioned angle is used, for the second approximation, the angle is halved to [-pi/4 ; pi/4) and so on.This usually gives better results with less iterations needed.NOTE: in previous implementations angle halving could be suppressed by the former argument"anglehalving". This still can be done by setting argument maxiter = 0.
Value
The function returns an object of class "princomp", i.e. a list similar to the output of the functionprincomp.
sdev the (robust) standard deviations of the principal components.
loadings the matrix of variable loadings (i.e., a matrix whose columns contain the eigen-vectors). This is of class "loadings": see loadings for its print method.
center the means that were subtracted.
scale the scalings applied to each variable.

16 PCAgrid
n.obs the number of observations.
scores if scores = TRUE, the scores of the supplied data on the principal components.
call the matched call.
obj A vector containing the objective functions values. For function PCAgrid this isthe same as sdev.
lambda The lambda each component has been calculated with (sPCAgrid only).
Note
See the vignette "Compiling pcaPP for Matlab" which comes with this package to compile and usethese functions in Matlab.
Author(s)
Heinrich Fritz, Peter Filzmoser <<[email protected]>>
References
C. Croux, P. Filzmoser, M. Oliveira, (2007). Algorithms for Projection-Pursuit Robust PrincipalComponent Analysis, Chemometrics and Intelligent Laboratory Systems, Vol. 87, pp. 218-225.
C. Croux, P. Filzmoser, H. Fritz (2011). Robust Sparse Principal Component Analysis Based onProjection-Pursuit, ?? To appear.
See Also
PCAproj, princomp
Examples
# multivariate data with outlierslibrary(mvtnorm)x <- rbind(rmvnorm(200, rep(0, 6), diag(c(5, rep(1,5)))),
rmvnorm( 15, c(0, rep(20, 5)), diag(rep(1, 6))))# Here we calculate the principal components with PCAgridpc <- PCAgrid(x)# we could draw a biplot too:biplot(pc)# now we want to compare the results with the non-robust principal componentspc <- princomp(x)# again, a biplot for comparison:biplot(pc)
## Sparse loadingsset.seed (0)x <- data.Zou ()
## applying PCApc <- princomp (x)
## the corresponding non-sparse loadingsunclass (pc$load[,1:3])
PCAproj 17
pc$sdev[1:3]
## lambda as calculated in the opt.TPO - examplelambda <- c (0.23, 0.34, 0.005)
## applying sparse PCAspc <- sPCAgrid (x, k = 3, lambda = lambda, method = "sd")unclass (spc$load)spc$sdev[1:3]
## comparing the non-sparse and sparse biplotpar (mfrow = 1:2)biplot (pc, main = "non-sparse PCs")biplot (spc, main = "sparse PCs")
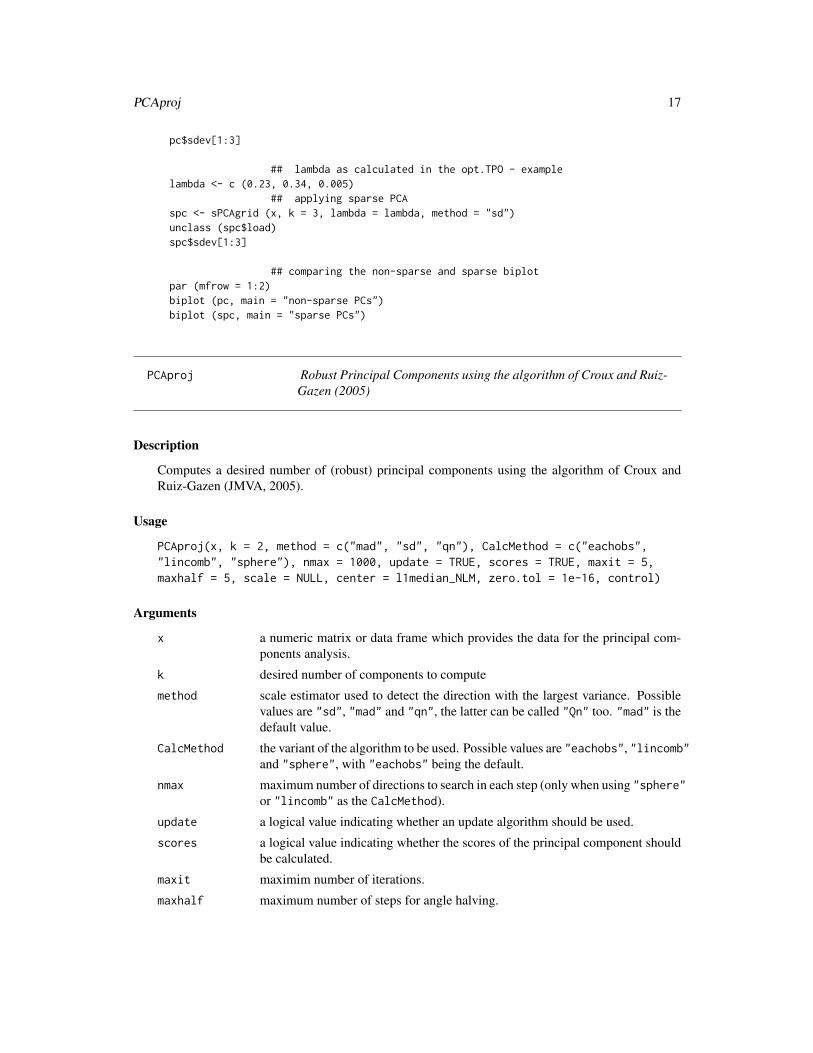
PCAproj Robust Principal Components using the algorithm of Croux and Ruiz-Gazen (2005)
Description
Computes a desired number of (robust) principal components using the algorithm of Croux andRuiz-Gazen (JMVA, 2005).
Usage
PCAproj(x, k = 2, method = c("mad", "sd", "qn"), CalcMethod = c("eachobs","lincomb", "sphere"), nmax = 1000, update = TRUE, scores = TRUE, maxit = 5,maxhalf = 5, scale = NULL, center = l1median_NLM, zero.tol = 1e-16, control)
Arguments
x a numeric matrix or data frame which provides the data for the principal com-ponents analysis.
k desired number of components to compute
method scale estimator used to detect the direction with the largest variance. Possiblevalues are "sd", "mad" and "qn", the latter can be called "Qn" too. "mad" is thedefault value.
CalcMethod the variant of the algorithm to be used. Possible values are "eachobs", "lincomb"and "sphere", with "eachobs" being the default.
nmax maximum number of directions to search in each step (only when using "sphere"or "lincomb" as the CalcMethod).
update a logical value indicating whether an update algorithm should be used.
scores a logical value indicating whether the scores of the principal component shouldbe calculated.
maxit maximim number of iterations.
maxhalf maximum number of steps for angle halving.
18 PCAproj
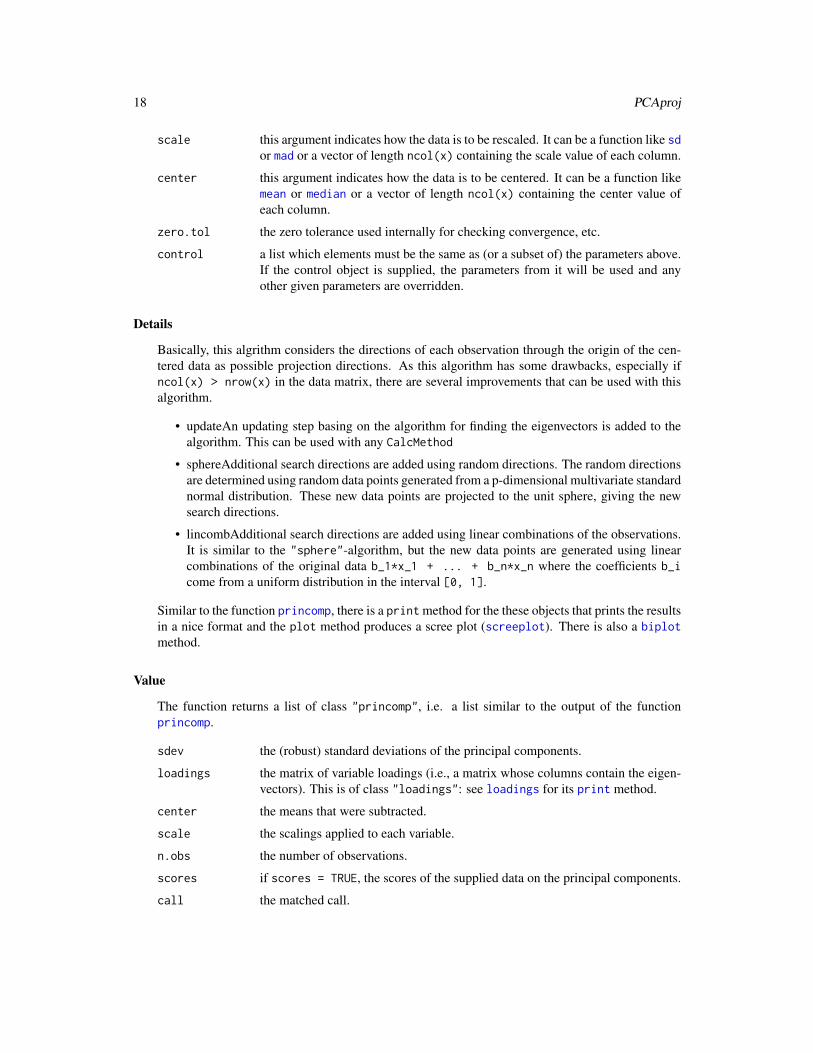
scale this argument indicates how the data is to be rescaled. It can be a function like sdor mad or a vector of length ncol(x) containing the scale value of each column.
center this argument indicates how the data is to be centered. It can be a function likemean or median or a vector of length ncol(x) containing the center value ofeach column.
zero.tol the zero tolerance used internally for checking convergence, etc.
control a list which elements must be the same as (or a subset of) the parameters above.If the control object is supplied, the parameters from it will be used and anyother given parameters are overridden.
Details
Basically, this algrithm considers the directions of each observation through the origin of the cen-tered data as possible projection directions. As this algorithm has some drawbacks, especially ifncol(x) > nrow(x) in the data matrix, there are several improvements that can be used with thisalgorithm.
• updateAn updating step basing on the algorithm for finding the eigenvectors is added to thealgorithm. This can be used with any CalcMethod
• sphereAdditional search directions are added using random directions. The random directionsare determined using random data points generated from a p-dimensional multivariate standardnormal distribution. These new data points are projected to the unit sphere, giving the newsearch directions.
• lincombAdditional search directions are added using linear combinations of the observations.It is similar to the "sphere"-algorithm, but the new data points are generated using linearcombinations of the original data b_1*x_1 + ... + b_n*x_n where the coefficients b_icome from a uniform distribution in the interval [0, 1].
Similar to the function princomp, there is a print method for the these objects that prints the resultsin a nice format and the plot method produces a scree plot (screeplot). There is also a biplotmethod.
Value
The function returns a list of class "princomp", i.e. a list similar to the output of the functionprincomp.
sdev the (robust) standard deviations of the principal components.
loadings the matrix of variable loadings (i.e., a matrix whose columns contain the eigen-vectors). This is of class "loadings": see loadings for its print method.
center the means that were subtracted.
scale the scalings applied to each variable.
n.obs the number of observations.
scores if scores = TRUE, the scores of the supplied data on the principal components.
call the matched call.

PCdiagplot 19
Author(s)
Heinrich Fritz, Peter Filzmoser <<[email protected]>>
References
C. Croux, P. Filzmoser, M. Oliveira, (2007). Algorithms for Projection-Pursuit Robust PrincipalComponent Analysis, Chemometrics and Intelligent Laboratory Systems, Vol. 87, pp. 218-225.
See Also
PCAgrid, ScaleAdv, princomp
Examples
# multivariate data with outlierslibrary(mvtnorm)x <- rbind(rmvnorm(200, rep(0, 6), diag(c(5, rep(1,5)))),
rmvnorm( 15, c(0, rep(20, 5)), diag(rep(1, 6))))# Here we calculate the principal components with PCAgridpc <- PCAproj(x, 6)# we could draw a biplot too:biplot(pc)
# we could use another calculation method and another objective function, and# maybe only calculate the first three principal components:pc <- PCAproj(x, 3, "qn", "sphere")biplot(pc)
# now we want to compare the results with the non-robust principal componentspc <- princomp(x)# again, a biplot for comparision:biplot(pc)
PCdiagplot Diagnostic plot for principal components
Description
Computes Orthogonal Distances (OD) and Score Distances (SD) for already computed principalcomponents using the projection pursuit technique.
Usage
PCdiagplot(x, PCobj, crit = c(0.975, 0.99, 0.999), ksel = NULL, plot = TRUE,plotbw = TRUE, raw = FALSE, colgrid = "black", ...)

20 PCdiagplot
Arguments
x a numeric matrix or data frame which provides the data for the principal com-ponents analysis.
PCobj a PCA object resulting from PCAproj or PCAgrid
crit quantile(s) used for the critical value(s) for OD and SD
ksel range for the number of PCs to be used in the plot; if NULL all PCs providedare used
plot if TRUE a plot is generated, otherwise only the values are returned
plotbw if TRUE the plot uses gray, otherwise color representation
raw if FALSE, the distribution of the SD will be transformed to approach chisquaredistribution, otherwise the raw values are reported and used for plotting
colgrid the color used for the grid lines in the plot
... additional graphics parameters as used in par
Details
Based on (robust) principal components, a diagnostics plot is made using Orthogonal Distance (OD)and Score Distance (SD). This plot can provide important information about the multivariate datastructure.
Value
ODist matrix with OD for each observation (rows) and each selected PC (cols)
SDist matrix with SD for each observation (rows) and each selected PC (cols)
critOD matrix with critical values for OD for each selected PC (rows) and each criticalvalue (cols)
critSD matrix with critical values for SD for each selected PC (rows) and each criticalvalue (cols)
Author(s)
Peter Filzmoser <<[email protected]>>
References
P. Filzmoser and H. Fritz (2007). Exploring high-dimensional data with robust principal compo-nents. In S. Aivazian, P. Filzmoser, and Yu. Kharin, editors, Proceedings of the Eighth InternationalConference on Computer Data Analysis and Modeling, volume 1, pp. 43-50, Belarusian State Uni-versity, Minsk.
M. Hubert, P.J. Rousseeuwm, K. Vanden Branden (2005). ROBCA: a new approach to robustprincipal component analysis Technometrics 47, pp. 64-79.
See Also
PCAproj, PCAgrid

plot.opt.TPO 21
Examples
# multivariate data with outlierslibrary(mvtnorm)x <- rbind(rmvnorm(85, rep(0, 6), diag(c(5, rep(1,5)))),
rmvnorm( 15, c(0, rep(20, 5)), diag(rep(1, 6))))# Here we calculate the principal components with PCAgridpcrob <- PCAgrid(x, k=6)resrob <- PCdiagplot(x,pcrob,plotbw=FALSE)
# compare with classical method:pcclass <- PCAgrid(x, k=6, method="sd")resclass <- PCdiagplot(x,pcclass,plotbw=FALSE)
plot.opt.TPO Tradeoff Curves for Sparse PCs
Description
Tradeoff curves of one or more sparse PCs for a series of lambdas, which contrast the loss ofexplained variance and the gain of sparseness.
Usage
## S3 method for class 'opt.TPO'plot(x, k, f.x = c ("l0", "pl0", "l1", "pl1", "lambda"),
f.y = c ("var", "pvar"), ...)## S3 method for class 'opt.BIC'plot(x, k, f.x = c ("l0", "pl0", "l1", "pl1", "lambda"),
f.y = c ("var", "pvar"), ...)
Arguments
x An opt.TPO or opt.BIC object.
k This function plots the tradeoff curve of the k-th component for opt.TPO-objects,or the first k components for opt.BIC-objects.
f.x, f.y A string, specifying which information shall be plotted on the x and y - axis.See the details section for more information.
... Further arguments passed to or from other functions.
Details
The argument f.x can obtain the following values:
• "l0": l0 - sparseness, which corresponds to the number of zero loadings of the consideredcomponent(s).
• "pl0": l0 - sparseness in percent (l0 - sparseness ranges from 0 to p-1 for each component).

22 plot.opt.TPO
• "l1": l1 - sparseness, which corresponds to the negative sum of absolute loadings of theconsidered component(s).(The exact value displayed for a single component is sqrt (p) - S, with S as the the absolutesum of loadings.)As this value is a part of the objective function which selects the candidate directions withinthe sPCAgrid function, this option is provided here.
• "pl1" The "l1 - sparseness" in percent (l1 - sparseness ranges from 0 to sqrt (p-1) for eachcomponent).
• "lambda": The lambda used for computing a particular model.
The argument f.y can obtain the following values:
• "var": The (cumulated) explained variance of the considered component(s). The value shownhere is calculated using the variance estimator specified via the method argument of functionsPCAgrid.
• "pvar": The (cumulated) explained variance of the considered component(s) in percent. The100%-level is assumed as the sum of variances of all columns of argument x.Again the same variance estimator is used as specified via the method argument of functionsPCAgrid.
The subtitle summarizes the result of the applied criterion for selecting a value of lambda:
• The name of the applied method (TPO/BIC).
• The selected value of lambda for the k-th component (opt.TPO) or all computed components(opt.BIC).
• The empirical cumulated variance (ECV) of the first k components in percent.
• The obtained l0-sparseness of the first k components.
This function operates on the return object of function opt.TPO or opt.BIC. The model (lambda)selected by the minimization of the corresponding criterion is highlighted by a dashed vertical line.
The component the argument k refers to, corresponds to the $pc.noord item of argument x. Formore info on the order of sparse PCs see the details section of opt.TPO.
Author(s)
Heinrich Fritz, Peter Filzmoser <<[email protected]>>
References
C. Croux, P. Filzmoser, H. Fritz (2011). Robust Sparse Principal Component Analysis Based onProjection-Pursuit, ?? To appear.
See Also
sPCAgrid, princomp
plotcov 23
Examples
set.seed (0)## generate test data
x <- data.Zou (n = 250)
k.max <- 3 ## max number of considered sparse PCs
## arguments for the sPCAgrid algorithmmaxiter <- 25 ## the maximum number of iterationsmethod <- "sd" ## using classical estimations
## Optimizing the TPO criterionoTPO <- opt.TPO (x, k.max = k.max, method = method, maxiter = maxiter)
## Optimizing the BIC criterionoBIC <- opt.BIC (x, k.max = k.max, method = method, maxiter = maxiter)
## Tradeoff Curves: Explained Variance vs. sparsenesspar (mfrow = c (2, k.max))for (i in 1:k.max) plot (oTPO, k = i)for (i in 1:k.max) plot (oBIC, k = i)
## Explained Variance vs. lambdapar (mfrow = c (2, k.max))for (i in 1:k.max) plot (oTPO, k = i, f.x = "lambda")for (i in 1:k.max) plot (oBIC, k = i, f.x = "lambda")
plotcov Compare two Covariance Matrices in Plots
Description
allows a direct comparison of two estimations of the covariance matrix (e.g. resulting from covPC)in a plot.
Usage
plotcov(cov1, cov2, method1, labels1, method2, labels2, ndigits, ...)
Arguments
cov1 a covariance matrix (from cov, covMcd, covPC, covPCAgrid, covPCAproj, etc.
cov2 a covariance matrix (from cov, covMcd, covPC, covPCAgrid, covPCAproj, etc.
method1 legend for ellipses of estimation method1
method2 legend for ellipses of estimation method2
labels1 legend for numbers of estimation method1

24 qn
labels2 legend for numbers of estimation method2
ndigits number of digits to use for printing covariances, by default ndigits=4
... additional arguments for text or plot
Details
Since (robust) PCA can be used to re-compute the (robust) covariance matrix, one might be inter-ested to compare two different methods of covariance estimation visually. This routine takes asinput objects for the covariances to compare the output of cov, but also the return objects fromcovPCAgrid, covPCAproj, covPC, and covMcd. The comparison of the two covariance matrices isdone by numbers (the covariances) and by ellipses.
Value
only the plot is generated
Author(s)
Heinrich Fritz, Peter Filzmoser <<[email protected]>>
References
C. Croux, P. Filzmoser, M. Oliveira, (2007). Algorithms for Projection-Pursuit Robust PrincipalComponent Analysis, Chemometrics and Intelligent Laboratory Systems, Vol. 87, pp. 218-225.
See Also
PCAgrid, PCAproj, princomp
Examples
# multivariate data with outlierslibrary(mvtnorm)x <- rbind(rmvnorm(200, rep(0, 6), diag(c(5, rep(1,5)))),
rmvnorm( 15, c(0, rep(20, 5)), diag(rep(1, 6))))plotcov(covPCAproj(x),covPCAgrid(x))
qn scale estimation using the robust Qn estimator
Description
Returns a scale estimation as calculated by the (robust) Qn estimator.
Usage
qn(x, corrFact)

qn 25
Arguments
x a vector of data
corrFact the finite sample bias correction factor. By default a value of ~ 2.219144 is used(assuming normality).
Details
The Qn estimator computes the first quartile of the pairwise absolute differences of all data values.
Value
The estimated scale of the data.
Warning
Earlier implementations used a wrong correction factor for the final result. Thus qn estimationscomputed with package pcaPP version > 1.8-1 differ about 0.12% from earlier estimations (version<= 1.8-1).
Note
See the vignette "Compiling pcaPP for Matlab" which comes with this package to compile and usethis function in Matlab.
Author(s)
Heinrich Fritz, Peter Filzmoser <<[email protected]>>
References
P.J. Rousseeuw, C. Croux (1993) Alternatives to the Median Absolute Deviation, JASA, 88, 1273-1283.
See Also
mad
Examples
# data with outliersx <- c(rnorm(100), rnorm(10, 10))qn(x)

26 ScaleAdv
ScaleAdv centers and rescales data
Description
Data is centered and rescaled (to have mean 0 and a standard deviation of 1).
Usage
ScaleAdv(x, center = mean, scale = sd)
Arguments
x matrix containing the observations. If this is not a matrix, but a data frame, itis automatically converted into a matrix using the function as.matrix. In anyother case, (eg. a vector) it is converted into a matrix with one single column.
center this argument indicates how the data is to be centered. It can be a function likemean or median or a vector of length ncol(x) containing the center value ofeach column.
scale this argument indicates how the data is to be rescaled. It can be a function like sdor mad or a vector of length ncol(x) containing the scale value of each column.
Details
The default scale being NULL means that no rescaling is done.
Value
The function returns a list containing
x centered and rescaled data matrix.
center a vector of the centers of each column x. If you add to each column of x the ap-propriate value from center, you will obtain the data with the original locationof the observations.
scale a vector of the scale factors of each column x. If you multiply each column of xby the appropriate value from scale, you will obtain the data with the originalscales.
Author(s)
Heinrich Fritz, Peter Filzmoser <<[email protected]>>
References
C. Croux, P. Filzmoser, M. Oliveira, (2007). Algorithms for Projection-Pursuit Robust PrincipalComponent Analysis, Chemometrics and Intelligent Laboratory Systems, Vol. 87, pp. 218-225.

ScaleAdv 27
Examples
x <- rnorm(100, 10, 5)x <- ScaleAdv(x)$x
# can be used with multivariate data toolibrary(mvtnorm)x <- rmvnorm(100, 3:7, diag((7:3)^2))res <- ScaleAdv(x, center = l1median, scale = mad)res
# instead of using an estimator, you could specify the center and scale yourself toox <- rmvnorm(100, 3:7, diag((7:3)^2))res <- ScaleAdv(x, 3:7, 7:3)res

Index
∗Topic multivariatecor.fk, 2covPC, 3covPCA, 4data.Zou, 6l1median, 7l1median_NLM, 8objplot, 10opt.TPO, 11PCAgrid, 14PCAproj, 17plot.opt.TPO, 21plotcov, 23qn, 24ScaleAdv, 26
∗Topic robustcor.fk, 2covPCA, 4data.Zou, 6l1median, 7l1median_NLM, 8objplot, 10opt.TPO, 11PCAgrid, 14PCAproj, 17PCdiagplot, 19plot.opt.TPO, 21qn, 24
as.matrix, 26
biplot, 18
cor, 2cor.fk, 2cov, 24covMcd, 24covPC, 3, 24covPCA, 4covPCAgrid, 24
covPCAgrid (covPCA), 4covPCAproj, 24covPCAproj (covPCA), 4
data.Zou, 6
l1median, 7l1median_BFGS (l1median_NLM), 8l1median_CG (l1median_NLM), 8l1median_HoCr (l1median_NLM), 8l1median_NLM, 8l1median_NM (l1median_NLM), 8l1median_VaZh (l1median_NLM), 8loadings, 15, 18
mad, 15, 18, 25, 26mean, 15, 18, 26median, 8, 9, 15, 18, 26
nlm, 9
objplot, 10, 11, 13opt.BIC, 10, 12, 13, 21, 22opt.BIC (opt.TPO), 11opt.TPO, 10, 11, 12–14, 21, 22optim, 9
par, 20PCAgrid, 4, 5, 14, 19, 20, 24PCAproj, 4, 5, 16, 17, 20, 24PCdiagplot, 19plot.opt.BIC, 11, 13plot.opt.BIC (plot.opt.TPO), 21plot.opt.TPO, 11–13, 21plotcov, 23princomp, 4, 5, 7, 11, 13, 15, 16, 18, 19, 22, 24print, 15, 18
qn, 24
ScaleAdv, 5, 19, 26
28

INDEX 29
screeplot, 15, 18sd, 15, 18, 26sPCAgrid, 7, 11–13, 16, 22sPCAgrid (PCAgrid), 14