pai settlements - pjm
TRANSCRIPT

For Public Use
PAI Settlements Appendix to “A Review of the October 2019 Performance Assessment Event” Market Implementation Committee March 2020

PAI Settlements
PJM © 2020 www.pjm.com | For Public Use i | P a g e
This page is intentionally left blank.

PAI Settlements
PJM © 2020 www.pjm.com | For Public Use ii | P a g e
Contents
Performance Assessment Interval Settlements ........................................................................................................ 1
Purpose .................................................................................................................................................................... 1 Background .............................................................................................................................................................. 1 Balancing Ratio ........................................................................................................................................................ 2 Performance Shortfall ............................................................................................................................................. 4 Excusals ................................................................................................................................................................... 7 Non-Performance Charges ................................................................................................................................... 11 Bonus Performance ............................................................................................................................................... 13 Demand Response Performance .......................................................................................................................... 16 Settlement Billing Timelines ................................................................................................................................. 17

PAI Settlements
www.pjm.com | For Public Use 1 | P a g e
Performance Assessment Interval Settlements
Purpose The purpose of this document is to provide more detail on the process and evaluation for penalties and bonuses associated with the Performance Assessment Intervals (PAIs) on Oct. 2, 2019, and provide data regarding the market settlement.
In November 2019, PJM released a paper “A Review of the October 2019 Performance Assessment Event,” detailing the operational events leading up to and during the Oct. 2 performance assessment event and recommendations for further consideration.
Background The Pre-Emergency Load Management Reduction Action issued on Oct. 2, 2019, triggered Performance Assessment Intervals (PAIs) that require PJM to evaluate the performance of all resources located in the Emergency Action area for each applicable five-minute interval. The Emergency Action areas for the Oct. 2, 2019 performance assessment event spanned AEP, BGE, DOM and PEPCO for the intervals designated in Table 1. Throughout this paper, some data will be looked at on a five-minute interval basis, which will be described as a PAI, and some data will be looked at across the aggregate PAIs, from 1400–1600 EDT, which will be denoted as the performance assessment event.
Impacted Zones for Performance Assessment Event
Zones Performance Assessment Intervals
AEP, BGE, DOM, PEPCO 1400–1545
AEP 1545–1600
The resources located in the above areas that were evaluated for this performance assessment event include:
• Generation: All generation resources, inclusive of Capacity Performance (CP) and base capacity resources, energy-only resources and regulation-only resources.
• Demand Response: All pre-emergency CP and base demand response (DR) with two-hour lead time dispatched by PJM, economic DR and regulation-only DR.
• Energy Efficiency: All annual energy efficiency resources.

PAI Settlements
PJM © 2020 www.pjm.com | For Public Use 2 | P a g e
Current capacity market rules exclude some resources located in the impacted zones from PAI evaluations, which include pseudo-tie units modeled in the area and base energy efficiency resources.1
All resources are evaluated for the performance assessment event and are included in the calculations for total performance, balancing ratio and bonus eligibility; however, only the resources with a CP commitment are subject to performance assessment penalties.
Based on the resource’s performance and capacity commitment, resources may be assessed non-performance charges or bonus performance credits. Non-performance is determined based on the response of resources to fulfill their capacity commitments during each five-minute PAI, and there is no netting permitted across intervals. The shortfall or excess is calculated separately for each resource and each interval. Resources with a shortfall, or delivered energy (or reduction) less than expected based on the capacity commitment, are assessed a financial penalty; while resources demonstrating excess performance, or delivery of energy (or reduction) greater than expected based on the capacity commitment, are eligible for bonus payments.
Resources that have been committed to a Fixed Resource Requirement (FRR) plan also have the option to elect the physical non-performance assessment option. Entities that elect the FRR physical option are not assessed non-performance charges and are not eligible for bonus performance credits for any performance associated with their FRR commitments. Instead, these entities must commit an additional megawatt quantity to their FRR capacity plan for the next delivery year in an amount equal to the sum of the net positive shortfalls for resources committed to their FRR plan, multiplied by the FRR physical penalty rate across all five-minute intervals in the performance assessment event.
Balancing Ratio For each PAI, PJM calculates a balancing ratio which represents the percentage share of total generation capacity commitments needed to support the load and reserves on the system within the Emergency Action area during that interval. This balancing ratio is then used to set the expected performance level of generation CP resources within the Emergency Action area for each PAI.
Balancing ratio is calculated as:
Balancing Ratio (BR) = (Total Actual Generation and Storage Performance + Net Energy Imports + DR Bonus Performance) / All Generation and Storage Committed UCAP
Where:
1 Prior to the 2020/2021 Delivery Year, pseudo-tie units are included in the assessment only if the Emergency Action area for PAI is PJM-wide. Base energy efficiency resources are not included in the assessment of PAIs that occur outside of the summer months of June through September.

PAI Settlements
PJM © 2020 www.pjm.com | For Public Use 3 | P a g e
• Total actual generation and storage performance is the actual metered output of the resources from PowerMeter adjusted for the real-time regulation or reserves assignment.
• Net energy imports are the net energy import quantity during the event reported in ExSchedule. Since the Oct. 2 performance assessment event was not RTO-wide, net energy imports are 0 MW.
• DR bonus performance is the net bonus megawatts for over-performing Curtailment Service Providers (CSP).
• All generation and storage-committed UCAP are the sum of the CP commitment UCAP value for all Reliability Pricing Model (RPM) generation resources included in the assessment.
The balancing ratio is expected to align with the system demands during the Emergency Action period. The peak demand on Oct. 2 was 126,000 MW; while this is a high load for the month of October, it is lower than the PJM peak load forecast which is used to establish the RPM reliability requirement (~165,000 MW). The RPM reliability requirement is established as the amount of capacity resources that are required to serve the forecast peak load and installed reserve margin to satisfy the PJM reliability criteria. As a result, it would be expected that the balancing ratio would be less than one, because the demand during the PAIs was significantly below the total committed capacity for those intervals. The average balancing ratio over the performance assessment event on Oct. 2 was 75 percent. The individual interval balancing ratios for each PAI are available in Table 2.
Balancing Ratio for Performance Assessment Intervals on Oct. 2
PAI Balancing Ratio 1400 72.62% 1405 73.05% 1410 73.55% 1415 74.13% 1420 74.28% 1425 74.19% 1430 74.42% 1435 74.45% 1440 74.66% 1445 74.78% 1450 74.54% 1455 74.55% 1500 74.14% 1505 73.91%

PAI Settlements
PJM © 2020 www.pjm.com | For Public Use 4 | P a g e
PAI Balancing Ratio 1510 74.16% 1515 73.89% 1520 73.51% 1525 73.18% 1530 73.24% 1535 73.43% 1540 73.88% 1545 80.20% 1550 80.00% 1555 80.42%
Performance Shortfall Non-performance is measured by comparing a resource’s actual performance to their expected performance to calculate a performance shortfall. This performance shortfall represents the amount of the committed capacity from the resource that was needed during the event but was not delivered to the system. The performance shortfall is calculated as: expected performance minus actual performance.
The expected performance of a resource is its CP commitment, adjusted by the balancing ratio (for generation) to account for the megawatts needed during the PAI. The actual performance of a resource is defined as the output of the resource during the event, accounting for both energy and ancillary services. The energy output is accounted for by the metered output of the resource. Ancillary services are accounted for based on the real-time regulation or reserves on the resource. The calculation for the ancillary services is intended to ensure the actual performance captures the resource’s performance up to their economic basepoint, even if they were moved off that dispatch point in order to provide the ancillary services in real-time.2
The expected and actual performance calculations for CP resources are based on resource type:
• Generation/Storage: − Expected Performance = Capacity Commitment (UCAP) x Balancing Ratio
− Actual Performance = Metered Energy Output + Reserve/Regulation Assignment2
• Demand Response:
2 For calculations for reserve and regulation assignment megawatts factored into actual performance, see the Operating Committee presentation: https://www.pjm.com/-/media/committees-groups/committees/oc/20160913/20160903-item-12-pah-examples-with-reg-and-synch.ashx
PAI Settlements
PJM © 2020 www.pjm.com | For Public Use 5 | P a g e
− Expected Performance = CP Capacity Commitment (ICAP)
− Actual Performance = Load Reduction + Reserve/Regulation Assignment2 • Energy Efficiency:
− Expected Performance = CP Capacity Commitment (ICAP) − Actual Performance = PJM-Approved Post-Installation Load Reduction
If a resource’s expected performance is greater than the actual performance, the resource will be assessed a non-performance penalty, unless the shortfall is excused from the performance shortfall. The excusal process and the megawatts that were excused for the Oct. 2 performance assessment event are discussed in the Excusal section of this paper.
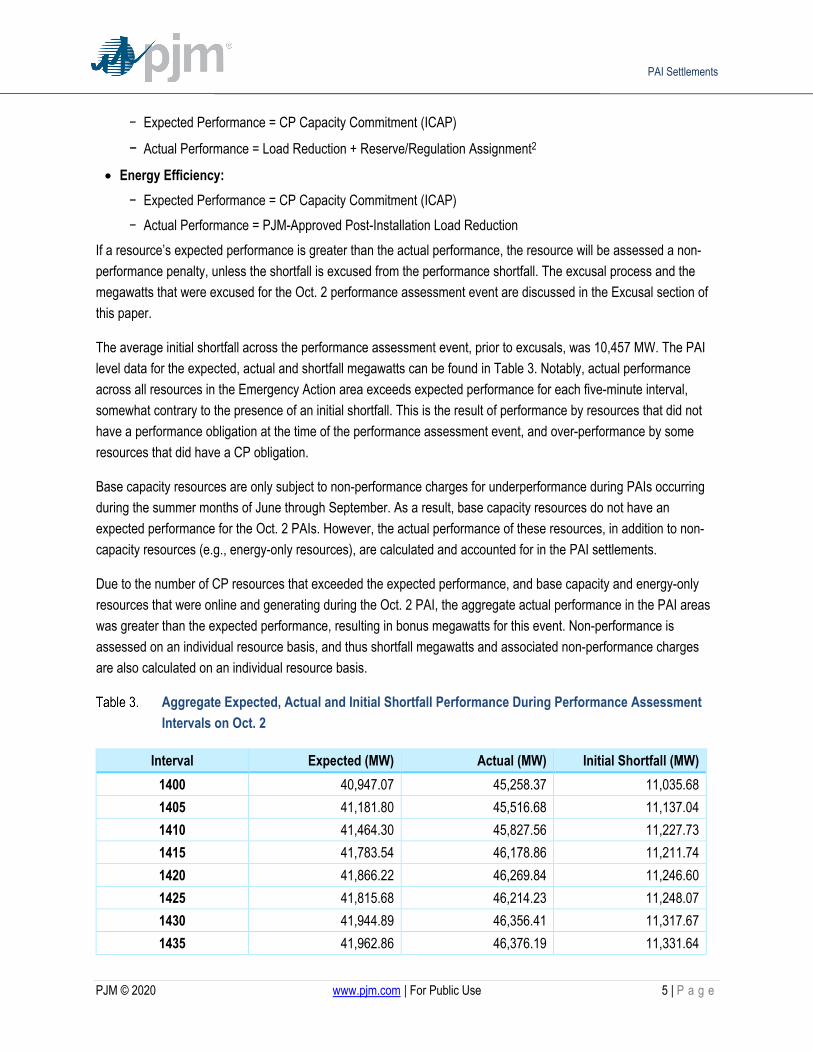
The average initial shortfall across the performance assessment event, prior to excusals, was 10,457 MW. The PAI level data for the expected, actual and shortfall megawatts can be found in Table 3. Notably, actual performance across all resources in the Emergency Action area exceeds expected performance for each five-minute interval, somewhat contrary to the presence of an initial shortfall. This is the result of performance by resources that did not have a performance obligation at the time of the performance assessment event, and over-performance by some resources that did have a CP obligation.
Base capacity resources are only subject to non-performance charges for underperformance during PAIs occurring during the summer months of June through September. As a result, base capacity resources do not have an expected performance for the Oct. 2 PAIs. However, the actual performance of these resources, in addition to non-capacity resources (e.g., energy-only resources), are calculated and accounted for in the PAI settlements.
Due to the number of CP resources that exceeded the expected performance, and base capacity and energy-only resources that were online and generating during the Oct. 2 PAI, the aggregate actual performance in the PAI areas was greater than the expected performance, resulting in bonus megawatts for this event. Non-performance is assessed on an individual resource basis, and thus shortfall megawatts and associated non-performance charges are also calculated on an individual resource basis.
Aggregate Expected, Actual and Initial Shortfall Performance During Performance Assessment Intervals on Oct. 2
Interval Expected (MW) Actual (MW) Initial Shortfall (MW) 1400 40,947.07 45,258.37 11,035.68 1405 41,181.80 45,516.68 11,137.04 1410 41,464.30 45,827.56 11,227.73 1415 41,783.54 46,178.86 11,211.74 1420 41,866.22 46,269.84 11,246.60 1425 41,815.68 46,214.23 11,248.07 1430 41,944.89 46,356.41 11,317.67 1435 41,962.86 46,376.19 11,331.64

PAI Settlements
PJM © 2020 www.pjm.com | For Public Use 6 | P a g e
Interval Expected (MW) Actual (MW) Initial Shortfall (MW) 1440 42,080.33 46,505.46 11,316.54 1445 42,143.84 46,575.34 11,312.91 1450 42,014.05 46,432.52 11,335.23 1455 42,021.04 46,440.21 11,325.13 1500 41,792.73 46,190.77 11,435.85 1505 41,661.26 46,046.09 11,357.26 1510 41,801.40 46,200.30 11,435.89 1515 41,651.93 46,035.82 11,492.00 1520 41,441.85 45,804.64 11,576.63 1525 41,256.69 45,600.89 11,508.37 1530 41,290.67 45,638.28 11,480.80 1535 41,393.43 45,751.36 11,325.09 1540 41,646.79 46,030.16 11,287.50 1545 19,947.56 22,148.92 4,367.16 1550 19,899.74 22,095.94 4,352.31 1555 20,002.65 22,209.95 4,302.55
Breaking out the shortfall megawatts to a more granular level, the next few graphs and charts contain only the CP resources that had an initial shortfall. CP resources that have met or exceeded their expected performance, and base capacity and energy-only resources, are excluded from this data set.
Expected, Actual and Initial Shortfall Performance for Underperformance Resources During Performance Assessment Intervals on Oct. 2
Interval Expected (MW) Actual (MW) Initial Shortfall (MW) 1400 16,295.97 5,260.23 11,035.68 1405 16,113.26 4,976.15 11,137.04 1410 16,154.60 4,926.80 11,227.73 1415 16,350.90 5,139.09 11,211.74 1420 16,383.64 5,136.97 11,246.60 1425 16,662.45 5,414.31 11,248.07 1430 16,714.55 5,396.82 11,317.67 1435 16,702.37 5,370.66 11,331.64 1440 16,703.02 5,386.41 11,316.54 1445 16,567.61 5,254.63 11,312.91

PAI Settlements
PJM © 2020 www.pjm.com | For Public Use 7 | P a g e
Interval Expected (MW) Actual (MW) Initial Shortfall (MW) 1450 16,742.44 5,407.14 11,335.23 1455 16,716.86 5,391.66 11,325.13 1500 16,098.74 4,663.08 11,435.85 1505 16,547.19 5,190.12 11,357.26 1510 16,112.88 4,677.17 11,435.89 1515 16,088.27 4,596.45 11,492.00 1520 16,315.42 4,738.98 11,576.63 1525 16,145.99 4,637.81 11,508.37 1530 17,011.18 5,530.57 11,480.80 1535 17,039.27 5,714.37 11,325.09 1540 16,120.46 4,833.15 11,287.50 1545 7,214.52 2,847.36 4,367.16 1550 7,708.20 3,355.88 4,352.31 1555 6,980.17 2,677.63 4,302.55
Initial Shortfall Broken Down by Fuel Type
Excusals A resource’s performance shortfall is evaluated for excusals and may be adjusted downward if the shortfall is deemed to be exempt. Megawatts are excused from performance for the following reasons:

PAI Settlements
PJM © 2020 www.pjm.com | For Public Use 8 | P a g e
• Megawatts were on a PJM-approved planned or maintenance outage.
• Megawatts were scheduled down by PJM, in alignment with the security-constrained economic dispatch (SCED).
• Megawatts were not scheduled to operate by PJM.3
For the Oct. 2 PAI events, the average excused megawatts for maintenance and planned outages were 7,293 MW. Being in October, the peak of maintenance season, the expected maintenance outages are higher than what can be expected in a typical winter or summer season. The shoulder period is when critical planned maintenance activities typically occur to ensure that these resources can continue to provide reliable generation throughout the year. These outages are scheduled and approved by PJM and recallable 72 hours in advance. This is the reason why these megawatts are deemed to be exempt from performance during their approved outage period. Prior to Oct. 2, PJM did not recall any generation maintenance outages, as load projections did not indicate that would be necessary. Forced outages, outages that are unscheduled or unplanned, are not exempt from performance; resources on a forced outage with a performance shortfall are assessed non-performance charges.
Megawatts that were not scheduled, or scheduled down by PJM, are exempt from performance penalties, because the resource followed PJM dispatch instructions and did not come online or generate past their dispatch point. This is important to system reliability during the performance assessment event that resources continue to follow PJM direction to help maintain power balance. If all resources were to come online and generate without PJM direction, this could result in reliability issues, such as transmission overloads, ACE imbalance, and stability. Therefore, resources that are not scheduled by PJM are exempt from performance penalties during that time. Resources may not be scheduled by PJM due to economic reasons, such as projected system conditions and locational marginal prices (LMPs) that did not support bringing the resource online; or controlling transmission constraints that supported lowering the unit’s output; or the resource is held offline or down by PJM for reserves. Specifically, in the case of a flexible resource, PJM may hold a unit offline to have that resource available during the peak when they expect the generation will be needed. The average excused megawatts for resources not scheduled or scheduled down by PJM for the PAI events was 1054 MW.3
A more granular breakdown of the excused megawatts for the PAIs are detailed in Table 5.
Excusal Megawatts for Planned Outages and Megawatts Not Scheduled by PJM by Performance Assessment Interval for Oct. 2
Interval Initial Shortfall Planned Outage Not Scheduled Final Shortfall 1400 11,028.9 7,744.1 1,215.5 2,069.4 1405 11,130.3 7,800.3 1,235.8 2,094.2
3 If a resource was needed by PJM and would otherwise have been scheduled by PJM to perform, but was not scheduled to operate, or was scheduled down solely due to (1) any operating parameter limitations submitted in the resource’s offer or (2) submission of market-based offer higher than cost-based offer, then these megawatts will not be considered exempted and will not result in downward adjustment of performance shortfall.

PAI Settlements
PJM © 2020 www.pjm.com | For Public Use 9 | P a g e
Interval Initial Shortfall Planned Outage Not Scheduled Final Shortfall 1410 11,221.0 7,859.2 1,260.3 2,101.4 1415 11,205.0 7,933.6 1,117.8 2,153.6 1420 11,239.8 7,951.1 1,123.5 2,165.2 1425 11,241.3 7,940.3 1,099.9 2,201.0 1430 11,310.9 7,969.7 1,183.9 2,157.2 1435 11,324.9 7,972.6 1,176.0 2,176.3 1440 11,309.8 7,998.5 1,127.0 2,184.3 1445 11,306.1 8,012.9 1,134.4 2,158.9 1450 11,328.5 7,984.7 1,031.7 2,312.0 1455 11,318.4 7,987.3 1,060.1 2,271.0 1500 11,430.9 7,934.0 1,587.0 1,909.9 1505 11,352.3 7,905.7 1,195.6 2,250.9 1510 11,430.9 7,938.2 1,256.2 2,236.6 1515 11,487.0 7,904.2 1,370.1 2,212.8 1520 11,571.7 7,856.3 1,445.9 2,269.5 1525 11,503.4 7,819.2 978.5 2,705.7 1530 11,475.8 7,823.1 1,041.6 2,611.0 1535 11,320.1 7,848.3 1,175.3 2,296.5 1540 11,282.5 7,902.4 1,167.8 2,212.3 1545 4,362.2 2,984.9 90.6 1,286.6 1550 4,347.3 2,976.6 131.1 1,239.6 1555 4,297.6 2,994.9 90.9 1,211.8

PAI Settlements
PJM © 2020 www.pjm.com | For Public Use 10 | P a g e
Fuel Type Breakdown of Excusals
As discussed in the Pricing Outcomes section of the original “A Review of the October 2019 Performance Assessment Event” paper, enough generation and reserves to support the load, in addition to heavy congestion in some areas, resulted in negative LMPs in some zones during the PAI events. Resources in these zones with negative LMPs are still evaluated in the performance assessment event. If the resource was offline and not called online to generate by PJM, that resource would be evaluated based on economics (comparing LMPs to the resource’s offer curve). If LMP did not support the resource being online, the resource megawatt obligation would be excused under the not-scheduled excusal bucket. If the resource was online, generating at the negative LMP buses, these resources would be evaluated as being desired to run at their economic minimum on the cheaper of their offer curves. Any expected performance obligation above that point (economic minimum) would be excused under the not-scheduled excusal bucket for being uneconomic. If the resource was online, generating below the economic minimum point, the megawatts from the operating point up to economic minimum would be counted as shortfall megawatts and be subject to non-performance penalties.

PAI Settlements
PJM © 2020 www.pjm.com | For Public Use 11 | P a g e
Non-Performance Charges Non-performance charge rates are calculated on a modeled RPM Locational Deliverability Area (LDA) basis for the relevant delivery year. The non-performance charge rate for a specific resource is based on the Net Cost of New Entry (Net CONE) ($/MW-day in installed capacity terms) for the LDA in which such resource resides and is calculated as:
Non-Performance Charge Rate ($/MW-5-Minute Interval) = Net CONE x Number of Days in Delivery Year / 30 Hours / 12 Intervals
The applicable charge rates for the Oct. 2 PAIs for those resources modeled in the RTO, BGE, PEPCO and SWMAAC LDAs for the 2019/2020 Delivery Year are detailed in Table 6.4
Non-Performance Charge Rates by LDA ($/MW-5-Minute Interval)
Non-Performance Charge Rates by Locational Deliverability Area (LDA) BGE $204.75 PEPCO $231.91 RTO $284.21 SWMAAC $218.33
These charge rates are multiplied by the final performance shortfall in each PAI to determine the non-performance financial penalty for committed CP resources. The non-performance charge is calculated as:
Non-Performance Charge = Performance Shortfall MW * Non-Performance Charge Rate
The non-performance charge for the performance assessment event totals approximately $8.2 million, which was allocated across 53 resources with final performance shortfall megawatts.
4 Modeled LDA Net CONE values for the 2019/2020 Delivery Year are available at https://www.pjm.com/-/media/markets-ops/rpm/rpm-auction-info/2019-2020-bra-planning-parameters.ashx?la=en

PAI Settlements
PJM © 2020 www.pjm.com | For Public Use 12 | P a g e
Non-Performance Charges by Performance Assessment Interval for Oct. 2
Interval Non-Performance Charge 1400 $369,097.33 1405 $374,639.73 1410 $373,678.49 1415 $379,832.80 1420 $379,333.45 1425 $393,932.87 1430 $377,301.76 1435 $379,918.07 1440 $380,975.69 1445 $376,218.99 1450 $410,748.36 1455 $399,158.94 1500 $255,267.73 1505 $412,875.66 1510 $406,664.32 1515 $401,762.28 1520 $420,317.08 1525 $456,651.66 1530 $441,412.51 1535 $359,470.94 1540 $344,791.29 1545 $ 35,223.29 1550 $31,770.11 1555 $23,776.69
Stop-loss provisions are in place to limit the total non-performance charge that can be assessed on each capacity resource. For CP resources, the maximum yearly non-performance charge is 1.5 times the modeled LDA Net CONE ($/MW-day in installed capacity terms), times the number of days in the delivery year, times the maximum daily unforced capacity committed by the resource from June 1 of the delivery year through the end of the month for which the non-performance charge was assessed. For all CP resources involved in the Oct. 2 PAI event, the calculated non-performance charge for the event was below the maximum yearly non-performance charge. As a result, it was not necessary to apply the stop-loss provision to any CP resource for the Oct. 2 PAI.

PAI Settlements
PJM © 2020 www.pjm.com | For Public Use 13 | P a g e
Bonus Performance A resource with actual performance above its expected performance is considered to have provided bonus performance, and will be assigned a share of the collected non-performance charge revenues in the form of a bonus performance credit. Bonus performance from a resource represents greater delivered energy (or reductions), in comparison to the amount of the committed capacity from the resource that was needed during the event. Bonus performance is calculated on all resources to determine over performance as: actual performance minus expected performance.
When calculating bonus megawatts, the actual performance for a dispatchable resource is capped at the megawatt level at which such resource was scheduled and dispatched by PJM during the performance assessment event. PJM caps the megawatt level that a resource is eligible to receive bonus credit for to incent resources to follow dispatch in real-time to support operations, and not chase potential bonus credits by over generating. Resources must also have at least one available schedule with economic minimum, economic maximum and emergency maximum, and at least one segment on the incremental energy curve.
The expected and actual performance calculations for bonus megawatt evaluations are based on resource type:
• Generation/Storage: − Expected Performance = (CP Commitment (UCAP) + Base Commitment (UCAP)) x Balancing Ratio − Actual Performance = Metered Energy Output + Reserve/Regulation Assignment
• Demand Response: − Expected Performance = CP Capacity Commitment (ICAP) − Actual Performance = Load Reduction + Reserve/Regulation Assignment
• Energy Efficiency: − Expected Performance = CP Capacity Commitment (ICAP) − Actual Performance = PJM Approved Post-Installation Load Reduction
The average bonus megawatts eligible for bonus credits for the performance assessment event on Oct. 2 was 9,706 MW. Approximately 81 percent of these megawatts came from CP resources while 19 percent came from base capacity or energy-only resources. The larger percent of bonus megawatts from the CP resources are driven by those resources being online generating, and the 75 percent balancing ratio. Resource output in excess of 75 percent of their capacity commitment, up to the megawatt level at which the resource was scheduled and dispatched, can be attributed to over performance.

PAI Settlements
PJM © 2020 www.pjm.com | For Public Use 14 | P a g e
Bonus Performance Megawatts for Performance Assessment Intervals for Oct. 2 Broken Down by CP Resources and Non-CP Resources
Interval Bonus MW − CP Resources Bonus MW − Base/Energy Resources Total Bonus MW 1400 8,999.9 1,854.8 10,854.7 1405 8,783.0 1,924.5 10,707.5 1410 8,799.0 2,053.3 10,852.3 1415 8,657.6 2,106.9 10,764.5 1420 8,623.4 2,137.6 10,761.1 1425 8,803.6 2,150.6 10,954.1 1430 8,430.4 2,138.9 10,569.2 1435 8,410.2 2,150.3 10,560.5 1440 8,293.2 2,085.4 10,378.6 1445 8,298.7 2,045.4 10,344.1 1450 8,341.5 2,001.1 10,342.6 1455 8,361.3 2,006.8 10,368.0 1500 8,473.6 2,049.3 10,522.9 1505 8,554.4 1,866.5 10,420.9 1510 8,644.2 1,908.4 10,552.6 1515 8,647.7 1,876.6 10,524.3 1520 8,778.2 1,876.7 10,654.9 1525 8,626.2 1,914.1 10,540.3 1530 8,591.5 1,976.2 10,567.7 1535 8,584.5 2,123.2 10,707.7 1540 8,589.0 2,091.8 10,680.8 1545 2,705.4 818.4 3,523.8 1550 2,629.2 731.6 3,360.9 1555 2,690.6 733.1 3,423.7
Total non-performance charges are allocated, at the account level, as bonus performance credit to resources that have bonus megawatts based on their pro-rata share of total bonus performance megawatts. The average $/MW-interval across the performance assessment event for bonus megawatts was $32.89.
Bonus Performance Credit by Performance Assessment Intervals for Oct. 2
Interval Total Bonus MW Total Non-Performance Charge Bonus $/MW-Interval 1400 10,854.7 $369,097.33 $34.00 1405 10,707.5 $374,639.73 $34.99 1410 10,852.3 $373,678.49 $34.43 1415 10,764.5 $379,832.80 $35.29 1420 10,761.1 $379,333.45 $35.25

PAI Settlements
PJM © 2020 www.pjm.com | For Public Use 15 | P a g e
Interval Total Bonus MW Total Non-Performance Charge Bonus $/MW-Interval 1425 10,954.1 $393,932.87 $35.96 1430 10,569.2 $377,301.76 $35.70 1435 10,560.5 $379,918.07 $35.98 1440 10,378.6 $380,975.69 $36.71 1445 10,344.1 $376,218.99 $36.37 1450 10,342.6 $410,748.36 $39.71 1455 10,368.0 $399,158.94 $38.50 1500 10,522.9 $255,267.73 $24.26 1505 10,420.9 $412,875.66 $39.62 1510 10,552.6 $406,664.32 $38.54 1515 10,524.3 $401,762.28 $38.17 1520 10,654.9 $420,317.08 $39.45 1525 10,540.3 $456,651.66 $43.32 1530 10,567.7 $441,412.51 $41.77 1535 10,707.7 $359,470.94 $33.57 1540 10,680.8 $344,791.29 $32.28 1545 3,523.8 $ 34,140.12 $ 9.69 1550 3,360.9 $ 30,687.27 $ 9.13 1555 3,423.7 $ 22,693.52 $ 6.63
Bonus MW by Fuel Type

PAI Settlements
PJM © 2020 www.pjm.com | For Public Use 16 | P a g e
Resources that have been committed to an FRR plan and elected the physical non-performance assessment option did have bonus megawatts calculated for the Oct. 2 performance assessment events. The details on the FRR physical bonus megawatts are being withheld for data confidentiality reasons.5
Demand Response Performance Detailed performance of DR for the Oct. 2 performance assessment event is reviewed in the Load Management Performance Review report.6 An excerpt of these details on performance, shortfall, bonus and penalties are detailed below. The full report can be referenced for more detailed analysis.
Table 10 below summarizes CP and expected energy load reductions reported by CSPs prior to the event, compared to actual energy load reduction that was settled. PJM dispatched CP DR long-lead resources Oct. 2, 2019, during their mandatory compliance period and base DR resources during their voluntary period. Resources in Dominion, PEPCO and BGE zones were dispatched from 1400 through 1545 EDT and resources in the AEP zone were dispatched from 1400 through 1600 EDT. Overall event performance during the mandatory compliance period was 78 percent. Capacity compliance is measured based on Firm Service Level and Guaranteed Load Drop approaches which can be significantly different from real-time energy load reductions. Further, CSPs reported an expected 728 MW of available reduction prior to the start of the event, compared to the 395 MW (54 percent) of load reduction which was actually provided. PJM uses the expected energy reductions reported by CSPs as part of the decision-making process when determining which DR resources should be dispatched to maintain system reliability.
Load Management Event Summary for Oct. 2
Product Capacity Committed (MW)**
Capacity Reduction (MW)
Capacity Performance
Expected Energy Reduction (MW)
Settled Energy Reduction (MW)***
Capacity Performance
25.4 19.9 78% 24.2 22
Base* n/a n/a n/a 703.8 373
Total 25.4 19.9 78% 728 395
* Base DR was a voluntary event since resources were only required to reduce load through September. Base capacity load reductions are used to offset CP shortfall and any residual base reductions are eligible for bonus payments.
**Long lead time and pre-emergency resources only in the event zones.
***Megawatt reduction in HE 15 (highest reduction hour).
5 PJM Manual 33 Section 3.1: https://www.pjm.com/~/media/documents/manuals/m33.ashx
6 https://pjm.com/-/media/markets-ops/dsr/2019-2020-dsr-activity-report.ashx?la=en

PAI Settlements
PJM © 2020 www.pjm.com | For Public Use 17 | P a g e
The capacity reduction represents the megawatts reduced by CP resources based on their load levels during the event, compared to their Peak Load Contribution. The settled energy reductions include reductions from both CP and base resources, and are based on load levels during the event relative to recent days’ load levels during the same hours. The shortfalls from capacity commitments receive non-performance charges. The settled energy reductions are made whole to their strike price.
Voluntary base DR, economic energy reductions and cleared ancillary services offers during the event intervals are eligible for bonus payments. Total bonus amount allocated to DR was $447,666. Average performance was a 6 MW shortfall which resulted in $40,049 in non-performance penalties. The bonus and non-performance penalty breakdown for DR is detailed in Table 11.
Penalty and Bonus Megawatts for the Performance Assessment Event on Oct. 2
Product Event Penalties
Avg. Shortfall (MW/Interval)
Avg. Penalty Rate ($/MW)
Event Bonus
Avg. Bonus (MW/Interval)
Weighted Avg. Bonus Rate ($/MW)
CP $40,049 5.9 $284 $344 0.5 $36.5
Base n/a n/a n/a $441,283 558.5 $34.7
Economic Energy/Ancillary Services
n/a n/a n/a $6,039
1.1 $36
Total $40,049 5.9 $284 $447,666 560 $34.73
Settlement Billing Timelines Non-performance assessments are billed starting three calendar months after the calendar month that included the performance assessment event and are spread across the remaining months in the delivery year. Monthly charges and credits are billed by dividing the total dollar amount due or owed by the number of months remaining in the delivery year.
For the Oct. 2 performance assessment event, charges and credits were first billed starting in the January 2020 monthly bill and will continue through the May 2020 monthly bill.