palos verdes a.o.r. chief economist & vice president appleton...january 5, 2017 . leslie...
TRANSCRIPT

Palos Verdes A.O.R.
January 5, 2017 Leslie Appleton-Young
Chief Economist & Vice President [email protected]

“Nobody had it priced in and the uncertainty Is absolutely enormous”
Every Wall Street Analyst After 11/8/16

Economic Stimulus Package
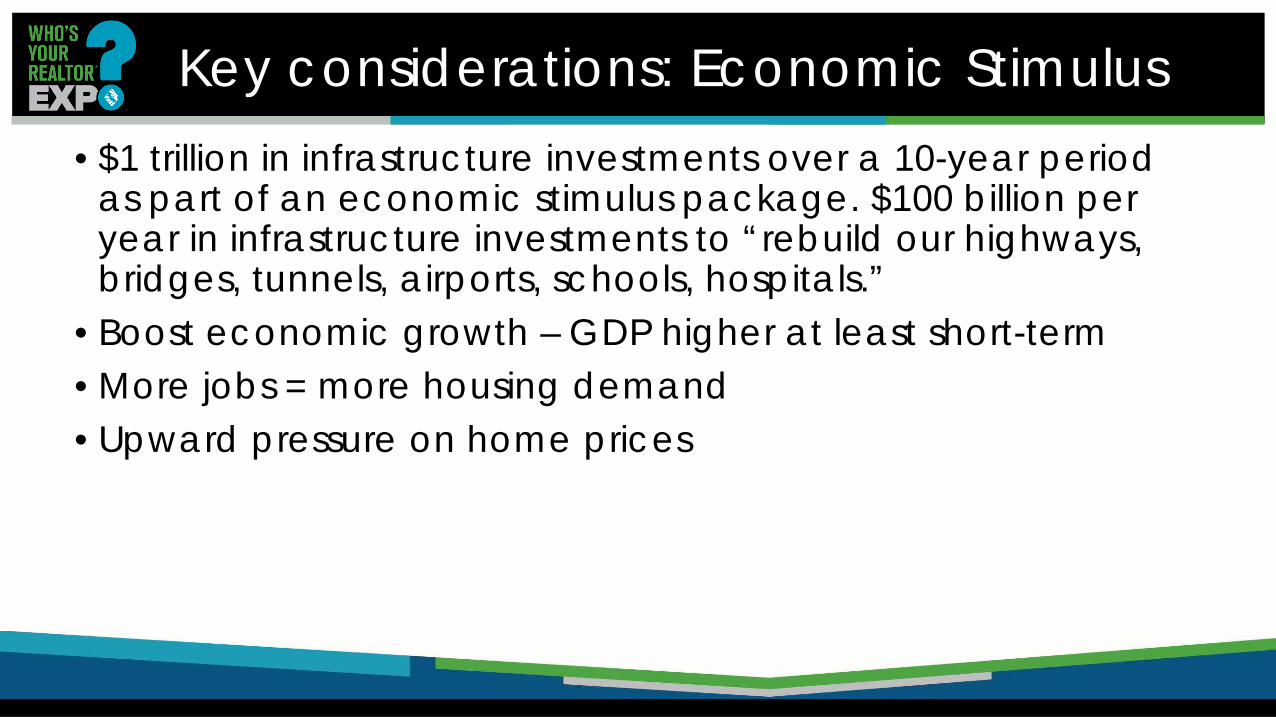
Key considerations: Economic Stimulus • $1 trillion in infrastructure investments over a 10-year period
as part of an economic stimulus package. $100 billion per year in infrastructure investments to “rebuild our highways, bridges, tunnels, airports, schools, hospitals.”
• Boost economic growth – GDP higher at least short-term • More jobs = more housing demand • Upward pressure on home prices

Trade Policy
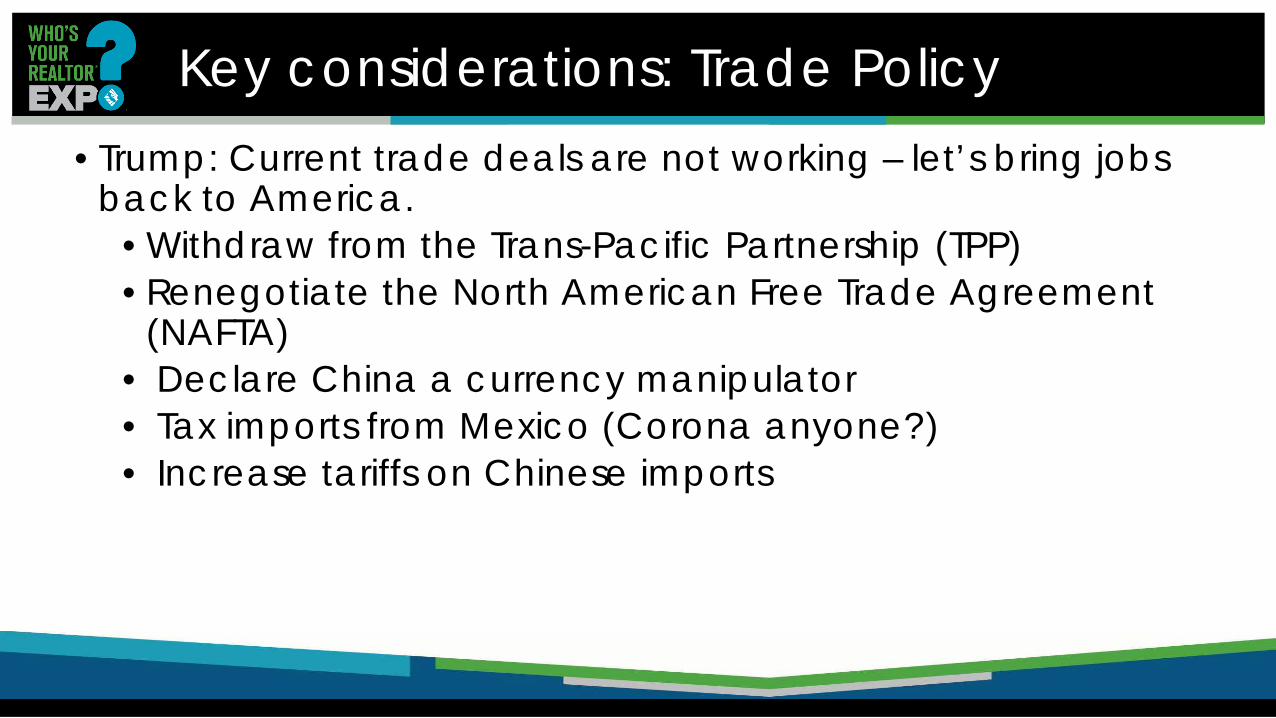
Key considerations: Trade Policy • Trump: Current trade deals are not working – let’s bring jobs
back to America. • Withdraw from the Trans-Pacific Partnership (TPP) • Renegotiate the North American Free Trade Agreement
(NAFTA) • Declare China a currency manipulator • Tax imports from Mexico (Corona anyone?) • Increase tariffs on Chinese imports

Tax Reform

Key considerations: Tax Reform Overhaul of the current tax code:
• Reduction in taxes paid by individuals and corporations. • Collapse the current 7 personal tax brackets to 3 brackets • Increase standard deduction for both single & married
Eliminate the federal estate and gift taxes • Repeal personal exemptions & cap itemized deductions

Monetary Policy
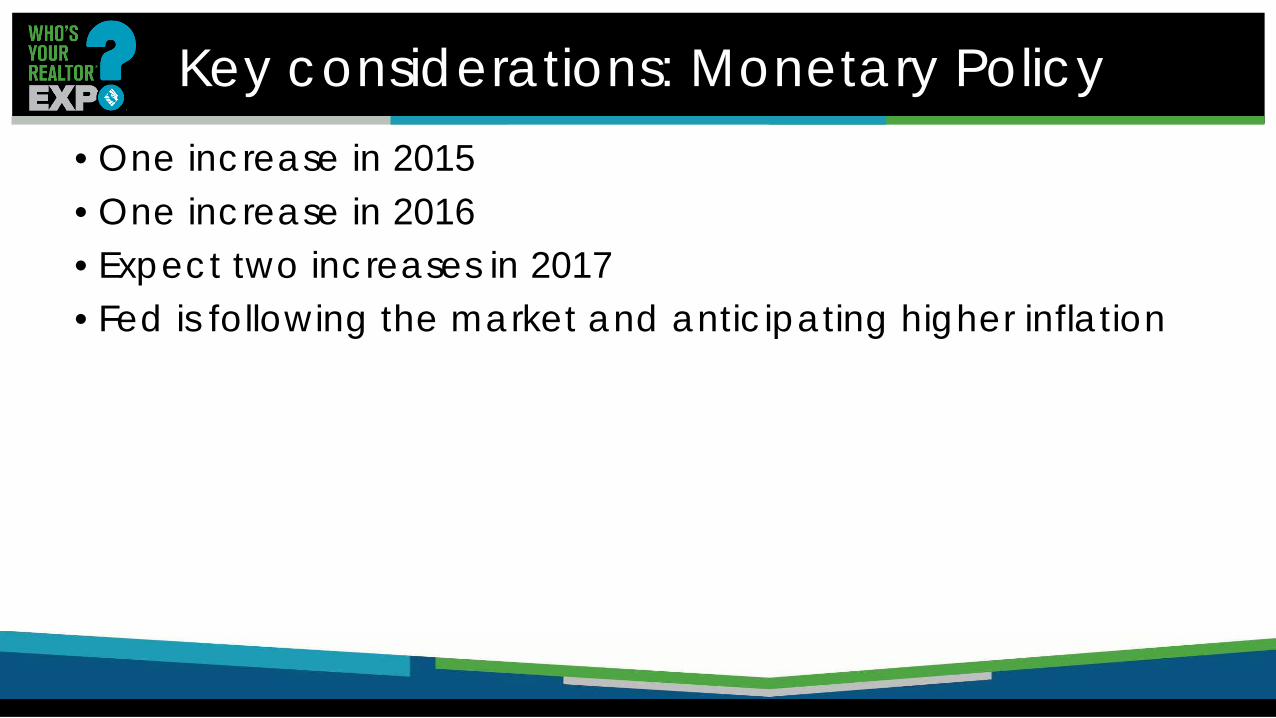
Key considerations: Monetary Policy • One increase in 2015 • One increase in 2016 • Expect two increases in 2017 • Fed is following the market and anticipating higher inflation

Mortgage Rates Rising Quickly January 2010 – December 2016 (12/29/16)
MONTHLY WEEKLY
SERIES: 30Yr FRM, 5Yr ARM SOURCE: Freddie Mac
3.68 4.32
2.94
3.30
0
1
2
3
4
5
6
2010/01 2010/09 2011/05 2012/01 2012/09 2013/05 2014/01 2014/09 2015/05 2016/01 2016/09 12.01.16
FRM ARM
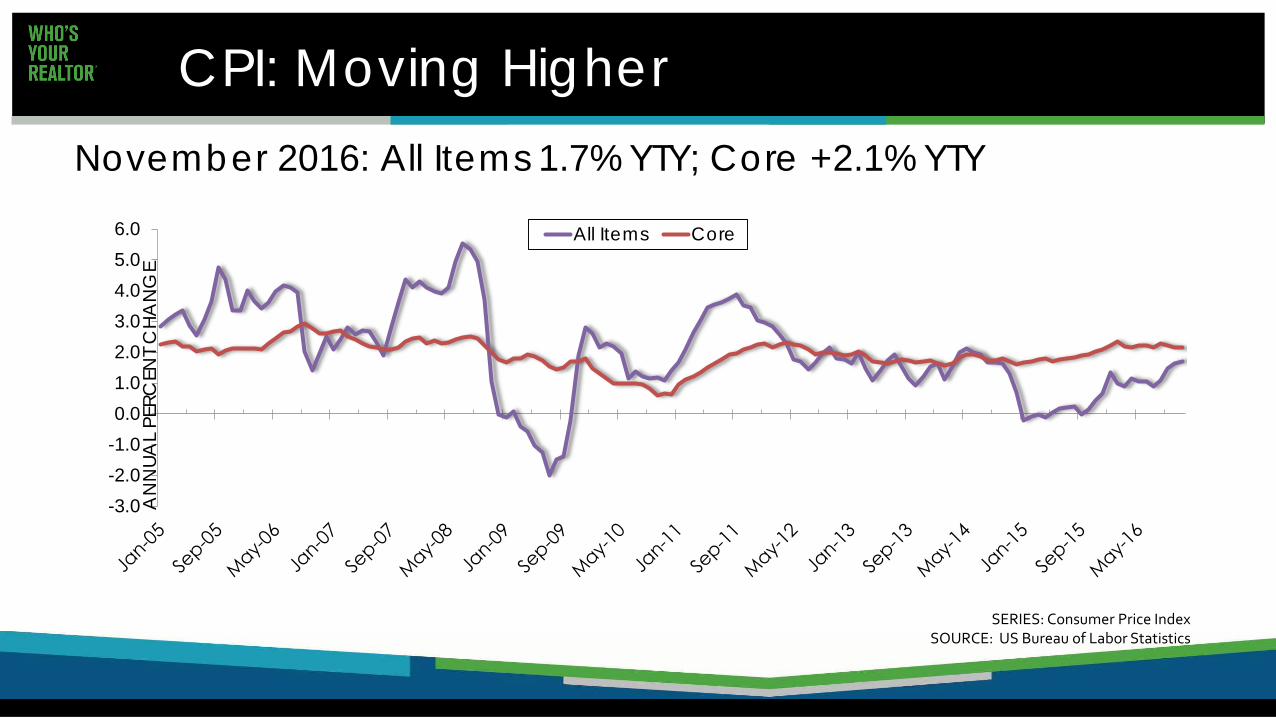
CPI: Moving Higher November 2016: All Items 1.7% YTY; Core +2.1% YTY
SERIES: Consumer Price Index SOURCE: US Bureau of Labor Statistics
-3.0-2.0-1.00.01.02.03.04.05.06.0
AN
NUA
L PE
RCEN
T C
HA
NG
E
All Items Core

Days Numbered?

Federal Government Regulation &Policy &
Programs FHA
Fannie & Freddie? Dodd- Frank?

Key considerations Republican stance has been to:
• Shrink Freddie Mac and Fannie Mae • Reform FHA • Reduce the government footprint in housing.
Unclear how Trump reacts to both the needs of the voters and the platform of the Republican party when it comes to housing.” (Nela Richardson, Redfin)
Key considerations: Regulation
• Changes to Dodd-Frank financial regulation: A clear positive
would be the lifting of compliance costs imposed on small-sized banks. Around 10,000 local and community banks fund construction and land development loans. With less regulatory burden, these small banks can make more loans and will boost home building activity
• Changes to financial regulations on large banks like Goldman Sachs and Wells Fargo could again lead us back to the days of cowboy capitalism and consequent exposure to a massive taxpayer bailout.” (Lawrence Yun, NAR)

EPA’s Land Use Policy?
Student Debt? Drones?
Lead Paint?
Immigrants Buying Homes?
Fair Housing Act?

CA Market Update
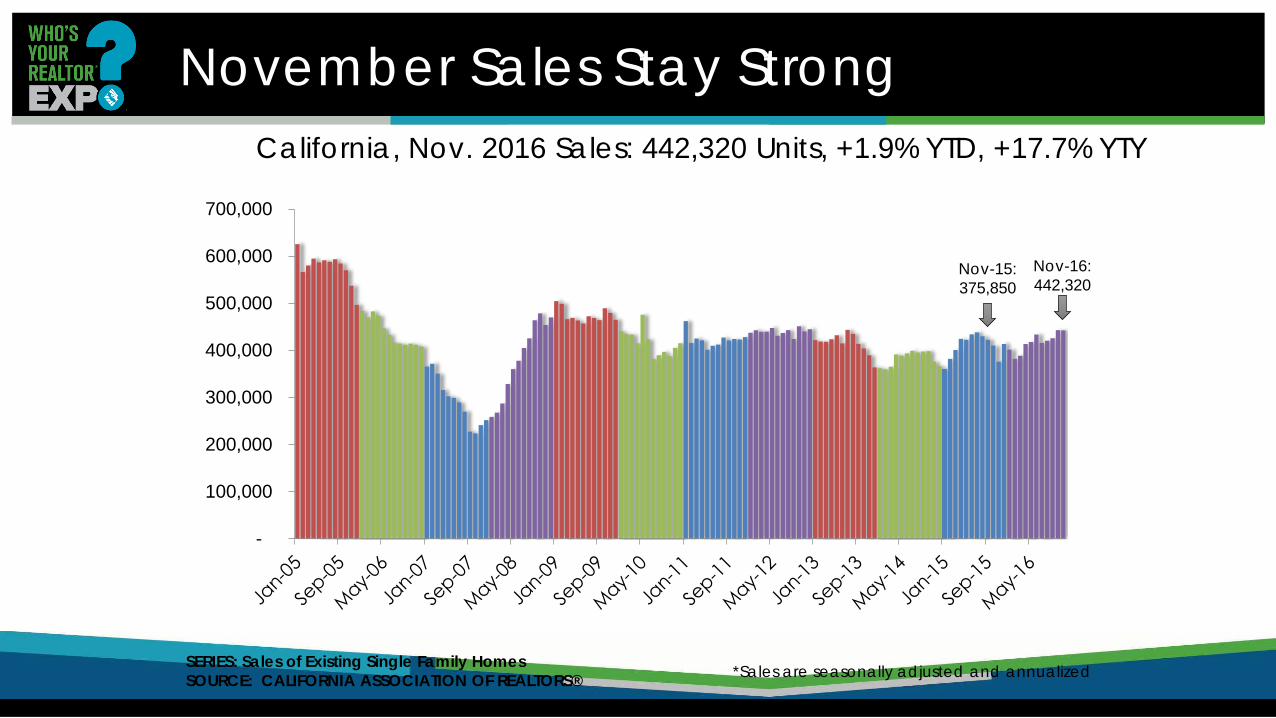
November Sales Stay Strong California, Nov. 2016 Sales: 442,320 Units, +1.9% YTD, +17.7% YTY
-
100,000
200,000
300,000
400,000
500,000
600,000
700,000
*Sales are seasonally adjusted and annualized SERIES: Sales of Existing Single Family Homes SOURCE: CALIFORNIA ASSOCIATION OF REALTORS®
Nov-16: 442,320
Nov-15: 375,850

Sales of Existing Detached Homes Southern California Region
Los Angeles 946 1,054 786 -10.2% 20.4% 0.8%Orange County 767 791 590 -3.0% 30.0% 1.7%
Riverside County 285 327 281 -12.8% 1.4% 6.2%San Bernardino 58 50 43 16.0% 34.9% 3.6%
San Diego 960 1,014 746 -5.3% 28.7% 2.6%Ventura 157 173 125 -9.2% 25.6% -1.7%
Santa Barbara 50 44 35 13.6% 42.9% 3.0%
Y-t-YCounty Nov-16 Oct-16 Nov-15 M-t-M Y-t-D
SERIES: Sales of Existing Detached Homes SOURCE: CALIFORNIA ASSOCIATION OF REALTORS®
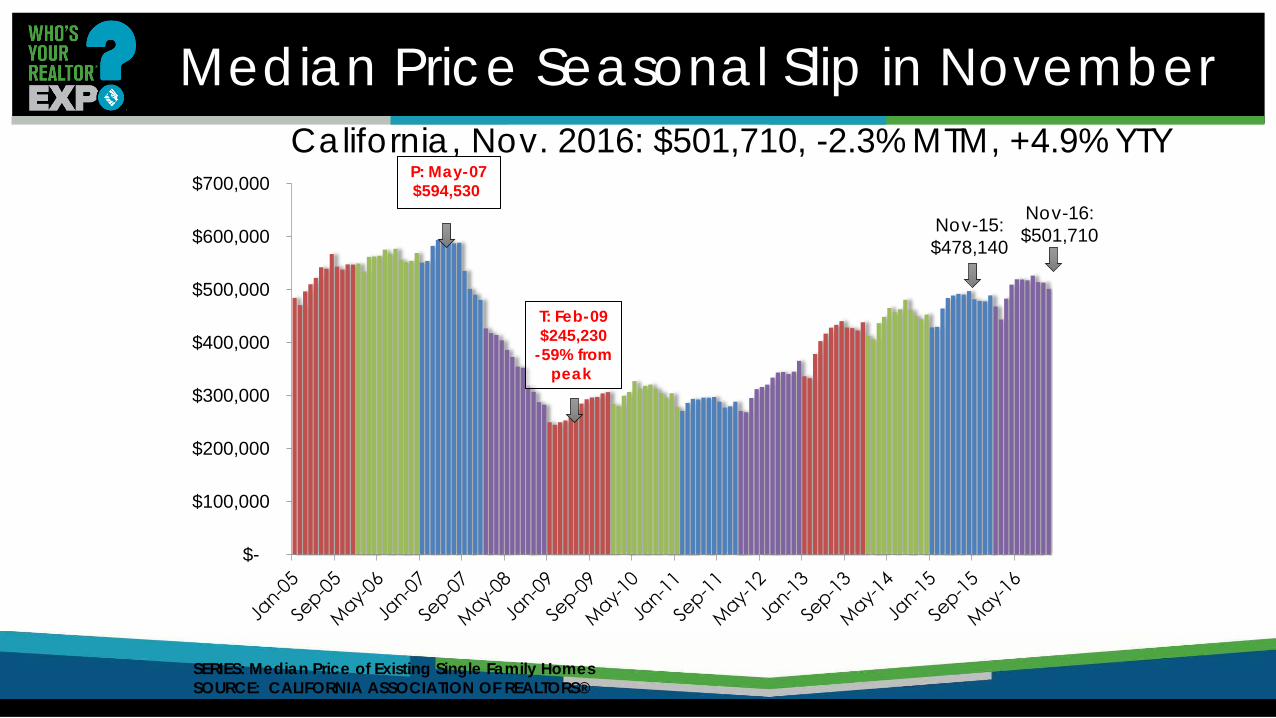
Median Price Seasonal Slip in November California, Nov. 2016: $501,710, -2.3% MTM, +4.9% YTY
$-
$100,000
$200,000
$300,000
$400,000
$500,000
$600,000
$700,000 P: May-07 $594,530
T: Feb-09 $245,230
-59% from peak
SERIES: Median Price of Existing Single Family Homes SOURCE: CALIFORNIA ASSOCIATION OF REALTORS®
Nov-16: $501,710 Nov-15:
$478,140
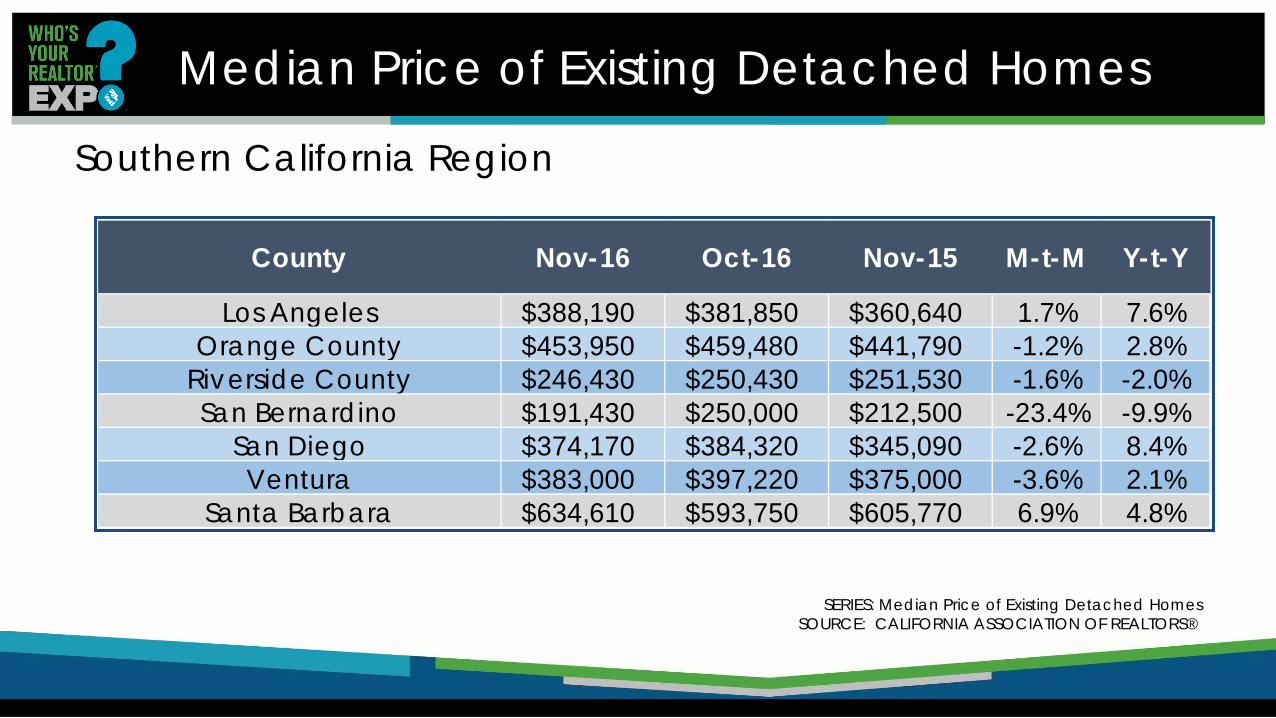
Median Price of Existing Detached Homes
Southern California Region
Los Angeles $388,190 $381,850 $360,640 1.7% 7.6%Orange County $453,950 $459,480 $441,790 -1.2% 2.8%
Riverside County $246,430 $250,430 $251,530 -1.6% -2.0%San Bernardino $191,430 $250,000 $212,500 -23.4% -9.9%
San Diego $374,170 $384,320 $345,090 -2.6% 8.4%Ventura $383,000 $397,220 $375,000 -3.6% 2.1%
Santa Barbara $634,610 $593,750 $605,770 6.9% 4.8%
Y-t-YCounty Nov-16 Oct-16 Nov-15 M-t-M
SERIES: Median Price of Existing Detached Homes SOURCE: CALIFORNIA ASSOCIATION OF REALTORS®
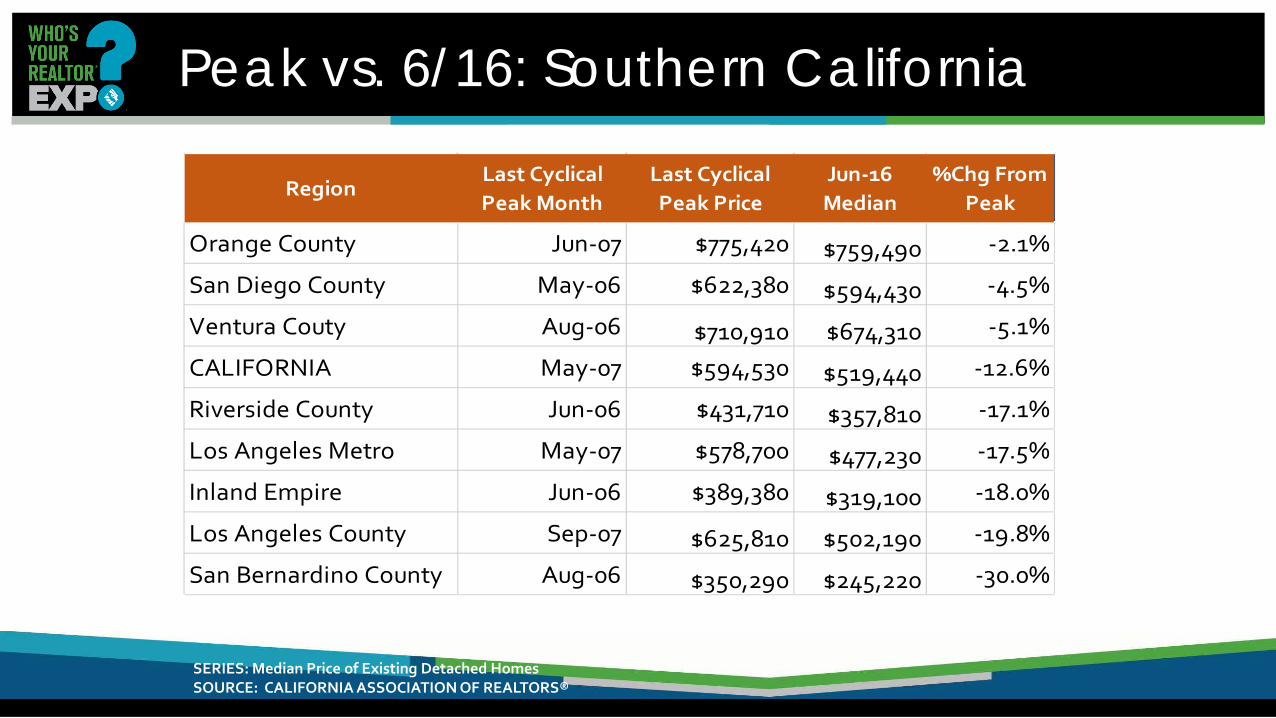
Peak vs. 6/16: Southern California
SERIES: Median Price of Existing Detached Homes SOURCE: CALIFORNIA ASSOCIATION OF REALTORS®
RegionLast Cyclical Peak Month
Last Cyclical Peak Price
Jun-16 Median
%Chg From Peak
Orange County Jun-07 $775,420 $759,490 -2.1%
San Diego County May-06 $622,380 $594,430 -4.5%
Ventura Couty Aug-06 $710,910 $674,310 -5.1%
CALIFORNIA May-07 $594,530 $519,440 -12.6%
Riverside County Jun-06 $431,710 $357,810 -17.1%
Los Angeles Metro May-07 $578,700 $477,230 -17.5%
Inland Empire Jun-06 $389,380 $319,100 -18.0%
Los Angeles County Sep-07 $625,810 $502,190 -19.8%
San Bernardino County Aug-06 $350,290 $245,220 -30.0%

Peak vs. 6/16 Median: Central Valley
SERIES: Median Price of Existing Detached Homes SOURCE: CALIFORNIA ASSOCIATION OF REALTORS®
RegionLast Cyclical Peak Month
Last Cyclical Peak Price
Jun-16 Median
%Chg From Peak
CALIFORNIA May-07 $594,530 $519,440 -12.6%
Madera County Feb-08 $275,000 $234,720 -14.6%
Sacramento County Aug-05 $394,450 $332,580 -15.7%
Placer County Aug-05 $527,990 $444,590 -15.8%
Kern (Bakersfield) County Jun-06 $299,920 $238,400 -20.5%
Kings County Mar-06 $268,050 $211,110 -21.2%
Tulare County Dec-05 $269,710 $211,820 -21.5%
Fresno County Jun-06 $313,510 $242,240 -22.7%
San Benito County May-05 $671,190 $511,500 -23.8%
Merced County Oct-05 $344,610 $207,580 -39.8%

Peak vs. 6/16 Median: Bay Area
SERIES: Median Price of Existing Detached Homes SOURCE: CALIFORNIA ASSOCIATION OF REALTORS®
RegionLast Cyclical Peak Month
Last Cyclical Peak Price
Jun-16 Median
%Chg From Cyclical Peak
San Francisco County May-07 $972,010 $1,350,000 38.9%
San Mateo County Oct-07 $1,020,000 $1,306,250 28.1%
Santa Clara County Apr-07 $865,000 $1,050,000 21.4%
Alameda County May-07 $709,420 $803,000 13.2%
San Francisco Bay Area May-07 $789,250 $841,960 6.7%
Marin County Jun-07 $1,149,390 $1,218,500 6.0%
Sonoma County Jan-06 $650,330 $608,000 -6.5%
Contra Costa County May-07 $698,420 $625,000 -10.5%
CALIFORNIA May-07 $594,530 $519,440 -12.6%
Napa County Aug-06 $729,170 $619,000 -15.1%
Solano County Jun-06 $492,800 $390,000 -20.9%
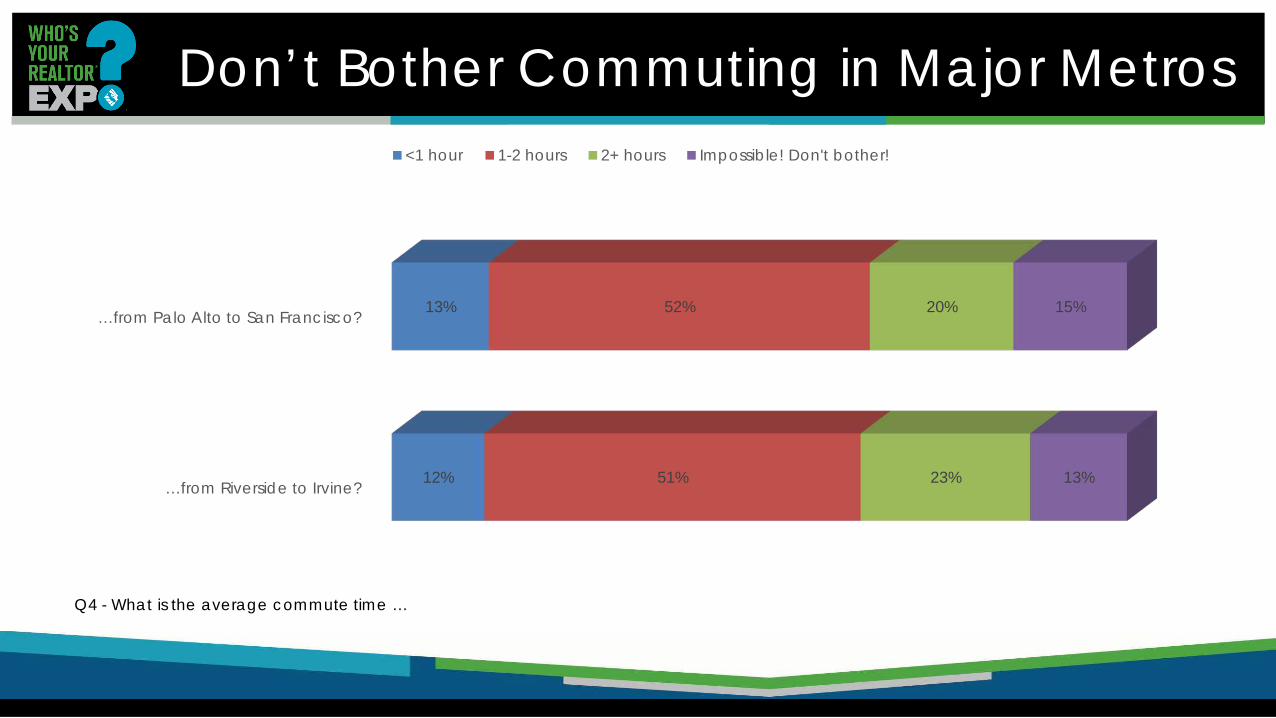
Don’t Bother Commuting in Major Metros
Q4 - What is the average commute time …
…from Riverside to Irvine?
…from Palo Alto to San Francisco?
12%
13%
51%
52%
23%
20%
13%
15%
<1 hour 1-2 hours 2+ hours Impossible! Don't bother!

Making Traffic Disappear is Most Desired Super Power
Q12 - Which super power would you like to have?
4.9%
19%
21%
26%
29%
0% 5% 10% 15% 20% 25% 30% 35%
Super strength
Invisibility
Instant mortgage approval
Flying
Make traffic disappear
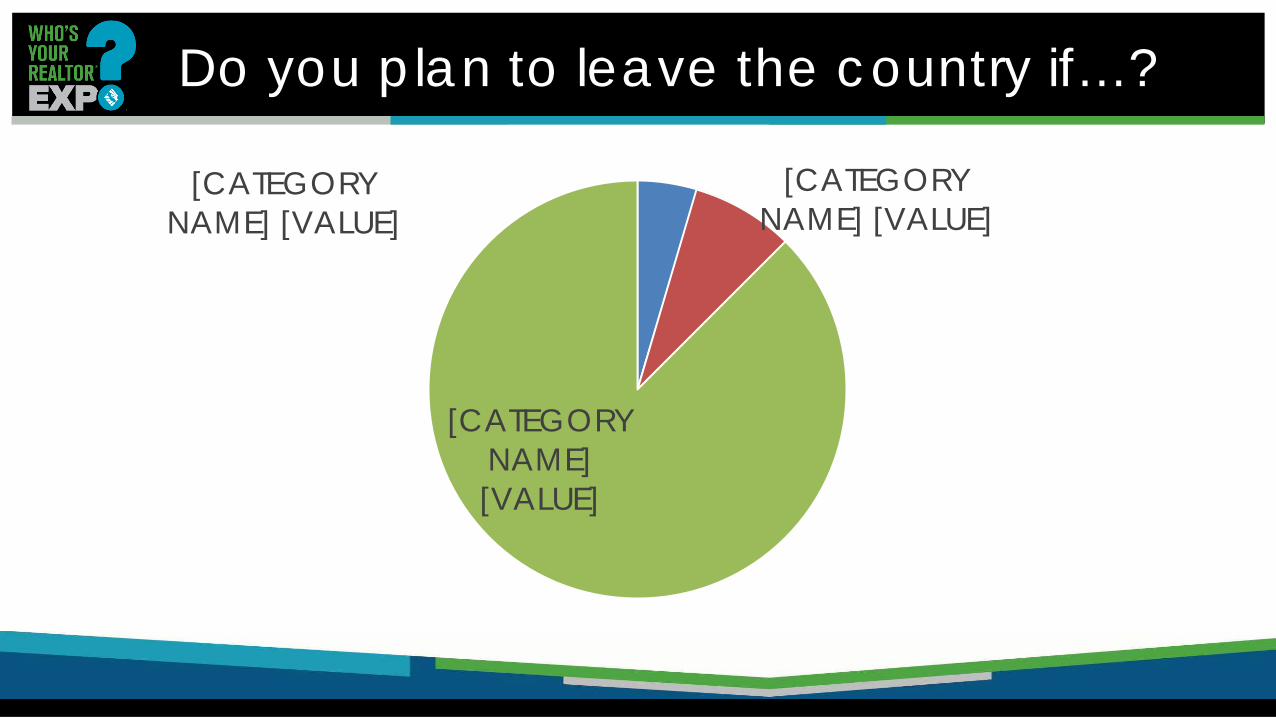
Do you plan to leave the country if…?
[CATEGORY NAME] [VALUE]
[CATEGORY NAME] [VALUE]
[CATEGORY NAME] [VALUE]

Economic Outlook

-4%
-3%
-2%
-1%
0%
1%
2%
3%
4%
5%
6%
2005 2007 2009 2011 2013 2015 Q2-11Q4-11Q2-12Q4-12Q2-13Q4-13Q2-14Q4-14Q2-15Q4-15Q2-16
AN
NUA
L PE
RCEN
T CHA
NG
E, C
HAIN
-TYP
E (2
009)
$
Gross Domestic Product A Strong-ish +3.5% in Q3
2015: 2.6%; 2016 Q3: 3.5%
ANNUALLY QUARTERLY
2009 Largest Annual Drop since 1946 (-2.8%)
SERIES: GDP SOURCE: US Dept. of Commerce, Bureau of Economic Analysis

SERIES: Components of GDP SOURCE: US Dept. of Commerce, Bureau of Economic Analysis
Consumers & Exports Drove Growth in Q3
2.03
0.18
0.85
0.14
-1.0
-0.5
0.0
0.5
1.0
1.5
2.0
2.5
3.0
3.5
Consumption Fixed Nonres. Investment Net Exports Government
Q4 2015Q1 2016Q2 2016Q3 2016
ANNUAL PERCENT CHANGE

-3%
-2%
-1%
0%
1%
2%
3%
4%
5%
2005
2007
2009
2011
2013
2015
2012
Q1
2012
Q3
2013
Q1
2013
Q3
2014
Q1
2014
Q3
2015
Q1
2015
Q3
2016
Q1
2016
Q3
Personal Consumption +3.0% 2015: 2.6%; 2016 Q3: 3.0%
ANNUAL PERCENT CHANGE
ANNUALLY QUARTERLY
SERIES: Personal Consumption SOURCE: US Dept. of Commerce, Bureau of Economic Analysis

-4%
-3%
-2%
-1%
0%
1%
2%
3%
4%
5%
6%
2005 2007 2009 2011 2013 2015 Q2-11Q4-11Q2-12Q4-12Q2-13Q4-13Q2-14Q4-14Q2-15Q4-15Q2-16
AN
NUA
L PE
RCEN
T CHA
NG
E, C
HAIN
-TYP
E (2
009)
$
Annual Economic Growth – Below 3% for 11Years
US GDP 2015: 2.6%; 2016 Q1: .8% Q2: 1.4% Q3: 3.2% Strongest in 2 years
ANNUALLY QUARTERLY
2009 Largest Annual Drop since 1946 (-2.8%)
SERIES: GDP SOURCE: US Dept. of Commerce, Bureau of Economic Analysis
3.2%

Consumer Confidence Surges in December
December 2016: 113.7
SERIES: Consumer Confidence SOURCE: The Conference Board
0
20
40
60
80
100
120
IND
EX, 1
00=1
985

Unemployment Rate Falling November 2016: US 4.6% & CA 5.3%
SERIES: Unemployment Rate SOURCE: US Bureau of Labor Statistics, CA Employment Development Division
The U-6 rate covers the unemployed, underemployed and those who are not looking but who want a job
-4%
-2%
0%
2%
4%
6%
8%
10%
12%
14% US-CA CA US
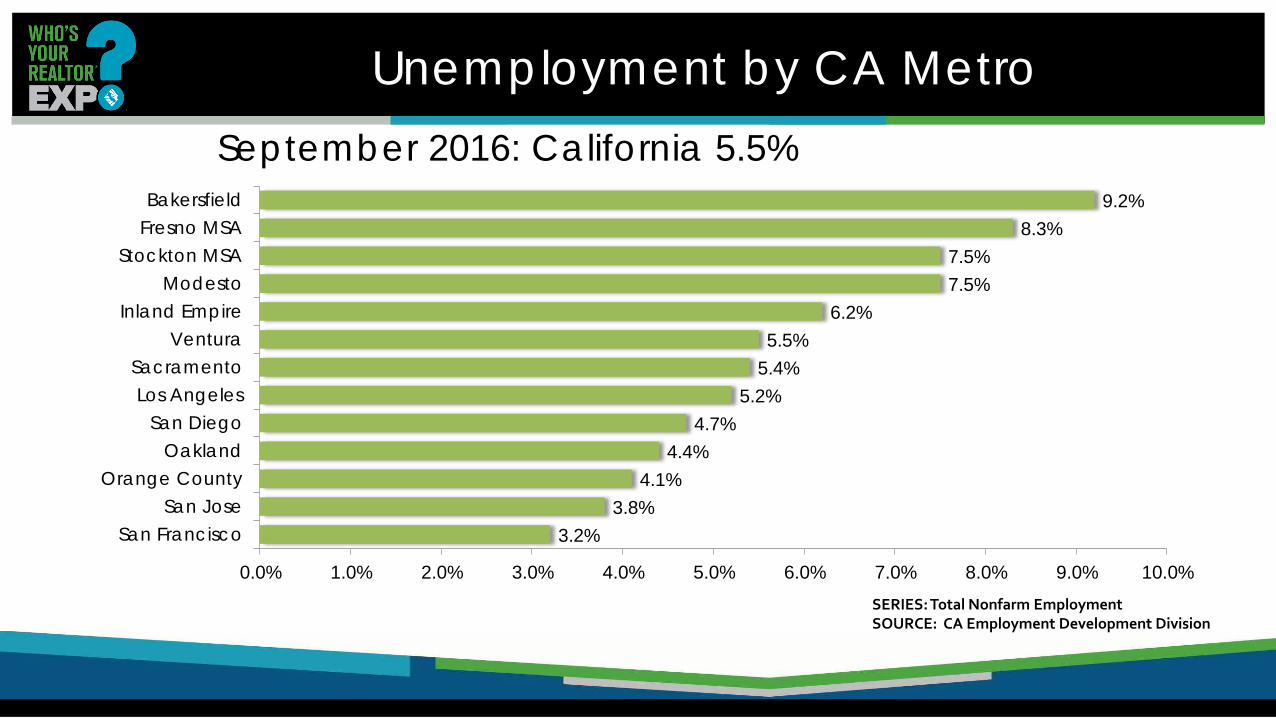
Unemployment by CA Metro
3.2% 3.8%
4.1% 4.4%
4.7% 5.2%
5.4% 5.5%
6.2% 7.5% 7.5%
8.3% 9.2%
0.0% 1.0% 2.0% 3.0% 4.0% 5.0% 6.0% 7.0% 8.0% 9.0% 10.0%
San FranciscoSan Jose
Orange CountyOakland
San DiegoLos Angeles
SacramentoVentura
Inland EmpireModesto
Stockton MSAFresno MSABakersfield
SERIES: Total Nonfarm Employment SOURCE: CA Employment Development Division
September 2016: California 5.5%

Ca Leads Nation in Job Growth 2.3 v. 1.7
-8
-6
-4
-2
0
2
4
6
AN
NUA
L PE
RCEN
T C
HA
NG
E
California US
SERIES: Total Nonfarm Employment SOURCE: US Bureau of Labor Statistics, CA Employment Development Division
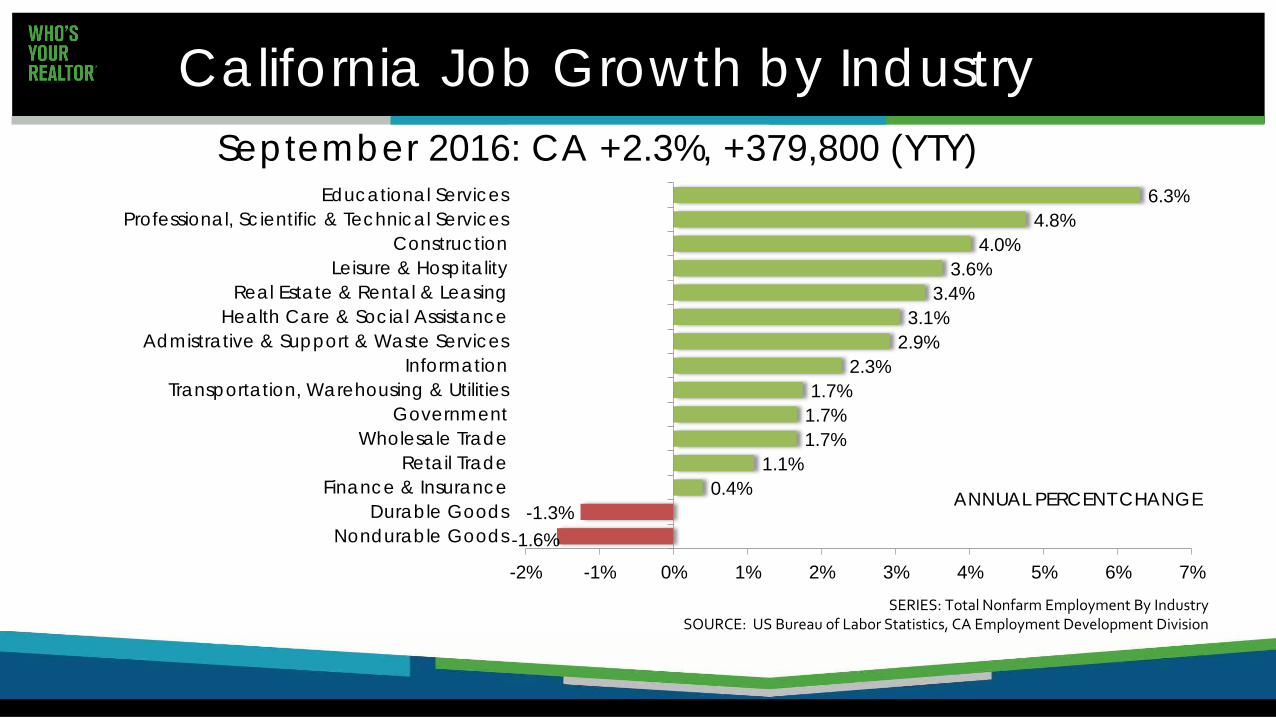
California Job Growth by Industry
-1.6% -1.3%
0.4% 1.1%
1.7% 1.7% 1.7%
2.3% 2.9% 3.1%
3.4% 3.6%
4.0% 4.8%
6.3%
-2% -1% 0% 1% 2% 3% 4% 5% 6% 7%
Nondurable GoodsDurable Goods
Finance & InsuranceRetail Trade
Wholesale TradeGovernment
Transportation, Warehousing & UtilitiesInformation
Admistrative & Support & Waste ServicesHealth Care & Social Assistance
Real Estate & Rental & LeasingLeisure & Hospitality
ConstructionProfessional, Scientific & Technical Services
Educational Services
SERIES: Total Nonfarm Employment By Industry SOURCE: US Bureau of Labor Statistics, CA Employment Development Division
September 2016: CA +2.3%, +379,800 (YTY)
ANNUAL PERCENT CHANGE

Job Trends by Metro: Modesto???
1.0% 1.2%
1.5% 1.6%
1.6% 1.8%
2.1% 2.4%
2.5% 2.6% 2.6%
3.2% 3.9%
0.0% 1.0% 2.0% 3.0% 4.0% 5.0%
Fresno MSABakersfield
VenturaStockton
Los AngelesInland Empire
San DiegoSan Francisco
OaklandOrange
SacramentoSan JoseModesto
SERIES: Total Nonfarm Employment SOURCE: CA Employment Development Division
October 2016: CA +2.4%, +389,500 (YTY)

U.S. Economic Outlook
SERIES: U.S. Economic Outlook SOURCE: CALIFORNIA ASSOCIATION OF REALTORS®
2011 2012 2013 2014 2015 2016p 2017f
US GDP 1.8% 2.3% 2.2% 2.4% 2.4% 1.5% 2.2%
Nonfarm Job Growth
1.2% 1.7% 1.7% 1.9% 2.1% 1.8% 1.4%
Unemployment 8.9% 8.1% 7.4% 6.2% 5.3% 4.9% 4.7%
CPI 3.1% 2.1% 1.5% 1.6% 0.1% 1.4% 2.1%
Real Disposable Income, % Change 2.5% 3.2% -1.4% 2.7% 3.4% 2.7% 2.7%
30-Yr FRM 4.5% 3.7% 4.0% 4.2% 3.9% 3.6% 4.0%

The “New” Normal

The “New” Housing Normal
• Lack of supply hinders sales • High-end: discretionary & slowing • Low/Moderate-end: demand continues unabated • Urban coastal CA slowing • Inland and Central and Northern CA growing • Migration patterns mirror housing affordability and jobs • Demographics is Destiny: Boomers aren’t moving, even when
they retire

Supply: Listings

Inventory Stays Below Last Year @ 3.1 Mos Nov. 2015: 4.2 Months; Nov. 2016: 3.1 Months
Note: “Unsold Inventory Index” represents the number of months it would take to sell the remaining inventory for the month in question. The remaining inventory for the month is defined as the number of properties that were “Active”, “Pending”, and “Contingent” (when available) and divide the sum by the number of “Sold” properties for the month in question.
0.0
2.0
4.0
6.0
8.0
10.0
12.0
14.0
16.0
18.0
SERIES: Unsold Inventory Index of Existing Single Family Homes SOURCE: CALIFORNIA ASSOCIATION OF REALTORS®
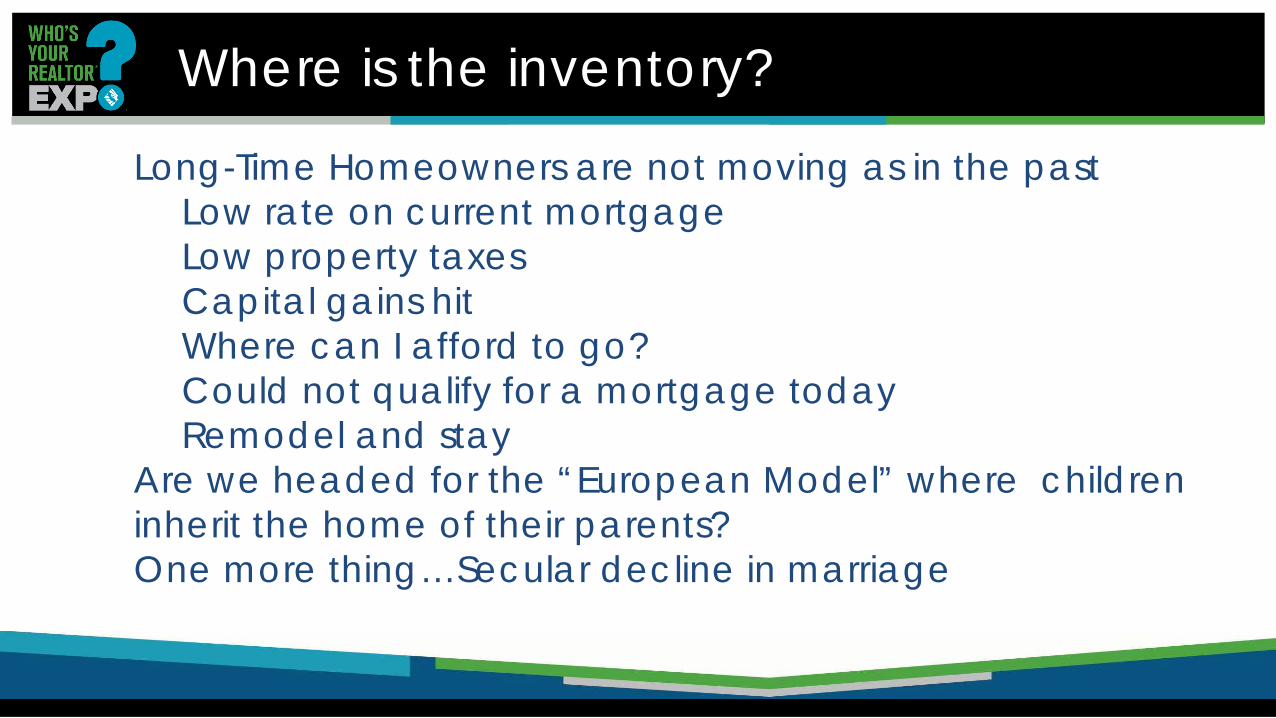
Where is the inventory?
Long-Time Homeowners are not moving as in the past Low rate on current mortgage Low property taxes Capital gains hit Where can I afford to go? Could not qualify for a mortgage today Remodel and stay
Are we headed for the “European Model” where children inherit the home of their parents? One more thing…Secular decline in marriage

Boomers Not Moving as Often
0.9% 0.8% 1.9%
5.7%
10.7%
21.3% 24.0%
31.8%
24.4%
9.0% 11.0%
12.4% 14.2%
12.0% 8.9%
7.3%
0%
5%
10%
15%
20%
25%
30%
35%
1978 & Earlier 1979 to 1984 1985 to 1989 1990 to 1994 1995 to 1999 2000 to 2005 2005 to 2009 2010 to 2013
California Homeowners by Length of Tenure, 2013 Under 55 55+
SERIES: Distribution of Home Ownership by Year Moved In SOURCE: U.S. Census Bureau, 2013 American Housing Survey
71% of Californian’s aged 55+ haven’t moved since 1999
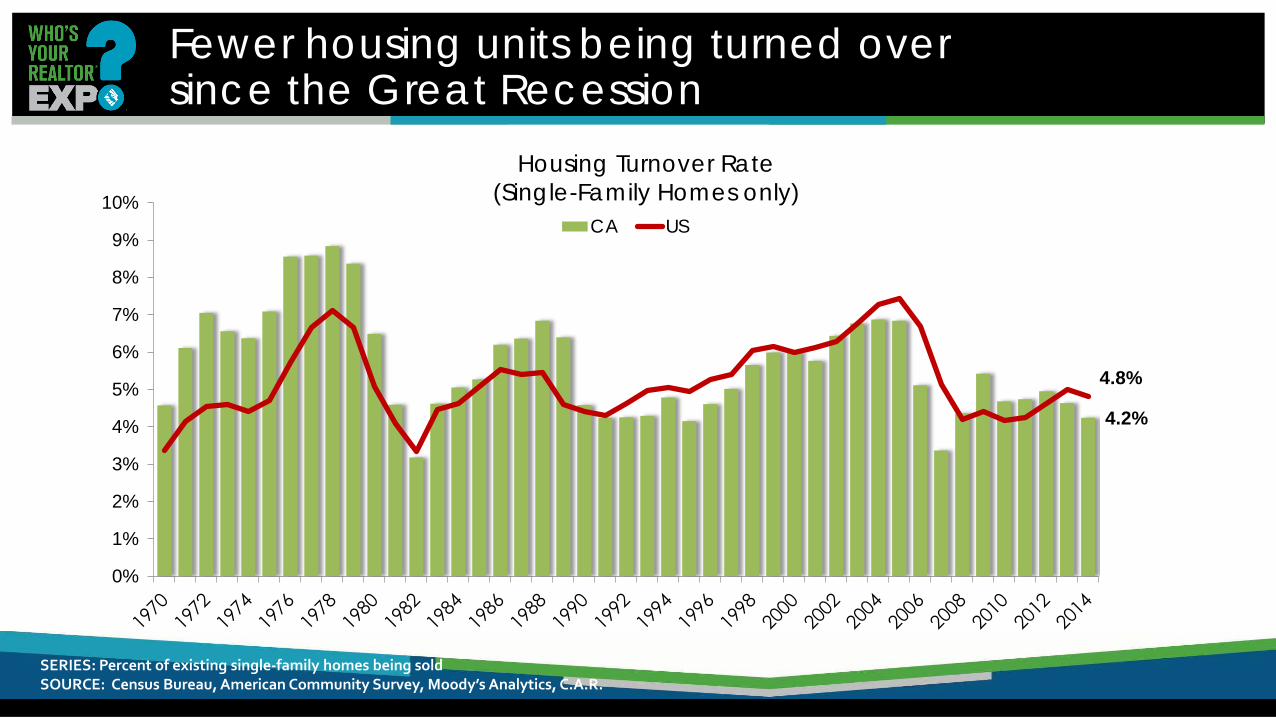
Fewer housing units being turned over since the Great Recession
4.2%
4.8%
0%
1%
2%
3%
4%
5%
6%
7%
8%
9%
10%CA US
SERIES: Percent of existing single-family homes being sold SOURCE: Census Bureau, American Community Survey, Moody’s Analytics, C.A.R.
Housing Turnover Rate (Single-Family Homes only)

Years Owned Home Before Selling
10
0
2
4
6
8
10
12 All Sellers
SERIES: 2016 Housing Market Survey SOURCE: CALIFORNIA ASSOCIATION OF REALTORS®

Owners Investing in Staying Put ?
$3.9 Billion through July
0.00.51.01.52.02.53.03.54.04.5
88 89 90 91 92 93 94 95 96 97 98 99 00 01 02 03 04 05 06 07 08 09 10 11 12 13 14 15 16
$ Bi
llions
Year-to-Date Through July
Alterations/Additions Reach All-Time High & Gaining Steam Up 16% from 2015 YTD levels
SOURCE: California Homebuilding Foundation (CHF)/Construction Industry Research Board (CIRB) Downloaded from Moody’s Analytics

Most Have Equity in their Home
Do you have equity in your home?
Yes, 92%
No, 8%
SERIES: 2016 Baby Boomer Survey SOURCE: CALIFORNIA ASSOCIATION OF REALTORS®

Majority Do Not Plan to Sell Home When they Retire
Do you plan to sell your current home when you retire?
Yes, 36%
No, 64%
SERIES: 2016 Baby Boomer Survey SOURCE: CALIFORNIA ASSOCIATION OF REALTORS®
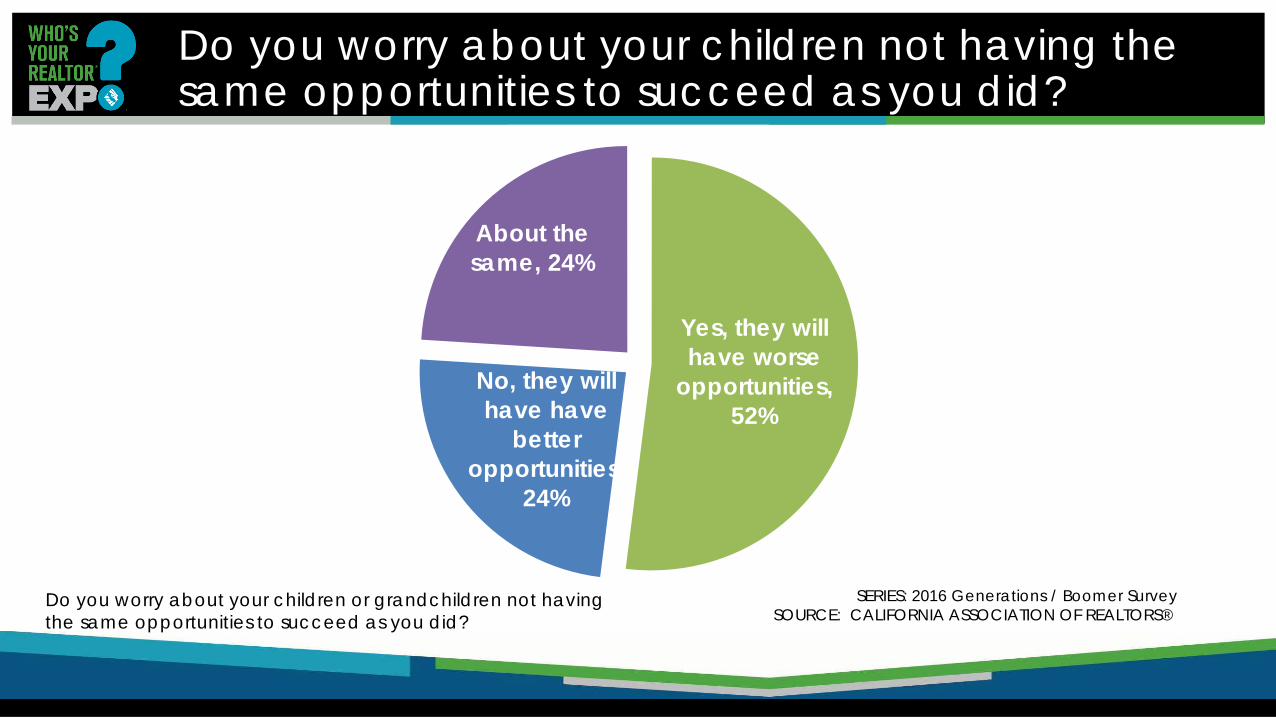
Do you worry about your children not having the same opportunities to succeed as you did?
Do you worry about your children or grandchildren not having the same opportunities to succeed as you did?
Yes, they will have worse
opportunities, 52%
No, they will have have
better opportunities,
24%
About the same, 24%
SERIES: 2016 Generations / Boomer Survey SOURCE: CALIFORNIA ASSOCIATION OF REALTORS®

Time to talk: ¾ Plan of have already Helped Children with Down Payment
Are you planning to provide help for your children to buy a home by contributing to their down payment or mortgage payments?
Yes, I am planning to help, 53% Yes, I have
already helped, 24%
No, 23%
SERIES: 2016 Generations / Boomer Survey SOURCE: CALIFORNIA ASSOCIATION OF REALTORS®

California’s Single-Family Housing Stock
0
500,000
1,000,000
1,500,000
2,000,000
2,500,000
3,000,000
5,000,000
5,500,000
6,000,000
6,500,000
7,000,000
7,500,000
2000 2003 2006 2009 2012 2015
Owner-Occupied (left) Renter-Occupied (right)
SOURCE: U.S. Census Bureau, Annual Social and Economic Supplement (ASEC) to the Current Population Survey (CPS) Downloaded from the National Bureau of Economic Research (NBER)

More Single Family Units Now Rentals
6,919,164
1,940,607
6,527,730
2,674,808
0
1,000,000
2,000,000
3,000,000
4,000,000
5,000,000
6,000,000
7,000,000
8,000,000
SF Owners SF Renters
2000 2005 2010 2015 SOURCE: U.S. Census Bureau, Annual Social and Economic Supplement (ASEC) to the Current Population Survey (CPS) Downloaded from the National Bureau of Economic Research (NBER)
Potentially between 400,000 and 700,000 SF Rentals that Used to be Owner-Occupied

Supply: New Housing Units
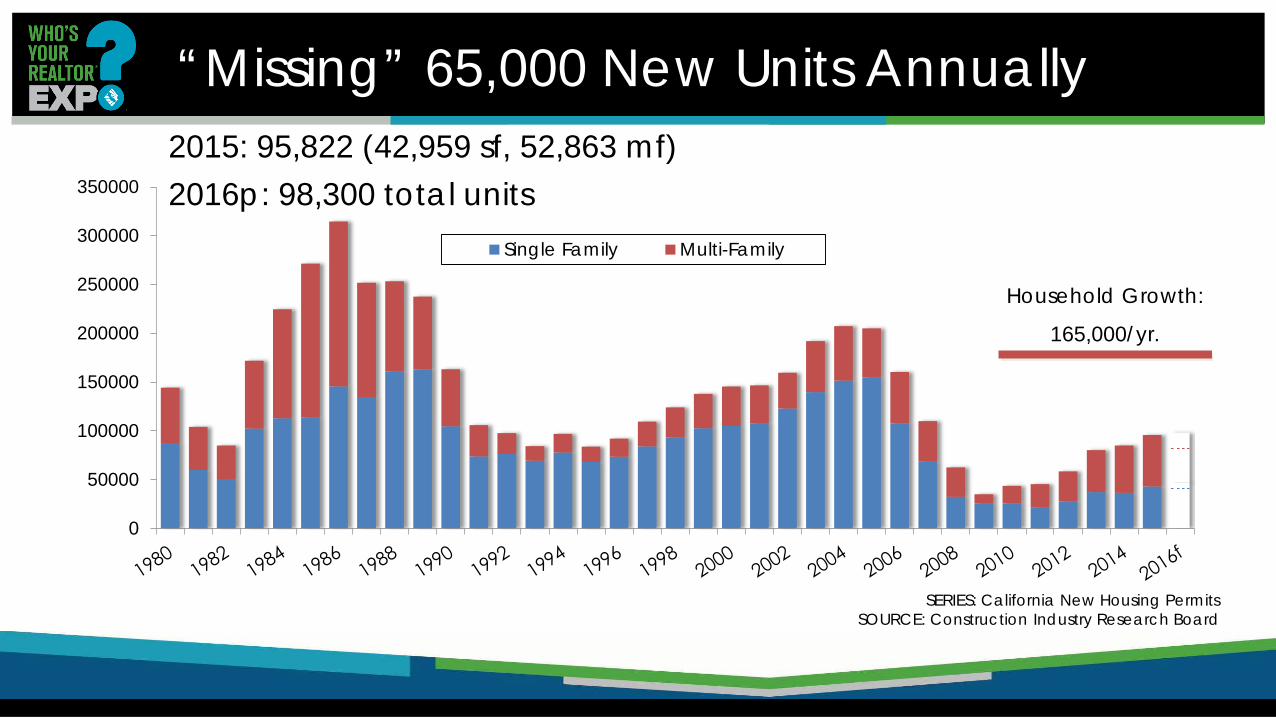
“Missing” 65,000 New Units Annually
SERIES: California New Housing Permits SOURCE: Construction Industry Research Board
0
50000
100000
150000
200000
250000
300000
350000
Single Family Multi-Family
Household Growth:
165,000/yr.
2015: 95,822 (42,959 sf, 52,863 mf) 2016p: 98,300 total units

Most Underbuilt Counties in California
381,300
174,833 162,740 127,542 141,162
95,245 98,149 105,586 66,054 44,772
88,134 35,426 44,923
18,141 40,434 14,901 18,108 31,255
6,349 10,890 0
50,000100,000150,000200,000250,000300,000350,000400,000450,000
New Jobs vs. New Permits (2010-2015) JobsPermits
SOURCE: California Employment Development Department, Construction Industry Research Board

Affordability

Housing Affordability Best in C.V.
57 56 56 54 52 50 50 50
48 46 45 45 45
41
32 31 30 29
27 26 26 25 25 22
20 20 19 18 17 14 13
0
10
20
30
40
50
60
SERIES: Housing Affordability Index SOURCE: CALIFORNIA ASSOCIATION OF REALTORS®
2016-Q2: % able to purchase median-priced home
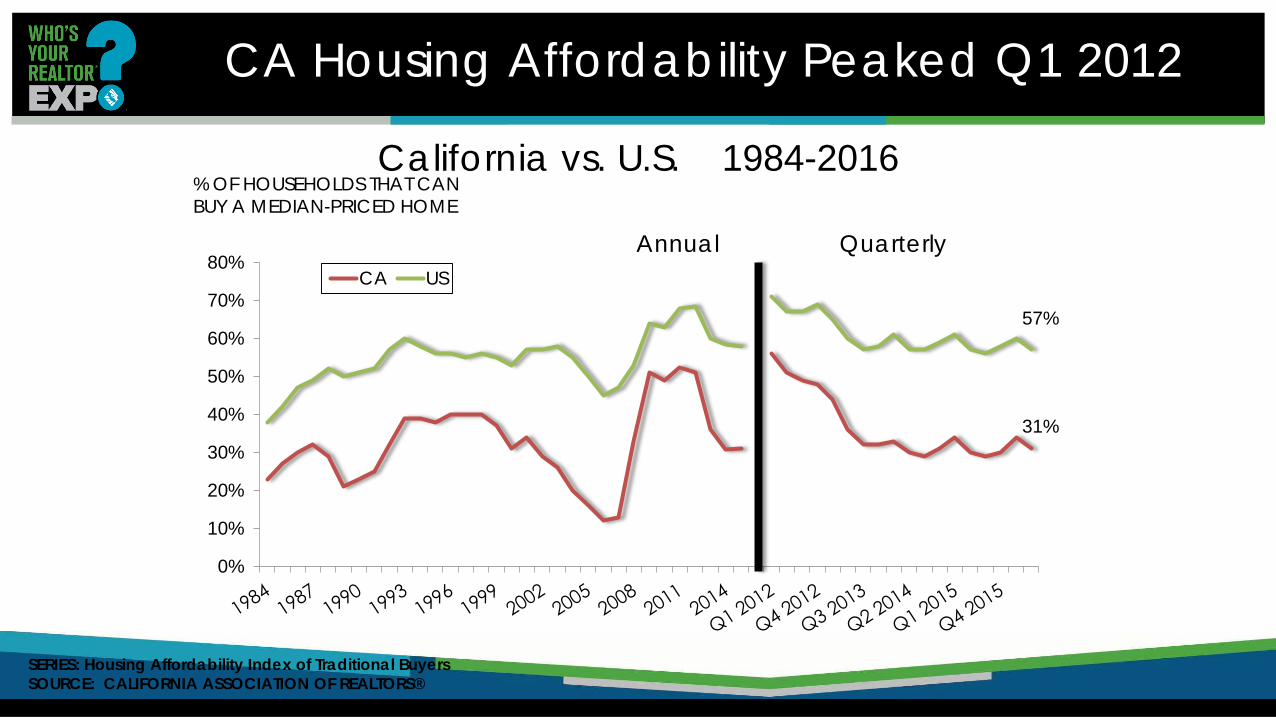
CA Housing Affordability Peaked Q1 2012
California vs. U.S. 1984-2016
% OF HOUSEHOLDS THAT CAN BUY A MEDIAN-PRICED HOME
SERIES: Housing Affordability Index of Traditional Buyers SOURCE: CALIFORNIA ASSOCIATION OF REALTORS®
31%
57%
0%
10%
20%
30%
40%
50%
60%
70%
80%CA US
Annual Quarterly

$28,430
$45,810
$72,360 $67,920
$93,550 $92,170 $101,260
$126,560
$92,571
-$10,000
$10,000
$30,000
$50,000
$70,000
$90,000
$110,000
$130,000
RetailSalespersons
Chefs andHead Cooks
ElementarySchool
Teachers
Firefighters Police andSherriff's Patrol
Officers
ComputerProgrammers
RegisteredNurses
SoftwareDevelopers
(Applications)
Min. IncRequired toBuy a Med.
Home
Wages v. Income Required to Qualify
SOURCE: Bureau of Labor Statistics, C.A.R.
2015 Annual Mean Wage
California

Share of First-Time Buyers remains Below Long-Run Average
29.5%
0%
10%
20%
30%
40%
50%
2005 2006 2007 2008 2009 2010 2011 2012 2013 2014 2015 2016
% First-Time Home Buyers Long Run Average
Long Run Average = 38%
SERIES: 2015 Housing Market Survey SOURCE: CALIFORNIA ASSOCIATION OF REALTORS®
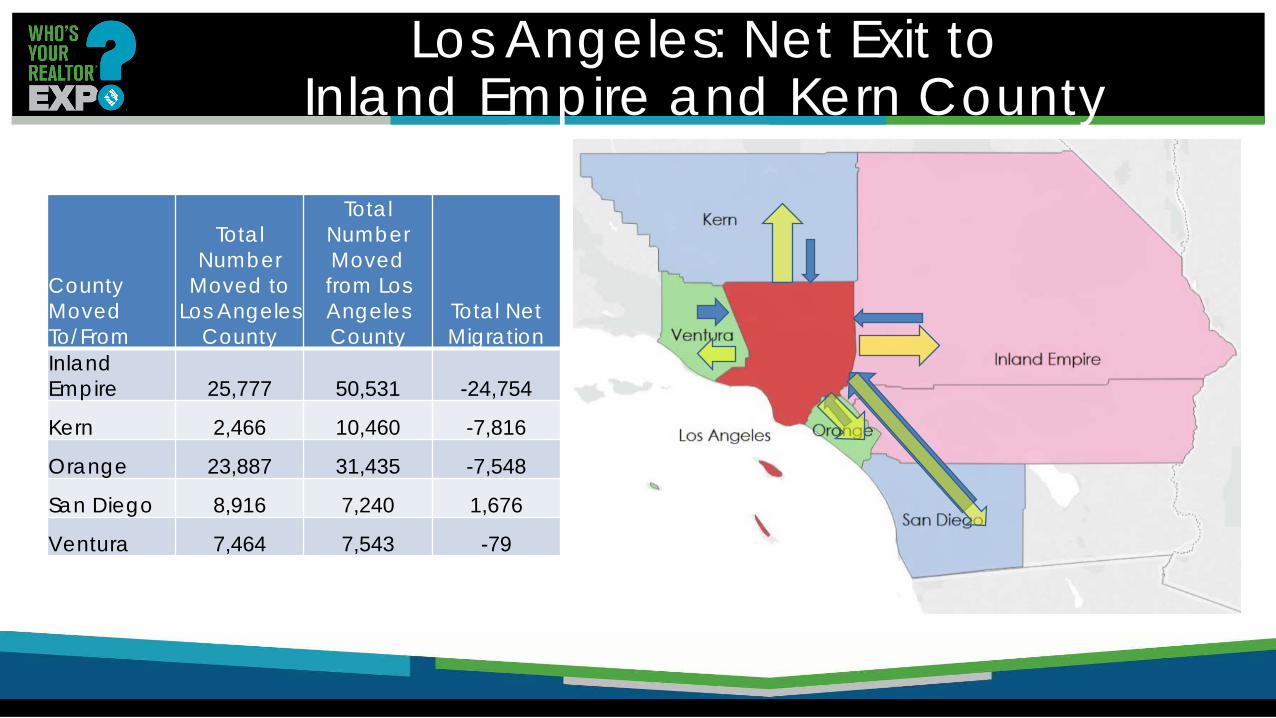
Los Angeles: Net Exit to Inland Empire and Kern County
County Moved To/From
Total Number
Moved to Los Angeles
County
Total Number Moved from Los Angeles County
Total Net Migration
Inland Empire 25,777 50,531 -24,754
Kern 2,466 10,460 -7,816
Orange 23,887 31,435 -7,548
San Diego 8,916 7,240 1,676
Ventura 7,464 7,543 -79

San Francisco: Affordability & Jobs Drive Migration
County Moved To/From
Total Number Moved to San Francisco County
Total Number Moved from San Francisco County Total Net Migration
Alameda 3983 10345 -6362
San Mateo 6161 7984 -1823
Contra Costa 1856 2998 -1142
Sonoma 557 1602 -1045
Marin 1428 1918 -490
Napa 0 243 -243
Solano 796 815 -19
Santa Clara 4041 2691 1350

The median income in Oakland is $47,000, which translates to $1,175/month for rent, but the average monthly rent in Oakland is $3,000.
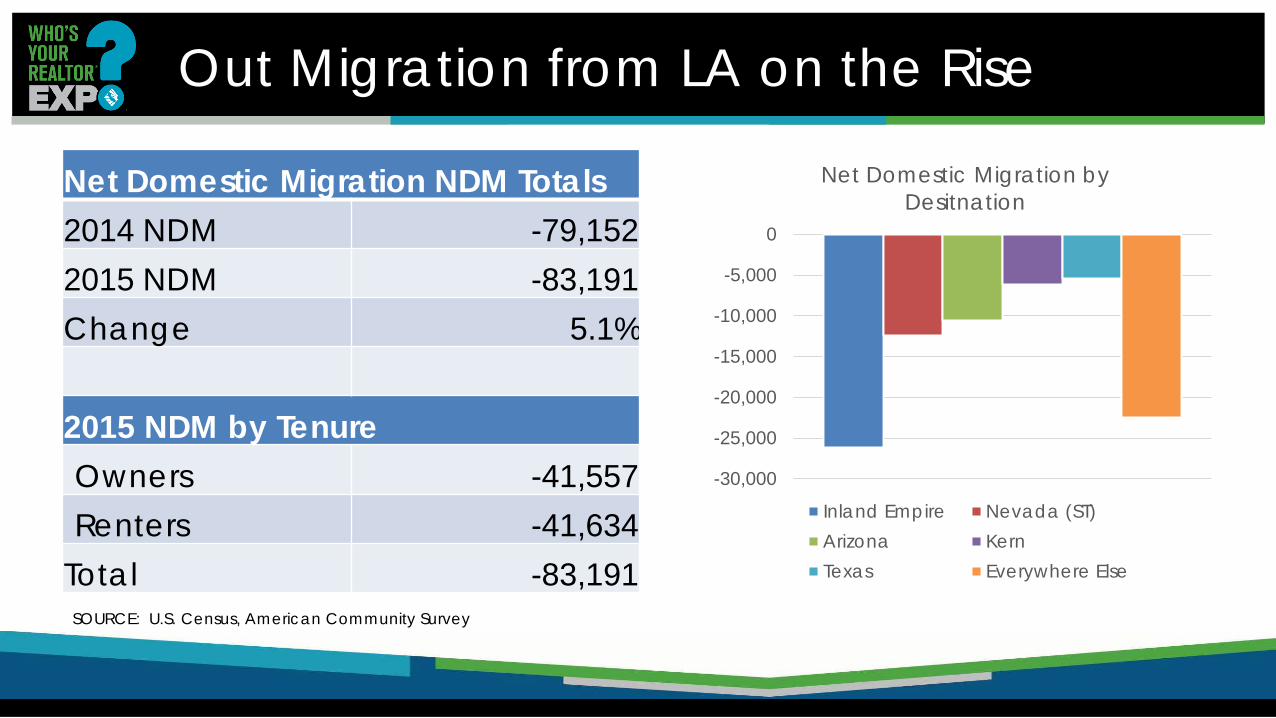
Out Migration from LA on the Rise
Net Domestic Migration NDM Totals 2014 NDM -79,152 2015 NDM -83,191 Change 5.1%
2015 NDM by Tenure Owners -41,557 Renters -41,634
Total -83,191 SOURCE: U.S. Census, American Community Survey
-30,000
-25,000
-20,000
-15,000
-10,000
-5,000
0
Net Domestic Migration by Desitnation
Inland Empire Nevada (ST)Arizona KernTexas Everywhere Else

Who’s Leaving? It’s a Housing Story
2015 NDM by Income
Under $25K -26,579
$25-$50K -14,523
$50-$100K -18,611
$100-$200K -8,406
$200K + -15,072
Total Net Migration -83,191
-47%
-28%
-20%
-3%
Net Domestic Migration by Age
Millennials Gen XBaby Boomers Greatest Generation
SOURCE: U.S. Census, American Community Survey

Same Story by Education: It’s Housing
2015 NDM by Education Level
Less than HS -19,378
HS Grad. -27,698
Some College -34,554
BA/BS 1,773
Grad. -3,334
Total -83,191 -40,000
-35,000
-30,000
-25,000
-20,000
-15,000
-10,000
-5,000
0
5,000Net Domestic Migration by Education
Less than HS HS Grad. Some College BA/BS Grad.
SOURCE: U.S. Census, American Community Survey
Austin: 70% Raleigh: 40% Portland: 30%

Demand & Desire for Homeownership
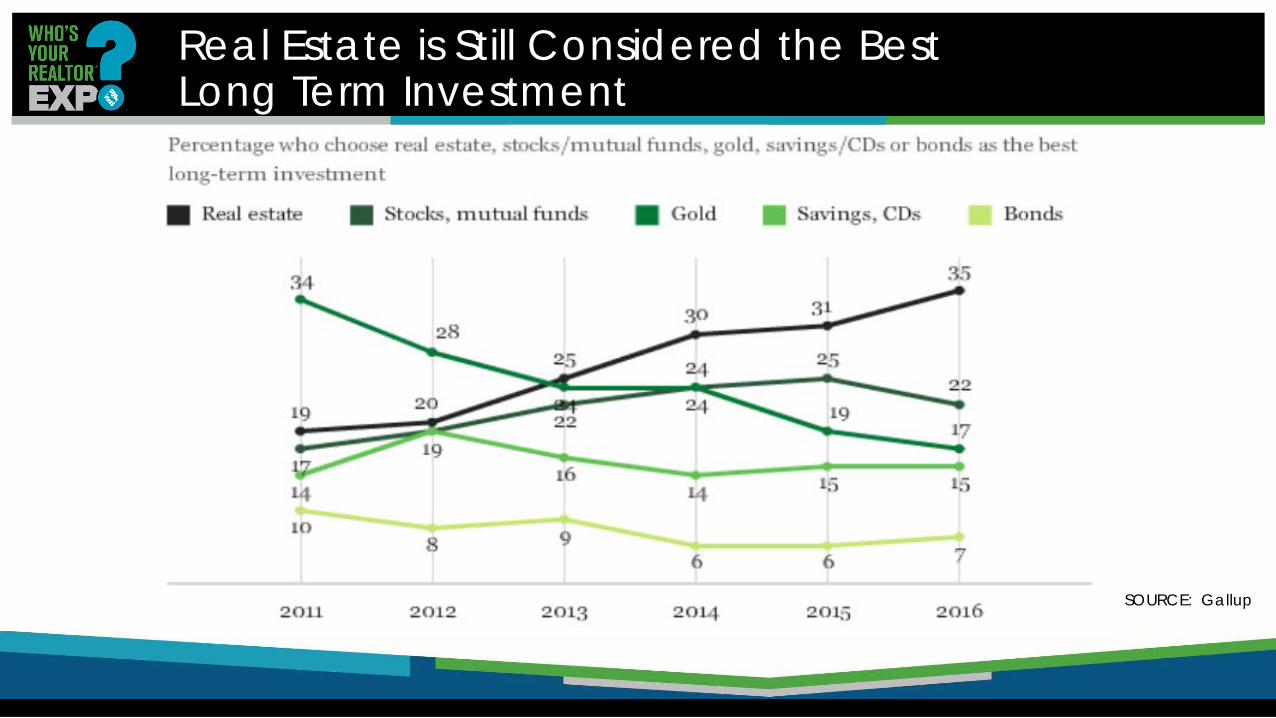
Real Estate is Still Considered the Best Long Term Investment
SOURCE: Gallup
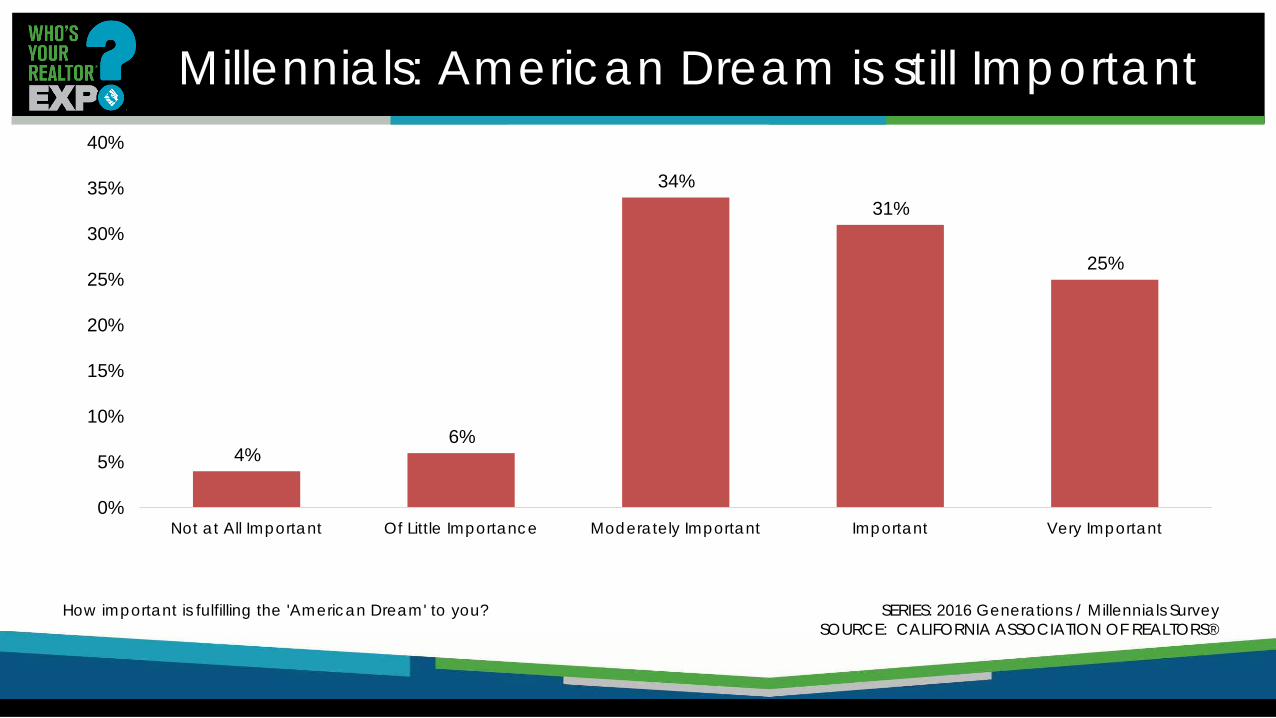
Millennials: American Dream is still Important
4% 6%
34% 31%
25%
0%
5%
10%
15%
20%
25%
30%
35%
40%
Not at All Important Of Little Importance Moderately Important Important Very Important
How important is fulfilling the 'American Dream' to you? SERIES: 2016 Generations / Millennials Survey SOURCE: CALIFORNIA ASSOCIATION OF REALTORS®
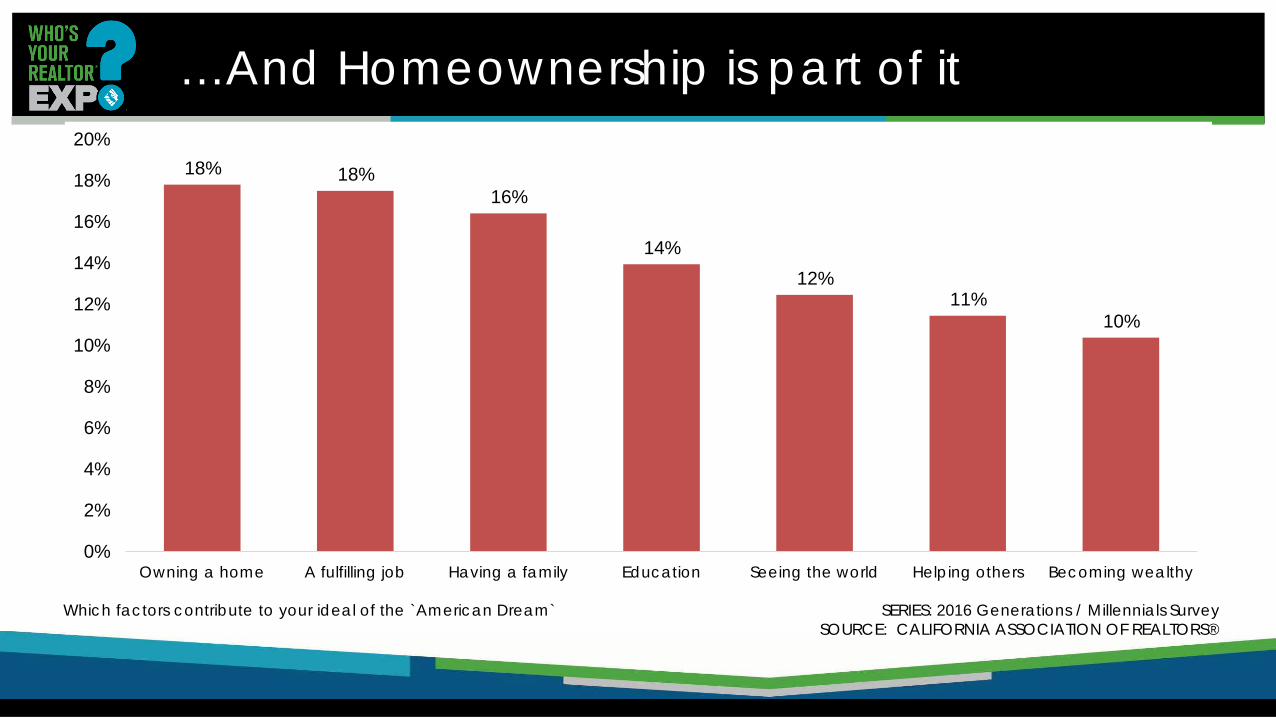
…And Homeownership is part of it
18% 18% 16%
14% 12%
11% 10%
0%
2%
4%
6%
8%
10%
12%
14%
16%
18%
20%
Owning a home A fulfilling job Having a family Education Seeing the world Helping others Becoming wealthy
Which factors contribute to your ideal of the `American Dream` SERIES: 2016 Generations / Millennials Survey SOURCE: CALIFORNIA ASSOCIATION OF REALTORS®
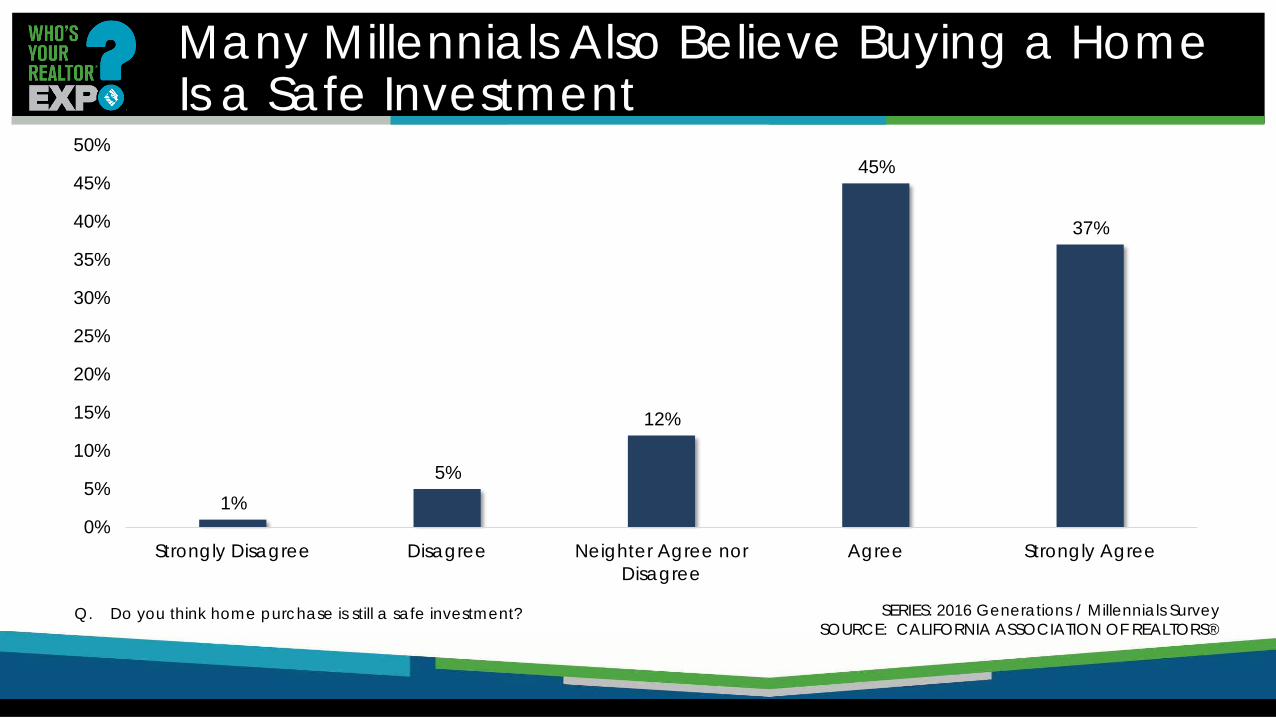
Many Millennials Also Believe Buying a Home Is a Safe Investment
SERIES: 2016 Generations / Millennials Survey SOURCE: CALIFORNIA ASSOCIATION OF REALTORS®
1% 5%
12%
45%
37%
0%
5%
10%
15%
20%
25%
30%
35%
40%
45%
50%
Strongly Disagree Disagree Neighter Agree norDisagree
Agree Strongly Agree
Q. Do you think home purchase is still a safe investment?
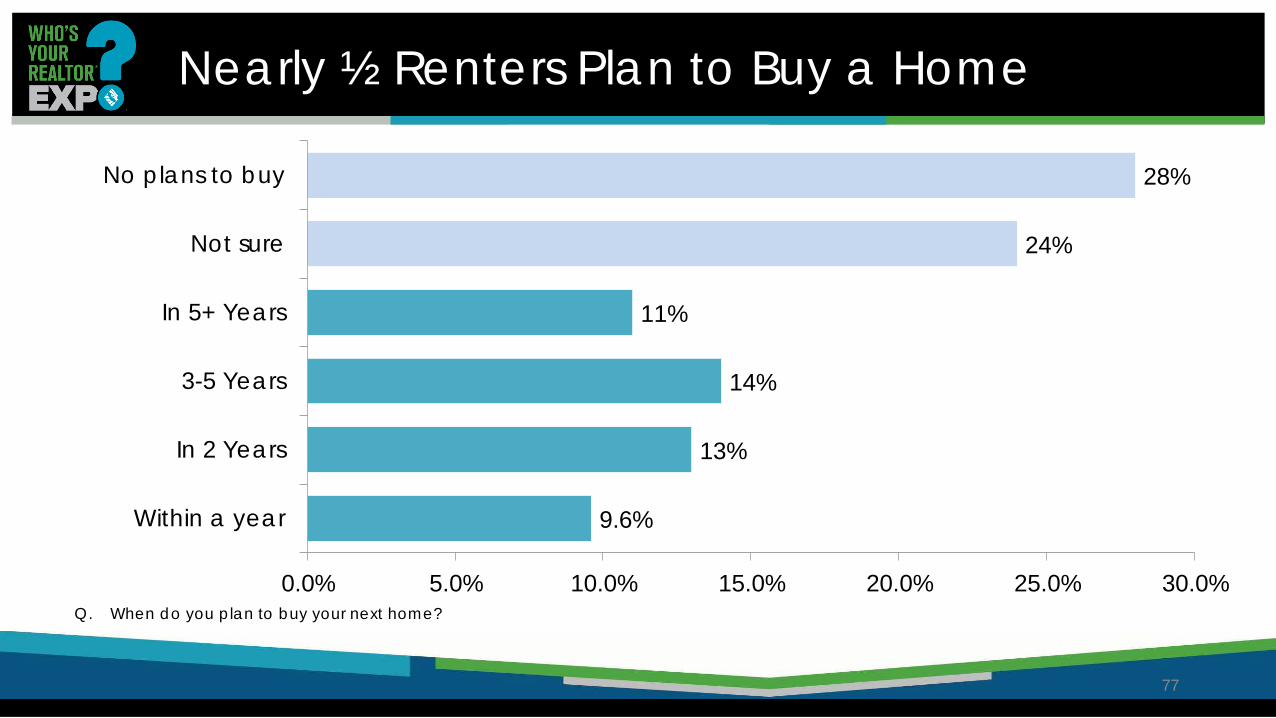
Nearly ½ Renters Plan to Buy a Home
77
Q. When do you plan to buy your next home?
9.6%
13%
14%
11%
24%
28%
0.0% 5.0% 10.0% 15.0% 20.0% 25.0% 30.0%
Within a year
In 2 Years
3-5 Years
In 5+ Years
Not sure
No plans to buy
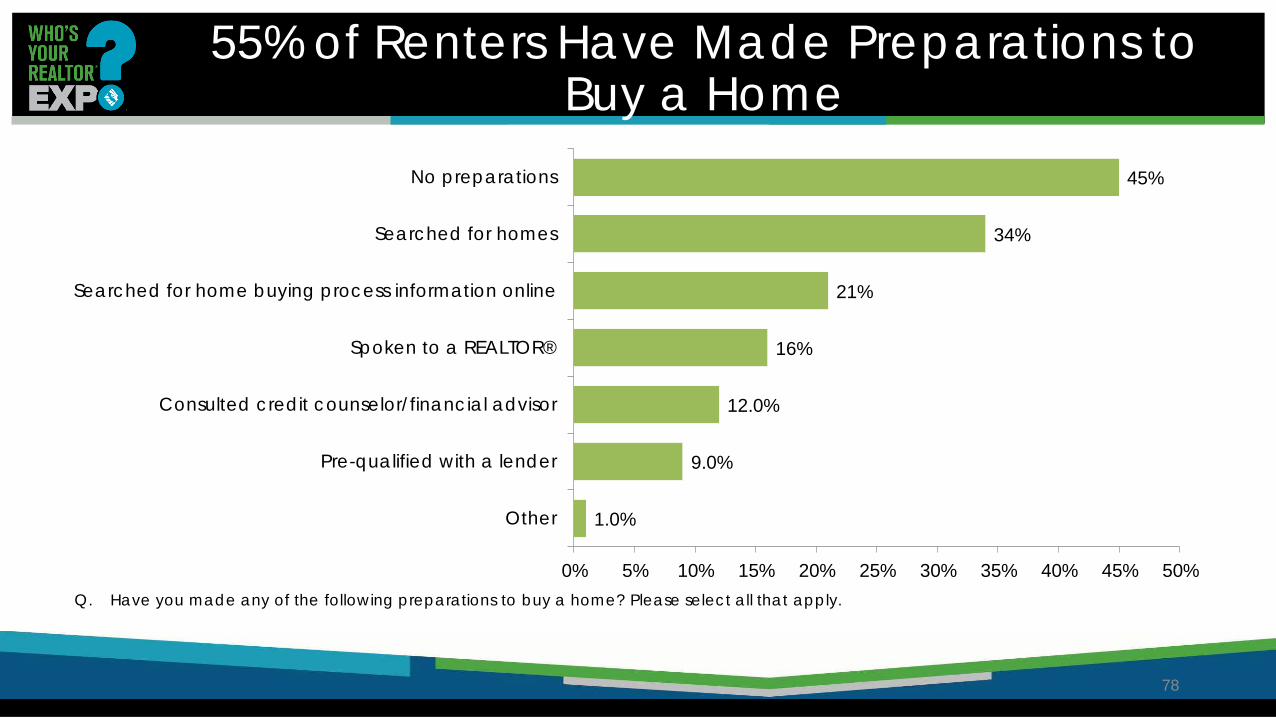
55% of Renters Have Made Preparations to Buy a Home
78
1.0%
9.0%
12.0%
16%
21%
34%
45%
0% 5% 10% 15% 20% 25% 30% 35% 40% 45% 50%
Other
Pre-qualified with a lender
Consulted credit counselor/financial advisor
Spoken to a REALTOR®
Searched for home buying process information online
Searched for homes
No preparations
Q. Have you made any of the following preparations to buy a home? Please select all that apply.

69% of Millennial renters would look into purchasing if knew about lower down-payments
No, 31%
Yes, 69%
All Millennial Owners
If You knew you could qualify with lower down-payment, would you start to look for a house? SERIES: 2016 Generations / Millennials Survey SOURCE: CALIFORNIA ASSOCIATION OF REALTORS®
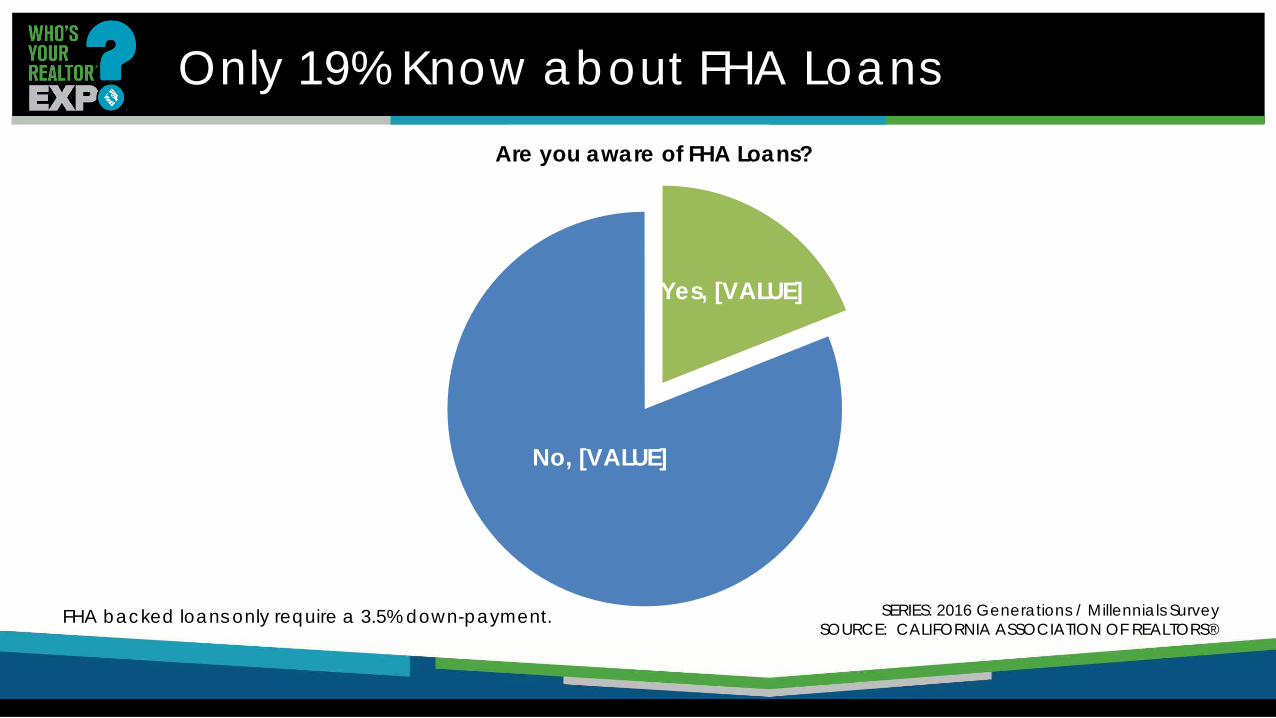
Only 19% Know about FHA Loans
Yes, [VALUE]
No, [VALUE]
Are you aware of FHA Loans?
FHA backed loans only require a 3.5% down-payment. SERIES: 2016 Generations / Millennials Survey SOURCE: CALIFORNIA ASSOCIATION OF REALTORS®

Student Loan Debt: 47% (34 or Under)

Student Debt Delayed Decisions to Move out of Family Member’s Home After College?
SERIES: 2016 Student Loan Debt and Housing Report SOURCE: National Association of Realtors®
% o
f Loa
n b
orro
wer
s

2016: Market Conditions Annual Housing Market survey
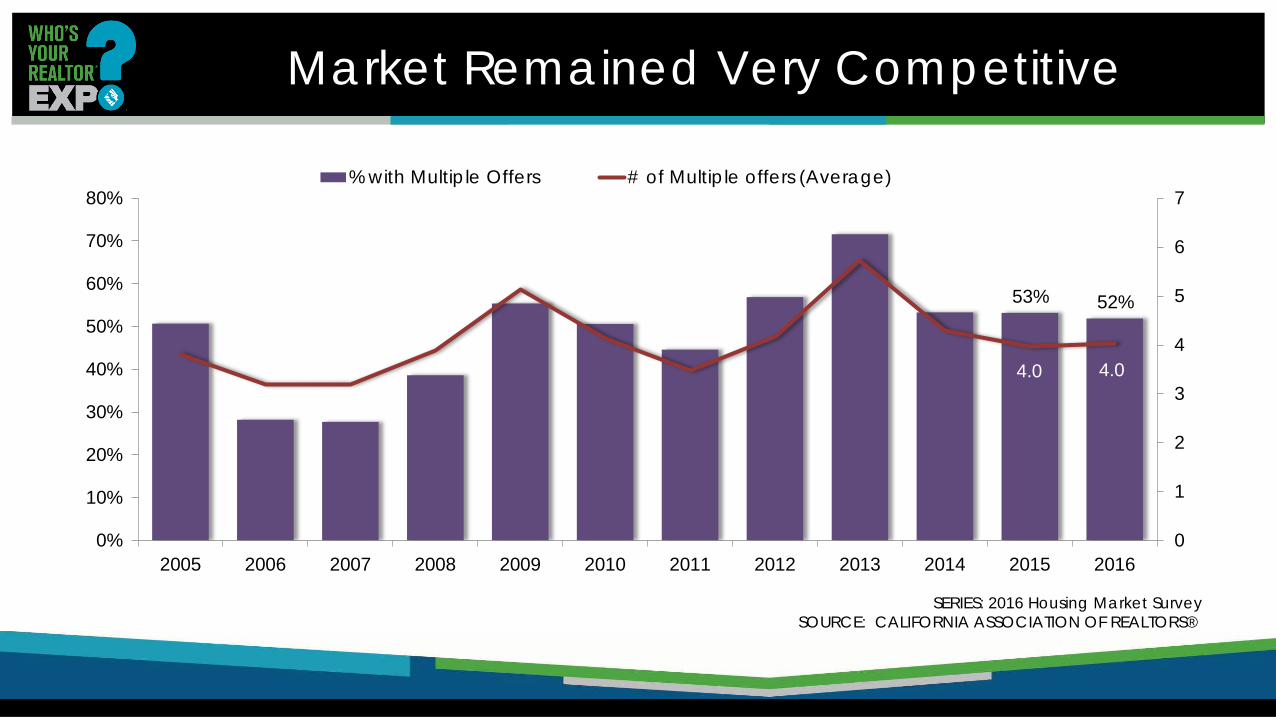
Market Remained Very Competitive
53% 52%
4.0 4.0
0
1
2
3
4
5
6
7
0%
10%
20%
30%
40%
50%
60%
70%
80%
2005 2006 2007 2008 2009 2010 2011 2012 2013 2014 2015 2016
% with Multiple Offers # of Multiple offers (Average)
SERIES: 2016 Housing Market Survey SOURCE: CALIFORNIA ASSOCIATION OF REALTORS®

Investor Buyers? Dropping Still Have Demand in Lower-Priced Segments
SERIES: 2016 Housing Market Survey SOURCE: CALIFORNIA ASSOCIATION OF REALTORS®
0%
5%
10%
15%
20%
25%
30%
1999 2000 2001 2002 2003 2004 2005 2006 2007 2008 2009 2010 2011 2012 2013 2014 2015 2016
Investment/Rental Property Vacation/Second Home% to Total Sales
Demand for Investment Properties remained at the Lowest level since 2009

International Buyers Dropping
8%
6% 5%
6% 6%
8%
6%
4%
3%
0%
1%
2%
3%
4%
5%
6%
7%
8%
9%
2008 2009 2010 2011 2012 2013 2014 2015 2016Q. Was the buyer an international buyer – a person who was a citizen of another country who wished to purchase residential real estate in the U.S.?
SERIES: 2016 Housing Market Survey SOURCE: CALIFORNIA ASSOCIATION OF REALTORS®
The share of international buyers dropped to the lowest level in 9 years

Local Housing Markets

Rancho Palos Verdes

Sales of Single Family Homes Rancho Palos Verdes, December 2016: 37 Units +7.3% 2015, +5.8% 2016 YTD, +12.1% YTY
SOURCE: Clarus Market Metrics

Median Price of Single Family Homes Rancho Palos Verdes, December 2016: $1,400,000 Up 11.3% MTM, Up 17.7% YTY
SOURCE: Clarus Market Metrics
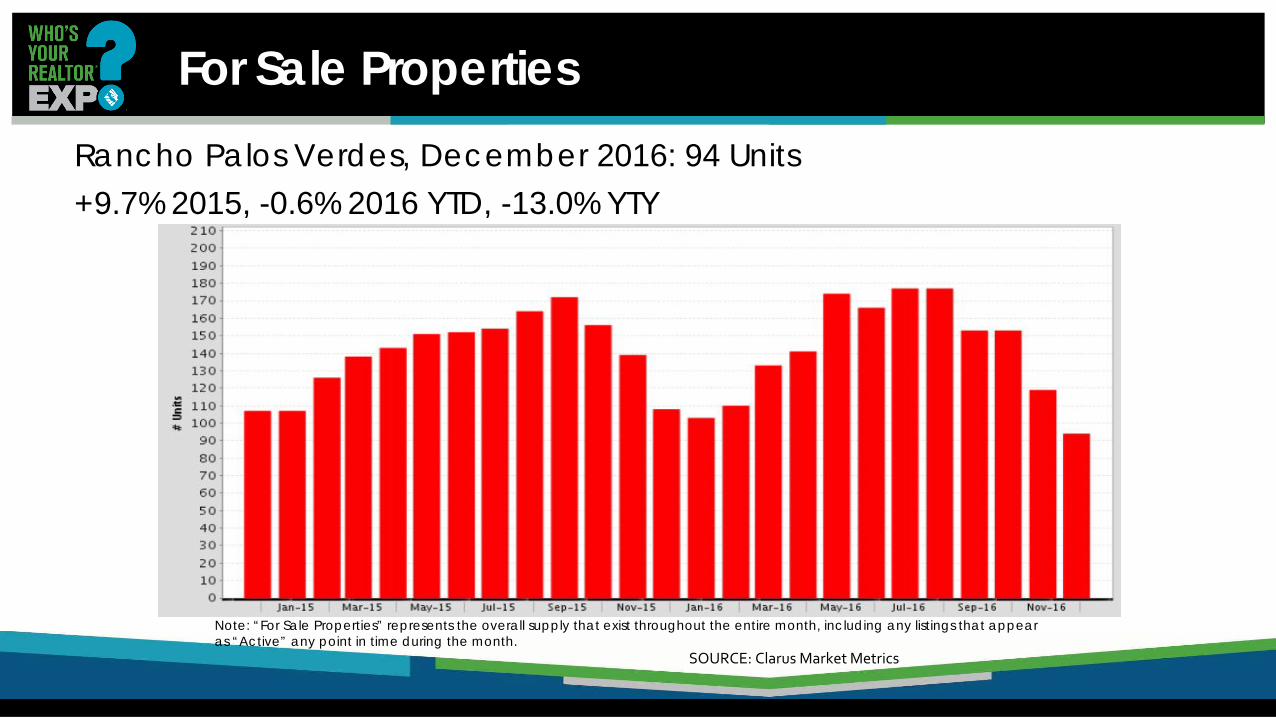
For Sale Properties Rancho Palos Verdes, December 2016: 94 Units +9.7% 2015, -0.6% 2016 YTD, -13.0% YTY
SOURCE: Clarus Market Metrics
Note: “For Sale Properties” represents the overall supply that exist throughout the entire month, including any listings that appear as “Active” any point in time during the month.

Rolling Hills Estates

Sales of Single Family Homes
Rolling Hills Estates, December 2016: 7 Units +2.5% 2015, 0% 2016 YTD, 0% YTY
SOURCE: Clarus Market Metrics

Median Price of Single Family Homes Rolling Hills Estates, December 2016: $1,580,000 Up 2.0% MTM, Up 8.2% YTY
SOURCE: Clarus Market Metrics

For Sale Properties Rolling Hills Estates, December 2016: 20 Units -8.9% 2015, +24.7% 2016 YTD, +42.9% YTY
Note: “For Sale Properties” represents the overall supply that exist throughout the entire month, including any listings that appear as “Active” any point in time during the month.
SOURCE: Clarus Market Metrics

Palos Verdes Estates

Sales of Single Family Homes
Palos Verdes Estates, December 2016: 17 Units +11.3% 2015, -11.7% 2016 YTD, +13.3% YTY
SOURCE: Clarus Market Metrics
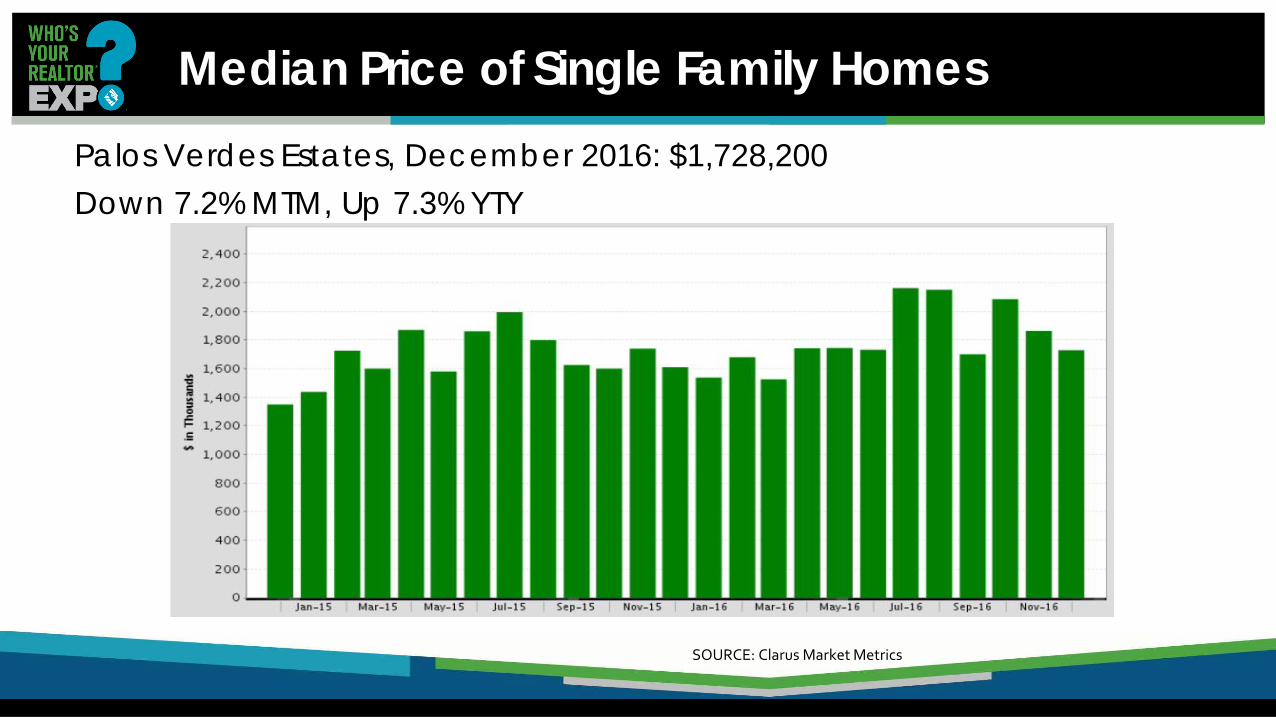
Median Price of Single Family Homes Palos Verdes Estates, December 2016: $1,728,200 Down 7.2% MTM, Up 7.3% YTY
SOURCE: Clarus Market Metrics
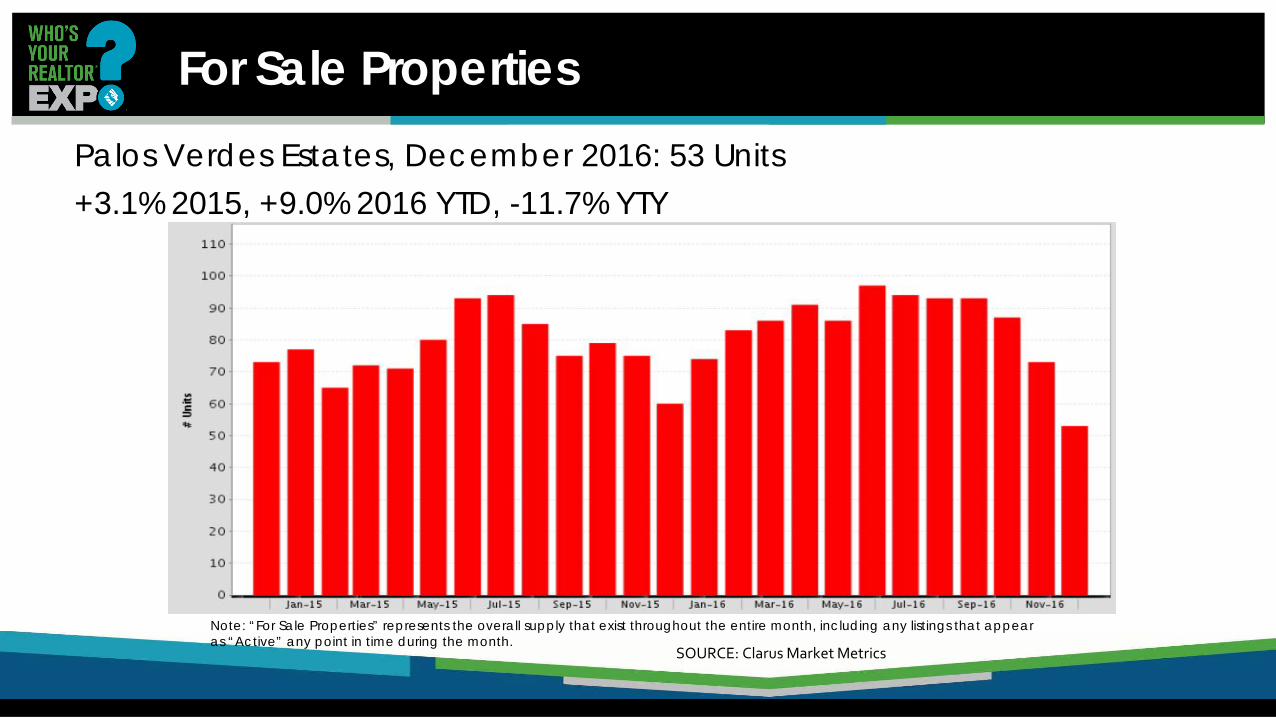
For Sale Properties Palos Verdes Estates, December 2016: 53 Units +3.1% 2015, +9.0% 2016 YTD, -11.7% YTY
Note: “For Sale Properties” represents the overall supply that exist throughout the entire month, including any listings that appear as “Active” any point in time during the month.
SOURCE: Clarus Market Metrics

2017 Forecast

Varying Market Expectations for 2017
13% 25% 29%
3.0%
40%
44% 35%
35%
47% 31% 36%
62%
0%
10%
20%
30%
40%
50%
60%
70%
80%
90%
100%
Prices Sales Inventory Interest rates
UpFlatDown
Q1 - What do you think will happen to the California real estate market in 2017?

California Housing Market Outlook
SERIES: CA Housing Market Outlook SOURCE: CALIFORNIA ASSOCIATION OF REALTORS®
2011 2012 2013 2014 2015 2016p 2017f
SFH Resales (000s) 422.6 439.8 414.9 382.7 408.8 407.3 413.0
% Change 1.4% 4.1% -5.9% -7.8% 6.8% -0.4% 1.4%
Median Price ($000s)
$286.0 $319.3 $407.2 $446.9 $474.4 $503.9 $525.6
% Change -6.2% 11.6% 27.5% 9.8% 6.2% 6.2% 4.3%
Housing Affordability Index
53% 51% 36% 30% 31% 33% 29%
30-Yr FRM 4.5% 3.7% 4.0% 4.2% 3.9% 3.6% 4.0%
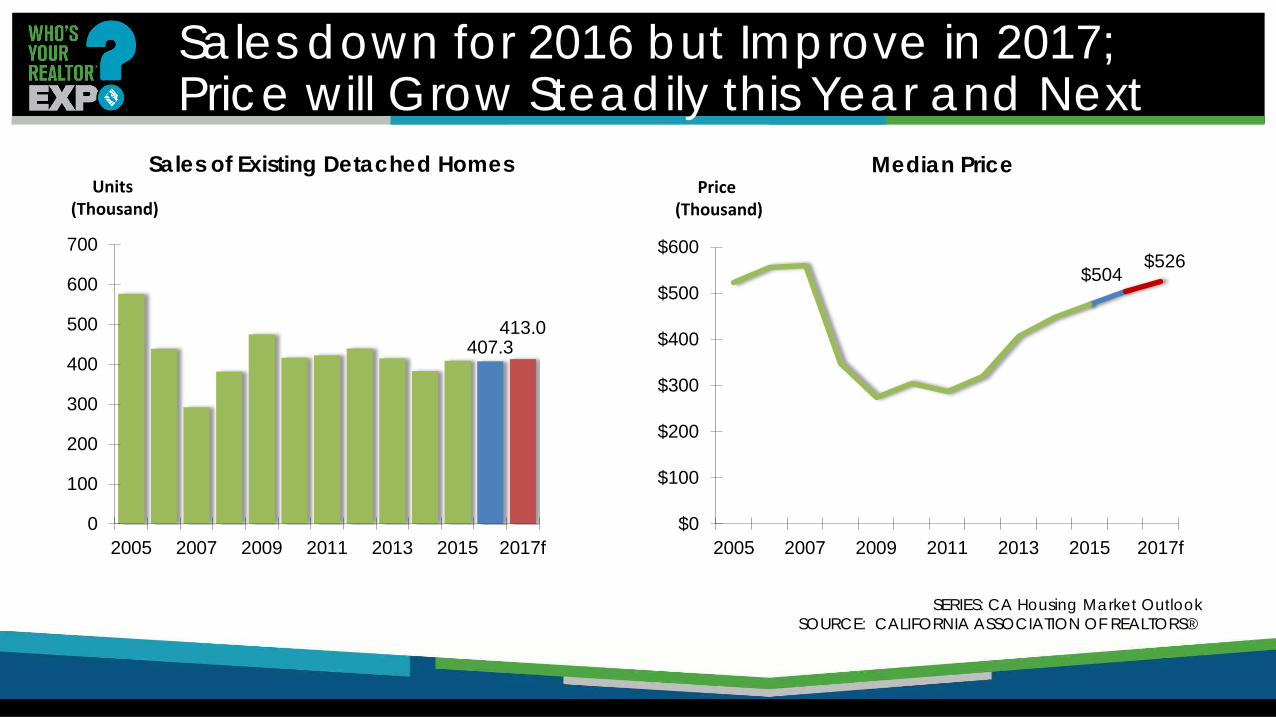
Sales down for 2016 but Improve in 2017; Price will Grow Steadily this Year and Next
SERIES: CA Housing Market Outlook SOURCE: CALIFORNIA ASSOCIATION OF REALTORS®
407.3 413.0
0
100
200
300
400
500
600
700
2005 2007 2009 2011 2013 2015 2017f
Sales of Existing Detached Homes
$504 $526
$0
$100
$200
$300
$400
$500
$600
2005 2007 2009 2011 2013 2015 2017f
Median Price Price
(Thousand) Units
(Thousand)

CA: Dollar Volume Up 5.8% in 2016, Up 5.8% in 2017
SERIES: CA Housing Market Outlook SOURCE: CALIFORNIA ASSOCIATION OF REALTORS®
$301
$244
$164 $133 $131 $127 $121
$140 $169 $171
$194 $205 $217
-40%
-30%
-20%
-10%
0%
10%
20%
30%
$0
$50
$100
$150
$200
$250
$300
$350
$400
2005 2006 2007 2008 2009 2010 2011 2012 2013 2014 2015 2016p 2017f
$ Volume of Sales Percent Change
$ in Billion % Change

1. CA home sales up slightly – down on $$$ coast; up $ inland
2. CA median price up 4.3% – flat $$$, up $ 3. Demand drivers (jobs; income; mortgage rates;
household formation) strong 4. Boomers staying put 5. Affordability concerns fuel out-migration of
Millennials in search of housing they can afford
Take 5: 2017 Market

2017 Challenges & Opportunities

[CATEGORY NAME], [VALUE] Lack of inventory,
28%
Mortagage rate increase, 10%
[CATEGORY NAME], 6%
Lack of Affordability Biggest Challenge
Q2 - What will be the biggest challenge for the housing market in 2017?

2017 Wild Cards
• Economy Under Trump • Unexpected rise in rates • Economic collapse • Tech giants crumble • Hit to equities • Global instability • Other Black Swans…

2017 Opportunities • Up your game – Always a good option • What business are YOU in? • Educate first time-home buyers – talk to their parents
• Become well versed on down payment assistance programs, debt management and improving credit to turn renters into buyers.
• Don’t give up on international buyers • Stay involved & stay current • Get married!

Book Recommendations

2017 SPF Book Recommendations
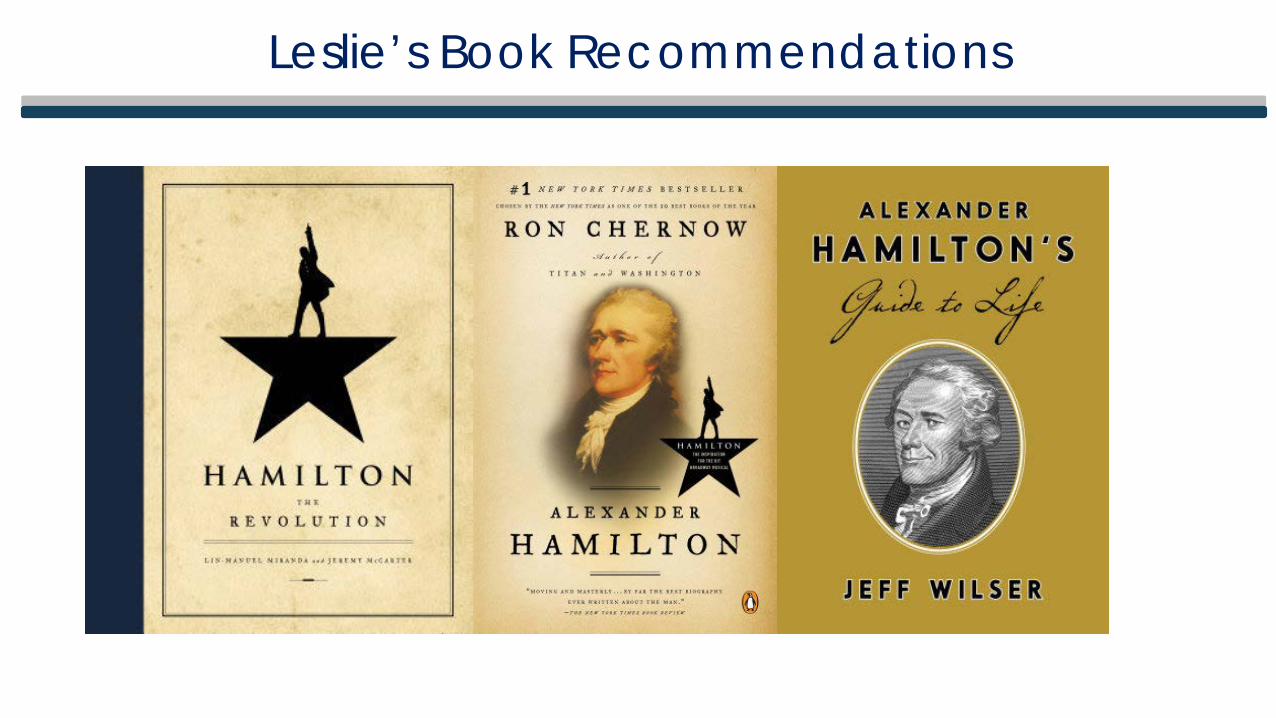
Leslie’s Book Recommendations


CARResearchGroup
CARResearchInfo
On.car.org/CARResearch
Housingmatters.car.org
Stay Connected with C.A.R. Research
