pardasani, raj, m.a. life science industry regional
TRANSCRIPT

PARDASANI, RAJ, M.A. Life Science Industry Regional Clusters: Spatial
Concentrations in Denver/Boulder, Colorado and Triad/Triangle, North Carolina. (2008)
Directed by Dr. Susan Walcott. 73pp.
This research examines the importance of proximity and the role of distance
within the life science sector of the economy for the interacting metropolitan regions of
Denver and Boulder, Colorado and Triad and Triangle, North Carolina. This sector is
characterized by high technology employment, research and development, and
knowledge spillovers. The thesis of this research is that synergies among sectors within
the life science industry exist between proximate places to build a regional economic
growth engine. Denver/Boulder, CO and Triad/Triangle, NC are complementary regions
which share benefits of interactions within the growing life science sector of the economy
because of proximity, strong commuting ties, a solid university system, and adequate
research funding. Statistics and data regarding labor sources and employment,
commuting patterns, and funding come from the Bureau of Labor Statistics,
ReferenceUSA Employment database, Census Transportation Planning Package, and the
National Institute of Health. Employment figures are classified by selected life science
sectors within the North American Industry Classification System (NAICS). Analysis of
these statistics will demonstrate the clustering of life science employment, ease of
mobility within the regions, and strength of research and development within the study
areas. Conclusions demonstrate that proximate places in Colorado and North Carolina
possess the attributes necessary to maintain a successful economic environment for the
life science industry to develop.

LIFE SCIENCE INDUSTRY REGIONAL CLUSTERS: SPATIAL CONCENTRATIONS IN
DENVER/BOULDER, COLORADO and TRIAD/TRIANGLE, NORTH CAROLINA
by
Raj Pardasani
A Thesis Submitted to
the Faculty of the Graduate School at
The University of North Carolina at Greensboro
in Partial Fulfillment
of the Requirements for the Degree
Master of Arts
Greensboro
2008
Approved by
Committee Chair

ii
APPROVAL PAGE
This thesis has been approved by the following committee of the Faculty of The
Graduate School at the University of North Carolina at Greensboro.
Committee Chair
Committee Members __________________________________________
_________________________________________
_____________________________
Date of Acceptance by Committee
_____________________________
Date of Final Oral Examination

iii
ACKNOWLEDGEMENTS
A special thanks to Dr. Susan Walcott for inspiring me to choose the topic for this thesis.
Dr. Walcott, thank you for all of your time and assistance.
Thank you also to committee members Dr. Keith Debbage and Dr. Selima Sultana. Your
suggestions and insight were very helpful along with what I have learned through
coursework.
Thank you to the faculty of the Geography Department at UNCG. I have learned a great
deal from all of my coursework and experiences.
A special thank you to my closest loved ones: my partner, mom, dad, and brothers. You
all have been there for me throughout the entire process and have encouraged me.

iv
TABLE OF CONTENTS
Page
LIST OF TABLES .......................................................................................................................... vi
LIST OF FIGURES ....................................................................................................................... vii
CHAPTER
I. INTRODUCTION ......................................................................................................... 1
II. REVIEW OF LITERATURE ......................................................................................... 4
2.1 Synergies Among Sectors Within the Same Industry ...................................... 4
2.1.1 Collaboration and Alliances ............................................................. 5
2.1.2 Innovation Systems .......................................................................... 6
2.2 Proximate Places .............................................................................................. 7
2.2.1 Spatial Concentrations: Cluster Development Strategy ................... 8
2.2.2 Knowledge Flows .......................................................................... 10
2.3 Building a Regional Economic Growth Engine ............................................. 11
2.3.1 Funding .......................................................................................... 12
2.3.2 Research and Educational Facilities .............................................. 13
III. RESEARCH DESIGN ................................................................................................ 15
3.1 Study Area ..................................................................................................... 16
3.2 Research Facilities and Funding .................................................................... 18
3.3 Commuting Between Proximate Places ......................................................... 19
3.4 Life Science Sectors and Employment .......................................................... 19
3.5 Company Surveys .......................................................................................... 22
IV. FINDINGS ................................................................................................................ 23
4.1 Education and Research ................................................................................. 23
4.1.1 Colorado Universities and Research Facilities .............................. 23
4.1.2 North Carolina Universities and Research Facilities ..................... 25
4.1.2a Triad ................................................................................ 25
4.1.2b Triangle ........................................................................... 26
4.1.3 Research Funding .......................................................................... 28
4.2 Business and Technological Development .................................................... 29
4.2.1 Colorado ........................................................................................ 29
4.2.2 North Carolina ............................................................................... 33
4.3 Commuting Patterns ...................................................................................... 35
4.4 Employment ................................................................................................... 38
4.5 Surveys .......................................................................................................... 48

v
V. CONCLUSION ........................................................................................................... 54
REFERENCES…………. ............................................................................................................. 57
APPENDIX A. SURVEY: INNOVATION AND COLLABORATION
IN LIFE SCIENCE FIRMS…………. .............................................................. 60
vi
LIST OF TABLES
Page
Table 4.1. Top-ranked NIH-funded Universities within the
Colorado and North Carolina Study Areas ................................................................ 28
Table 4.2. Total Number of Daily Commuters: Colorado Study Area .......................................... 36
Table 4.3. Total Number of Daily Commuters: North Carolina Study Area ................................. 37
Table 4.4. Number of Employees and LQs for Colorado Counties ............................................... 40
Table 4.5. Number of Employees and LQs for North Carolina Counties ...................................... 40
Table 4.6. Colorado Corp Tech Companies ................................................................................... 44
Table 4.7. North Carolina Corp Tech Companies ......................................................................... 45
Table 4.8. Colorado MSA LQs ...................................................................................................... 48
Table 4.9. North Carolina MSA LQs ............................................................................................. 48
Table 4.10. Company Background Information from Surveys ...................................................... 49
Table 4.11. Company Background Information from Surveys: Revenue ...................................... 50
Table 4.12. Company Location Information from Surveys ........................................................... 51

vii
LIST OF FIGURES
Page
Figure 3.1. Colorado Study Area ................................................................................................... 17
Figure 3.2. North Carolina Study Area ......................................................................................... 17
Figure 4.1. Colorado: Top-Ranked, NIH-Funded Universities...................................................... 25
Figure 4.2. North Carolina: Top-Ranked, NIH-Funded Universities ........................................... 27
Figure 4.3. Number of Employees for Companies Classified by NAICS Code within
Denver – Boulder – Aurora, CO CSA ...................................................................... 42
Figure 4.4. Number of Employees for Companies Classified by NAICS Code within
Greensboro – Winston-Salem – High Point CSA .................................................... 43
Figure 4.5. Number of Employees for Companies Classified by NAICS Code within
Raleigh – Durham – Cary CSA ................................................................................ 43
Figure 4.6. Survey Ranking Scores of Various Firm Innovation Strategies .................................. 52

1
CHAPTER I
INTRODUCTION
Metropolitan areas seek to attract clusters of firms related to the life science industry
since this sector tends to be highly profitable. A major question remains as to why some groups
of cities are more successful at nurturing firms in certain components of this industry than are
other urban areas. A region can be measured at various scales but is defined here as a group of
proximate Metropolitan Statistical Areas (MSAs) or Combined Statistical Areas (CSAs). The
MSAs chosen for analysis are grouped into CSAs, which are defined by the U.S. Census Bureau
as an aggregate of adjacent MSAs that are linked by commuting ties (U.S. Census Bureau 2008).
Some metropolitan locations attract successful, high-technology clusters while others are less able
to do so. The role of place is an important consideration in the location of life science activities.
Why do companies choose one place over another?
The thesis of this research is that synergies among sectors within the life science industry
exist between proximate places that can build a regional economic growth engine. It is
hypothesized that each MSA in this group selected tends to develop its own specialization within
the life science industry. Even with specializations that are unique to each MSA, firms within life
sciences tend to cluster in a proximate sense. Life science industry clusters and specializations by
MSA will be demonstrated through the use of Bureau of Labor Statistics (BLS) and
ReferenceUSA company database information. Another part of the hypothesis of this research is
that life science firms establish their locations in regional clusters and develop strategies for
innovation and collaboration to benefit from synergies and regional growth. This will be
demonstrated through the use of company surveys.

2
This research examines the importance of proximity and the role of distance within the
life science sector of the economy using case studies of CSAs in Colorado and North Carolina. In
Colorado, the proximate MSAs of Boulder, Denver, and Greeley are studied. In North Carolina,
the proximate CSAs of Greensboro - Winston-Salem - High Point (known as the Triad) and
Raleigh – Durham – Cary (known as the Triangle) are studied. The Triad CSA contains three
MSAs and the Triangle consists of two. The MSA and CSA definitions for the year 2006 are
used. They change according to population patterns and decisions made by the U.S. Census
Bureau and Office of Management and Budget. Some of the data presented uses previous MSA
definitions. The Research Design section articulates the reason for choosing these MSAs as study
regions and their rankings in terms of employment within selected life science sectors.
It is asserted that the regions of Denver/Boulder, CO and Triad/Triangle, NC are each
complementary regions which share the benefits of interactions within the growing life science
sector of the economy because of the location of employment clusters, strong commuting ties
between the proximate MSAs and CSAs, and highly ranked research institutions in terms of grant
funding. These regions benefit economically from the development of biopharmaceutical
industry clusters. They are highly connected with their local university systems, thus attracting
high-technology firms and employment and providing a highly skilled and highly educated
workforce. There is a sense of communication relationships which result in knowledge flows and
spillovers. The industry is experiencing high rates of growth in these economically vibrant
regions because corporations, businesses, and universities learn from each other.
The life sciences industry is important to study since their R&D branches apply
biological knowledge and techniques related to molecular, cellular, and genetic processes to
3
develop products and services, generating high revenues for their harboring locales.
Biotechnology remains a fairly new industry with approximately 40% of existing firms less than
15 years old (Hall and Bagchi-Sen 2007). The industry consists of firms which establish
themselves to develop this knowledge and involves the creation of new ideas through research
and development of new products and processes (Cortwright and Mayer 2002). This new and
rapidly changing industry has a great impact on the health, quality of life, and life span of the
human race. One significant achievement is recombinant DNA technology which has resulted in
proteins that are already used as therapeutics. Antibodies for cancer, arthritis and tissue
transplant, growth hormones, and clot-busting enzymes have been also been discovered by top
scientists and researchers within the industry (DeVol et al. 1994).
Funding and support are available in the form of National Institute of Health (NIH) grant
funding, private sector investments, venture capitalists, and research and development (R&D)
contracts. NIH funding data will be used as a proxy to represent all of these sources of support.
The literature review in the next section includes a discussion of collaboration, alliances, and
innovation within the biopharmaceutical industry, strategies for cluster development, knowledge
flows, funding sources, and research facilities. The data presented in the Findings section will
show that the important characteristics of life science clusters exist and aid in regional economic
growth in key metropolitan clusters in both Colorado and North Carolina.
4
CHAPTER II
REVIEW OF LITERATURE
2.1 Synergies Among Sectors Within the Same Industry
High-technology related businesses generally locate in a place so they can benefit from
the synergies created through human interaction and easy access to a university‟s researchers,
students, facilities, programs, and equipment (Rosenblum 2004). Core high technology areas are
characterised by a synergistic combination of growth in employment, product and process
innovation, and high rates of local business formation, all operating to obtain high levels of
agglomerative advantage (Lyons 1995). Firms containing higher levels of R&D are presented
with more opportunities for collaboration (Hall and Bagchi-Sen 2007).
Regional hot spots help to create new jobs and business ventures from technological
discovery and inventions that are important for an innovation infrastructure. One survey of
biotech firms suggests that access to highly-skilled labor is a critical factor for activities that
involve R&D (St. John and Pouder 2006). Biopharmaceutical is a field where high-technology
professional employment, ability to license technology, and access to venture capital are
important. Low R&D intensity firms place more importance on proximity to major customers
because they may be actively involved or interested in new product development. Innovation
performance is most often a function of firm-level characteristics wherein technology is
integrated throughout the innovation process (Hall and Bagchi-Sen 2007). Firms need carefully
planned and executed strategies for research, product development, manufacturing, marketing,
and distribution in order to achieve competitive advantage

5
A firm‟s commitment to R&D expenditure is critical to innovation performance. The
general definition of R&D intensity is the percentage of firm revenues spent on R&D. This is
considered an incurred expense so research could sometimes have a negative effect on innovation
measurements. R&D productivity is better measured by research-based rather than production-
based innovation. Data suggest that high levels of R&D intensity are associated with high levels
of domestic patent applications, international patent applications, domestic patent approvals, and
international patent approvals (Hall and Bagchi-Sen 2007). In the case of many firms, there
could be a significant lag time between investment in research and eventual growth in business
performance. High R&D intensity firms place higher levels of importance on access to
universities, other biopharmaceutical firms, and firms in related industries.
2.1.1 Collaboration and Alliances
Several important innovation strategies seek to ensure success in biopharmaceutical firms
including university alliances, licensing agreements, export-import connections to alliances for
R&D, product development, and marketing. The strength of an area‟s local science base is closely
correlated with new firm formation, especially in the therapeutics and diagnostics sectors
(Bagchi-Sen 2007). One strategic consideration presented includes increasing the number of
university and industry candidates in which firms can associate with investors and collaborators.
Another strategy is to license-in technologies from other firms and use their expertise. There are
many good reasons for considering inter-firm strategic alliances: accessibility of funds, reduction
of risk, quality control in R&D, product development and manufacturing for large scale trials, and
getting attention of third party investors. A mutual benefit is apparent, where large firms benefit
from alliances with smaller firms and vice versa (Bagchi-Sen 2007). Smaller firms often seek
assistance from larger firms for clinical trials, manufacturing, sales, and marketing which help
maintain a continuous revenue stream. Over 50% of all respondents in a recent study of life
6
biopharmaceutical firms in the U.S. noted the critical importance of developing alliances with
large non-biopharmaceutical companies. Firms with high R&D intensity levels earn over 60% of
their revenues from royalty and/or licensing agreements or contracts. The primary focus is on
production and commercialization if a firm earns a greater amount of revenue from product sales.
Younger firms tend to concentrate resources on research, product development, licensing
technology, and collaborating to innovate (Hall and Bagchi-Sen 2007). The Data and
Methodology section includes statistics from a survey conducted in North Carolina related to
innovation strategies.
2.1.2 Innovation Systems
A regional innovation system (RIS) differs from a cluster in that it can span several
different sectors and clusters rather than being composed of a concentration of organizations
within the same or similar industrial sector. A sectoral innovation system (SIS) focuses more on
the impact of specific knowledge bases and innovation processes and is defined as a group of
firms working to develop and make a sector‟s product and utilize its technologies. They tend to
be more concerned with the impact of different technological regimes on innovation processes
than an RIS would be (Coenen, et al. 2006). A regional perspective is important for analyzing
innovation interaction and inter-organizational learning processes because it emphasizes the
importance of personal relationships and networks for economic activities. This research defines
regions as proximate, inter-related combinations of cities which encompass urban areas.
A decline in the R&D power of large corporations is occurring along with the increase of
specialist research firms (Cooke 2004). Many government agencies are interested in developing
policies to network regional innovation systems. The mode of knowledge production shifted
because of the rise in research. Many dedicated biotechnology firms (DBFs) are initiating
leading-edge research in clusters where large pharmaceutical firms are linked to research
7
institutes and other DBFs. Many DBFs are heavily involved in knowledge generation but still
need large pharmaceutical firms to assist in funding. Research DBFs are able to bring together
skilled researchers and technologists to target specific areas (Cooke 2004). Several large
companies developed and released drugs due to research conducted by university and private
research scientists (i.e. Novartis, and Glivec). Knowledge production is strongly regionalized in
many clusters because of the importance of university and research institute laboratories to
clusters of DBFs and the support of venture capitalists and other business services.
2.2 Proximate Places
Several studies found that companies with similar interests and business like to cluster in
close proximity. Industry clusters are part of a popular development practice useful for policy-
makers, community leaders, and everyday citizens to better understand regional economies.
Regional clusters may form because of trading relationships and/or to share markets and
knowledge resources (Feser and Luger 2003). Clusters can have a significant, positive impact on
the regional economies in which they reside. The Milken Institute defines an industry cluster as
“a geographic concentration of sometimes competing, sometimes collaborating firms, and their
related supplier network” (DeVol et al. 1994: 1). Interrelated life science industries generate
wealth within a regional economy. Important factors in the development of life science clusters
include proximity to research institutions, a supportive entrepreneurial culture, risk financing, and
the availability of real estate (Walcott 2002). Competitive advantage is maintained when
companies cooperate in a shared place. Government officials advertise a variety of regional
features that may be appealing to high technology firms, including research universities, generous
financial institutions, and political support.
On the global scale, “places of high skill, high wage labor such as involved in research
and development activities will attract businesses in the most developed countries, while lower

8
paying and less skill-demanding jobs will cluster in less developed countries” (Walcott 2001).
This is known as the new international division of labor which plays a large role in the location of
biotechnology activities. Walcott (2001) used core (United States) and semi-periphery (China)
areas to categorize R&D and manufacturing sites of high tech activities. R&D occurs in core
regions and while manufacturing and product packaging, processing, and handling occur in the
semi-periphery. Regional and urban land planners are increasingly looking toward the
biotechnology industry for long term economic growth opportunities. Knowledge flows through
professional associations and informal relationships between individuals can result in knowledge
spillovers being created within a cluster (Phene and Tallman 2002). The Marshall-Arrow-Romer
(MAR) externality predicts that industries cluster geographically to absorb knowledge that spills
over from other firms. Part of the prediction is that the industry grows faster because neighboring
firms learn from each other. The data and analysis presented in this research demonstrate the
existence of clusters within these sectors in the Colorado and North Carolina study areas. This
demonstrates the benefits of life science industry cluster formation within regions.
2.2.1 Spatial Concentrations: Cluster Development Strategy
Almost every state has a cluster development strategy as part of its economic
development plan. The Brookings Institute reported in 2002 that 41 communities were pursuing
a life science cluster strategy even though 75% of the largest biopharmaceutical firms are located
in only nine regions of the United States (St.John and Pouder 2006). Firms within certain sectors
of the life science industry are often very successful when spatially concentrated. A firms‟
specific industry classification affects what type of interactions are created within clusters.
Biopharmaceutical industry clusters are characterized by an analytical and science-based
knowledge base related to natural sciences like biology, chemistry, and medicine (Coenen et al.
2006). The agro – food industry is more synthetic and engineering-based involving food
9
technology, agriculture, and basic knowledge transfer between agro-food companies and large
public research institutes. The pharmaceutical sector is the largest niche in terms of amount of
sales, accounting for over 70% of all sales in life sciences. The biopharmaceutical industry is
based on R&D trade among universities, research institutes, pharmaceutical companies, and small
life science firms.
Biopharmaceutical businesses in the United States thrive in geographic clusters,
attracting capital investment and facilitating technology transfer. Highly skilled labor tends to be
more concentrated in some MAs than others. A major factor in the development of a cluster is a
nearby research university, which is necessary because of the need to remain competitive and
have access to the latest technological innovations in this knowledge-based industry (Walcott
2002). Life science firms tend to concentrate geographically around research universities and
health centers. Marshall developed the notion of “industrial districts” as aggolmerations of firms
operating in one industry sector in a well-defined and relatively small geographic area (St. John
and Pouder 2006). Other innovative models include innovative milieus and technology districts.
Cluster formation and evolultion could be the result of various factors including start-up firms
evolving or just proximity to a large customer base or market.
Some of the numerous advantages of firms in clusters include cost savings, increased
market power, availability of specialized labor facilities, sharing of information, proximity to
suppliers or markets, learning, innovation, and increased specialization (Feser and Luger 2003).
Clusters have been used by policy-makers, community leaders, and citizens to understand the
complexity of regional economies. Biotechnology is considered a “hot cluster” along with the
fields of bioinformatics and information technology. Policy-makers are generally more
interested in emerging and potential high-tech clusters because they provide good jobs and are
beneficial for regional economic analysis. Although cluster studies are useful, they must have

10
clearly laid-out goals, objectives, defenitions, indicators, weghts, data sources, and models.
Biases should also be discussed up front (Feser and Luger 2003). These types of analyses can
help with disagreements between local officials and the public regarding a region‟s future and
economic prospects. Successful development of a high-technology cluster depends on several
factors such as a strong scientific base, government support, a highly educated workforce, and a
good quality of life, just to name a few. This study examines whether these factors exist in the
metropolitan areas of the Triad/Triangle, NC and Denver/Boulder, CO.
2.2.2 Knowledge Flows
R&D spillovers have a significant effect on high technology employment.
Communication can be improved with an increase in informal relationships and more frequent
face to face contact. A concentration of an industry in a city can result in knowledge spillovers
between firms and a growth of the industry (Acs, FitzRoy, and Smith 2002). Knowledge
spillovers are „knowledge externalities bounded in space‟, which allows companies located
nearby important knowledge sources to introduce innovations at a faster rate than rival firms
located elsewhere. Firms may seek external knowledge indirectly and informally by localized
knowledge spilling across organizational boundaries (Breschi and Lisson 2001).
Location is key in increasing exposure to potential knowledge spillovers. Location
decisions often made by firms to maximize the effect of knowledge spillovers and to enhance
their competitive position (Alcacer and Chung 2007). Many firms strategically choose locations
in order to more easily gain knowledge from others but also to reduce leakage of their own
knowledge. Generally, public sources like academia and government provide basic knowledge
while private industry sources provide less basic, more appropriable knowledge. Firms can serve
as potential knowledge sources while also receiving knowledge spillovers. Some locations have
greater amounts of knowledge-generating activity than others. Localized spillovers from

11
academic institutions impact the birth of biopharmaceutical companies in the United States
(Zucker et al. 1988).
2.3 Building a Regional Economic Growth Engine
Employment in biopharmaceutical is expected to grow faster than employment in the rest
of the economy through at least 2012, according to the Bureau of Labor Statistics. Some regions
are “hubs for organizational creation” due to a diversity of organizations, a well-established
knowledge base (university system), law firms specializing in intellectual property, public
research institutes, consultants, and venture capitalists (Powell, Koput and Smith-Doerr 2002).
Private sector investment in product development is a critical factor in the development of firms
within the biopharmaceutical industry. Recently, public and private investment surged in bio-
related firms. Firms spend large amounts of money on R&D for many years, thus usually
operating at a loss. They generally have low odds of success and developing regulatory approval
for commercial products takes a long time. Drugs require Federal Drug Administration (FDA)
approval, which requires a great deal of time and money. Venture capitalists and other investors
often seek to recoup their investment by having the firm issue stock in an “initial public offering”
(IPO) once promising products are developed (Cortwright and Mayer 2002). Other sources of
funding include R&D contracts and funding arrangements with pharmaceutical companies.
Biopharmaceuticals is a field where firms are dependent on venture financing. A large
percentage of firms receive such funding from local sources. Monitoring, advising, and
managing are easier if the young firm is located nearby (Powell, Koput and Smith-Doerr 2002).
Venture capitalists may play a different role in an early-stage company versus one that has
already undergone its first round of financing. Companies that sought only non-local finance
were, on average, larger, older, and had more collaborations with diverse types of organizations.
Findings also concluded that firms at the pre-initial public offering (IPO) stage with only local

12
backing were the smallest in terms of number of employees but had the largest percentage of staff
with PhDs and/or MDs. Locally–backed firms are generally stronger scientifically suggesting a
strong research base. Older, more experienced venture capital firms located in technology-rich
areas can be more flexible in where they invest. As they become more established and mature,
they are more willing to work with high-risk local start-ups (Powell, Koput and Smith-Doerr
2002).
2.3.1 Funding
The founding of new biopharmaceutical firms in the 1970s and 1980s occurred in areas
with high “intellectual capital” (Powell, Koput and Smith-Doerr 2002). “Star scientists” who had
direct roles as founders and advisors resulted in closer links being established. A major source of
funding for small biopharmaceutical firms is a R&D contract or equity funding arrangement with
a major company. The dollar amount of research agreements has increased from $846 million
prior to 1990 to $5.2 billion since 1996. As stated by Cortwright and Mayer (2002: 23) “The
flow of research contracts from pharmaceutical funds to biotechnology firms is a strong indicator
of the location of commercially promising research activities” .
The availability of capital is a major factor in the development of firms within the
biopharmaceutical industry. Start-up firms depend heavily on venture capital investment for
initial costs and organized venture capital is the most important source of start-up capital. An
example of this is a private investment made by a professional fund manager. Venture capitalists
may invest in several biopharmaceutical firms while firms may obtain funding from several
venture sources. Venture capital firms and capitalists themselves tend to be highly concetrated
regionally. These investments are needed to sustain biopharmaceutical firms from inception
through years of research and product development. Technology-based startups with a high
potential for growth are more likely to be sought after by venture capital firms. In the case of

13
biopharmaceutical, venture capitalists may play more of a role in a financed company possiby
even helping run the company. This is another reason for clustering and close proximity. The
Colorado and North Carolina sections of the literature review describe sources of funding for
start-up businesses and several initiatives taking place in both states to assist in growth of the
industry.
2.3.2 Research and Educational Facilities
The life science sector of the economy is very research-oriented and innovative.
Examining the location of research institutions and universities is the first step in understanding
the geography of biotechnology (Cortwright and Mayer 2002). Levels of commitment to R&D
vary among individual firms. State governments tend to invest funds in developing
biopharmaceutical around public research universities. There is difficulty in the long-term
survival of small firms without strong relationships with universities or other large
biopharmaceutical (pharmaceutical and other) companies. Universities are generally good
sources of knowledge, funds, and credibility of a firm‟s reputation. Most large public and private
universities have invested in technology transfer in the biomedical sciences industry (Bagchi-Sen
2007). Universities are used for assisting in advancing research-based innovation and are
important in terms of technology resources and access to physical resources. Detailed
information on the life science fields of study offered at the various research institutions within
Colorado and North Carolina are described in this study.
Research parks normally utilize a partnership of government, academia, and industry and
consist of master planned land and buildings which are designed for public and private research
(Rosenblum 2004). A variety of activities are able to take place simultaneously including applied
research, technology transfer and corporate research and development. Space is provided for
start-up firms to become established businesses and some parks provide incubator facilities.

14
University technology transfer programs are found to be a good source of business startups and
an interface between academic research and industry. Regional and state governments view
research parks as great economic development tools. Universities generally seek business
opportunities for students, training, and increased technology transfer while private industry
attempts to develop clusters of like-mined businesses.

15
CHAPTER III
RESEARCH DESIGN
This research will demonstrate the economic strength of the life science industry in the
selected metropolitan regions in Colorado and North Carolina. It will also show the different
specializations existent in each proximate place, and location factors of individual firms. The
important factors of proximity, commuting ties, industry clusters, and funding will be examined
by utilizing data from various sources. Research funding and grant statistics are obtained from
the National Institute of Health (NIH) to show the amount received by the top universities within
the study areas. Commuting pattern statistics are obtained from the U.S. Census Bureau, Census
Transportation Planning Package (CTPP) to demonstrate the amount of workers traveling daily
between the selected MSAs and CSAs. This will emphasize the importance of geographic
proximity in maintaining a region‟s economic strength. Industry clusters are determined by
computing the number of employees from the Bureau of Labor Statistics (BLS) and
ReferenceUSA Company database to visualize total number of employees and employment
concentration within select industry classifications.
The nature of the industrial employment clusters and location of research-intensive
universities will prove that the key proximate metropolitan areas are complementary regions. The
analysis presented will show how proximate places are able to benefit from each other and work
together in building a strong regional economy. It contributes to the idea that the
biopharmaceutical industry is highly sought after as a tool for regional economic strength and has
the ability to unify metropolitan regions.

16
3.1 Study Area
Colorado and North Carolina contain metropolitan regions in which spatial
concentrations of sectors within the biopharmaceutical industry thrive. Life science sector firms
are very profitable and have a beneficial impact on the regions in which they are located. This
research asserts that metropolitan areas within close proximity of each other are able to share the
benefits of economic development within this sector. Both states contain two proximate,
complimentary regions which share benefits of interactions within the life science sector.
Remember that a region is defined here as an MSA or CSA. In Colorado, the proximate MSAs of
Boulder and Denver are examined. The Greeley MSA will also be included since it is part of the
same CSA. The North Carolina study area is different from Colorado in that two proximate
CSAs are examined: Greensboro – Winston-Salem – High Point (referred to as the Triad), and
Raleigh – Durham – Cary (referred to as the Triangle). The Colorado study area is shown in
Figure 3.1 and North Carolina‟s in Figure 3.2. Compiled data include research grant funding,
commuting patterns within each region, total available employment figures, and opinions
expressed through individual company surveys.

17
Figure 3.1
Figure 3.2

18
These study regions were chosen because of their high ranking in terms of life science
employment. The Brookings Institution classifies the Raleigh – Durham – Chapel Hill MSA as a
biotechnology center, meaning it has an above average level of research activity and
commercialization. The Denver – Boulder – Greeley and Greensboro – Winston-Salem – High
Point MSAs are classified as median metropolitan areas (Cortwright and Mayer 2002). This
study used 1997 MSA definitions. According to 2003 BLS data, the Boulder MSA ranked
number one in terms of its location quotient (LQ) statistic which measures employment
concentration within the research and development and pharmaceutical and medicine
manufacturing sectors. The Raleigh – Durham – Chapel Hill MSA ranked 3rd, Denver - Aurora
27th, and Greensboro – Winston-Salem, High Point 34
th (Debbage and Nuyda 2005). These are
based on a study of 40 MSAs using 1999 definitions. Each study region contains one highly
ranked region adjacent to one which is ranked lower, in terms of life science employment. It is
believed that metropolitan areas within close proximity of each other are able to share the benefits
of economic development within a particular economic sector.
3.2 Research Facilities and Funding
The largest single source of funding for research and training related to medicine, health,
and biopharmaceutical is the National Institute of Health (NIH). To demonstrate the strength of
the life science research base in the study areas, the amount of research grant funding and the
national ranking of the major universities are presented in the Analysis section. NIH data were
obtained from the U.S. Department of Health and Human Services, Office of Extramural
Research. General information on academic programs related to life sciences is also presented,
along with maps showing university locations.
19
3.3 Commuting Between Proximate Places
Commuting pattern statistics were compiled from the Journey to Work and Place of
Work section of the U.S. Census Bureau Transportation Planning Package. Although the data
represent all workers, not just life science employees, the statistics show the amount of
commuting taking place between the MAs and CSAs to demonstrate the general traits of a
regional growth engine and the connection between proximate places. Even though CSAs are
defined by the U.S. Census Bureau as an aggregate of adjacent MSAs that are linked by
commuting ties, it is beneficial to look at commuting statistics, especially noting the amount of
commuting taking place between the selected proximate regions (U.S. Census Bureau 2008).
Data were collected as “Residence to Workplace”, showing the number of daily commuters from
one county to another. This was done for each county to each other county in the study regions.
The total number of daily commuters between the proximate MSAs and CSAs was then
calculated.
3.4 Life Science Sectors and Employment
The North American Industry Classification System (NAICS) is defined by the Office of
Management and Budget of the federal government and classifies industry nationwide
(Cortwright and Mayer 2002). According to the Brookings Institution (2002), most life science
firms fall into either of two industry categories: 54171 – Research and Development in Physical,
Engineering, and Life Sciences or 32541 – Pharmaceutical and Medicine Manufacturing, but
there is no one generally accepted definition of biotechnology (Debbage and Nuyda 2005). This
report will define the life science sector by the following nine NAICS codes as defined by the
Census, to cover the broad range of related activities that take place within the sector:

20
a) 325411: Medicinal and Botanical Manufacturing
b) 325412: Pharmaceutical Preparation Manufacturing
c) 325413: In-Vitro Diagnostic Substance Manufacturing
d) 325414: Biological Product (except Diagnostic) Manufacturing
e) 334510: Electro medical and Electrotherapeutic Apparatus Manufacturing
f) 334517: Irradiation Apparatus Manufacturing
g) 339111: Laboratory Apparatus and Furniture Manufacturing
h) 339112: Surgical and Medical Instrument Manufacturing
i) 541710: Research and Development in Physical, Engineering, and Life Sciences
These codes encompass a variety of life science drug and pharmaceuticals and manufacturing
activities that take place along with research and development. Batelle (2006) includes these
NAICS codes in his analysis. Since defining life sciences is difficult, he identified four major
subsectors: Agricultural Feedstock and Chemicals, Drugs and Pharmaceuticals, Medical Devices
and Equipment, and Research, Testing, and Medical Laboratories. This study will not include
analysis of Agricultural Feedstock and Chemicals. The nine codes chosen here fall into one of
the latter three categories. The selected study regions in both Colorado and North Carolina
contain a great number of firms within these categories.
Employment data were compiled from the U.S. Department of Labor – Bureau of Labor
Statistics (BLS) and the ReferenceUSA business database for the years 2006 and 2007. The BLS
proved useful for total number of employees for the study areas. This statistic was used in the
equation for location quotients (LQ), described later in this section. Total employment within
each sector was calculated using the available individual company information downloaded from
the ReferenceUSA database. An identification and password is required and was accessed
through the University of North Carolina – Greensboro online library system. Data provided
through the database is updated monthly. This research utilized August 2007 data. The selection
criteria used was NAICS code within the counties located within the specified MSAs. Data were
downloaded from two business databases: U.S. Businesses, and Corp Tech. The U.S. Business

21
database includes a broad range of sectors of employment while the Corp Tech database lists
companies specializing in biopharmaceutical, computer hardware/software, and pharmaceuticals.
One important difference between the two databases is that the U.S. Business database provides
latitude and longitude information while the Corp Tech database does not provide this
information.
The Analysis section of this research will show maps of company locations by NAICS
code, using the U.S. Business list, while the Corp Tech companies are in a list. Available data
includes the total number of employees and NAICS code for each company listed. Companies
within the selected life science NAICS codes were selected and grouped for analysis, although
data were not available for a small number of the companies. This data provides evidence of
different patterns of industrial concentrations.
The employment statistics, along with calculated LQs for each county within the study
areas, provide evidence of the different specializations prominent in the different MSAs. LQs are
beneficial for visualizing the location of labor markets by county or region with a higher or lower
proportion of their employment base in life sciences relative to a national norm (Debbage and
Nuyda 2005). The equation is a ratio defined as:
(County/Regional Biotech Employment/U.S. Biotech Employment)
(County/Regional Total Employment/U.S. Total Employment)
A LQ greater than one indicates an area with a higher percentage of biotech employment than the
percentage of total jobs relative to a national share while an LQ less than one indicates a lower
percentage.

22
3.5 Company Surveys
Surveys were mailed to life science companies within the North Carolina study regions to
gain a better understanding of local and nonlocal connections of companies and location factors
that increase competitiveness. The survey was created by Dr. Susan Walcott and Dr. Sharmistha
Bagchi-Sen for another life science related study for companies in New York and North Carolina.
The companies chosen to answer surveys were based on the North Carolina list of 414 obtained
from the ReferenceUSA database. The first section of the survey contained questions related to
company background. The respondents were asked to choose from Diagnostic, Therapeutic,
Agri-Bio, Environment, or Other as the firm‟s main area of business. Other background
information obtained includes whether the company is a subsidiary of a larger firm or a university
spin off, public or private, year established, total revenue, percent of revenue assigned to R&D,
and how much exporting is taking place. The second section of the survey pertains to location
factors. Respondents were asked top reasons for choosing their location, the most important
forms of local/state government assistance received, and status of labor supply in the location.
The third section presents questions related to collaborative efforts. They were used to determine
how much R & D activity is performed in-house and where, if any, university and industry
collaborators are located. The next section of questions helped gather information related to
where, if any, company manufacturing activities take place. The last section of the survey deals
with innovation. Respondents were asked to rank the importance of various innovation strategies.
The survey is presented in Appendix A.

23
CHAPTER IV
FINDINGS
4.1 Education and Research
This section will demonstrate the strength of the research base in Colorado and North
Carolina, contributing to the first thesis hypothesis that synergies among sectors within the life
science industry exist between proximate places to build a regional economic growth engine.
Since the life science sector of the economy is very research-oriented and innovative, examining
the location of research institutions and universities is the first step in understanding the
geography of biopharmaceuticals. The quality of medical research and education available
affects economic development of the life science industry (Cortwright and Mayer 2002).
Universities are generally good sources of knowledge, funds, and credibility of a firm‟s
reputation. This section of the findings will provide a general description of the universities in
the study areas and how much NIH funding is made available.
4.1.1 Colorado Universities and Research Facilities
The Denver/Boulder area is a „stand-alone‟ profit center with product related R & D
activities employing skilled and semi-skilled workers (Lyons 1995). The National Science
Foundation reported 52 life science PhDs issued in 1999 by universities in the Denver-Boulder-
Greeley Metropolitan Statistical Area (MSA). Colorado maintains a healthy link between
academia and the private sector. The University of Colorado system contains substantial research
centers which support the life science industry. The Colorado Alliance for Bioengineering is
responsible for the coordination of biopharmaceutical activities among faculty in all universities
throughout the state (Colorado Bioscience Association). The University of Colorado at Denver

24
and Health Services Center offer a Ph.D in Health and Behavioral Sciences, an M.S. in Health
Administration, an M.S. in Biology, and in Chemistry. The University of Denver offers an M.S.
and Ph.D in Biological Sciences and PhDs in Biochemistry and Chemistry. The University of
Colorado at Boulder offers several PhDs including Biological Sciences (Ecology, Evolutionary,
Molecular, Cellular, and Developmental), Chemical and Biological Engineering, and
Biochemistry. Other advanced degrees in Environmental Engineering and Neuroscience are also
available. Bio-technician training is offered at the Community College of Aurora where students
can emphasize in R&D or biotechnology manufacturing. The Institute for Bio-Energetics was
created by the University of Colorado – Colorado Springs to study cellular metabolism and
communication to help treat and/or cure serious diseases. Figure 4.1 shows the Colorado
universities which ranked highly in research grant funding received from the NIH.

25
Figure 4.1
4.1.2 North Carolina Universities and Research Facilities
4.1.2a Triad
The Triad region includes the cities of Greensboro, Winston-Salem, and High Point and
is home to several research institutions offering degrees related to life sciences. UNC-
Greensboro offers M.S. degrees in Chemistry and Biochemistry Information, Genetic Counseling,
and Biology. Ph.D degrees are available in Nutrition and Public Health. NC A&T State
University offers an M.S. degree in Biology, a Ph.D in Energy and Environmental Studies, and an

26
undergraduate degree in Chemistry. Both of these universities are in the process of developing a
joint graduate program in nanoscience and nanoengineering to be housed at the new
Nanotechnology School and Gateway University Research Park. The Joint School of
Nanoscience and Nanoengineering (JSNN) will enroll Masters and Doctorate students focusing in
nanotechnology research. High Point University offers undergraduate degrees in biology,
chemistry, and medical technology. Another major Triad university is Wake Forest (and the
Bowman Gray School of Medicine) located in Winston-Salem. Along with advanced degrees in
the field of medicine, they offer PhD‟s in Biochemistry, Structural Biology, Biomedical
Engineering, Cancer Biology, Chemistry, Neuroscience, Physiology, and Pharmacology. Wake
Forest is also home to various health science departments, the Institute for Regenerative
Medicine, and the Center for Nanotechnology and Molecular Materials.
4.1.2b Triangle
The Triangle region includes the cities of Raleigh, Durham, Chapel Hill, and Cary.
Universities in this region have a great deal to offer in terms of advanced degrees in medicine and
life science-related fields of study. NC State University in Raleigh offers several degrees and
certificates directly related to life sciences. These include minor studies in Biotechnology and
Life Science Ethics, Masters degrees in Microbial Biotechnology and Comparative Biomedical
Sciences, and a Ph.D degree in Biomedical Engineering. Others include PhD‟s in Biochemistry,
Bioinformatics, Microbiology, and Biological and Agricultural Engineering. UNC-Chapel Hill is
home to one of the Triangle‟s medical schools. Some of the advanced degrees are Biochemistry
and Biophysics, Biological and Biomedical Sciences, Cell and Developmental Biology,
Neurobiology, and Pharmaceutical Sciences. Duke University in Durham houses the other
medical school in the Triangle. It offers certificates in Biomolecular and Tissue Engineering and
Nanoscience, along with Ph.D. degrees in branches of Biology and Chemistry. Figure 4.2 shows

27
the North Carolina universities which ranked highly in grant funding from the NIH. A higher
education bond approved in North Carolina in the year 2000 included bioscience research
buildings like the College of Veterinary Research Building on NC State‟s Centennial Biomedical
Campus. Bond funding has also been approved for a new research and clinical facility at the
UNC Chapel Hill Cancer Center budgeted at $180 million (Batelle 2006). The Centennial
Campus of NC State is being developed as a dual-use research park including university
resources in genomics and bio-informatics.
Figure 4.2

28
4.1.3 Research Funding
In 2000, NIH disbursed a total of $13.3 billion for research activities. The Denver-
Boulder-Greeley MSA was allocated $208,884,942, a 1.8% share of the total funding to the top
100 cities. The share of NIH research funding for medical schools and research institutions
increased by 0.5% between 1985 and 2000 – from $29,698,000 to $134,378,000 (more than
quadrupled). This type of funding comprises the largest share of NIH funding. Total federal
research funding for medical schools in all the metropolitan areas more than tripled in 15 years
from $2.4 billion in 1985 to $7.6 billion in 2000 (Cortwright and Mayer 2002). Research
institutions provide highly trained and skilled scientists, many of which are financed by NIH
grant funding. Several institutions within the Colorado and North Carolina study areas ranked
highly in the amount of funding awarded. For the fiscal year 2005, 3419 institutions received
awards. Table 4.1 provides a listing of the major universities with their respective rankings,
number of awards and amounts from the top 500 list.
Table 4.1 Top-ranked NIH-funded Universities within the Colorado and North Carolina Study
Areas
Source: U.S. Department of Health and Human Services, Office of Extramural Research – NIH
Among these universities, the total amount of funding for North Carolina universities is
$834,770,648 while those in Colorado received a total of $280,701,234. Duke in Durham, NC,
29
ranked sixth, is the highest ranking among the universities in both study areas. This is followed
by UNC-Chapel Hill (16th) and UC-Denver (30
th). The University of Denver ranked 451
st,
receiving the lowest amount among those on this list. Nearly each major city within the study
clusters houses a major university ranked highly in NIH funding. In Colorado, a university from
the list is located in Denver, Aurora, Boulder, and Fort Collins. In North Carolina, they are
located in the Triad city of Winston-Salem and the Triangle cities of Raleigh, Durham (two
universities), and Chapel Hill. The locations of these universities and the high amount of health-
related research funding provide evidence of the strength of research activities within the study
regions.
4.2 Business and Technological Development
4.2.1 Colorado
Four bills introduced in the 2006 legislative session would benefit Colorado‟s bioscience
industry. The Bioscience Net Operating Loss Bill gives permission to the Colorado Economic
Development Commission to purchase the right to gain a future tax benefit from net operating
losses from bioscience companies. It establishes criteria for a company to be able to sell the
future tax benefit to the commission. A second bill concerns the advancement of new bioscience
discoveries at Colorado research institutions. It provides for matching funds to support the
development of life science technologies come from new discoveries within institutions. A third
bill subsidizes the indirect cost portion of contract for core laboratory services at research
institutions by Colorado bioscience companies. Companies would gain incentives to contract for
services with research institutions and the research institutions would likewise be provided
incentives to provide business-friendly services. The fourth piece of legislation would provide a
performance-based incentive to employers who create a certain number of new full-time jobs.
The Office of Economic Development and International Trade works with Colorado businesses,

30
associations, and universities to encourage growth and development of life science companies.
The Advance Colorado Center (ACC) provides a common headquarters and support for non-
profit organizations. The organizations, in turn, provide a variety of services and programs to
companies and entrepreneurs to enhance job growth. The ACC is a partnership between the
Colorado Economic Development Commission, the Office of Economic Development and
International Trade, and the University of Colorado at Denver Health Sciences Center (Batelle
2006).
An Action Plan to Grow Colorado’s Bioscience Cluster was developed in 2003 by the
Colorado Office of Innovation and Technology, industry, university, and government
representatives. The idea behind the plan is that the state nurture local businesses and focus
heavily on excelling in bioscience research. The Action Plan is updated yearly and has resulted
in a great deal of concentration in the northern part of the state. The medical campus at
Fitzsimons is home to many relocated facilities including the University of Colorado Health
Science Center (UCHSC), the University of Colorado Hospital (UCH), and the Children‟s
Hospital. Approximately $53 million has been appropriated by Congress for the relocation of
Denver‟s Veterans Affairs Hospital. The initial phase of the full campus move is estimated to
cost $1.3 billion. The new location will increase from 2.7 million square feet on 46 acres to 3.4
million square feet on 210 acres at the new location. Another 1.5 million square feet for research
activities is planned after the initial phase. A total capital investment of around $4 billion will be
required to complete the entire Fitzsimons building program. Other projects that have been
completed since 2004 or are under construction include two research complexes, Barbara Davis
Center for Childhood Diabetes, Denison Library, 3 education facilities, an academic office, and a
common area including a residential and commercial complex (Batelle 2006).

31
The U.S. Department of Labor gave the Denver metropolitan region a five - year, $15
million Workforce Innovations in Regional Economic Development (WIRED) grant for
workforce development and the biosciences are one of the targeted industries. The Fitzsimons
BioBusiness Incubator helps promote the growth and success of the bioscience businesses in
Colorado, with an emphasis on forming a cluster at Fitzsimons. Services include business
planning, management, intellectual property protection, scientific resources, access to laboratory
space, and capital formation (Batelle 2006). The Colorado Economic Development Commission,
Aurora Economic Development Council, Fitzsimons Redevelopment Authority, University of
Colorado, and the Metro Denver Economic Development Corporation are some of the
contributors. The Colorado Venture Capital Authority (VCA) was created in March 2004
because of legislation signed by the Governor. The legislation requires that the funds be used to
provide capital in early stages of company development.
The Colorado Bioscience Park Aurora is being developed as a part of the Fitzsimons
Redevelopment Project. The park is affiliated with the University of Colorado and is expected to
contain 3 million square feet of space and 4000 employees. Research-oriented biomedical,
biotechnology, and pharmaceutical facilities will be a large part of the park‟s development
process. The Bioscience Park Center opened in 2000 and currently houses 18 bioscience
companies taking advantage of specialized equipment and facilities (Batelle 2006). Denver
Bioscience Center at Stapleton is under development at the former Stapleton Airport and will
consist of a 200-acre biomanufacturing park. It will provide space for small spin-offs to expand
their manufacturing operations and is in close proximity to the Colorado Bioscience Park at
Fitzsimons.
The Fitzsimons Redevelopment Authority in Aurora is a $ 4.3 billion life sciences
complex that has become the focus of the biopharmaceutical industry in the Rocky Mountain
32
region (Krizner 2005). It lies on the site of a former U.S. Army medical base, which has assumed
control of 332 acres, while the University of Colorado controls the rest. Currently, 5000 people
are employed there, and that is expected to grow to 19,000 by 2010. Funding has been approved
by the Colorado state legislature for the university to build a Health Sciences Center on a 217-
acre site by 2008. The complex will include the university‟s education and research buildings
and a medical library. One hundred sixty acres is designated as the Colorado Bioscience Park –
Aurora which including an incubator. Companies need three qualifications to join the incubator
program: 1) research needs to be in life sciences, 2) science has to be peer-reviewed, and 3) there
needs to be a compelling reason to be in the incubator program. Officials at Fitzsimons will
consider whether a technology has the opportunity to grow a company (Krizner 2005).
According to PriceWaterhouseCoopers Moneytree and IPO.com, 16 venture capital
investments were made in the Denver-Boulder-Greeley CMSA between 1995 and 2001, totaling
$156,162,000 or a 1.6% share of the total venture capital investments made during this time in the
United States. The Commercial Opportunity Fund was created by Colorado State University to
support early feasibility studies and analyses of technologies that may emerge from its faculty.
The fund‟s purpose is to provide monetary support to increase the likelihood of commercial
success of the technologies. Criteria used by the Colorado State University Research Foundation
(CSURF) to grant awards include commercial viability, proximity to completion, market
research, and adequacy (Batelle 2006). The Proof of Concept (POC) Fund, created by the
University of Colorado, is similar to Commercial Opportunity Fund but uses a competitive
application process managed by the Technology Transfer Office. Recombinant Capital is a
private analyst of the biopharmaceutical industry and reports the dollar value of R&D. The total
value for Denver-Boulder-Greeley between 1990 and 2001 was $169 million which increased
33
from $19 million prior to 1980 to $133 million between 1996 and 2001 (Cortwright and Mayer
2002).
4.2.2 North Carolina
Many regions across America are developing strategies to create and grow clusters of
biopharmaceutical companies, and many are cultivating in the Triangle and Piedmont Triad
(Batelle 2006). These regions are working to replace jobs in older, declining, and manufacturing
industries with life sciences since it is a field that can compete in national and international
markets. Clusters and concentrations of businesses are an important requirement for the success
of the industry in these two metropolitan areas. Many regional policy-makers invest in R&D
infrastructure to help sustain university-industry connections. Alliances and access to knowledge
may not necessarily be bound by geography but spatial proximity promotes vital knowledge
spillovers. North Carolina experienced a decline in the textile, apparel, furniture, and tobacco
industries because the state lacked a strong R&D base. This prompted an effort to shift policy
from traditional manufacturing to high-tech businesses. Government leaders and policy-makers
believe that the state should nurture the identified existing clusters of high-growth and R&D-
intensive activity. Stressing the development of these clusters will help achieve and maintain a
competitive advantage (Feser and Luger 2003).
Strategies implemented to expand the industry throughout the state include the New Jobs
Across North Carolina policy developed in 2004 by the North Carolina Biotechnology Center.
The nonprofit Golden LEAF Foundation contributed to the $60 million Biomanufacturing and
Pharmaceutical Training Consortium, a network created through NC State University, Central
University in Durham, and the NC Community College System. This fund also contributed a
great deal to a bioscience venture fund. The Biotechnology Center offers institutional
development and multidisciplinary research grants or bioscience research at North Carolina

34
universities. The Center, along with the UNC system, provides a trust fund and other sources for
assistance in faculty recruitment. Collaborative funding grants are offered by the Biotechnology
Center and the Kenan Institute for Engineering, Technology and Science at NC State to match
university and industry contributions to joint research projects (Batelle 2006).
The North Carolina Small Business and Technology Development Center offers grants
for universities participating in applied research that are matched by in-state companies. The
Council for Entrepreneurial Development is a non-profit organization that mentors and prepares
entrepreneurs in the Research Triangle area for raising venture capital. The Biotechnology
Center also makes loans to companies for product development, proof-of-concept research and
business planning (Batelle 2006). There are several bioscience incubators available in North
Carolina including a 14,000-square-foot one at the First Flight Venture Center in RTP, RTP
BioVenture Center, and the NC State Technology Incubator. Research Triangle Park (RTP) has
grown since its development in the 1950s with the goal of attracting R&D labs in biosciences,
including agricultural (Batelle 2006). It now encompasses over 15 million square feet of office
space on over 7000 acres. The Piedmont-Triad Research Park in Winston-Salem currently houses
14 bioscience companies and uses resources from Bowman Gray School of Medicine at Wake
Forest University.
Parks provide “a nurturing environment in which to work” as a full-fledged stand-alone
business (Krizner 2005: 16). The biggest challenge to startup a company is often the transition
from the academic world to the business world. Biopharmaceutical economic development
projects grew tremendously during the past few years. The industry is constantly finding new
products and vaccines while maintaining job growth.

35
4.3 Commuting Patterns
CSAs are defined by the U.S. Census Bureau as an aggregate of adjacent MSAs that are
linked by commuting ties (U.S. Census Bureau 2008). Included in this research are the
commuting statistics, especially to note the amount of commuting taking place between the
selected proximate regions (MSAs or CSAs). Tables 4.2 and 4.3 show the number of commuters
traveling daily between the counties of the Colorado and North Carolina study regions.

36
So
urc
e: U
.S. C
ensu
s B
ure
au,
Cen
sus
Tra
nsp
ort
atio
n P
lannin
g P
ackag
e
Ta
ble
4.2
T
ota
l N
um
ber
of
Dai
ly C
om
mute
rs:
Colo
rado S
tudy A
rea
Bould
er M
SAGr
eeley
MSA
Bould
erAd
ams
Arap
ahoe
Clear
Cree
kDe
nver
Doug
lasEl
Paso
Elber
tGi
lpin
Jeffe
rson
Park
Weld
Tota
l Out
-bou
nd
Bould
er12
7,692
6,137
2,496
410
,783
277
124
596,6
1911
2,419
28,92
9
Adam
s17
,009
70,24
413
,884
2749
,339
2,106
198
4957
521
,028
291,9
1715
9,396
ORIG
INAr
apah
oe2,3
3313
,901
130,4
3584
,795
12,28
158
610
018
712
,240
4836
925
4,942
Clear
Cree
k47
140
223
2,425
890
393
278
1,262
72
5,269
COUN
TYDe
nver
5,395
14,94
847
,190
6717
6,750
6,107
553
2860
523
,176
6279
927
0,285
Doug
las71
12,1
1132
,217
20,90
130
,157
1,377
293
346,5
8914
8493
,777
El Pa
so18
449
31,8
512,1
491,1
5525
1,105
484
359
257,2
99
Elber
t46
347
2,389
1,500
2,180
379
3,006
939
02
210
,204
Gilpi
n69
089
7625
279
231,2
1952
03
132,2
47
Jeffe
rson
12,86
719
,496
30,48
244
873
,727
5,438
282
102,0
3213
7,126
305
743
270,0
89
Park
9022
058
04
805
111
214
151,5
522,7
886,2
89
Weld
7,771
4,716
991
3,702
209
411,3
368
57,77
768
,780
Tota
l In-b
ound
47
,143
126,7
0526
0,318
2,996
414,8
3759
,806
254,7
383,4
864,9
5420
5,703
3,269
61,76
51,3
98,57
7
DEST
INAT
ION
COUN
TY
Denv
er-A
uror
a MSA

37
So
urc
e: U
.S. C
ensu
s B
ure
au,
Cen
sus
Tra
nsp
ort
atio
n P
lannin
g P
ackag
e
Ta
ble
4.3
T
ota
l N
um
ber
of
Dai
ly C
om
mute
rs:
Nort
h C
aroli
na
Stu
dy A
rea
Ala
man
ceD
avid
son
Dav
ieFo
rsyt
hFr
ankl
inG
uilfo
rdRa
ndol
phRo
ckin
gham
Stok
esSu
rry
Yadk
inCh
atha
mD
urha
mH
arne
ttJo
hnst
onO
rang
e Pe
rson
Wak
eTo
tal O
ut-b
ound
Alam
ance
47,7
3412
919
418
6,44
330
127
134
62,
387
860
3,58
958
847
62,6
10
Dav
idso
n32
340
,621
314
11,0
6214
,668
2,54
017
763
1039
222
1845
69,9
04
Dav
ie25
521
7,71
05,
242
410
5328
3069
327
1558
14,4
88
Chat
ham
349
2154
2158
988
411
611
,018
2,73
926
714,
206
82,
743
22,7
46
ORI
GIN
Dur
ham
385
2529
211
303
2320
1534
984
,262
409
9,26
227
013
,929
109,
492
COU
NTY
Fors
yth
287
4,13
690
211
9,23
38
16,5
1539
235
81,
165
560
663
2084
1533
226
214
4,63
5
Fran
klin
252
2747
951
2828
254
2910
,347
11,7
92
Gui
lford
4,05
02,
982
677,
636
1718
7,15
03,
984
1,72
068
1045
192
450
536
253
597
209,
388
Har
nett
1721
2434
247
248
547
15,9
161,
521
848,
841
27,2
84
John
ston
4133
7792
5111
812
41,
645
1,39
926
,971
246
823
,628
54,3
34
Ora
nge
2,03
883
8352
647
792
16,4
709
105
35,0
5314
24,
212
59,5
60
Pers
on31
25
876
3643
3,93
917
671
9,60
961
415
,330
Rand
olph
578
2,60
711
694
20,2
7838
,637
143
1012
832
3929
5515
764
,082
Rock
ingh
am50
396
2487
011
,960
7325
,523
511
2136
175
122
39,7
61
Stok
es15
252
5810
,259
1,62
020
1,36
06,
330
1,16
766
1754
21,2
18
Surr
y13
101
734,
316
500
1479
512
24,8
211,
146
211
219
8931
,707
Wak
e27
439
2315
32,
430
353
2310
715
6087
343
,351
916
4,05
03,
552
166
272,
432
328,
727
Yadk
in11
134
541
5,50
432
319
1472
1,67
87,
572
2715
,895
Tota
l In-
boun
d 56
,980
51,6
979,
742
165,
658
2,89
426
1,82
647
,045
29,7
578,
782
28,3
789,
918
14,8
8615
6,92
418
,313
33,5
3557
,255
10,3
5933
9,00
41,
302,
953
Gre
ensb
oro
-- W
inst
on-S
alem
-- H
igh
Poin
t CSA
Rale
igh
-- D
urha
m --
Car
y CS
A
DES
TIN
ATI
ON
CO
UN
TY
38
From these figures, the following number of commuters between proximate regions was
determined:
Location Number of Commuters
Boulder MSA to Denver-Aurora MSA 26,386
Boulder MSA to Greeley MSA 2,419
Denver Aurora MSA to Boulder MSA 39,118
Denver-Aurora MSA to Greeley MSA 2,209
Greeley MSA to Boulder MSA 7,771
Greeley MSA to Denver-Aurora MSA 10,962
Greensboro – Winston-Salem – High Point CSA
to Raleigh – Durham – Cary CSA 11,052
Raleigh – Durham – Cary CSA to
Greensboro – Winston-Salem – High Point CSA 7,177
This data helps demonstrate the interaction between the proximate places in each state and
contributes to the hypothesis that synergies exist.
4.4 Employment
Tables 4.4 and 4.5 show the numbers of employees and LQs by NAICS code for the
counties in the Colorado and North Carolina study areas. After data were collected from the
ReferenceUSA database, very few employees from both study areas were listed for NAICS
334517 (Irradiation Apparatus Manufacturing), so it was left out of the LQ calculation. LQ is
used in this analysis as an indicator of the strength of the employment bases of the specified life
science sectors. Table 4.4 shows that Boulder County (also its own MSA) has the highest LQ in
biological product manufacturing, surgical and medical instrument manufacturing, and research
and development. Denver County shows the highest in surgical and medical instrument
manufacturing, and the same is true for all the counties combined. Table 4.5 shows that Durham
County is similar to Boulder, in that the LQ is high for surgical and medical instrument
manufacturing and research and development. Biological product manufacturing returns the

39
highest LQ for all counties in the North Carolina study region. Later in this section, the LQs for
all sectors are presented for all MSAs covered in this study (Table 4.8 and 4.9).

40
Table 4.4 Number of Employees and LQs for Colorado Counties
Employees LQ Employees LQ Employees LQ Employees LQ
Medicinal and Botanical Manufacturing (325411) 125 2.78
Pharmaceutical Preparation Manufacturing (325412) 69 0.31 39 0.09 439 1.94 117 0.17
In-Vitro Diagnostic Substance Manufacturing (325413) 35 2.22
Biological Product (except Diagnostic) Manufacturing (325414) 58 2.25 448 17.40
Electromedical and Electrotherapeutic Apparatus Manufacturing (334510) 6 0.10 14 0.24 31 0.18
Laboratory Apparatus and Furniture Manufacturing (339111) 18 1.24 20 0.46
Surgical and Medical Instrument Manufacturing (339112) 319 2.95 1529 7.08 5028 46.50 584 1.80
Research and Development in Life Sciences (541710) 250 0.47 563 0.53 1147 2.14 825 0.51
ALL NAICS 737 0.72 2256 1.11 7094 6.97 1577 0.52
Employees LQ Employees LQ Employees LQ Employees LQ Employees LQ
Medicinal and Botanical Manufacturing (325411) 125 0.56
Pharmaceutical Preparation Manufacturing (325412) 166 1.23 207 0.46 1037 0.51
In-Vitro Diagnostic Substance Manufacturing (325413) 15 0.48 50 0.32
Biological Product (except Diagnostic) Manufacturing (325414) 2 3.22 7 0.14 515 1.99
Electromedical and Electrotherapeutic Apparatus Manufacturing (334510) 3 0.03 54 0.39
Laboratory Apparatus and Furniture Manufacturing (339111) 38 0.26
Surgical and Medical Instrument Manufacturing (339112) 149 2.30 20 7.67 2771 12.80 19 0.09 10419 12.60
Research and Development in Life Sciences (541710) 114 0.36 840 0.78 67 0.06 3806 0.73
ALL NAICS 429 0.70 22 0.90 3843 1.89 86 0.04 16044 1.92
Denver
Douglas
Colorado Study Area Counties
Number of Employees and Location Quotients by NAICS Code (According to ReferenceUSA Database)
Jefferson WeldElbert All Counties
Adams BoulderArapahoe
Table 4.5 Number of Employees and LQs for North Carolina Counties
Employees LQ Employees LQ Employees LQ Employees LQ Employees LQ
Medicinal and Botanical Manufacturing (325411)
Pharmaceutical Preparation Manufacturing (325412) 2 0.02 929 4.00
In-Vitro Diagnostic Substance Manufacturing (325413)
Biological Product (except Diagnostic) Manufacturing (325414) 4 0.31 80 30.00 20 0.78
Electromedical and Electrotherapeutic Apparatus Manufacturing (334510) 73 1.24
Laboratory Apparatus and Furniture Manufacturing (339111)
Surgical and Medical Instrument Manufacturing (339112) 324 5.99 15 0.41 15 1.66 6308 58.30
Research and Development in Life Sciences (541710) 100 0.37 2 0.37 5662 10.50
ALL NAICS 430 0.96 82 1.46 15 0.04 15 0.18 12992 17.30
Employees LQ Employees LQ Employees LQ Employees LQ Employees LQ
Medicinal and Botanical Manufacturing (325411)
Pharmaceutical Preparation Manufacturing (325412) 10 0.04 1091 2.42 16 0.43 2 0.03
In-Vitro Diagnostic Substance Manufacturing (325413)
Biological Product (except Diagnostic) Manufacturing (325414) 3 0.12 1494 29.00 1204 156.00 10 1.30
Electromedical and Electrotherapeutic Apparatus Manufacturing (334510) 511 8.68
Laboratory Apparatus and Furniture Manufacturing (339111) 200 6.86
Surgical and Medical Instrument Manufacturing (339112) 191 1.77 202 0.94 40 1.23 174 5.37
Research and Development in Life Sciences (541710) 116 0.22 182 0.17 10 0.00 120 0.75
ALL NAICS 831 0.87 3169 1.56 16 0.09 1254 4.10 306 1.00
Employees LQ Employees LQ Employees LQ Employees LQ Employees LQ
Medicinal and Botanical Manufacturing (325411) 130 1.93 0 0.58
Pharmaceutical Preparation Manufacturing (325412) 3389 5.00 5439 2.40
In-Vitro Diagnostic Substance Manufacturing (325413) 195 4.13 195 0.00
Biological Product (except Diagnostic) Manufacturing (325414) 44 0.57 2859 11.10
Electromedical and Electrotherapeutic Apparatus Manufacturing (334510) 140 0.79 724 1.23
Laboratory Apparatus and Furniture Manufacturing (339111) 262 5.99 462 3.17
Surgical and Medical Instrument Manufacturing (339112) 240 5.55 8 1.52 1374 4.24 122 14.40 9013 8.19
Research and Development in Life Sciences (541710) 4055 2.52 10247 1.91
ALL NAICS 240 0.59 8 0.16 9589 3.14 122 1.54 28939 2.85
Orange
North Carolina Study Area Counties
Number of Employees and Location Quotients by NAICS Code (According to ReferenceUSA Database)
Yadkin All CountiesRandolph Stokes Wake
Alamance Chatham Davidson Davie Durham
Forsyth Guilford Harnett Johnston
Source: ReferenceUSA Database
41
Figures 4.3 and 4.4 show the number of employees and locations of individual companies
classified by NAICS code. The point features for the companies are displayed in a geographic
information system based on coordinates. These maps present the companies obtained from the
ReferenceUSA Business database, containing latitude and longitude information. Tables 4.6 and
4.7 list the companies from the ReferenceUSA Corp Tech database, since they contained no
latitude and longitude information. The maps and Corp Tech lists begin to show a general pattern
of different sectors and employee size of individual companies within the study areas. Figure 4.3
shows larger companies within Surgical and Medical Instrument Manufacturing (NAICS 339112)
in all three MSAs with more located in the Denver-Aurora MSA. A dense concentration of R&D
(NAICS 541710) companies is found in the Boulder MSA and many in this sector are scattered
throughout Denver-Aurora. Figures 4.4 and 4.5 show a similar pattern for North Carolina. Large
companies within Surgical and Medical Instrument Manufacturing are found in both CSAs while
R&D is concentrated more in the Triangle. The Triangle is also home to several large
Pharmaceutical Preparation Manufacturing (NAICS 325412) companies as shown in Figure 4.5.
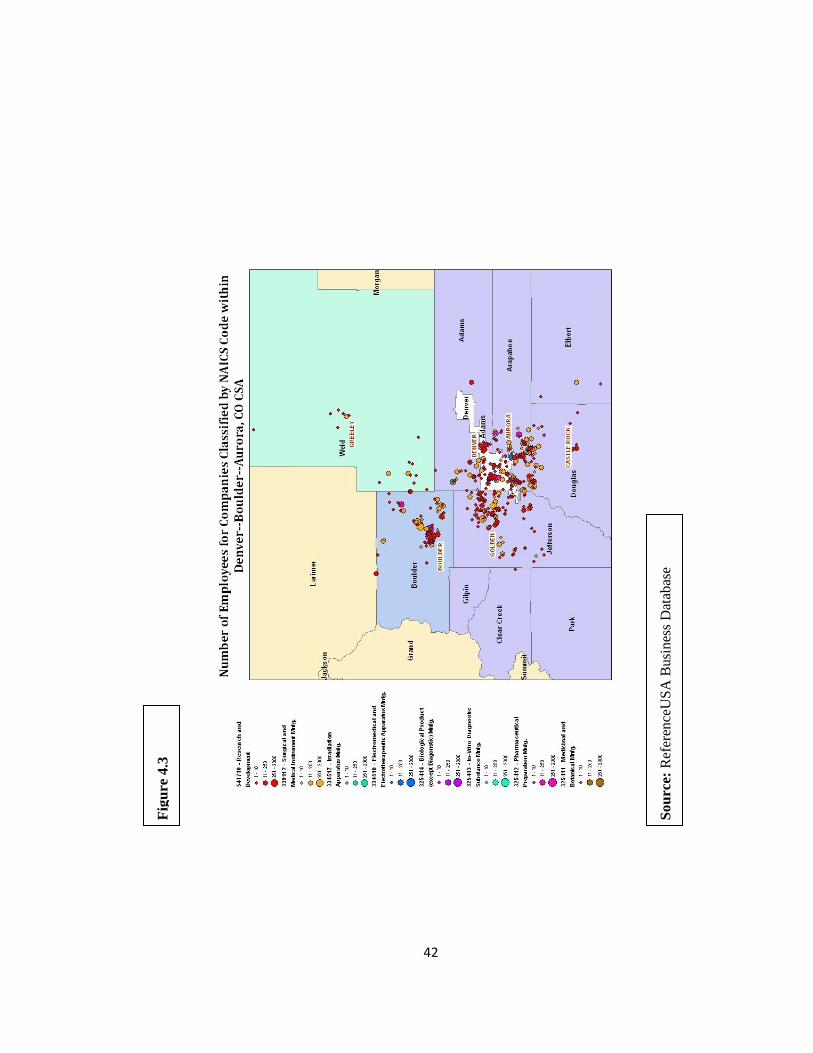
42
So
urc
e: R
efer
ence
US
A B
usi
nes
s D
atab
ase
Fig
ure
4.3

43
Figure 4.4
Figure 4.5
Source: ReferenceUSA Business Database

44
Table 4.6 Colorado Corp Tech Companies
Company Name City ST NAICS1 Primary Industry Code Num of Employees Company Type
Isonics Corp. Golden CO 325411 Advanced Materials 16 Public
Animark, Inc. Aurora CO 325412 Medical 4 Private
Roche Colorado Corporation Boulder CO 325412 Pharmaceuticals 325 Subsidiary
Sirna Therapeutics Boulder CO 325412 Pharmaceuticals 77 Public
Shippert Medical Technologies Corp. Centennial CO 325412 Medical 15 Private
The Chemins Company, Inc. Colorado Springs CO 325412 Pharmaceuticals 110 Private
EAS, Inc. Golden CO 325412 Pharmaceuticals 200 Private
GTC Nutrition, LLC Golden CO 325412 Pharmaceuticals 3 Private
Ora Labs Inc Parker CO 325412 Pharmaceuticals 153 Subsidiary
Myogen, Inc. Westminster CO 325412 Pharmaceuticals 53 Public
Affinity Bioreagents, Inc. Golden CO 325413 Biotechnology 15 Private
Martek Biosciences Boulder Corporation Boulder CO 325414 Biotechnology 30 Subsidiary
Pharmion Corporation Boulder CO 325414 Pharmaceuticals 50 Public
Proligo LLC Boulder CO 325414 Biotechnology 331 Subsidiary
SomaLogic, Inc. Boulder CO 325414 Biotechnology 40 Private
AspenBio, Inc. Castle Rock CO 325414 Biotechnology 11 Public
Evolutionary Genomics, LLC Lafayette CO 325414 Biotechnology 13 Private
Geobiotics, LLC Lakewood CO 325414 Biotechnology 7 Private
GlobeImmune, Inc. Louisville CO 325414 Biotechnology 34 Private
Allos Therapeutics, Inc. Westminster CO 325414 Pharmaceuticals 57 Public
CardioOptics, Inc. Boulder CO 334510 Medical 12 Private
Encision, Inc. Boulder CO 334510 Medical 35 Public
Conmed Electrosurgery Centennial CO 334510 Medical 331 Subsidiary
Williams-Associates Inc Commerce City CO 334510 Medical 6 Unknown
Denver Instrument Co Denver CO 334510 Environmental 12 Public
VIASYS Healthcare Inc. Nicolet Vascular Inc. Golden CO 334510 Medical 3 Subsidiary
Gambro Healthcare Lakewood CO 334510 Medical 500 Subsidiary
Mesa Laboratories, Inc. Medical Division Lakewood CO 334510 Medical 32 Division
Medivance, Inc. Louisville CO 334510 Medical 35 Private
Mountain X Ray & Equipment Inc Denver CO 334517 Medical 5 Private
Sienco, Inc. Arvada CO 339111 Medical 3 Private
Scientech, Inc. Boulder CO 339111 Test & Measurement 18 Private
Vitraform Inc Denver CO 339111 Test & Measurement 20 Private
Accellent Cardiology Arvada Arvada CO 339112 Medical 140 Division
Therapeutic Recreation Systems, Inc. Boulder CO 339112 Medical 5 Private
Tyco Healthcare Group LP Valleylab Division Boulder CO 339112 Medical 664 Division
Valleylab Boulder CO 339112 Medical 1201 Division
Endo Pharmaceuticals Colorado Boulder CO 339112 Medical 21 Subsidiary
Pare Surgical Inc Centennial CO 339112 Medical 1 Private
Preferred Medical Products, Inc. Centennial CO 339112 Medical 35 Private
Certol International, LLC Cottrell Commerce City CO 339112 Medical 30 Private
Genesee BioMedical, Inc. Denver CO 339112 Medical 17 Private
Baxa Corporation Englewood CO 339112 Medical 185 Private
Denver Biomedical, Inc. Golden CO 339112 Medical 50 Private
Employee Information Services, Inc. Lakewood CO 339112 Medical 65 Private
Ferraris Medical, Inc. Louisville CO 339112 Medical 40 Subsidiary
Inverness Medical BioStar, Inc. Louisville CO 339112 Medical 300 Division
Sound Surgical Technologies LLC Louisville CO 339112 Medical 58 Private
Mc Kinley Medical LLC Wheat Ridge CO 339112 Medical 24 Private
Source: ReferenceUSA Corp Tech Database

45
Table 4.7 North Carolina Corp Tech Companies
Company Name City ST NAICS1 Primary Industry Code Num of Employees Company Type
Aeolus Pharmaceuticals Inc. Research Triangle Park NC 325412 Pharmaceuticals 5 Public
Apex Bioscience, Inc. Durham NC 325412 Pharmaceuticals 10 Subsidiary
Ardent Pharmaceuticals, Inc. Durham NC 325412 Pharmaceuticals 16 Private
DarPharma, Inc. Chapel Hill NC 325412 Pharmaceuticals 13 Private
EISAI Inc Research Triangle Park NC 325412 Pharmaceuticals 230 Private
Eli Lilly and Co. Sphinx Laboratories Durham NC 325412 Pharmaceuticals 148 Division
Gentris Corp. Morrisville NC 325412 Pharmaceuticals 15 Private
Gilead Sciences, Inc. Durham NC 325412 Pharmaceuticals 180 Division
IDEXX Pharmaceuticals, Inc. Greensboro NC 325412 Pharmaceuticals 40 Private
Inspire Pharmaceuticals, Inc. Durham NC 325412 Pharmaceuticals 165 Public
Krenitsky Pharmaceuticals Inc. Durham NC 325412 Pharmaceuticals 6 Private
Kucera Pharmaceutical Co., Inc. Winston Salem NC 325412 Biotechnology 5 Private
MoliChem Medicines Inc. Chapel Hill NC 325412 Pharmaceuticals 4 Private
Novo Nordisk Pharmaceutical Clayton NC 325412 Pharmaceuticals 365 Unknown
Pozen, Inc. Chapel Hill NC 325412 Pharmaceuticals 38 Public
Salix Pharmaceuticals, Ltd. Raleigh NC 325412 Pharmaceuticals 83 Public
TEAMM Pharmaceuticals, Inc. Morrisville NC 325412 Pharmaceuticals 85 Subsidiary
Targacept Inc. Winston Salem NC 325412 Pharmaceuticals 72 Private
Tranzyme, Inc. Research Triangle Park NC 325412 Pharmaceuticals 32 Private
Trimeris, Inc. Durham NC 325412 Biotechnology 100 Public
Tyco Healthcare Mallinckrodt Raleigh NC 325412 Pharmaceuticals 280 Division
Hybrizyme Corp. Raleigh NC 325413 Biotechnology 7 Private
Icoria, Inc. Morrisville NC 325413 Biotechnology 188 Public
Ajinomoto AminoScience, LLC Raleigh NC 325414 Biotechnology 130 Private
AlphaVax Human Vaccines, Inc. Research Triangle Park NC 325414 Pharmaceuticals 60 Private
Argos Therapeutics, Inc. Durham NC 325414 Pharmaceuticals 65 Private
Athenix Corp. Durham NC 325414 Biotechnology 38 Private
Biogaia Biologics, Inc. Raleigh NC 325414 Biotechnology 3 Subsidiary
Biolex, Inc. Pittsboro NC 325414 Biotechnology 80 Private
Carolina By-Products Co. Greensboro NC 325414 Biotechnology 1494 Private
EMD Pharmaceuticals, Inc. Durham NC 325414 Pharmaceuticals 166 Subsidiary
Piedmont Research Ctr Morrisville NC 325414 Biotechnology 40 Private
Serenex Durham NC 325414 Biotechnology 25 Private
Talecris Biotherapeutics, Inc. Research Triangle Park NC 325414 Biotechnology 1700 Private
Vesta Therapeutics, Inc. Durham NC 325414 Biotechnology 7 Private
Zen-Bio, Inc. Research Triangle Park NC 325414 Biotechnology 9 Private
BMG LabTechnologies, Inc. Durham NC 334510 Biotechnology 50 Private
BioStratum Inc. Durham NC 334510 Medical 23 Private
Carolina Medical, Inc. King NC 334510 Medical 11 Subsidiary
Diagnostic Healthcare Systems Raleigh NC 334510 Medical 20 Private
LipoScience, Inc. Raleigh NC 334510 Medical 120 Private
MED-EL Corporation North America Durham NC 334510 Medical 0 Subsidiary
Aeroglide Corporation Cary NC 339111 Test & Measurement 145 Private
Flexcell International Corp. Hillsborough NC 339111 Biotechnology 10 Private
Purolator Facet Inc Greensboro NC 339111 Subassemblies & Components 200 Public
Bespak, Inc. Cary NC 339112 Medical 85 Public
Hospira, Inc. Clayton Clayton NC 339112 Medical 60 Division
Innovative Devices, LLC Raleigh NC 339112 Medical 2 Partnership
MEDTOX Diagnostics, Inc. Burlington NC 339112 Medical 65 Subsidiary

46
Medi USA Whitsett NC 339112 Medical 32 Unknown
Nobex Corporation Durham NC 339112 Medical 42 Private
Owens & Minor Raleigh NC 339112 Medical 57 Unknown
Ribonomics, Inc. Durham NC 339112 Biotechnology 5 Private
STEMCO Biomedical, Inc. Durham NC 339112 Medical 26 Private
SunTech Medical, Inc. Morrisville NC 339112 Medical 70 Private
TriPath Oncology, Inc. Durham NC 339112 Medical 70 Subsidiary
Triangle Biomedical Sciences, Inc. Durham NC 339112 Medical 30 Private
bioMerieux, Inc. Durham NC 339112 Biotechnology 3850 Subsidiary
AAIPharma Inc. Analytical Services Inc. Chapel Hill NC 541710 Pharmaceuticals 58 Division
Alpha-Gamma Technologies, Inc. Research and Engineering Division Raleigh NC 541710 Environmental 0 Division
Amphora Discovery Corp. Durham NC 541710 Pharmaceuticals 56 Private
Bayer Environmental Science Clayton NC 541710 Biotechnology 22 Unknown
CaroTech, LLC Durham NC 541710 Pharmaceuticals 3 Private
Cato Research Ltd Durham NC 541710 Biotechnology 300 Subsidiary
Charles River Clinical Services Cary NC 541710 Test & Measurement 2827 Division
Chathamborough Research Group Pittsboro NC 541710 Pharmaceuticals 2 Private
Chemical Technologies, LLC Graham NC 541710 Chemicals 70 Private
Constella Group Inc. Durham NC 541710 Computer Software 170 Private
Eastern Technical Associates Raleigh NC 541710 Environmental 20 Private
Embrex, Inc. Durham NC 541710 Biotechnology 309 Public
Fortron Bio Science, Inc. Morrisville NC 541710 Biotechnology 7 Private
Health Decisions, Inc. Chapel Hill NC 541710 Biotechnology 43 Private
Honda R & D Americas Inc Haw River NC 541710 Factory Automation 30 Public
HumanCentric Technologies, Inc. Cary NC 541710 Computer Hardware 40 Private
Integrated Laboratory Systems, Inc. Durham NC 541710 Environmental 120 Private
King Pharmaceuticals Inc Cary NC 541710 Pharmaceuticals 65 Unknown
Laboratory Corporation of America Research Triangle Park NC 541710 Pharmaceuticals 700 Division
Lineberry Research Associates, LLC Research Triangle Park NC 541710 Pharmaceuticals 75 Private
MediaSpan Group, Inc. Durham NC 541710 Telecommunications & Internet 200 Private
Metabolon Inc Durham NC 541710 Factory Automation 34 Private
National Institute of Environmental Health Sciences Research Triangle Park NC 541710 Medical 1000 Subsidiary
National Institute-Environmntl Hlth Sciences Research Triangle Park NC 541710 Environmental 875 Non-profit
Norak Biosciences, Inc. Morrisville NC 541710 Biotechnology 29 Private
Novozymes North America, Inc. Franklinton NC 541710 Biotechnology 400 Subsidiary
Nuada Pharmaceuticals, Inc. Durham NC 541710 Pharmaceuticals 30 Private
PPD Discovery Morrisville NC 541710 Biotechnology 43 Subsidiary
PharmaLinkFHI, Inc. Research Triangle Park NC 541710 Pharmaceuticals 0 Private
SCYNEXIS Chemistry and Automation, Inc. Research Triangle Park NC 541710 Biotechnology 80 Private
Scientific Services Program Chapel Hill NC 541710 Biotechnology 5 Non-profit
Synthon Parmaceuticals Research Triangle Park NC 541710 Factory Automation 35 Unknown
TransTech Pharma Inc. High Point NC 541710 Biotechnology 70 Private
Valspar Corp High Point NC 541710 Advanced Materials 100 Public
inGenium research, inc. Cary NC 541710 Biotechnology 30 Private
nTouch Research Corp. Raleigh NC 541710 Pharmaceuticals 90 Private
Source: ReferenceUSA Corp Tech Database
Each MSA‟s specialization in life sciences is more apparent in Tables 4.8 and 4.9. These
show the calculated LQ‟s by NAICS code for each MSA. Table 4.8 shows that surgical and
medical instrument manufacturing is the most dominant in both Boulder and Denver-Aurora, but
far higher in Boulder at 46.5. This sector is considered the specialization for both of these MSAs.

47
These LQs conclude that the Boulder MSA is the hub of life science and manufacturing activities.
The Greeley MSA does not have a significant life science industry base.
The hypothesis that each MSA develops its own specialization is more applicable to the
North Carolina study area. This is evident from the LQs shown in Table 4.9. It shows that
biological product manufacturing is the specialization in the Triad (LQ of 11.67) while it is
surgical and medical instrument manufacturing in the Triangle (LQ of 12.18). The Triangle
specializes more in R&D than the Triad. The Triad has a higher LQ for all the other
manufacturing activities than the Triangle, except for pharmaceutical preparation manufacturing
and laboratory apparatus and furniture manufacturing.
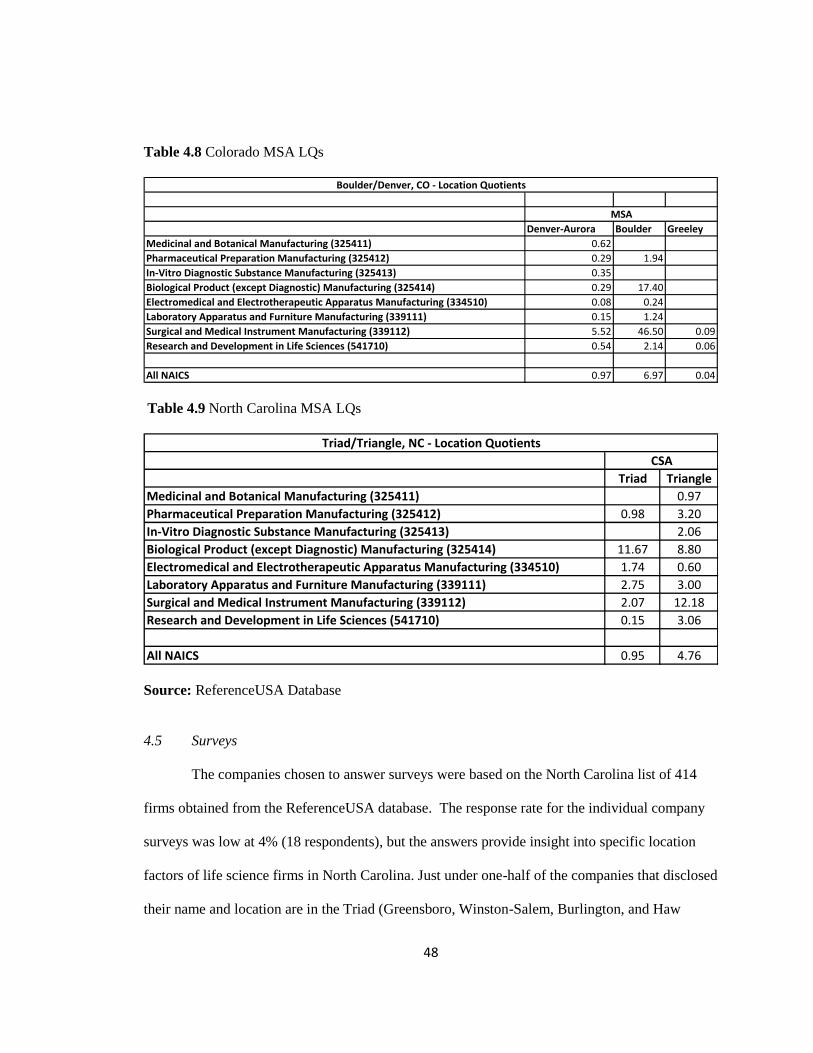
48
Table 4.8 Colorado MSA LQs
Denver-Aurora Boulder Greeley
Medicinal and Botanical Manufacturing (325411) 0.62
Pharmaceutical Preparation Manufacturing (325412) 0.29 1.94
In-Vitro Diagnostic Substance Manufacturing (325413) 0.35
Biological Product (except Diagnostic) Manufacturing (325414) 0.29 17.40
Electromedical and Electrotherapeutic Apparatus Manufacturing (334510) 0.08 0.24
Laboratory Apparatus and Furniture Manufacturing (339111) 0.15 1.24
Surgical and Medical Instrument Manufacturing (339112) 5.52 46.50 0.09
Research and Development in Life Sciences (541710) 0.54 2.14 0.06
All NAICS 0.97 6.97 0.04
MSA
Boulder/Denver, CO - Location Quotients
Table 4.9 North Carolina MSA LQs
Triad Triangle
Medicinal and Botanical Manufacturing (325411) 0.97
Pharmaceutical Preparation Manufacturing (325412) 0.98 3.20
In-Vitro Diagnostic Substance Manufacturing (325413) 2.06
Biological Product (except Diagnostic) Manufacturing (325414) 11.67 8.80
Electromedical and Electrotherapeutic Apparatus Manufacturing (334510) 1.74 0.60
Laboratory Apparatus and Furniture Manufacturing (339111) 2.75 3.00
Surgical and Medical Instrument Manufacturing (339112) 2.07 12.18
Research and Development in Life Sciences (541710) 0.15 3.06
All NAICS 0.95 4.76
CSA
Triad/Triangle, NC - Location Quotients
Source: ReferenceUSA Database
4.5 Surveys
The companies chosen to answer surveys were based on the North Carolina list of 414
firms obtained from the ReferenceUSA database. The response rate for the individual company
surveys was low at 4% (18 respondents), but the answers provide insight into specific location
factors of life science firms in North Carolina. Just under one-half of the companies that disclosed
their name and location are in the Triad (Greensboro, Winston-Salem, Burlington, and Haw

49
River) while the remaining are located in the Triangle (Raleigh, Durham, and, Chapel Hill, and
RTP). Eleven percent of the companies are classified as diagnostic, 45 percent therapeutic, 11
percent agri-bio, and 33 percent classified themselves in the “other” category (i.e. biodiesel and
manufacturing). Company names are anonymous. These results are shown in Table 4.10.
Table 4.10 Company Background Information from Surveys
Company CSA Main Area of Business Company Type Year Established Number of Employees
1 Triangle Other (biofuels) Other (company) 2003 24
2 Triad Other (biologic, scaffolding) Other 1989 8
3 Triangle Therapeutic A spin off from a university 2000 7
4 Triangle Therapeutic Other (privately held) 2003 10
5 ### Therapeutic 2001 10
6 Triangle Therapeutic A spin off from a university 2005 4
7 ### Therapeutic Other 2002 11
8 ### Agri-Bio 1994 5
9 ### Therapeutic Other (private LLC) 2001 3
10 ### Therapeutic Other 1999 100
11 Triad Diagnostic A subsidiary of a large firm 2002 4
12 Triad Agri-Bio Other (independent) 2006 2
13 Triangle Diagnostic Other 2001 5
14 Triangle Diagnostic Other (started after retiring from university) 2002 5
15 Triad Other (service) Other (small business) 1989 3
16 Triad Therapeutic Other (corporate HQ) 1955 120
17 ### Therapeutic Other 2004 12
18 Triangle Other (Bioanalytical) Other (Type "S" Corp) 1993 55
Source: Survey created by Dr. Susan Walcott and Dr. Sharmistha Bagchi-Sen
The oldest firm is a corporate headquarter therapeutic firm established in 1955. This
company also happens to have the highest number of employees (120). The youngest firm is an
independent agri-bio firm established in 2006, which happens to contain the lowest number of
employees (2). The second largest employer is a therapeutic firm with 100 employees while a
majority of the remaining companies employ less than ten. All of the companies reported
revenue earnings under $10 million with two-thirds reporting under $1 million. The average
percentage of total revenue assigned by a company to R&D activity is 46.5%. Two companies
(one therapeutic and one agri-bio) reported an assigned 100 percent of their revenue toward R&D

50
activity, although the independent agri-bio firm spent only an estimated $20,000 on R&D in the
past 5 years. The largest amount spent on R&D is $20 million (75% of its revenue) by a
therapeutic company with 100 employees. Four of the companies reported regular exporting
activities and 13 of them do not export at all. Table 4.11 shows these results.
Table 4.11 Company Background Information from Surveys: Revenue
Company CSA Main Area of Business Total Revenue % Revenue Estimate $ spent on Export If Yes, Revenue
for R&D R&D (past 5 yrs.) from Export, %
1 Triangle Other (biofuels) $1 - $10 million 15 750,000 no
2 Triad Other (biologic, scaffolding) $1 - $10 million 20 4,000,000 yes, regularly 30
3 Triangle Therapeutic < $1 million 75 6,000,000 no
4 Triangle Therapeutic < $1 million 40 3,000,000 no
5 ### Therapeutic < $1 million 100 yes, periodically 1
6 Triangle Therapeutic < $1 million 80 250,000 no
7 ### Therapeutic < $1 million 70 no
8 ### Agri-Bio < $1 million 20 350,000 no
9 ### Therapeutic < $1 million 50 100,000 no
10 ### Therapeutic $1 - $10 million 75 20,000,000 no
11 Triad Diagnostic $1 - $10 million 0 yes, regularly 5
12 Triad Agri-Bio < $1 million 100 20,000 no
13 Triangle Diagnostic < $1 million 75 2,250,000 yes, regularly 15
14 Triangle Diagnostic < $1 million 90 500,000 no
15 Triad Other (service) < $1 million 0 0 no
16 Triad Therapeutic $1 - $10 million 10 1,000,000 yes, regularly 30
17 ### Therapeutic < $1 million 15 750,000 no
18 Triangle Other (Bioanalytical) $1 - $10 million 3 400,000 no
Source: Survey created by Dr. Susan Walcott and Dr. Sharmistha Bagchi-Sen
Various reasons were given for the locations being chosen for establishment. Several
respondents noted proximity to local universities (i.e. NC State, Duke, UNC-Chapel Hill), RTP,
Piedmont Triad Research Park, medical facilities, farms, and other firms within the industry. A
few personal reasons were listed such as family establishment, lifestyle, existing residence in the
area, and new structure‟s color coordination. A majority of the answers indicate a strong
presence of universities, talented labor, and other biopharmaceutical firms. It is of interest that
two known Triad companies stated proximity to RTP as a reason for location. This signifies the
synergy that exists between the Triad and Triangle. Another respondent mentioned synergies as a
reason. Table 4.12 lists the specific reasons given.

51
Table 4.12 Company Location Information from Surveys
Company CSA Main Area of Business LOCATION
Reason # 1 Reason # 2
1 Triangle Other (biofuels) Good deal on buildings and land Mezzanine painted in corporate colors
2 Triad Other (biologic, scaffolding) Was already living here New opportunities have materialized in the last 3 years
3 Triangle Therapeutic Access to talented labor pool (scientists) Quality of life in RTP
4 Triangle Therapeutic talent in the area general industry player in the area
5 ### Therapeutic town zoning convenience for customers
6 Triangle Therapeutic Close to N.C. State Cost per square foot
7 ### Therapeutic biotech hub skilled worker pool
8 ### Agri-Bio proximity to markets costs
9 ### Therapeutic close to home close to Research Triangle
10 ### Therapeutic quality of life proximity to life science companies
11 Triad Diagnostic close proximity to RTP and other research groups lifestyle
12 Triad Agri-Bio close to farmers, farms close to university; industry
13 Triangle Diagnostic close to Duke and RTP important contacts in the area
14 Triangle Diagnostic established family (wife and children) in RTP area (Duke, UNC-Chapel Hill, NC State)
15 Triad Other (service) Location, near medical facilities cost factor
16 Triad Therapeutic labor costs proximity to RTP
17 ### Therapeutic already resided here research park (Piedmont Triad Research Park), synergies
18 Triangle Other (Bioanalytical) It is where I lived prior to founding the business need for labs by local industries
Source: Survey created by Dr. Susan Walcott and Dr. Sharmistha Bagchi-Sen
Eleven out of the eighteen respondents answered “No” when asked if there is a shortage
of labor supply. Four respondents indicated a shortage of labor supply including companies
specializing in biofuels, therapeutic, diagnostic, and bioanalytical services. They indicated the
need for scientifically educated sales personnel, entrepreneurial managers, and administrative
assistants.
A majority of the companies do not perform R&D in-house. All but two of the
companies have seen an increased or the same amount of R&D collaboration with universities
and industries in the past five years. Less than 30% of the firms have one or more strategic
alliances for manufacturing. Some of the facilities are not suitable for manufacturing. A majority
of the companies reported developing new products and processes in the past ten years. The
average number of new products is approximately seven and the average number of new
processes is three. Most of them had only a few domestic patent approvals within this time
period, but one company had 200. The last section of the survey asked respondents to rank the
importance of various innovation strategies on a scale of 1 to 5 (1 = not important, 2 = minor
importance, 3 = moderate importance, 4 = very important, and 5 = critically important). The

52
average score was calculated for each strategy since a wide range of scores was reported (Figure
4.6).
Figure 4.6 Survey Ranking Scores of Various Firm Innovation Strategies
3.8
3.8
3.1
3.7
2.5
2.9
2.8
3
3.1
2.5
3.5
3.4
3.1
3.1
3.3
3.2
2.2
2.8
1.8
2.9
3.6
3.9
3.2
1.6
2.4
0.0 0.5 1.0 1.5 2.0 2.5 3.0 3.5 4.0 4.5
Expand R&D effort
Develop new products on a continual basis
Develop new processes on a continual basis
Constantly improve existing products
Obtain early technology from university researchers
Develop R&D alliances with U.S. based universities
Develop R&D alliances with Foreign firms/universities
Develop R&D alliances with Pharmaceutical companies
Develop R&D alliances with other biotech companies
Develop R&D alliances with other companies (e.g. chemical)
Collaborate with companies to enhance credibility/reputation
Collaborate with companies to attract investors
Collaborate with companies to access research/market information
Collaborate with companies to develop products and manufacture
Collaborate with companies to access marketing/distribution channels
License out technology
License in technology
Aggessively seek American investors
Aggessively seek foreign investment for US facilities
Manufacture our own products
Incorporate user feedback in the innovation process
Find new domestic clients
Develop strategic alliances with foreign firms for distribution in …
Establish manufacturing facilities in foreign countries
Enter foreign markets before competitors move in
RANKING
RANKING
Source: Survey created by Dr. Susan Walcott and Dr. Sharmistha Bagchi-Sen
The strategies of overall highest importance are to find new domestic clients, develop new
products on a continuous basis, and expand R&D effort. The lowest rankings were with the
strategies of establishing manufacturing facilities in foreign countries, aggressively seeking
foreign investment for U.S. facilities and licensing-in technology. The remaining strategies are
generally at least moderately important. All but two of the companies have seen an increased or

53
the same amount of R&D collaboration with universities and industries in the past five years.
This tells us that firms within the region are working closely with the local universities and
research facilities for R&D activities. Also, a majority of the companies would like to increase
this effort, along with finding new local clients. This is more important to them than seeking
foreign investment. The overall conclusion from these survey findings is that many companies
are likely to seek resources from within their local region. The results contribute to the
hypothesis that life science firms establish their locations in regional clusters and develop
strategies for innovation and collaboration to benefit from synergies and regional growth.

54
CHAPTER V
CONCLUSION
Both Colorado and North Carolina contain comparable regional clusters of companies in
the life science industry. A sectoral complementarity exists between Boulder and Denver,
Colorado, and the Triad and Triangle, North Carolina where the proximate places benefit
economically from the development of industry clusters. Employment clusters were found here
by collecting data from the BLS and ReferenceUSA company database for nine specified sectors
covering R&D and various manufacturing activities. These data, including latitude and longitude
information for individual companies, helps visualize where firms of specified life science sectors
are located. The company location maps conclude that larger companies within Surgical and
Medical Instrument Manufacturing are located in all three study MSAs in Colorado with more
located in Denver-Aurora. A dense concentration of R&D companies is found in the Boulder
MSA and many in this sector are scattered throughout Denver-Aurora. The pattern is similar for
North Carolina where Surgical and Medical Instrument Manufacturing firms are found in both
CSAs while R&D is concentrated more in the Triangle. The Triangle is also home to several
Pharmaceutical Preparation Manufacturing firms.
Each MSA‟s specialization in life sciences is more apparent when looking at calculated
LQ‟s by NAICS code for each MSA. Surgical and medical instrument manufacturing is the most
dominant industry for both Boulder and Denver-Aurora, but the LQ is far higher in Boulder. This
sector is considered the specialization for both of these MSAs. The LQ calculations also
conclude that the Boulder MSA is the hub of life science and manufacturing activities in
Colorado. The Greeley MSA does not have a significant life science industry base. The

55
hypothesis that each MSA develops its own specialization is more applicable to the North
Carolina study area. The LQs conclude that biological product manufacturing is the
specialization in the Triad while it is surgical and medical instrument manufacturing in the
Triangle (LQ of 12.18). The Triangle specializes more in R&D than the Triad. The Triad has a
higher LQ for all the other manufacturing activities than the Triangle, except for pharmaceutical
preparation manufacturing and laboratory apparatus and furniture manufacturing.
Commuting pattern statistics were compiled from the U.S. Census Bureau Transportation
Planning Package to show a connection between the proximate regions of each study area and to
demonstrate the general traits of a regional economic growth engine. Small portions of all
commuters were found to be traveling daily to work in the other proximate MSA or CSA in their
region. The strength of the research base of both study areas is demonstrated through the use of
data from the NIH, including the highest-ranked institutions in terms of research grant funding.
These research institutions provide highly trained and skilled scientists. Nine universities from
these regions are ranked in the top 500. This is an indicator of the high quality of medical
research and well educated labor force. Four universities receiving a total of $280,701,234 in
grants are located in the Colorado study area. Five receiving a total of $834,770,648 are in North
Carolina. Several schools in both study areas provide advanced degrees in life science fields.
Data were collected from surveys conducted for North Carolina companies. Several
survey respondents noted proximity to local universities as the reason for their location decision.
A majority of them also indicated an increase in R&D collaboration with universities. Findings
conclude that many companies are likely to seek resources from within their local region and
contribute to the hypothesis that life science firms establish their locations in regional clusters and

56
develop strategies for innovation and collaboration to benefit from synergies and regional growth.
Findings from these data sources indicate that characteristics of both states allow them to house
proximate, complimentary regions where life science firms can become successful. Synergies in
both states exist between the proximate places to build regional economic growth engines.

57
REFERENCES
Acs, Z., F. FitzRoy, and I. Smith. 2002. High-technology employment and R&D in Cities:
Heterogeneity vs. Specialization. The Annals of Regional Science 36: 373-386.
Advance Colorado Center. 2006. Last Accessed 14 November 2006 from
http://www.advancecoloradocenter.com/
Alcacer, J. and W. Chung. 2007. Location Strategies and Knowledge Spillovers. Management
Science. 53(5): 760-776.
Bagchi-Sen, S. 2007. Strategic Considerations for Innovation and Commercialization in the US
Biotechnology Sector. European Planning Studies 15(6): 753-766.
Batelle. Growing the Nation‟s Bioscience Sector: State Bioscience Initiatives 2006.
Biotechnology Industry Report. Columbus, OH, Batelle Memorial Institute 2006.
Breschi, S. and F. Lissoni. 2001. Knowledge Spillovers and Local Innovations Systems: A
Critical Survey. Industrial and Corporate Change 10(4): 975-1005.
Coenen, L., J. Moodysson, C. Ryan, B. Asheim, and P. Phillips. 2006. Comparing a
Pharmaceutical and an Agro-food Bioregion: On the Importance of Knowledge Bases for
Socio-spatial Patterns or Innovation. Industry and Innovation 13(4): 393-414.
Cooke, P. 2004. Life Sciences Clusters and Regional Science Policy. Urban Studies . 41(5/6):
1113-1131.
Cortwright, J. and H. Mayer. 2002. Signs of Life: The Growth of Biotechnology Centers in the
U.S. The Brookings Institution Center on Urban and Metropolitan Policy.
Colorado Bioscience Association. 2006. Last Accessed 14 November 2006 from
http://www.cobioscience.com/
Debbage, K. and G. Nuyda. 2005. Biotechnology Inventory and Assessment by Metropolitan
Area: Signs of Life in the Triad. Report for Triad Chambers of Commerce and NC
Biotechnology Center.
DeVol, R., P. Wong, J. Ki, A. Bedroussian, and R. Koepp. 2004. “America‟s Biotech and Life
Science Clusters: San Diego‟s Position and Economic Contributions”. Milken Institute.
Feser, Edward J. and M. Luger. 2003. Cluster Analysis as a mode of inquiry: Its use in science
and technology policymaking in North Carolina. European Planning Studies 11(1): 11-24

58
Hall, L. and S. Bagchi-Sen. 2007. An analysis of firm-level innovation strategies in the US
biotechnology industry. Technovation 27:4-14.
Journey to Work and Place of Work. 2000. U.S. Census Bureau. Last Accessed 12 October 2006
from http://www.census.gov/population/www/socdemo/journey.html
Jud, Donald G. and A. Brod. 2006. Triad Bioscience Index. A Report for the Piedmont Triad
Office, North Carolina Biotechnology Center.
Krizner, Ken. 2005. Biotech Companies Seek Location Advantages. Expansion Management.
May 2005, 9-32.
Lyons, Donald. 1995. Agglomeration Economies Among High Technology Firms in Advanced
Production Areas: The Case of Denver/Boulder. Regional Studies 29.3: 265-278
Metro Denver Economic Development Corporation. 2006. Last Accessed 12 November 2006
from http://www.metrodenver.org/
North Carolina Board of Science and Technology. 2006. Last Accessed February 2008 from
www.ncnanotechnology.com
Peterson, Eric. 2000. What Biotech Companies Need to Grow. ColoradoBiz. May 2000.
Phene, A. and S. Tallman. Knowledge Flows and Geography in Biotecnology. International
Journal of Medical Marketing. 2,3: 241-254.
Powell, W., K. Koput, J. Bowie, and L. Smith-Doerr. 2002. The Spatial Clustering of Science and
Capital: Accounting for Biotech Firm-Venture Capital Relationships. Regional Studies
36(3): 291-305.
ReferenceUSA. 2008. Last Accessed 24 May 2008 from www.referenceusa.com
Rosenblum, Lois. 2004. These Parks Mean Business: Using biotechnology research to stimulate
the regional economy. Planning. July: 20-23.
St. John, C. and R. Pouder. 2006. Technology Clusters versus Industry Clusters: Resources,
Networks, and Regional Advantages. Growth and Change 37(2): 141-171.
U.S. Census Bureau. 2008. Last Accessed 11 May 2008 from www.census.gov
U.S. Department of Health and Human Services, Office of Extramural Research – National
Institute of Health “Award Trends.” http://grants1.nih.gov/grants/award/awardtr.htm
(accessed December 16, 2007).
Walcott, S. 2002. Analyzing and Innovative Environment: San Diego as a Bioscience Beachhead.
Economic Development Quarterly 16:99-114.

59
Walcott, S. 2001. Growing Global: Life Cycle of a Life Science Cluster. Growth and Change
32:511- 32.

60
APPENDIX A: SURVEY: INNOVATION AND COLLABORATION IN LIFE SCIENCE
FIRMS
Background:
1. Main area of business (check all that apply):
Diagnostic Therapeutic Agri-Bio Environment Other ___________
2. Is the company:
a subsidiary of a large firm a spin off from a university Other_____________________
3. Is the company: public private
4. When was the company established? _______
5. The total number of employees is (please estimate): __________
6. The total revenue for the most recent fiscal year is (check only one box.):
< $1 million $1-10 million $10.1-25 million $25.1-50 million > $50 million
7. What % of your company‟s total revenue is assigned to research and development (R&D) activity? _%
If possible, please estimate the total dollars spent per year on R&D over the past 5 years: $_______________
8. Do you export? No Yes, regularly Yes, periodically Plan to export in the future
If yes, what percentage of revenue comes from exports? __%
Location:
9. Please list the top two reasons for locating your establishment where you are:

61
Reason #1: _____________________________________________________________________
Reason #2: _____________________________________________________________________
10. Please list the most important form of local/state government assistance that benefits your operations:
Local: _________________________________________________________________________
State: _________________________________________________________________________
11. What is the most essential type of government assistance that is missing and would be beneficial to
your operations?
Local: _________________________________________________________________________
State: _________________________________________________________________________
12. Is there a shortage of labor supply in the area? No Yes
If yes, in which occupational groups (please describe):
Group 1: _____________________________________________________________
Group 2: _____________________________________________________________
Others: _____________________________________________________________

62
Collaborative Efforts:
Collaboration is defined as formal partnerships in R&D, which include substantial contributions of time, capital,
technology, or other assets. Please answer the following questions as they relate to your company’s experience
with collaboration:
13. Is all R&D performed in-house? No Yes If no, please answer the following:
In the past 5 years, university R&D collaboration has increased decreased remained the same
In the past 5 years, industry R&D collaboration has increased decreased remained the same
14. Roughly what percentage of your R&D collaborators comes from the following geographic areas?
(Here, we are trying to assess the importance of local versus non-local R&D connections)
Location of R&D
collaborators
University (percentage share of
collaborators)
Industry (percentage share of
collaborators)
Local % %
State % %
Elsewhere in the US % %
International % %
Total 100% 100%
15. What is the main foreign country from where you have University collaborators? _____________________
16. What is the main foreign country from where you have Industry collaborators? _____________________
Manufacturing and Sales:
17. Does this firm operate with strategic alliances for manufacturing? Yes No If yes, how many? ___
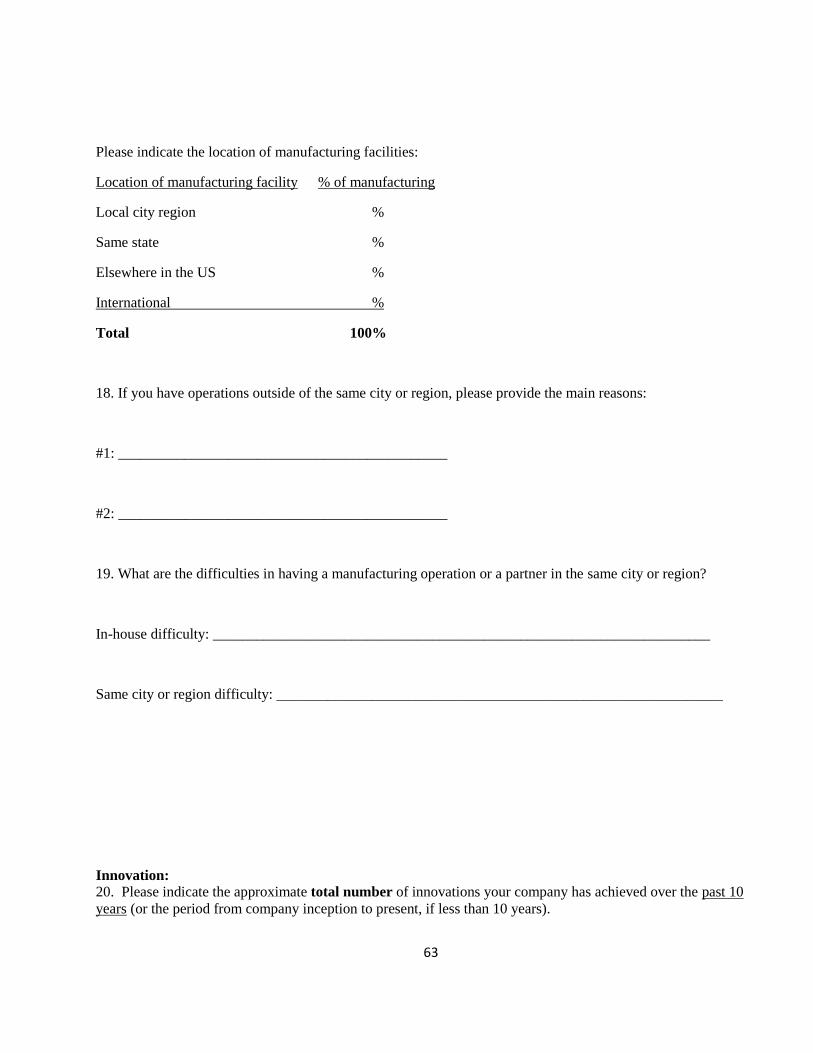
63
Please indicate the location of manufacturing facilities:
Location of manufacturing facility % of manufacturing
Local city region %
Same state %
Elsewhere in the US %
International %
Total 100%
18. If you have operations outside of the same city or region, please provide the main reasons:
#1: _____________________________________________
#2: _____________________________________________
19. What are the difficulties in having a manufacturing operation or a partner in the same city or region?
In-house difficulty: ____________________________________________________________________
Same city or region difficulty: _____________________________________________________________
Innovation:
20. Please indicate the approximate total number of innovations your company has achieved over the past 10
years (or the period from company inception to present, if less than 10 years).

64
New products _______ New processes _______ Domestic patent approvals _______
21. Please indicate the % of products in 3rd
stage clinical trial: ____%
22. Indicate the importance of the following strategies to your company (check one box per strategy from scale) 1=not important 2=minor importance 3=moderate importance 4=very important 5=critically important
1 2 3 4 5
a. Expand our research and development (R&D) effort ........
b. Develop new products on a continual basis ........................
c. Develop new processes on a continual basis .......................
d. Constantly improve our existing products ...........................
e. Obtain “early” technology from university researchers .......
f. Develop R&D alliances with: U.S. based universities ........
i. Foreign firms/universities
Pharmaceutical companies
ii. Other biotech companies .
iii. Other companies (eg, chemical)
g. Collaborate with established pharma or chemical companies to:
i. enhance credibility/reputation ................................
ii. attract investors .....................................................
iii. access research/market information ........................
iv. develop products and manufacture .........................
v. access marketing/distribution channels ..................
h. License out technology ........................................................
i. License in technology ..........................................................
j. Aggressively seek American investors ................................
k. Aggressively seek foreign investment for US facilities .......
l. Manufacture our own products ............................................
m. Incorporate user feedback in the innovation process ...........
n. Find new domestic clients ...................................................
o. Develop strategic alliances with foreign firms for
distribution in foreign markets ...........................................
p. Establish manufacturing facilities in foreign countries ........
q. Enter foreign markets before competitors move in ..............
THANK YOU FOR TAKING THE TIME TO COMPLETE THIS SURVEY
YOUR ASSISTANCE IS GREATLY APPRECIATED

65
A summary of this survey will be available in February 2008. The results will show overall trends only (no individuals or
firms will be identified). If you wish to receive a copy of the summary report, please attach your business card to this form or
complete the mailing address section below.
Can we call or e-mail you for clarification of a specific answer?
yes, call or e-mail yes, I would like a copy of the completed report