patents to products innovation, product creation …
TRANSCRIPT

PATENTS TO PRODUCTS:INNOVATION, PRODUCT CREATION,
AND FIRM GROWTH
David Argente Salome Baslandze Douglas Hanley Sara Moreira
Penn State EIEF & CEPR Pittsburgh Northwestern
7-8 November, 2019CEPR Macroeconomics and Growth Programme Meeting

PRODUCT INNOVATION
I Product innovation is a key mechanism through which innovation translates intoeconomic growth.
I Lack of systematic data on product introduction.
I Patents – the most widely-used proxy for innovation.
PRODUCT INNOVATION [THIS PAPER]
I Product innovation is a key mechanism through which innovation translates intoeconomic growth.
I Lack of systematic data on product introduction.Large-scale firm & product dataset covering consumer goods.
I Patents – the most widely-used proxy for innovation.[Q1] How do patents relate to the actual product innovation on the market?[Q2] How does product innovation and patenting vary by firm’s marketleadership?
PRODUCT INNOVATION AND PATENTS
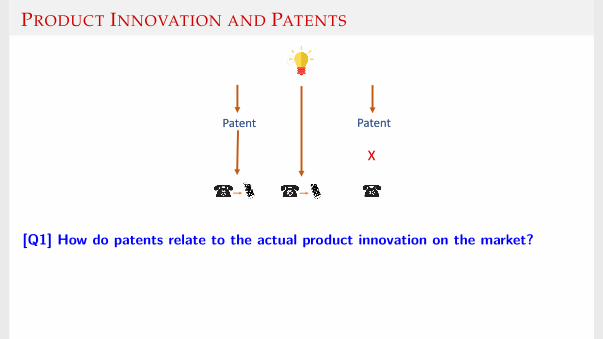
[Q1] How do patents relate to the actual product innovation on the market?
PRODUCT INNOVATION AND PATENTS
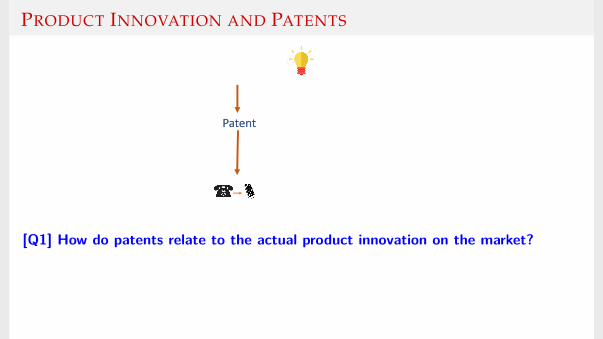
Patent
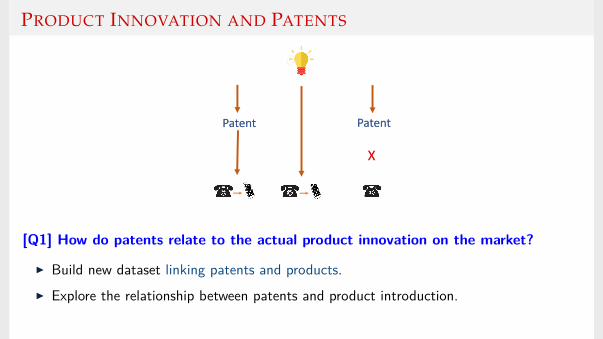
[Q1] How do patents relate to the actual product innovation on the market?
PRODUCT INNOVATION AND PATENTS
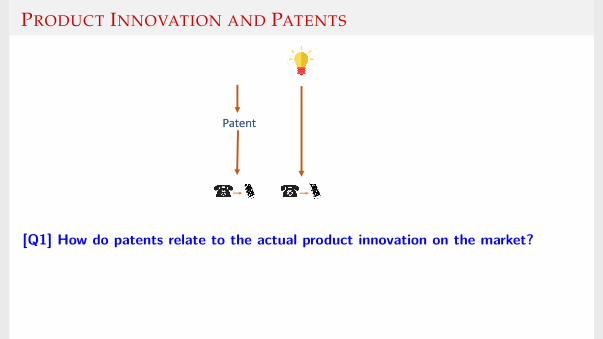
Patent
[Q1] How do patents relate to the actual product innovation on the market?
PRODUCT INNOVATION AND PATENTS
Patent Patent
X
[Q1] How do patents relate to the actual product innovation on the market?
PRODUCT INNOVATION AND PATENTS
Patent Patent
X
[Q1] How do patents relate to the actual product innovation on the market?
I Build new dataset linking patents and products.I Explore the relationship between patents and product introduction.
PRODUCT INNOVATION AND PATENTS: FIRM HETEROGENEITY
Patent Patent
X
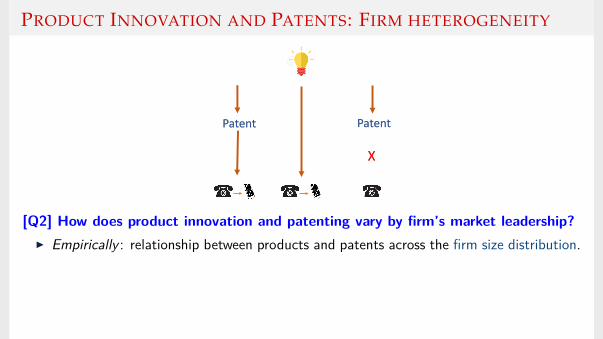
[Q2] How does product innovation and patenting vary by firm’s market leadership?I Empirically : relationship between products and patents across the firm size distribution.
[Q2] Why? Patents signal productive value (innovation on the market), but also ...patents are a protective tool to shield from competition.
I Theoretically : role of patents in deterring innovation by the followers.

PRODUCT INNOVATION AND PATENTS: FIRM HETEROGENEITY
Patent Patent
X
[Q2] How does product innovation and patenting vary by firm’s market leadership?I Empirically : relationship between products and patents across the firm size distribution.
[Q2] Why? Patents signal productive value (innovation on the market), but also ...patents are a protective tool to shield from competition.
I Theoretically : role of patents in deterring innovation by the followers.

OUTLINE
I. Data and Matching Algorithms
II. Patents-to-Products Relationship
III. The Role of Firm Heterogeneity
IV. Conceptual Framework and Patent Value
DATA AND MATCHING ALGORITHMS
Product Data
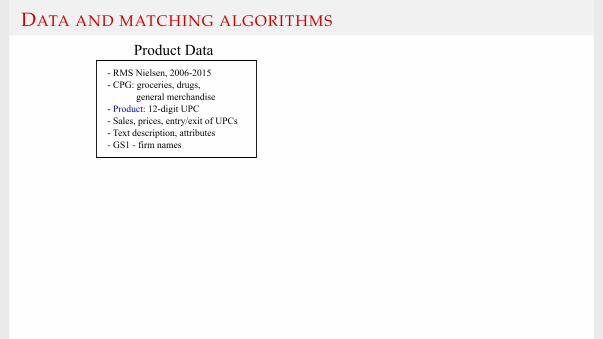
- RMS Nielsen, 2006-2015- CPG: groceries, drugs, general merchandise- Product: 12-digit UPC- Sales, prices, entry/exit of UPCs- Text description, attributes- GS1 - firm names
We classify products into distinct product categories:I Products – barcodes/UPC codesI Product category – a set of similar products (ex: lamps, detergents, shaving razors).
Products Product categories k-means clustering Newness Alternative Newness measures Newness Validation Examples

DATA AND MATCHING ALGORITHMS
Product Data
- RMS Nielsen, 2006-2015- CPG: groceries, drugs, general merchandise- Product: 12-digit UPC- Sales, prices, entry/exit of UPCs- Text description, attributes- GS1 - firm names
We classify products into distinct product categories:I Products – barcodes/UPC codesI Product category – a set of similar products (ex: lamps, detergents, shaving razors).
Products Product categories k-means clustering Newness Alternative Newness measures Newness Validation Examples
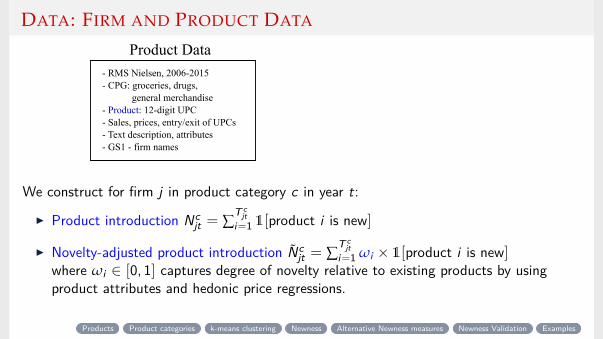
DATA: FIRM AND PRODUCT DATA
Product Data
- RMS Nielsen, 2006-2015- CPG: groceries, drugs, general merchandise- Product: 12-digit UPC- Sales, prices, entry/exit of UPCs- Text description, attributes- GS1 - firm names
We construct for firm j in product category c in year t:
I Product introduction Ncjt = ∑
T cjt
i=1 1[product i is new]
I Novelty-adjusted product introduction Ncjt = ∑
T cjt
i=1 ωi × 1[product i is new]where ωi ∈ [0, 1] captures degree of novelty relative to existing products by usingproduct attributes and hedonic price regressions.
Products Product categories k-means clustering Newness Alternative Newness measures Newness Validation Examples

DATA: PATENT DATA
Patent DataProduct Data
- RMS Nielsen, 2006-2015- CPG: groceries, drugs, general merchandise- Product: 12-digit UPC- Sales, prices, entry/exit of UPCs- Text description, attributes- GS1 - firm names
- USPTO, 1975-2017- Universe of granted patents & applications- Patent text, classification, citations, claims- Assignee data+Thompson M&A
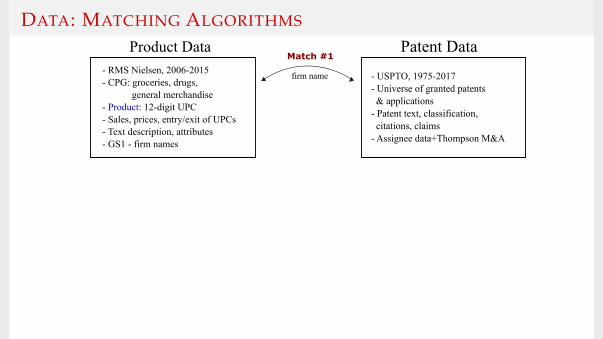
DATA: MATCHING ALGORITHMS
Patent Data
firm name
Match #1Product Data
- RMS Nielsen, 2006-2015- CPG: groceries, drugs, general merchandise- Product: 12-digit UPC- Sales, prices, entry/exit of UPCs- Text description, attributes- GS1 - firm names
- USPTO, 1975-2017- Universe of granted patents & applications- Patent text, classification, citations, claims- Assignee data+Thompson M&A
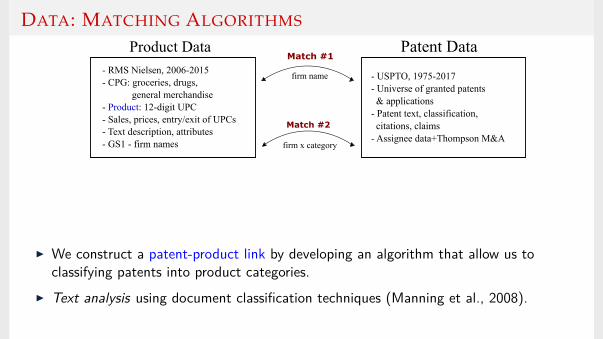
DATA: MATCHING ALGORITHMS
Patent Data
firm x category
firm name
Match #2
Match #1Product Data
- RMS Nielsen, 2006-2015- CPG: groceries, drugs, general merchandise- Product: 12-digit UPC- Sales, prices, entry/exit of UPCs- Text description, attributes- GS1 - firm names
- USPTO, 1975-2017- Universe of granted patents & applications- Patent text, classification, citations, claims- Assignee data+Thompson M&A
I We construct a patent-product link by developing an algorithm that allow us toclassifying patents into product categories.
I Text analysis using document classification techniques (Manning et al., 2008).

DATA: MATCHING ALGORITHMS
Step 1: Collect representative documents details
I Patents: title (x5), abstract (x1), patent classification description (x3),title cited patents (x1)
I Product Categories: title (x10), entire text (x1), and first 10% text (x10)of Wikipedia article(s)
Step 2: Built document vectors details
I Use both 1-grams and 2-grams as tokens, and apply lemmatizerI Exclude words that appear in > 80% of documents (“the”, “and”).I Weight by total-frequency-inverse-document-frequency (Aizawa, 2003)
Step 3: Built similarity score between patent and product categories details
I Use inner product of normalized vectors (cosine similarity) to obtain similarity metricI Define a patent-product category match – max-similarity product category (in top 5)
Validations

MATCH #1. EXAMPLE
Match1Firmxyear
§ 17,595newproducts § 6,812newpatent
applications
(2006–2015)Example

MATCH #2. EXAMPLE
(2006 – 2015)
Match 2firm name x category
P&G products split into categories
. . .Deodorants Detergents Cosmetics Shaving
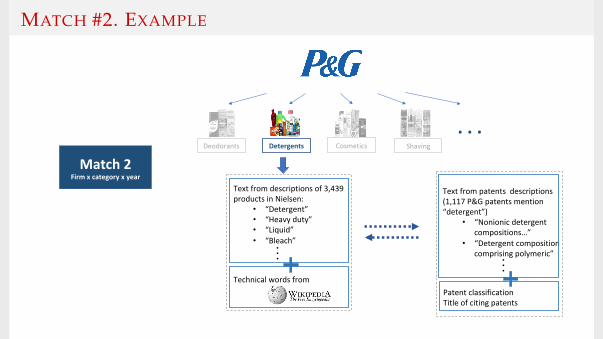
MATCH #2. EXAMPLE
Match2Firmxcategoryxyear
...Deodorants Detergents Cosmetics Shaving
...
Textfrompatentsdescriptions(1,117P&Gpatentsmention“detergent”)
• “Nonionicdetergentcompositions…”
• “Detergentcompositioncomprisingpolymeric”
...
Technicalwordsfrom
Textfromdescriptionsof3,439productsinNielsen:
• “Detergent”• “Heavyduty”• “Liquid”• “Bleach”
PatentclassificationTitleofcitingpatents

CONSUMER GOODS SECTOR: SIZE AND REPRESENTATIVENESS
I ProductI Data covers non-durable and semi-durable consumer products, corresponding to about
14% U.S. consumption of goods and 4.4% U.S. total consumptionI There are a total of 35K distinct firms manufacturing consumer productsI Dataset covers about about 40% total U.S. consumer goods sales, and covers close to the
universe of firms and product introduction in the sector
I PatentsI 9.4% of firms with consumer products have at least a patent between 2006-2015, which
compares with 6% manufacturing between 2001-2012 (Hall et al.2012).I There is a total of 5 million patents in the period 2001-2015, and about 15% of those
have as assignees firms with consumer products (6% is we required to be matched toconsumer products) Detailed table
I Examples:Firms: P&G (16,211), Kimberly Clark (5,500), Kraft (964), L’Oreal (6,030), Abbott Labs (3,941);Samsung (39,395), Toshiba Battery (8,962), Whirlpool (2,495), Basf (907), Nike (4,584).Patents: Kiinde pump Asthma inhaler P&G, TidePod Danone, obesity disorders Beyond Meat, Plant-based

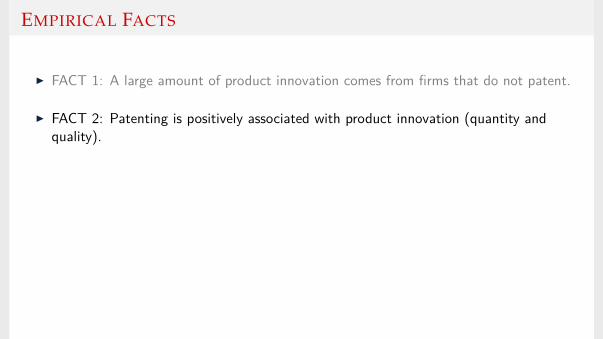
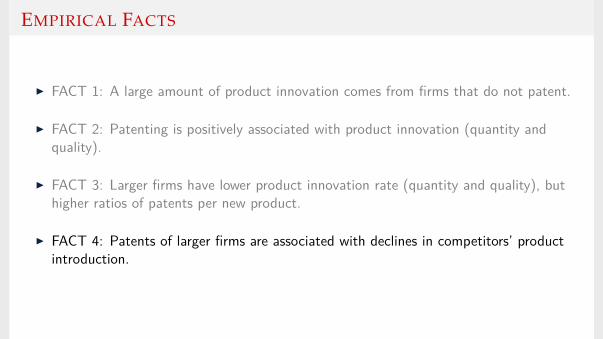
EMPIRICAL FACTS
I FACT 1: A large amount of product innovation comes from firms that do not patent.
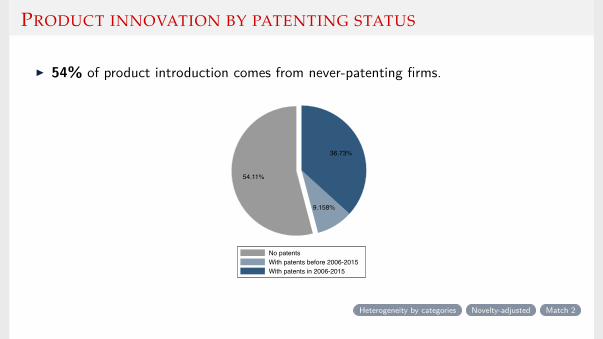
PRODUCT INNOVATION BY PATENTING STATUS
I 54% of product introduction comes from never-patenting firms.
54.11%
9.158%
36.73%
No patentsWith patents before 2006-2015With patents in 2006-2015
Heterogeneity by categories Novelty-adjusted Match 2
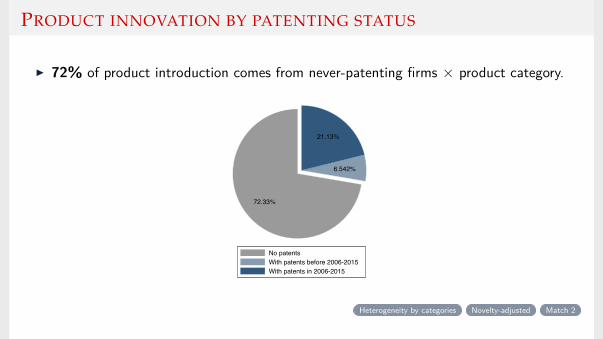
PRODUCT INNOVATION BY PATENTING STATUS
I 72% of product introduction comes from never-patenting firms × product category.
72.33%
6.542%
21.13%
No patentsWith patents before 2006-2015With patents in 2006-2015
Heterogeneity by categories Novelty-adjusted Match 2
EMPIRICAL FACTS
I FACT 1: A large amount of product innovation comes from firms that do not patent.
I FACT 2: Patenting is positively associated with product innovation (quantity andquality).

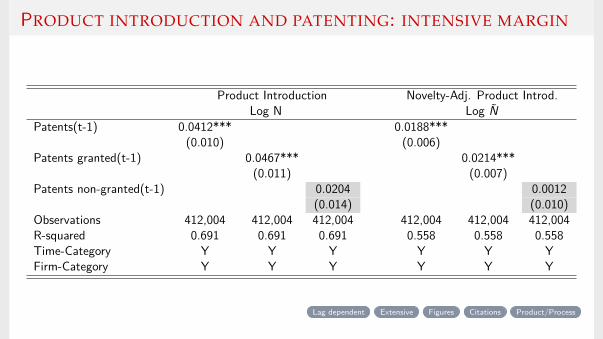
PRODUCT INTRODUCTION AND PATENTING: INTENSIVE MARGIN
Product Introduction Novelty-Adj. Product Introd.Log N Log N
Patents(t-1) 0.0412*** 0.0188***(0.010) (0.006)
Patents granted(t-1) 0.0467*** 0.0214***(0.011) (0.007)
Patents non-granted(t-1) 0.0204 0.0012(0.014) (0.010)
Observations 412,004 412,004 412,004 412,004 412,004 412,004R-squared 0.691 0.691 0.691 0.558 0.558 0.558Time-Category Y Y Y Y Y YFirm-Category Y Y Y Y Y Y
Lag dependent Extensive Figures Citations Product/Process

EMPIRICAL FACTS
I FACT 1: A large amount of product innovation comes from firms that do not patent.
I FACT 2: Patenting is positively associated with product innovation (quantity andquality).
I FACT 3: Larger firms have lower product innovation rate (quantity and quality), buthigher ratios of patents per new product.

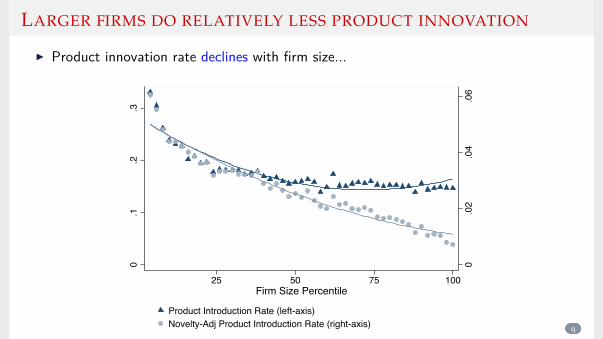
LARGER FIRMS DO RELATIVELY LESS PRODUCT INNOVATION
I Product innovation rate declines with firm size...
0.0
2.0
4.0
6
0.1
.2.3
25 50 75 100Firm Size Percentile
Product Introduction Rate (left-axis) q
LARGER FIRMS DO RELATIVELY LESS PRODUCT INNOVATION
I Product innovation rate declines with firm size...
0.0
2.0
4.0
6
0.1
.2.3
25 50 75 100Firm Size Percentile
Product Introduction Rate (left-axis) Novelty-Adj Product Introduction Rate (right-axis) q
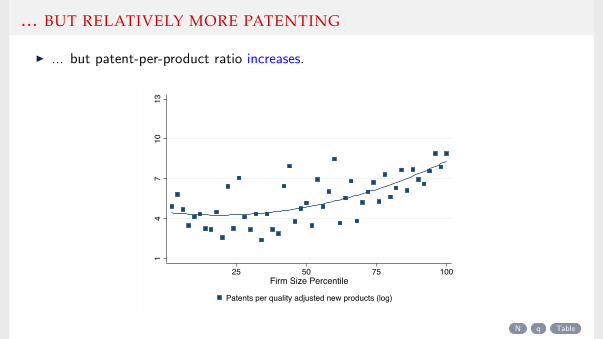
... BUT RELATIVELY MORE PATENTING
I ... but patent-per-product ratio increases.
14
710
13
25 50 75 100Firm Size Percentile
Patents per quality adjusted new products (log)
N q Table
EMPIRICAL FACTS
I FACT 1: A large amount of product innovation comes from firms that do not patent.
I FACT 2: Patenting is positively associated with product innovation (quantity andquality).
I FACT 3: Larger firms have lower product innovation rate (quantity and quality), buthigher ratios of patents per new product.
I FACT 4: Patents of larger firms are associated with declines in competitors’ productintroduction.
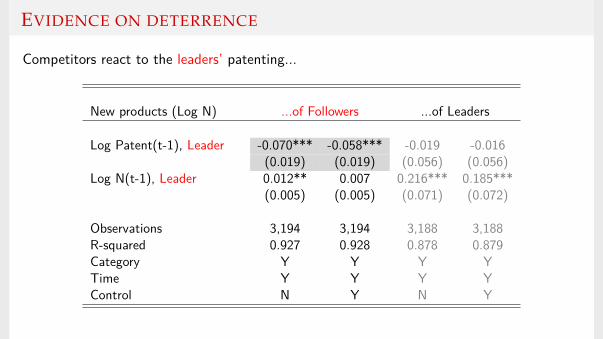
EVIDENCE ON DETERRENCE
Competitors react to the leaders’ patenting...
New products (Log N) ...of Followers ...of Leaders
Log Patent(t-1), Leaderxxx -0.070*** -0.058*** -0.019 -0.016(0.019) (0.019) (0.056) (0.056)
Log N(t-1), Leaderxxx 0.012** 0.007 0.216*** 0.185***(0.005) (0.005) (0.071) (0.072)
Observations 3,194 3,194 3,188 3,188R-squared 0.927 0.928 0.878 0.879Category Y Y Y YTime Y Y Y YControl N Y N Y
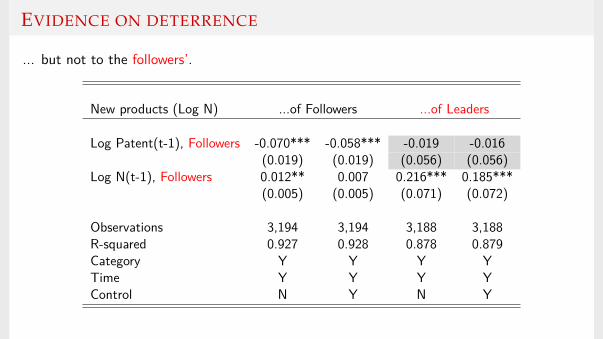
EVIDENCE ON DETERRENCE
... but not to the followers’.
New products (Log N) ...of Followers ...of Leaders
Log Patent(t-1), Followers -0.070*** -0.058*** -0.019 -0.016(0.019) (0.019) (0.056) (0.056)
Log N(t-1), Followers 0.012** 0.007 0.216*** 0.185***(0.005) (0.005) (0.071) (0.072)
Observations 3,194 3,194 3,188 3,188R-squared 0.927 0.928 0.878 0.879Category Y Y Y YTime Y Y Y YControl N Y N Y

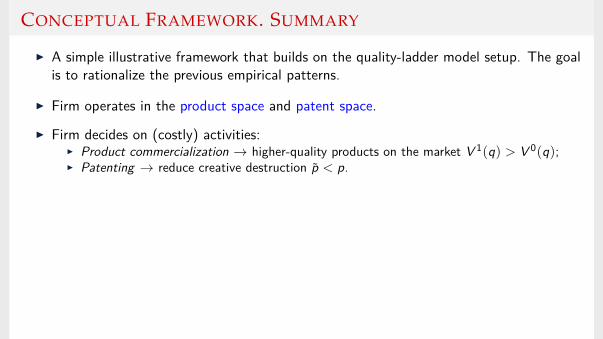
CONCEPTUAL FRAMEWORK. SUMMARY
I A simple illustrative framework that builds on the quality-ladder model setup. The goalis to rationalize the previous empirical patterns.
I Firm operates in the product space and patent space.
I Firm decides on (costly) activities:I Product commercialization → higher-quality products on the market V 1(q) > V 0(q);I Patenting → reduce creative destruction p < p.
I Implications:I Market leaders have lower incentives for product innovation (similar to the Arrow’s
replacement effect).
∆Product = V 1(q)− V 0(q) ↓ q
I Market leaders have higher incentives to engage in patenting – protect higher value.
∆Patent = V 1(q)[ 1
r + p −1
r + p
]↑ q
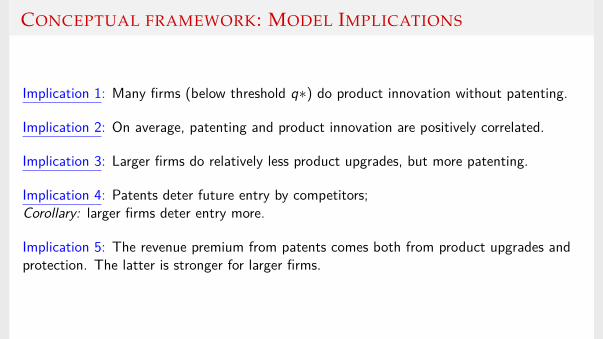
CONCEPTUAL FRAMEWORK: MODEL IMPLICATIONS
Implication 1: Many firms (below threshold q∗) do product innovation without patenting.
Implication 2: On average, patenting and product innovation are positively correlated.
Implication 3: Larger firms do relatively less product upgrades, but more patenting.
Implication 4: Patents deter future entry by competitors;Corollary: larger firms deter entry more.
Implication 5: The revenue premium from patents comes both from product upgrades andprotection. The latter is stronger for larger firms.
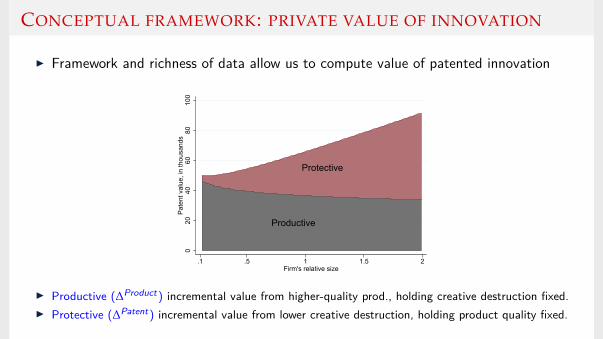
CONCEPTUAL FRAMEWORK: PRIVATE VALUE OF INNOVATION
I Framework and richness of data allow us to compute value of patented innovation
020
4060
8010
0P
aten
t val
ue, i
n th
ousa
nds
.1 .5 1 1.5 2Firm's relative size
Protective
Productive
I Productive (∆Product) incremental value from higher-quality prod., holding creative destruction fixed.I Protective (∆Patent) incremental value from lower creative destruction, holding product quality fixed.

CONCLUSION
I New dataset linking patents to products.
I Relationship between patenting and product introduction.
I Importance of firm heterogeneity : market leaders vs followers.
I Value of patented innovation and decomposition: productive vs protective.

Appendix

PRODUCT
I Products defined at the finest level of disaggregation: 12-digit UPC, barcode.I Changes in any attribute of a good (e.g. forms, sizes, package, formula) result in changes
in barcode.I Overall, 66% of new products enter the market with a new combination of observable
attributes (as covered by RMS).I Hence, allow us to identify any product innovation, small or large.
I More than 100 billion unique observations at the week × store × level.
I During the sample, total sales are worth approx $2 trillion.
I 40,000 stores covering 53% of sales in grocery stores, 55% in drug stores, 32% in massmerchandisers, 2% in convenience stores, and 1% in liquor stores.
Back
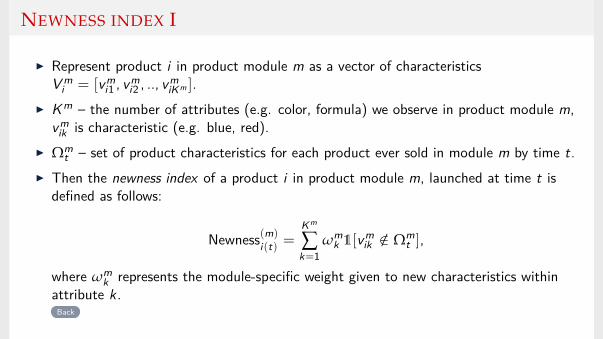
NEWNESS INDEX I
I Represent product i in product module m as a vector of characteristicsV m
i = [vmi1 , vm
i2 , .., vmiKm ].
I K m – the number of attributes (e.g. color, formula) we observe in product module m,vm
ik is characteristic (e.g. blue, red).I Ωm
t – set of product characteristics for each product ever sold in module m by time t.I Then the newness index of a product i in product module m, launched at time t is
defined as follows:
Newness(m)i(t) =
Km
∑k=1
ωmk 1[vm
ik /∈ Ωmt ],
where ωmk represents the module-specific weight given to new characteristics within
attribute k.Back
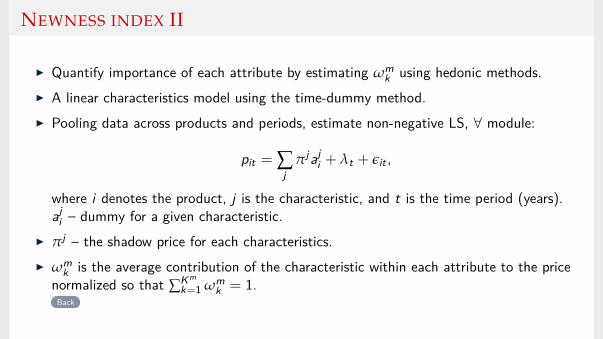
NEWNESS INDEX II
I Quantify importance of each attribute by estimating ωmk using hedonic methods.
I A linear characteristics model using the time-dummy method.I Pooling data across products and periods, estimate non-negative LS, ∀ module:
pit = ∑j
πjaji + λt + εit ,
where i denotes the product, j is the characteristic, and t is the time period (years).aj
i – dummy for a given characteristic.I πj – the shadow price for each characteristics.I ωm
k is the average contribution of the characteristic within each attribute to the pricenormalized so that ∑Km
k=1 ωmk = 1.
Back

NEWNESS INDEX III. PAIN REMEDIES - HEADACHE
I Brand (310 distinct): Tylenol, Excedrin, Advil, Aleve
I Flavor (35 distinct): regular, orange, grape, cherry
I Container (17 distinct): pack, bottle, box, case, tube
I Style (3 distinct): children, regular, ACM
I Form (47 distinct): caplet, capsule, tablet, gelcap, powder
I Generic (2 distinct): yes or no
I Formula (25 distinct): regular, extra strength, rapid release, extended release
I Type (74 distinct): aspirin, aspirin caffeine, ibuprofen, naproxen
I Consumer (30 distinct): trauma, migraine, menstrual, arthritis
I Size (89 distinct): caplet (100, 250, 500), tablet (24, 30, 36)
Back
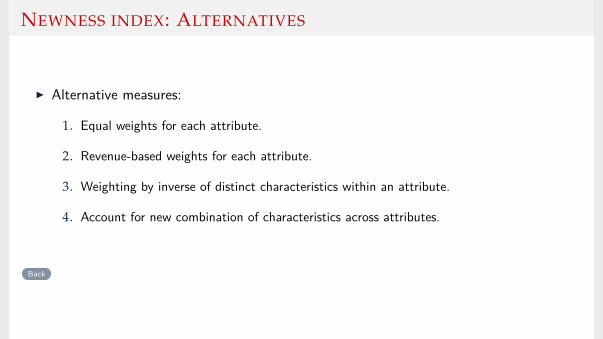
NEWNESS INDEX: ALTERNATIVES
I Alternative measures:
1. Equal weights for each attribute.
2. Revenue-based weights for each attribute.
3. Weighting by inverse of distinct characteristics within an attribute.
4. Account for new combination of characteristics across attributes.
Back
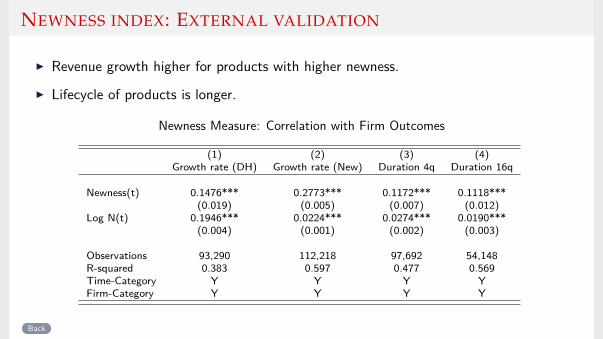
NEWNESS INDEX: EXTERNAL VALIDATION
I Revenue growth higher for products with higher newness.
I Lifecycle of products is longer.
Newness Measure: Correlation with Firm Outcomes
(1) (2) (3) (4)Growth rate (DH) Growth rate (New) Duration 4q Duration 16q
Newness(t) 0.1476*** 0.2773*** 0.1172*** 0.1118***(0.019) (0.005) (0.007) (0.012)
Log N(t) 0.1946*** 0.0224*** 0.0274*** 0.0190***(0.004) (0.001) (0.002) (0.003)
Observations 93,290 112,218 97,692 54,148R-squared 0.383 0.597 0.477 0.569Time-Category Y Y Y YFirm-Category Y Y Y Y
Back
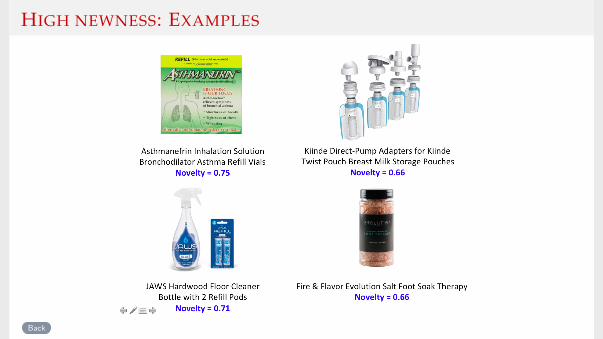
HIGH NEWNESS: EXAMPLES
Back
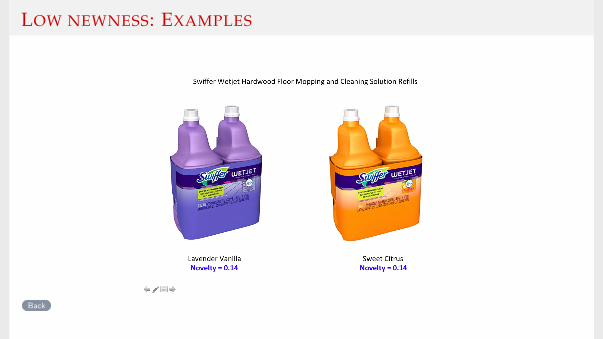
LOW NEWNESS: EXAMPLES
Back
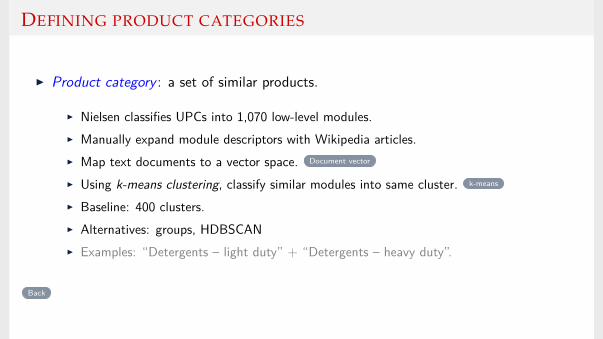
DEFINING PRODUCT CATEGORIES
I Product category : a set of similar products.
I Nielsen classifies UPCs into 1,070 low-level modules.I Manually expand module descriptors with Wikipedia articles.I Map text documents to a vector space. Document vector
I Using k-means clustering, classify similar modules into same cluster. k-means
I Baseline: 400 clusters.I Alternatives: groups, HDBSCANI Examples: “Detergents – light duty” + “Detergents – heavy duty”.
Back

K-MEANS CLUSTERING
I Each module’s text document → word frequency vector. Document vector
I Aggregate module vectors into clusters using k-means clustering.I Specify the desired number of clusters k beforehand.I Procedure yields partitioning that minimizes the within-cluster vector variance.I Letting x be a given module vector and set Si be cluster i , we choose our cluster sets
Si so as to minimizek
∑i=1
∑x∈Si
||x − µi ||2
where µi =1|Si | ∑x∈Si x .
Back
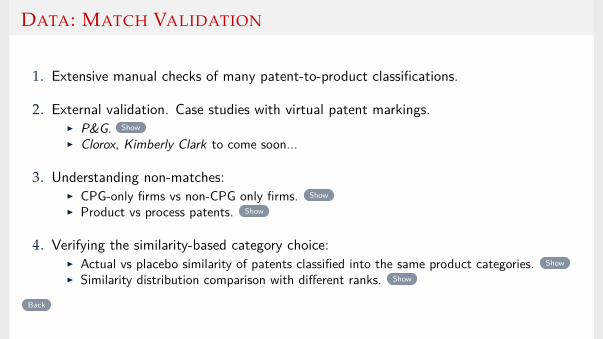
DATA: MATCH VALIDATION
1. Extensive manual checks of many patent-to-product classifications.
2. External validation. Case studies with virtual patent markings.I P&G. Show
I Clorox, Kimberly Clark to come soon...
3. Understanding non-matches:I CPG-only firms vs non-CPG only firms. Show
I Product vs process patents. Show
4. Verifying the similarity-based category choice:I Actual vs placebo similarity of patents classified into the same product categories. Show
I Similarity distribution comparison with different ranks. Show
Back

REPRESENTATIVE DOCUMENTS
I Construct representative documents on patent and product sides.I Patents:
I Text of patent application (or publication).I Title, abstract, patent claims, U.S. and International Patent Classification text.I Concatenate all of the available text.
I Product categories:I Set of module titles that belong to the category.I Set of Wikipedia articles manually assigned to product modules within a category.I Repeat the first 10% of each Wikipedia entry 10 times.I Vectorize each Wiki entry, then average these vectors together (preserving `2-norm).

DOCUMENT VECTOR
I Use 1-grams and 2-grams (phrases) as tokens.
I Exclude words that appear in > 80% of documents (“the”, “and”).
I Run each document through a lemmatizer.
I Convert each document to word (token) vectors with counts.
I Corpus of documents represented by a sparse matrix cij of counts, i ∈ 1, . . . , N isthe document and j ∈ 1, . . . , K the word.
I Use total-frequency-inverse-document-frequency (tf-idf) (using document frequenciesfrom the patent data)
wj = log(
N + 1dj + 1
)+ 1 where dj = |i ∈ N |cij > 0|
Back
SIMILARITY METRIC & PATENT-PRODUCT MATCH
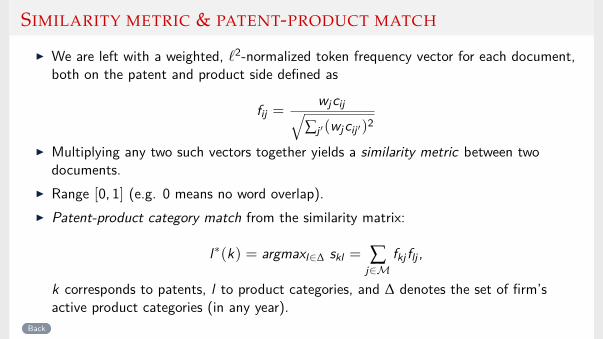
I We are left with a weighted, `2-normalized token frequency vector for each document,both on the patent and product side defined as
fij =wjcij√
∑j ′(wjcij ′)2
I Multiplying any two such vectors together yields a similarity metric between twodocuments.
I Range [0, 1] (e.g. 0 means no word overlap).I Patent-product category match from the similarity matrix:
l∗(k) = argmaxl∈∆ skl = ∑j∈M
fkj flj ,
k corresponds to patents, l to product categories, and ∆ denotes the set of firm’sactive product categories (in any year).
Back
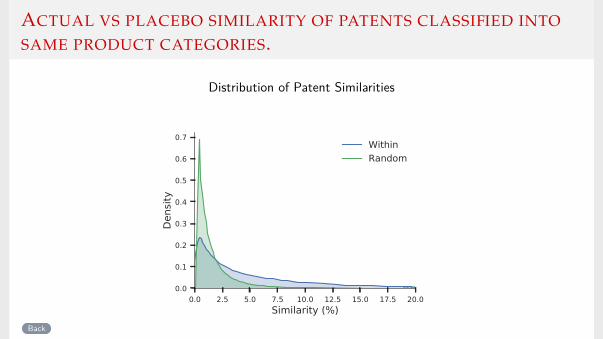
ACTUAL VS PLACEBO SIMILARITY OF PATENTS CLASSIFIED INTO
SAME PRODUCT CATEGORIES.
Distribution of Patent Similarities
0.0 2.5 5.0 7.5 10.0 12.5 15.0 17.5 20.0Similarity (%)
0.0
0.1
0.2
0.3
0.4
0.5
0.6
0.7
Dens
ity
WithinRandom
Back

P&G CASE STUDY WITH EXTERNAL INFORMATION ON PATENT
MARKINGS I
Distribution of Patent Similarities
1 2 3 4 5 >5
Similarity Ranking
0
25
50
75
100
125
150
175
Num
ber o
f Pat
ents
Back

P&G CASE STUDY WITH EXTERNAL INFORMATION ON PATENT
MARKINGS II
Distribution of Patent Similarities
0 20 40 60Similarity (%)
0.00
0.01
0.02
0.03
0.04
0.05CorrectIncorrect
Back
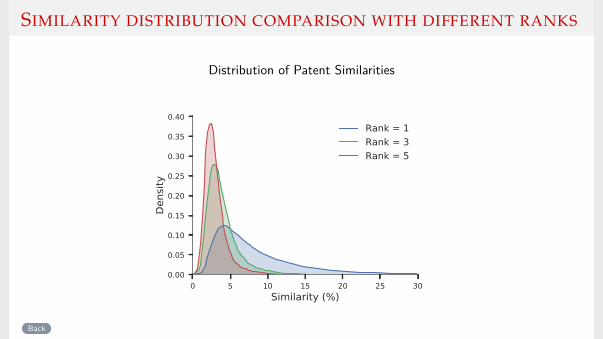
SIMILARITY DISTRIBUTION COMPARISON WITH DIFFERENT RANKS
Distribution of Patent Similarities
0 5 10 15 20 25 30Similarity (%)
0.00
0.05
0.10
0.15
0.20
0.25
0.30
0.35
0.40
Dens
ity
Rank = 1Rank = 3Rank = 5
Back
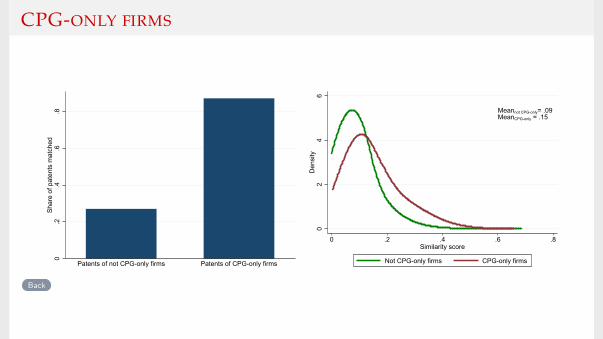
CPG-ONLY FIRMS
0.2
.4.6
.8S
hare
of p
aten
ts m
atch
ed
Patents of not CPG-only firms Patents of CPG-only firms
Meannot CPG-only= .09MeanCPG-only = .15
02
46
Den
sity
0 .2 .4 .6 .8Similarity score
Not CPG-only firms CPG-only firms
Back
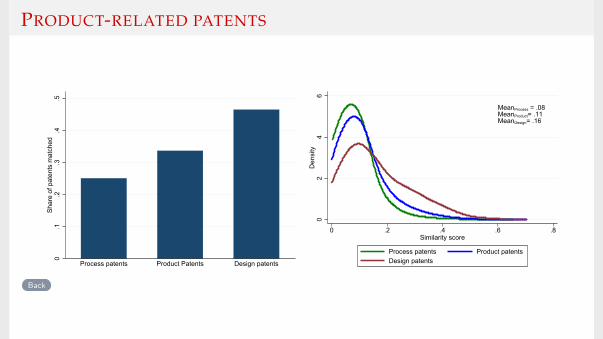
PRODUCT-RELATED PATENTS
0.1
.2.3
.4.5
Sha
re o
f pat
ents
mat
ched
Process patents Product Patents Design patents
MeanProcess = .08MeanProduct= .11MeanDesign= .16
02
46
Den
sity
0 .2 .4 .6 .8Similarity score
Process patents Product patentsDesign patents
Back
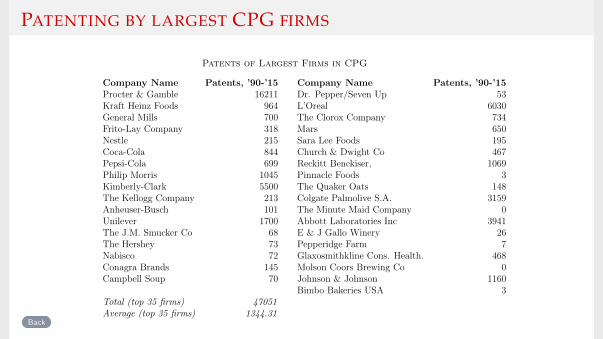
PATENTING BY LARGEST CPG FIRMS
Patents of Largest Firms in CPG
Company Name Patents, ’90-’15 Company Name Patents, ’90-’15Procter & Gamble 16211 Dr. Pepper/Seven Up 53Kraft Heinz Foods 964 L’Oreal 6030General Mills 700 The Clorox Company 734Frito-Lay Company 318 Mars 650Nestle 215 Sara Lee Foods 195Coca-Cola 844 Church & Dwight Co 467Pepsi-Cola 699 Reckitt Benckiser, 1069Philip Morris 1045 Pinnacle Foods 3Kimberly-Clark 5500 The Quaker Oats 148The Kellogg Company 213 Colgate Palmolive S.A. 3159Anheuser-Busch 101 The Minute Maid Company 0Unilever 1700 Abbott Laboratories Inc 3941The J.M. Smucker Co 68 E & J Gallo Winery 26The Hershey 73 Pepperidge Farm 7Nabisco 72 Glaxosmithkline Cons. Health. 468Conagra Brands 145 Molson Coors Brewing Co 0Campbell Soup 70 Johnson & Johnson 1160
Bimbo Bakeries USA 3Total (top 35 firms) 47051Average (top 35 firms) 1344.31
1
Back
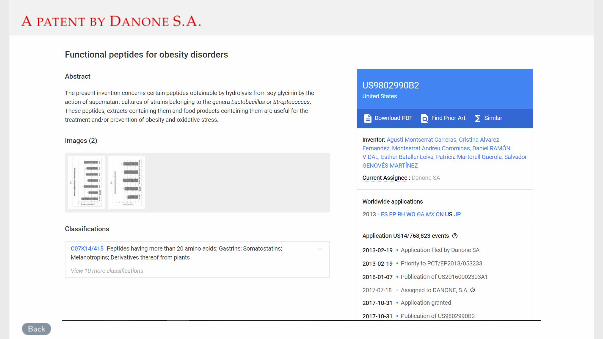
A PATENT BY DANONE S.A.
Back
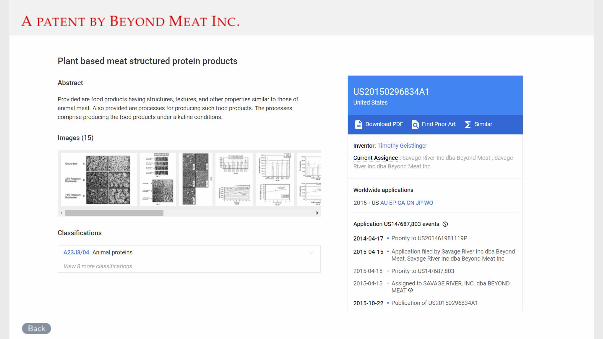
A PATENT BY BEYOND MEAT INC.
Back

A PATENT BY DRISCOLL INC.
Back
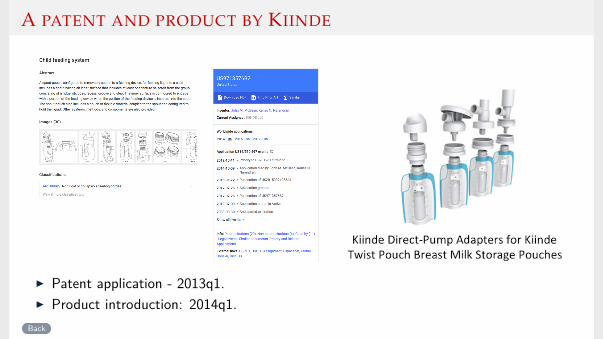
A PATENT AND PRODUCT BY KIINDE
I Patent application - 2013q1.I Product introduction: 2014q1.
Back

A PATENT AND A PRODUCT BY NEPHRON PHARMA
I Patent application: 2012q2.I Product introduction: 2012q4.
Back
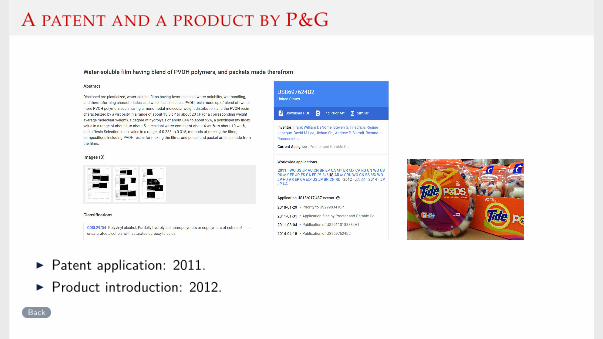
A PATENT AND A PRODUCT BY P&G
I Patent application: 2011.I Product introduction: 2012.
Back
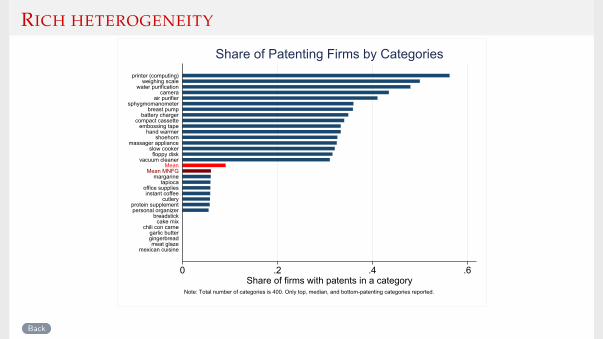
RICH HETEROGENEITY
0 .2 .4 .6Share of firms with patents in a category
mexican cuisinemeat glaze
gingerbreadgarlic butter
chili con carnecake mix
breadstickpersonal organizerprotein supplement
cutleryinstant coffee
office suppliestapioca
margarineMean MNFG
Meanvacuum cleaner
floppy diskslow cooker
massager applianceshoehorn
hand warmerembossing tape
compact cassettebattery charger
breast pumpsphygmomanometer
air purifiercamera
water purificationweighing scale
printer (computing)
Note: Total number of categories is 400. Only top, median, and bottom-patenting categories reported.
Share of Patenting Firms by Categories
Back
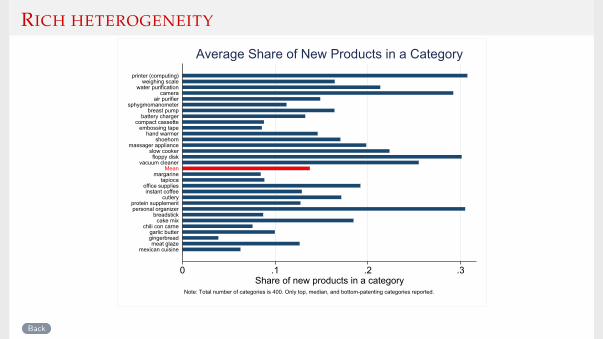
RICH HETEROGENEITY
0 .1 .2 .3Share of new products in a category
mexican cuisinemeat glaze
gingerbreadgarlic butter
chili con carnecake mix
breadstickpersonal organizerprotein supplement
cutleryinstant coffee
office suppliestapioca
margarineMean
vacuum cleanerfloppy disk
slow cookermassager appliance
shoehornhand warmer
embossing tapecompact cassette
battery chargerbreast pump
sphygmomanometerair purifier
camerawater purification
weighing scaleprinter (computing)
Note: Total number of categories is 400. Only top, median, and bottom-patenting categories reported.
Average Share of New Products in a Category
Back
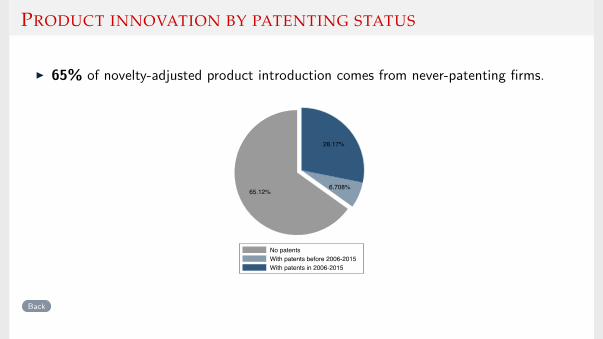
PRODUCT INNOVATION BY PATENTING STATUS
I 65% of novelty-adjusted product introduction comes from never-patenting firms.
65.12%6.708%
28.17%
No patentsWith patents before 2006-2015With patents in 2006-2015
Back
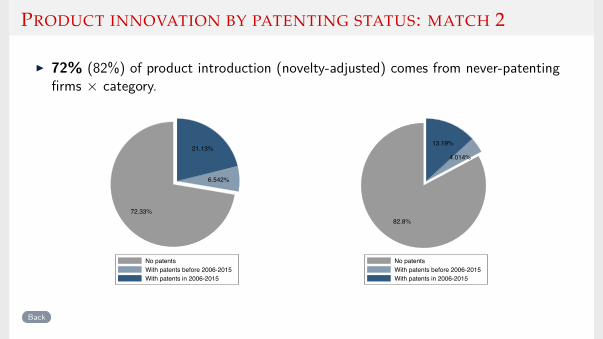
PRODUCT INNOVATION BY PATENTING STATUS: MATCH 2
I 72% (82%) of product introduction (novelty-adjusted) comes from never-patentingfirms × category.
72.33%
6.542%
21.13%
No patentsWith patents before 2006-2015With patents in 2006-2015
82.8%
4.014%
13.19%
No patentsWith patents before 2006-2015With patents in 2006-2015
Back

PATENTING INTENSITY BY PRODUCT GROUPS: MATCH 1
Share of innovations coming from 2006-2015 patenting firms
0 .2 .4 .6 .8Share of products coming from patenting firms
CheeseBread and baked goods
Fresh produceBooks and magazines
FlourIce
WineDisposable diapers
Jams, jellies, spreadsCondiments, gravies, and sauces
Snacks, spreads, dips-dairyBeer
Prepared food-dry mixesNuts
PastaMean
Baking suppliesStationery, school supplies
Wrapping materials and bagsPhotographic supplies
Fresheners and deodorizersDetergents
Insecticds/pesticds/rodenticdsSoft goods
Floral, gardeningPet food
Household suppliesBaby needs
CookwarePet care
Shoe careSanitary protection
Grooming aidsLaundry supplies
Batteries and flashlightsToys & sporting goods
Canning, freezing suppliesBaby food
Housewares, appliancesHardware, tools
Deodorant
Note: Total number of groups is 117. Only top and bottom reported.
Back

PATENTING INTENSITY BY PRODUCT GROUPS: MATCH 2
0 .2 .4 .6 .8 1Share of new products by patenting firms
alfalfaback pain
bitterscobbler (food)
date palmdiarrhea
hushpuppylist of asian cuisines
mothslug
pc gamedisinfectant
carpet cleaningacne
hampermanicure
trading cardfecal occult blood
blenderyeast
clothes ironcan opener
tamponbattery charger
bleachfabric softener
condomshoehorn
musical instrumentlaundry detergent
mascarahair coloring
litter boxbaby food
lamptalc
deodoranttoothpaste
weighing scalemassager appliance
Note: Total number of categories is 400. Only top and bottom reported.
Share of New Products by Patenting Firms by Categories
Back

COMPARISON OF CPG AND NON-CPG PATENTS
1990-2015 Match1 Match2 AllTotal applications 1,000,707 280,860 6,058,569Granted patents (%) 80 80 79Product patents (%) 65 71 68Utility patents (%) 72 67 72Cites mean 7 6.7 6.9Cites median 2 2 2Time to grant (med) 2 2 2Licensing (%) .59 1.7 .7Litigation (%) 6.1 7.9 4.4
Back

SUMMARY STATISTICS BY PATENTING STATUS
(1) (2) (3)No Patents Patents before ’06 Patents in ’06-’15
Rev. all products 3708.75 12275.72 27598.79Rev. new products 243.27 988.62 1670.12Rev. new products, post entry period 386.62 2064.76 3955.06Num. products 16.11 35.09 74.09Num. new products 2.60 6.73 12.91Product entry rate 0.19 0.17 0.22Num. product categories 2.36 3.11 4.11Share new products lasting more than 4 qtrs. 0.74 0.70 0.75Share new products lasting more than 16 qtrs. 0.44 0.40 0.42Average newness new products 0.13 0.09 0.10Newness-weighted num. new products 0.57 0.70 1.07Num. patent applications 0.00 0.00 6.14Num. granted patent applications 0.00 0.00 4.47Num. citations-weighted patent applications 0.00 0.00 8.87Stock patent applications until year t 0.00 10.88 125.93Stock granted patent applications until year t 0.00 10.59 115.39Num. of diff. technology classes (IPC3) on patents . . 5.56NumFirms 29373 1879 3284Observations 188118 15285 29030
Back
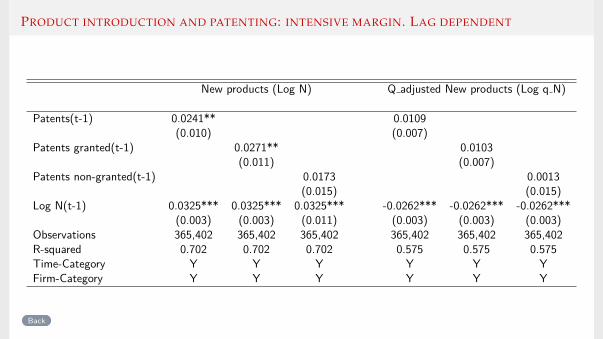
PRODUCT INTRODUCTION AND PATENTING: INTENSIVE MARGIN. LAG DEPENDENT
New products (Log N) Q adjusted New products (Log q N)
Patents(t-1) 0.0241** 0.0109(0.010) (0.007)
Patents granted(t-1) 0.0271** 0.0103(0.011) (0.007)
Patents non-granted(t-1) 0.0173 0.0013(0.015) (0.015)
Log N(t-1) 0.0325*** 0.0325*** 0.0325*** -0.0262*** -0.0262*** -0.0262***(0.003) (0.003) (0.011) (0.003) (0.003) (0.003)
Observations 365,402 365,402 365,402 365,402 365,402 365,402R-squared 0.702 0.702 0.702 0.575 0.575 0.575Time-Category Y Y Y Y Y YFirm-Category Y Y Y Y Y Y
Back
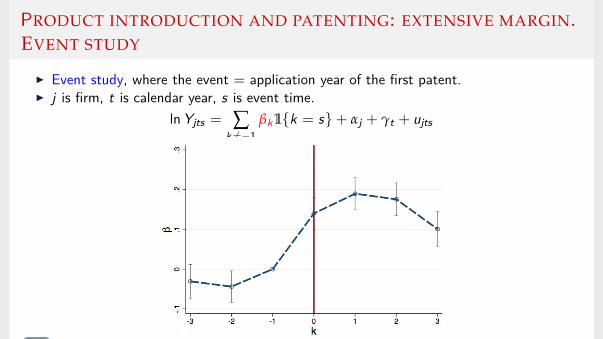
PRODUCT INTRODUCTION AND PATENTING: EXTENSIVE MARGIN.EVENT STUDY
I Event study, where the event = application year of the first patent.I j is firm, t is calendar year, s is event time.
ln Yjts = ∑k 6=−1
βk1k = s+ αj + γt + ujts
Back
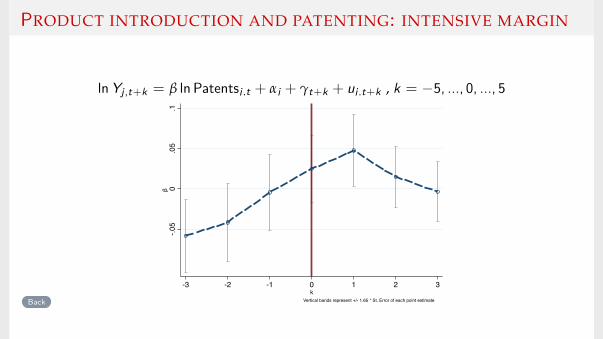
PRODUCT INTRODUCTION AND PATENTING: INTENSIVE MARGIN
ln Yj,t+k = β ln Patentsj,t + αj + γt+k + uj,t+k , k = −5, ..., 0, ..., 5
-.05
0.0
5.1
β
-3 -2 -1 0 1 2 3k
Vertical bands represent +/- 1.65 * St. Error of each point estimateBack

PRODUCT INTRODUCTION AND PATENTING: INTENSIVE MARGIN. CITATIONS & CLAIMS
New products (Log N) Q adjusted New products (Log q N)
Patents(t-1) 0.0412*** 0.0188***(0.010) (0.006)
Patent cites(t-1) 0.026*** 0.014***(0.007) (0.004)
Patent claims(t-1) 0.0012*** 0.006**(0.004) (0.003)
Observations 412,004 412,004 411,889 412,004 412,004 411,889R-squared 0.691 0.691 0.691 0.558 0.558 0.558Time-Category Y Y Y Y Y YFirm-Category Y Y Y Y Y Y
Back
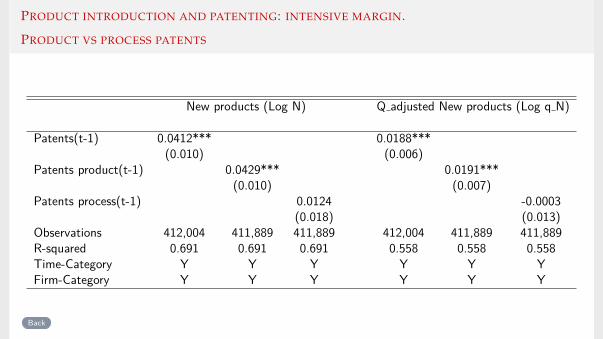
PRODUCT INTRODUCTION AND PATENTING: INTENSIVE MARGIN.
PRODUCT VS PROCESS PATENTS
New products (Log N) Q adjusted New products (Log q N)
Patents(t-1) 0.0412*** 0.0188***(0.010) (0.006)
Patents product(t-1) 0.0429*** 0.0191***(0.010) (0.007)
Patents process(t-1) 0.0124 -0.0003(0.018) (0.013)
Observations 412,004 411,889 411,889 412,004 411,889 411,889R-squared 0.691 0.691 0.691 0.558 0.558 0.558Time-Category Y Y Y Y Y YFirm-Category Y Y Y Y Y Y
Back
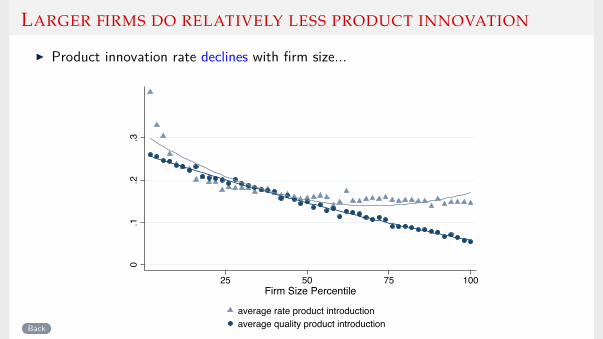
LARGER FIRMS DO RELATIVELY LESS PRODUCT INNOVATION
I Product innovation rate declines with firm size...
0.1
.2.3
25 50 75 100Firm Size Percentile
average rate product introductionaverage quality product introductionBack

... BUT RELATIVELY MORE PATENTING
I ... but patent-per-product ratio increases.
-7.5
-5-2
.50
2.5
10 20 30 40 50Size Bin (ascending)
Patents per new products (log)

... BUT RELATIVELY MORE PATENTING
I ... but patent-per-product ratio increases.
-5-2
.50
2.5
5
10 20 30 40 50Size Bin (ascending)
Patents per average quality (log)
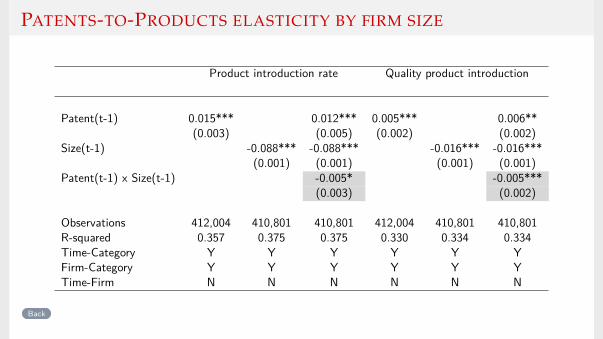
PATENTS-TO-PRODUCTS ELASTICITY BY FIRM SIZE
Product introduction rate Quality product introduction
Patent(t-1) 0.015*** 0.012*** 0.005*** 0.006**(0.003) (0.005) (0.002) (0.002)
Size(t-1) -0.088*** -0.088*** -0.016*** -0.016***(0.001) (0.001) (0.001) (0.001)
Patent(t-1) x Size(t-1) -0.005* -0.005***(0.003) (0.002)
Observations 412,004 410,801 410,801 412,004 410,801 410,801R-squared 0.357 0.375 0.375 0.330 0.334 0.334Time-Category Y Y Y Y Y YFirm-Category Y Y Y Y Y YTime-Firm N N N N N N
Back

PATENTS-TO-PRODUCTS ELASTICITY BY FIRM SIZE
Product introduction rate Quality product introduction
Patent(t-1) 0.015*** 0.012*** 0.002 0.012**(0.003) (0.005) (0.003) (0.006)
Size(t-1) -0.088*** -0.088*** -0.031*** -0.030***(0.001) (0.001) (0.002) (0.002)
Patent(t-1) x Size(t-1) -0.005* -0.008**(0.003) (0.003)
Observations 412,004 410,801 410,801 93,912 93,290 93,290R-squared 0.357 0.375 0.375 0.510 0.513 0.513Time-Category Y Y Y Y Y YFirm-Category Y Y Y Y Y YTime-Firm N N N N N N
Back
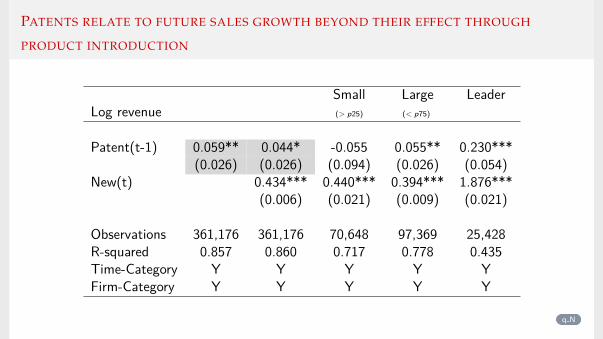
PATENTS RELATE TO FUTURE SALES GROWTH BEYOND THEIR EFFECT THROUGH
PRODUCT INTRODUCTION
Small Large LeaderLog revenue (> p25) (< p75)
Patent(t-1) 0.059** 0.044* -0.055 0.055** 0.230***(0.026) (0.026) (0.094) (0.026) (0.054)
New(t) 0.434*** 0.440*** 0.394*** 1.876***(0.006) (0.021) (0.009) (0.021)
Observations 361,176 361,176 70,648 97,369 25,428R-squared 0.857 0.860 0.717 0.778 0.435Time-Category Y Y Y Y YFirm-Category Y Y Y Y Y
q N

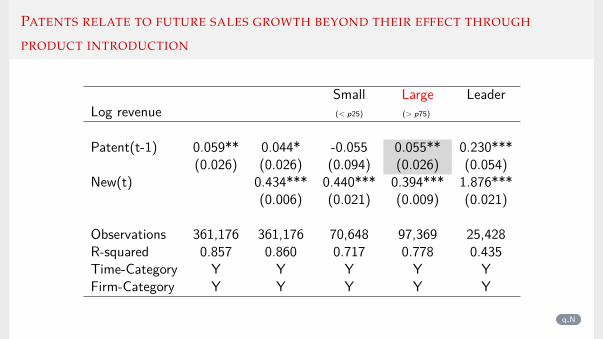
PATENTS RELATE TO FUTURE SALES GROWTH BEYOND THEIR EFFECT THROUGH
PRODUCT INTRODUCTION
Small Large LeaderLog revenue (< p25) (> p75)
Patent(t-1) 0.059** 0.044* -0.055 0.055** 0.230***(0.026) (0.026) (0.094) (0.026) (0.054)
New(t) 0.434*** 0.440*** 0.394*** 1.876***(0.006) (0.021) (0.009) (0.021)
Observations 361,176 361,176 70,648 97,369 25,428R-squared 0.857 0.860 0.717 0.778 0.435Time-Category Y Y Y Y YFirm-Category Y Y Y Y Y
q N
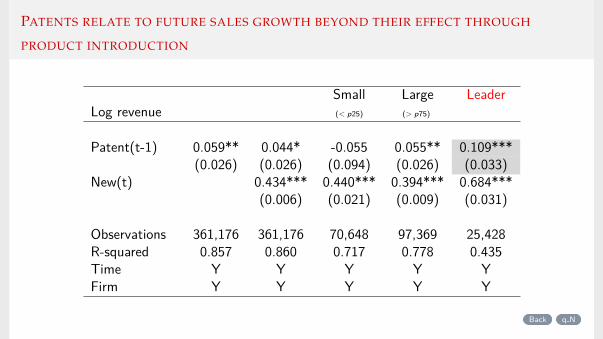
PATENTS RELATE TO FUTURE SALES GROWTH BEYOND THEIR EFFECT THROUGH
PRODUCT INTRODUCTION
Small Large LeaderLog revenue (< p25) (> p75)
Patent(t-1) 0.059** 0.044* -0.055 0.055** 0.109***(0.026) (0.026) (0.094) (0.026) (0.033)
New(t) 0.434*** 0.440*** 0.394*** 0.684***(0.006) (0.021) (0.009) (0.031)
Observations 361,176 361,176 70,648 97,369 25,428R-squared 0.857 0.860 0.717 0.778 0.435Time-Category Y Y Y Y YFirm-Category Y Y Y Y Y
Back q N
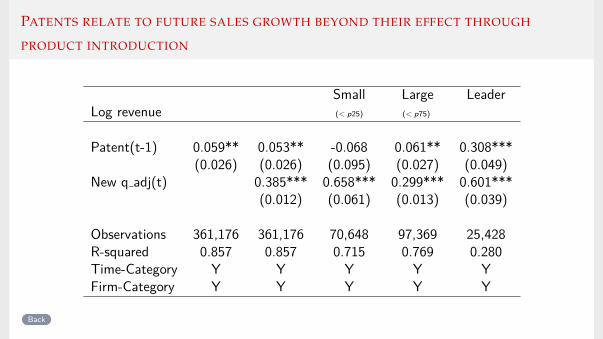
PATENTS RELATE TO FUTURE SALES GROWTH BEYOND THEIR EFFECT THROUGH
PRODUCT INTRODUCTION
Small Large LeaderLog revenue (< p25) (< p75)
Patent(t-1) 0.059** 0.053** -0.068 0.061** 0.308***(0.026) (0.026) (0.095) (0.027) (0.049)
New q adj(t) 0.385*** 0.658*** 0.299*** 0.601***(0.012) (0.061) (0.013) (0.039)
Observations 361,176 361,176 70,648 97,369 25,428R-squared 0.857 0.857 0.715 0.769 0.280Time-Category Y Y Y Y YFirm-Category Y Y Y Y Y
Back
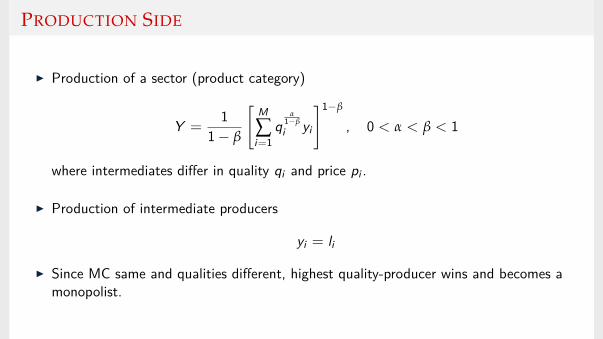
PRODUCTION SIDE
I Production of a sector (product category)
Y =1
1− β
[M
∑i=1
qα
1−β
i yi
]1−β
, 0 < α < β < 1
where intermediates differ in quality qi and price pi .
I Production of intermediate producers
yi = li
I Since MC same and qualities different, highest quality-producer wins and becomes amonopolist.
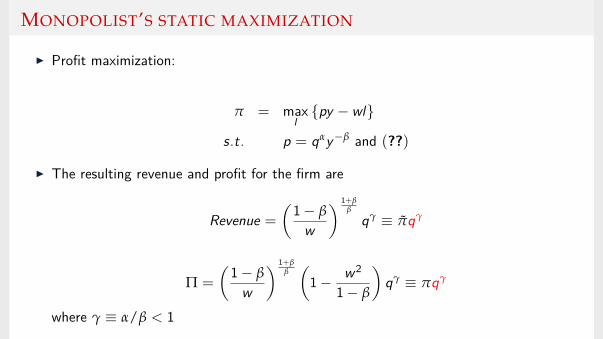
MONOPOLIST’S STATIC MAXIMIZATION
I Profit maximization:
π = maxlpy − wl
s.t. p = qαy−β and (??)
I The resulting revenue and profit for the firm are
Revenue =
(1− β
w
) 1+ββ
qγ ≡ πqγ
Π =
(1− β
w
) 1+ββ(
1− w2
1− β
)qγ ≡ πqγ
where γ ≡ α/β < 1
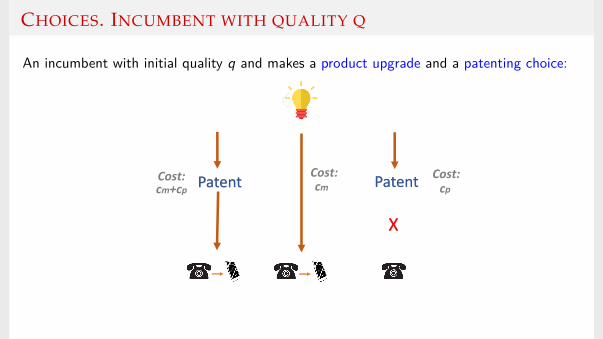
CHOICES. INCUMBENT WITH QUALITY Q
An incumbent with initial quality q and makes a product upgrade and a patenting choice:
Patent Patent
X
Cost: cp
Cost: cm
Cost: cm+cp

CHOICES. INCUMBENT WITH QUALITY Q
I If product upgrade → increase profitsI q ↑ q + λ in product space.
I If patent → increase protectionI ∀t entrant arrives at (exog) rate p with an innovation of size λe∼U(0, 1).
I If incumbent does not have a patent, it is replaced with probability p.
I Patent creates ε wall of protection, such that:I for an entrant to replace
q + λe︸ ︷︷ ︸Entrant’s quality height
> q + ε︸ ︷︷ ︸Incumbent’s patent height
Hence, the probability of creative destruction is p = (1− ε)p < p.
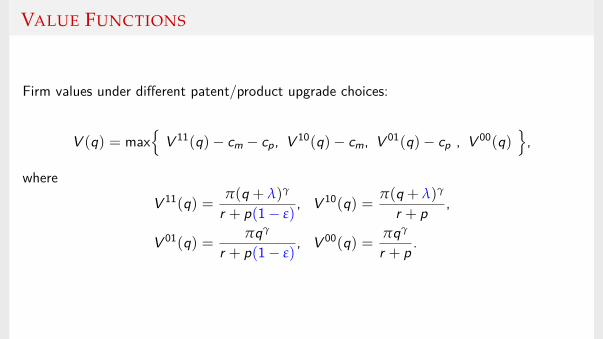
VALUE FUNCTIONS
Firm values under different patent/product upgrade choices:
V (q) = max
V 11(q)− cm − cp, V 10(q)− cm, V 01(q)− cp , V 00(q)
,
where
V 11(q) = π(q + λ)γ
r + p(1− ε), V 10(q) = π(q + λ)γ
r + p ,
V 01(q) = πqγ
r + p(1− ε), V 00(q) = πqγ
r + p .
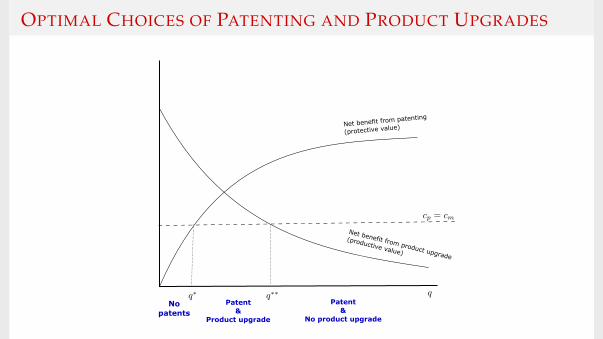
OPTIMAL CHOICES OF PATENTING AND PRODUCT UPGRADES
Net benefit from patenting
(protective value)
Net benefit from product upgrade
(productive value)
Nopatents
Patent&
Product upgrade
Patent&
No product upgrade
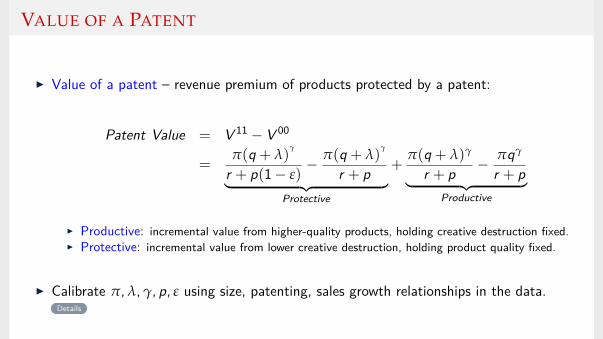
VALUE OF A PATENT
I Value of a patent – revenue premium of products protected by a patent:
Patent Value = V 11 − V 00
=π(q + λ)
γ
r + p(1− ε)− π(q + λ)
γ
r + p︸ ︷︷ ︸Protective
+π(q + λ)γ
r + p − πqγ
r + p︸ ︷︷ ︸Productive
I Productive: incremental value from higher-quality products, holding creative destruction fixed.I Protective: incremental value from lower creative destruction, holding product quality fixed.
I Calibrate π, λ, γ, p, ε using size, patenting, sales growth relationships in the data.Details
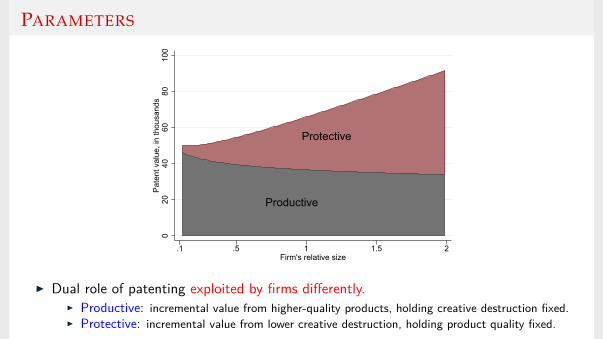
PARAMETERS
020
4060
8010
0P
aten
t val
ue, i
n th
ousa
nds
.1 .5 1 1.5 2Firm's relative size
Protective
Productive
I Dual role of patenting exploited by firms differently.I Productive: incremental value from higher-quality products, holding creative destruction fixed.I Protective: incremental value from lower creative destruction, holding product quality fixed.
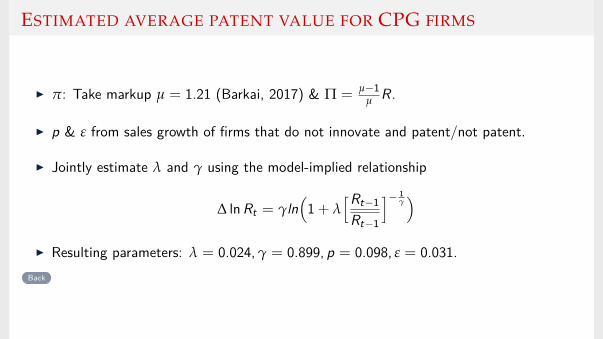
ESTIMATED AVERAGE PATENT VALUE FOR CPG FIRMS
I π: Take markup µ = 1.21 (Barkai, 2017) & Π = µ−1µ R.
I p & ε from sales growth of firms that do not innovate and patent/not patent.
I Jointly estimate λ and γ using the model-implied relationship
∆ ln Rt = γln(
1 + λ[Rt−1
Rt−1
]− 1γ)
I Resulting parameters: λ = 0.024, γ = 0.899, p = 0.098, ε = 0.031.Back