early warning system and currency ... warning system and currency volatility management in emerging...
TRANSCRIPT

129Early Warning System and Currency Volatility Management in Emerging Market
EARLY WARNING SYSTEM AND CURRENCY VOLATILITY MANAGEMENT IN EMERGING MARKET
Natasia Engeline S1
Salomo Posmauli Matondang2
This paper adopts theoretical models from Candelon, Dumitrescu, and Hurlin and empirical model
from Commerzbank to devise a set of indicators that can serve as an early warning system (EWS) on
exchange rate. In light of the appreciation of emerging countries’ currencies during the Fed quantitative
easing period, it is important to understand on how The Fed normalization would put pressure on managing
volatility for central banks, especially for countries with large trade and fiscal deficit such as Indonesia.
All in all, using both EWS models, central banks could discern potential exchange rate depreciation for
intervention purpose.
Abstract
Keywords: Dynamic Logit Model, Foreign Exchange, Early Warning System, Emerging Countries,
Foreign Exchange Intervention.
JEL Classification: C32, E58, F31, F37.
1 Financial Analyst, Reserve Management Department of Bank Indonesia ([email protected])2 Financial Analyst, Reserve Management Department of Bank Indonesia ([email protected])

130 Buletin Ekonomi Moneter dan Perbankan, Volume 19, Nomor 2, Oktober 2016
I. INTRODUCTION
Research on emerging countries’ exchange rate dynamics has been the subject of interest by academia, market participants, and financial regulators; considering their high volatility. Central banks especially those in emerging market economies are taking special interest in exchange rate dynamics due to their role in stabilizing exchange rate movement through intervention. Gracia et al. (2011) argued that the role of central bank intervention in exchange rate movement is desirable, especially in vulnerable emerging economies. Alder and Tovar (2011), Basu and Varoudakis (2013), and Neely (2008), identified several motives of the central bank’s intervention such as moderate exchange rate volatility, reducing exchange rate misalignment, accumulate reserves, and supply foreign exchange to the market.
More recently, following the unconventional policies of major advanced economies from 2008, emerging countries’ currencies have experienced appreciation due to massive capital inflow. Looking forward, it is important to understand on how The Federal Reserve normalization would put pressure for central banks on managing volatility, especially those with large trade and fiscal deficit such as Indonesia. In retrospect, initial reports that The Federal Reserve might begin “tapering” its quantitative easing on May 2013, caused a rush to exit from emerging countries including Indonesia, with exchange rate declines of as much as 20% in the following four months.
Considering the importance of intervention in managing emerging currencies, central banks in emerging market economies should devise a set of indicators that can serve as an early warning system (EWS); which could identify an impending depreciation before it occurs. EWS could help central banks implement optimal policies including the strategies of intervention to prevent or smooth the impact of currency depreciation.
Kaminsky, Lizondo, and Reinhart (1998) pioneered a comprehensive survey regarding EWS by proposing several case studies of devaluation episodes using structural model of balance of payment crises, signaling model for currency crises, as well as empirical study using macroeconomic and financial data for emerging countries. Berg and Patillo (1999) proposed a static panel probit model as an alternative to the signaling approach. Bussiere and Fratzcher (2006) proposed a multinominal logit EWS that consider the crisis as a ternary variable instead of binary.
Unfortunately, in previous studies, EWS have remained silent at the recent financial crisis. The difficulty to detect potential currency depreciation lies in the specificity of EWS that aimed at accurately detecting the occurrence of a currency depreciation which is translated into a binary variable that takes the value of one when depreciation occurs and the value of zero otherwise. In this context, it is not possible to directly implement the method proposed in times series econometrics such as vector autoregression. Furthermore, most previous EWS are static and assume that the depreciation probability depends only on a set of macroeconomic variables.
131Early Warning System and Currency Volatility Management in Emerging Market
1 Detail explanation on constrained maximum likelihood is available on appendix.
Candelon, Dumitrescu, and Hurlin (2010) proposed a new generation of EWS which reconcile the limited dependent property of the depreciation variable and the dynamic dimension of this phenomenon. In particular, Candelon et al. (2010) considered not only the exogenous source of depreciation persistence from macroeconomic data, but also endogenous persistence of depreciation which are lagged binary depreciation variable and past index associated to the probability of being in depreciation period. Thus, the EWS relies an autoregressive (AR) model, where the endogenous variable summarizes all the past information of the system. Given all these different specifications, an exact maximum likelihood estimation by Kauppi and Saikonnen (2008) is used to estimate the models.1
In contrast from academic EWS model, Commerzbank (2013) proposed a simple currency depreciation index that requires a shorter forecast period and does not require regular recalibration. Commerzbank used several macroeconomics indicators such as current account and industrial production as well as market indicators such as real effective exchange rate and equity market performance that translated into risk measures with equal weighting.
Perhaps the most interesting feature of our research is on how we adopt both models from Candelon et al. (2010) and Commerzbank (2013) to give a better understanding toward potential currency depreciation. All in all, using both EWS model, central banks could discern potential exchange rate depreciation for intervention purpose.
This paper is structured as follows. Section 2 describes the structure of early warning signal (EWS) by Candelon et al. (2010) and Commerzbank as well as several assumptions for the EWS index. Section 3 describes the data and construction of the EWS index. Section 4 reports the forecast evaluation and intervention strategies, while section 5 concludes.
II. THEORY
The first model is a dynamic EWS based on Candelon et al. (2010) that exploits the persistence property of the currency depreciation captured by lagged endogenous indicators. The second model is based on Commerzbank that use macroeconomics and market indicators to construct a depreciation warning index.
2.1. Dating Currency Depreciation
Before elaborating further into the EWS model, we define currency depreciation as large market movement adjusted for interest rate differentials rather that looking at composite indices of exchange rate pressure as elaborated by Kumar et al. (2002). Thus, if e
t is the exchange rate

132 Buletin Ekonomi Moneter dan Perbankan, Volume 19, Nomor 2, Oktober 2016
vis-à-vis the US dollar and rt and r
t* are domestic and foreign (US) interest rates of maturity ∆,
we supposed that depreciation takes place if
where γ1 is a cut-off point which is set to 5 percent. Our rationale behind the cut-off point
is an assumption that an exchange rate movement bigger than 5 percent is consider high in many countries that adopt manage float regime. Equation above is defined as an unanticipated
depreciation crash. Note that the product on the left hand side of this inequality is the return that an investor receives if he shorts the domestic currency for the period ∆ then invests the proceeds in US bonds of maturity ∆ as normally happened during risk aversion period.
Furthermore, second definition of currency depreciation or known as depreciation crashes could also be defined if
Where γ2 is a cut-off point which is also set to 5 percent. Therefore, total currency
depreciation could be defined as large market movement that satisfies both the first and second definition of currency depreciation above.
2.2. Specification and Estimation of Dynamic EWS Model
First, consider the time-series version of the dynamic limited dependent EWS. Denote
as the currency depreciation binary variable for country n, taking the value of 1 during
depreciation periods and 0 otherwise and as the matrix of explanatory variables,
i.e., macroeconomic indicators.
The one-step-ahead dynamic specification taken into account exogenous macroeconomic variables (x
t-1) as well as endogenous variables both lagged binary variable (yt-1) and lagged index
(πt-1) takes the general form of:
133Early Warning System and Currency Volatility Management in Emerging Market
where Pt-1(yt
=1) is the conditional probability given the information set we have at time t-1, π
t is the index at time t, and F is a distribution function i.e., Gaussian in the case of the
probit model and logistic for the logit model.
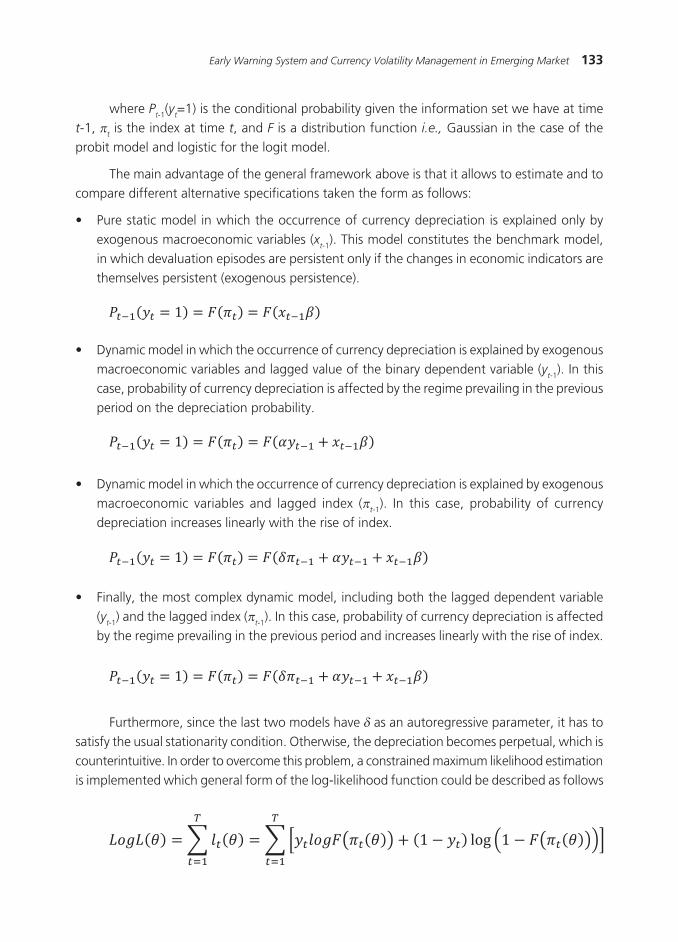
The main advantage of the general framework above is that it allows to estimate and to compare different alternative specifications taken the form as follows:
• Purestaticmodel inwhichtheoccurrenceofcurrencydepreciationisexplainedonlybyexogenous macroeconomic variables (x
t-1). This model constitutes the benchmark model, in which devaluation episodes are persistent only if the changes in economic indicators are themselves persistent (exogenous persistence).
• Dynamicmodelinwhichtheoccurrenceofcurrencydepreciationisexplainedbyexogenousmacroeconomic variables and lagged value of the binary dependent variable (y
t-1). In this case, probability of currency depreciation is affected by the regime prevailing in the previous period on the depreciation probability.
• Dynamicmodelinwhichtheoccurrenceofcurrencydepreciationisexplainedbyexogenousmacroeconomic variables and lagged index (π
t-1). In this case, probability of currency depreciation increases linearly with the rise of index.
• Finally,themostcomplexdynamicmodel,includingboththelaggeddependentvariable(y
t-1) and the lagged index (πt-1). In this case, probability of currency depreciation is affected
by the regime prevailing in the previous period and increases linearly with the rise of index.
Furthermore, since the last two models have δ as an autoregressive parameter, it has to satisfy the usual stationarity condition. Otherwise, the depreciation becomes perpetual, which is counterintuitive. In order to overcome this problem, a constrained maximum likelihood estimation is implemented which general form of the log-likelihood function could be described as follows

134 Buletin Ekonomi Moneter dan Perbankan, Volume 19, Nomor 2, Oktober 2016
where θ is the vector parameters. Given the maximum-likelihood framework, dynamic time-series models are easy to implement.
2.3. Specification and Estimation of Commerzbank Model
Commerzbank (2013) developed a simple and intuitive EWS model, using both macroeconomic indicator and market indicator, that requires shorter forecast period, does not require regular recalibration, and makes clear contribution of individual inputs to the overall risk signal.
Macroeconomics indicators that are being used to construct the index are as follows
• Current account: This gives an indication of the degree to which a country relies on foreign funding. Higher current account surplus may translate into lower volatility in the currency.
• Money supply: Excessive money creation may lead to higher inflation and consequently a weaker currency.
• Inflation: Excessive inflation will typically lead to depreciation of the currency.
• Industrial production: Falling industrial production may signal that the economy is weakening. Lower interest rate and/or a weaker currency may be required to stimulate a recovery thus triggering currency depreciation.
• Trade data (exports): A sharp fall in exports will lessen demand for the currency. A weaker currency may in any case be necessary to increase the competitiveness of the export market.
• Short term debt: High level of short term debt increases the risk of a funding crisis should debt become difficult to roll over.
• Non-performing loans: An elevated ratio of non-performing loans could lead to weaker economic growth if not a banking crisis.
• Domestic credit: Very high level or credit to the domestic private sector may indicate excesses in the banking system.
• Economic surprises: Worse than expected economic data may result from deterioration in the economy that could lead to the withdrawal of capital from local assets and consequent weakening of the currency.
Market indicators that are being used to construct the index are as follows
• Real effective exchange rate: The trade-weighted average exchange rate, adjusted for differing price levels in home and foreign markets, provides a gauge of a country’s external competitiveness. If a country’s REER increases too strongly, it may signal that the currency needs to depreciate.

135Early Warning System and Currency Volatility Management in Emerging Market
• FX implied volatility: The level of FX implied volatility acts as a proxy for option prices and hence the approximate cost of hedging. An increased level of hedging activity may be indicative of concern over a weakening of the currency.
• Equity market performance: Weaker asset markets can lead to withdrawal of foreign capital. If investors repatriate the realized funds there will be selling pressure on the local currency.
• Global risk sentiment: The global risk environment can influence currency markets through the home bias effect – investors in developed markets are more likely to withdraw funds from emerging markets when risk is perceived as being high.
Commerzbank model use simple steps to generate a warning index as follows
• Rankeachdatapointwithrespecttoitsownhistory.
• Convertpercentilerankingsintoriskmeasures.Wherealowervalueismorelikelytocausefor concern, i.e., industrial production, the risk level is given by one hundred minus the percentile ranking, otherwise the risk measure is simply given by the rank.
• Riskrankingsforallmacroeconomicandmarketindicatorsforanindividualcountryaresimply averaged to generate an overall risk rating on a scale from 0 to 100 for the currency in question.
• Riskindexiscalculatedusingequalweighting
2.4. Optimal Cut-Off
In order to compare the depreciation probabilities obtained from EWS model with the actual currency depreciation, we have to shift these probabilities to depreciation forecasts by defying an optimal threshold or cut-off that determine between potential currency depreciation and calm periods. If the probability of a depreciation is greater than the cut-off, the model issues a signal of a forthcoming depreciation. The lower the threshold is, the more signals the model will send, but at the same time, the number of wrong signals rises. On the other hand, higher threshold level reduces the number of wrong signals, but increases the number of missing signals. Thus, an indicator variable of predicting potential depreciation in currency for could be defined as follows, where C represents a fixed cut-off:
136 Buletin Ekonomi Moneter dan Perbankan, Volume 19, Nomor 2, Oktober 2016
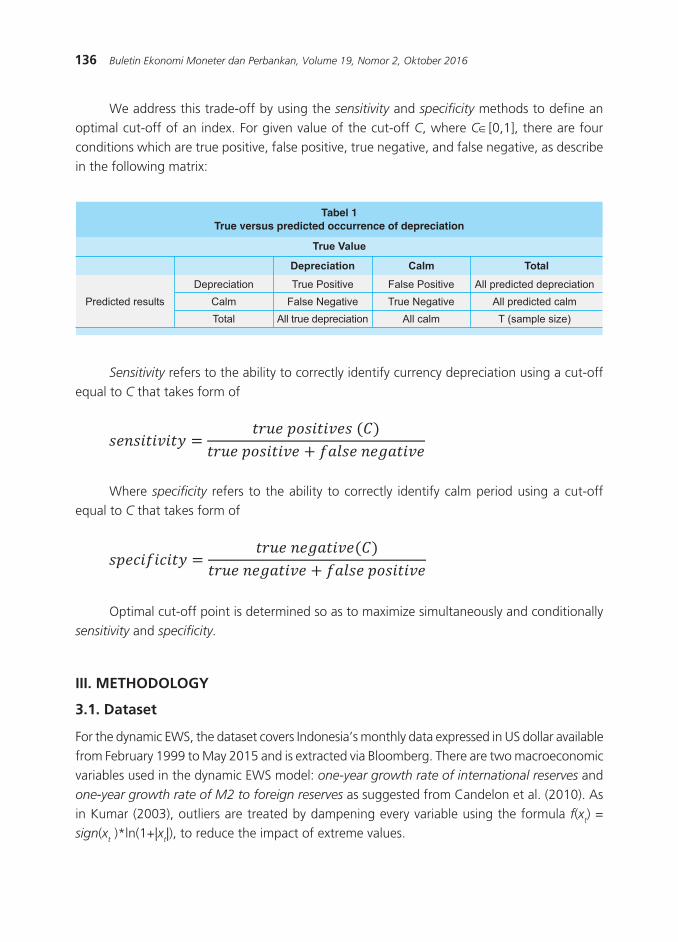
We address this trade-off by using the sensitivity and specificity methods to define an optimal cut-off of an index. For given value of the cut-off C, where C∈[0,1], there are four conditions which are true positive, false positive, true negative, and false negative, as describe in the following matrix:
������������
������������
����
�����
������������� ���
�� ����������
������������
������ ��������������
��������������
�� ��������
��������
��������������������������
������������������
���������������
����������������������������������������� �������������
���� �����
����������
Sensitivity refers to the ability to correctly identify currency depreciation using a cut-off equal to C that takes form of
Where specificity refers to the ability to correctly identify calm period using a cut-off equal to C that takes form of
Optimal cut-off point is determined so as to maximize simultaneously and conditionally sensitivity and specificity.
III. METHODOLOGY
3.1. Dataset
For the dynamic EWS, the dataset covers Indonesia’s monthly data expressed in US dollar available from February 1999 to May 2015 and is extracted via Bloomberg. There are two macroeconomic variables used in the dynamic EWS model: one-year growth rate of international reserves and one-year growth rate of M2 to foreign reserves as suggested from Candelon et al. (2010). As in Kumar (2003), outliers are treated by dampening every variable using the formula f(x
t) =
sign(xt )*ln(1+|x
t|), to reduce the impact of extreme values.

137Early Warning System and Currency Volatility Management in Emerging Market
For the Commerzbank depreciation index, monthly data expressed in US dollar available from the period January 2004 to May 2015 is also extracted via Bloomberg. Taking concern about some limitation in the data availability, macroeconomic indicators used in the Commerzbank depreciation index are reduced to current account, money supply, inflation, industrial production, and non-performing loan while market indicators used are real effective exchange rate, FX
implied volatility, equity market performance, and global risk sentiment.
3.2. Model Evaluation and Robustness Test
In order to show the usefulness of the model, we implement the EWS evaluation by Candelon et al. (2011), especially to test their forecasting abilities (out-of-sample exercises). The main advantage of this framework is that it can be applied to any EWS outputting depreciation probabilities, both in-sample and out-of-sample. To be more precise, first, we rely on different evaluation criteria and comparison tests to identify the outperforming model. Second, we gauge the optimal model’s ability to discriminate between depreciation and calm periods by identifying the optimal cut-off for each model.
Accordingly, we consider both classic EWS evaluation measures such as the QPS criterion and newer one for the EWS literature, which take the cut-off into account in the evaluation and thus lead to a more refined diagnostic, i.e. the Area Under the ROC criterion (AUC). The QPS criterion is a mean-squared-error measure that compares the depreciation probabilities (the forecasts issued by the EWS, P
t-1 (yt=1)) with the depreciation occurrence indicator y
t:
At the same time, AUC is a credit-scoring criteria, that reveals the predictive abilities of an EWS by relying on all the values of the gut-off, i.e. the threshold used to compute depreciation forecasts :
Where Se(c) represents the sensitivity, i.e. the proportion of depreciation correctly identified by the EWS for a given cut-off c and Sp(c) is the specificity, i.e. the proportion of calm periods correctly identified by the model for a cut-off equal to c.

138 Buletin Ekonomi Moneter dan Perbankan, Volume 19, Nomor 2, Oktober 2016
Next, the optimal cut-off is identified by maximizing the Youden index (J) which is an accuracy measure arbitrating between type I and type II errors (misidentified depreciation and false alarms):
where J(c)=Se(c)+ Sp(c)-1. A model’s ability to correctly discriminate between depreciation and calm periods is the given by sensitivity and specificity. For more details on the evaluation method, see Candelon et al. (2011).
IV. RESULT AND ANALYSIS
4.1. Estimation Results for Dynamic EWS
General form of dynamic EWS elaborated above has main advantage that it allows to estimate and compare different EWS specification. First, we estimate the three types of dynamic EWS as well as the benchmark which is the static EWS model under analysis in the time-series framework. Furthermore, the static model is labeled as Model 1, a dynamic one which includes the lagged binary dependent variable is labeled as Model 2, a dynamic one including the lagged index is labeled as Model 3, and finally, a dynamic model which includes both the lagged binary dependent variable and the lagged index is labeled as Model 4.
Second, we find the best goodness of fit from the four models by relying on Schwarz Information Criterion (SBC). SBC reveals that the right-hand-side variables have important explanatory power. Based on the lowest values of the SCB criterion, Model 2 that includes the lagged binary dependent variable seems to be the most adequate model to predict potential currency depreciation. Thus, SCB gives a clear indication that dynamic model generally outperform the static one.
��������� ������ ������ ������ ������
��������������������������������� �����������������������
������� ������� ������� ������� �������
��� ��� ��� ���
�� ������������ ���� � ��������� ��������������������� �������������������������������� ���� �� ������ ��������������� ������
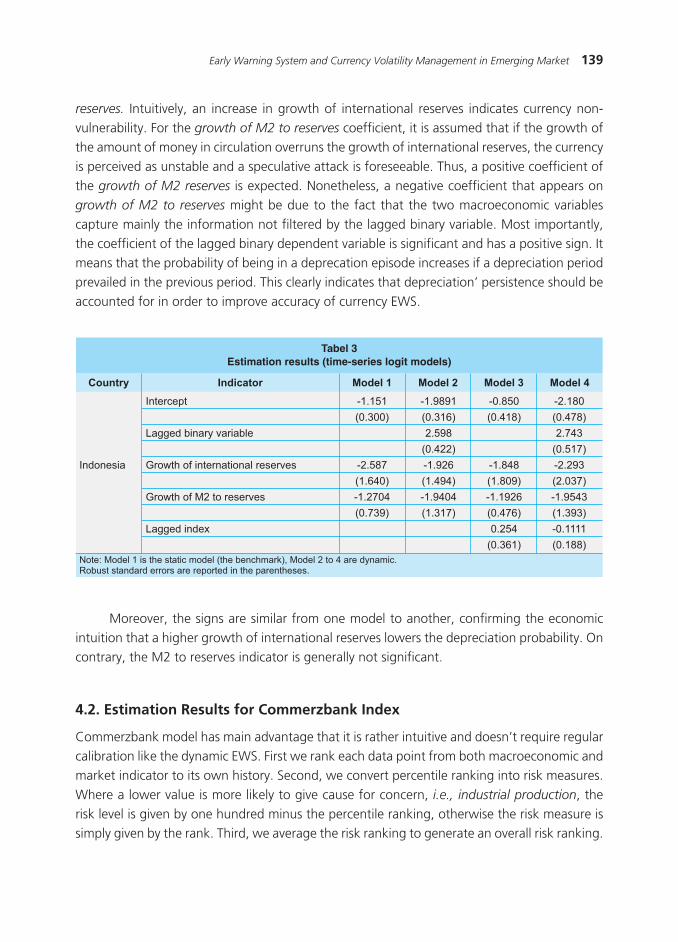
Third, we analyze the signs of the estimated parameters for the Model 2. The result shows a negative coefficient of growth of international reserves, indicating a decline in the probability of currency depreciation is presumed with an increase in a country’s growth of international
139Early Warning System and Currency Volatility Management in Emerging Market
reserves. Intuitively, an increase in growth of international reserves indicates currency non-vulnerability. For the growth of M2 to reserves coefficient, it is assumed that if the growth of the amount of money in circulation overruns the growth of international reserves, the currency is perceived as unstable and a speculative attack is foreseeable. Thus, a positive coefficient of the growth of M2 reserves is expected. Nonetheless, a negative coefficient that appears on growth of M2 to reserves might be due to the fact that the two macroeconomic variables capture mainly the information not filtered by the lagged binary variable. Most importantly, the coefficient of the lagged binary dependent variable is significant and has a positive sign. It means that the probability of being in a deprecation episode increases if a depreciation period prevailed in the previous period. This clearly indicates that depreciation’ persistence should be accounted for in order to improve accuracy of currency EWS.
�������
���������
����������������������������������������� ����������
���������
�������������������� �
�������������������� ���������
����������������������
������������
�������������
���������� �������� ������
������������������� ����������� ���� � �������
��������� ���
���� ���������������� ������� �������
��������� ������ ������������������������ ���������������������
��������� ������� ������� ������ �������
���������� �������������������� �������������������� ������ ������������������������������������������������������������������
Moreover, the signs are similar from one model to another, confirming the economic intuition that a higher growth of international reserves lowers the depreciation probability. On contrary, the M2 to reserves indicator is generally not significant.
4.2. Estimation Results for Commerzbank Index
Commerzbank model has main advantage that it is rather intuitive and doesn’t require regular calibration like the dynamic EWS. First we rank each data point from both macroeconomic and market indicator to its own history. Second, we convert percentile ranking into risk measures. Where a lower value is more likely to give cause for concern, i.e., industrial production, the risk level is given by one hundred minus the percentile ranking, otherwise the risk measure is simply given by the rank. Third, we average the risk ranking to generate an overall risk ranking.

140 Buletin Ekonomi Moneter dan Perbankan, Volume 19, Nomor 2, Oktober 2016
The result shows an increasing risk ranking for current account, inflation, non-performing
loan, and equity risk performance indicator. Confirming an economic intuition, wider current account deficit as well as increasing inflation and non-performing loan might prompt a speculative attack from fundamentalist agent due to deteriorating fundamental factors. Whereas, continuing pressure on stock market might prompt a speculative attack from technical analysts. Looking forward in the near term, based on fundamental point of view as well as possible outflow due to likelihood of normalization of Fed Fund Rate in the second semester of 2015, continuing pressure on IDR is inevitable.
Figure 1. Predicted probability of depreciation – in sample (Commerzbank Index)
����������
�������������������������������� ������������ ��
����������������������� ���������������������������������������������������������������������������������������������������������������������������������������� ������������ ������������������������� ������������������������ ���������������������������������� ������������������������� ����������������������������� ������� ������������������
������������������������������������
�� �� ������� � �� ��� �� ��� �� ��
����������������
����
������������������������
���������������������
��������
���������������
�����������������������
�����������
�����������
������������������
������������������������
����������������������
�����������������������
��
��
��
��
��
��
������ ���� ���� ���� ���� ���� ���� ���� ���� ���� ����
���
���
���
���
�
���
���
�����
������� �� ������������ ������

141Early Warning System and Currency Volatility Management in Emerging Market
Historically, distribution of IDR depreciation index is centered on 45 to 60 and extreme values are seldom seen. Furthermore, the warning signal has on average come a few months earlier.
Figure 2.Distribution of Commerzbank Index
4.3. Forecast Evaluation and Intervention Strategies
In this section, we go one step further and test the in-sample forecasting abilities of the static and dynamic EWS model as well as Commerzbank depreciation index. More importantly, the out-of-sample predictive abilities of the best dynamic model (Model 2) and Commerzbank are also checked. In order to do this, we apply the validation methodology developed by Candelon et al. (2009).
4.3.1. In-sample analysis
To check the within sample forecasting abilities of the static and dynamic time-series models as well as Commerzbank depreciation index, the whole dataset is considered. Once the filtered probabilities and risk index are calculated, each model is evaluated. We assess the forecasting abilities of these models by considering QPS and AUC evaluation criteria. Recall that the higher the AUC and the lower the QPS the better the model.
��
��
��
��
�
��� �� �� �� �� �� �� �� ��
142 Buletin Ekonomi Moneter dan Perbankan, Volume 19, Nomor 2, Oktober 2016
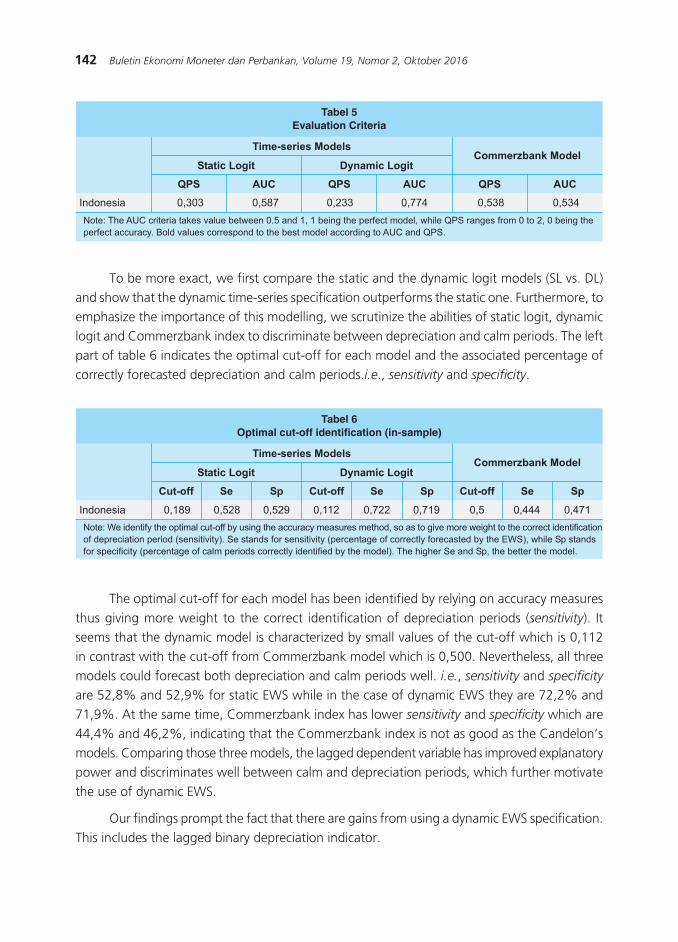
To be more exact, we first compare the static and the dynamic logit models (SL vs. DL) and show that the dynamic time-series specification outperforms the static one. Furthermore, to emphasize the importance of this modelling, we scrutinize the abilities of static logit, dynamic logit and Commerzbank index to discriminate between depreciation and calm periods. The left part of table 6 indicates the optimal cut-off for each model and the associated percentage of correctly forecasted depreciation and calm periods.i.e., sensitivity and specificity.
���
��������� ����� ����� ����� ����� ����� �����
��������������������������
��� ��� ��� ��� ���
������������ �������������
�����������������������������
���� ������������������������������������������������������������� �������������������������� ������������������������ �����������������������������������������������������������������������������
�������
��������� ����� ����� ����� ����� ����� ����� ��� ����� �����
�������������������������� ��������� ��� �������
������������ �������������
��� �� �� ��� ������ �������� �
�� ��������� ��� ����� ������� ������������ ����������������������� ����������� ����������������� � �� ��������� ����� ���� ������������� ����������������� ��� � ����� ������������� ��� ��������� ������������ ��������� ������ ����� ������������ ��������������� ��������� ������������������������� ������� �������� �������� ����������������������� ����� ��� ��������
� �� ������� � �� ������� � ��
The optimal cut-off for each model has been identified by relying on accuracy measures thus giving more weight to the correct identification of depreciation periods (sensitivity). It seems that the dynamic model is characterized by small values of the cut-off which is 0,112 in contrast with the cut-off from Commerzbank model which is 0,500. Nevertheless, all three models could forecast both depreciation and calm periods well. i.e., sensitivity and specificity are 52,8% and 52,9% for static EWS while in the case of dynamic EWS they are 72,2% and 71,9%. At the same time, Commerzbank index has lower sensitivity and specificity which are 44,4% and 46,2%, indicating that the Commerzbank index is not as good as the Candelon’s models. Comparing those three models, the lagged dependent variable has improved explanatory power and discriminates well between calm and depreciation periods, which further motivate the use of dynamic EWS.
Our findings prompt the fact that there are gains from using a dynamic EWS specification. This includes the lagged binary depreciation indicator.

143Early Warning System and Currency Volatility Management in Emerging Market
4.3.2. Out-of-sample analysis
We then check the out-of-sample performance of our dynamic EWS model, estimated over February 1999 until June 2010, and the estimated parameters are used to compute the probability of having depreciation in July 2010. This estimation and forecasting is then rerun for the March 1999 until July 2010 period to obtain the out-of-sample depreciation probability for August 2010 and so on.
It results that when faced more than one month of currency depreciation period, the EWS forecasting probability is very high during depreciation periods. On the contrary, when faced only one period of depreciation, the model forecasting abilities are disappointing. It is also seen in the out-of-sample analysis that the dynamic EWS indicates a potential depreciation since October 2013. Thus in line with continuing pressure on emerging market exchange rate after The Fed announced that it might begin unwinds its unconventional policy on May 2013.
Figure 3.Predicted probability of depreciation – in sample (Static EWS)
Figure 4.Predicted probability of depreciation – in sample (Dynamic EWS)
�
���
���
���
���
���
���
���
���
���
�
������ ������ ����� ������ ������ ����� ������ ������ �����
����������� ��������������� ���
������ ������ ������������ ������ ������ ������ ������ ����������
����
����
����
�����
�����
�����
�����
�
� ��
� �
� ��
� �
� ��
� �
� ��
���������������������
����
���������� ������ ������ ������ ������ ������ ������ ������ ������
�
���
���
���
���
��
���
���
���
���
�
����������� ��������������� � �
�����
���������� ������ ������ ������ ������ ������ ������ ������ ������
���
���
�
���
���
�
���
���
���
������ ��������������� �����
144 Buletin Ekonomi Moneter dan Perbankan, Volume 19, Nomor 2, Oktober 2016
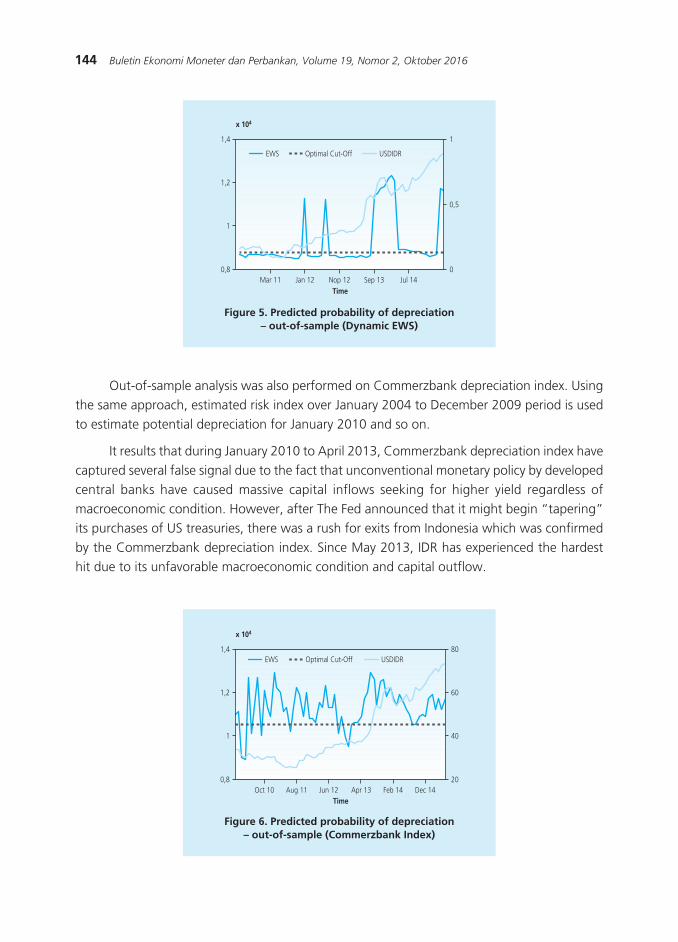
Figure 5. Predicted probability of depreciation– out-of-sample (Dynamic EWS)
Figure 6. Predicted probability of depreciation– out-of-sample (Commerzbank Index)
Out-of-sample analysis was also performed on Commerzbank depreciation index. Using the same approach, estimated risk index over January 2004 to December 2009 period is used to estimate potential depreciation for January 2010 and so on.
It results that during January 2010 to April 2013, Commerzbank depreciation index have captured several false signal due to the fact that unconventional monetary policy by developed central banks have caused massive capital inflows seeking for higher yield regardless of macroeconomic condition. However, after The Fed announced that it might begin “tapering” its purchases of US treasuries, there was a rush for exits from Indonesia which was confirmed by the Commerzbank depreciation index. Since May 2013, IDR has experienced the hardest hit due to its unfavorable macroeconomic condition and capital outflow.
�����
���������� ������ ������ ������ ������
� �
�
� �
� �
�
� �
�
� ��������������� ������
�����
����
���
�
���
���
��
��
��
��
������ ������ ������ ����� ����� �����
��� ��������������� ����
145Early Warning System and Currency Volatility Management in Emerging Market
All in all, the dynamic EWS model have good forecasting abilities not only in-sample but also out-of-sample. Whereas Commerzbank depreciation index recently have improved its forecasting abilities considering the fact that IDR appreciation during 2010 until April 2013 was caused by massive capital inflow rather than fundamental factors.
4.4. Intervention Strategy
After estimating three different types of EWS for forecasting depreciation period, we then try to understand why and how central bank intervene in foreign exchange markets as elaborated by Chutasripanich and Yetman (2015). Before assessing intervention strategy, first let us identify the motives of central banks for intervention which has been elaborated by Adler et al. (2011), Basu et al. (2013) and Neely (2008). Generally, these motives can be grouped as follows:
• Leaning against the wind: Recent survey by BIS shows that the most common reason for emerging market central banks to intervene in foreign exchange market was to limit exchange rate volatility and smooth the trend path of the exchange rate (BIS (2013)). For example, Adler et al (2011) find that half of the central bank in their sample intervene to dampen exchange rate volatility.
• Reducing exchange rate misalignment: Central bank may wish to step into the foreign exchange market if they see that the current value appears to be either overvalue or undervalued. It is presumed that an exchange rate that is too strong could reduce a country’s competitiveness and too low can lead to unsustainable growth and inflation. However, this statement is probably understated, due to the fact that central bank knows that equilibrium value of the exchange rate is hard to measure and depreciating one currency to increase competitiveness might attract a “currency war” stigma.
• Managing or accumulating FX reserves: After Asian financial crisis, many central banks find the urge to accumulate reserves for defending their currencies during crisis. Some central banks officially announced that intervention would be conducted for the purpose of building reserves, for example Turkey, South Africa, Chile, and Mexico.
• Ensuring liquidity: Some central banks may conduct intervention to ensure adequate liquidity in order to counter disorderly markets and avoid financial stress. BIS survey shows that more than half of participating central banks intervened to provide liquidity in the foreign exchange market.
In order to assess the effectiveness of intervention strategy, Chutasripanich et al (2015) modeled a simple analytical framework for two most common intervention strategies: leaning
against exchange rate misalignment and leaning against the wind. Their model assumed that the fundamental value of the exchange rate is the value at which the current account is equal to zero. However, active trading by risk-averse, rational, speculator may push the exchange

146 Buletin Ekonomi Moneter dan Perbankan, Volume 19, Nomor 2, Oktober 2016
rate away from this value. For example, if speculators engage in the carry trade, their returns depend on the behavior of both the exchange rate and interest rates.
The model also assumed that foreign exchange interventions are sterilized so that central banks are exposed to exchange rate risk and carry costs when they intervene. The effectiveness of different intervention rules are then assess using across five criteria: stabilizing the exchange rate, reducing current account imbalances, discouraging speculation, minimizing reserves volatility and limiting intervention costs. Their finding could be summarized as follows:
• The actions of speculators can, under some circumstances, reduce the volatility of exchange rates but, even then, they tend to increase exchange rate misalignment.
• Intervention that reduces exchange rate volatility also reduces the risks of speculation, creating a feedback loop and potentially leading to high levels of speculation.
• Uncertainty about the fundamental value of the exchange rate results in foreign exchange intervention being less efficient.
• Leaning against the wind, which avoids the problem of having to estimate the fundamental value might reduce the volatility of the exchange rate but tends to increase exchange rate misalignment.
• The cost of the foreign exchange intervention will be especially large when exchange rate movements are driven by interest rate shocks since these drive a positive correlation between the stock of reserves and the carrying cost of those reserves.
• Relative to transparent intervention, adding element of opaqueness offers both cost and benefits. It tends to increase the volatility of exchange rate, current account balances and reserves, but reduce the size of speculative flows and the cost of carrying reserves.
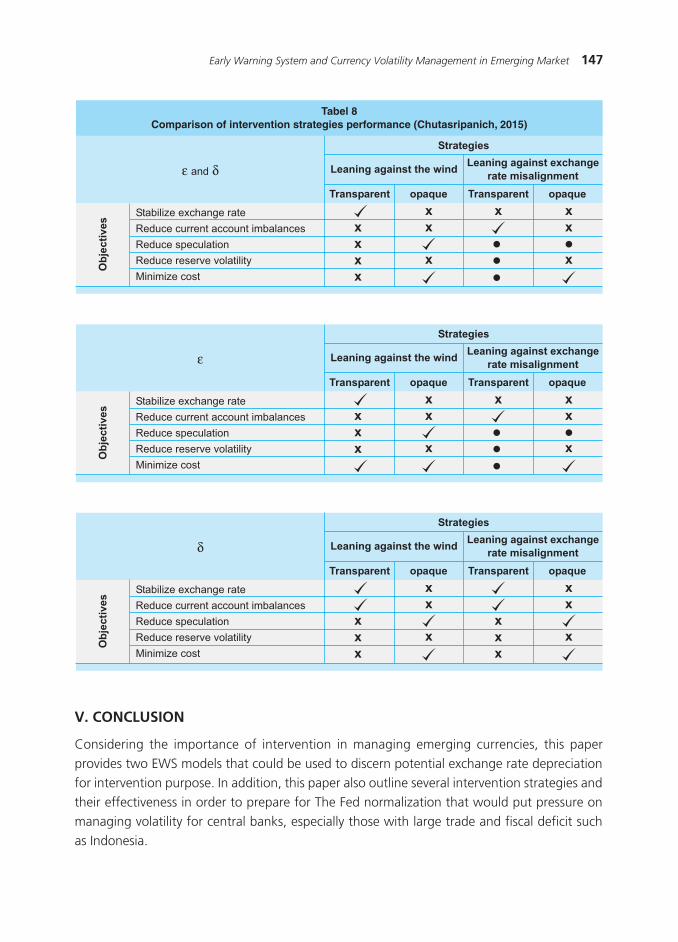
Comparison of the performance of intervention strategies to the shock of fundamental value of exchange rate (labelled ε), to the shock of interest rate differential (labelled δ), as well as both to the shock of fundamental and interest rate differential across five criteria, shows that there are no one approach that dominates.
�������
��������� ����� ����� ����� ���� ���� �����
�������������������������� ��������� ���������������
������������� ������ ��������
����������������������
�� ��������������� ���� ���������������� ������ ����������� �������������� ��� ����������������� ��� ��������������������������� �������������� ������������������������������������������������������ ���� ��� ��������
�� �� ������� �� ��
147Early Warning System and Currency Volatility Management in Emerging Market
����������������������������������������� ����������������������������� ��������������� ������������������ ��
���������������������������������������� �����������������������������������
����������
������������������������������������������������
�����������������
���������� ���� ���������� ����
����
����
��
�������
����
��
�
� ��
�
����������������������������������������� ����������������������������� ��������������� ������������������ ��
����������
������������������������������������������������
�����������������
���������� ���� ���������� ����
����
����
��
�
���
��
�
� ��
�
����������������������������������������� ����������������������������� ��������������� ������������������ ��
����������
������������������������������������������������
�����������������
���������� ���� ���������� ����
����
����
��
�
��
��
�
��
��
���
V. CONCLUSION
Considering the importance of intervention in managing emerging currencies, this paper provides two EWS models that could be used to discern potential exchange rate depreciation for intervention purpose. In addition, this paper also outline several intervention strategies and their effectiveness in order to prepare for The Fed normalization that would put pressure on managing volatility for central banks, especially those with large trade and fiscal deficit such as Indonesia.

148 Buletin Ekonomi Moneter dan Perbankan, Volume 19, Nomor 2, Oktober 2016
Several conclusions can be drawn from using both the dynamic EWS and Commerzbank index as well as incorporating them into intervention strategies. First, we show that in the in-sample test, dynamic logit models (sensitivity and specificity 72,2% and 71,9%) outperform static one (sensitivity and specificity 52,8% and 52,9%) as well as Commerzbank depreciation index (sensitivity and specificity 44,4% and 46,2%) . Second, by combining both EWS, we could have a better predictive ability of potential currency depreciation. Since the dynamic EWS give better predictive ability both within in-sample an out-sample analysis, it is easier to assume that dynamic EWS alone would deliver adequate signals to discern potential currency depreciation. However, Commerzbank depreciation index could give us a better understanding of individual risk ranking for both macroeconomics and market indicators. Third, assessing the intervention strategy to lean against the wind to the shock of fundamental value of exchange rate (considering deteriorating fundamental condition in Indonesia) as well as to the shock of interest rate differential (normalization of Fed Fund Rate), it is suggested that some degree of opaqueness might help to limit speculation and minimize cost. However, if the main objective is to stabilize exchange rate, leaning against the wind transparently might be optimal. Furthermore, it is also suggested that cost of the foreign exchange intervention will be especially large when exchange rate movements are driven by interest rate shocks (Fed normalization)
Looking ahead, continuing pressures on IDR is inevitable. Nonetheless, there is no doubt that using both EWS model, central bank could implement optimal policies including the strategies of intervention to prevent or smooth the impact of currency depreciation.
149Early Warning System and Currency Volatility Management in Emerging Market
REFERENCES
Adler, G., and Tovar, C.E. (2011). Foreign Exchange Intervention: A Shield Against Appreciation Winds?. IMF Working Paper 11/165.
Bank for International Settlements. (2005). Foreign Exchange Market Intervention in Emerging Markets: Motives, Techniques and Implication. BIS Papers 24.
Bank for International Settlements. (2013). Market Volatility and Foreign Exchange Intervention in EMEs: What has Changed?. BIS Papers 73.
Basu, K., and Varoudakis, A. (2013). How to Move the Exchange Rate if You Must: The Diverse Practice of Foreign Exchange Intervention by Central Banks and a Proposal for Doing it Better. World Bank Policy Research Working Paper 6460.
Berg, A., and Pattillo, C. (1999). Predicting Currency Crises: The Indicators Approach and an Alternative. Journal of International Money and Finance, 18, 561-586.
Bussiere, M., and Fratzscher, M. (2006). Towards a New Early System of Financial Crises. Journal
of International Money and Finance, 25(6), 953-973.
Candelon, B., Dumitrecu, E.I., Hurlin, C. (2009). How to evaluate an Early Warning System? Towards a Unified Statistical Framework for Assessing Financial Crises Forecasting Methods. Working Paper.
Candelon, B., Dumitrecu, E.I., Hurlin, C. (2010). Currency Crises Early Warning System: why they should be Dynamic. Working Paper.
Commerzbank. (2013). Emerging Market Currency Exposure: How to Hedge and Manage Exposures to High Yield, Volatile Currencies. Commerzbank.
Falcetti, E., Tudela, M. (2006). Modelling Currency Crises in Emerging Markets: A Dynamic Probit Model with Unobserved Heterogeneity and Autocorrelated Errors. Oxford Bulletin
of Economics and Statistics, 68(4), 445-471.
Frankel, J.A., Yetman, J. (1990). Chartists, Fundamentalist and Trading in The Foreign Exchange Market. American Economic Review, 80(2), 181-185.
Fuertes, A.M., Kalotychou, E. (2007). Optimal Design of Early Warning Systems for Sovereign Debt Crises. International Journal of Forecasting, 23(1), 85-100
Gallant, A.R. (2008). Nonlinear Statistical Models. New York. USA: John Wiley and Sons.
Gracia, C.J., Restrepo, J.E., and Roger, S. (2011). How Much Should Inflation Targeters Care About the Exchange Rate?, Journal of International Money and Finance 30(7), 1590-1617.
150 Buletin Ekonomi Moneter dan Perbankan, Volume 19, Nomor 2, Oktober 2016
Harding, D., and Pagan A. (2009). An Econometric Analysis of Some Models for Constructed Binary Time Series. NCER Working Paper 39.
Kaminsky, G., Lizondo, S., Reinhart, C. (1998). Leading Indicators of Currency Crises. IMF Staff
papers, 45 (1), 1-48.
Kauppi, H., Saikkonen, P. (2008). Predicting U.S. Recession with Dynamic Binary Response Models. The Review of Economics and Statistics, 90 (4), 777-791.
Kumar, M., Moorthy, U., and Perraudin, W. (2003). Predicting Emerging Market Currency Crashes. Journal of Empirical Finance, 10, 427-454.
Neely, C.J. (2001). The Practice of Central Bank Intervention: Looking Under the Hood. Federal
Reserve Bank of St. Louis Review May/June, 1-10.
Neely, C.J. (2001). Central Bank Authorities’ Believe about Foreign Exchange Intervention. Journal of International money and Finance, 27(1), 1-25.
151Early Warning System and Currency Volatility Management in Emerging Market
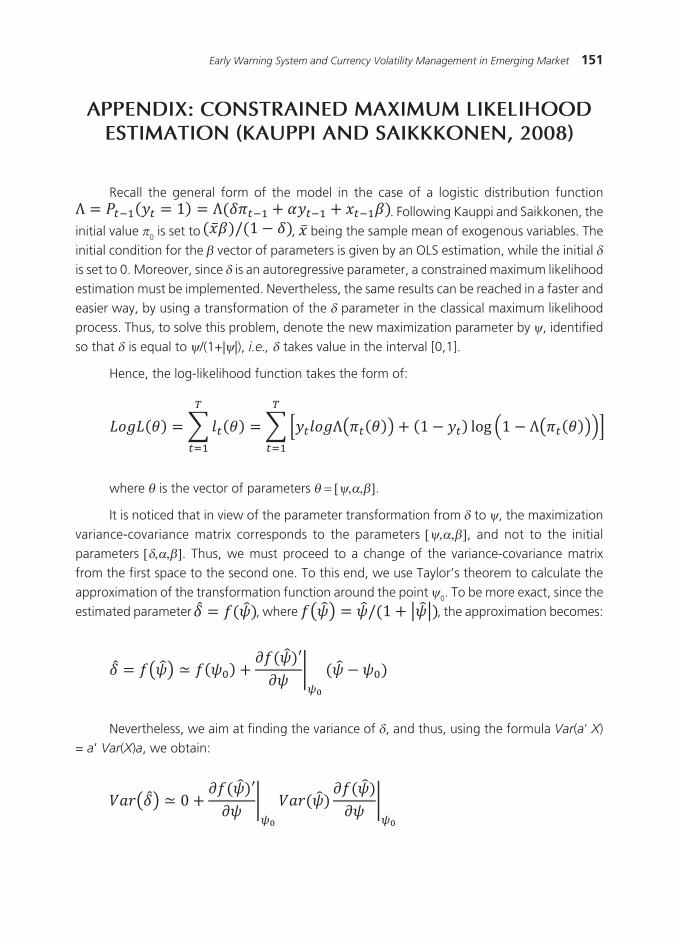
Recall the general form of the model in the case of a logistic distribution function . Following Kauppi and Saikkonen, the
initial value π0 is set to , being the sample mean of exogenous variables. The initial condition for the β vector of parameters is given by an OLS estimation, while the initial δ is set to 0. Moreover, since δ is an autoregressive parameter, a constrained maximum likelihood estimation must be implemented. Nevertheless, the same results can be reached in a faster and easier way, by using a transformation of the δ parameter in the classical maximum likelihood process. Thus, to solve this problem, denote the new maximization parameter by ψ, identified so that δ is equal to ψ/(1+|ψ|), i.e., δ takes value in the interval [0,1].
Hence, the log-likelihood function takes the form of:
AppENDIx: CONSTRAINED MAxIMUM LIKELIhOOD ESTIMATION (KAUppI AND SAIKKKONEN, 2008)
where θ is the vector of parameters θ = [ψ,α,β].
It is noticed that in view of the parameter transformation from δ to ψ, the maximization variance-covariance matrix corresponds to the parameters [ψ,α,β], and not to the initial parameters [δ,α,β]. Thus, we must proceed to a change of the variance-covariance matrix from the first space to the second one. To this end, we use Taylor’s theorem to calculate the approximation of the transformation function around the point ψ0. To be more exact, since the estimated parameter , where , the approximation becomes:
Nevertheless, we aim at finding the variance of δ, and thus, using the formula Var(a’ X) = a’ Var(X)a, we obtain:
152 Buletin Ekonomi Moneter dan Perbankan, Volume 19, Nomor 2, Oktober 2016
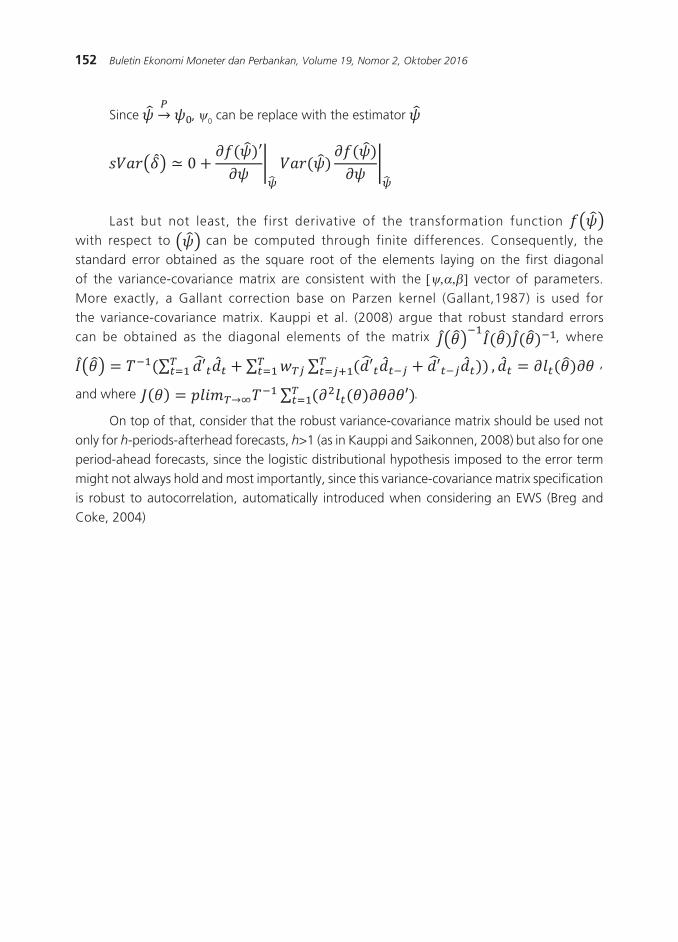
Since , ψ0 can be replace with the estimator
Last but not least, the first derivative of the transformation function with respect to can be computed through finite differences. Consequently, the standard error obtained as the square root of the elements laying on the first diagonal of the variance-covariance matrix are consistent with the [ψ,α,β] vector of parameters. More exactly, a Gallant correction base on Parzen kernel (Gallant,1987) is used for the variance-covariance matrix. Kauppi et al. (2008) argue that robust standard errors can be obtained as the diagonal elements of the matrix , where
,
and where .
On top of that, consider that the robust variance-covariance matrix should be used not only for h-periods-afterhead forecasts, h>1 (as in Kauppi and Saikonnen, 2008) but also for one period-ahead forecasts, since the logistic distributional hypothesis imposed to the error term might not always hold and most importantly, since this variance-covariance matrix specification is robust to autocorrelation, automatically introduced when considering an EWS (Breg and Coke, 2004)