salient features of the district - tirunelveli … name tirunelveli has been composed ... vii...
TRANSCRIPT

i
SALIENT FEATURES OF THE DISTRICT
Introduction:
Tirunelveli District was formed in 1790 by the East India company, later came under the
direct control of the British Crown Queen Victoria. The name Tirunelveli has been composed
from the three Tamil words i.e. „Thiru – Nel – Veli‟ meaning Sacred Paddy Hedge.
Geographical data:
Tirunelveli District having geographical area of 6759 sq.kms, in the Southeastern portion
of Tamil Nadu is triangular in shape. It lies between 8°.05‟ and 9°.30‟ of the Northern latitude
and 77°.05‟ and 78°.25‟ of Eastern longitude.
Topography:
The district is located in the southern part of Tamil Nadu and sourrended by
Virudhunagar District on the north, Western Ghats on the West, Kannyakumari District on the
south and Tuticorin District on the East. The lifeline of the district river Tamiraparani feeds
the district and quenches the thirst of residents of Tirunelveli and Tuticorin district too.
Administrative Setup:
The District has 3 Revenue Divisions Consisting of 11 Taluks, 60 Firkas 19
Development Blocks, 616 Revenue Villages and 425 Village Panchayats.
Demographic Details:
The population of the District was 2723988 in 2001 Census and 3077233 as per 2011
census. The Density of Population per sq.km. was 399 in 2001 census and 460 persons as per
2011 census. Tirunelveli, Tenkasi and Ambasamudram are the most densely populated Taluks
in the District as per 2011 census.
The Sex ratio is 1023 females for every 1000 males. The Literacy rate is 82.50% in the
District as per 2011 census.
ii
Out of total population, males are 1333939 and females 1390049 in 2001 census and
males are 1520912 and females 1556321 as per 2011 census. The district having Schedule caste
population of 569714 which represents 18.5% to the total population as per 2011 census.
Schedule Tribes are found to be very small in numbers 10270 which is 0.33% to the total
population.
Climate and Rainfall:
The district has peculiar climate throughout the year and receives rainfall in all the
seasons which representing 1034.3 mm in 2013-2014. When compared with last five years except
2012-2013 excess rainfall was in the district.
The maximum precipitation is contributed by the North East Monsoon (412.8 mm)
followed by Summer (314.1 mm) and the South West Monsoon (237 mm) and Winter (70.4 mm.
But in the current year shortage of rainfall was received during North-East Monsoon season.
Occupation:
Agriculture plays a Vital role in the District‟s economy. The total cropped area was
162144 hectares, which worked out 23.99% to the total area of 675850. Paddy, Cholam, Ragi,
Cumbu Maize and other minor millets are the important food crops. Cotton, Chillies, Sugarcane
and Groundnut are the important commercial crops. Out of total cultivated area of 162144
hectares 28643 hectares were sown more than once.
Irrigation:
The District is blessed with the Western Ghats from which all the perennial rivers are
flew and drain towards the east. The surface water of the District is drained into major river
basin viz., Thamiraparani, Vaippar, Nambiar and Hanumanathi. Thamiraparani is the major
river basin in the District. The other Streams which are seasonal in nature are Servallar,
Manimuthar, Ramanathi, Pachaiyar, Chittar and Uppodai rivers which are drain into the
Tamiraparani basin. The sources of irrigation are Canal, Tank and Well, which covers 85534
hectares. Among the total area irrigated, Well irrigation covers 42104 hectares, Tanks 26964
hectares and Canal 16466 hectares.
iii
Industry:
There are 25 medium and major industries such as Cement, Cotton yarn, Calcium
carbide, Sugar, Cotton seed oil, Printing papers and flour Mill etc.
Among the other industries in the District Pin, Clip, Matches, Beedi,Vessels making and
Engineering industries are important. The important Village industries functioning in the
district are Handloom, Poultry farming, Brick kiln, Jaggary production. The products
Handloom like Lungi, Sarees etc., are marketed in north India. The fine Korai mats from
Pathamadi have one of the world fame. Kallidaikurichi Pappads, Karukurichi mud pots and
Tirunelveli “Halva” are specialities which earned many laurels to the District.
Tourist spots:
Courtallam is situated at the Western Ghats in Tenkasi Taluk. The famous waterfalls on
rocks and tiny droplets are sprinkled in the air. The water falls of Courtalam have medicinal
value as they run through forest and herbs before their decent.
Pappanasam Agasthiar falls also attracts tourist and pilgrims.There is a Wild life
sanctuary at Mundanthurai and Kalakadu. Spotted deers, Liontailed monkeys, Elephants and
Tigers are plenty.
Religious Significance:
The Nellaiappar temple at Tirunelveli, Sankaranainar temple at Sankarankoil,
Kasiviswanathar temple at Tenkasi and Vanamamalai Temple at Nanguneri are the land
marks of the District signifying the Hindu Culture. . Palayamkottai has many Christian missions
and Athankaraipallivasal & Pottalpudur Darga have considered to be important sacred places
for Muslims.

iv
DISTRICT PROFILE 2013-2014
TIRUNELVELI DISTRICT
1.GEOGRAPHICAL POSITION
North Latitude Between : 8.05` and 9.30`
East Longitude Between : 77.05` and 78.25`
2.AREA AND POPULATION – 2001 Census 2011 Census i. Area (Sq.Km.) : 6823 6759
ii. Population
a. Male : 1333939 1520912
b. Female : 1390049 1556321
c. Total : 2723988 3077233
d. Rural : 1415742 1557004
e. Urban : 1308246 1520229
iii. Density/Sq.Km : 399 460
iv. Literates
a. Male : 74.76 89.24
b. Female : 59.83 75.98
iv. Main Workers (2001 Census)
a. Total Workers : 1281117 NA
b. Male Workers : 737911 NA
c. Female Workers : 543206 NA
d. Rural Workers : 729776 NA
e. Urban Workers : 551341 NA
f. Cultivators : 137516 107943
g. Agricultural Labourers : 356055 321083
h. Household Industry : 282282 626714
i. Other Workers : 505264 NA
vi. Non-Workers : 1442871 1640779
vii Language spoken in the Districs Tamil & English
3.VITAL STATISTICS i. Birth : 66811
ii. Death : 17701
iii. Infant Deaths : 1151
iv. Birth Rate (per 1000 Population) : 21.64
v. Death Rate (per 1000 Population) : 5.73
vi. Infant Mortality Rate(Per 1000 Live Births : -
vii.Expectation o life at Birth : -
a. Male : -
b. Female : -
viii No. of Deaths of Women due to
Problems related to child birth : -

v
a. At the time of delivery : -
b. During Pregnancy : -
4. TEMPERATURE (IN CELSIUS)
a. Plains
i. Maximum : -
ii. Minimum : -
b. Hill Stations
i. Maximum : -
ii. Minimum : -
5. RAINFALL (in mm)
a. Normal : : 845.1
i.North East Monsoon : 467.2
ii.SouthWest Monsoon : 142.4
iii.Winder season : 69.3
iv. Summer : 166.2
b. Actual : 1034.3
i. North East Monsoon : 412.8
ii.SouthWest Monsoon : 237
iii.Winder season : 70.4
iv. Summer : 314.1
6. AGRICULTURE (in Hec.)
a. Total Cultivated Area (Hec
: 180925
b. Net Area Sown (Hec.) : 155658
c. Area Sown more than once (Hec.) : 25267
d. Area and Production of Principal Crops : Area (Hec.)
i. Rice : 62280
ii. Millets and Other Cereals : 11840
iii. Pulses : 2612
iv. Sugarcrops : 3369
v. Groundnut : 376
vi. Gingelly : 224
vii.Cotton : 1731
e. Agricultural Land Holdings : :
2010-11 (9th Agri Census)
a. Holdings (Nos) : 293237
b. Area in Hect. : 211761.23
c. Average Size of holdings in Hect : 1.38
f. Important Food Crops : Paddy, Black gram, Banana, Green

vi
gram, Sugarcane , Cashewnut and
Maize
g. Important non Food Crops
: Groundnut, Coconut, Cotton &
Gingelly
7. IRRIGATION(Fasli 1421) i. Net Area Irrigated by : (in Hec.)
a Government Canals : 16466
b. Private Canals : Nil
c. Tanks : 26964
d. Tube Wells : 802
e. Other Wells : 41301
f. Other Sources : Nil
g. Total Net Area Irrigated : 85533
ii. Gross Area Irrigated : 64881
iii. Name of the River : Tamirabarani, Ramanathi,
Kadananathi, Karuppanathi,
Kundaru and Chittaru
iv. Name of the Lake Nil
8. ANIMAL HUSBANDRY
i. Veterinary Institutions : 1
a. Veterinary Hospitals : 7
b. Veterinary Dispensaries : 99
c. Clinician Centres(Poly clinic) : 1
d. Sub-centres : 31
ii. Poultry Development
a.Chicks produced in hatcheries : Nil
b.Birds sold for breeding : Nil
c.Birds sold for food : Nil
iii.Livestock and Poultry Population 2004 Census
a. Cattle : 418694
b. Buffaloes : 78777
c. Sheep : 487273
d. Goat : 390570
e. Poultry : 1218583
9. DAIRY DEVELOPMENT (Govt)
a. Dairies : 1
b. Milk Chilling Plants : 2
c. No. of Milk Co-operative Societies : 193
d. Milk Production (Lakh Litres) : 113.51

vii
10. FISHERIES
I. Length of Coastal Line (Km : 48.9
II. No,of Coastal Blocks : 2
III. No. of Coastal Centres (Landing) : 7
IV. Marine Fish Production (Tonnes) : -
V. Inland Fish Production (Tonnes) : 282.17
11. FOREST
I. Forest Area (Hec.) : -
a. Forests : 127758
b. Social Forests : -
c. Unclassed Forests : -
II.Out-turn of Forest Product
a. Timber (Cu.m.) : N.A
b. Fuel wood (MT : N.A
c. Pulpwood (MT : N.A
d. Sandalwood (MT : N.A
. e. Rubber (MT) : N.A
f. Bamboo (Tonne) : N.A
g. Tea Green Leaves (Tonne) : N.A
h. Wattle Bark (MT) : N.A
12. ELECTRICITY (IN M.U.)
I.Generation of Electricity :
In M.U
a. Hydro : -
b. Wind Mill Generation : 4859.557
c. Thermal : Nil
d. Power Purchased : NA
e. Gas Turbine : -
II.Consumption of Electricity (in m.u.) a. Agriculture : NA
b. Industry : 80.12
c. Commercial : 146.63
d. Domestic : 766.59
e. Public Lighting & Public Works : 89.01
f. Sales to Licensees : Nil
g. Sales to Other States : Nil
h. Miscellaneous : 31.64
III.Rural Electrification
a. No.of Pump sets Electrified : 82657
b. No. of Villages Electrified : 425
c. Number of Hamlets Electrified : 1727

viii
13. ENTERPRISES 5th Economic Census 2005 Rural Urban
i. No. of Agri. Enterprises : 24668 1880
ii. No. of Non-Agri. Enterprises : 204405 80542
ii. No. of Enterprises
a. With premises : 221628 80567
b. Without premises : 7445 1855
14. INDUSTRIES No. of Working Factories (Regd) : 865
No. of Workers : 26270
No. of Trade Unions : 26
No. of Strikes : 3
No. of Lockouts : -
Large Scale Industries : NA
Medium Scale Industries : NA
Small Scale Industries : NA
Cottage Industries : NA
No. of new factories set up : NA
Name of the important industries in
the district
: The India Cements Ltd.,Sankar
Nagar, Sundaram Textiles Ltd.,
Nanguneri, Subburaj Spinning
Mills,Sankar Nagar, Dharani Sugars
Ltd. Dharani Nagar Sun Paper mill
private Ltd Cheranmahadevi EM.Pee
Sugars& Chemical Ltd Idaikal, Syed
cotton mills Alangulam & Nanguneri
,Survalakshmi Paper Board Ltd
Seethaparbanallur
Name of the industrial park : Gangaikondan, Nanguneri SIDCO
Industrial Estate Valliyoor
15. KHADI AND VILLAGE INDUSTRIES
I. Khadi
:
Production (Rs.in
Lakhs)
Sales
(Rs.in Lakhs)
a. Khadi : 14.87 33.71
b.Woolen : - -
c. Silk : - -
d. Yarn : 14.60 -
II. Village Industires
a. Soaps : 17.0 -
b. Leather Goods : 12.0 12.0
c. Industrial Co.Op Societies : 362.86 383.96
16. MEDICAL AND HEALTH( in numbers) I. Modern Medicine(Government only)
a. No. of Hospitals : 13
ix
b. Primary Health Centres : 69
c. Health Sub Centres : 383
d. Other Medical Institution : 1
e. Beds in Hospitals : 1038
f. Doctors : 179
g. Nurses : 155
II. Indian Medicine (Government only)
a. Hospitals : 1
b. Primary Health Centres : -
c. Beds in Hospitals : 350
d. Doctors : 62
e. Nurses : 25
III. Homoeopathy(Government only)
a. Hospitals : -
b. Primary Health Centres : -
c. Beds in Hospitals : -
d. Doctors : -
e. Nurses : -
17. EDUCATION i. Universities : 2
ii. Arts and Science Colleges : 25
iiiI. Colleges for Professional Education
a. Allopathy : 1
b. Indian Medicine : 1
c. Homoeopathy : -
d. Engineering Colleges : 20
e. Agriculture Colleges : 1
f. Veterinary Colleges : 1
g. Law Colleges : 1
iv. Colleges for Special Education : 25
v. Pre primary Schools : -
vi. Primary Schools : 1791
vii. Middle Schools : 453
viii. High & Hr.Sec Schools : 461
ix. Education guarantee scheme : -
18. TRANSPORT I. Road Length (Km.) :
National Highways : -
State Highways : 1676.826
Major District Road : 1230.266
Other District Road
Sugarcane
:
:
4804.33
12.500
II. Registered Motor Vehicles
x
a. Commercial
b. Non-Commercial
:
:
2088
16691
III. Railway Length(in Km)
a. Route Length
b. Track Length
:
:
-
-
c. Number of Railway Stations : -
IV. Number of Sea Ports : NIL
V. Number of Air Ports : NIL
VI. Name of the Air Port : NIL
VII. Name of the Export
Commodity
: MAT, Cloth, Onion,Chillies.
19. COMMUNICATION I. Post & Telegraph (in No.)
a. Post Offices doing Postal
business alone
: 169
b. Post Offices doing Postal &
Telegraph Business
: Nil
II. Telephones
a. No. of Telephones in use : 76870
b. No. of Public Call Offices : 2327
c.. No. of Telephones Exchanges : 84
20. CO-OPERATION
I. District Central Cooperative Banks
(including branches) : 30
II. District Co-operative Union : -
III. Co-Operative Training Institute : -
IV. Co-Operative Printing Press : -
xi
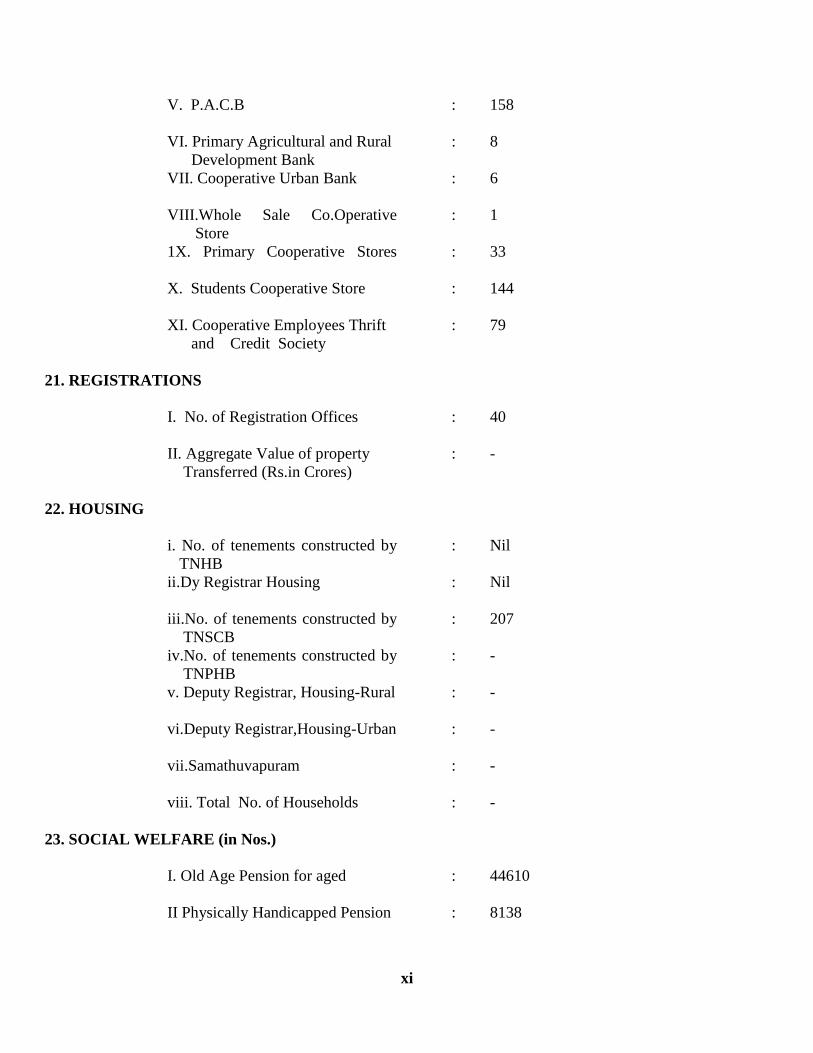
V. P.A.C.B : 158
VI. Primary Agricultural and Rural
Development Bank
: 8
VII. Cooperative Urban Bank : 6
VIII.Whole Sale Co.Operative
Store
: 1
1X. Primary Cooperative Stores
: 33
X. Students Cooperative Store
: 144
XI. Cooperative Employees Thrift
and Credit Society
: 79
21. REGISTRATIONS
I. No. of Registration Offices : 40
II. Aggregate Value of property
Transferred (Rs.in Crores)
: -
22. HOUSING
i. No. of tenements constructed by
TNHB
: Nil
ii.Dy Registrar Housing : Nil
iii.No. of tenements constructed by
TNSCB
: 207
iv.No. of tenements constructed by
TNPHB
: -
v. Deputy Registrar, Housing-Rural : -
vi.Deputy Registrar,Housing-Urban : -
vii.Samathuvapuram : -
viii. Total No. of Households : -
23. SOCIAL WELFARE (in Nos.)
I. Old Age Pension for aged : 44610
II Physically Handicapped Pension : 8138

xii
III. Widow Pension : 28379
IV. Agri. Labour pension : 4240
V. Deserted Wives Pension : 3195
VI. Unmarried woman Pension : 975
VII Uzhavar Sandhai
VIII CMUPT Pension
:
:
-
15932
24. NUTRITIOUS MEALS PROGRAMME
No.of Centres
No. of
Beneficiaries
I.C.D.S Scheme : 2562 186934
Purachi Thalaivar Noon Meal : 2087 198365
25.REVENUE ADMINISTRATIVE DIVISIONS
i. Revenue Divisions : 3
ii. Revenue Taluks : 11
iii. Revenue Firkas : 60
iv. Revenue Villages : 616
26. LOCAL BODIES
i. Corporations : 1
ii. Municipalities : 7
iii. Panchayat Unions : 19
iv. Town Panchayats : 36
v. Village Panchayats : 425
27.COMMUNITY DEVELOPMENT
i. No. of Development Divisions : 1
ii. No. of Blocks Covered : 19
iii. Population Covered (Lakhs) : 30.77
xiii
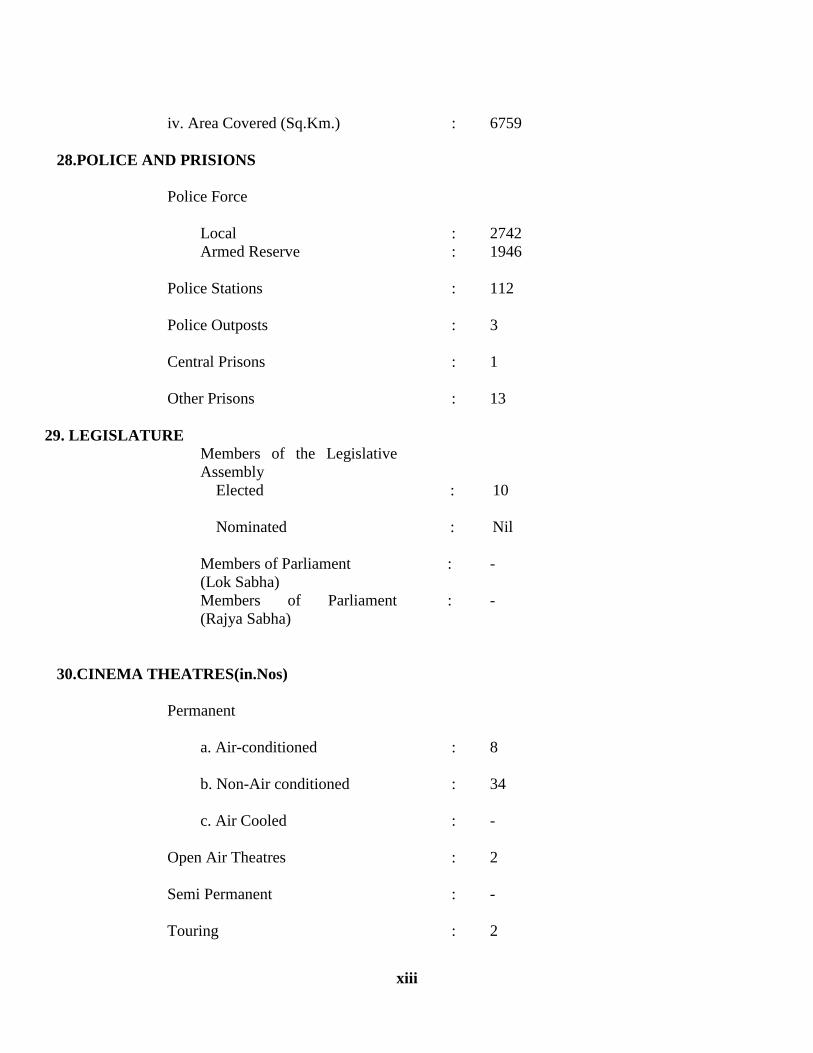
iv. Area Covered (Sq.Km.) : 6759
28.POLICE AND PRISIONS
Police Force
Local : 2742
Armed Reserve : 1946
Police Stations : 112
Police Outposts : 3
Central Prisons : 1
Other Prisons : 13
29. LEGISLATURE
Members of the Legislative
Assembly
Elected : 10
Nominated : Nil
Members of Parliament
(Lok Sabha)
: -
Members of Parliament
(Rajya Sabha)
: -
30.CINEMA THEATRES(in.Nos)
Permanent
a. Air-conditioned : 8
b. Non-Air conditioned : 34
c. Air Cooled : -
Open Air Theatres : 2
Semi Permanent : -
Touring : 2
xiv
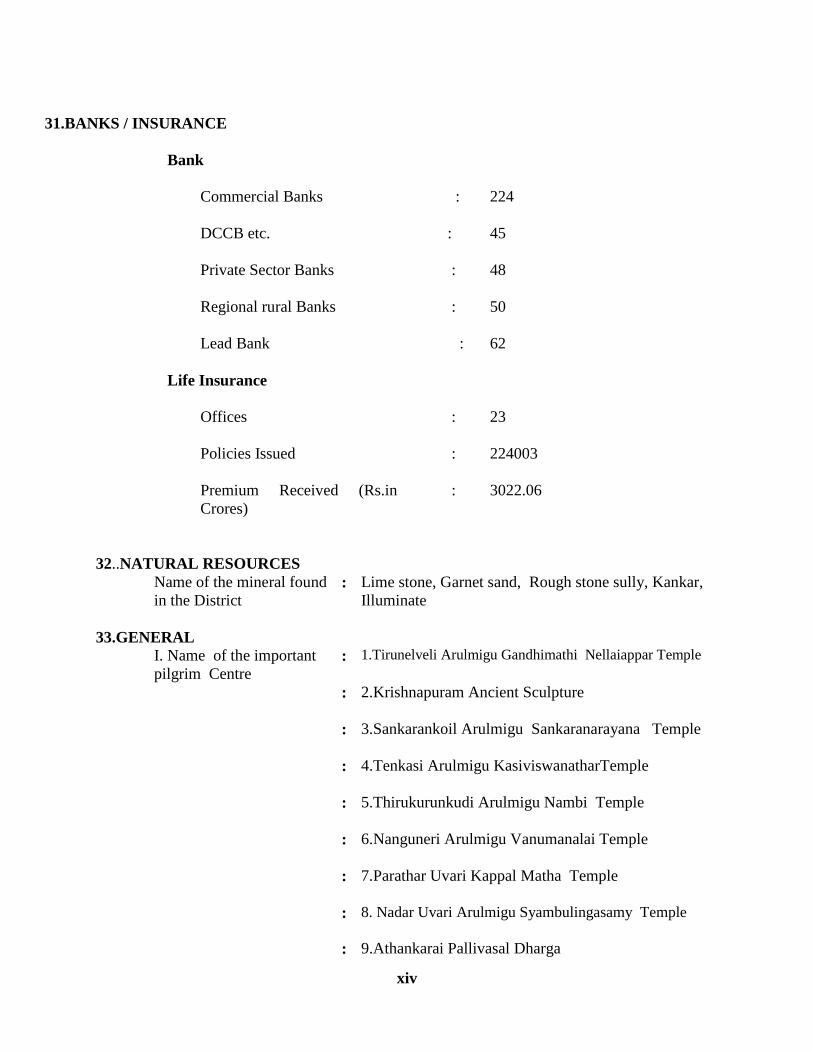
31.BANKS / INSURANCE
Bank
Commercial Banks : 224
DCCB etc. : 45
Private Sector Banks : 48
Regional rural Banks : 50
Lead Bank : 62
Life Insurance
Offices : 23
Policies Issued : 224003
Premium Received (Rs.in
Crores)
: 3022.06
32..NATURAL RESOURCES
Name of the mineral found
in the District : Lime stone, Garnet sand, Rough stone sully, Kankar,
Illuminate
33.GENERAL
I. Name of the important
pilgrim Centre : 1.Tirunelveli Arulmigu Gandhimathi Nellaiappar Temple
: 2.Krishnapuram Ancient Sculpture
: 3.Sankarankoil Arulmigu Sankaranarayana Temple
: 4.Tenkasi Arulmigu KasiviswanatharTemple
: 5.Thirukurunkudi Arulmigu Nambi Temple
: 6.Nanguneri Arulmigu Vanumanalai Temple
: 7.Parathar Uvari Kappal Matha Temple
: 8. Nadar Uvari Arulmigu Syambulingasamy Temple
: 9.Athankarai Pallivasal Dharga

xv
: 10.Papanasam Arulmigu Sivan Temple
: 11.Courtalam Arulmigu Courtaleesuwar Temple
: 12.Panpozhi Arulmigu Thirumalai Kumarasamy Temple
: 13. Pottal Pudur: Dharga
II. Name of the important
Tourist Centre
: 1.Courtalam: Main falls, Old Falls, Five Falls,
Honey Falls, Tiger Falls and Boating
: 2.Papanasam: Dam site, Agasthiar falls and Temple
: 3. Manimuthar:Dam site and falls
: 4.Mundanthurai: Wild life Sanctuary
: 5.Kalakadu:Wild life sanctuary
: 6. Koondhankulam: Birds sanctuary
: 7.Tirunelveli: District Science Centre and Temple
xvi
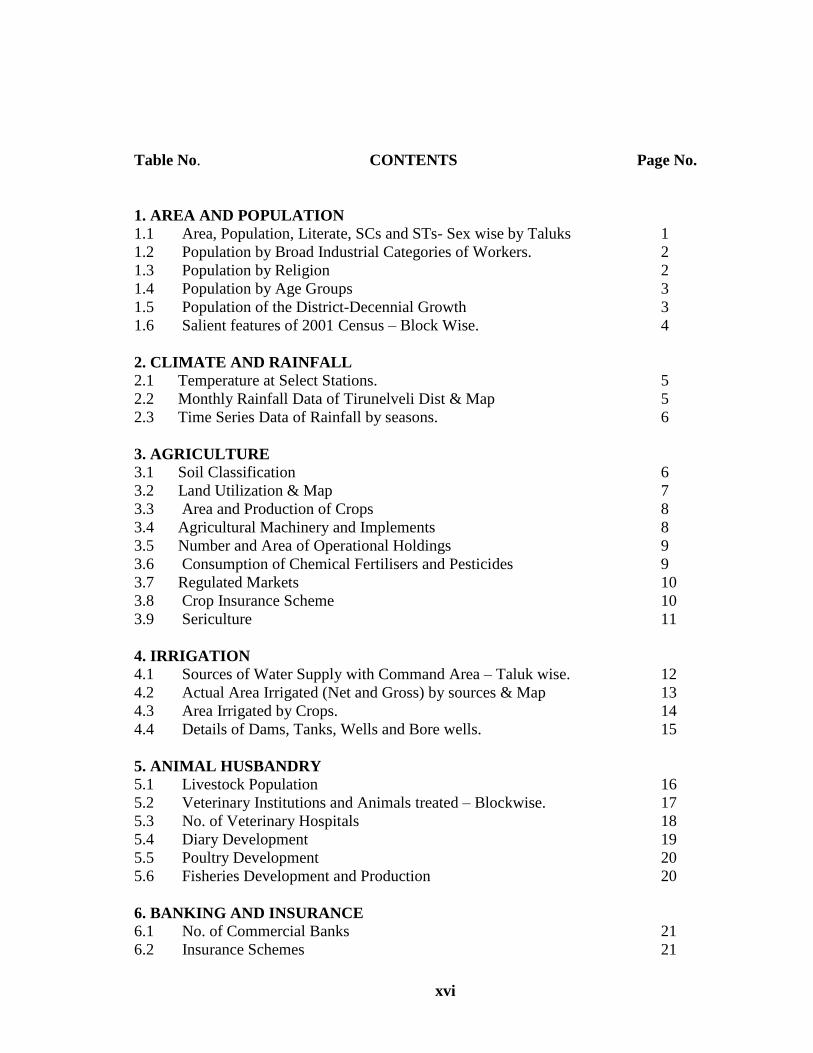
Table No. CONTENTS Page No.
1. AREA AND POPULATION
1.1 Area, Population, Literate, SCs and STs- Sex wise by Taluks 1
1.2 Population by Broad Industrial Categories of Workers. 2
1.3 Population by Religion 2
1.4 Population by Age Groups 3
1.5 Population of the District-Decennial Growth 3
1.6 Salient features of 2001 Census – Block Wise. 4
2. CLIMATE AND RAINFALL
2.1 Temperature at Select Stations. 5
2.2 Monthly Rainfall Data of Tirunelveli Dist & Map 5
2.3 Time Series Data of Rainfall by seasons. 6
3. AGRICULTURE
3.1 Soil Classification 6
3.2 Land Utilization & Map 7
3.3 Area and Production of Crops 8
3.4 Agricultural Machinery and Implements 8
3.5 Number and Area of Operational Holdings 9
3.6 Consumption of Chemical Fertilisers and Pesticides 9
3.7 Regulated Markets 10
3.8 Crop Insurance Scheme 10
3.9 Sericulture 11
4. IRRIGATION
4.1 Sources of Water Supply with Command Area – Taluk wise. 12
4.2 Actual Area Irrigated (Net and Gross) by sources & Map 13
4.3 Area Irrigated by Crops. 14
4.4 Details of Dams, Tanks, Wells and Bore wells. 15
5. ANIMAL HUSBANDRY
5.1 Livestock Population 16
5.2 Veterinary Institutions and Animals treated – Blockwise. 17
5.3 No. of Veterinary Hospitals 18
5.4 Diary Development 19
5.5 Poultry Development 20
5.6 Fisheries Development and Production 20
6. BANKING AND INSURANCE
6.1 No. of Commercial Banks 21
6.2 Insurance Schemes 21
xvii
7. CO-OPERATION
7.1 Co-operative Societies 22
8. CIVIL SUPPLIES
8.1 No. of Fair Price Shops 23
8.2 Quantum of Essential Commodities distributed and their retail price 24
8.3 No. of Ration Cards (Rural and Urban) 25
8.4 Quantity supplied 25
8.5 No. of LPG Connections 25
8.6 No. of Persons waiting for LPG connection. 26
9. COMMUNICATION
9.1 Post-Offices doing postal business only 26
9.2 Post-Offices doing Post and Telegraphic Business 27
9.3 Telegraph Offices 28
9.4 No. of Telephone Exchanges, Capacity and No. in Use 28
9.5 No. of PCOs attached to each exchange 29
9.6 No. of Persons waiting for Phone Connection. 29
10. ELECTRICITY
10.1 No. of Power Stations 30
10.2 Quantum of Power purchased 31
10.3 Power Consumption Sector wise 31
10.4 Peak Demand and Energy Output 31
10.5 Revenue from Electric Schemes and Cost per Unit 32
10.6 Transmission and Distribution of Electricity 32
10.7 Capacity of Transformers 33
10.8 Rural Electrification 34
10.9 Name and Address of fault report offices. 35
11. EDUCATION
11.1 Universities, Students and Teachers and Courses offered 36
11.2 Colleges for General Education, Students and Teachers 36
11.3 College for Professional Education, Students and Teachers 37
11.4 Colleges for Special Education, Students and Teachers 37
11.5 Schools for General Education, Students and Teachers 38
11.6 Schools for Professional Education, Students and Teachers 38
11.7 Schools for Special Education, Students and Teachers 38
11.8 Institutions for Other Professional Education, Students and Teachers 38
11.9 Computer Training Centers 39
11.10 Hospitals and Inmates by Community 40
11.11 Scholarships to Students by Community 40
12. FISHERIES
12.1 Fisheries Development 41
12.2 Estimated M F Production/Inland Fish Production 42
xviii
12.3 No. of Families engaged in Fishing 42
13. HANDLOOM 13.1 No. of Focal Centers with Location details 42
13.2 No. of Societies and Variety wise Production 43
13.3 No. of Power Looms and No. of Employees working 43
13.4 No. of Families engaged 43
14. HANDICRAFTS
14.1 Name and Address of Handicrafts 44
14.2 Articles available in the Handicrafts 44
14.3 Value of Articles produced and Value of Articles sold 45
14.4 No. of Families engaged in Handicrafts 45
15. HEALTH AND FAMILY WELFARE
15.1 Hospitals, Dispensaries, Bed Strength, Doctors and Nurses 45
15.2 No. of Allied Pathological Units available 46
15.3 Disease wise patients treated 46
15.4 Distribution of Medical Personnel 46
15.5 Progress of Family Welfare Programs 47
16. HOUSING
16.1 Plans sanctioned, Building completed under Private Sector 47
16.2 Plans sanctioned, Building completed under Public Sector 47
16.3 Amount invested in Housing and Building activity under Public Sector 48
16.4 Construction activity of Tamil Nadu Housing Board 48
16.5 Construction activity of Tamil Nadu Slum Clearance Board 48
16.6 Index No. of Building Construction cost in Urban centers 49
16.7 Labor Charges of Construction Workers. 49
17. INDUSTRIES
17.1 Results of Annual Survey of Industries 49
17.2 Estimates of Value of Output and Value Added by
Manufacture by Industries Based on ASI 49
17.3 Industrial Production 50
17.4 Production and Value of Major Minerals in the District 50
17.5 Production of Handloom Cloth 50
17.6 Small Scale Industries 51
17.7 Khadi and Village Industries 52
17.8 No. of Printing Presses 53
17.9 No. of Photocopy (Xerox) centers 53
18. FACTORIES
18.1 Registered and Working Factories 53
18.2 Employment in Working Factories 54
18.3 Trade Unions, Industrial Disputes by Strikes, Lockout and Gheraos 55
19. LOCAL BODIES
19.1 Municipal Bodies Area and Population by Grades 55

xix
19.2 Municipal Bodies by Taluks 56
19.3 Panchayat Union, Village/Town Panchayats 56
19.4 Revenue Divisions, Taluks, Firkas and Revenue Villages 56
19.5 Tax Collected by Corporation/Municipality/Panchayat Union/
Town Panchayat/Village Panchayat 56
19.6 Rural Development Activitie 57
20. LABOUR AND EMPLOYMENT
20.1 No of Persons registered during the year and Total No. of
Persons waiting upto the end of the year as per Live Register 58
20.2 No. of Placement during and upto the end of the year. 58
20.3 Employment Under NREGS 58
21. LEGAL SERVICE 21.1 Judicial Divisions and Original Jurisdiction 59
21.2 Results of Civil and Criminal cases in the Court of Original
Jurisdiction, Civil Suits Regular. 59
21.3 Nature of free Legal available, no. of beneficiaries,
no. of cases disposed in Lok Adalat during the year 60
21.4 No. of Advocates practicing in Courts 60
22. LIBRARIES 22.1 List of Head and Branch Libraries in the district with
details of Members, Books available and Readers 61
22.2 No. of Libraries houses in Government Building /Rental Building 61
22.3 No. of Reading Rooms 61
23. MINING AND QUARRYING 23.1 No. of Mining and Quarrying units in the district 62
23.2 Classification-wise production during the year 62
24. MANUFACTURING SECTOR
24.1 No. of Food and other allied manufacturing units in the district 63
24.2 No. of Non-Food manufacturing units in the district 63
25. MEDICAL SERVICES 25.1 No. of Medical Colleges in the district with Students and Teachers 63
25.2 No. of College of Pharmacy with Students and Teachers 64
25.3 No. of Medical Stores in the district - Category-wise 64
25.4 No. of Veterinary Colleges with Students and Teachers 64
26. MOTOR VEHICLES
26.1 No. of Motor Vehicles (Category-wise) Registered during 65
the year and upto the end of the year
26.2 No. of Motor Vehicles (Category-wise) available for hire
p purpose during the year 66
26.3 No. of Persons issued with Driving License 66
xx
27. NON-CONVENTIONAL ENERGY GENERATION 27.1 No. of solar energy generating units in the district with 67
production area
27.2 No. of Wind Mills Generating units with production data 67
28. POLICE AND PRISONS
28.1 Police Force 67
28.2 Cognizable Offences under Indian Penal Code 68
28.3 Prisons and Convicts & Classification of Convicts 68
28.4 No. of Cases Registered under PCR 69
28.5 No. of Cases Registered against Woman Harassment and Dowry 69
29. PUBLIC HEALTH
29.1 Public Health and Medical Services rendered by
Organizations and Individual 70
29.2 No. of Primary Health Centers with Sub-centers 70
30. PRINTING AND PUBLICATION 30.1 No. of News papers, Weekly Magazines, Monthly Magazines,
a. etc., Published 71
30.2 No. of Publishers in the district other than 71
News papers and Magazines
30.3 No. of Printing presses in the district 71
31. PRICE INDICES
31.1 Index Numbers of Wholesale Prices 72
31.2 Consumer Price Index Numbers for Industrial Workers 72
31.3 Consumer Price Index Numbers for Selected essential items for Rural 73
31.4 Consumer Price Index Numbers for Selected essential items for Urban 73
32. QUALITY CONTROL
32.1 List of Industrial / Establishment Units having Quality Control
Facilities and the products subjected to Quality Control 74
33. REGISTRATION
33.1 No. of Registration Offices in the district 75
33.2 Registration and Aggregate Value of properties
transferred during – 2010-2011 75
34. REPAIR AND SERVICES
34.1 Authorized Automobiles Repair and Service Stations 75
34.2 Authorized Electrical and Electronic goods Repair and Service Unit 75
35. RESTAURANTS AND HOTELS
35.1 Restaurants, Cafes and Other Eating and Drinking Places 75
35.2 Details of Hotels 76

xxi
36. RECREATION AND CULTURAL SERVICES
36.1 List of Cinema Theatres and their capacities 76
36.2 List of Clubs and Associations 77
36.3 List of Motion Picture Distributors and Projection Services 77
37. SOCIAL WELFARE
37.1 Puratchi Thalaivar MGR Nutritious Meals Programs Centres 77
37.2 No. of Beneficiaries under Puratchi Thalaivar MGR
Nutritious Meals Program 78
37.3 No. of Beneficiaries under the free supply of
Text Books and Uniforms 78
37.4 No. of Beneficiaries under the free Cycle 78
37.5 No. of Beneficiaries under Old Age Pension Scheme 79
37.6 Free Houses and House sites distributed to community 79
37.7 Implementation of Relief Measures and Pension Scheme 80
38. SANITARY SERVICES
38.1 No. of Sanitary Workers engaged in Sanitation, Garbage
and Sewage disposal and other particulars 80
38.2 No. of Vehicles engaged in the sanitary services 80
39. SCIENTIFIC AND RESEARCH SERVICES
39.1 Institutions and Laboratories engaged in Research Work 81
40. STORAGE FACILITIES
40.1 List of Agricultural and Non-Agricultural Storage Godowns 81
40.2 List of Cold Storage Godowns 81
41. TEXTILES
41.1 No. of Ginning, Spinning and Weaving Mills in the district 82
41.2 Quantum of Production during the year 82
42. TRADE AND COMMERCE
42.1 No. of Major and Minor Trade and Commercial Estate in
the district 82
43. TRANSPORT 43.1 Length of Roads 83
43.2 Road Accidents 83
43.3 Registered Motor Vehicles 83
43.4 Transport Corporation 84
43.5 Selected indicators of overall performance of State 84
Transport Corporation
43.6 Railway Lines and Stations 84
43.7 Port Development 85
43.8 Airports 85

xxii
43.9 Private Transport Operations 86
44. TOURISM
44.1 Places of Tourist Attraction 86
44.2 List of Places of Worship 86
44.3 List of Hotels and Restaurants 87
44.4 List of Travel Agents 87
44.5 Train and Air Service Timings 88
44.6 Railway Length in Kilo Metre 89
45. VITAL STATISTICS
45.1 Births and Deaths registered in the district 89
45.2 Birth, Death and Infant Mortality rates in the district 90
45.3 Death by Causes 90
46. VOLUNTARY SERVICES
46.1 List of Voluntary Services available in the district for the
development of Rural and Urban Population 91
47. WATER WORKS AND SUPPLY
47.1 No. of Schemes Operated in the district 92
47.2 No. of Workers engaged in the Water Works and Supply 92
47.3 No. of House connections, fountains 93
47.4 Educational Expenditure. 93
* * * * * *

1
Source: Census of India - 2011
1. AREA AND POPULATION
1.1 Salient Features of 2011 Census - Block wise
Year : 2013-2014
S.N
o.
Name of the
Block
Are
a (
sq.k
m.)
Population Literate Scheduled Castes Scheduled Tribes
Per
son
s
Male
Fem
ale
Per
son
s
Male
Fem
ale
Per
son
s
Male
Fem
ale
Per
son
s
Male
Fem
ale
1 Manur 493.43 605495 298734 306761 476043 24178 228865 101902 49851 52051 1654 813 841
2 Palayamkottai 371.62 125816 63931 64585 96621 51373 45248 30848 15384 15464 479 234 245
3 Sankarankoil 293.54 159683 79250 80433 111290 61647 49643 44015 21647 22368 326 167 159
4 Melaneelithanallur 317.83 95104 47058 48066 62039 34483 27556 15206 7492 7714 24 11 13
5 Kuruvikulam 404.36 95357 46677 48680 63593 35104 28489 33939 16587 17352 168 78 90
6 Tenkasi 216.60 187778 93713 94065 138159 74568 63591 37008 18372 18636 441 212 229
7 Alangulam 324.65 130928 64177 66751 89946 49011 40935 18565 8968 9597 111 56 55
8 Keelapavoor 207.76 186784 92967 93817 138159 72634 60603 17880 8812 9068 142 71 71
9 Vasudevanallur 568.90 194156 95537 98619 128637 71528 57109 47215 22928 24287 930 464 466
10 Shencottah 189.22 118273 59022 59251 84133 46135 37998 27501 13810 13691 824 416 408
11 Ambasamudram 734.84 147038 72132 74906 116262 60643 55619 22670 10968 11702 755 365 390
12 Cheranmahadevi 197.93 135326 66668 68658 104429 54571 49858 25162 12273 12889 552 273 279
13 Papakudi 162.54 83326 40958 42368 59688 31875 27813 12364 6099 6265 188 105 83
14 Kadayanallur 264.79 167846 84060 83736 115689 64570 51119 34265 16961 17304 493 225 268
15 Kadayam 195.40 111369 54856 56513 81022 43158 37864 19494 9571 9923 191 94 97
16 Nanguneri 502.59 12841 55476 57365 85314 44342 40972 21210 10373 10837 226 117 109
17 Kalakadu 440.94 112761 55432 57329 87571 45163 42408 18144 8771 9373 437 233 204
18 Valliyur 425.92 158047 78130 79917 124717 64128 60589 22742 11162 11580 742 371 371
19 Radhapuram 446.14 146605 72154 74451 115067 58599 56468 19584 9541 10043 1587 804 783
Total 6759.00 3077233 1520912 1556321 2273457 1210710 1062747 569714 279570 290144 10270 5109 5161

2
1.2. Population by Broad Industrial Categories of Workers
Year: 2013-2014
Sl.
No
(1)
Industrial Category
(2)
District Tamil Nadu
Persons
(3)
% to total
workers
(4)
Persons
*
(5)
% to total
workers
(6)
1.
Main +Marginal Workers
a) Cultivators
b) Agricultural Labour
c) Household Industry
Manufacturing,
Processing, Servicing
and Repairs
d) Other Workers
165047
107943 321083 215667
626714
11
8
22
15
44
32884681
4248457
9606547
1364893
17664784
100
12.9
29.2
4.2
53.7
2. Non Workers 1640779 53.32 39262329
Total Population 3077233 72147030
Source: Census of India 2011.
1.3. Population by Religion
Year: 2013-2014
Source: Census of India 2001.
Sl. No.
(1)
Religion
(2)
Persons in
District
(3)
Persons in
Tamil Nadu
(4)
Percentage(%)
In the District
(5)
Tamil Nadu
(6)
All India
(7)
1. Hindus 2172815 54985079 79.7 88.11 80.46
2. Muslims 252235 3470647 9.3 5.56 13.43
3. Christians 296578 3785060 10.9 6.07 2.34
4. Sikhs 89 9545 - 0.02 1.87
5. Buddhists 32 5393 - 0.01 0.77
6. Jains 272 83359 - 0.13 0.41
7. Other
Religions 133 7252 - 0.01 0.65
8. Religions not
Stated 1834 59344 0.1 0.09 0.07
Total
Population 2723988 62405679 100.0 100.00 100.00

3
1.4. Population by Age Groups
Year: 2013-2014
Sl. No Age Groups Persons in
Districts
Persons in
Tamil Nadu
Percentage to total in
District Tamil Nadu
(1) (2) (3) (4) (5) (6)
1. 0-14 741842 16710874 27.23 26.78
2. 15-29 772521 17704221 28.36 28.37
3. 30-44 550358 13393220 20.21 21.46
4. 45-59 388462 8661022 14.26 13.88
5. 60 and above 270805 5936342 9.94 9.51
Total 2723988 62405679 100.00 100.00
Source: Census of India 2001.
1.5. Population of the District Decennial Growth
Year 2013-2014
Period
(Subject to the period of
availability)
Region
Population
Percentage Variation Since
Previous Census
(1)
2001
(2)
2011 (3) (4)
Total 2723988 Total 3077233 11.47
Rural 1415742 Rural 1557004 9.07
Urban 1308246 Urban 1520229 13.94
Source: Census of India 2011.

4
1.6. Salient Features of 2011 Census -Block wise
Year: 2013-2014
Sl.
No.
Name of the Block
Den
sity
per
sq
.km
.
Fem
ales
per
10
00
mal
es (
Sex
Rat
io)
Incr
ease
in
po
pu
lati
on
sin
ce
20
01
in %
Urb
an/R
ura
l
Po
pu
lati
on
in
%
Literacy rate
among
S.C
. P
op
ula
tio
n i
n %
S.T
. P
op
ula
tio
n i
n %
Male
(%)
Female
(%)
1. Manur Block 1227.11 1027 18.69 82.74 74.61 16.83 0.27
2. Palayamkottai 345.83 1010 30.89 80.36 70.06 24.00 0.37
3. Sankarankoil 543.99 1015 8.89 77.79 61.72 27.56 0.20
4. Melaneelithanallur 299.23 1022 9.10 73.31 57.33 15.99 0.03
5. Kuruvikulam 203.56 1043 -10.88 75.21 58.52 35.59 0.18
6. Tenkasi Block 866.93 1004 9.40 79.57 67.60 19.71 0.23
7. Alangulam 403.29 1040 11.92 76.37 61.32 14.18 0.08
8. Keezhapavoor 899.04 1009 15.56 78.13 64.60 9.57 0.08
9. Vasudevanallur 341.28 1032 9.17 74.87 57.91 24.32 0.48
10. Shencottai 625.06 1004 16.00 78.17 64.13 23.25 0.70
11. Ambasamudram 200.10 1038 3.41 84.07 74.25 15.42 0.51
12. Cheranmahadevi 683.71 1030 9.27 81.85 72.62 18.59 0.41
13. Pappakudi 512.65 1034 17.16 77.82 65.65 14.84 0.23
14. Kadayanallur 633.88 997 19.10 76.81 61.01 20.41 0.29
15. Kadayam Block 569.95 1030 13.97 78.68 67.00 17.50 0.17
16. Nanguneri 224.52 1034 5.69 79.93 71.42 18.80 0.20
17. Kalakadu 255.73 1034 15.52 81.47 73.97 16.09 0.39
18. Vallioor 371.07 1023 6.77 82.08 75.81 14.39 0.47
19. Radhapuram 328.61 1032 25.76 81.21 75.85 13.36 1.08
District Average 451.00 1023 12.97 78.97 67.12 18.51 0.33
Source: Census of India 2011.
*Entire population of Tirunelveli Corporation included in MANUR Block.
5
2. CLIMATE AND RAINFALL
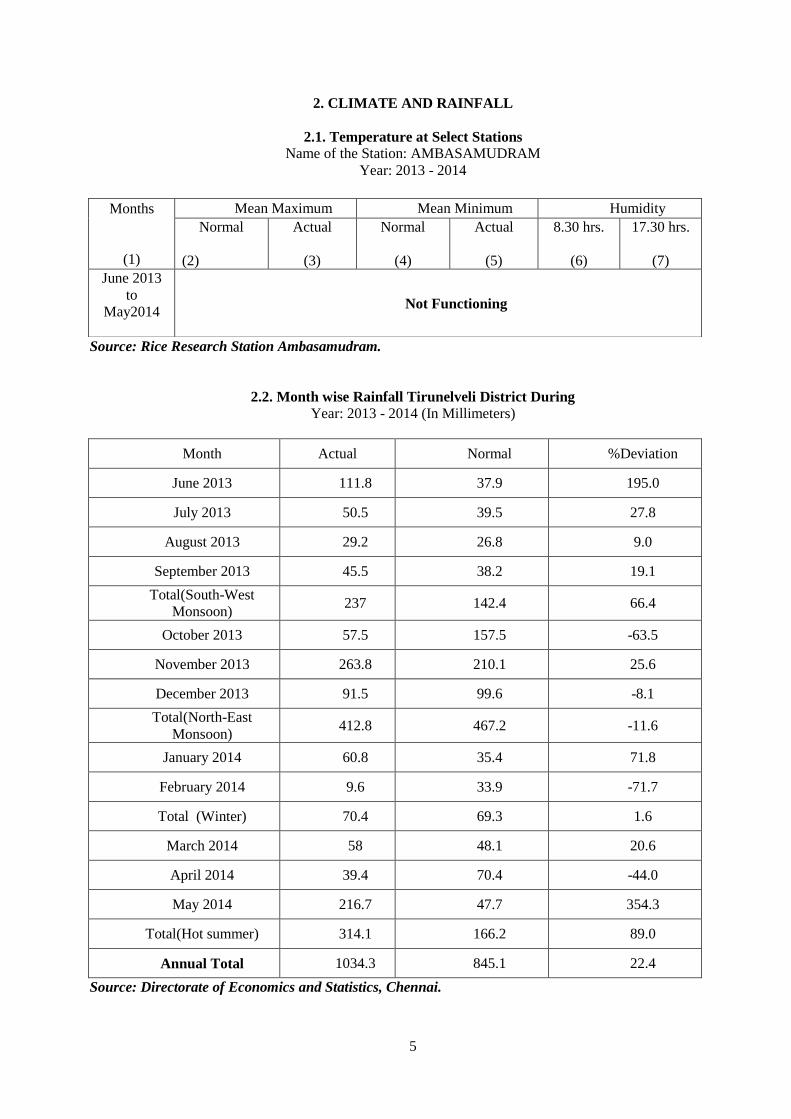
2.1. Temperature at Select Stations
Name of the Station: AMBASAMUDRAM
Year: 2013 - 2014
Source: Rice Research Station Ambasamudram.
2.2. Month wise Rainfall Tirunelveli District During
Year: 2013 - 2014 (In Millimeters)
Month Actual Normal %Deviation
June 2013 111.8 37.9 195.0
July 2013 50.5 39.5 27.8
August 2013 29.2 26.8 9.0
September 2013 45.5 38.2 19.1
Total(South-West
Monsoon) 237 142.4 66.4
October 2013 57.5 157.5 -63.5
November 2013 263.8 210.1 25.6
December 2013 91.5 99.6 -8.1
Total(North-East
Monsoon) 412.8 467.2 -11.6
January 2014 60.8 35.4 71.8
February 2014 9.6 33.9 -71.7
Total (Winter) 70.4 69.3 1.6
March 2014 58 48.1 20.6
April 2014 39.4 70.4 -44.0
May 2014 216.7 47.7 354.3
Total(Hot summer) 314.1 166.2 89.0
Annual Total 1034.3 845.1 22.4
Source: Directorate of Economics and Statistics, Chennai.
Months
(1)
Mean Maximum Mean Minimum Humidity
Normal
(2)
Actual
(3)
Normal
(4)
Actual
(5)
8.30 hrs.
(6)
17.30 hrs.
(7)
June 2013
to
May2014
Not Functioning

6
2.3. Time Series Data of Rainfall by Seasons (Last 5 Years)
Year: 2009 - 2010 to 2013 - 2014
Year
South West
Monsoon
North East
Monsoon
Winter
Season
Hot Weather
Season Total
Deviatio
n
(+ or
– or =)
from
Normal
No
rmal
Act
ual
No
rmal
Act
ual
No
rmal
Act
ual
No
rmal
Act
ual
No
rmal
Act
ual
2009-
2010 92.6 127.3 429.8 653.4 72.6 36 141.9 84.4 736.9 901.1 +22.3
2010-
2011 92.6 189.6 429.8 555.8 69.3 74.5 166.2 127.7 757.9 947.6 +25.0
2011-
2012 142.4 107.7 467.2 639.9 69.3 70.7 166.2 100.7 845.1 919.0 +8.8
2012-
2013 142.2 36.9 467.2 515.8 69.3 98.9 166.2 16.7 844.9 668.3 -20.9
2013-
2014 142.4 237 467.2 412.8 69.3 70.4 166.2 314.1 845.1 1034.3 22.4
Source: Directorate of Economics and Statistics, Chennai.
3. AGRICULTURE
3.1. Soil Classification
Year 2013 - 2014
Sl. No.
(1)
Type of Soil
(2)
Places in District
(3)
1. Red Loam Tenkasi,Shencottah,sivagiri,Rathapuram,
Alangulam,V.K.puthur
2. Lateritic Soil NiL
3. Black Soil Sankarankoil,Melaneelithnallur,Kuruvikulam,
Palayamkottai,Manur
4. Sandy Coastal Alluviam Nil
5. Red Sandy Soil Nil
Source: Directorate of Economics and Statistics, Chennai (Hand Book of Tamilnadu).

7
3.2. Land Utilization
(Area in Hectares)
Year: 2013 - 2014
Sl. No.
(1)
Land Classification
(2)
2012-2013
(4)
2013-2014
(4)
1. Forest 127758 127758
2. Barren and Uncultivable waste 29682 29682
3. Land put to Non-Agricultural uses 103136 103148
4. Cultivable Waste 35631 35319
5. Permanent Pastures and Other Grazing Land 5156 5156
6. Land Under Miscellaneous Tree Crops and Groves
not included in Net Area Sown 8376 8446
7. Current Fallow 58138 42064
8. Other Fallow Land 179921 190778
9. Net Area Sown 128052 133501
10. Geographical Area According to Village Papers 675850 675850
11. Total Cropped Area 136984 162144
12. Area sown more than once 8932 28643
Source: „G‟ Return Fasli 1423.
8
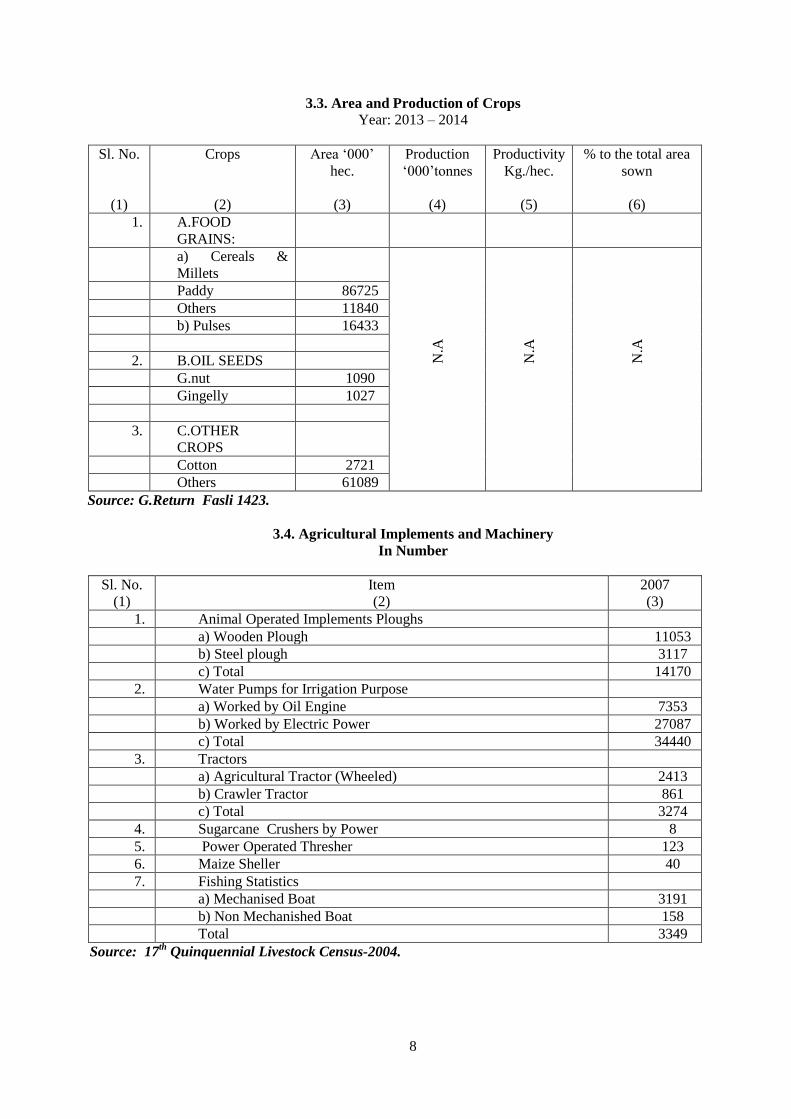
3.3. Area and Production of Crops
Year: 2013 – 2014
Sl. No.
(1)
Crops
(2)
Area ‘000’
hec.
(3)
Production
‘000’tonnes
(4)
Productivity
Kg./hec.
(5)
% to the total area
sown
(6)
1. A.FOOD
GRAINS:
a) Cereals &
Millets
N.A
N.A
N.A
Paddy 86725
Others 11840
b) Pulses 16433
2. B.OIL SEEDS
G.nut 1090
Gingelly 1027
3. C.OTHER
CROPS
Cotton 2721
Others 61089
Source: G.Return Fasli 1423.
3.4. Agricultural Implements and Machinery
In Number
Sl. No.
(1)
Item
(2)
2007
(3)
1. Animal Operated Implements Ploughs
a) Wooden Plough 11053
b) Steel plough 3117
c) Total 14170
2. Water Pumps for Irrigation Purpose
a) Worked by Oil Engine 7353
b) Worked by Electric Power 27087
c) Total 34440
3. Tractors
a) Agricultural Tractor (Wheeled) 2413
b) Crawler Tractor 861
c) Total 3274
4. Sugarcane Crushers by Power 8
5. Power Operated Thresher 123
6. Maize Sheller 40
7. Fishing Statistics
a) Mechanised Boat 3191
b) Non Mechanished Boat 158
Total 3349
Source: 17th
Quinquennial Livestock Census-2004.

9
3.5. Number and Area of Operational Land Holdings
Size Class
of holdings
(Hectares)
No. of Operational
holdings Area operated in hec.
(1) Individual
(2)
Joint
(3)
Institution
(4)
Total
(5)
Individual
(6)
Joint
(7)
Institution
(8)
Total
(9)
< 0.5 193633 0 385 194018 44280.18 0.00 93.16 44373.34
0.5-1.0 48457 0 114 48571 33811.60 0.00 79.40 33891.00
1.0-2.0 30716 0 83 30799 42485.94 0.00 115.95 42601.89
2.0-3.0 9616 0 49 9665 23272.03 0.00 118.63 23390.66
3.0-4.0 4169 0 34 4203 14332.06 0.00 122.50 14454.56
4.0-5.0 2065 0 13 2078 9160.54 0.00 59.68 9220.22
5.0-7.5 2053 0 34 2087 12359.29 0.00 211.36 12570.65
7.5-10.0 777 0 23 800 6699.76 0.00 199.25 6899.01
10.0-20.0 674 0 50 724 9211.65 0.00 701.60 9913.25
20.0 &
above 192 0 100 292 6554.73 0.00 7891.92 14446.65
Total 292352 0 885 293237 202167.78 0.00 9593.45 211761.23
Source: Agricultural Census-2010-11.
3.6. Consumption of Chemical Fertilisers and Pesticides
Year: 2013 – 2014
Fertilizers (in ‘000’ Tonne) Pesticides (K.gs.)
Urea
‘000’ Tonne
(7)
Nitrogenous
(N)
(1)
Phosphatic
(P2 05)
(2)
Pottassic
(K2 0)
(3)
Total
(NPK)
(4)
Dust
(5)
Liquid
(6)
38.176 7.240 6.920 52.336 51764 80740 31.470
Source: Joint Director of Agriculture Tirunelveli -2.

10
3.7. Regulated Markets
Year: 2013 - 2014
Sl. No.
Name of Regulated Markets
Name of Sub
Regulated
Markets
Quantity arrivals
(‘in M.T.’)
Receipts
(Rs.in Lakhs)
1. Sankarankovil - 5765 43.00
2. Tenkasi - 3895 18.00
3. Ambasamuthiram - 9132 30.00
4. Valliyoor - 4666 20.00
5. Tirunelveli - 8560 48.00
6. Pavoorsathiram - 3690 10.00
7. Kadayanallur - 3670 11.00
8. Thesayanvelai - 2650 12.00
9. Thiruvengadam - 2330 7.00
10. Sivagiri - 610 4.50
11. Alangulam - 4100 17.30
Total 49068 220.80
Source: Secretary District Agriculture Marketing Committee Office Tirunelveli-2.
3.8. Crop Insurance Scheme for the Fasli
Year: 2013 - 2014
Sl.
No. Name of the Crop
No of Blocks
notified
Premium
collected
No. of
Beneficiaries
Amount
Sanctioned (in
Rs.)
1. Paddy I 19 9475 25 379000
2. Paddy II 19 422271 2666 40006310
3. Maize 4 415330 419 6922150
4. Ground Nut 5 0 0 0
5. Cotton 6 0 0 0
6. Sugarcane 4 0 0 0
7. Plantain 14 144717 201 4338867
8. Onion 5 0 0 0
9. Tapioca 1 0 0 0
10. Sunflower 19 0 0 0
11. cumbu 0 0 0 0
12. Cholam 1 0 0 0
13. Ragi 0 0 0 0
14. Blackgram 7 3828 7 39830
15. Greengram 4 0 0 0
16. Horsegram 0 0 0 0
17. Chillies 6 1738 1 39680
18. Paddy III 1 0 0 0
19. Seasamum 1 0 0 0
Total 997359 3319 51725837
Source: J.R. Co – operative, Tirunelveli – 2.

11
3.9. Sericulture
Year: 2013 - 2014
Sl.
No.
Name of the block
(1)
Area under
Mulberry
(in Acre)
(2)
Production of
Cocoons (in
Kg)
(3)
Value in Rupees
(4)
1. Tenkasi 77.25 14960.0 3366450
2. Kadayanallur 235.25 43724.8 9838080
3. Sankarankoil. 0 0 0
4. Vasudevanallur 149 17098.0 3847185
5. Kuruvikulam 89.0 16770.1 389900
6. Alangulam 140 18260.0 4143900
7. Kadayam 68.50 8334.5 2052650
8. Ambasamudram 62.00 4345.4 1875262
9. Nanguneri 00 0 0
10. Palayamkottai 00 0 0
11. Pappakudi 60.75 4412.0 978000
12. Keelapavoor 280.50 45870.0 10295875
13. Kalakadu 00 0 0
14. Cheranmahadevi 00 0 0
15. Melaneelithanallur 62.00 12201.4 278900
16. Shenkottai 90.00 16110.0 3648890
17. Radhapuram 00 0 0
18. Manur 56.00 8345.0 187944
19. Valliyoor 00 0 0
Total 1370.25 210431.2 44739870
Source: Assistant Director of Sericulture - Tenkasi.
12
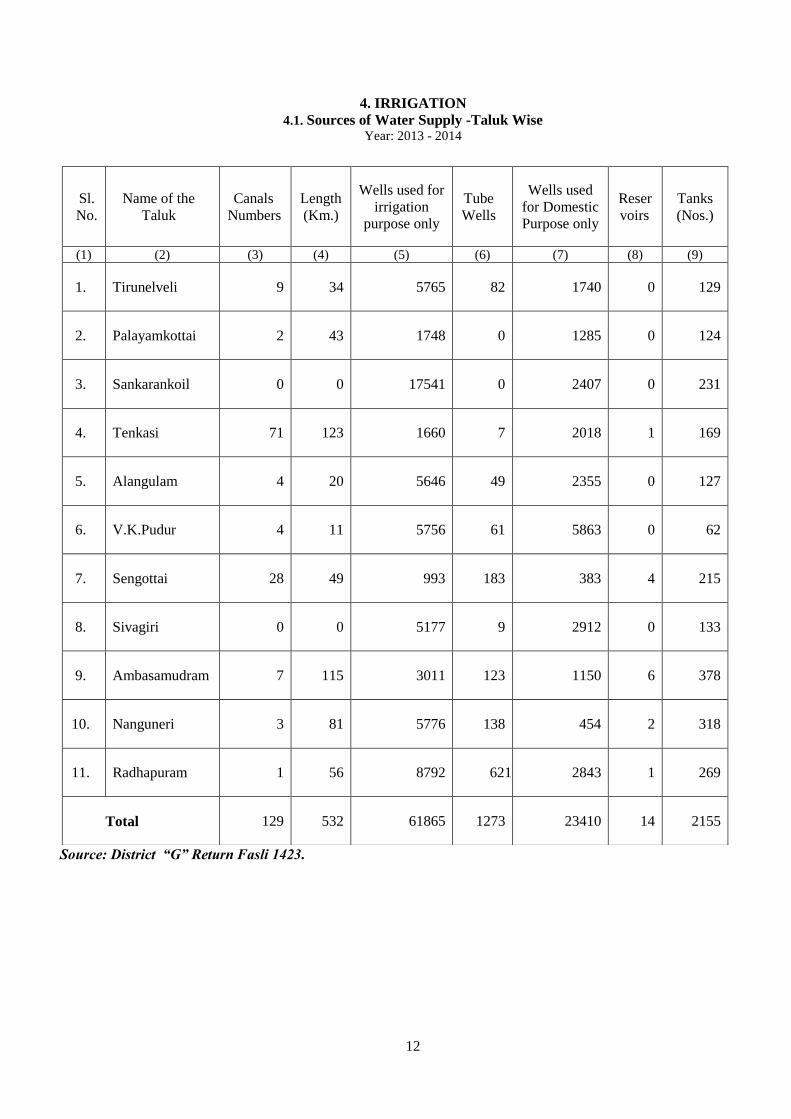
4. IRRIGATION
4.1. Sources of Water Supply -Taluk Wise
Year: 2013 - 2014
Source: District “G” Return Fasli 1423.
Sl.
No.
Name of the
Taluk
Canals
Numbers
Length
(Km.)
Wells used for
irrigation
purpose only
Tube
Wells
Wells used
for Domestic
Purpose only
Reser
voirs
Tanks
(Nos.)
(1) (2) (3) (4) (5) (6) (7) (8) (9)
1. Tirunelveli 9 34 5765 82 1740 0 129
2. Palayamkottai 2 43 1748 0 1285 0 124
3. Sankarankoil 0 0 17541 0 2407 0 231
4. Tenkasi 71 123 1660 7 2018 1 169
5. Alangulam 4 20 5646 49 2355 0 127
6. V.K.Pudur 4 11 5756 61 5863 0 62
7. Sengottai 28 49 993 183 383 4 215
8. Sivagiri 0 0 5177 9 2912 0 133
9. Ambasamudram 7 115 3011 123 1150 6 378
10. Nanguneri 3 81 5776 138 454 2 318
11. Radhapuram 1 56 8792 621 2843 1 269
Total 129 532 61865 1273 23410 14 2155
13
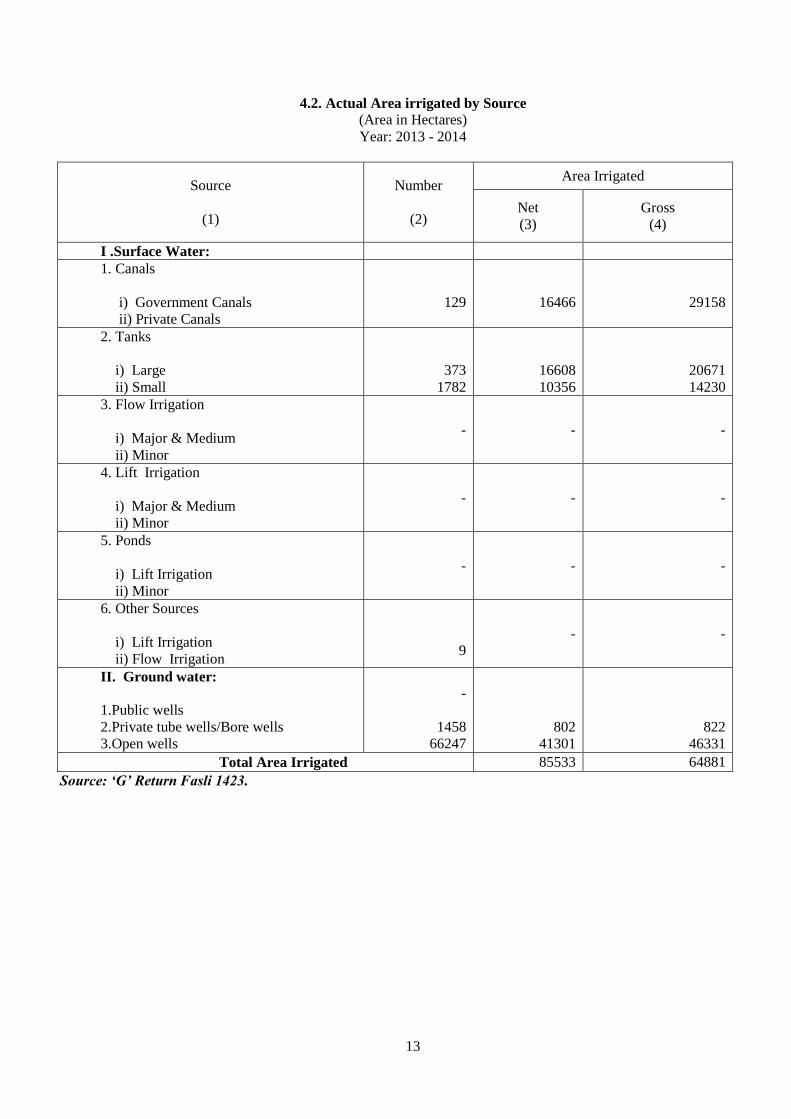
4.2. Actual Area irrigated by Source
(Area in Hectares)
Year: 2013 - 2014
Source
(1)
Number
(2)
Area Irrigated
Net
(3)
Gross
(4)
I .Surface Water:
1. Canals
i) Government Canals
ii) Private Canals
129
16466
29158
2. Tanks
i) Large
ii) Small
373
1782
16608
10356
20671
14230
3. Flow Irrigation
i) Major & Medium
ii) Minor
- - -
4. Lift Irrigation
i) Major & Medium
ii) Minor
- - -
5. Ponds
i) Lift Irrigation
ii) Minor
- - -
6. Other Sources
i) Lift Irrigation
ii) Flow Irrigation
9
- -
II. Ground water:
1.Public wells
2.Private tube wells/Bore wells
3.Open wells
-
1458
66247
802
41301
822
46331
Total Area Irrigated 85533 64881
Source: „G‟ Return Fasli 1423.
14
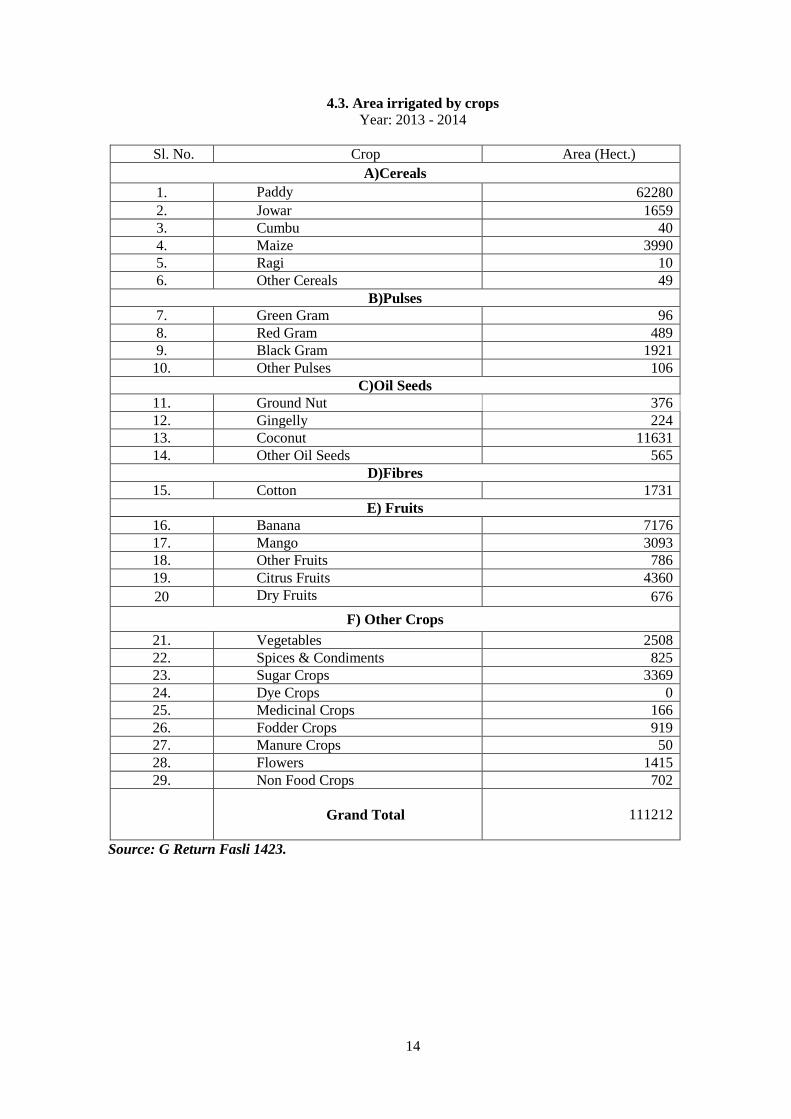
4.3. Area irrigated by crops
Year: 2013 - 2014
Sl. No. Crop Area (Hect.)
A)Cereals
1. Paddy 62280
2. Jowar 1659
3. Cumbu 40
4. Maize 3990
5. Ragi 10
6. Other Cereals 49
B)Pulses
7. Green Gram 96
8. Red Gram 489
9. Black Gram 1921
10. Other Pulses 106
C)Oil Seeds
11. Ground Nut 376
12. Gingelly 224
13. Coconut 11631
14. Other Oil Seeds 565
D)Fibres
15. Cotton 1731
E) Fruits
16. Banana 7176
17. Mango 3093
18. Other Fruits 786
19. Citrus Fruits 4360
20 Dry Fruits 676
F) Other Crops
21. Vegetables 2508
22. Spices & Condiments 825
23. Sugar Crops 3369
24. Dye Crops 0
25. Medicinal Crops 166
26. Fodder Crops 919
27. Manure Crops 50
28. Flowers 1415
29. Non Food Crops 702
Grand Total
111212
Source: G Return Fasli 1423.

15
4.4. Details of Dams, Tanks, Wells and Bore Wells
Year: 2013 – 2014
Source : PWD , EB, & G. Return.
Sl.
No. Name of reservoir
Yea
r of
Co
nst
ruct
ion
Cat
chm
ent
area
(in
Sq.K
.m
Wat
er s
pre
ad a
rea
at F
RL
(i
n S
q.k
m)
Max
imum
Hei
ght
in
Met
res
Cap
acit
y a
t F
RL
in M
CM
-No
. o
f T
ank
s
No
. o
f B
ore
wel
ls
1. Mamimuthar 1958 161.61 9.40 45.72 156.07 - -
2. Gatana 1974 46.46 0.80 32.92 9.97 - -
3. Ramanadhi 1974 16.58 0.39 31.09 4.30 - -
4. Karuppanadhi 1977 29.34 0.50 34.44 5.24 - -
5. Gundar 1983 9.92 0.21 14.66 0.71 - -
6. Adavainainarkoil 2003 15.54 0.35 47.20 4.93 - -
7. Vadakku Pachiyar 2003 35.09 1.85 20.10 12.51 - -
8. Kodumudiyar 2003 24.86 0.53 28.00 3.45 - -
9. Nambiar 2000 187.06 1.52 10.84 2.33 - -
10. Papanasam 1942 149.03 2.24 66.0 156 - -
11. Servalur 1986 110 - 51.34 34.69 - -
12. Tanks - - - - - 2155 -
13. Tube wells & Bore
wells - - - - - - -

16
5. ANIMAL HUSBANDARY
5.1. Livestock Population
Sl. No. Classification Numbers
1.
2.
3.
4.
5.
6.
7.
8.
9.
10.
1.
2.
3.
4.
I. Live Stock
Cattle
i) Male
ii) Female
Total
Buffaloes
i) Male
ii) Female
Total
Bovines
i) Male
ii) Female
Total
Sheep
Goats
Horses and Ponies
Pigs
Rabbits
Camels
Donkeys
Domestic Dogs & others
94481
324213
418694
15930
62847
78777
110411
387060
497471
487273
390570
245
12752
2401
-
961
67877
Total Livestock 1957021
II. POULTRY Fowls
Ducks, Drakes& Duckling
Turkeys
Others
1205376
9095
2168
1944
Total Poultry 1218583
Source: 17th
Livestock Census 2004.
17
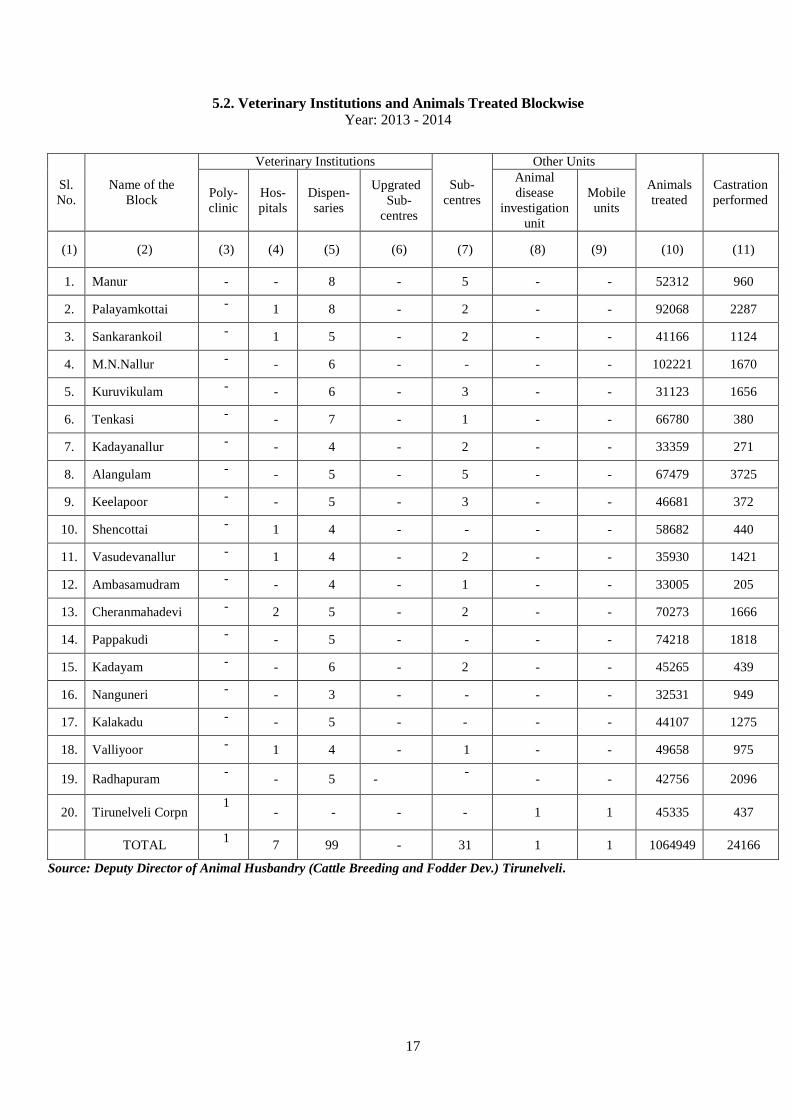
5.2. Veterinary Institutions and Animals Treated Blockwise
Year: 2013 - 2014
Source: Deputy Director of Animal Husbandry (Cattle Breeding and Fodder Dev.) Tirunelveli.
Sl.
No.
Name of the
Block
Veterinary Institutions
Sub-
centres
Other Units
Animals
treated
Castration
performed Poly-
clinic
Hos-
pitals
Dispen-
saries
Upgrated
Sub-
centres
Animal
disease
investigation
unit
Mobile
units
(1) (2) (3) (4) (5) (6) (7) (8) (9) (10) (11)
1. Manur - - 8 - 5 - - 52312 960
2. Palayamkottai - 1 8 - 2 - - 92068 2287
3. Sankarankoil - 1 5 - 2 - - 41166 1124
4. M.N.Nallur - - 6 - - - - 102221 1670
5. Kuruvikulam - - 6 - 3 - - 31123 1656
6. Tenkasi - - 7 - 1 - - 66780 380
7. Kadayanallur - - 4 - 2 - - 33359 271
8. Alangulam - - 5 - 5 - - 67479 3725
9. Keelapoor - - 5 - 3 - - 46681 372
10. Shencottai - 1 4 - - - - 58682 440
11. Vasudevanallur - 1 4 - 2 - - 35930 1421
12. Ambasamudram - - 4 - 1 - - 33005 205
13. Cheranmahadevi - 2 5 - 2 - - 70273 1666
14. Pappakudi - - 5 - - - - 74218 1818
15. Kadayam - - 6 - 2 - - 45265 439
16. Nanguneri - - 3 - - - - 32531 949
17. Kalakadu - - 5 - - - - 44107 1275
18. Valliyoor - 1 4 - 1 - - 49658 975
19. Radhapuram -
- 5 - -
- - 42756 2096
20. Tirunelveli Corpn 1
- - - - 1 1 45335 437
TOTAL 1
7 99 - 31 1 1 1064949 24166

18
5.3. Number of Veterinary Hospitals
Year: 2013 - 2014
Sl. No.
Name of the Block
Number of
Government Hospitals
Private
Hospitals
VH Mobile
Unit VD RVD SC Total
(1) (2) (3) (4)
1. Manur - - 8 1 5 14 -
2. Palayamkottai 1 1 3 1 1 6 -
3. Sankarankoil 1 - 4 1 2 8 -
4. Melaneelithanallur - - 5 1 - 6 -
5. Kuruvikulam - - 4 1 3 8 -
6. Tenkasi - - 6 1 1 8 -
7. Kadayanallur - - 3 1 2 6 -
8. Alangulam - - 4 1 5 10 -
9. Keelappavur - - 4 1 3 8 -
10. Shencottai 1 - 3 1 - 5 -
11. Vasudevanallur 1 - 3 1 2 7 -
12. Ambasamudram - - 3 1 1 5 -
13. Cheranmahadevi 2 - 4 1 2 9 -
14. Pappakudi - - 4 1 - 5 -
15. Kadayam - - 5 1 2 8 -
16. Naguneri - - 2 1 - 3 -
17. Kalakadu - - 4 1 - 5 -
18. Valliyur 1 - 3 1 1 6 -
19. Radhapuram - - 4 1 - 5 -
20. Tirunelveli Corporation
(Poly Clinic) 1 - 4 1 6
-
Source: Deputy Director of Animal Husbandry (Cattle Breeding and Fodder Dev.) Tirunelveli.
19
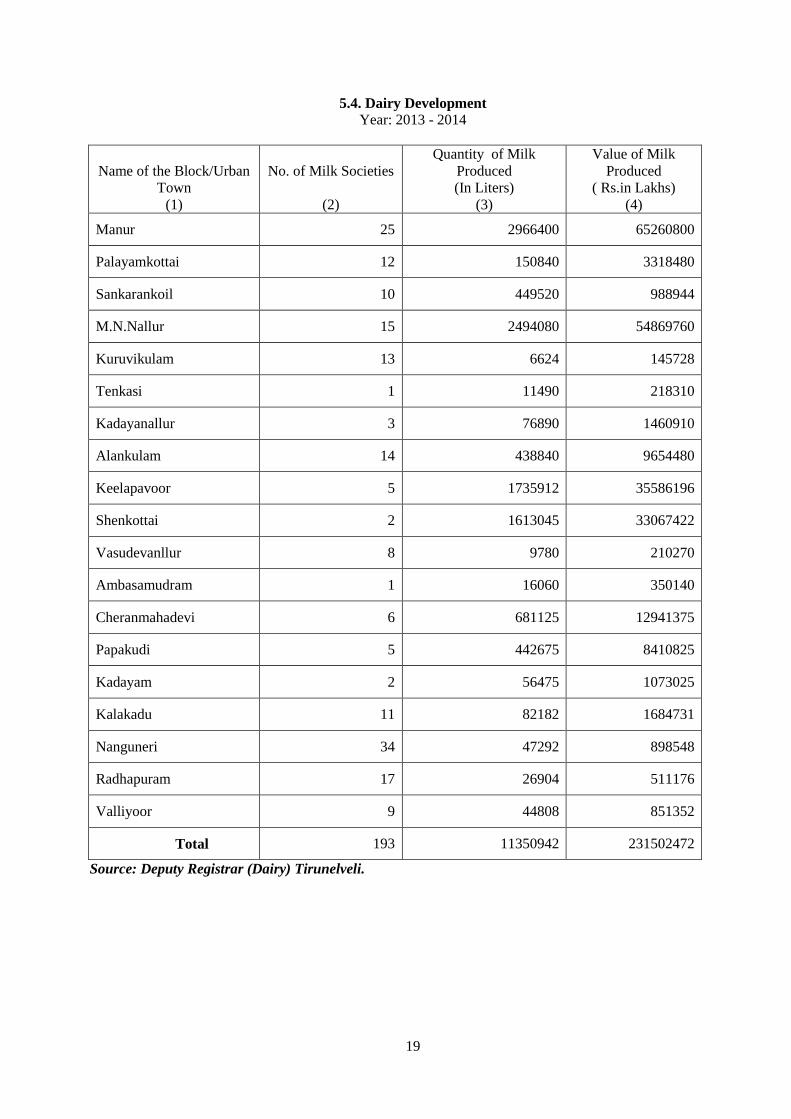
5.4. Dairy Development
Year: 2013 - 2014
Name of the Block/Urban
Town
(1)
No. of Milk Societies
(2)
Quantity of Milk
Produced
(In Liters)
(3)
Value of Milk
Produced
( Rs.in Lakhs)
(4)
Manur 25 2966400 65260800
Palayamkottai 12 150840 3318480
Sankarankoil 10 449520 988944
M.N.Nallur 15 2494080 54869760
Kuruvikulam 13 6624 145728
Tenkasi 1 11490 218310
Kadayanallur 3 76890 1460910
Alankulam 14 438840 9654480
Keelapavoor 5 1735912 35586196
Shenkottai 2 1613045 33067422
Vasudevanllur 8 9780 210270
Ambasamudram 1 16060 350140
Cheranmahadevi 6 681125 12941375
Papakudi 5 442675 8410825
Kadayam 2 56475 1073025
Kalakadu 11 82182 1684731
Nanguneri 34 47292 898548
Radhapuram 17 26904 511176
Valliyoor 9 44808 851352
Total 193 11350942 231502472
Source: Deputy Registrar (Dairy) Tirunelveli.

20
5.5. Poultry Development
Year: 2013 - 2014
Sl.No. Name of the Block Broiler (No’s) Layer (No’s)
1. Manur - 568
2. Palayamkottai - -
3. Sankarankoil - -
4. Melaneelithanallur - -
5. Kuruvikulam - -
6. Tenkasi - -
7. Kadayanallur - -
8. Alangulam - -
9. Keelappavur - -
10. Shencottai - -
11. Vasudevanallur - -
12. Ambasamuthram - -
13. Cheranmahadevi - -
14. Papakudi - -
15. Kadayam - -
16. Nanguneri - -
17. Kalakadu - -
18. Valliyoor - -
19. Radhapuram - -
Total - 568
Source: Deputy Director of Animal Husbandry Cattle Breeding & Fodder Development, Tirunelveli
& Private farms.
5.6. Fisheries Development and Production
Year: 2013 - 2014
Name and Address of
Fishing centres
Inland Fish Catch
(Tonne)
Marine Fish Catch
(Tonne)
Number of Fisherman
engaged
Inland Marine
Tirunelveli Dist.
Stocked variety -7.17 tons
Unstocked Variety -1.84
tons
- 6
Source: Assistant Director of Fisheries Tirunelveli and Radhapuram.
21
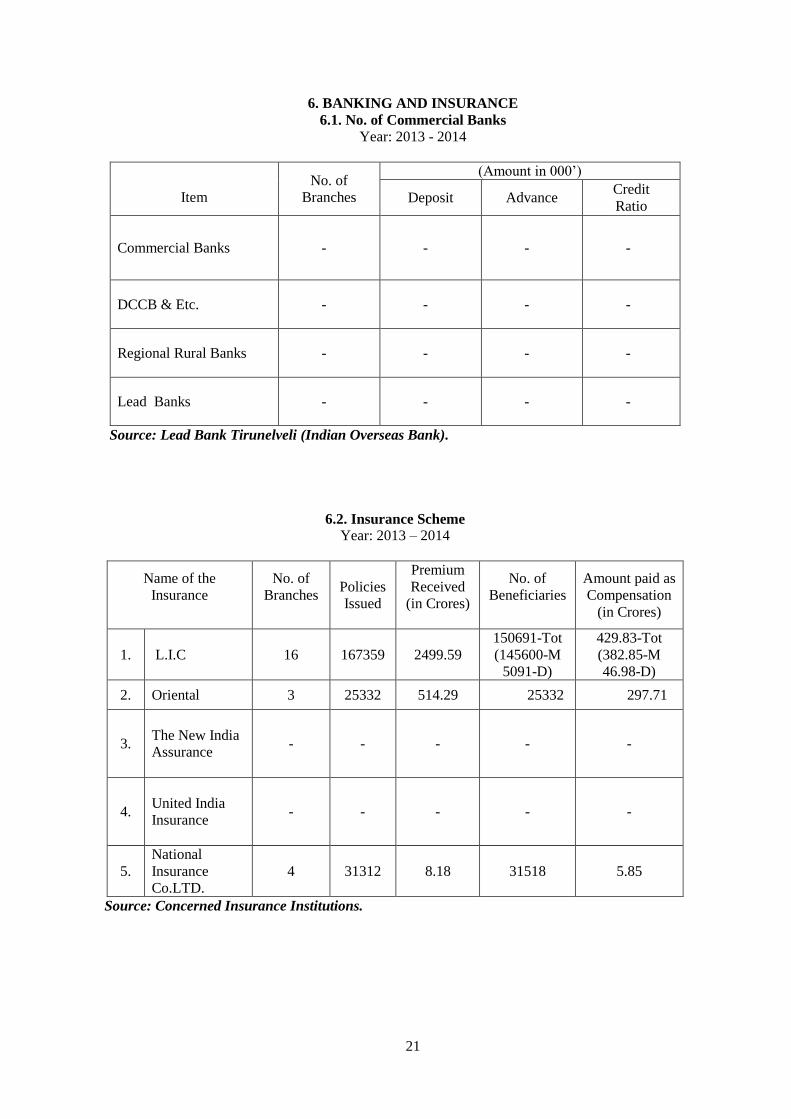
6. BANKING AND INSURANCE
6.1. No. of Commercial Banks
Year: 2013 - 2014
Item
No. of
Branches
(Amount in 000’)
Deposit Advance Credit
Ratio
Commercial Banks - - - -
DCCB & Etc. - - - -
Regional Rural Banks - - - -
Lead Banks - - - -
Source: Lead Bank Tirunelveli (Indian Overseas Bank).
6.2. Insurance Scheme
Year: 2013 – 2014
Name of the
Insurance
No. of
Branches
Policies
Issued
Premium
Received
(in Crores)
No. of
Beneficiaries
Amount paid as
Compensation
(in Crores)
1. L.I.C 16 167359 2499.59
150691-Tot
(145600-M
5091-D)
429.83-Tot
(382.85-M
46.98-D)
2. Oriental 3 25332 514.29 25332 297.71
3.
The New India
Assurance
- - - - -
4.
United India
Insurance
- - - - -
5.
National
Insurance
Co.LTD.
4 31312 8.18 31518 5.85
Source: Concerned Insurance Institutions.
22
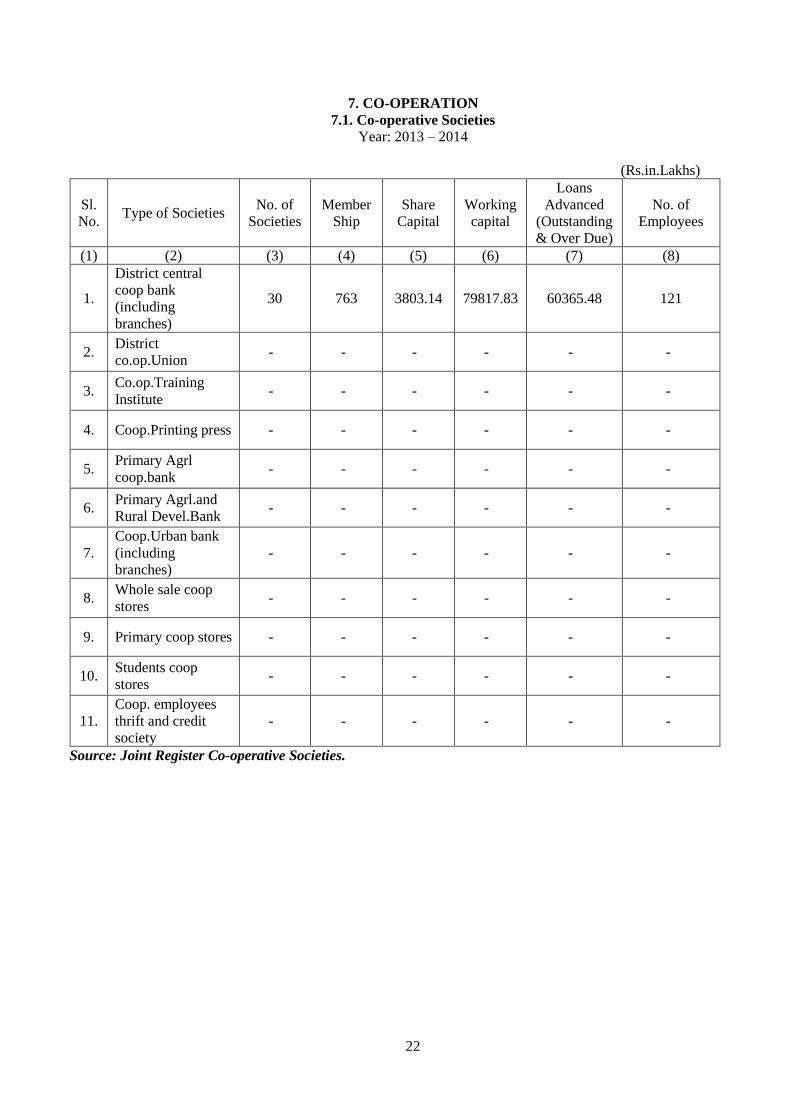
7. CO-OPERATION
7.1. Co-operative Societies
Year: 2013 – 2014
(Rs.in.Lakhs)
Sl.
No. Type of Societies
No. of
Societies
Member
Ship
Share
Capital
Working
capital
Loans
Advanced
(Outstanding
& Over Due)
No. of
Employees
(1) (2) (3) (4) (5) (6) (7) (8)
1.
District central
coop bank
(including
branches)
30 763 3803.14 79817.83 60365.48 121
2. District
co.op.Union - - - - - -
3. Co.op.Training
Institute - - - - - -
4. Coop.Printing press - - - - - -
5. Primary Agrl
coop.bank - - - - - -
6. Primary Agrl.and
Rural Devel.Bank - - - - - -
7.
Coop.Urban bank
(including
branches)
- - - - - -
8. Whole sale coop
stores - - - - - -
9. Primary coop stores - - - - - -
10. Students coop
stores - - - - - -
11.
Coop. employees
thrift and credit
society
- - - - - -
Source: Joint Register Co-operative Societies.

23
8. CIVIL SUPPLIES
8.1. No. of Fair Price Shops
Year: 2013 - 2014
Sl. No. Name of the Taluk No. of Shops Part Time Shop Total
1. Tiunelveli 128 36 164
2. Palayamcottai 121 10 131
3. Sankarankoil 132 64 196
4. Tenkasi 110 35 145
5. Shencottah 36 14 50
6. Sivagiri 63 18 81
7. Ambasamudhram 143 47 190
8. Radhapuram 91 84 175
9. Nanguneri 87 41 128
10. Alangulam 51 32 83
11. Veerakeralampudur 37 24 61
District Total 999 405 1404
Source: District Supply Officer Tirunelveli.

24
8.2. Quantum of Essential Commodities Distributed and their Retail Prices
Year: 2013 - 2014
Sl.
No.
Name of
the
Commodity
Issued
Price per
(Kg.) Scale of Supply
1. Rice
Free of
Cost
1.0 Unit -12kg
1.5 Unit - 14kg
2.0 Unit - 16kg
2.5 Unit - 18kg
3.0 and above - 20kg
AAY Card -35Kg.
2.
Wheat
Rs.7.50
Corporation Area & Dist H.Qrs - 10kg per card
Other areas - 5kg per card
3.
Sugar
Rs.13.50
1 member - 1/2kg
2 member - 1 kg
3 member -1 1/2kg
4 & above -2kg
Option Sugar-Additional 3Kg.
4. Palm Oil Rs.25 1 litre
5. Sooji Rs.17 1 Kg
6. Maida Rs.16 1kg
7. Kerosene
Rs 13.80
to 14.10
(Varies
in
Hill
station/
Distance)
Location No LPG
Cylinder
One
LPG
Cylinder
Two LPG
Cylinder
Dist H.Qrs./
Corporation
10
Litres
3 Litres NIL
Municipal Area 6 Litres 3 Litres NIL
Town Panchayat
Area
5 Litres 3 Litres
Village Panchayat
Area
3 Litres 3 Litres Nil
8.
Others 1.Ooty Tea
2.Iodised
Salt
3.Redgram
Dhal
4.Urid Dhal
Rs.15
Rs.3.50
Rs.30.00
Rs.30.00
(100gram) No Limit
(Per1 K.g) No Limit
(1 Kg per family)
(1 Kg per family)
Source: District Supply Officer Tirunelveli.
25
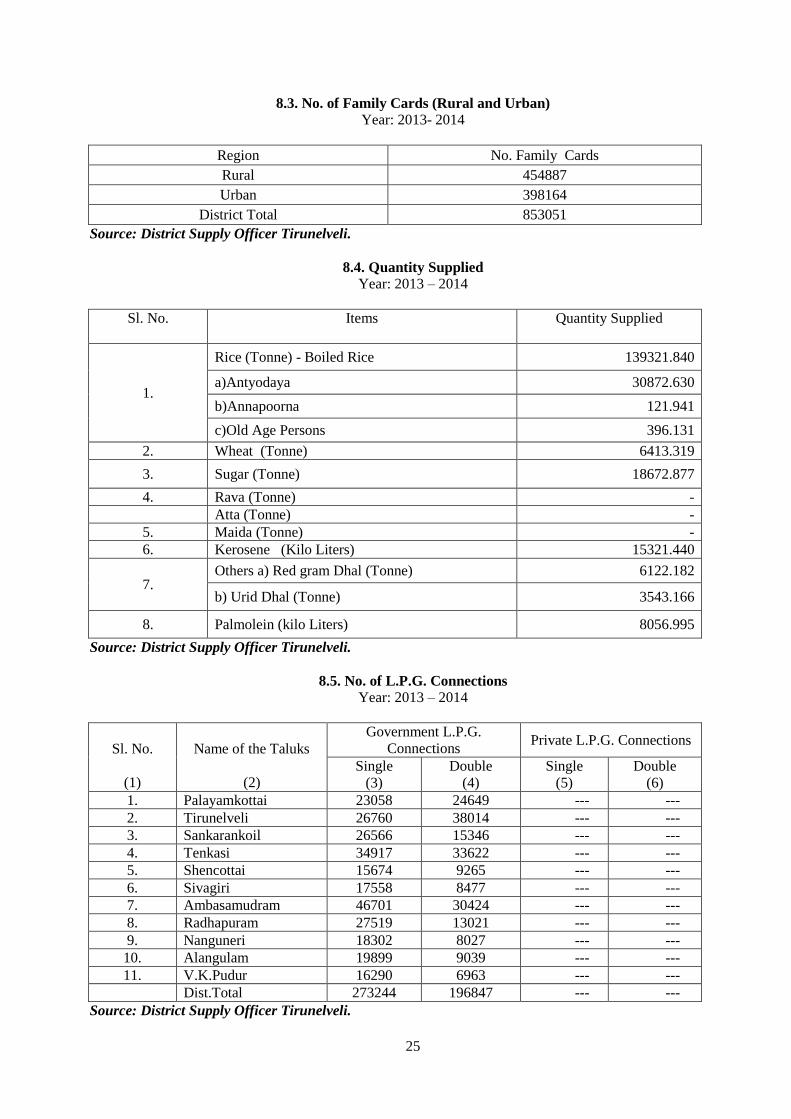
8.3. No. of Family Cards (Rural and Urban)
Year: 2013- 2014
Region No. Family Cards
Rural 454887
Urban 398164
District Total 853051
Source: District Supply Officer Tirunelveli.
8.4. Quantity Supplied
Year: 2013 – 2014
Sl. No. Items Quantity Supplied
1.
Rice (Tonne) - Boiled Rice 139321.840
a)Antyodaya 30872.630
b)Annapoorna 121.941
c)Old Age Persons 396.131
2. Wheat (Tonne) 6413.319
3. Sugar (Tonne) 18672.877
4. Rava (Tonne) -
Atta (Tonne) -
5. Maida (Tonne) -
6. Kerosene (Kilo Liters) 15321.440
7. Others a) Red gram Dhal (Tonne) 6122.182
b) Urid Dhal (Tonne) 3543.166
8. Palmolein (kilo Liters) 8056.995
Source: District Supply Officer Tirunelveli.
8.5. No. of L.P.G. Connections
Year: 2013 – 2014
Sl. No.
(1)
Name of the Taluks
(2)
Government L.P.G.
Connections Private L.P.G. Connections
Single
(3)
Double
(4)
Single
(5)
Double
(6)
1. Palayamkottai 23058 24649 --- ---
2. Tirunelveli 26760 38014 --- ---
3. Sankarankoil 26566 15346 --- ---
4. Tenkasi 34917 33622 --- ---
5. Shencottai 15674 9265 --- ---
6. Sivagiri 17558 8477 --- ---
7. Ambasamudram 46701 30424 --- ---
8. Radhapuram 27519 13021 --- ---
9. Nanguneri 18302 8027 --- ---
10. Alangulam 19899 9039 --- ---
11. V.K.Pudur 16290 6963 --- ---
Dist.Total 273244 196847 --- ---
Source: District Supply Officer Tirunelveli.
26
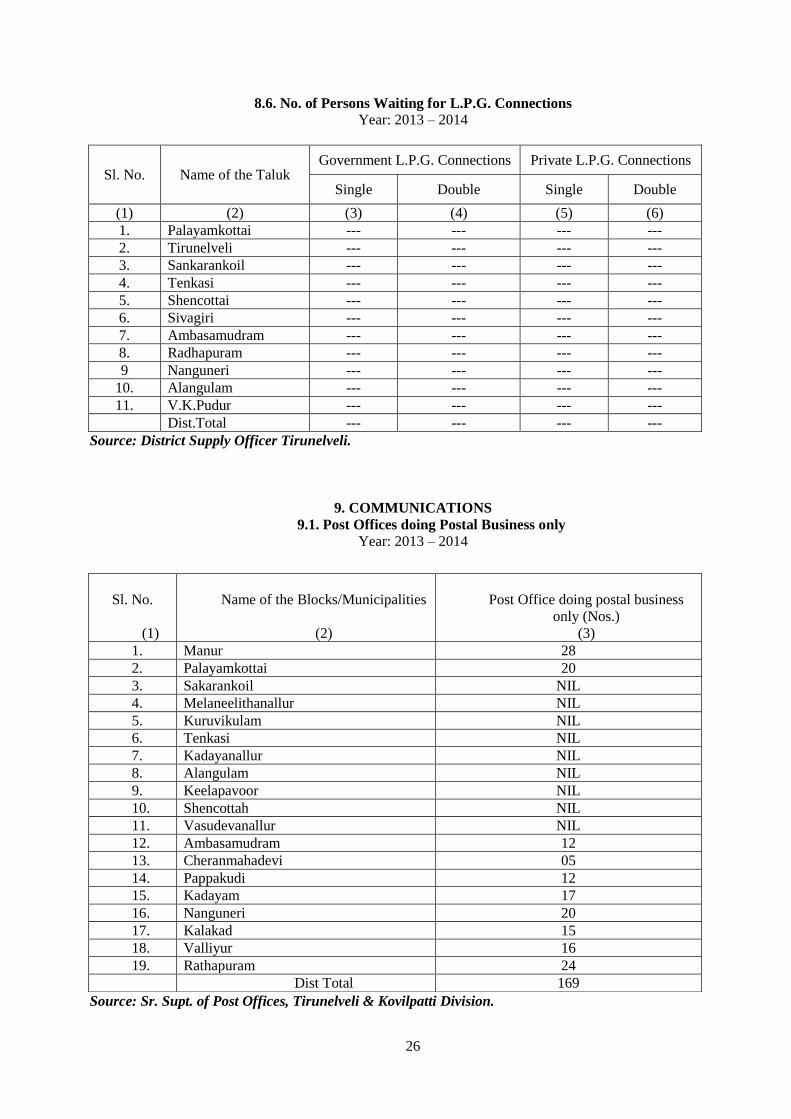
8.6. No. of Persons Waiting for L.P.G. Connections
Year: 2013 – 2014
Sl. No. Name of the Taluk Government L.P.G. Connections Private L.P.G. Connections
Single Double Single Double
(1) (2) (3) (4) (5) (6)
1. Palayamkottai --- --- --- ---
2. Tirunelveli --- --- --- ---
3. Sankarankoil --- --- --- ---
4. Tenkasi --- --- --- ---
5. Shencottai --- --- --- ---
6. Sivagiri --- --- --- ---
7. Ambasamudram --- --- --- ---
8. Radhapuram --- --- --- ---
9 Nanguneri --- --- --- ---
10. Alangulam --- --- --- ---
11. V.K.Pudur --- --- --- ---
Dist.Total --- --- --- ---
Source: District Supply Officer Tirunelveli.
9. COMMUNICATIONS
9.1. Post Offices doing Postal Business only
Year: 2013 – 2014
Source: Sr. Supt. of Post Offices, Tirunelveli & Kovilpatti Division.
Sl. No.
(1)
Name of the Blocks/Municipalities
(2)
Post Office doing postal business
only (Nos.)
(3)
1. Manur 28
2. Palayamkottai 20
3. Sakarankoil NIL
4. Melaneelithanallur NIL
5. Kuruvikulam NIL
6. Tenkasi NIL
7. Kadayanallur NIL
8. Alangulam NIL
9. Keelapavoor NIL
10. Shencottah NIL
11. Vasudevanallur NIL
12. Ambasamudram 12
13. Cheranmahadevi 05
14. Pappakudi 12
15. Kadayam 17
16. Nanguneri 20
17. Kalakad 15
18. Valliyur 16
19. Rathapuram 24
Dist Total 169

27
9.2. Post Office doing Telegraphic Business
Year: 2013 – 2014
Sl.No
(1)
Name of the Blocks/Municipalities
(2)
Post Office doing Post and Telegraphic
business (No’s)
(3)
1. Manur
NIL
2. Palayamkottair
3. Sankarankoil
4. Melaneelithanallur
5. Kuruvikulam
6. Tenkasi
7. Kadayanallur
8. Alankulam
9. Keelapavoor
10. Shencottah
11. Vasudevanallur
12. Ambasamudram
13. Cheranmahadevi
14. Pappakudi
15. Kadayam
16. Nanguneri
17. Kalakad
18. Valliyur
19. Rathapuram
Source: Sr. Supt. of Post Offices, Tirunelveli & Kovilpatti Division.

28
9.3. Telegraph Office
Year: 2013 – 2014
Sl. No
(1)
Name of the Blocks/Municipalities
(2)
No. of Telegraph
(3)
1. Manur (Central Telegraph Office,
Tirunelveli)
Nil
2. Palayamkottai
3. Sankarankoil
4. Melaneelithanallur
5. Kuruvikulam
6. Tenkasi
7. Kadayanallur
8. Alankulam
9. Keelapavoor
10. Shencottah
11. Vasudevanallur
12. Ambasamudram
13. Cheranmahadevi
14. Pappakudi
15. Kadayam
16. Nanguneri
17. Kalakad
18. Valliyur
19. Rathapuram
Total
Source: Sub Divisional Engineer, Customer Service Centre, BSNL, Tirunelveli.
9.4. No. of Telephone Exchanges, Capacity and No. in Use
Year: 2013-2014
Sl.No.
(1)
Item
(2)
Numbers
(3)
1. Number of Telephone Exchanges 84
2. Number of Equipped Capacity 143484
3. Number of Direct Exchange Lines 76870
4. Private Branch Exchange 31(PRI)
5. Extension -
6. Number of telephones (Extension) in use -
7. Number of Function Line -
Source: BSNL, Tirunelveli.
29
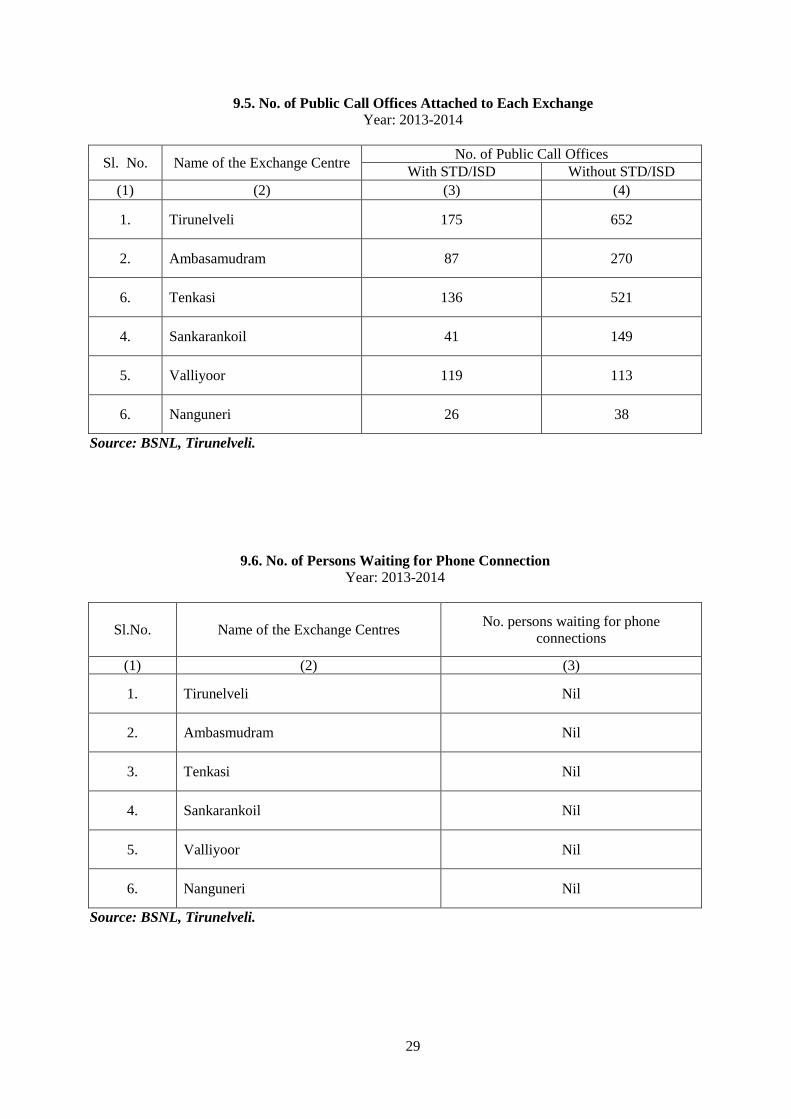
9.5. No. of Public Call Offices Attached to Each Exchange
Year: 2013-2014
Sl. No. Name of the Exchange Centre No. of Public Call Offices
With STD/ISD Without STD/ISD
(1) (2) (3) (4)
1. Tirunelveli 175 652
2. Ambasamudram 87 270
6. Tenkasi 136 521
4. Sankarankoil 41 149
5. Valliyoor 119 113
6. Nanguneri 26 38
Source: BSNL, Tirunelveli.
9.6. No. of Persons Waiting for Phone Connection
Year: 2013-2014
Sl.No. Name of the Exchange Centres No. persons waiting for phone
connections
(1) (2) (3)
1. Tirunelveli Nil
2. Ambasmudram Nil
3. Tenkasi Nil
4. Sankarankoil Nil
5. Valliyoor Nil
6. Nanguneri Nil
Source: BSNL, Tirunelveli.

30
10. ELECTRICITY
10.1. No. of Power Stations
Year: 2013-2014
Source: S.E., TNEB (Production Circle), Tirunelveli.
Sl.No
Name of the
Power Stations
Year of
Operation
Installed
Capacity (M.W.)
Generation
(M.U.)
Station
Consumption
(M.U.)
Net Unit
sent out
(M.U.)
1.
Papanasam Unit I 1944
4*8MW=32
MW 137.671 0.816 136.855
Papanasam Unit II 1944
Papanasam Unit
III 1945
Papanasam Unit
IV 1951
2. Servalar 1986 20 MW 50.130 0.101 50.029
3. Kodayar PH I 1970 60 MW 112.657 0.285 112.372
4. Kodayar PH II 1971 40 MW 46.240 0.266 45.972
5.
Periar Unit I 1958
2*42 MW
2*35 MW 454.372 1.704 452.668
Periar Unit II 1959
Periar Unit III 1959
Periar Unit VI 1965
6. Suruliyar 1978 35 MW 100.450 0.246 100.204
7. Vaigai Unit I 1990
2*3 MW 15.175 0.047 15.128 Vaigai Unit II 1990
8. Peruchani Unit I 2006
2*0.650 MW 0.977 0 0.977 Peruchani Unit II 2006
9.
Periyar Vaigai
SHEP I
Unit I 2011 2*2 MW 2.526 0 2.526
Unit II
10.
Periyar Vaigai
SHEP I
Unit I 2013 2*1.25 MW 6.160 0.042 6.118
Unit II

31
10.2. Quantum of Power Purchased
Year: 2013- 2014
Power purchased sectors name
Power purchased in M.U.
Sun Paper Mills Limited
Empee Sugar And Chemical Limited
---
---
Source: S.E., TNEB (Distribution Circle), Tirunelveli.
.
10.3. Power Consumption Sector wise
Year: 2013- 2014
Sl.No. Sectors Consumption (M.U) % of the
Consumption
1.
2.
3.
4.
5.
6.
7.
8.
Industries
Agriculture
Domestic
Commercial
Public lighting and Public Works
Sales to licensees
Sales to other States
Miscellaneous
80.12
0
766.59
146.63
89.01
0
0
31.64
7.19
0
68.81
13.16
7.99
0
0
2.84
Total 1113.99 100%
Source: District Electricity Board.
10.4. Peak Demand and Energy Output
Year: 2013 – 2014
Sl. No. Power Demand Details
1.
Instantaneous peak demand 352
2. Sustained peak demand 337
Source: District Electricity Board.

32
10.5. Revenue from Electric Schemes and Cost per unit
Year: 2013- 2014
Sectors Cost per unit Income in Rs.in lakhs
(1) (2) (3)
Government
Public- II a
Private
Domestic- I a
Commercial
0
3
-
1.6
6.21
0
2670
-
12265
4980
Source: District Electricity Board –Tirunelveli.
10.6. Transmission and Distribution of Electricity
Year: 2013- 2014
Sl. No.
Item
Unit
Achievement
Up to 31.03.2014
1. 500 K.V.A 167 83500 KVA
2. 250 K.V.A 1105 276250 KVA
3. 200 K.V.A. 9 1800KVA
4 180 K.V.A. 1 160 KVA
5. 150 K.V.A 15 2250 KVA
6. 100 K.V.A 5123 512300 KVA
7. 75 K.V.A 186 13950 KVA
8. 63 K.V.A 1581 99603 KVA
9. Others 268 13400 KVA
Total 8455 1003213 KVA
Source: SE, TNEB, Distribution Circle.
33
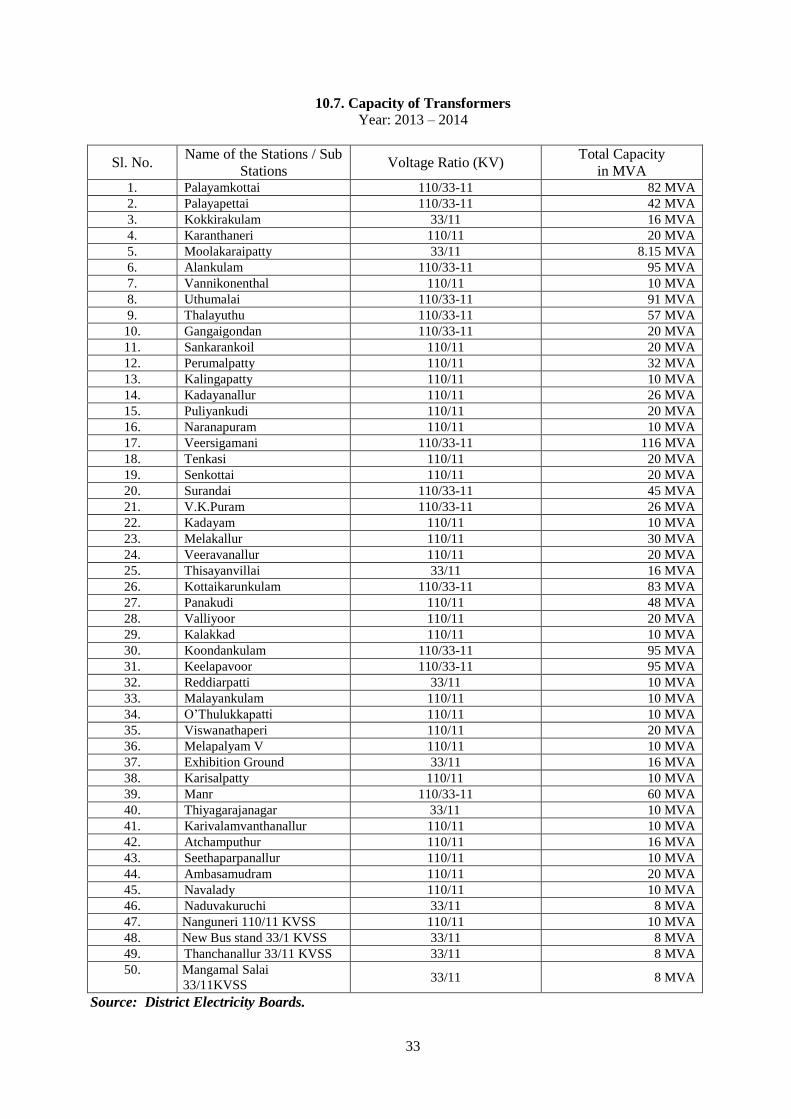
10.7. Capacity of Transformers Year: 2013 – 2014
Sl. No. Name of the Stations / Sub
Stations Voltage Ratio (KV)
Total Capacity
in MVA 1. Palayamkottai 110/33-11 82 MVA
2. Palayapettai 110/33-11 42 MVA
3. Kokkirakulam 33/11 16 MVA
4. Karanthaneri 110/11 20 MVA
5. Moolakaraipatty 33/11 8.15 MVA
6. Alankulam 110/33-11 95 MVA
7. Vannikonenthal 110/11 10 MVA
8. Uthumalai 110/33-11 91 MVA
9. Thalayuthu 110/33-11 57 MVA
10. Gangaigondan 110/33-11 20 MVA
11. Sankarankoil 110/11 20 MVA
12. Perumalpatty 110/11 32 MVA
13. Kalingapatty 110/11 10 MVA
14. Kadayanallur 110/11 26 MVA
15. Puliyankudi 110/11 20 MVA
16. Naranapuram 110/11 10 MVA
17. Veersigamani 110/33-11 116 MVA
18. Tenkasi 110/11 20 MVA
19. Senkottai 110/11 20 MVA
20. Surandai 110/33-11 45 MVA
21. V.K.Puram 110/33-11 26 MVA
22. Kadayam 110/11 10 MVA
23. Melakallur 110/11 30 MVA
24. Veeravanallur 110/11 20 MVA
25. Thisayanvillai 33/11 16 MVA
26. Kottaikarunkulam 110/33-11 83 MVA
27. Panakudi 110/11 48 MVA
28. Valliyoor 110/11 20 MVA
29. Kalakkad 110/11 10 MVA
30. Koondankulam 110/33-11 95 MVA
31. Keelapavoor 110/33-11 95 MVA
32. Reddiarpatti 33/11 10 MVA
33. Malayankulam 110/11 10 MVA
34. O’Thulukkapatti 110/11 10 MVA
35. Viswanathaperi 110/11 20 MVA
36. Melapalyam V 110/11 10 MVA
37. Exhibition Ground 33/11 16 MVA
38. Karisalpatty 110/11 10 MVA
39. Manr 110/33-11 60 MVA
40. Thiyagarajanagar 33/11 10 MVA
41. Karivalamvanthanallur 110/11 10 MVA
42. Atchamputhur 110/11 16 MVA
43. Seethaparpanallur 110/11 10 MVA
44. Ambasamudram 110/11 20 MVA
45. Navalady 110/11 10 MVA
46. Naduvakuruchi 33/11 8 MVA
47. Nanguneri 110/11 KVSS 110/11 10 MVA
48. New Bus stand 33/1 KVSS 33/11 8 MVA
49. Thanchanallur 33/11 KVSS 33/11 8 MVA
50. Mangamal Salai
33/11KVSS 33/11 8 MVA
Source: District Electricity Boards.

34
10.8. Rural Electrification
Year: 2013 – 2014
Electrified during the year Electrified up to the year
Towns
Village
Hamlet
Agricultural
Pump set
Town
Village
Hamlet
Agricultural
Pump set
(1) (2) (3) (4) (5) (6) (7) (8)
-
- - 560 45 425 1727 82657
Source: District Rural Electricity Office.

35
10.9. Name and address of fault report offices
Year: 2013- 2014
Sl. No. Name of the Stations/Sub Stations No. fault reported
1. Palayamkottai 110 KV SS 36
2. Palayapettai 110 KV SS 9
3. Kokkirakulam 33KV SS 7
4. Karanthaneri 110 KV SS 15
5. Moolakaraipatty33KV SS 8
6. Alankulam 110 KV SS 5
7. Vannikonenthal 110 KV SS 8
8. Uthumalai 110 KV SS 4
9. Thalayuthu 110 KV SS 10
10. Gangaigondan 110 KV SS 9
11. Sankarankoil 110 KV SS 9
12. Perumalpatty 110 KV SS 13
13. Kalingapatty 110 KV SS 7
14. Kadayanallur 110 KV SS 4
15. Puliyankudi 110 KV SS 0
16. Naranapuram 110 KV SS 5
17. Veersigamani 110 KV SS 7
18. Tenkasi 110 KV SS 7
19. Senkottai 110 KV SS 4
20. Surandai 110 KV SS 8
21. V.K.Puram 110 KV SS 30
22. Kadayam 110 KV SS 15
23. Melakallur 110 KV SS 10
24. Veeravanallur 110 KV SS 17
25. Thisayanvillai 33KV SS 3
26. Kottaikarunkulam 110 KV SS 10
27. Panakudi 110 KV SS 30
28. Valliyoor 110 KV SS 10
29. Kalakkad 110 KV SS 15
30. Koondankulam 110 KV SS 10
31. Keelapavoor 110 KV SS 5
32. Reddiarpatti 33KV SS 7
33. Malayankulam 110 KV SS 5
34. O’Thulukkapatti 110 KV SS 10
35. Viswanathaperi 110 KV SS 9
36. Melapalyam 33KV SS 15
37. Exhibition Ground 33KV SS 10
38. Karisalkulam 110 KV SS 7
39. Manur 110 KV SS 19
40. Thiyagarajanagar 33KV SS 10
41. Karivalamvanthnallur 110 KV SS 15
42. Achamputhur 110 KV SS 10
43. Seethaparpanallur 110 KV SS 14
44. Ambasamuthiram 110 KV SS 11
45. Nava Lady 110 KV SS 7
46. Naduvakurichy 33 KV SS 5
47. Nanguneri 110/11 KV SS 1
48. New Bus Stand 33/11 KV SS 0
49. Thachanallur 33/11 KV SS 0
50. Mangammal Salai 33/11 KV SS 2
Source: District Eectricity Board.

36
11. EDUCATION
11.1. Universities, Students and Teachers and Courses offered
Year: 2013 – 2014
Sl. No Name of the University
Students
Teachers Boys
Girls
Total
(1) (2) (3) (4) (5) (6)
1. Mononmaniam Sundaranar
University 6111 14856 20967 1286
2. Anna University, Tirunelveli 13025 7912 20937 1779
Source: Registrar Mononmaniam Sundaranar University& Anna University.
11.2. Colleges for General Education, Students and Teachers
Year: 2013 – 2014
Sl. No.
Name of Institution
No. of
Institution
Students Teachers
Boys Girls Total
(1) (2) (3) (4) (5) (6) (7)
1.
Government Colleges 2 622 2252 2874 110
2.
Aided Colleges 13 1850 3750 5600 632
3.
Self Financed
Colleges 10 1620 4341 5961 524
Total 25 4092 10343 14435 1266
Source: Joint Director of Collegiate Education, Regional Office Tirunelveli.

37
11.3. College for Professional Education, Students and Teachers
Year: 2013– 2014
Sl. No. Name of the
Institutions
No. of
Institutions
Students Teachers
Boys Girls Total
(1) (2) (3) (4) (5) (6) (7)
1. Govt . Medical
College 1 599 1272 1871 208
2. S.A.Raja Dental
college 1 128 466 594 74
3. Antartica college of
Pharmacy 1 46 58 104 8
4. S.A.Raja college of
Pharmacy 1 124 420 544 67
5.
Sri Ram Nallamani
Yadav College of
Pharmacy
- - - - -
6.
i) Govt college of
Engineering 1 2044 1020 3064 51
ii) Pvt college of
Engineering 14 10981 6892 17873 1728
7. Govt Siddha medial
college 1
8. Polytechnic college 15 12817 1033 13850 835
9. Devendra college of
Physiotherapy 1 26 25 51 5
Source: Respective Educational Institution.
11.4. Colleges for Special Education, Students and Teachers
Year: 2013 – 2014
Sl. No. Name of Institutions No. of
Institutions
Students Teachers
Boys Girls Total
(1) (2) (3) (4) (5) (6) (7)
1. College of Education 25 576 2453 3029 277
Source: Concerned Institutions.

38
11.5. Schools for General Education, Students and Teachers
Year: 2013 – 2014
Sl. No.
Name of the
Institutions
No. of
Institution
Students Teachers
Boys Girls Total
(1) (2) (3) (4) (5) (6) (7)
1. High School &
Higer.Sec. School 461 36978 45186 82164 2166
2. Middle school 453 48455 47288 95743 3843
3. Primary school 1791 7943 78686 86629 7346
TOTAL 2341 93376 171160 264536 13355
Source: DEO, Tirunelveli, Tenkasi, Cheranmahadevi, Add.C.E.O,SSA, & IMS.
11.6. Schools for Professional Education, Students and Teachers
Year: 2013- 2014
Sl. No Name of the Institution No. of the
Institutions
Students Teachers
Boys Girl Total
(1) (2) (3) (4) (5) (6) (7)
1. Industrial Training Institute
(Govt) 4 723 22 745 103
2. Industrial Training Institute
(Private) 27 1807 81 1888 287
Source: R.J.D., of Training, Tirunelveli.
11.7. Schools for Special Education, Students and Teachers
Year: 2013- 2014
Sl. No. Name of the Institution No. of the
Institution
Students Teachers
Boys Girls Total
(1) (2) (3) (4) (5) (6) (7)
1. Teacher training Institution 26 63 1398 1461 159
Source: DIET, Tirunelveli.
11.8. Institutions for Other Professional Education, Students and Teachers
Year: 2013 – 2014
Sl. No. Name of the Institution No. of
Institutions
Students Teachers
Boys Girls Total
(1) (2) (3) (4) (5) (6) (7)
1. Government Law College BL Course
ML Course
794
14
425
20
1219
34 67
Source: Principal, Govt. Law College Tirunelveli.
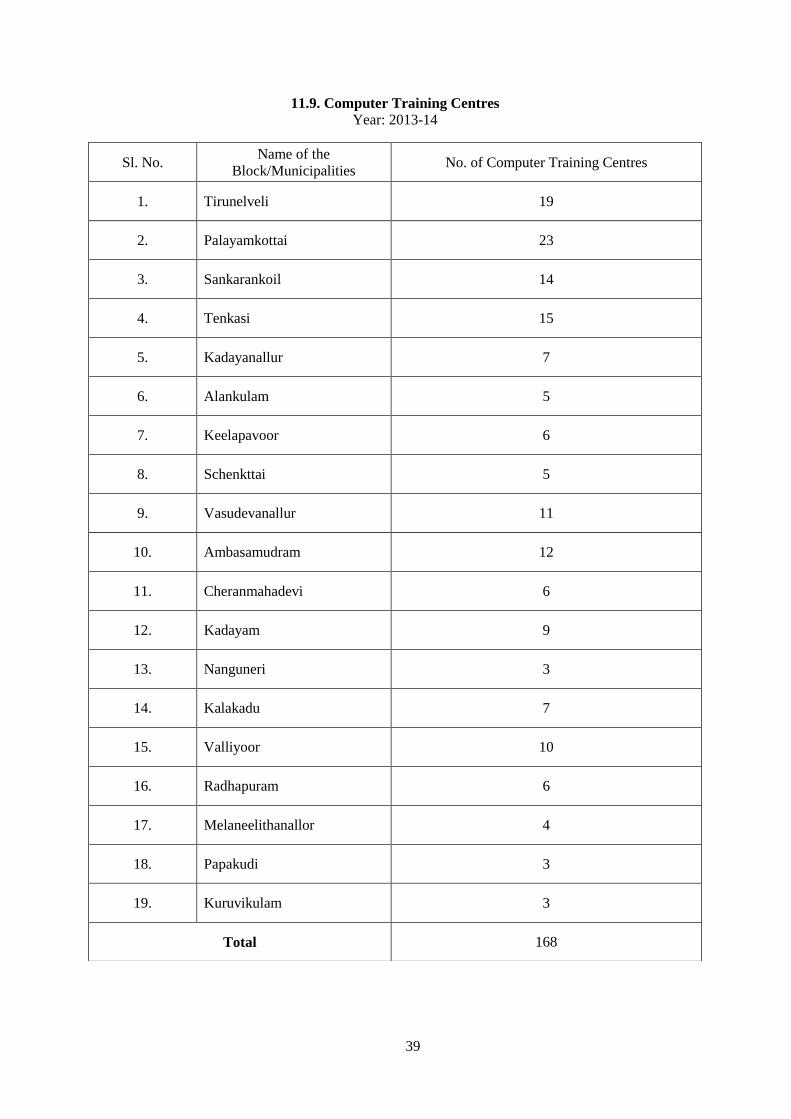
39
11.9. Computer Training Centres Year: 2013-14
Sl. No. Name of the
Block/Municipalities No. of Computer Training Centres
1. Tirunelveli 19
2. Palayamkottai 23
3. Sankarankoil 14
4. Tenkasi 15
5. Kadayanallur 7
6. Alankulam 5
7. Keelapavoor 6
8. Schenkttai 5
9. Vasudevanallur 11
10. Ambasamudram 12
11. Cheranmahadevi 6
12. Kadayam 9
13. Nanguneri 3
14. Kalakadu 7
15. Valliyoor 10
16. Radhapuram 6
17. Melaneelithanallor 4
18. Papakudi 3
19. Kuruvikulam 3
Total 168

40
11.10. Hostels and Inmates by Community
Year: 2013-2014
Name of Caste
No. of Hostels No. of Inmates
Boys Girls Total Boys Girls Total
S.C - - - - - -
S.T - - - - - -
M.B.C 4 1 5 66 12 78
D.N.C 11 2 13 227 54 281
Minorities - 2 2 - 53 53
B.C 20 11 31 321 286 607
Source: DADWO, & Backward Officer, Tirunelveli.
11.11. Scholarships to Students by Community
Year: 2013- 2014
Scheduled
Caste/Scheduled Tribe
Denotified Communities/Most
Backward Classes Backward Classes
No.
Beneficiaries
Amount
(Rs)
No.
Beneficiaries
Amount
(Rs.)
No.
Beneficiaries
Amount
(Rs.)
(1) (2) (3) (4) (5) (6)
- - 7,742/- 1,78,28,124/- 6,539 3,35,81,969/-
Source: DADWO, & Backward Officer, Tirunelveli.
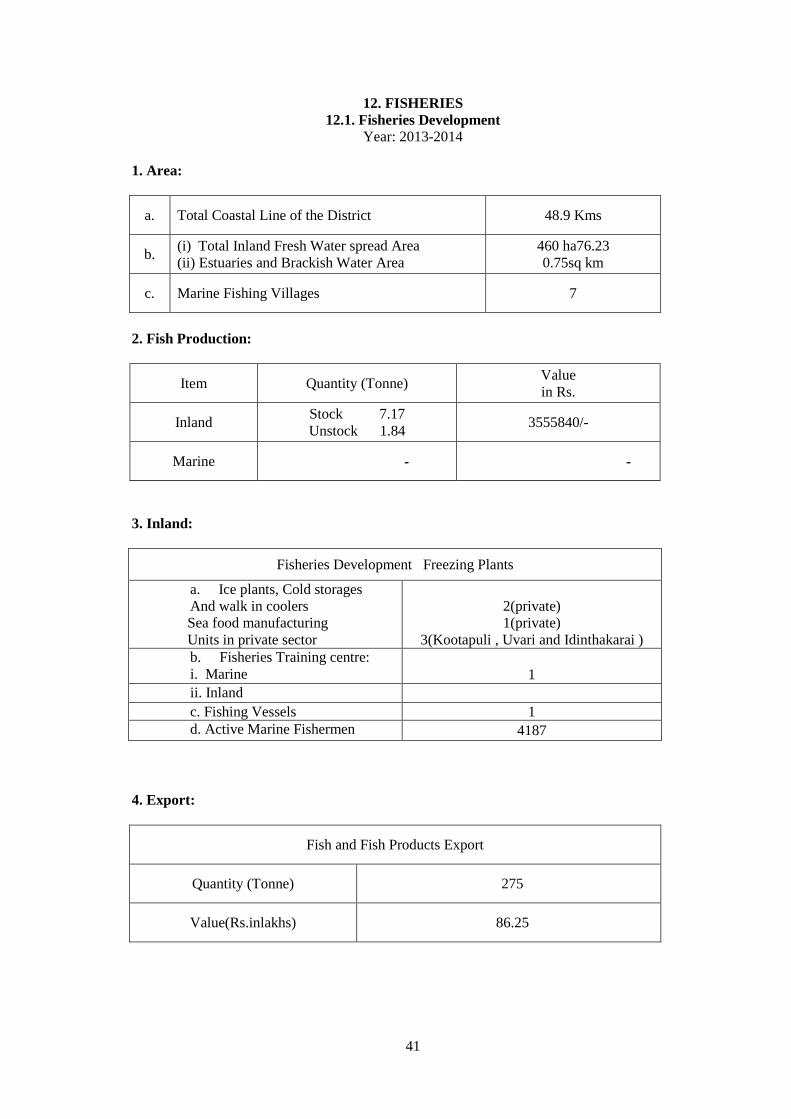
41
12. FISHERIES
12.1. Fisheries Development
Year: 2013-2014
1. Area:
a. Total Coastal Line of the District 48.9 Kms
b. (i) Total Inland Fresh Water spread Area
(ii) Estuaries and Brackish Water Area
460 ha76.23
0.75sq km
c. Marine Fishing Villages 7
2. Fish Production:
Item Quantity (Tonne) Value
in Rs.
Inland Stock 7.17
Unstock 1.84 3555840/-
Marine - -
3. Inland:
Fisheries Development Freezing Plants
a. Ice plants, Cold storages
And walk in coolers
Sea food manufacturing
Units in private sector
2(private)
1(private)
3(Kootapuli , Uvari and Idinthakarai ) b. Fisheries Training centre:
i. Marine
1 ii. Inland c. Fishing Vessels 1 d. Active Marine Fishermen 4187
4. Export:
Fish and Fish Products Export
Quantity (Tonne) 275
Value(Rs.inlakhs) 86.25

42
12.2. Estimated Marine Fish Production / Inland Fish Production
Year: 2013- 2014
Sl. No. Block/Municipalities Quantity (Tonne) Value Rs.
1. Inland Fishing Stocked -7.17 tons
Unstocked -1.84 tons 3555840/-
2. Marine Fishing - -
Source: District Inland & Marine Fisheries Department, Tirunelveli & Radhapuram.
12.3. No. of Families Engaged in Fishing
Year: 2013- 2014
Sl. No.
(1)
Name of the Block
(2)
No. of Families engaged
(3)
1. Inland Fishing 5
2. Marine Fishing -
Source: District Inland & Marine Fisheries Department, Tirunelveli & Radhapuram.
13. HANDLOOM
13.1. No. of Focal Centres and Location Details
Year: 2013- 2014
Sl. No.
(1)
No. of the Focal Centres
(2)
Name/Location of the Focal Centres
(3)
1.
5
Kallidaikurichi
2. Valliyoor
3. Veeravanallur
4. Sankarankoil
5. Puliangudi
Source: Asst. Director of Handlooms and Textiles, Tirunelveli.
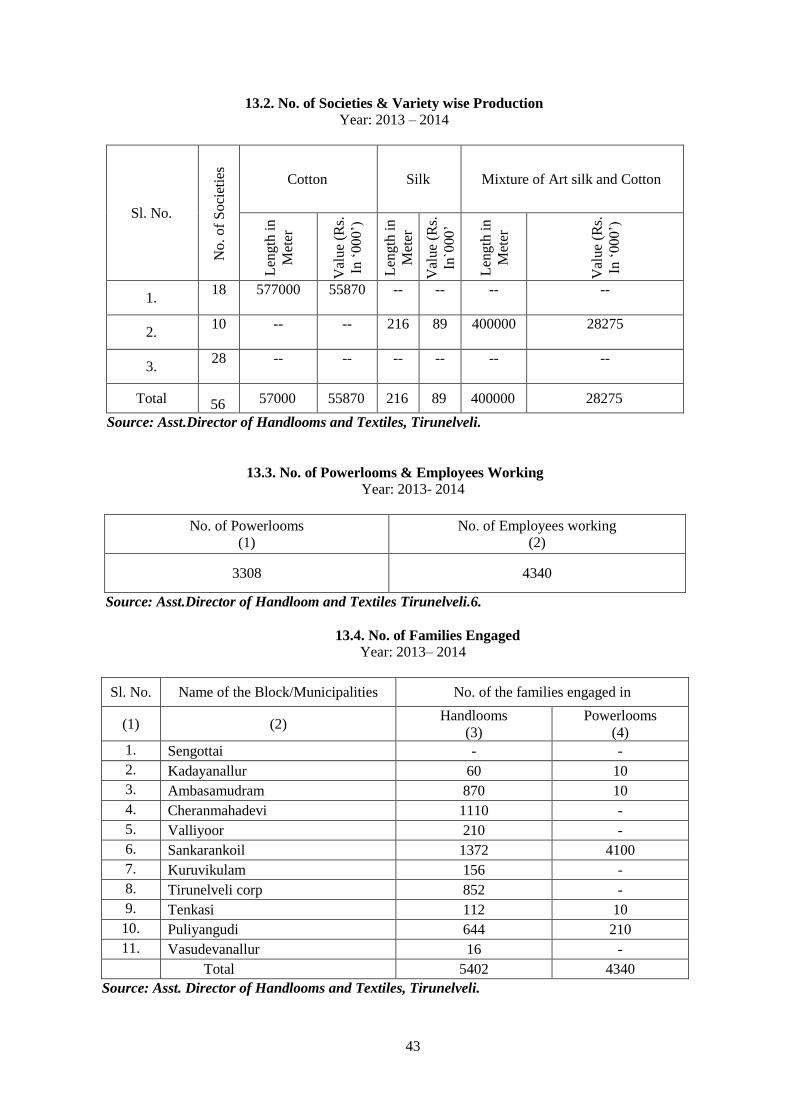
43
13.2. No. of Societies & Variety wise Production
Year: 2013 – 2014
Sl. No. N
o.
of
So
ciet
ies
Cotton Silk Mixture of Art silk and Cotton
Len
gth
in
Met
er
Val
ue
(Rs.
In ‘
00
0’)
Len
gth
in
Met
er
Val
ue
(Rs.
In`0
00
’
Len
gth
in
Met
er
Val
ue
(Rs.
In ‘
00
0’)
1. 18 577000 55870 -- -- -- --
2. 10 -- -- 216 89 400000 28275
3. 28 -- -- -- -- -- --
Total 56 57000 55870 216 89 400000 28275
Source: Asst.Director of Handlooms and Textiles, Tirunelveli.
13.3. No. of Powerlooms & Employees Working
Year: 2013- 2014
No. of Powerlooms
(1)
No. of Employees working
(2)
3308 4340
Source: Asst.Director of Handloom and Textiles Tirunelveli.6.
13.4. No. of Families Engaged
Year: 2013– 2014
Sl. No. Name of the Block/Municipalities No. of the families engaged in
(1) (2) Handlooms
(3)
Powerlooms
(4)
1. Sengottai - -
2. Kadayanallur 60 10
3. Ambasamudram 870 10
4. Cheranmahadevi 1110 -
5. Valliyoor 210 -
6. Sankarankoil 1372 4100
7. Kuruvikulam 156 -
8. Tirunelveli corp 852 -
9. Tenkasi 112 10
10. Puliyangudi 644 210
11. Vasudevanallur 16 -
Total 5402 4340
Source: Asst. Director of Handlooms and Textiles, Tirunelveli.

44
14. HANDICRAFTS
14.1. Name and Address of Handicrafts Year: 2013– 2014
Sl. No.
(1)
Name of the Block/s
(2)
Name & Address of the Handicraft
(3)
1. Ambasamudram Poompuhar Brass & Metal Centre,
Vaigaikulam-627412, Pottary(Karukurichi)
2. Cheranmahadevi Kora Grassmat (Pattamadai)
3. Palayamkottai Leather goods (Palayamkottai)
4. Shencottai Honey (Viswanathapuram)
5. Tenkasi-Thenpothai Artistic Pottery/ Terracotta
6. Kalakad Natural Fibre
7. Sankarankovil Hand Embroidery
8. Tirunelveli Wood Caving/Hand embroidery
9. Vadakkankulam Hand Embroidery/Fur Dolls
Source: A.D Handicraft Nagercoil.
14.2. Articles Available In Handicrafts
Sl.No.
(1)
Name of Craft/s
(2)
Articles available in the Handicrafts
(3)
1. Poompuhar Brass & Metal Centre,
Vaigaikulam-627412, Mannarkoil Temple perquisites, utility items, utensils etc
2. Natural Fibre / Embroidery , Pathamadai,
Veevanallur,
Mats, bags, Lamp Shades, Flowervase, Pen Stand,
pouches, utility bags, table coasters, folders,
frocks, cushion covers etc
3. Lacquerware, Ambasamudram Toys, Figures of animals, birds, bangles, lamp
shades etc
4. Cane & Bamboo, Shenkottai Baskets, lamp shade, furniture, flowervase,
curtains and other utility items
5. Artistic pottery/ Terracota, Thenpothai, Pottery Items
6.
. Pottery, Kallidaikurichi, Karakurichi Pottery Items
7. Embroidery / fur dolls, Vadakkankulam Dolls, Embroidery Items
8. Nature Fibre, Kalakadu
Mats, bags, Lamp Shades, Flowervase, Pen Stand,
pouches, utility bags, table coasters, folders,
frocks, cushion covers etc
9. Wood Craving/ Hand Embroidery,
Tirunelveli Town Statues, door Carving etc
10. Wood Craving/ Stone carving,
Pavanasam Statues, door Carving etc
11. Hand embroidery, Sankarankoil
Mats, bags, Lamp Shades, Flowervase, Pen Stand,
pouches, utility bags, table coasters, folders,
frocks, cushion covers etc
Source: A.D Handicraft Nagercoil.

45
14.3. Value of Articles Produced
Year 2013-2014
Sl. No.
Name of the Handicrafts
Value of the articles
Produced In lakhs
Inter unit
Transfer
Value of the
articles sold in Rs
in Lakhs
1. Brass Malabar Lamps 10.84 7.98 0.19
2. Brass Bells 2.80 2.13 -
3. Brass Ornamental Lamps 16.54 12.08 0.38
4. Brass Iron Boxes 22.21 22.21 -
5. Brass Lamps 2.60 2.20 0.12
6. Brass Mini - - -
Total 54.99 46.60 0.69
Source: Poompuhar Brass & Bell Metal Centre, Vagaikulam.
14.4. No. of Families Engaged In Handicrafts
Year 2013-2014
Sl. No.
Name of the District
No. of the Handicrafts
Articles Produced
Estimated No.
of artisans
Estimated
Production
Capacity
1 Tirunelveli - 5000 10 Crores
Source: A.D Handicraft Nagercoil.
15. HEALTH & FAMILY WELFARE
15.1. Hospitals, Dispensaries Bed Strength, Doctors and Nurses
Year: 2013 – 2014
Classification Modern
Medicine
Indian Medicine
Ayurvedic Siddha Unani Ayurvedic Sidha
Unani combined Total
Grand
Total
4 8
Hospital - - - - - - -
P.H.C - - - - - - -
H.S.C - - - - - - -
4Other
Medical Inst. - - - - - - -
Bed strength 1038 - 350 - - 1388 1388
No.of
Doctors 179 - 62 - - 241 241
No. of
Nurses 155 - 25 - - 180 180
Source : J.D.Health,Tenkasi, D.D.Health,Tirunelveli & S.Koil, TVMCH, Siddha College Hospital.

46
15.2. No. of Allied Pathological Units Available
Year-2013-2014
Source: Joint Director of Health Tenkasi.
15.3. Disease/ Category wise Patients Treated
Year: 2013 – 2014
Sl. No. Name of the Disease/Category wise No. of patients treated
1. Allopathy 851964
2. Indian Medicine 123434
3. Homeopathy -
Source : TVMCH, Siddha College Hospital, J.D.Health,Tenkasi, D.D.Health, Tirunelveli &S.Koil.
15.4. Distribution of Medical Personnel
Year: 2013 – 2014
No. of
Doctors No. of Nurse No. of Technical persons Others
62
25 38 87
Source : TVMCH, Siddha College Hospital, J.D.Health,Tenkasi,D.D.Health,Tirunelveli & S.Koil.
Sl. No. Name of the Block/ Municipality No. of Pathological Units
1. Tenkasi 1
2. Sankarankoil 1
3. Ambasamudram 1
4. Shenkottai 1
5. Namguneri 1
6. Radhapuram 1
7. Sivagiri 1
8. Kadayanallur 1
9. Cheranmadevi 1
10. Melapalayam 1
11. Puliyankudi 1
Total 11
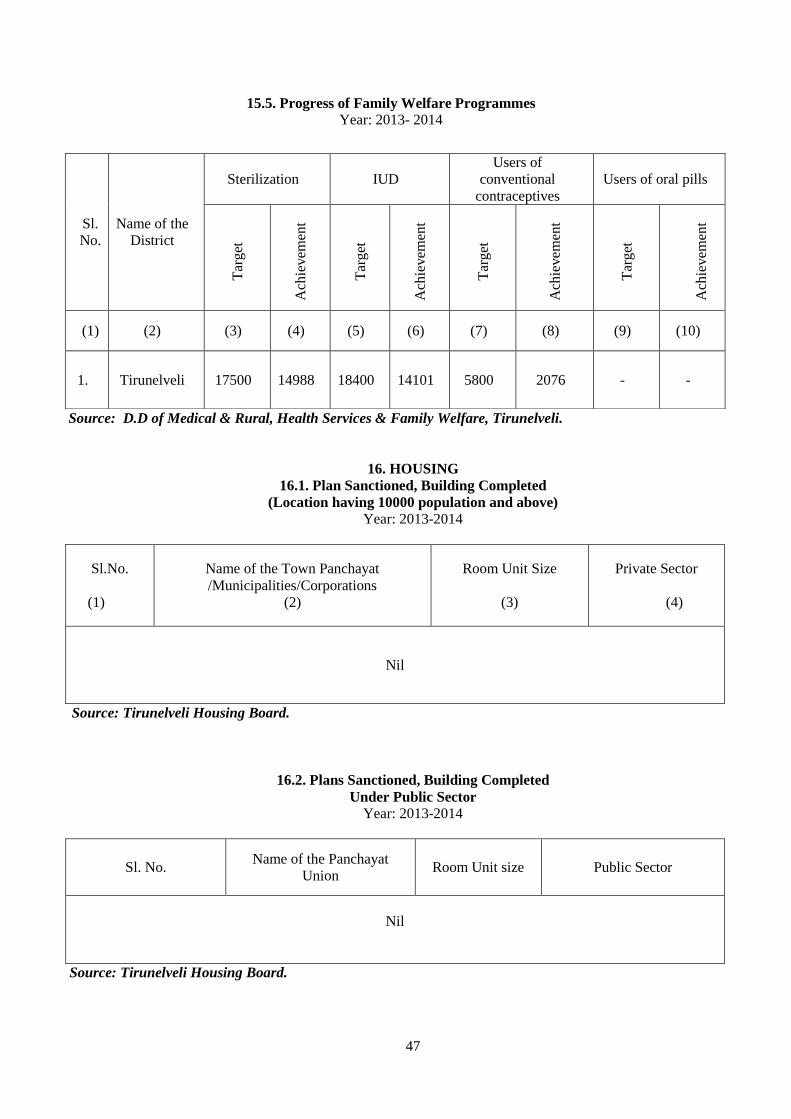
47
15.5. Progress of Family Welfare Programmes
Year: 2013- 2014
Source: D.D of Medical & Rural, Health Services & Family Welfare, Tirunelveli.
16. HOUSING
16.1. Plan Sanctioned, Building Completed
(Location having 10000 population and above)
Year: 2013-2014
Sl.No.
(1)
Name of the Town Panchayat
/Municipalities/Corporations
(2)
Room Unit Size
(3)
Private Sector
(4)
Nil
Source: Tirunelveli Housing Board.
16.2. Plans Sanctioned, Building Completed
Under Public Sector
Year: 2013-2014
Sl. No. Name of the Panchayat
Union Room Unit size Public Sector
Nil
Source: Tirunelveli Housing Board.
Sl.
No.
Name of the
District
Sterilization IUD
Users of
conventional
contraceptives
Users of oral pills
Tar
get
Ach
ievem
ent
Tar
get
Ach
ievem
ent
Tar
get
Ach
ievem
ent
Tar
get
Ach
ievem
ent
(1) (2) (3) (4) (5) (6) (7) (8) (9) (10)
1. Tirunelveli 17500 14988 18400 14101 5800 2076 - -

48
16.3. Amount Invested in Housing and Building Activity
Under Public Sector
Year: 2013- 2014
Residential
Rs.in ‘000’
Percentage to
total
Non-Residential
Rs.in ‘000’ Percentage to total
Total
Rs.in ‘000’
Nil
Source: Tirunelveli Housing Board.
16.4. Construction Activity of Tamil Nadu Housing Board
Year: 2013- 2014
Sl. No. Name of the Scheme Number
1. Low Income Group Housing Schemes Flats -
2. Middle Income Group Housing Schemes 32 (keelanatham self finance scheme
phase II stage II)
3. Slum Improvements/Clearance Tenements -
4. Tamil Nadu Government Rental Housing Flats -
5. Flats -
6. Subsidized Industrial Housing Tenements -
7. Fire Proof Tenements -
8. Special Low Cost Housing Scheme {EWS) -
9 Police -
10. Specify any other High Income Group 16 HIG houses (keelanatham self
finance scheme phase II stage II)
Source: Tirunelveli Housing Board.
16.5. Construction Activity of Tamil Nadu Slum Clearance Board
Year: 2013-2014
Sl. No. Item Achievement
1. Number of Tenements sanctioned for construction 207
2. Number of Tenements constructed 207
3. Amount sanctioned (Rs.in lakhs) Rs.554.10 Lakhs
4. Amount spent (Rs.in lakhs) Rs.537.75 Lakhs
5. Number of tenements occupied 186
6. Rent received (Rs.in lakhs) -
Source: Slum Clearance Board.
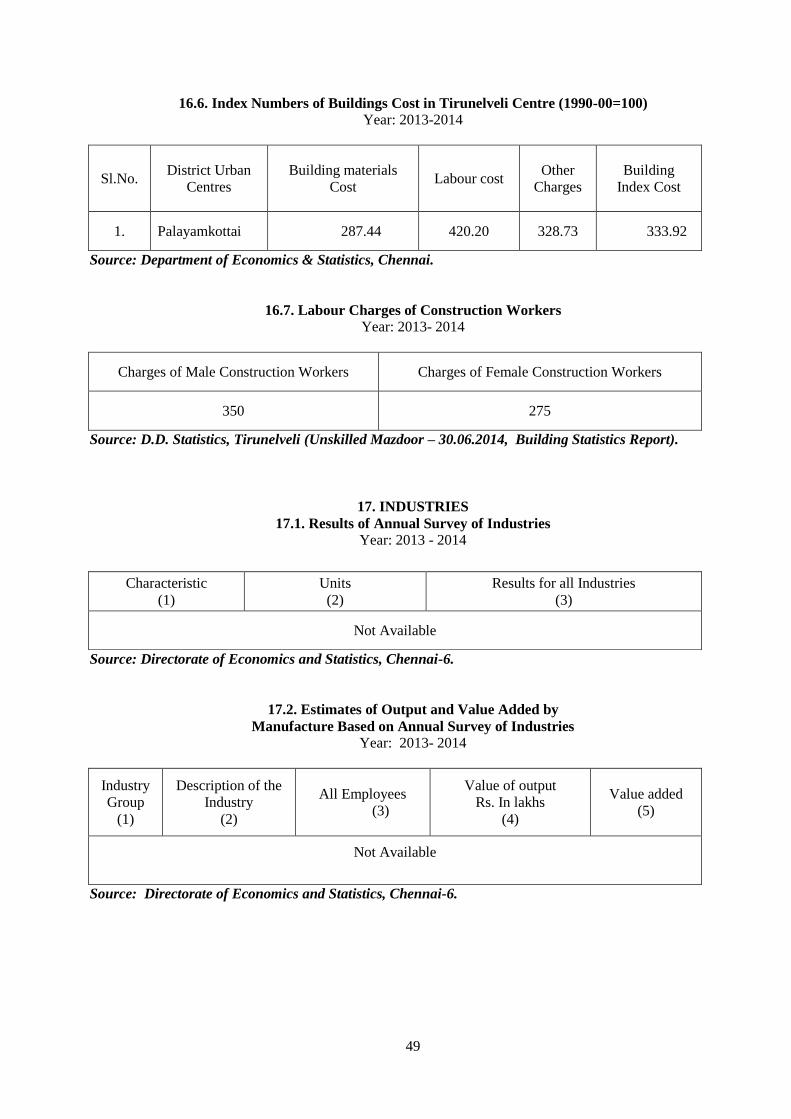
49
16.6. Index Numbers of Buildings Cost in Tirunelveli Centre (1990-00=100)
Year: 2013-2014
Sl.No. District Urban
Centres
Building materials
Cost Labour cost
Other
Charges
Building
Index Cost
1. Palayamkottai 287.44 420.20 328.73 333.92
Source: Department of Economics & Statistics, Chennai.
16.7. Labour Charges of Construction Workers
Year: 2013- 2014
Charges of Male Construction Workers Charges of Female Construction Workers
350 275
Source: D.D. Statistics, Tirunelveli (Unskilled Mazdoor – 30.06.2014, Building Statistics Report).
17. INDUSTRIES
17.1. Results of Annual Survey of Industries
Year: 2013 - 2014
Source: Directorate of Economics and Statistics, Chennai-6.
17.2. Estimates of Output and Value Added by
Manufacture Based on Annual Survey of Industries
Year: 2013- 2014
Industry
Group
(1)
Description of the
Industry
(2)
All Employees
(3)
Value of output
Rs. In lakhs
(4)
Value added
(5)
Not Available
Source: Directorate of Economics and Statistics, Chennai-6.
Characteristic
(1)
Units
(2)
Results for all Industries
(3)
Not Available
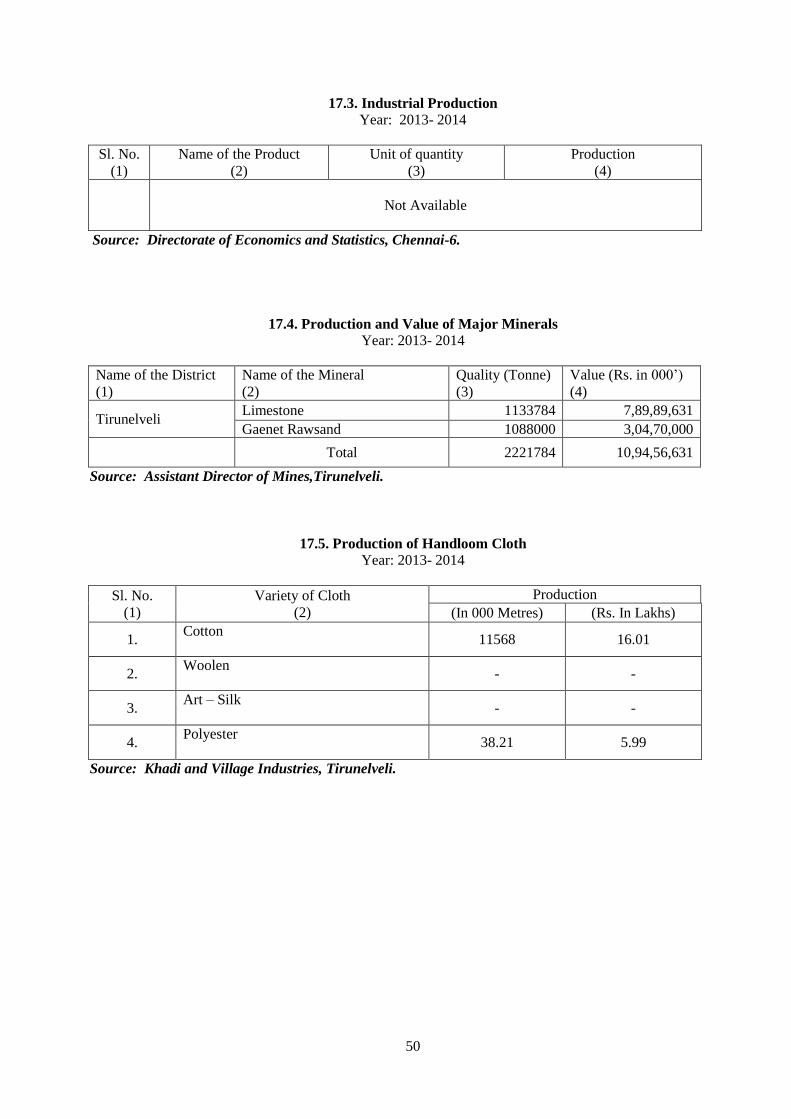
50
17.3. Industrial Production
Year: 2013- 2014
Sl. No.
(1)
Name of the Product
(2)
Unit of quantity
(3)
Production
(4)
Not Available
Source: Directorate of Economics and Statistics, Chennai-6.
17.4. Production and Value of Major Minerals
Year: 2013- 2014
Name of the District
(1)
Name of the Mineral
(2)
Quality (Tonne)
(3)
Value (Rs. in 000’)
(4)
Tirunelveli Limestone 1133784 7,89,89,631
Gaenet Rawsand 1088000 3,04,70,000
Total 2221784 10,94,56,631
Source: Assistant Director of Mines,Tirunelveli.
17.5. Production of Handloom Cloth
Year: 2013- 2014
Sl. No.
(1)
Variety of Cloth
(2)
Production
(In 000 Metres) (Rs. In Lakhs)
1. Cotton
11568 16.01
2. Woolen
- -
3. Art – Silk
- -
4. Polyester
38.21 5.99
Source: Khadi and Village Industries, Tirunelveli.
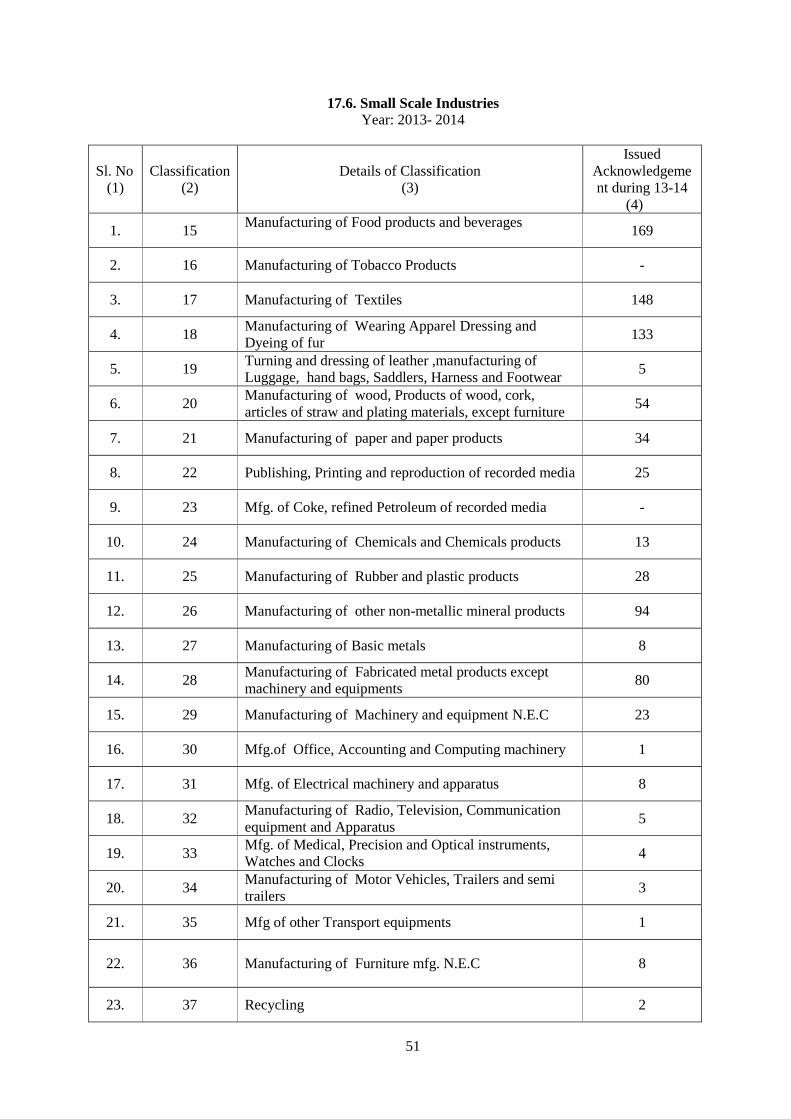
51
17.6. Small Scale Industries
Year: 2013- 2014
Sl. No
(1)
Classification
(2)
Details of Classification
(3)
Issued
Acknowledgeme
nt during 13-14
(4)
1. 15 Manufacturing of Food products and beverages
169
2. 16 Manufacturing of Tobacco Products -
3. 17 Manufacturing of Textiles 148
4. 18 Manufacturing of Wearing Apparel Dressing and
Dyeing of fur 133
5. 19 Turning and dressing of leather ,manufacturing of
Luggage, hand bags, Saddlers, Harness and Footwear 5
6. 20 Manufacturing of wood, Products of wood, cork,
articles of straw and plating materials, except furniture 54
7. 21 Manufacturing of paper and paper products 34
8. 22 Publishing, Printing and reproduction of recorded media 25
9. 23 Mfg. of Coke, refined Petroleum of recorded media -
10. 24 Manufacturing of Chemicals and Chemicals products 13
11. 25 Manufacturing of Rubber and plastic products 28
12. 26 Manufacturing of other non-metallic mineral products 94
13. 27 Manufacturing of Basic metals 8
14. 28 Manufacturing of Fabricated metal products except
machinery and equipments 80
15. 29 Manufacturing of Machinery and equipment N.E.C 23
16. 30 Mfg.of Office, Accounting and Computing machinery 1
17. 31 Mfg. of Electrical machinery and apparatus 8
18. 32 Manufacturing of Radio, Television, Communication
equipment and Apparatus 5
19. 33 Mfg. of Medical, Precision and Optical instruments,
Watches and Clocks 4
20. 34 Manufacturing of Motor Vehicles, Trailers and semi
trailers 3
21. 35 Mfg of other Transport equipments 1
22. 36 Manufacturing of Furniture mfg. N.E.C 8
23. 37 Recycling 2

52
24. 40 Electricity, Gas, Steam and hot Water Supply 1
25. 41 Collection, purification and distribution of water 3
26. 50 Maintenance and repair of motor vehicles and motor
cycles (NIC 1998 codes:50200 and 50404) 42
27. 52
Maintenance and repairing of personal and household
Goods ( NIC
1998 codes 52601-52609)
49
28. 60 Land transport (NIC 1988 Codes:60211) 0
29. 63 Supporting and Auxiliary activities (NIC 1998 Codes
63022&63091) 6
30. 64 Post and Telecommunications 2
31. 71 Renting of transport equipments, other machinery and
Equipments N.E.C. (NIC 1998 Codes 71110-71290) 4
32. 72 Computer and related activities ( NIC 1998 Codes
72201, 72202, 72203, 72300, 72400, 72501 &72502 87
33. 74
Other business activities (NIC 1998 Codes 74131,
74132, 74133, 74221,74300,74941,74942,74950,74993
and 74994)
27
34. 85 Health and Social Work (NIC 1998 Codes : 85197 and
85321) 0
35. 92 Recreational, Cultural and sporting activities (NIC 1998
Codes 92111, 92113, 92114 and 92115) 1
36. 93 Other Service activities (NIC 1998 Codes: 93010 and
93011) 243
Source: District Industries and Commerce Office.
17.7. Khadi and Village Industries
Year: 2013- 2014
Sl. No. Industry
(1)
Production
(Rs. In lakhs)
(2)
Sales (Rupees in
lakhs)
(3)
Employment to
(No. of persons)
(4)
Earnings
(Rs. In lakhs)
(5)
1. Khadi
Production 22.00 43.90 12 4.00
2. Yarn Production 14.60 - 41 5.42
3. Soap Industry 17.00 - 15 3.00
4.
.
Bee-Keeping
Industries - - - -
5. Pottery
industries - - - -
6. Leather
industries 12.00 12.00 4 2.80
7.
Industrial Co.op.
Society 362.86 383.96 49 0.40
Source: District Khadi and Village Industries, Tirunelveli.
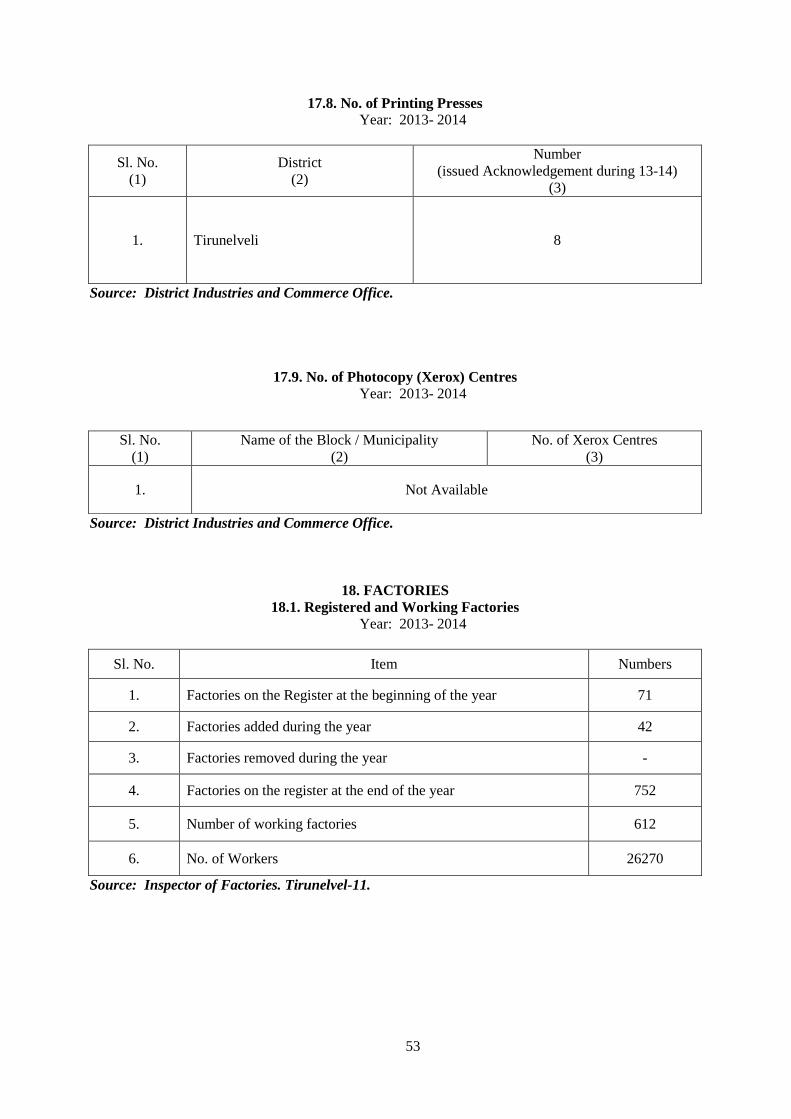
53
17.8. No. of Printing Presses
Year: 2013- 2014
Sl. No.
(1)
District
(2)
Number
(issued Acknowledgement during 13-14)
(3)
1. Tirunelveli 8
Source: District Industries and Commerce Office.
17.9. No. of Photocopy (Xerox) Centres
Year: 2013- 2014
Source: District Industries and Commerce Office.
18. FACTORIES
18.1. Registered and Working Factories
Year: 2013- 2014
Sl. No. Item Numbers
1. Factories on the Register at the beginning of the year 71
2. Factories added during the year 42
3. Factories removed during the year -
4. Factories on the register at the end of the year 752
5. Number of working factories 612
6. No. of Workers 26270
Source: Inspector of Factories. Tirunelvel-11.
Sl. No.
(1)
Name of the Block / Municipality
(2)
No. of Xerox Centres
(3)
1. Not Available
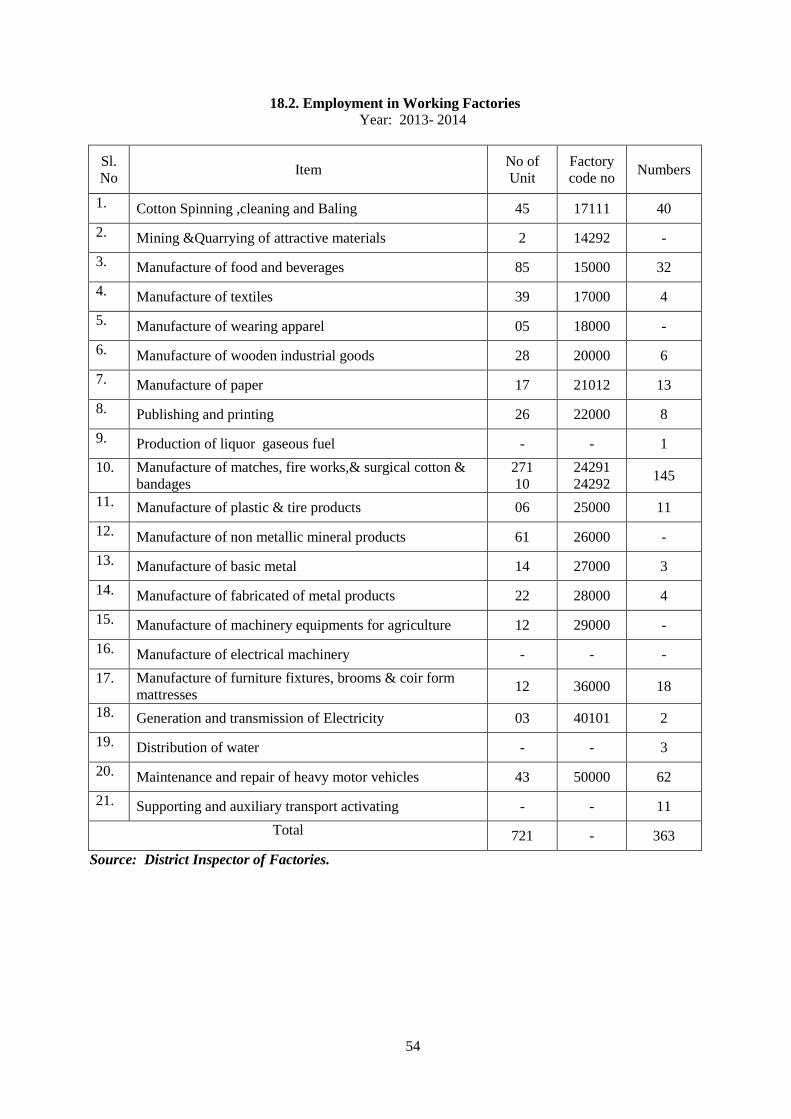
54
18.2. Employment in Working Factories Year: 2013- 2014
Sl.
No Item
No of
Unit
Factory
code no Numbers
1. Cotton Spinning ,cleaning and Baling 45 17111 40
2. Mining &Quarrying of attractive materials 2 14292 -
3. Manufacture of food and beverages 85 15000 32
4. Manufacture of textiles 39 17000 4
5. Manufacture of wearing apparel 05 18000 -
6. Manufacture of wooden industrial goods 28 20000 6
7. Manufacture of paper 17 21012 13
8. Publishing and printing 26 22000 8
9. Production of liquor gaseous fuel - - 1
10. Manufacture of matches, fire works,& surgical cotton &
bandages
271
10
24291
24292 145
11. Manufacture of plastic & tire products 06 25000 11
12. Manufacture of non metallic mineral products 61 26000 -
13. Manufacture of basic metal 14 27000 3
14. Manufacture of fabricated of metal products 22 28000 4
15. Manufacture of machinery equipments for agriculture 12 29000 -
16. Manufacture of electrical machinery - - -
17. Manufacture of furniture fixtures, brooms & coir form
mattresses 12 36000 18
18. Generation and transmission of Electricity 03 40101 2
19. Distribution of water - - 3
20. Maintenance and repair of heavy motor vehicles 43 50000 62
21. Supporting and auxiliary transport activating - - 11
Total 721 - 363
Source: District Inspector of Factories.
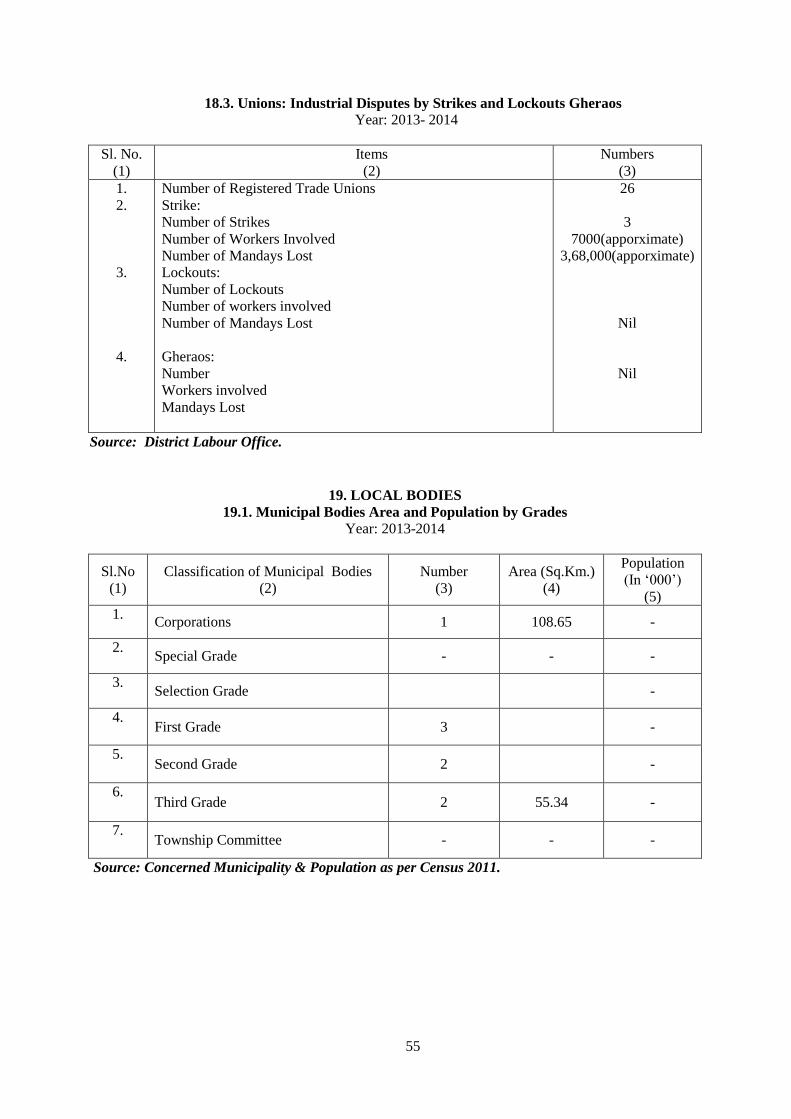
55
18.3. Unions: Industrial Disputes by Strikes and Lockouts Gheraos
Year: 2013- 2014
Sl. No.
(1)
Items
(2)
Numbers
(3)
1.
2.
3.
4.
Number of Registered Trade Unions
Strike:
Number of Strikes
Number of Workers Involved
Number of Mandays Lost
Lockouts:
Number of Lockouts
Number of workers involved
Number of Mandays Lost
Gheraos:
Number
Workers involved
Mandays Lost
26
3
7000(apporximate)
3,68,000(apporximate)
Nil
Nil
Source: District Labour Office.
19. LOCAL BODIES
19.1. Municipal Bodies Area and Population by Grades
Year: 2013-2014
Sl.No
(1)
Classification of Municipal Bodies
(2)
Number
(3)
Area (Sq.Km.)
(4)
Population
(In ‘000’)
(5)
1. Corporations 1 108.65 -
2. Special Grade - - -
3. Selection Grade -
4. First Grade 3 -
5. Second Grade 2 -
6. Third Grade 2 55.34 -
7. Township Committee - - -
Source: Concerned Municipality & Population as per Census 2011.

56
19.2. Municipal Bodies
Source: Deputy Director of Statistics, Tirunelveli.
19.3. Panchayat Unions, Village Panchayats / Town Panchayats
Year: 2013- 2014
Development
Districts
Panchayat
Union
Village
Panchayats
Town
Panchayats
1 19 425 36
Source: Deputy Director of Statistics, Tirunelveli.
19.4. Revenue Divisions, Taluks, Firkas and Revenue Villages
Year: 2013- 2014
Revenue Divisions Revenue Taluks Revenue Firkas Revenue Villages
3 11 60 616
Source: Deputy Director of Statistics, Tirunelveli.
19.5. Tax collected By Corporation / Municipality / Panchayat Union /
Town Panchayat / Village Panchayat
Year: 2013- 2014
Item Corporation Municipality Town Panchayat Village
Panchayat
Tax collected
in Rs. In Lakhs - 1089.45 - -
Source: RDMA, A.D.(T.P.), A.D.(Panchayat).
Sl. No.
Corporations/
Municipalities
Co
rpo
rati
on
Grade of Municipal Councils
To
tal
Sp
ecia
l
Sel
ecti
on
Fir
st
Sec
on
d
Th
ird
To
wn
ship
Co
mm
itte
es
1. Tirunelveli 1 - - - - - - 1
2. Sengottai - - - - 1 - - 1
3. Puliyankudi - - - - 1 - - 1
4. Kadaiyanallur - - - 1 - - - 1
5. Sankarankoil - - - 1 - - - 1
6. Tenkasi - - - 1 - - - 1
7. Ambasamudram - - - - - 1 - 1
8 Vickramasingapuram - - - - - 1 - 1
Total 1 - - 3 2 2 - 8
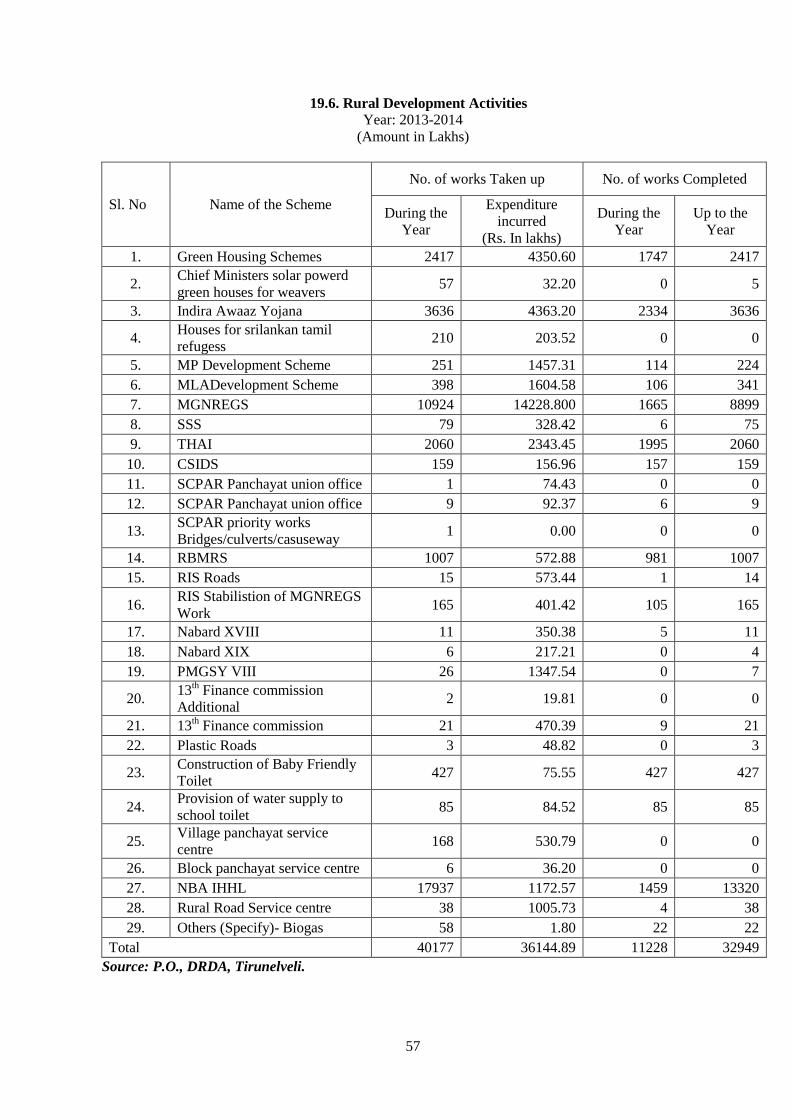
57
19.6. Rural Development Activities
Year: 2013-2014
(Amount in Lakhs)
Sl. No Name of the Scheme
No. of works Taken up No. of works Completed
During the
Year
Expenditure
incurred
(Rs. In lakhs)
During the
Year
Up to the
Year
1. Green Housing Schemes 2417 4350.60 1747 2417
2. Chief Ministers solar powerd
green houses for weavers 57 32.20 0 5
3. Indira Awaaz Yojana 3636 4363.20 2334 3636
4. Houses for srilankan tamil
refugess 210 203.52 0 0
5. MP Development Scheme 251 1457.31 114 224
6. MLADevelopment Scheme 398 1604.58 106 341
7. MGNREGS 10924 14228.800 1665 8899
8. SSS 79 328.42 6 75
9. THAI 2060 2343.45 1995 2060
10. CSIDS 159 156.96 157 159
11. SCPAR Panchayat union office 1 74.43 0 0
12. SCPAR Panchayat union office 9 92.37 6 9
13. SCPAR priority works
Bridges/culverts/casuseway 1 0.00 0 0
14. RBMRS 1007 572.88 981 1007
15. RIS Roads 15 573.44 1 14
16. RIS Stabilistion of MGNREGS
Work 165 401.42 105 165
17. Nabard XVIII 11 350.38 5 11
18. Nabard XIX 6 217.21 0 4
19. PMGSY VIII 26 1347.54 0 7
20. 13
th Finance commission
Additional 2 19.81 0 0
21. 13th Finance commission 21 470.39 9 21
22. Plastic Roads 3 48.82 0 3
23. Construction of Baby Friendly
Toilet 427 75.55 427 427
24. Provision of water supply to
school toilet 85 84.52 85 85
25. Village panchayat service
centre 168 530.79 0 0
26. Block panchayat service centre 6 36.20 0 0
27. NBA IHHL 17937 1172.57 1459 13320
28. Rural Road Service centre 38 1005.73 4 38
29. Others (Specify)- Biogas 58 1.80 22 22
Total 40177 36144.89 11228 32949
Source: P.O., DRDA, Tirunelveli.
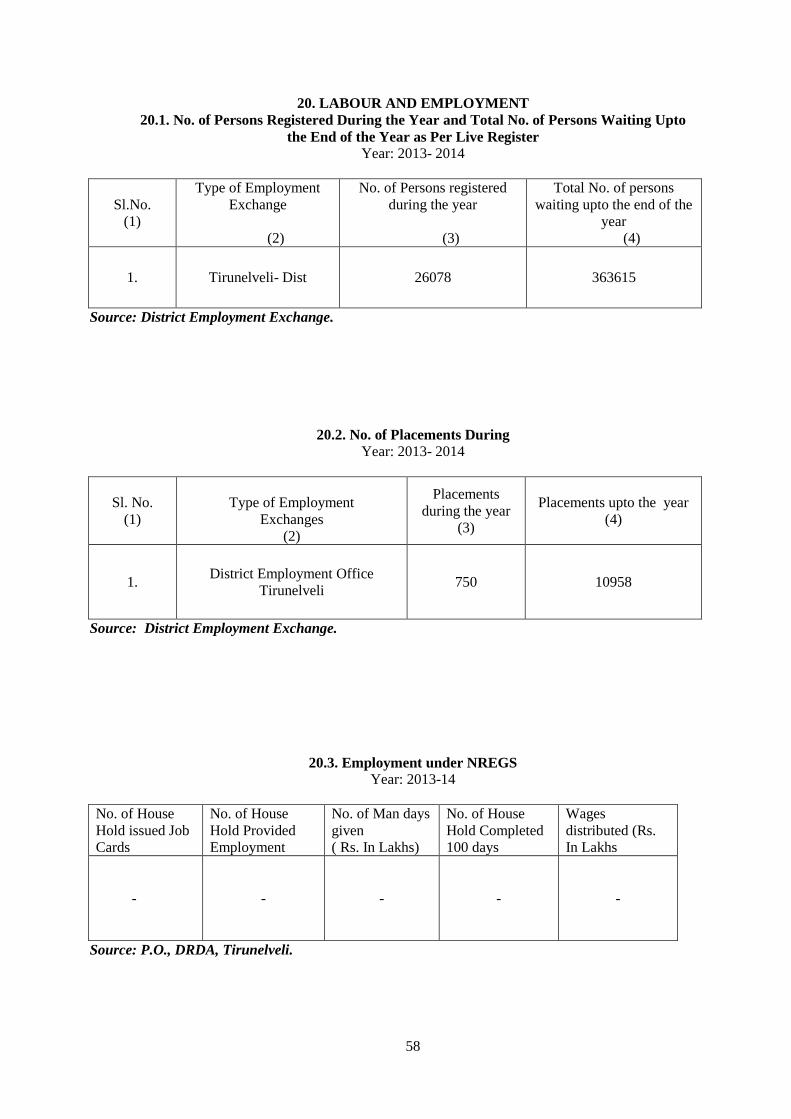
58
20. LABOUR AND EMPLOYMENT
20.1. No. of Persons Registered During the Year and Total No. of Persons Waiting Upto
the End of the Year as Per Live Register Year: 2013- 2014
Sl.No.
(1)
Type of Employment
Exchange
(2)
No. of Persons registered
during the year
(3)
Total No. of persons
waiting upto the end of the
year
(4)
1. Tirunelveli- Dist 26078 363615
Source: District Employment Exchange.
20.2. No. of Placements During
Year: 2013- 2014
Sl. No.
(1)
Type of Employment
Exchanges
(2)
Placements
during the year
(3)
Placements upto the year
(4)
1. District Employment Office
Tirunelveli 750 10958
Source: District Employment Exchange.
20.3. Employment under NREGS
Year: 2013-14
No. of House
Hold issued Job
Cards
No. of House
Hold Provided
Employment
No. of Man days
given
( Rs. In Lakhs)
No. of House
Hold Completed
100 days
Wages
distributed (Rs.
In Lakhs
-
- - - -
Source: P.O., DRDA, Tirunelveli.
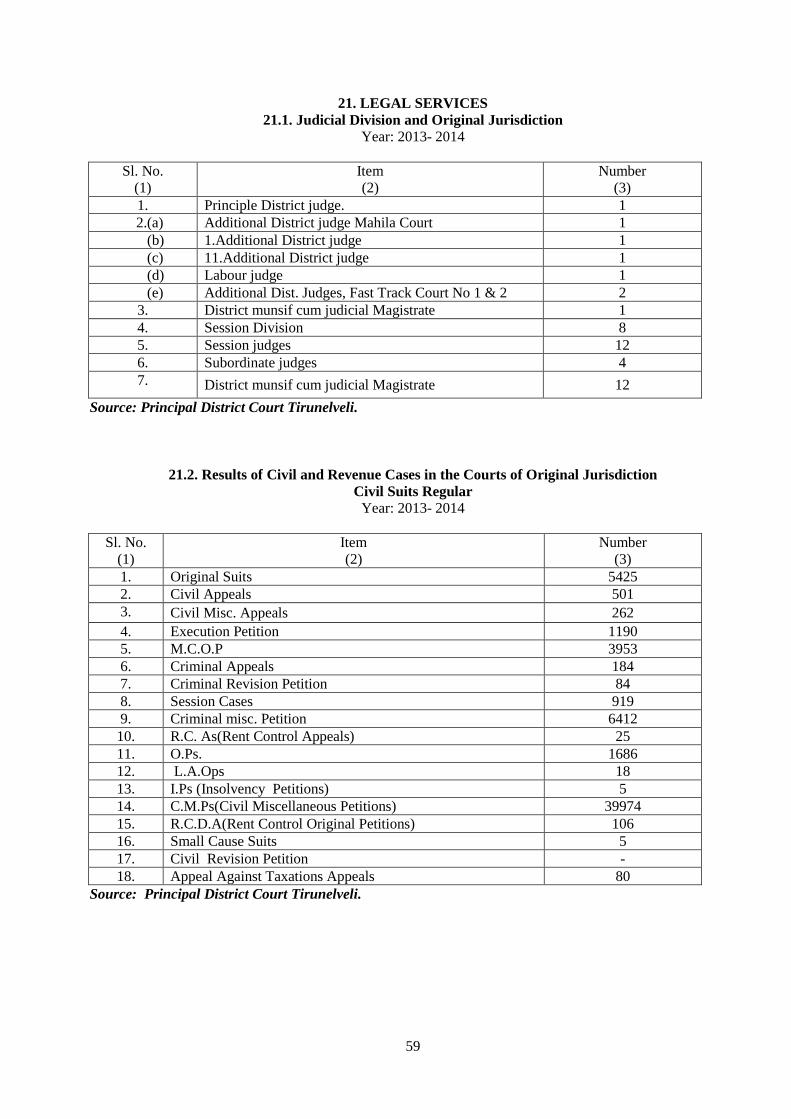
59
21. LEGAL SERVICES
21.1. Judicial Division and Original Jurisdiction
Year: 2013- 2014
Sl. No.
(1)
Item
(2)
Number
(3)
1. Principle District judge. 1
2.(a) Additional District judge Mahila Court 1
(b) 1.Additional District judge 1
(c) 11.Additional District judge 1
(d) Labour judge 1
(e) Additional Dist. Judges, Fast Track Court No 1 & 2 2
3. District munsif cum judicial Magistrate 1
4. Session Division 8
5. Session judges 12
6. Subordinate judges 4
7. District munsif cum judicial Magistrate 12
Source: Principal District Court Tirunelveli.
21.2. Results of Civil and Revenue Cases in the Courts of Original Jurisdiction
Civil Suits Regular
Year: 2013- 2014
Sl. No.
(1)
Item
(2)
Number
(3)
1. Original Suits 5425
2. Civil Appeals 501
3. Civil Misc. Appeals 262
4. Execution Petition 1190
5. M.C.O.P 3953
6. Criminal Appeals 184
7. Criminal Revision Petition 84
8. Session Cases 919
9. Criminal misc. Petition 6412
10. R.C. As(Rent Control Appeals) 25
11. O.Ps. 1686
12. L.A.Ops 18
13. I.Ps (Insolvency Petitions) 5
14. C.M.Ps(Civil Miscellaneous Petitions) 39974
15. R.C.D.A(Rent Control Original Petitions) 106
16. Small Cause Suits 5
17. Civil Revision Petition -
18. Appeal Against Taxations Appeals 80
Source: Principal District Court Tirunelveli.

60
21.3. Nature of Free Legal Available and No. of Beneficiaries, No. of Cases Disposed of in
Lok Adalat during the
Year: 2013- 2014
Sl. No.
(1)
Nature of free legal available
(2)
No. of Beneficiaries
(3)
No. of cases disposed of in
Lok Adalat
(4)
1. M.C.O.P - 467
2. Bank Suits - 3
3. H.M.O.Ps - 19
4. Civil Suits - 154
5. Compoundable I.P.C - 32749
6. Maintenance - 1
7. Labour Case - 17
8. Taxation - -
9. Cheque - 47
TOTAL 33457
Source: Principal District Court Tirunelveli.
21.4. No. of Advocates Practicing in Courts
Year: 2013- 2014
Sl. No.
(1)
Name of the Court
(2)
No. of Advocates Practicing
(3)
1. Tirunelveli Courts 1500
2. Ambasamudram Courts 252
3. Tenkasi Courts 252
4. Sankarankoil Courts 220
5. Valliyoor Courts 126
6. Nanguneri Courts 84
7. Cheranmahadevi Courts 45
8. Shenkottai Courts 60
9. Sivagiri Courts 76
Source: Principal District Court Tirunelveli.

61
22. LIBRARIES
22.1. List of Head and Branch Libraries in the district all the details of Members, Books
available and Readers.
Year: 2013- 2014
Place/Name of the
Head/Branch
(1)
Members (Nos.)
(2)
No. of Books available
(3)
Number of
Readers
(4)
Tirunelveli Dist
Central Library 36392 145138 73802
Branch Library 196197 1157908 2104039
Rural Library 50648 453253 1077661
Source: District Library Officer, Tirunelveli.-2.
22.2. Number of Libraries housed in Government Building/Rental Building.
Year: 2013 – 2014
Libraries in Government Building (in Nos.) Free
Building Libraries in Rental Building in (Nos.)
60 97
35
Source: District Library Officer, Tirunelveli.-2.
22.3 Number of Reading Rooms
Year: 2013 – 2014
Sl. No.
(1)
Type of Libraries
(2)
Number of Libraries
(3)
Number of Reading Room
(4)
1. Central library 1 1
2. Children Library 1 1
3. Branch Library 102 102
4. Rural Library 82 82
5. AGAMT Library NIL NIL
Source: District Library Officer, Tirunelveli.-2.

62
23. MINING AND QUARRYING
23.1. Number of Mining and quarrying units in the District
Year: 2013 – 2014
Sl. No. Name of Taluk
Major Minerals Minor Minerals
Lime
Stone Garnet
Rough
Stone Earth Granite Kankar
1. Tirunelveli 32 - 49 - 2 -
2. Palayamkottai 3 - 21 - 2 -
3. Sankarankoil 13 - 20 - 3 2
4. Ambasamudram 10 - 22 - 15 -
5. Nanguneri 3 - 2 - 2 -
6. Radhapuram 4 53 29 2 3 -
7. Tenkasi - - 11 - 1 -
8. Sengottai - - 8 - - -
9. Sivagiri 6 - 1 - - -
10. Veerakeralampudur - - 13 - 0 2
11. Alangulam 2 - 14 - 1 -
Total 73 53 190 2 29 4
Source: Assistant Director of Mines, Tirunelveli.
23.2. Classification-wise Production
Year 2013-2014
Sl. No. Name of the Minerals Production (in tones/unit)
1. Limstone 1133784.00
2. Garnet 1088000.00
3. Roughstone 1803246.00
4. Gravel/Earth 678906.00
5. Granite 30515.06
6. Kankar 186.00
Source: Assistant Director of Mines, Tirunelveli.
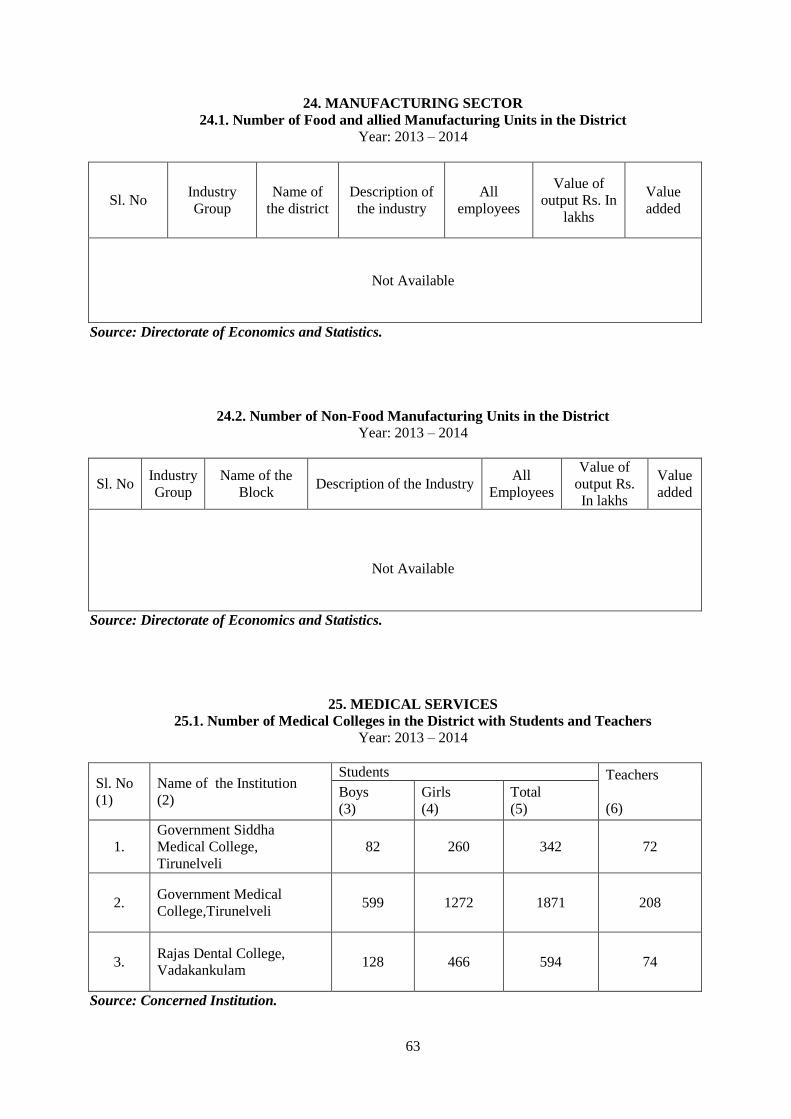
63
24. MANUFACTURING SECTOR
24.1. Number of Food and allied Manufacturing Units in the District
Year: 2013 – 2014
Sl. No Industry
Group
Name of
the district
Description of
the industry
All
employees
Value of
output Rs. In
lakhs
Value
added
Not Available
Source: Directorate of Economics and Statistics.
24.2. Number of Non-Food Manufacturing Units in the District
Year: 2013 – 2014
Sl. No Industry
Group
Name of the
Block Description of the Industry
All
Employees
Value of
output Rs.
In lakhs
Value
added
Not Available
Source: Directorate of Economics and Statistics.
25. MEDICAL SERVICES
25.1. Number of Medical Colleges in the District with Students and Teachers
Year: 2013 – 2014
Sl. No
(1)
Name of the Institution
(2)
Students Teachers
(6) Boys
(3)
Girls
(4)
Total
(5)
1.
Government Siddha
Medical College,
Tirunelveli
82 260 342 72
2. Government Medical
College,Tirunelveli 599 1272 1871 208
3. Rajas Dental College,
Vadakankulam 128 466 594 74
Source: Concerned Institution.
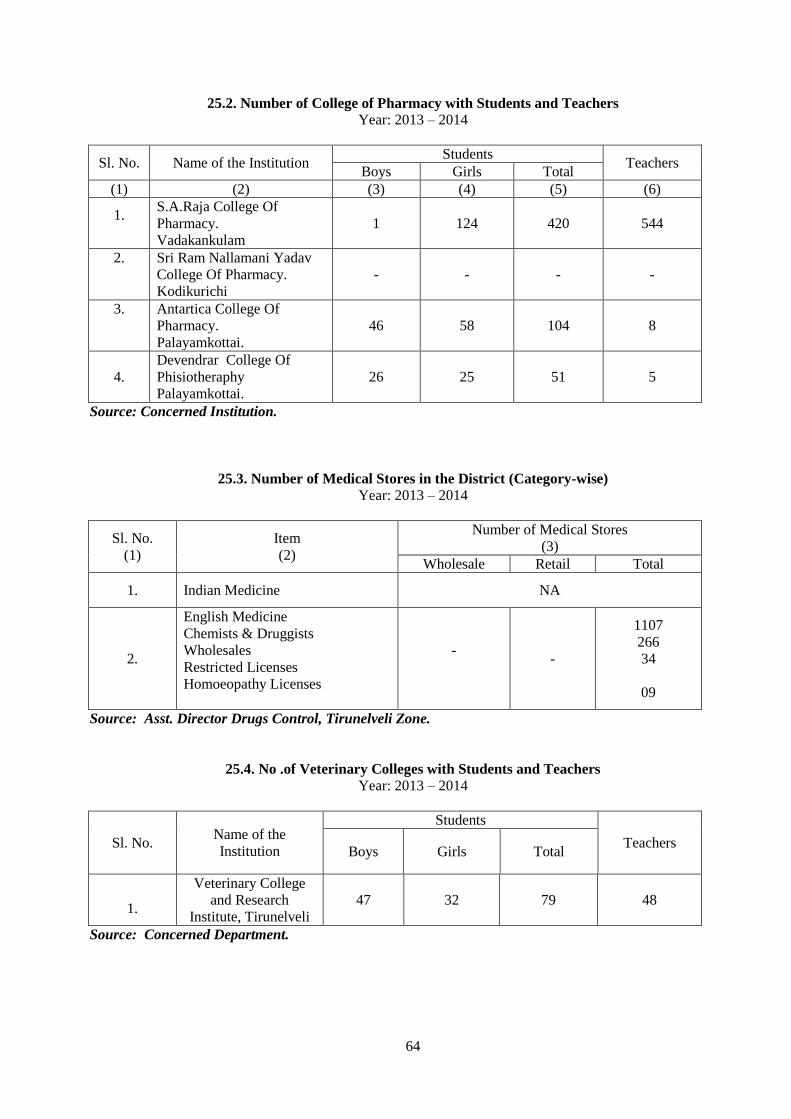
64
25.2. Number of College of Pharmacy with Students and Teachers
Year: 2013 – 2014
Sl. No. Name of the Institution Students
Teachers Boys Girls Total
(1) (2) (3) (4) (5) (6)
1.
S.A.Raja College Of
Pharmacy.
Vadakankulam
1 124 420 544
2.
Sri Ram Nallamani Yadav
College Of Pharmacy.
Kodikurichi
- - - -
3.
Antartica College Of
Pharmacy.
Palayamkottai.
46 58 104 8
4.
Devendrar College Of
Phisiotheraphy
Palayamkottai.
26 25 51 5
Source: Concerned Institution.
25.3. Number of Medical Stores in the District (Category-wise)
Year: 2013 – 2014
Sl. No.
(1)
Item
(2)
Number of Medical Stores
(3)
Wholesale Retail Total
1. Indian Medicine NA
2.
English Medicine
Chemists & Druggists
Wholesales
Restricted Licenses
Homoeopathy Licenses
-
-
1107
266
34
09
Source: Asst. Director Drugs Control, Tirunelveli Zone.
25.4. No .of Veterinary Colleges with Students and Teachers
Year: 2013 – 2014
Sl. No. Name of the
Institution
Students
Teachers Boys Girls Total
1.
Veterinary College
and Research
Institute, Tirunelveli
47 32 79 48
Source: Concerned Department.
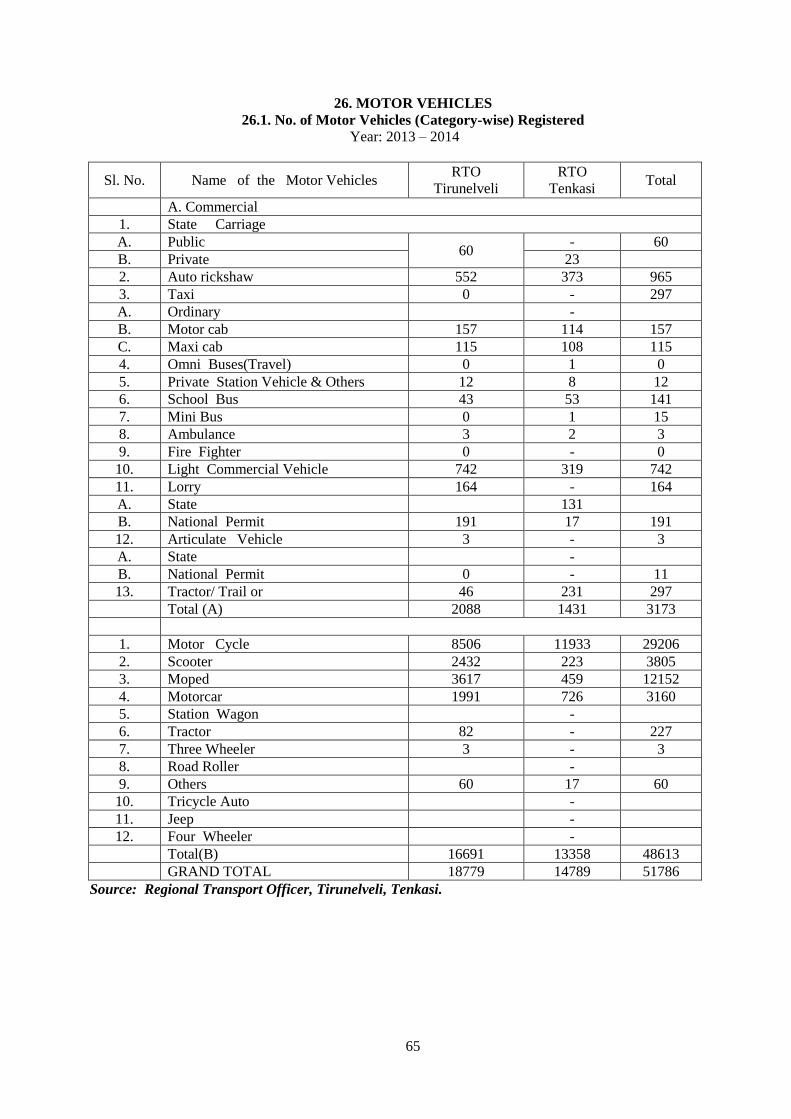
65
26. MOTOR VEHICLES
26.1. No. of Motor Vehicles (Category-wise) Registered
Year: 2013 – 2014
Sl. No. Name of the Motor Vehicles RTO
Tirunelveli
RTO
Tenkasi Total
A. Commercial
1. State Carriage
A. Public 60
- 60
B. Private 23
2. Auto rickshaw 552 373 965
3. Taxi 0 - 297
A. Ordinary -
B. Motor cab 157 114 157
C. Maxi cab 115 108 115
4. Omni Buses(Travel) 0 1 0
5. Private Station Vehicle & Others 12 8 12
6. School Bus 43 53 141
7. Mini Bus 0 1 15
8. Ambulance 3 2 3
9. Fire Fighter 0 - 0
10. Light Commercial Vehicle 742 319 742
11. Lorry 164 - 164
A. State 131
B. National Permit 191 17 191
12. Articulate Vehicle 3 - 3
A. State -
B. National Permit 0 - 11
13. Tractor/ Trail or 46 231 297
Total (A) 2088 1431 3173
1. Motor Cycle 8506 11933 29206
2. Scooter 2432 223 3805
3. Moped 3617 459 12152
4. Motorcar 1991 726 3160
5. Station Wagon -
6. Tractor 82 - 227
7. Three Wheeler 3 - 3
8. Road Roller -
9. Others 60 17 60
10. Tricycle Auto -
11. Jeep -
12. Four Wheeler -
Total(B) 16691 13358 48613
GRAND TOTAL 18779 14789 51786
Source: Regional Transport Officer, Tirunelveli, Tenkasi.
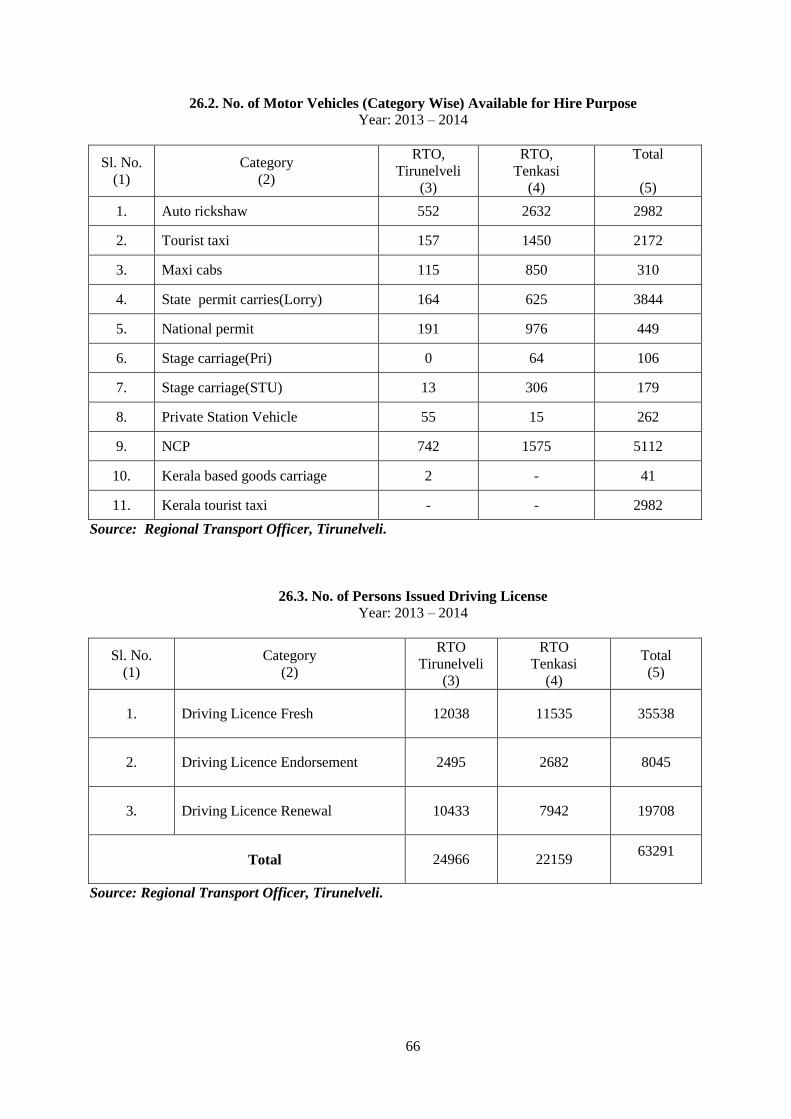
66
26.2. No. of Motor Vehicles (Category Wise) Available for Hire Purpose
Year: 2013 – 2014
Sl. No.
(1)
Category
(2)
RTO,
Tirunelveli
(3)
RTO,
Tenkasi
(4)
Total
(5)
1. Auto rickshaw 552 2632 2982
2. Tourist taxi 157 1450 2172
3. Maxi cabs 115 850 310
4. State permit carries(Lorry) 164 625 3844
5. National permit 191 976 449
6. Stage carriage(Pri) 0 64 106
7. Stage carriage(STU) 13 306 179
8. Private Station Vehicle 55 15 262
9. NCP 742 1575 5112
10. Kerala based goods carriage 2 - 41
11. Kerala tourist taxi - - 2982
Source: Regional Transport Officer, Tirunelveli.
26.3. No. of Persons Issued Driving License
Year: 2013 – 2014
Sl. No.
(1)
Category
(2)
RTO
Tirunelveli
(3)
RTO
Tenkasi
(4)
Total
(5)
1. Driving Licence Fresh 12038 11535 35538
2. Driving Licence Endorsement 2495 2682 8045
3. Driving Licence Renewal 10433 7942 19708
Total 24966 22159 63291
Source: Regional Transport Officer, Tirunelveli.
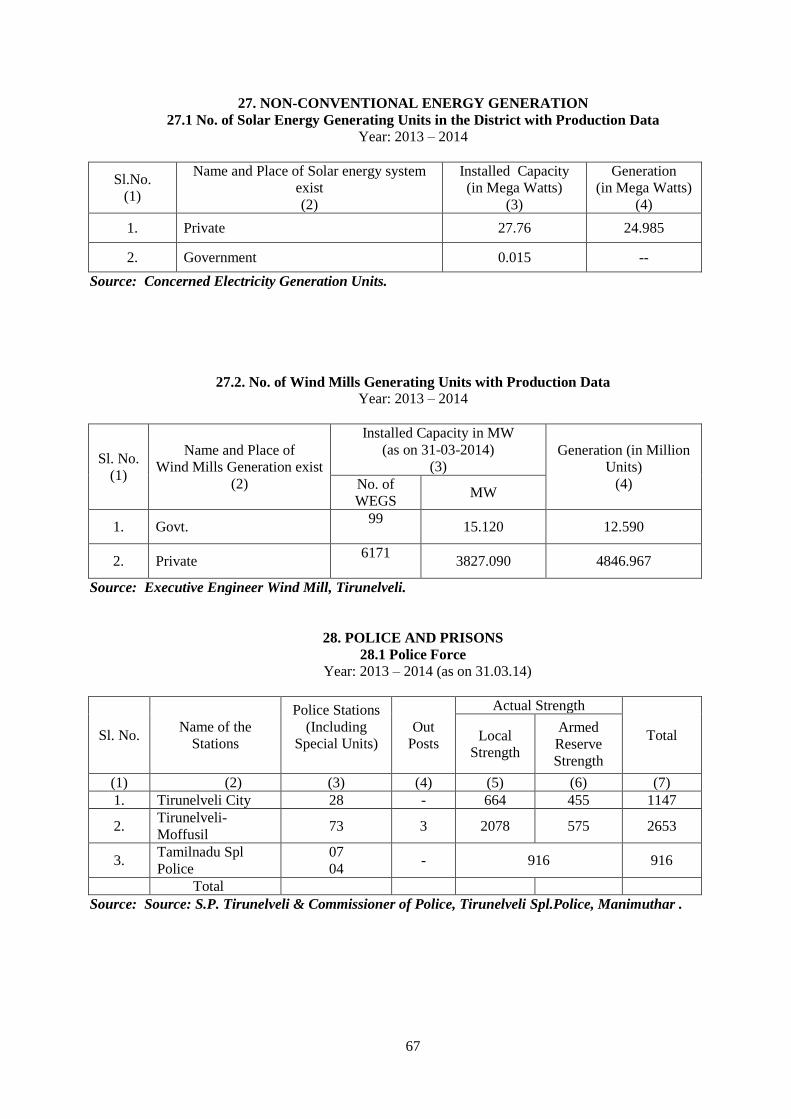
67
27. NON-CONVENTIONAL ENERGY GENERATION
27.1 No. of Solar Energy Generating Units in the District with Production Data
Year: 2013 – 2014
Sl.No.
(1)
Name and Place of Solar energy system
exist
(2)
Installed Capacity
(in Mega Watts)
(3)
Generation
(in Mega Watts)
(4)
1. Private 27.76 24.985
2. Government 0.015 --
Source: Concerned Electricity Generation Units.
27.2. No. of Wind Mills Generating Units with Production Data
Year: 2013 – 2014
Sl. No.
(1)
Name and Place of
Wind Mills Generation exist
(2)
Installed Capacity in MW
(as on 31-03-2014)
(3) Generation (in Million
Units)
(4) No. of
WEGS MW
1. Govt. 99
15.120 12.590
2. Private 6171
3827.090 4846.967
Source: Executive Engineer Wind Mill, Tirunelveli.
28. POLICE AND PRISONS
28.1 Police Force
Year: 2013 – 2014 (as on 31.03.14)
Sl. No. Name of the
Stations
Police Stations
(Including
Special Units)
Out
Posts
Actual Strength
Total Local
Strength
Armed
Reserve
Strength
(1) (2) (3) (4) (5) (6) (7)
1. Tirunelveli City 28 - 664 455 1147
2. Tirunelveli-
Moffusil 73 3 2078 575 2653
3. Tamilnadu Spl
Police
07
04 - 916 916
Total
Source: Source: S.P. Tirunelveli & Commissioner of Police, Tirunelveli Spl.Police, Manimuthar .
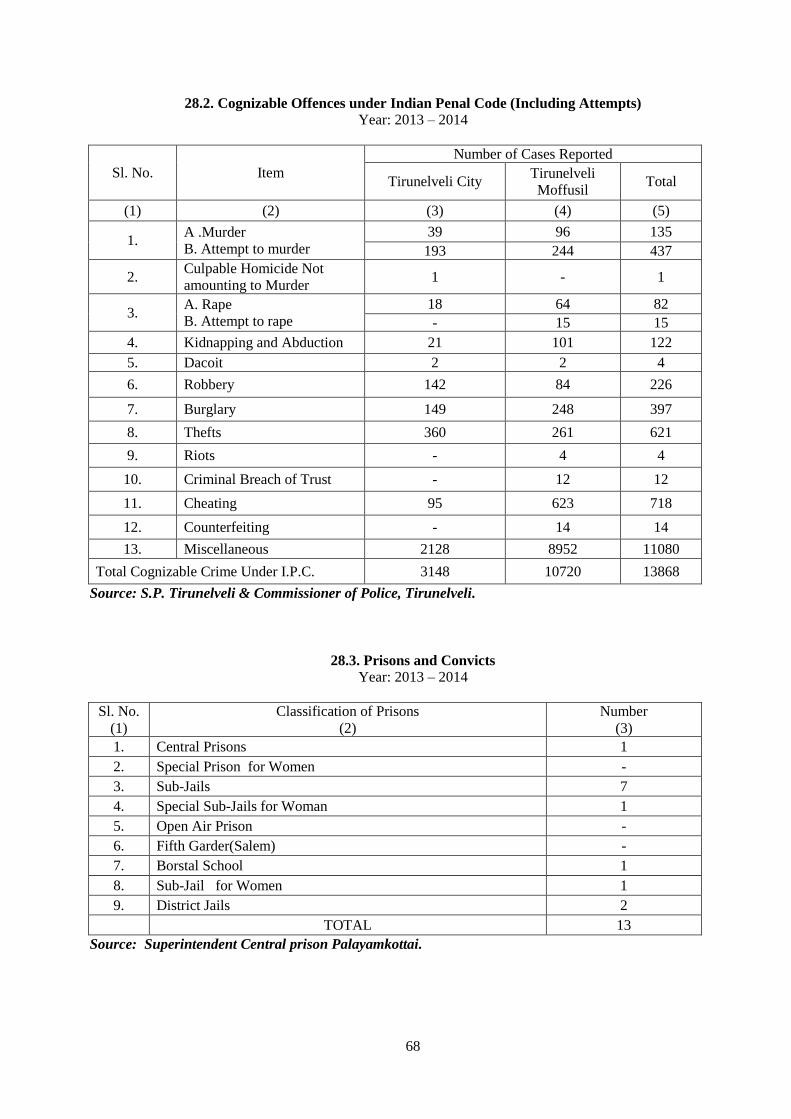
68
28.2. Cognizable Offences under Indian Penal Code (Including Attempts)
Year: 2013 – 2014
Sl. No. Item
Number of Cases Reported
Tirunelveli City Tirunelveli
Moffusil Total
(1) (2) (3) (4) (5)
1. A .Murder
B. Attempt to murder
39 96 135
193 244 437
2. Culpable Homicide Not
amounting to Murder 1 - 1
3. A. Rape
B. Attempt to rape
18 64 82
- 15 15
4. Kidnapping and Abduction 21 101 122
5. Dacoit 2 2 4
6. Robbery 142 84 226
7. Burglary 149 248 397
8. Thefts 360 261 621
9. Riots - 4 4
10. Criminal Breach of Trust - 12 12
11. Cheating 95 623 718
12. Counterfeiting - 14 14
13. Miscellaneous 2128 8952 11080
Total Cognizable Crime Under I.P.C. 3148 10720 13868
Source: S.P. Tirunelveli & Commissioner of Police, Tirunelveli.
28.3. Prisons and Convicts
Year: 2013 – 2014
Sl. No.
(1)
Classification of Prisons
(2)
Number
(3)
1. Central Prisons 1
2. Special Prison for Women -
3. Sub-Jails 7
4. Special Sub-Jails for Woman 1
5. Open Air Prison -
6. Fifth Garder(Salem) -
7. Borstal School 1
8. Sub-Jail for Women 1
9. District Jails 2
TOTAL 13
Source: Superintendent Central prison Palayamkottai.
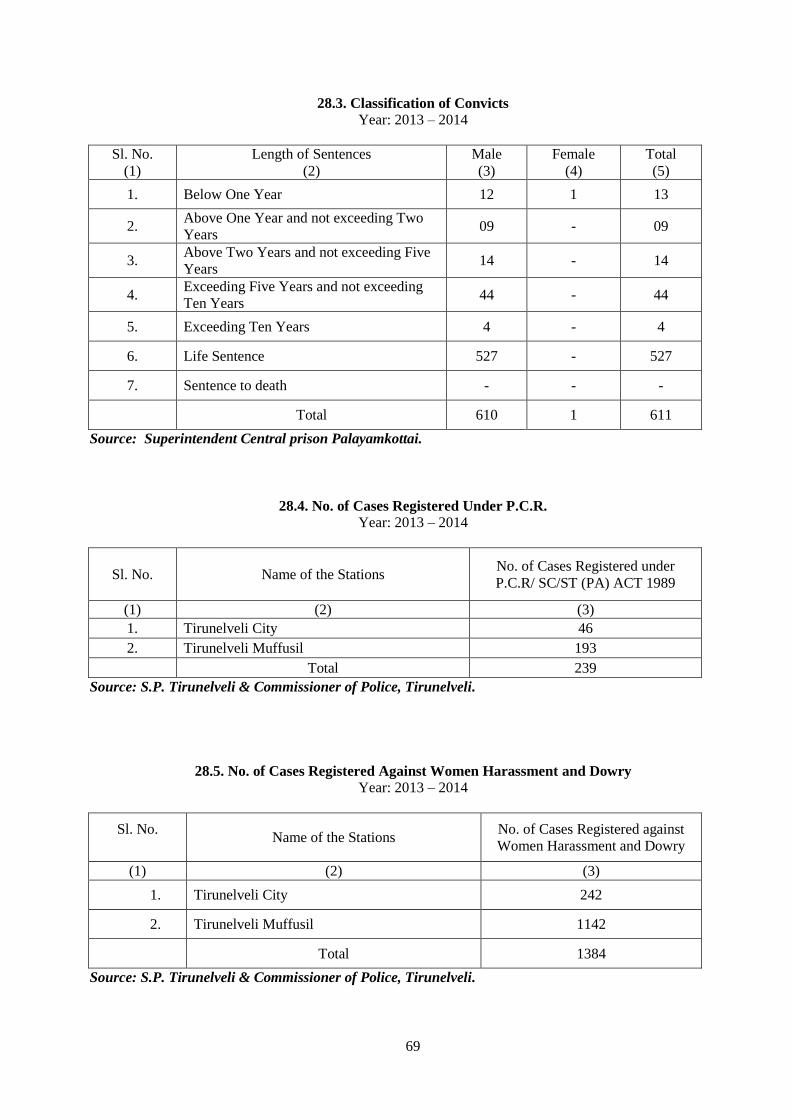
69
28.3. Classification of Convicts
Year: 2013 – 2014
Sl. No.
(1)
Length of Sentences
(2)
Male
(3)
Female
(4)
Total
(5)
1. Below One Year 12 1 13
2. Above One Year and not exceeding Two
Years 09 - 09
3. Above Two Years and not exceeding Five
Years 14 - 14
4. Exceeding Five Years and not exceeding
Ten Years 44 - 44
5. Exceeding Ten Years 4 - 4
6. Life Sentence 527 - 527
7. Sentence to death - - -
Total 610 1 611
Source: Superintendent Central prison Palayamkottai.
28.4. No. of Cases Registered Under P.C.R.
Year: 2013 – 2014
Sl. No. Name of the Stations No. of Cases Registered under
P.C.R/ SC/ST (PA) ACT 1989
(1) (2) (3)
1. Tirunelveli City 46
2. Tirunelveli Muffusil 193
Total 239
Source: S.P. Tirunelveli & Commissioner of Police, Tirunelveli.
28.5. No. of Cases Registered Against Women Harassment and Dowry
Year: 2013 – 2014
Sl. No.
Name of the Stations
No. of Cases Registered against
Women Harassment and Dowry
(1) (2) (3)
1. Tirunelveli City 242
2. Tirunelveli Muffusil 1142
Total 1384
Source: S.P. Tirunelveli & Commissioner of Police, Tirunelveli.

70
29. PUBLIC HEALTH
29.1. Public Health and Medical Services Rendered by Organizations and Individual
Year: 2013- 2014
Sl. No.
(1)
Items
(2)
Numbers
(3)
1. Hospitals (Allopathy) NA
2. Dispensaries NA
3. Sanitary NA
4. Nursing Home NA
5. Maternity & Child Welfare Clinic NA
6. Ayurvedic NA
7. Unani NA
8. Homeopathy NA
Source: Concerned Office.
29.2. No. of Primary Health Centres with Sub-Centres
Year: 2013 – 2014
Sl. No. Name of the Block / Municipality No. of Primary Health
Centres No. of Sub-Centre
(1) (2) (3) (4)
1. Ambasamudram 3 26
2. Cheranmahadevi 4 20
3. Kadayam 3 17
4. Kalakadu 3 17
5. Manur 4 22
6. Nanguneri 5 23
7. Palayamkottai 5 26
8. Pappakudi 2 16
9. Radhapuram 4 23
10. Valliyoor 4 27
11. Alangulam 3 20
12. Kadayanallur 3 12
13. Keelapavoor 5 26
14. Kuruvikulam 4 2
15. Melaneelithanallur 3 17
16. Schenkottai 4 12
17. Sankarankoil 4 18
18. Tenkasi 3 16
19. Vasudevanalloor 3 25
Total 69 383
Source: Deputy Director, Health, Tirunelveli & S.Koil.

71
30. PRINTING AND PUBLICATION
30.1. No. of News Papers, Weekly Magazines, Monthly Magazines Etc., Published
Year: 2013 – 2014
Sl. No.
(1)
Name of the News Paper
(2)
Language of Publication
(3)
Type of Periodicals
(4)
1. Sri Dharmabathy - -
2. The Missionary intelligence - -
3. Magalir Ungal Choice - -
4. Deva Prasannam - -
5. Jesus gives Victory - -
6. Thaluka Murasu - -
7. Samuthaya Vizhipunarvu sakthi Sudar - -
8. Thinathanthi Tamil Daily Paper
9. Thinamalar Tamil Daily Paper
10. Thinamani Tamil Daily Paper
11. Thinakaran Tamil Daily Paper
12. Thinapoomi Tamil Daily Paper
13. Malaimurasu Tamil Daily Paper
14. Malaimalar Tamil Daily Paper
15. Indian Express Tamil Daily Paper
Source: R.D.O., Tirunelveli, Cheranmahadevi, Tenkasi.
30.2. No. of Publishers in the District Other than News Papers and Magazines
Year: 2013 – 2014
Sl. No.
(1)
Name of the Taluk
(2)
No. of Publishers
(3)
1. Tirunelveli Nil
Source: R.D.O., Tirunelveli, Cheranmahadevi, Tenkasi.
30.3. No. of Printing Presses in the District
Year: 2013 – 2014
Sl. No.
(1)
Name of the Block /
Municipality
(2)
No. of the Printing
Press/ issued
Acknowledgement
during 12-13
(3)
Type of the Press
(Letter Press/Off set/Litho/Colour
Graphics)
(4)
1. Not Available
Source: District Industrial Centers.
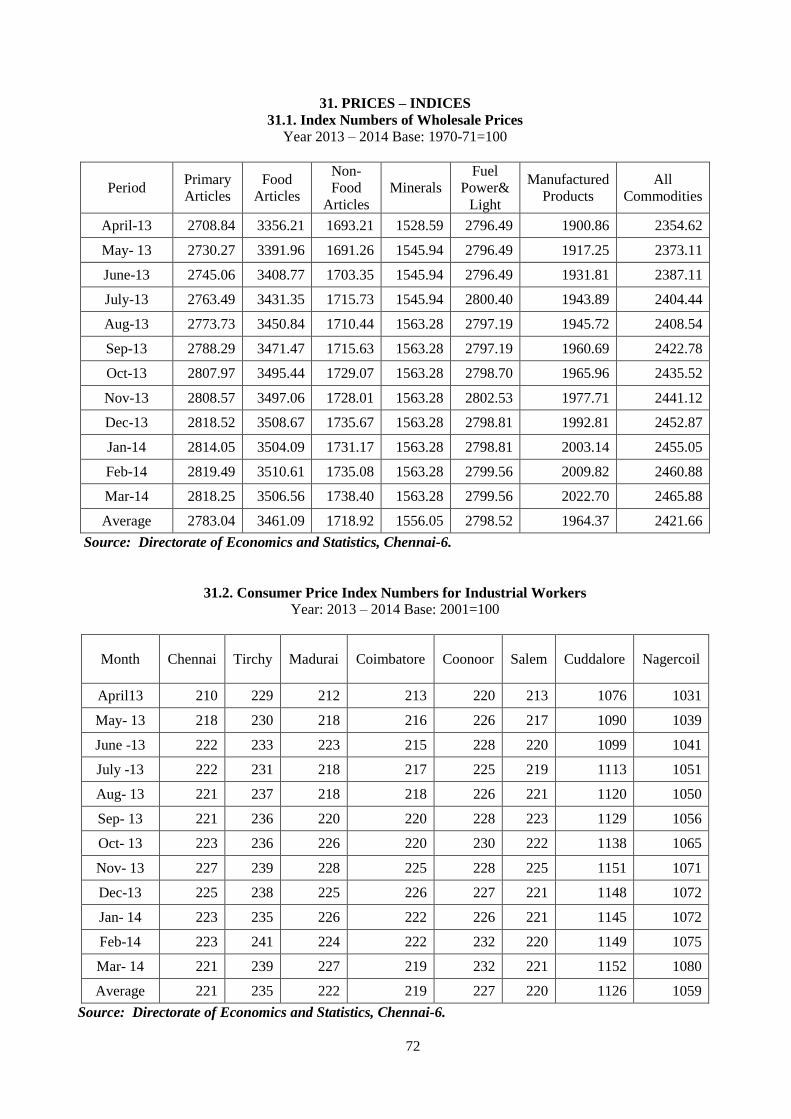
72
31. PRICES – INDICES
31.1. Index Numbers of Wholesale Prices
Year 2013 – 2014 Base: 1970-71=100
Period Primary
Articles
Food
Articles
Non-
Food
Articles
Minerals
Fuel
Power&
Light
Manufactured
Products
All
Commodities
April-13 2708.84 3356.21 1693.21 1528.59 2796.49 1900.86 2354.62
May- 13 2730.27 3391.96 1691.26 1545.94 2796.49 1917.25 2373.11
June-13 2745.06 3408.77 1703.35 1545.94 2796.49 1931.81 2387.11
July-13 2763.49 3431.35 1715.73 1545.94 2800.40 1943.89 2404.44
Aug-13 2773.73 3450.84 1710.44 1563.28 2797.19 1945.72 2408.54
Sep-13 2788.29 3471.47 1715.63 1563.28 2797.19 1960.69 2422.78
Oct-13 2807.97 3495.44 1729.07 1563.28 2798.70 1965.96 2435.52
Nov-13 2808.57 3497.06 1728.01 1563.28 2802.53 1977.71 2441.12
Dec-13 2818.52 3508.67 1735.67 1563.28 2798.81 1992.81 2452.87
Jan-14 2814.05 3504.09 1731.17 1563.28 2798.81 2003.14 2455.05
Feb-14 2819.49 3510.61 1735.08 1563.28 2799.56 2009.82 2460.88
Mar-14 2818.25 3506.56 1738.40 1563.28 2799.56 2022.70 2465.88
Average 2783.04 3461.09 1718.92 1556.05 2798.52 1964.37 2421.66
Source: Directorate of Economics and Statistics, Chennai-6.
31.2. Consumer Price Index Numbers for Industrial Workers
Year: 2013 – 2014 Base: 2001=100
Month Chennai Tirchy Madurai Coimbatore Coonoor Salem Cuddalore Nagercoil
April13 210 229 212 213 220 213 1076 1031
May- 13 218 230 218 216 226 217 1090 1039
June -13 222 233 223 215 228 220 1099 1041
July -13 222 231 218 217 225 219 1113 1051
Aug- 13 221 237 218 218 226 221 1120 1050
Sep- 13 221 236 220 220 228 223 1129 1056
Oct- 13 223 236 226 220 230 222 1138 1065
Nov- 13 227 239 228 225 228 225 1151 1071
Dec-13 225 238 225 226 227 221 1148 1072
Jan- 14 223 235 226 222 226 221 1145 1072
Feb-14 223 241 224 222 232 220 1149 1075
Mar- 14 221 239 227 219 232 221 1152 1080
Average 221 235 222 219 227 220 1126 1059
Source: Directorate of Economics and Statistics, Chennai-6.
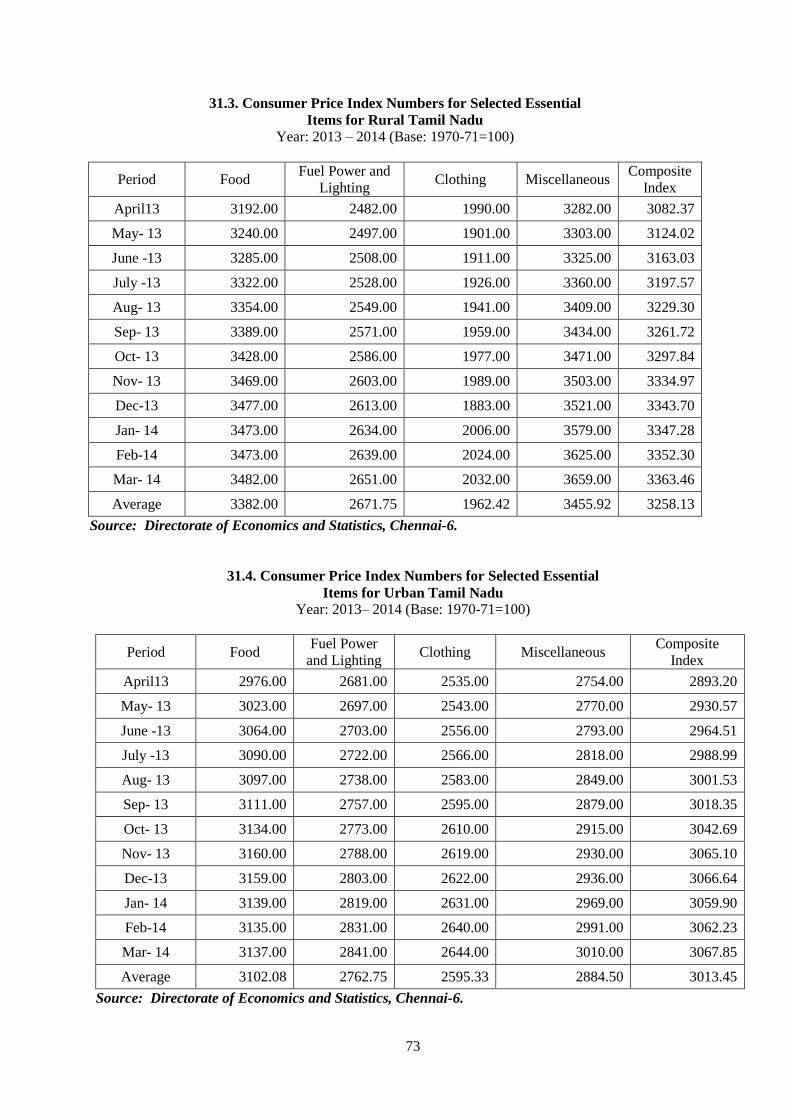
73
31.3. Consumer Price Index Numbers for Selected Essential
Items for Rural Tamil Nadu
Year: 2013 – 2014 (Base: 1970-71=100)
Period Food Fuel Power and
Lighting Clothing Miscellaneous
Composite
Index
April13 3192.00 2482.00 1990.00 3282.00 3082.37
May- 13 3240.00 2497.00 1901.00 3303.00 3124.02
June -13 3285.00 2508.00 1911.00 3325.00 3163.03
July -13 3322.00 2528.00 1926.00 3360.00 3197.57
Aug- 13 3354.00 2549.00 1941.00 3409.00 3229.30
Sep- 13 3389.00 2571.00 1959.00 3434.00 3261.72
Oct- 13 3428.00 2586.00 1977.00 3471.00 3297.84
Nov- 13 3469.00 2603.00 1989.00 3503.00 3334.97
Dec-13 3477.00 2613.00 1883.00 3521.00 3343.70
Jan- 14 3473.00 2634.00 2006.00 3579.00 3347.28
Feb-14 3473.00 2639.00 2024.00 3625.00 3352.30
Mar- 14 3482.00 2651.00 2032.00 3659.00 3363.46
Average 3382.00 2671.75 1962.42 3455.92 3258.13
Source: Directorate of Economics and Statistics, Chennai-6.
31.4. Consumer Price Index Numbers for Selected Essential
Items for Urban Tamil Nadu
Year: 2013– 2014 (Base: 1970-71=100)
Period Food Fuel Power
and Lighting Clothing Miscellaneous
Composite
Index
April13 2976.00 2681.00 2535.00 2754.00 2893.20
May- 13 3023.00 2697.00 2543.00 2770.00 2930.57
June -13 3064.00 2703.00 2556.00 2793.00 2964.51
July -13 3090.00 2722.00 2566.00 2818.00 2988.99
Aug- 13 3097.00 2738.00 2583.00 2849.00 3001.53
Sep- 13 3111.00 2757.00 2595.00 2879.00 3018.35
Oct- 13 3134.00 2773.00 2610.00 2915.00 3042.69
Nov- 13 3160.00 2788.00 2619.00 2930.00 3065.10
Dec-13 3159.00 2803.00 2622.00 2936.00 3066.64
Jan- 14 3139.00 2819.00 2631.00 2969.00 3059.90
Feb-14 3135.00 2831.00 2640.00 2991.00 3062.23
Mar- 14 3137.00 2841.00 2644.00 3010.00 3067.85
Average 3102.08 2762.75 2595.33 2884.50 3013.45
Source: Directorate of Economics and Statistics, Chennai-6.

74
32. QUALITY CONTROL
32.1. List of Industrial/Establishment Units Having Quality Control Facilities and the
Products Subjected to Quality Control.
Year: 2013– 2014
Sl. No.
(1)
List of Industries
(2)
Establishment Units having,
Quality Control Facilities
(3)
Products subjected to
Quality Control
(4)
1. Cement India-Cements Cement
2. Cloth Manufacturing Madura-Coats Clothes
3. Sugar Factories 1.Dharani Sugars
2.Em.Pee.Sugars
1.Sugar
2.Power Generation
Source: Concerned Office.
33. REGISTRATION
33.1. No. of Registration Offices in the District
Year: 2013- 2014
Sl. No.
(1)
Name of the Block / Municipalities
(2)
No. of Registration Office
(3)
1. Tirunelveli – Corporation 6
MUNICIPALITY
1. Sankarankoil 1
2. Pluingudi 1
3. Kadayanallur 1
4. Tenkasi 2
5. Shencottai 1
BLOCK
1. Alangulam 2
2. Kadayanallur 1
3. Sankarankoil 2
4. Vasudevanallur 2
5. Keelapavoor 1
6. Tenkasi 2
7. Melaneelithanallur 1
8. Nanguneri 2
9. Radhapuram 2
10. Kalakadu 2
11. Manur 1
12. Valliyoor 2
13. Cheranmahadevi 3
14. Ambasamudram 3
15. Kadayam 1
16. Pappakudi 1
Total 40
Source: Deputy Inspector General of Registration Tirunelveli -1.
**Source 2013.

75
33.2. Registration and Aggregate Value of Properties Transferred
Year 2013-2014
No. of Registration
(Moveable and Immovable)
Aggregate Value of Properties Transferred
(Moveable and Immovable )
- -
Source: Deputy Inspector General of Registration Tirunelveli -1.
**Source 2013.
34. REPAIRS AND SERVICE
34.1. Authorised Automobiles Repair and Service Stations
Year: 2013– 2014
Name of the Block / Municipalities
(1)
Authorized Automobiles Repair and Service (in No’s.)
(2)
Not Available
34.2. Authorised Electrical and Electronic Goods Repair and Service Units
Year: 2013 – 2014
Name of the Block / Municipalities
(1)
Electrical and Electronic goods Repair and Service
Units(in No’s)
(2)
Not Available
35.1. HOTELS
Year: 2013 – 2014
Sl. No.
(1)
Name of District
(2)
No. of Hotels
(3)
1.
Tirunelveli -
.Source: Deputy Commissioner (CT), Tirunelveli.

76
35.2. Details of Hotels
Year: 2013 – 2014
Sl. No.
(1)
Name of District
(2)
No of Hotels with
Lodging Facilities
(3)
No of the Hotels without
Lodging Facilities
(4)
1.
Tirunelveli
- -
Source: Deputy Commissioner (CT), Tirunelveli.
36. RECREATION AND CULTURAL SERVICES
36.1. List of Cinema Theatres and their Capacities
Year: 2013 – 2014
Sl. No.
(1)
Name of the District-Tirunelveli
(2)
No. of the Cinema Theatres
(3)
Capacity
(4)
1. Air conditioned 8
Not Available
2. Non Air Conditioned 34
3. Open Air 2
4. Semi Permanent -
5. Touring 2
Total 46
Source: District Collectorate („C‟ Section).

77
36.2. List of Clubs and Associations
Year: 2013 – 2014
Sl. No.
(1)
Place
(2)
Name of the Club and Association
(3)
1. Palayankottai Lions Club
2. Palayankottai Rotary Club
3. Palayankottai District Club
4. Tirunelveli Rotary Club/ Lions Club
5. Ambasamudram Rotary Club
6. Ambasamudram Lions Club
7. Tenkasi Rotary Club
8. Tenkasi Lions Club
9. Nanguneri Lions Club
10. Shenkottai Lions Club
11. Alankulam Lions Club
12. Surandai Lions Club
13. Tisayanvillai Rotary Club/ Lions Club
14. Sankarankovil Lions Club
15. Kadayanallur Lions Club
16. Puliyangudi Lions Club
17. Valliyoor Lions Club
Source: Concerned Office.
36.3. List of Motion Picture Distributors and Projection Services
Year: 2013-2014
Sl. No.
(1)
Name of the Block / Municipality
(2)
Name of the Picture Distributors / Projection
Services
(3)
Not Available
37. SOCIAL WELFARE
37.1. Puratchi Thalaivar M.G.R. Nutritious Meals Programme Centres
Year: 2013-2014
Sl. No. Project No. of Centres
1. ICDS 2562
2. P.A. Noon Meal Centre (School Sector) 2087
Total 4649
Source: ICDS &P.A. Noon Meal Tirunelveli.

78
37.2. No. of Beneficiaries under Puratchi Thalaivar M.G.R. Nutritious Meals Programme
Year: 2013-2014
Sl. No. No. of Beneficiary Under age Group Beneficiaries
ICDS Centres
1. 6-36 Months Children 74993
2. 25-60 Months Children 61663
3. Pregnant & Lactating Woman 26533
4. 1 to 2 Years Egg Beneficiries 23745
P.A. Noon Meal Centre
5. 5-9 Years Children 124413
6. 10-14 Years Children 60611
7. 15&16 Years 12832
8. NCLP 509
Source: ICDS &P.A. Noon Meal Tirunelveli.
37. 3. Number of Beneficiaries under Free Supply of Text Books and Uniforms
Year: 2013– 2014
Sl. No
Name of School
Age group 6-14 (Standards I to VIII)
Text Books Uniforms
Boys Girls Boys Girls
1. Primary 80651 82795 60357 58488
2. Upper Primary 61281 62440 28781 30278
Source: SSA, Tirunelveli (DISE).
37. 4. Number of Beneficiaries under Free Cycles
Year: 2013 – 2014
No. of Schools Boys Girls Total
136 15221 16222 31443
Source: CEO, Tirunelveli.
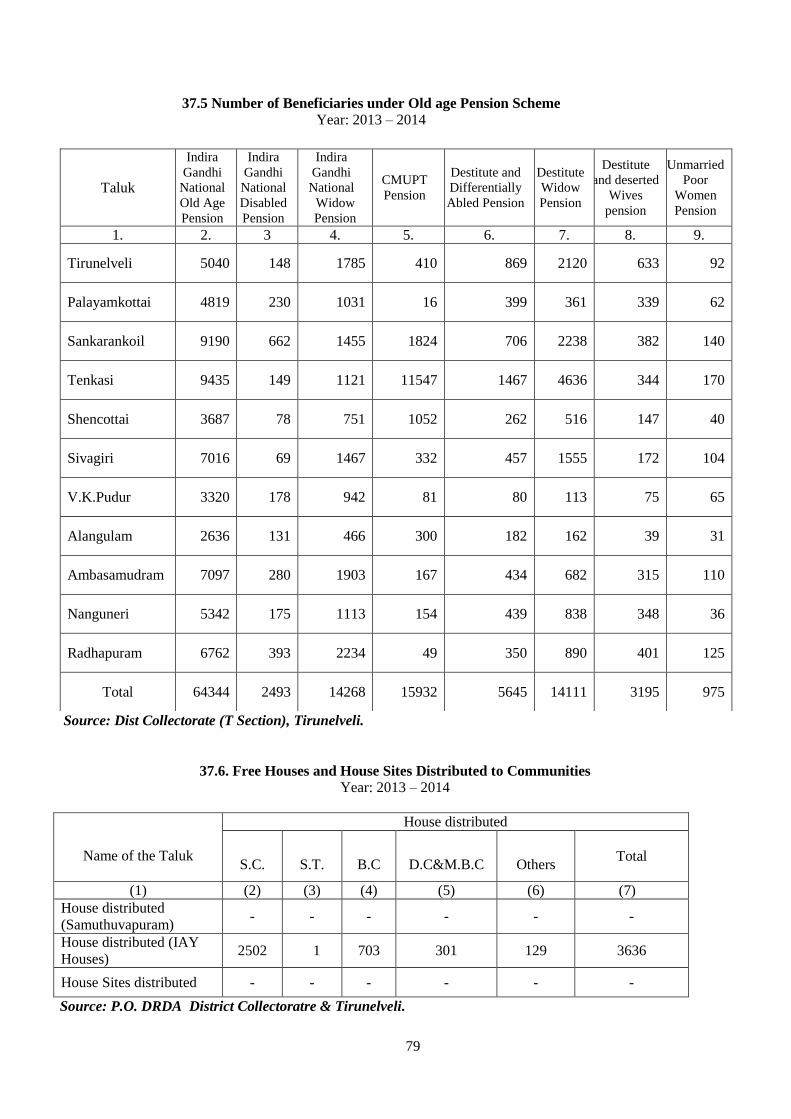
79
37.5 Number of Beneficiaries under Old age Pension Scheme
Year: 2013 – 2014
Source: Dist Collectorate (T Section), Tirunelveli.
37.6. Free Houses and House Sites Distributed to Communities
Year: 2013 – 2014
Name of the Taluk
House distributed
S.C.
S.T.
B.C
D.C&M.B.C
Others
Total
(1) (2) (3) (4) (5) (6) (7) 7
House distributed
(Samuthuvapuram) - - - - - -
House distributed (IAY
Houses) 2502 1 703 301 129 3636
House Sites distributed - - - - - -
Source: P.O. DRDA District Collectoratre & Tirunelveli.
Taluk
Indira
Gandhi
National
Old Age
Pension
Indira
Gandhi
National
Disabled
Pension
Indira
Gandhi
National
Widow
Pension
CMUPT
Pension
Destitute and
Differentially
Abled Pension
Destitute
Widow
Pension
Destitute
and deserted
Wives
pension
Unmarried
Poor
Women
Pension
1. 2. 3 4. 5. 6. 7. 8. 9.
Tirunelveli 5040 148 1785 410 869 2120 633 92
Palayamkottai 4819 230 1031 16 399 361 339 62
Sankarankoil 9190 662 1455 1824 706 2238 382 140
Tenkasi 9435 149 1121 11547 1467 4636 344 170
Shencottai 3687 78 751 1052 262 516 147 40
Sivagiri 7016 69 1467 332 457 1555 172 104
V.K.Pudur 3320 178 942 81 80 113 75 65
Alangulam 2636 131 466 300 182 162 39 31
Ambasamudram 7097 280 1903 167 434 682 315 110
Nanguneri 5342 175 1113 154 439 838 348 36
Radhapuram 6762 393 2234 49 350 890 401 125
Total 64344 2493 14268 15932 5645 14111 3195 975

80
37.7. Implementation of Relief Measures and Pension Schemes
Year: 2013 – 2014
Sl. No. Name of the Scheme/ Relief Measures No. of
Beneficiaries
Total Amount Disbursed
(Rs. in ‘000’
1.
Freedom Fighters Pension Scheme - -
a)State Government - -
b) Central Government - -
2. Mozhi Kavalar Pension Scheme - -
3. Tamilaringar - -
Source: Collectorate, Tirunelveli (K1 Treasury Section), D.D.Tamil Development.
*Not received.
38. SANITARY SERVICES
38.1. No. of Sanitary Workers engaged in Sanitation, Garbage and Sewage
Disposal and other Particulars.
Year: 2013-2014
Name of the Municipality
No. of Workers
engaged in
Sanitation
No. of Sanitary Workers
engaged in Garbage and
Sewage disposal
No. of Sanitary Workers
engaged in Other
connected works related
with sanitation
Tenkasi 85 0 0
Sankarankoil 101 96 5
Kadayanallur 89 0 0
Puliyangudi 96 96 0
Senkottai 31 15 16
Ambasamudram 44 5 39
V.K.Puram 63 0 0
Total 509 212 60
Source: R.D.M.A., Tirunelveli.
38.2. No. of Vehicles Engaged In Sanitary Services
Year: 2013-2014
Sl. No.
(1)
Name of the Municipality
(2)
No. of vehicles engaged in Sanitary Services
(3)
1. Tenkasi 6
2. Sankarankoil 5
3. Kadayanallur 8
4. Puliyangudi 6
5. Senkottai 11
6. Ambasamudram 12
7. V.K.Puram 6
Total 54
Source: R.D.M.A., Tirunelveli.

81
39. SCIENTIFIC AND RESEARCH SERVICE
39.1. Institutions and Laboratories Engaged In Research Work
Name and address of Institutions and
Laboratories
(1)
Type of Research Field
(2)
State Agmark Laboratory, Tirunelveli Agmark Grading is carried out for Centralised, and
decentralized commodities. State Agmark Laboratory, Tenkasi
Source: Deputy Director of Agriculture (Agri Buisness) Tirunelveli.
40. STORAGE FACILITIES
40.1. List of Agricultural and Non-Agricultural Storage Godowns
Sl. No Item Numbers Capacity (Tonnes)
1. Agriculture - -
2. Co-Operation - -
3. Civil Supplies - -
4. Panchayat Union - -
5. Regulated Market - -
6. Tamil Nadu Warehousing Corp 8 18500
Source: Concerned Department.
40.2. List of Cold Storage and Godowns
Sl. No. Name and address of the cold storage
Nil
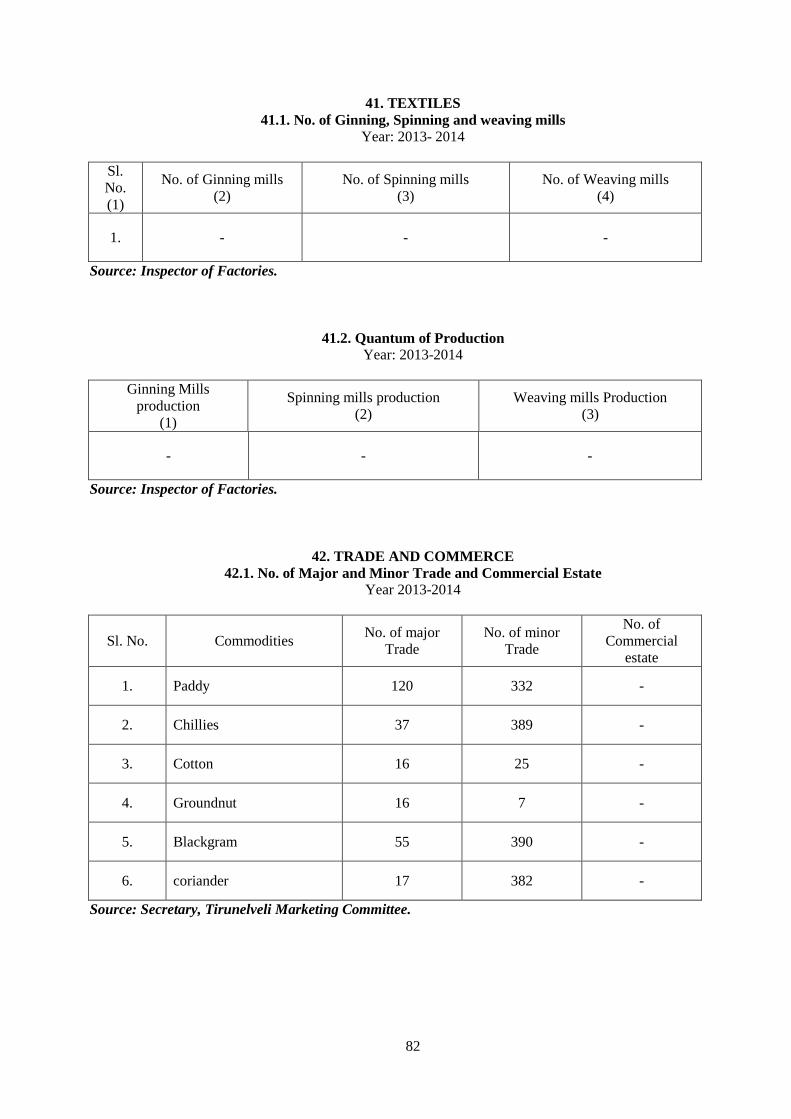
82
41. TEXTILES
41.1. No. of Ginning, Spinning and weaving mills
Year: 2013- 2014
Sl.
No.
(1)
No. of Ginning mills
(2)
No. of Spinning mills
(3)
No. of Weaving mills
(4)
1. - - -
Source: Inspector of Factories.
41.2. Quantum of Production
Year: 2013-2014
Ginning Mills
production
(1)
Spinning mills production
(2)
Weaving mills Production
(3)
- - -
Source: Inspector of Factories.
42. TRADE AND COMMERCE
42.1. No. of Major and Minor Trade and Commercial Estate
Year 2013-2014
Sl. No. Commodities No. of major
Trade
No. of minor
Trade
No. of
Commercial
estate
1. Paddy 120 332 -
2. Chillies 37 389 -
3. Cotton 16 25 -
4. Groundnut 16 7 -
5. Blackgram 55 390 -
6. coriander 17 382 -
Source: Secretary, Tirunelveli Marketing Committee.

83
43. TRANSPORT
43.1. Length of Roads (In Kilo Metres)
Year 2013-2014
Source: S.E (H), Tirunelveli & S.E. (NH), Tirunelveli.
43.2. Accidents
Year: 2013-2014
Sl. No.
Name of the
corporation/Block/
Municipality
Total Number
of Accidents
No. of persons
injured
Number of persons
killed
1. Tirunelveli Moffusial - - -
2. Tirunelveli City - - -
Source: Superintendent of Police Tirunelveli.
43.3. Registered Motor Vehicles
Year: 2013 – 2014
Commercial Vehicles Non Commercial Vehicles Total
2088
16691
18779
Source: Regional Transport Office Tirunelveli & Tenkasi.
Name of
authority
Surfaced Roads (K.M) Un surfaced
Roads Grand Total Cement
Concrete Bituminous
Water bound
Macadam Total
National
High ways - - - - - -
State High
ways 4.34 1672.486 - 1676.826 - 1676.826
Major
District
Road
3.485 1226.781 - 1230.266 - 1230.266
Other
District
Road
6.358 4797.972 - 4804.33 - 4804.33
Sugarcane
Roads - 12.500 - 12.500 - 12.500

84
43.4. Transport Corporations
Year: 2013-2014
Sl.
No.
Name of the
Corporations
Year of
Formation
Headquarter
District covered
No. of buses
as on 31st
March
1.
Tamil State
Transport
Corporation
(Tirunelveli)
Ltd.,
Tirunelveli
Region
01.01.1974
(Formation)
01.04.1983
(Bifurcation as
TNSTC
(Madurai
Division-I
12.02.2004
(Amalgamation
as the existing
corporation
23.10.2010
(Bifurcation as
TNSTC
Regional H.Q-
Tirunelveli
Tirunelveli &
Tuiticorin -
Source: GM TNSTC (Madurai) Ltd., Tirunelveli.
43.5. Selected Indicators on Overall Performance of State Transport Corporations
Year: 2013-2014
Sl. No. Item Name of the Transport
Corporation
1.
2.
3.
4.
5.
6.
7.
8.
9.
10.
11.
12.
Fleet Strength
Kilometers operated carried per day (in lakhs)
Number of passengers carried per day (in lakhs)
Fleet Utilization (Percentage)
Kilometer efficiency (Percentage)
Kilometer run per litre of diesel
a) City / Town
Mofussil
overall
Number of routes (As on 31 March)
Number of New routes introduced during the year
New villages benefited during the year
Benefited village population (in lakhs)
Staff strength as on 31St
March
Number of New Buses purchased
1091
4.87
10.19
95.14
103.48
5.67
5.48
5.53
701
40
4
0.024
6448
132
Source: GM TNSTC Madurai Div-II Tirunelveli.
43.6. Railway Lines (Broad Gauge) and Stations
Item
Tirunelveli Sub
Division
Tiuticorin Sub
Division
Srivaikundam Sub
Division
Total
(5)
** ** ** ** **
** Report is Under Process.

85
43.7. Port Development
1. Major Ports
2. Minor ports
Vessels entered and Cargo handled
Name of the Port Vessels entered Cargo handled
Major Ports:
Chennai
Tuticorin
Nil Nil
Intermediate Ports
Cuddalore
Nagapattinam
Nil Nil
Minor Ports
Kilakarai
Rameswaram
Pamban
Colachal
Kanniyakumari
Valinokkam
* Including Transshipment,
Cargo and Container cargo
Nil Nil
Source: Concerned Port Office.
43.8 AIR PORTS Year.2013-2014
Sl.
No.
(1)
Airport
(2)
Passengers (in ‘000’)
Embarked
(3)
Disembarked
(4)
Transit
(5)
Total
(6)
1. INTERNATIONAL
AIRPORT, MADRAS
Nil
a) International
b) Domestic
2. DOMESTIC AIRPORT
a) Madras
b) Coimbatore
c) Madurai
d) Tiruchirappalli
Table 43.8. Contd
.
Cargo Handled (Tonne) Revenue (Rs. In lakhs)
Loaded
(7)
Unloaded
(8)
Total
(9)
PAX
(10)
Cargo
(11)
Total
(12)
Nil
Source: Concerned Airport.

86
43.9. Private Transport Operators
Year: 2013-2014
Sl. No.
Type of the
Transport
Operations
Tirunelveli Tenkasi
Total
1. Moffusil 1 1 2
2. Tourist 0 0 0
3. Spare 3 1 4
4. Mini Bus Route 0 0 0
Source: Regional Transport Officer, Tirunelveli, Tenkasi.
44. TOURISM
44.1. Places of Tourist Attraction
Year: 2013-14
Sl. No.
(1)
Tourist Place
(2)
1. Courtalam Main falls, Old Falls, Five Falls, Honey Falls, Tiger Falls and
Boating
2. Papanasam Dam site, Agasthiar falls and Temple
3. Manimuthar Dam site and falls
4. Mundanthurai Wild life Sanctuary
5. Kalakadu Wild life sanctuary
6. Koondhankulam Birds sanctuary
7. Tirunelveli District Science Centre
8. Thirupudaimaruthur
9. Gundar Dam
10. Adavi nainar dam
11. Kadana Dam.
12. Krishnapuram
Source: District Tourist Development Office.
44.2. List of Places of Worship
Sl. No.
(1)
Places of Worship
(2)
1. A/M Nellaiapparkoil -Tirunelveli.
2. A/M Kasiviswanatharkoil -Tenkasi.
3. A/M Vanamamalai Temple -Nanguneri.
4. A/M Gomathiammankoil -Sankarankoil.
5. A/M Nambikoil -Tirukarangudi.
6. A/M Perumalkoil -Panagudi.
7. Chitrasabai -Courtallam.
8. Papanasam Temple -Papanasam.
9. Dharga-Athangarai & Pottalpudur.
10. St.Antony Church - Uvari.
11. A/M Anjanayartemple -Kadayanallur
12. A/M Nithyakalyani Ammantemple - Radhapuram.
13. A/M Balasubiramaniasamy Kovil -Aiyakudi Temple
Source: District Tourist Development Office.

87
44.3. List of Hotels and Lodging Houses
Year: 2013- 2014
Name of District Hotels Hotels & Lodging
Houses Lodging Houses
Tirunelveli
75 22 53
Source: Deputy Commissioner (CT), Tirunelveli.
44.4. List of Travel Agents
Year: 2013- 2014
Sl. No.
(1)
List of Travel Agents
(2)
1.
2.
3.
4.
5.
6.
7.
8.
9.
10.
11.
12.
13
14.
S.R.M. Travels
Amarnath Travels
S.P.K.Travels
Aarthi Travels
Parveen Travels
TVLS Travels
A.B.T Travels.
Lakshmi Travels
Senthur Travels
P.V.T.Travels
Rathi Meena
S.P.S.Travels
Bluewings Travels
Source: Concerned Office.

88
44.5. Train Service Timings (01.07.2014)
Sl.
No.
Train Service Timings
No Name of the train Service Time Arrival Departure
1. 22630 Dadar Express Wed Tirunelveli Dadar
2. 22628 Intercity Express Daily Tirunelveli Tiruchchirapali
3. 11022 Chalukya Express Mon,Thu,Fri Tirunelveli Dadar
4. 16787 Jammu Express Mon,Fri Tirunelveli Jammu Tawi
5. 12632 Nellai Express Daily Tirunelveli Chennai
6. 16106 Tiruchendur Express Daily Tiruchendur Chennai
7. 16352 Mumbai Express Thu,Sun Nagercoil Mumbai
8. 16128[6] Guruvayur Express Daily Guruvayur Chennai
9. 16340 Mumbai Express Mo,Tu,We,Fr Nagercoil Mumbai
10. 12666[6] Howrah Express Sat Kanyakumari Howrah
11. 16863[6] Puducherry Express Fri Kanyakumari Puducherry
12. 17236 Bangalore Express Daily Nagercoil Bangalore
13. 12668 ChennaiExpress Fri Nagercoil Chennai
14. 12634 KanniyakumariExpress Daily Kanniyakumari Chennai
15. 16724 AnanthapuriExpress Daily Trivandrum Chennai
16. 12641 ThirukuralExpress wed,Fri Kanniyakumari Nizamudin
17. 12690 ChennaiExpress Sun Nagercoil Chennai
18. 16609 CoimbatoreExpress Daily Nagercoil Coimbatore
19. 22622[6] RameswaramExpress Tue,Fri,Sun Kanyakumari Rameswaram
20. 56701[7] PunalurFastPassenger Daily Punalur Madurai
21. 22620 BilaspurExpress Sun Tirunelveli Bilaspur
22. 56700[7] PunalurFastPassenger Daily Madurai Punalur
23. 19577[6] Hapa Express Mon,Tue Tirunelveli Hapa
24. 16723 AnanthapuriExpress Daily Chennai Trivandrum
25. 16127[6] GuruvayurExpress Daily Chennai Guruvayur
26. 56821/56822 Passenger Train Daily Tirunelveli Erode
27 56319/56320 Passenger Train Daily Nagercoil Coimbatore
28 56700/56701 Passenger Train Daily Madurai Punalur
29 56761/56762 Passenger Train Daily Tirunelveli Thiruchendur
30 56763/56764 Passenger Train Daily Tirunelveli Thiruchendur
31 56765/56766 Passenger Train Daily Tirunelveli Thiruchendur
32 56828/56827 Passenger Train Daily Tirunelveli Tuticorin
33 56312/56311 Passenger Train Daily Tuticorin Kanyakumari
34 56767/56768 Passenger Train Daily Tuticorin Thiruchendur
35 56801/56800 Passenger Train Daily Tirunelveli Tenkasi
36 56797/56798 Passenger Train Daily Tirunelveli Tenkasi
37 56799/56796 Passenger Train Daily Tirunelveli Tenkasi
38 56803/56802 Passenger Train Daily Tiruchendur Tenkasi
39 56770/56769 Passenger Train Daily Thiruchendur Palani
Source: Southern Railway.
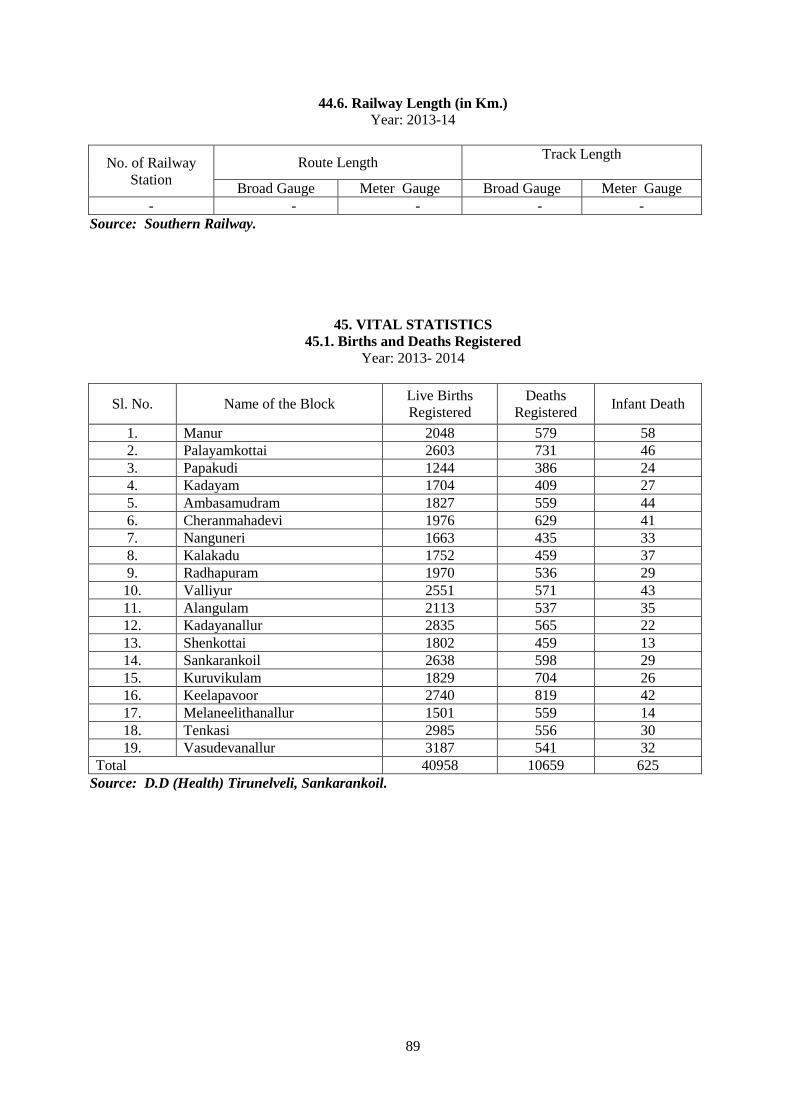
89
44.6. Railway Length (in Km.)
Year: 2013-14
No. of Railway
Station
Route Length Track Length
Broad Gauge Meter Gauge Broad Gauge Meter Gauge
- - - - -
Source: Southern Railway.
45. VITAL STATISTICS
45.1. Births and Deaths Registered
Year: 2013- 2014
Sl. No. Name of the Block Live Births
Registered
Deaths
Registered Infant Death
1. Manur 2048 579 58
2. Palayamkottai 2603 731 46
3. Papakudi 1244 386 24
4. Kadayam 1704 409 27
5. Ambasamudram 1827 559 44
6. Cheranmahadevi 1976 629 41
7. Nanguneri 1663 435 33
8. Kalakadu 1752 459 37
9. Radhapuram 1970 536 29
10. Valliyur 2551 571 43
11. Alangulam 2113 537 35
12. Kadayanallur 2835 565 22
13. Shenkottai 1802 459 13
14. Sankarankoil 2638 598 29
15. Kuruvikulam 1829 704 26
16. Keelapavoor 2740 819 42
17. Melaneelithanallur 1501 559 14
18. Tenkasi 2985 556 30
19. Vasudevanallur 3187 541 32
Total 40958 10659 625
Source: D.D (Health) Tirunelveli, Sankarankoil.
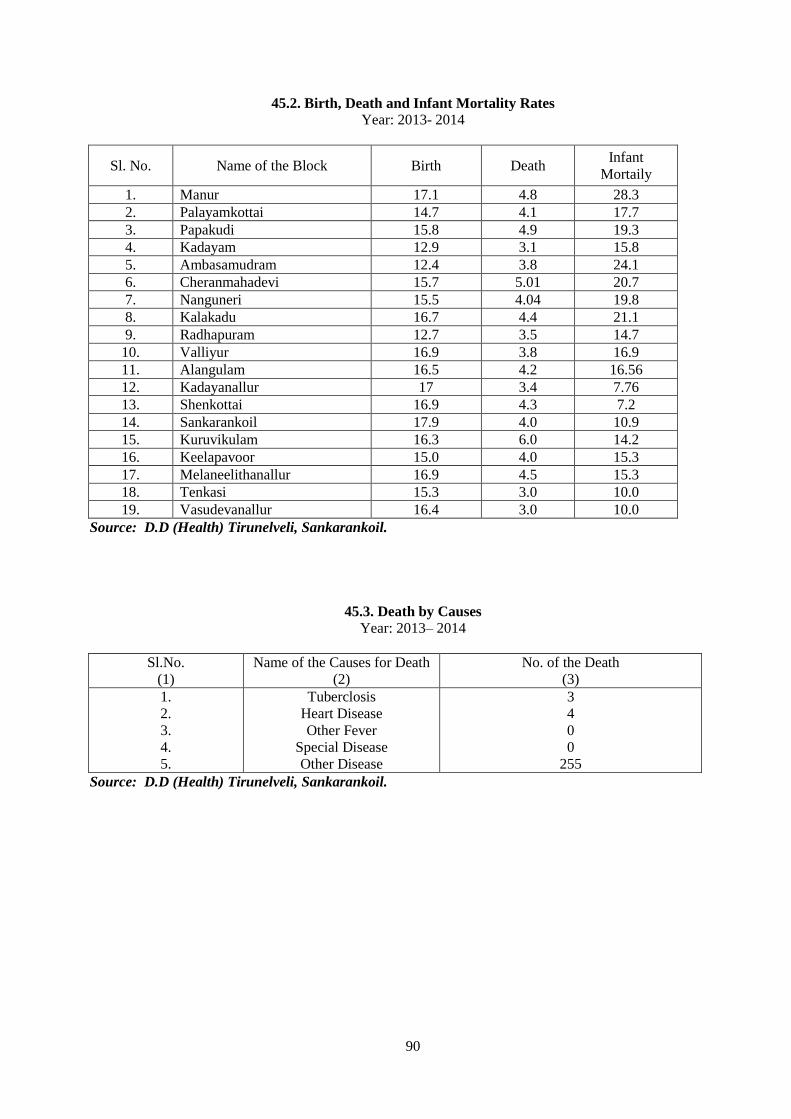
90
45.2. Birth, Death and Infant Mortality Rates
Year: 2013- 2014
Sl. No. Name of the Block Birth Death Infant
Mortaily
1. Manur 17.1 4.8 28.3
2. Palayamkottai 14.7 4.1 17.7
3. Papakudi 15.8 4.9 19.3
4. Kadayam 12.9 3.1 15.8
5. Ambasamudram 12.4 3.8 24.1
6. Cheranmahadevi 15.7 5.01 20.7
7. Nanguneri 15.5 4.04 19.8
8. Kalakadu 16.7 4.4 21.1
9. Radhapuram 12.7 3.5 14.7
10. Valliyur 16.9 3.8 16.9
11. Alangulam 16.5 4.2 16.56
12. Kadayanallur 17 3.4 7.76
13. Shenkottai 16.9 4.3 7.2
14. Sankarankoil 17.9 4.0 10.9
15. Kuruvikulam 16.3 6.0 14.2
16. Keelapavoor 15.0 4.0 15.3
17. Melaneelithanallur 16.9 4.5 15.3
18. Tenkasi 15.3 3.0 10.0
19. Vasudevanallur 16.4 3.0 10.0
Source: D.D (Health) Tirunelveli, Sankarankoil.
45.3. Death by Causes
Year: 2013– 2014
Sl.No.
(1)
Name of the Causes for Death
(2)
No. of the Death
(3)
1.
2.
3.
4.
5.
Tuberclosis
Heart Disease
Other Fever
Special Disease
Other Disease
3
4
0
0
255
Source: D.D (Health) Tirunelveli, Sankarankoil.
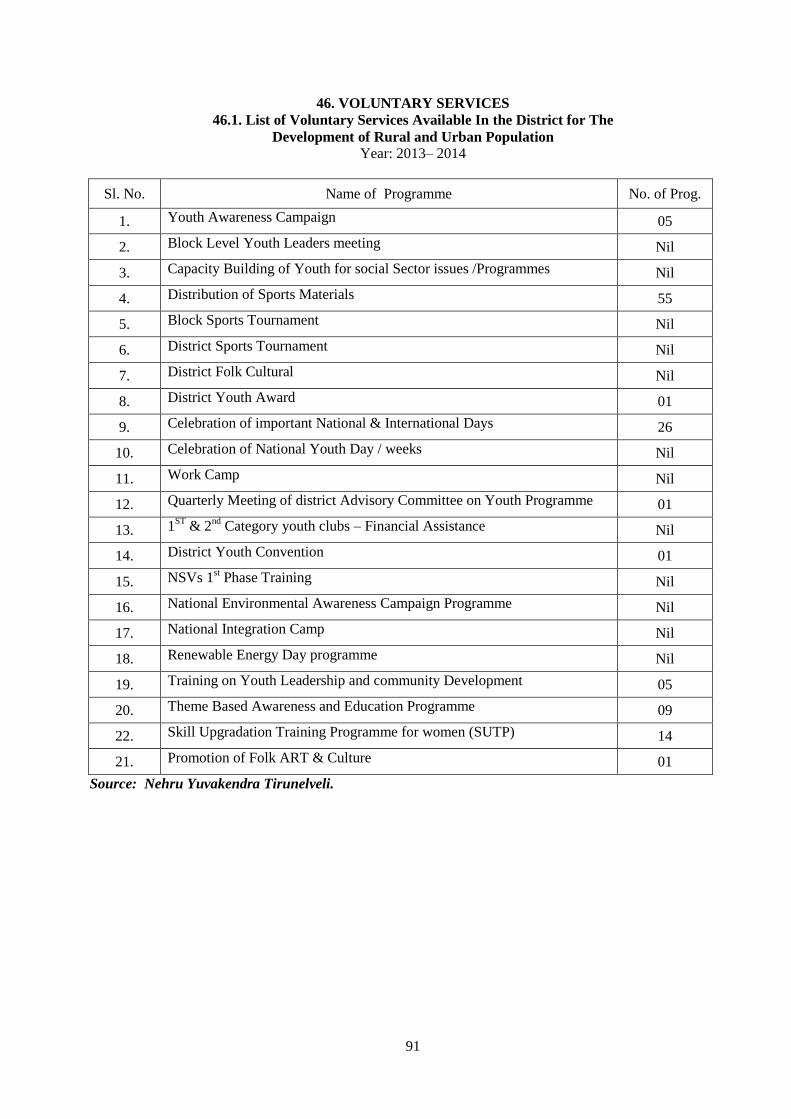
91
46. VOLUNTARY SERVICES
46.1. List of Voluntary Services Available In the District for The
Development of Rural and Urban Population Year: 2013– 2014
Sl. No. Name of Programme No. of Prog.
1. Youth Awareness Campaign 05
2. Block Level Youth Leaders meeting Nil
3. Capacity Building of Youth for social Sector issues /Programmes Nil
4. Distribution of Sports Materials 55
5. Block Sports Tournament Nil
6. District Sports Tournament Nil
7. District Folk Cultural Nil
8. District Youth Award 01
9. Celebration of important National & International Days 26
10. Celebration of National Youth Day / weeks Nil
11. Work Camp Nil
12. Quarterly Meeting of district Advisory Committee on Youth Programme 01
13. 1ST
& 2nd
Category youth clubs – Financial Assistance Nil
14. District Youth Convention 01
15. NSVs 1st Phase Training Nil
16. National Environmental Awareness Campaign Programme Nil
17. National Integration Camp Nil
18. Renewable Energy Day programme Nil
19. Training on Youth Leadership and community Development 05
20. Theme Based Awareness and Education Programme 09
22. Skill Upgradation Training Programme for women (SUTP) 14
21. Promotion of Folk ART & Culture 01
Source: Nehru Yuvakendra Tirunelveli.

92
47. WATER WORKS AND SUPPLY
47.1. No. of Schemes Operated In the District
Year: 2013 – 2014
No. of Schemes
Sl. No. Name of the Municipalities Name of the
Scheme
No. of the Schemes
Operated In The District
1. Tenkasi Urban Water
Supply
25
2. Sankarankoil Urban Water
Supply
3. Kadayanallur Urban Water
Supply
4. Puliyangudi Urban Water
Supply
5. Senkottai Urban Water
Supply
6. Ambasamudram Urban Water
Supply
7 V.K.Puram Urban Water
Supply
Source: E.E., TWAD Board, Maintenance Division, Tirunelveli.
47.2. No. of Workers Engaged In the Water Works and Supply
Year: 2013-2014
Sl. No.
(1)
Name of the
Municipalities
Name of the Schemes
(2)
No. of Workers engaged in water
works and supply
(3)
1. Tenkasi Urban Water Supply -
2. Sankarankoil Urban Water Supply 25
3. Kadayanallur Urban Water Supply -
4. Puliyangudi Urban Water Supply Sanctioned Post 51-Vacant
5. Senkottai Urban Water Supply 7
6. Ambasamudram Urban Water Supply 12
7. V.K.Puram Urban Water Supply 6
Source: P.A., (P.D.,) A.D., (T.P.,) RDMA.

93
47.3. No. of House Connections, Fountains
Year: 2013-2014
Sl. No.
(1)
Name of the Municipalities
(2)
No. of House water connections
(3)
House connection Fountain
1. Tenkasi 10832 182
2. Sankarankoil 9671 110
3. Kadayanallur 13971 171
4. Puliyangudi 9725 52
5. Senkottai 4560 144
6. Ambasamudram 7198 156
7. V.K.Puram 9802 72
Total 65759 887
Source: R.D.M.A., Tirunelveli.
47.4. Educational Expenditure
Year: 2013 – 2014
District Type of School No. of Schools Rs.”000”
Tirunelveli
High School & Higher
Secondary
461 -
Source: CEO, Tirunelveli.