performance-based approach for evaluating the fire
TRANSCRIPT
PERFORMANCE-BASED APPROACH FOR EVALUATING THE FIRE RESPONSE OF PRESTRESSED CONCRETE DOUBLE T-BEAMS
By
Nickolas Robert Hatinger
A THESIS
Submitted to Michigan State University
in partial fulfillment of the requirements for the degree of
MASTER OF SCIENCE
Civil Engineering
2012
ABSTRACT
PERFORMANCE-BASED APPROACH FOR EVALUATING THE FIRE RESPONSE OF PRESTRESSED CONCRETE BEAMS
By
Nickolas Robert Hatinger
In recent years precast/prestressed concrete (PPC) double T-beams have gained wide popularity
in numerous building applications. Since structural fire safety is a high priority, building codes
generally specify fire resistance requirements. The current approach for evaluating fire
resistance of structural members, including those of PPC double T-beams, through prescriptive-
based methods has numerous drawbacks. The guidelines are limited in scope and restrictive in
application, since they were developed based on ASTM E-119 standard fire tests. Furthermore,
these guidelines are only valid for a narrow range of beams and do not fully account for realistic
fire, loading or restraint scenarios. To overcome these drawbacks, a performance-based
methodology is applied to evaluate the fire resistance of PPC beams under realistic fire, loading,
and restraint scenarios. SAFIR, a special-purpose finite element program, was used to carry a set
of numerical analyses to study the effect of various factors governing the fire resistance of PPC
double T-beams. In the analysis, high temperature material properties, various load and restraint
levels, and material and geometric nonlinearity were accounted for. A realistic failure criterion
was also included to determine failure. Results from the analysis indicate that fire scenario, load
level, and failure criterion have significant influence on the fire resistance of PPC double T-
beams. The steps involved in undertaking a performance-based fire approach are outlined.

iii
ACKNOWLEDGEMENTS
I would like to acknowledge a number of people whom supported me throughout the completion
of this research project:
Precast/Prestressed Concrete Institute for awarding Dr. Venkatesh Kodur the Daniel P. Jenny
research fellowship to carry out this research.
Dr. Venkatesh Kodur, my advisor, for this opportunity and for his guidance, patience, and
exemplary expertise in the field of structural fire engineering.
Rustin Fike, a Ph.D. candidate and fellow fire group member at Michigan State University, for
his technical support with SAFIR and proofreading this thesis.
Lansival Jean-Baptiste, a technical support member of SAFIR at the University of Liege, for his
mastery in SAFIR.
Dr. Monther Dwaikat, fellow fire group member at Michigan State University, for his
contributions in proofreading this thesis.
Last but not least my parents and wife, Kavita, for their love and support.
iv
TABLE OF CONTENTS
LIST OF TABLES ......................................................................................................................... vi
LIST OF FIGURES ..................................................................................................................... viii
KEY TO SYMBOLS .................................................................................................................... xii
CHAPTER 1 ...................................................................................................................................1
1. INTRODUCTION....................................................................................................................1 1.1. General ...............................................................................................................................1 1.2. Fire Resistance of Prestressed Concrete .....................................................................3 1.3. Prestressed Concrete Beams under Fire ......................................................................4 1.4. Fire Resistance Design ....................................................................................................6
1.5. Objectives ...........................................................................................................................6 1.6. Layout..................................................................................................................................7
CHAPTER 2 ...................................................................................................................................9
2. LITERATURE REVIEW ........................................................................................................9
2.1. General ...............................................................................................................................9 2.2. Design for Fire Resistance ............................................................................................10
2.2.1. Fire Resistance Tests ...........................................................................................11
2.2.2. Analytical Studies ..................................................................................................17
2.2.3. Provisions in Codes/Standards ...........................................................................19 2.3. High Temperature Material Properties .........................................................................23
2.3.1. General ...................................................................................................................23 2.3.2. Concrete .................................................................................................................24 2.3.3. Prestressing and Mild Reinforcing Steel ...........................................................33
2.4. Summary ..........................................................................................................................43 CHAPTER 3 .................................................................................................................................63
3. NUMERICAL MODEL .........................................................................................................63
3.1. General .............................................................................................................................63 3.2. Selection of Computer Model ........................................................................................64
3.3. Computer Program SAFIR .............................................................................................64
3.3.1.General Analysis Procedure ..................................................................................65
3.3.2.Thermal Analysis .....................................................................................................66
3.3.3.Structural Analysis ...................................................................................................66
3.3.4.Material Models ........................................................................................................67
3.3.5.Software Features ...................................................................................................68
3.4. Sensitivity Analysis..........................................................................................................68
3.5. Model Validation ..............................................................................................................70 3.6. Summary ..........................................................................................................................72
CHAPTER 4 .................................................................................................................................81
4. PARAMETRIC STUDIES ....................................................................................................81
v
4.1. General .............................................................................................................................81 4.2. Analysis Details ...............................................................................................................82
4.2.1. Beams .....................................................................................................................82 4.2.2. SAFIR Models ........................................................................................................83
4.2.3. High Temperature Material Properties ...............................................................85 4.2.4. Failure Criteria .......................................................................................................85
4.3. Factors Governing Fire Resistance ..............................................................................86
4.3.1. Effect of Fire Scenario ..........................................................................................86
4.3.2. Effect of Concrete Compressive Strength .........................................................90 4.3.3. Effect of Restraint ..................................................................................................90
4.3.4. Effect of Load Intensity .........................................................................................92
4.3.5. Effect of Aggregate Type .....................................................................................93
4.3.6. Effect of Failure Criteria .......................................................................................95
4.4. Summary ..........................................................................................................................96 CHAPTER 5 ...............................................................................................................................108
5. PERFORMANCE-BASED APPROACH .........................................................................108 5.1. General ...........................................................................................................................108 5.2. Performance-Based Approach ....................................................................................109
5.2.1. Fire Scenario ........................................................................................................109 5.2.2. Loading Scenario ................................................................................................110
5.2.3. High Temperature Material Properties .............................................................111 5.2.4. Thermal and Structural Analysis .......................................................................112 5.2.5. Failure Criteria .....................................................................................................113
5.2.6. Practical Alternatives ..........................................................................................114
5.3. Summary ........................................................................................................................114 CHAPTER 6 ...............................................................................................................................116
6. CONCLUSIONS AND RECOMMENDATIONS .............................................................116 6.1. General ...........................................................................................................................116 6.2. Conclusions ....................................................................................................................117 6.3. Recommendations for Future Research ...................................................................118
APPENDICES ............................................................................................................................121 APPENDIX A..............................................................................................................................121 APPENDIX B..............................................................................................................................147 APPENDIX C .............................................................................................................................158 APPENDIX D .............................................................................................................................163 APPENDIX E..............................................................................................................................173 REFERENCES ..........................................................................................................................179
vi
LIST OF TABLES Table 2.1 – Tabulated Fire Ratings for PPC Building Components (Gustaferro and Carlson 1962)
........................................................................................................................................... 44 Table 2.2 – Tabulated Fire Ratings for PPC T-beams with Spray-applied Insulation developed by
Abrams and Gustaferro (1972) ......................................................................................... 44 Table 2.3 – Reinforcement Details of RC Beams used in Lin et al. (1981) Study to Investigate
the Effects of Shear and Moment Redistribution of Continuously Supported Flexural Members (a) Top Reinforcement Details.......................................................................................... 45 (b) Bottom Reinforcement Details .................................................................................... 46 (c) Stirrup Reinforcement Details ..................................................................................... 47
Table 2.4 – Comparison of Design Provisions Specified by US, Canadian, and Eurocode Design
Provisions .......................................................................................................................... 48 Table 2.5 – Fire Resistance Ratings (hrs) for 10DT24+2 and 12DT32+2 as per Different Codes
of Practice ......................................................................................................................... 48 Table 3.1 – Summary of Results from Fire Resistance Test on Simply Supported PPC Beam. .. 74 Table 4.1 – Sectional Details and Material Properties of PPC Double T-beams 10DT24+2 and
12DT32+2 used in the Parametric Study. ......................................................................... 98 Table 4.2 – Results from Fire Resistance Analysis on PPC Double T-beams. ............................ 99 Table A1.1.1 – Simplified Calculation Results for 10DT24+2 According to US Fire Provisions
......................................................................................................................................... 126 Table A1.1.2 – Simplified Calculation Results for 12DT32+2 According to Canadian Fire
Provisions ........................................................................................................................ 128 Table A1.2.1 – Simplified Calculation Results for 10DT24+2 According to Canadian Fire
Provisions ........................................................................................................................ 134 Table A1.2.2 – Simplified Calculation Results for 12DT32+2 According to Canadian Fire
Provisions ........................................................................................................................ 136 Table A1.3.1 – Simplified Calculation Results for 10DT24+2 According to Eurocode Fire
Provisions ........................................................................................................................ 143 Table A1.3.2 – Simplified Calculation Results for 12DT32+2 According to Eurocode Fire
Provisions ........................................................................................................................ 145
vii
Table B.1 – Constitutive Relationships for High Temperature Properties of Normal Strength
Concrete .......................................................................................................................... 147 Table B.1 (cont’d) – Constitutive Relationships for High Temperature Properties of Normal
Strength Concrete............................................................................................................ 148 Table B.1 (cont’d) – Constitutive Relationships for High Temperature Properties of Normal
Strength Concrete............................................................................................................ 149 Table B.1 (cont’d) – Constitutive Relationships for High Temperature Properties of Normal
Strength Concrete............................................................................................................ 150 Table B.1 (cont’d) – Constitutive Relationships for High Temperature Properties of Normal
Strength Concrete............................................................................................................ 151 Table B.2 – Values for Main Parameters of Stress-strain Relationships of Normal Strength
Concrete at Elevated Temperatures (Eurocode 2, 2004) ................................................ 152 Table B.3 – Constitutive Relationships for High Temperature Properties of Prestressing Steel
Reinforcement ................................................................................................................. 153 Table B.4 – Values for Main Parameters of Stress-strain Relationships of Prestressing Steel
Reinforcement at Elevated Temperatures (Eurocode 2, 2004) ....................................... 154 Table B5. –Values for Ultimate Strength of Prestressing Steel at Elevated Temperatures (PCI,
2004) ............................................................................................................................... 154 Table B.6 – Constitutive Relationships for High Temperature Properties of Reinforcing Steel 155 Table B.6 (cont’d) – Constitutive Relationships for High Temperature Properties of Reinforcing
Steel................................................................................................................................. 156 Table B.7 –Values for Main Parameters of Stress-strain Relationships of Reinforcing Steel at
Elevated Temperatures (Eurocode 2, 2004).................................................................... 157
viii
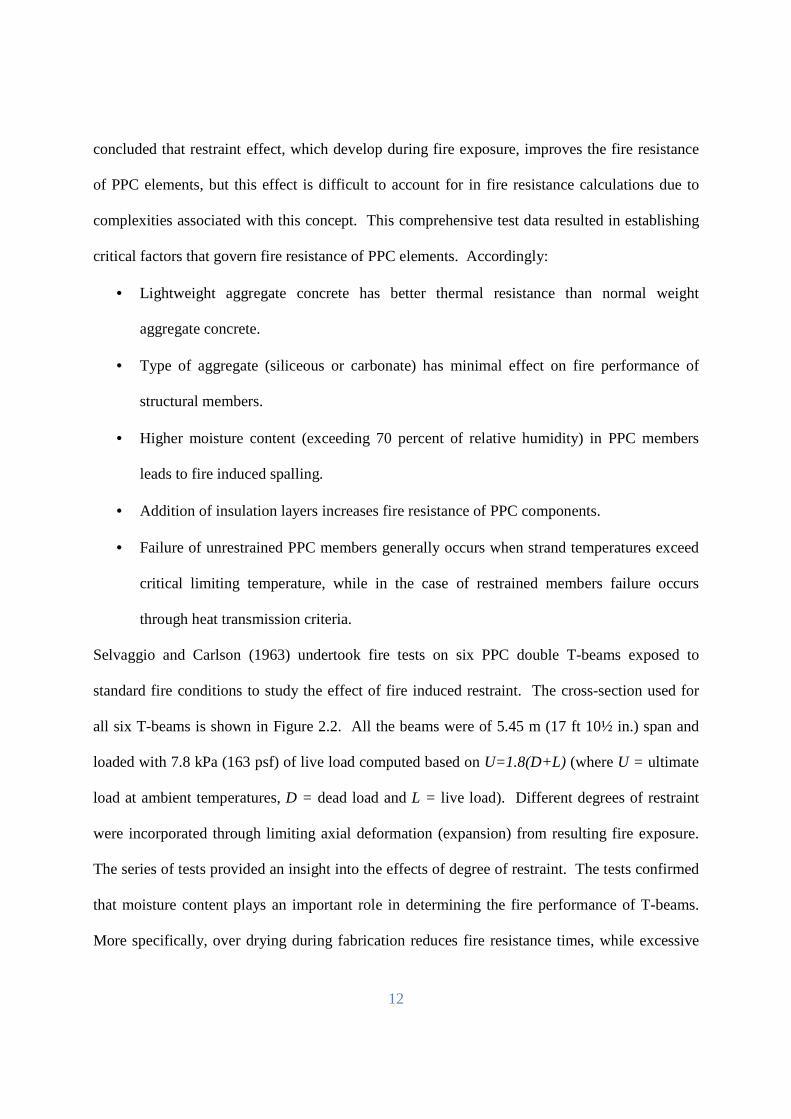
LIST OF FIGURES Figure 2.1 – Details of Bridge Girder Tested by Wood’s (1960) to Establish a Fire Rating ....... 49 Figure 2.2 – Details of T-beams Tested by Selvaggio and Carlson (1963) to Study the Effect of
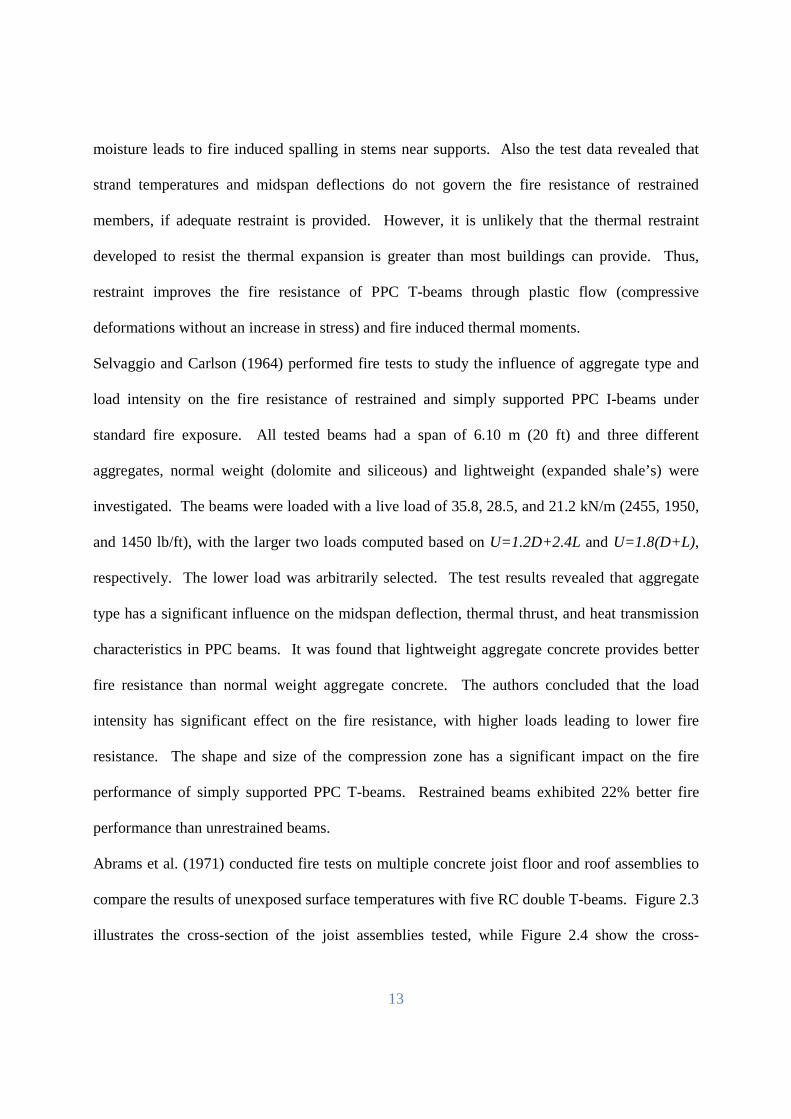
Restraint ............................................................................................................................... 49 Figure 2.3 – Details of Concrete Joist Floor and Roof Assembly Tested by Abram et al. (1971) to
Evaluate Unexposed Surface Temperatures ........................................................................ 50 Figure 2.4 – Details of T-beam’s Tested by Abram et al. (1971) to Compare the Unexposed Slab
Temperatures (a) First Test Specimen ........................................................................................................ 50 (b) Second Test Specimen ................................................................................................... 50
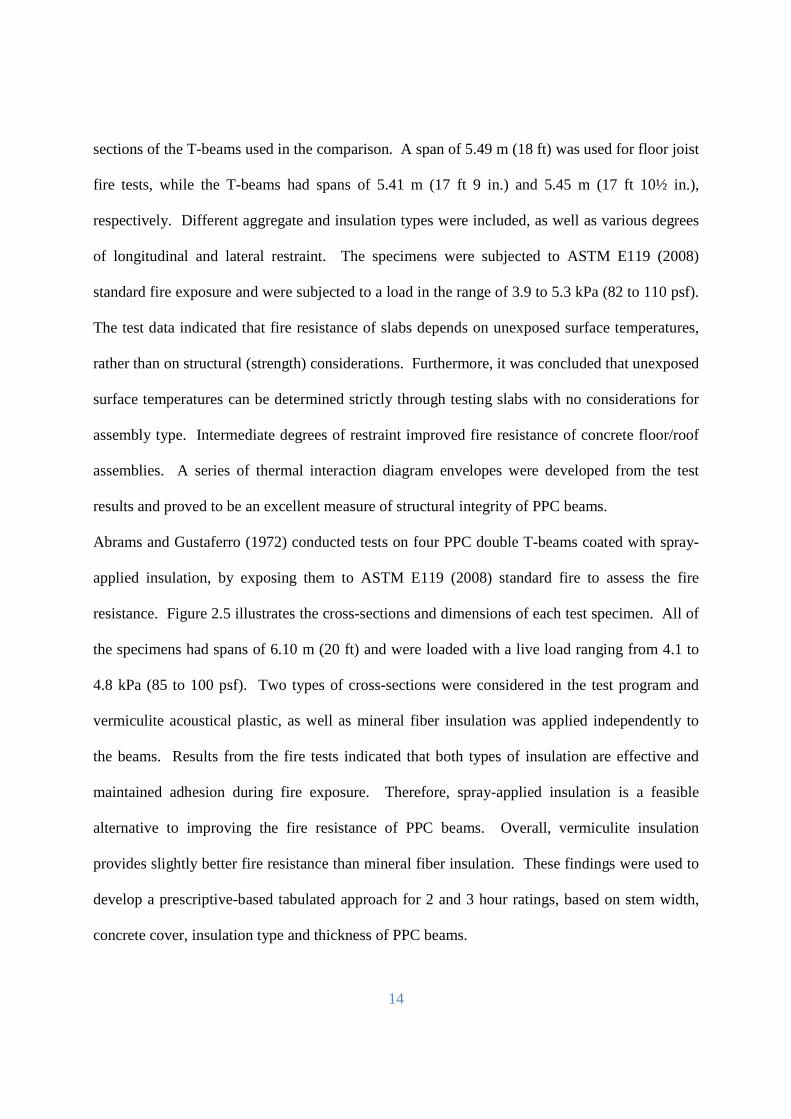
Figure 2.5 - Details of Insulated T-beam’s Tested by Abram’s and Gustaferro’s (1972) Study to
Assess the Effect of Spray-applied Insulation on Fire Ratings (a) Non-insulated T-beam .................................................................................................... 51 (b) ½ in. Vermiculite Acoustical Insulation Protected T-beam ........................................... 51
(c) 1 in. Vermiculite Acoustical Insulation Protected T-beam ............................................ 52
(d) ½ in. Mineral Fiber Insulation Protected T-beam .......................................................... 52 Figure 2.6 – Details of Continuous RC Beams Tested by Lin et al. (1981) to Investigate the
Effects of Shear and Moment Redistribution on Fire Performance ..................................... 53
Figure 2.7 – Details of Continuous T-beam Tested by Lin et al. (1981) to Investigate the Effects
of Shear and Moment Redistribution on Fire Performance
(a) Midspan Section ............................................................................................................. 53
(b) Support Section .............................................................................................................. 53
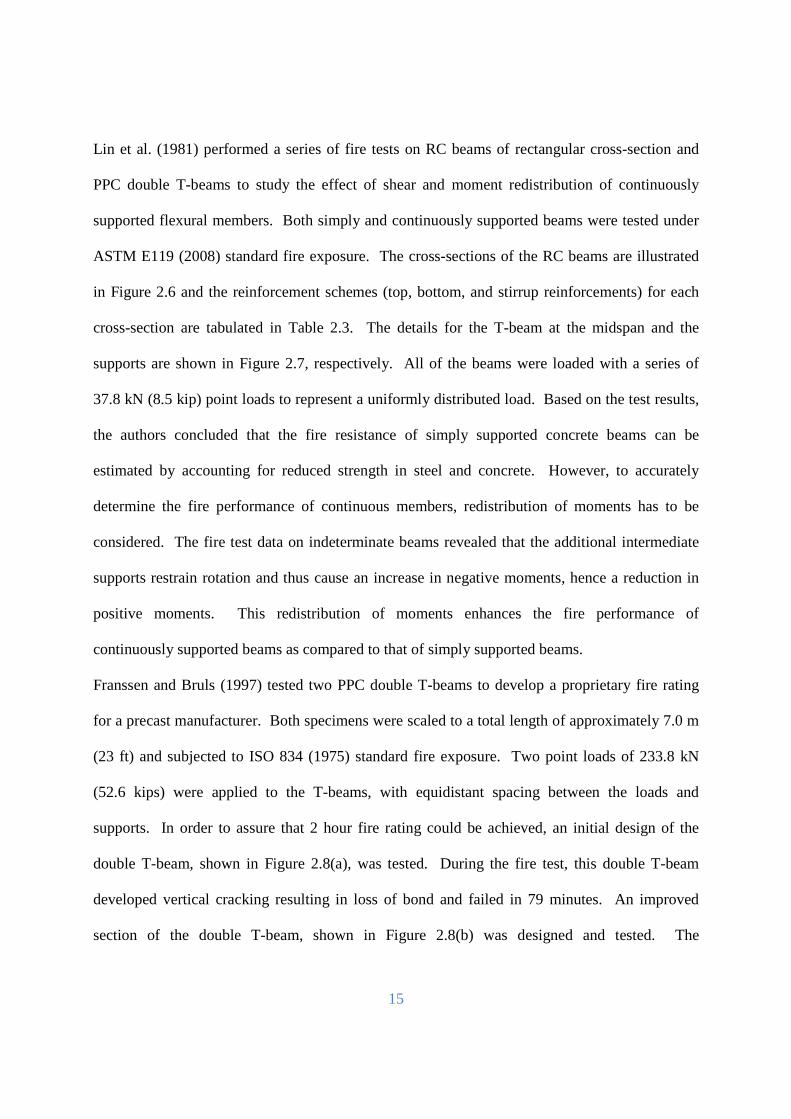
Figure 2.8 – Cross-sectional Details of Double T-beams Tested by Franssen and Bruls (2007) to
Develop a Proprietary Fire Rating
(a) Original Section .............................................................................................................. 54
(b) Improved Section ........................................................................................................... 54 Figure 2.9 – Details of Double T-beams Tested by Anderson and Lauridsen (1999) to Study the
Effects of Fire Induced Spalling
(a) Cross-sectional Details ................................................................................................... 55 (b) Strand Arrangements in the Beams ................................................................................ 55
Figure 2.10 – Variation of Thermal Conductivity of Concrete as Function of Temperature
according to Eurocode (2004) and ASCE (1992) ................................................................ 56 Figure 2.11 – Variation of Thermal Capacity of Concrete as a Function of Temperature
according to Eurocode (2004) and ASCE (1992) ................................................................ 56
ix
Figure 2.12 – Variation of Concrete Stress-Strain Curves as a Function of Temperature according to Eurocode (2004) and ASCE (1992) ................................................................................. 57
Figure 2.14 – Variation of Concrete Compressive Strength as a Function of Temperature
according to Eurocode (2004) and ASCE (1992) ................................................................ 58 Figure 2.16 – Variation of Concrete Thermal Expansion as a Function of Temperature according
to Eurocode (2004) and ASCE (1992) ................................................................................. 59 Figure 2.17 – Variation of Prestressing Steel Stress-Strain Curves as a Function of Temperature
according to Eurocode (2004) .............................................................................................. 60 Figure 2.18 – Variation of Mild Reinforcing Steel Stress-Strain Curves as a Function of
Temperature according to Eurocode (2004) and ASCE (1992) ........................................... 60
Figure 2.19 – Variation of Mild Reinforcing and Prestressing Steel Ultimate Strength as a
Function of Temperature according to Eurocode (2004), PCI (2004), and ASCE (1992) .. 61
Figure 2.20 – Variation of Mild Reinforcing and Prestressing Steel Yield Strength as a Function
of Temperature according to Eurocode (2004) and ASCE (1992) ...................................... 61
Figure 2.21 – Variation of Mild Reinforcing and Prestressing Steel Elastic Modulus as a
Function of Temperature according to Eurocode (2004) and ASCE (1992) ....................... 62
Figure 2.22 – Variation of Mild Reinforcing and Prestressing Steel Thermal Elongation as a
Function of Temperature according to ASCE (1992) and Eurocode (2004) ....................... 62
Figure 3.1 – Overview of SAFIR’s General Analysis Procedure ................................................. 74 Figure 3.2 – 10DT24+2 Thermal Model for Temperature Analysis of PPC T-beam. For
interpretation of the references to color in this and all other figures, the reader is referred to the electronic version of this thesis. ..................................................................................... 75
Figure 3.3 – 10DT24+2 Structural Model for Strength Analysis of PPC T-beam. ...................... 75
Figure 3.4 – Thermal Model I, II, and III for Temperature Analysis of PPC T-beam. ................ 76
Figure 3.5 – Variation of Strand and Average Slab Temperatures as a Function of Time for
Model I, II, and III. .............................................................................................................. 77
Figure 3.6 – Midspan Deflection as a Function of Time for Model I, II, and III. ........................ 77
Figure 3.7 – Cross-sectional Details of the Beam Tested by UL for Establishing Fire Ratings .. 78
Figure 3.8 – Unexposed Slab Temperatures as a Function of Time for Various Slab Thickness for
UL Beam .............................................................................................................................. 78

x
Figure 3.9 – Comparison of Predicted Fire Resistance (SAFIR) with Measured Test Data. ....... 79
Figure 3.10 – Cross-sectional details of Gusaferro et. al. Beam used in Validation Study. ......... 79
Figure 3.11 – Variation of Strand Temperature as a Function of Time for Gustaferro et al. PPC
beam. .................................................................................................................................... 80
Figure 3.12 – Comparison of Predicted Midspan Deflections with Test Data for Gustaferro et al.
PPC Beam. ........................................................................................................................... 80
Figure 4.1 – Elevation and Cross-sectional Details of the 10DT24+2 PPC Double T-beam used
in the Parametric Study
(a) Elevation ....................................................................................................................... 100
(b) Cross-section ................................................................................................................ 100
Figure 4.2 – Elevation and Cross-sectional Details of the 12DT32+2 PPC Double T-beam used
in Parametric Study (a) Elevation ....................................................................................................................... 101
(b) Cross-section ................................................................................................................ 101
Figure 4.3 – Time-temperature Relationships for Various Fire Scenarios used in Parametric
Study .................................................................................................................................. 102
Figure 4.4 – Variation of Strand and Slab Temperatures as a Function of Time in PPC Beam
12DT32+2 .......................................................................................................................... 102
Figure 4.5 – Midspan Deflection as a Function of Time for PPC Beam 12DT32+2 under Various
Fires Scenarios ................................................................................................................... 103
Figure 4.6 – Midspan Deflection as a Function of Time for PPC Beam 12DT32+2 with different
Concrete Strengths ............................................................................................................. 103
Figure 4.7 – Idealization of PPC Beam with Axial Restraint End Condition
(a) Elevation ....................................................................................................................... 104
(b) Sectional Forces, Moments, and Strains ...................................................................... 104 Figure 4.8 – Effect of Axial Restraint on Fire Response of 12DT32+2 PPC Beam
(a) Fire-induced Axial Force .............................................................................................. 105 (b) Midspan Deflection ...................................................................................................... 105
Figure 4.9 – Effect of Load Intensity on Fire Response of 10DT24+2 PPC Beam
(a) Fire Resistance.............................................................................................................. 106
(b) Midspan Deflection ...................................................................................................... 106 Figure 4.10 – Effect of Aggregate Type on Midspan Deflection of PPC Beam 12DT32+2 ...... 107
xi
Figure C.1 – Variation of Specific Heat of Concrete as a Function of Temperature for Different Moisture Contents by Weight ............................................................................................ 158
Figure C.2 – Variation of Volumetric Specific Heat of Concrete as a Function of Temperature for
Different Moisture Contents by Weight ............................................................................ 159 Figure C.3 – Variation of Thermal Conductivity of Concrete as a Function of Temperature .... 159
Figure C.4 – Variation of Concrete Density as a Function of Temperature ............................... 160
Figure C.6 – Variation of Concrete Tensile Strength as a Function of Temperature ................. 161
Figure C.7 – Variation of Stress-strain Curve of Concrete as a Function of Temperature......... 161
Figure C.8 – Variation of Prestressing Steel Thermal Elongation as a Function of Temperature
............................................................................................................................................ 162
Figure C.9 – Variation of Stress-strain Curve of Prestressing Steel as a Function of Temperature
............................................................................................................................................ 162
xii
KEY TO SYMBOLS
a distance from member’s bottom face to centroid of bottom strand
amod modification for the strand axis distances based the member’s cross-section
asd average distance from member’s side face to axis distance of strand
asd,mod modified average distance from members side face to axis distance of strand
aθ temperature reduced depth of equivalent rectangular stress block
A cross-sectional area
Aeff effective area of member
Ak unfactored load due to fire effect
Aps cross-sectional area of prestressing strands
As cross-sectional area of steel truss member
As,provided area of prestressing steel provided
As,req required area of prestressing steel
b width of stem at strand centroid
b width of member
beff effective width of members compression face
bw width of member
c distance from extreme compression fiber to neutral axis
cavg average concrete cover for side strands
xiii
cbottom average minimum concrete cover for bottom strands
cmin minimum concrete cover
creq required concrete cover to meet fire resistance rating
cside average minimum concrete cover for side strands
C compressive force in strands
d distance from extreme compression fiber to centroid of prestressing steel in tension
dp distance from extreme compression fiber to centroid of prestressing steel in tension
D unfactored dead load
DL unfactored dead load pressure
e eccentricity between thermal induced force and center gravity of section
Es elastic modulus of steel truss member
f’ c concrete compressive strength
fck characteristic compressive cylinder strength of concrete at 28 days
f prθ stress in prestressed reinforcement at factored resistance under elevated
temperatures
fpsθ temperature reduced stress in prestressed reinforcement at nominal strength of
member
fpu ultimate strength of prestressing steel
fpuθ temperature reduce ultimate tensile strength of prestressing steel
xiv
fpy specified yield strength of prestressing steel
fse effective stress in prestressing steel after losses
FRR fire resistance rating
Gk characteristic permanent action
h concrete slab (topping) thickness
hs slab thickness
I moment of inertia
kp coefficient used in calculating critical load
ks reduction factor for a strength or deformation property dependent on the material
temperature
K axial stiffness of steel truss member
l length of steel truss member
l span length
L unfactored live load
M thermal induced restraining moment
MEd,fi deign value of the applied internal bending moment under fire conditions
M nθ nominal moment strength of section at elevated temperatures
MRd,fi design resistance value of the applied internal bending moment under fire
conditions
Qk characteristic variable action
xv
Rc nominal moment resistance of a member under ambient temperatures
Rf applied moment under fire conditions
S tensile force in strands, unfactored snow load
Sb section modulus with respect to the bottom fiber of a cross-section
Sb section modulus with respect to the top fiber of a cross-section
tf flange thickness
T thermal induced axial force
u distance from strand centroid to bottom of member
U ultimate load capacity at ambient temperatures
V/S volume-to-surface ratio
w uniform load
wEd,fi factored uniform load under fire conditions
wf factored uniform load under fire conditions
Wt self-weight
W unfactored wind load
yb distance from the bottom fiber to the center gravity of the section
ys distance from the centroid of prestressing strands to the bottom fiber
yt distance from the top fiber to the center gravity of the section
α1 ratio of average stress in rectangular compression block to the specified concrete
strength
xvi
β1 compressive stress block factor
εc compressive strain in the top fiber of the section
εs tensile strain in prestressing strand
γp factor for type of prestressing tendon
γs partial factor for prestressing steel
γs,fi partial factor for prestressing steel for material in fire design
θc strength reduction factor under ambient temperatures
θcr critical temperature of prestressing strand
θf strength reduction factor under fire conditions
σp ultimate stress of prestressing steel
σprθ ultimate stress of prestressing steel at elevated temperatures
η reduction factor for design load level in fire situation
ω positive steel reinforcement ratio
ωpu prestressing steel reinforcement ratio
ω‘ negative steel reinforcement ratio

1
Chapter 1
1. Introduction
1.1. General
In recent years precast/prestressed concrete (PPC) construction has gained wide popularity in
buildings, bridges, parking structures, and shopping centers. Precast concrete is a type of
construction, where concrete is cast offsite in a reusable mould and then cured in a controlled
environment until it is transported to the worksite and erected. A common practice in the precast
industry is to prestress the concrete to overcome the concrete’s natural weakness to tensile
stresses. One method to prestress concrete is by casting concrete around already tensioned high-
strength steel strands. Once the concrete has partially cured, the strands are released to induce a
net compressive force onto the concrete through friction developed between the concrete and the
strands. This clamping or prestressing effect improves the capacity of concrete members and has
2
advantages over traditional reinforced concrete (RC). For example, a PPC double T-beam can be
used in applications with longer spans than a heavily reinforced double T-beam with a similar
cross-section. Other key advantages that have led to the prevalence of PPC construction in
today’s structural landscape are its desirable span-to-depth ratios, aesthetics, high quality
manufacturing, constructability, low maintenance characteristics, aptitude for seismic
applications, acoustics, and fire resistance.
Similar to all types of construction, PPC structures must satisfy minimal safety requirements set
forth in design codes, including structural fire safety provisions. The fundamental philosophy
behind the structural fire safety design of a building is to protect against death, injury, and
property loss during the event of a fire. The two main strategies to provide fire safety are
categorized as either active or passive fire protection. Active protection systems include
sprinklers, smoke and heat detectors, and fire extinguishers. The primary goals of active
protection systems are to either automatically or manually prevent the ignition or growth of a
fire. These systems are also intended to ensure the safe escape of buildings occupants from
harmful temperatures or smoke inhalation. In contrast, passive fire protection systems refer to
the fire resistance measures incorporated into building’s structural and nonstructural
components. By carefully selecting fire resistant construction materials and proper design of
building components, passive fire protection can prevent the spread of fire and collapse of a
structure. This thesis focuses on the fire resistance (passive fire protection) of a PPC component,
more specifically the fire resistance of PPC double T-beams.
3
1.2. Fire Resistance of Prestressed Concrete
The primary approach to incorporate passive fire protection measures into a building is through
proper selection of fire resistant construction materials, such as concrete. One of the many
advantages concrete has over alternative construction materials, such as wood, steel or fiber
reinforced polymers, is its inherent fire resistance. The fire resistance of concrete is a product of
its’ constituents, cement and aggregates. Both of these materials possess a low rate of heat
transfer and poor thermal conductivity. Upon chemically combining the components, a high fire
resistant construction material (concrete) is produced that is virtually inert, non-combustible, and
does not emit smoke, toxic fumes, or molten. Concrete’s ability to resist fire is one reason for
PPC construction prevalence in residential, warehouse, and industrial buildings, as well as,
parking structures, justice facilities, stadiums, and arenas.
To ensure fire safety of PPC facilities and their occupants it is crucial to understand how its
constituent materials, such as concrete and prestressing steel, respond to elevated temperatures.
When concrete is exposed to prolonged fire exposure the hydrated cement paste composing the
matrix binding the aggregates will eventually revert back into its initial components, water and
cement. This chemical transformation leads to a slow reduction in the concrete’s strength and
stiffness. The rate of strength and stiffness loss is dependent on the thermal resistance of a
concretes mix design. Variations in concrete mixes, such as aggregate type or content, density,
moisture content, permeability, porosity, cement composition, and w/c ratio can dramatically
affect the concrete’s thermal resistance. Therefore, to ensure fire safety, engineers must
understand how variations in concrete mix design affect the fire resistance of prestressed
concrete.
4
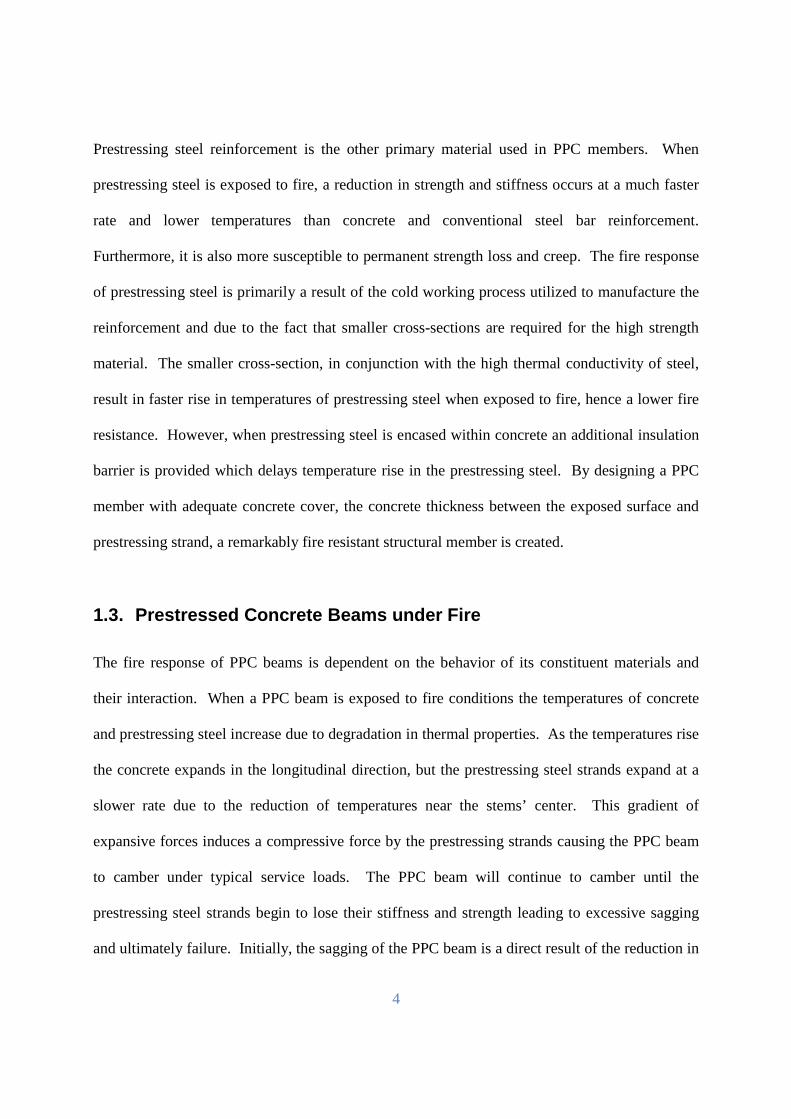
Prestressing steel reinforcement is the other primary material used in PPC members. When
prestressing steel is exposed to fire, a reduction in strength and stiffness occurs at a much faster
rate and lower temperatures than concrete and conventional steel bar reinforcement.
Furthermore, it is also more susceptible to permanent strength loss and creep. The fire response
of prestressing steel is primarily a result of the cold working process utilized to manufacture the
reinforcement and due to the fact that smaller cross-sections are required for the high strength
material. The smaller cross-section, in conjunction with the high thermal conductivity of steel,
result in faster rise in temperatures of prestressing steel when exposed to fire, hence a lower fire
resistance. However, when prestressing steel is encased within concrete an additional insulation
barrier is provided which delays temperature rise in the prestressing steel. By designing a PPC
member with adequate concrete cover, the concrete thickness between the exposed surface and
prestressing strand, a remarkably fire resistant structural member is created.
1.3. Prestressed Concrete Beams under Fire
The fire response of PPC beams is dependent on the behavior of its constituent materials and
their interaction. When a PPC beam is exposed to fire conditions the temperatures of concrete
and prestressing steel increase due to degradation in thermal properties. As the temperatures rise
the concrete expands in the longitudinal direction, but the prestressing steel strands expand at a
slower rate due to the reduction of temperatures near the stems’ center. This gradient of
expansive forces induces a compressive force by the prestressing strands causing the PPC beam
to camber under typical service loads. The PPC beam will continue to camber until the
prestressing steel strands begin to lose their stiffness and strength leading to excessive sagging
and ultimately failure. Initially, the sagging of the PPC beam is a direct result of the reduction in
5
strength and stiffness of its constituents’ mechanical properties, but just prior to failure high
temperature creep amplifies the sagging. Failure occurs once the capacity of the PPC beam has
reduced low enough to be overtaken by the demands of the applied loading. The duration of
time, starting from the ignition of the fire until failure is attained in the structural member, is
defined as the fire resistance of a PPC beam. Fire resistance of PPC beams is influenced by a
number of factors such as fire scenario, load level, and restraint.
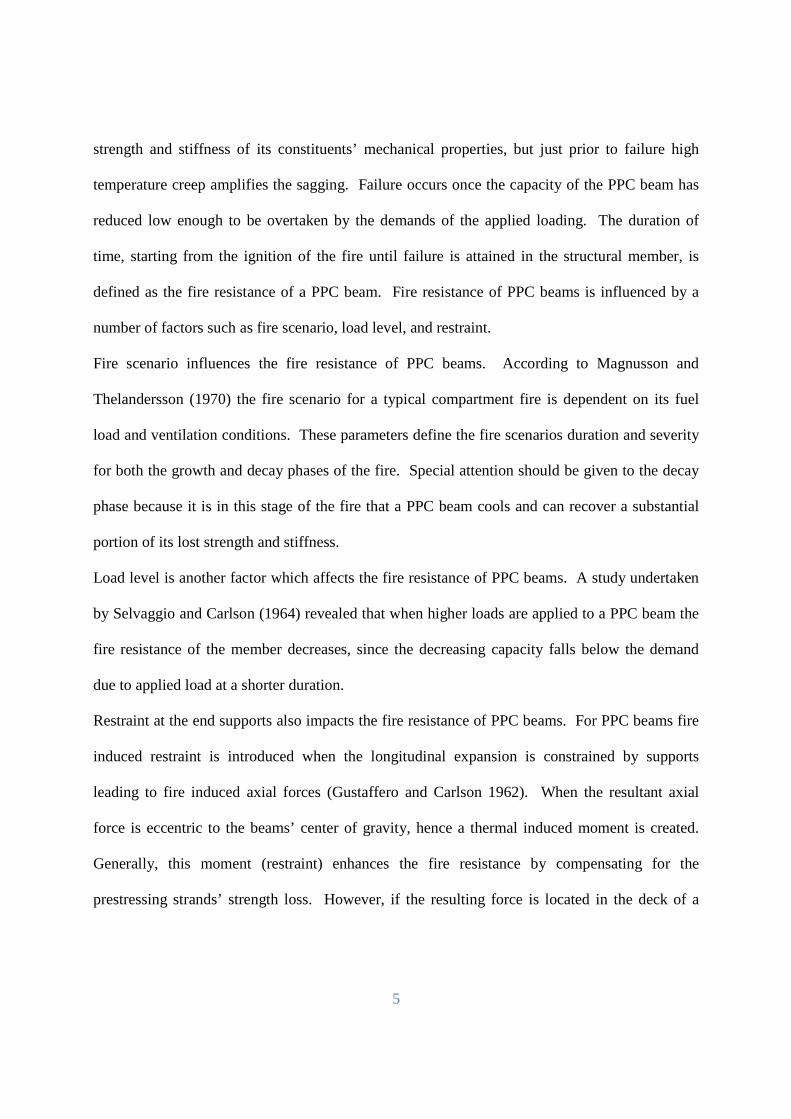
Fire scenario influences the fire resistance of PPC beams. According to Magnusson and
Thelandersson (1970) the fire scenario for a typical compartment fire is dependent on its fuel
load and ventilation conditions. These parameters define the fire scenarios duration and severity
for both the growth and decay phases of the fire. Special attention should be given to the decay
phase because it is in this stage of the fire that a PPC beam cools and can recover a substantial
portion of its lost strength and stiffness.
Load level is another factor which affects the fire resistance of PPC beams. A study undertaken
by Selvaggio and Carlson (1964) revealed that when higher loads are applied to a PPC beam the
fire resistance of the member decreases, since the decreasing capacity falls below the demand
due to applied load at a shorter duration.
Restraint at the end supports also impacts the fire resistance of PPC beams. For PPC beams fire
induced restraint is introduced when the longitudinal expansion is constrained by supports
leading to fire induced axial forces (Gustaffero and Carlson 1962). When the resultant axial
force is eccentric to the beams’ center of gravity, hence a thermal induced moment is created.
Generally, this moment (restraint) enhances the fire resistance by compensating for the
prestressing strands’ strength loss. However, if the resulting force is located in the deck of a
6
PPC beam (above the center of gravity of the section) then the thermal induced moment can have
a negative effect and may lead to early failure.
1.4. Fire Resistance Design
Structural fire safety is one of the primary considerations in building applications and hence,
building codes generally specify fire resistance rating requirements for structural elements.
These fire resistance ratings are generally derived based on standard fire resistance tests or
through prescriptive-based approaches. As an illustration, the prescriptive-based provisions in
ACI 216.1 (2007) estimates fire ratings based on minimum concrete cover thickness to the
reinforcement in PPC beams. These provisions are limited in scope and restrictive in application
since they were developed in accordance with ASTM E119 (2008) standard fire tests.
Furthermore, the provisions are valid only for narrow range of beams, and do not fully account
for realistic fire, loading or restraint scenarios. In addition, simplified rules of thumb cannot be
applied to new types of designs (different section configurations) and materials (high strength
concrete), which limits designers from taking full advantage of the high fire resistance attributes
offered by PPC construction.
1.5. Objectives
This thesis presents results from numerical studies aimed at overcoming the current fire
resistance limitations for PPC double T-beams. A performance-based approach is applied in the
fire resistance analysis of PPC double T-beams. Two double T-beams were analyzed using a
finite element based computer program under different fire scenarios, loading and restraint.
High temperature material properties, various load and restraint levels, and material and
7
geometric nonlinearities were accounted for. A realistic failure criterion was also included to
evaluate the fire response and determine failure. The design fires were selected to provide a
wide spectrum of possible building applications. Results from the parametric studies were used
to study the thermal and structural response of PPC double T-beams under realistic fire exposure,
restraint, load intensity and failure conditions. To achieve this objective the following tasks were
performed to accomplish the intended objectives.
• Conduct a detailed state-of-the-art literature review of experimental and analytical
studies, as well as provisions in current design codes on the fire resistance of PPC
flexural members.
• Illustrate the differences between United States (US) of America, Canadian, and
Eurocode fire design provisions for evaluating fire resistance of PPC double T-beams
through a case.
• Validate the numerical model SAFIR using published fire test data on the response of
PPC double T-beams from Portland Cement Association (PCA) and Underwriter
Laboratories (UL) studies.
• Undertake a parametric study to verify the influence of critical factors on the fire
performance of PPC double T-beams.
• Outline a performance-based approach to undertake fire resistance analysis on PPC
double T-beams.
1.6. Layout
This thesis is divided into six main chapters, followed by a series of appendices. Chapter 1
provides the background on the fire resistance of PPC beams and objectives for this thesis. The
8
intent of Chapter 2 is to identify the critical factors affecting the fire resistance of PPC beams
through a state-of-the-art literature review highlighting the details and findings of fire tests and
numerical studies. In addition, an overview of current provisions provided in US, Canadian, and
Eurocode codes/standards is discussed. Chapter 3 presents the details regarding capabilities,
features, and analysis procedures of the finite-element based SAFIR computer program. A
sensitivity analysis investigating the level of refinement required to discretize the model is also
presented in this chapter. Also, the validation of the model is presented by comparing fire
resistance predictions with data from fire tests and finite-element analyses. Chapter 4 presents
details and results of the parametric study on the effect of critical factors on the fire resistance of
two PPC double T-beams. These results are used in Chapter 5 to develop guidelines for a
performance-based approach for PPC beams. The guidelines outline the specific requirements
for the selection of the fire scenario, material model, numerical model, and failure criteria. The
final chapter, Chapter 6, presents conclusions from the study recommendations for future work.
9
Chapter 2
2. Literature Review 2.1. General
Since the 1950’s a number of experimental and analytical studies have been carried out to study
the response of precast/prestressed concrete (PPC) members under fire conditions. Typically,
these studies were based on standard fire exposure and focused strictly on the behavior of single
elements such as beams, slabs, etc., and neglected any structural interactions such as beam-slab
assemblies and framed structures. Through these studies, many of the key factors affecting fire
resistance of PPC members have been identified. Many of these findings are the basis of
prescriptive fire provisions offered in design codes and standards. A brief overview of a state-of-
the-art literature review of experimental and analytical studies is presented to investigate the
behavior of PPC beams and its constituents under fire exposure. In addition, provisions in US,
10
Canadian, and Eurocode design fire codes/standards and high temperature material properties
influencing the fire resistance of concrete, prestressing steel, and reinforcing steel are reviewed.
The discussion provided for each material property is accompanied with high temperature
material models used to predict the fire resistance of PPC beams.
2.2. Design for Fire Resistance
The fire resistance of a structural member is defined as the time to reach failure under a given
fire exposure. In the US, failure of a roof/floor beam correlates to the time when the beam,
which is subjected to an ASTM E119 fire exposure, has either exceeded a predefined unexposed
slab or critical strand temperature, or when the strength limit state is reached. For a structural
element to be deemed acceptable in a building application, the fire resistance time must be equal
to or exceed the required fire rating. The fire rating is the minimal time required by building fire
codes and is dependent on the type of structural element, the occupancy of the building and the
building characteristics. The most common method to establish fire resistance of a concrete
beam is through tabulated data based on cross-sectional area, aggregate type, and concrete cover.
These fire ratings are derived from standard fire tests. The problem with this approach is that
these tabulated fire ratings are based on standard fire tests for a few select beams and cannot be
extended to other types of beam cross-sections. The following literature review highlights many
of the fire tests carried out to establish the current fire resistance requirements and is intended to
reveal the limitations of their application.
11
State-of-the-art
2.2.1. Fire Resistance Tests
Numerous fire resistance tests have been performed on PPC beams primarily to derive fire
resistance ratings. The majority of these tests have been based on scaled specimens subjected to
standard fire exposure. Some of the notable experimental studies are discussed below:
Woods (1960) conducted one of the first fire tests on a PPC beam at the Portland Cement
Association (PCA) Fire Research Center in USA. A full sized, 14.26 m (43 ft 6 in.), I-shaped
bridge girder, illustrated in Figure 2.1, was tested in a massive furnace to determine its structural
behavior and fire resistance rating under an ASTM E119 (2008) standard fire exposure. This
PPC beam achieved a high fire resistance of 4 hr 31 min and this was attributed to massive
concrete cross-sectional area capable of absorbing substantial amounts of heat. Further, Woods
concluded that concrete cover thickness to steel strands has significant impact on fire resistance
of PPC beams.
Results of 47 standard fire tests on precast PPC building components (beams and slabs),
conducted by several organizations were compiled by Gustaferro and Carlson (1962). These fire
tests were conducted by National Bureau of Standards, Underwriters Laboratories, PCA, and
Fire Prevention Research Institute to assess the critical factors affecting fire performance. An
assortment of span lengths, insulation thicknesses, aggregate types and member cross-section
shapes, such as I-shaped, double-tee, and single-tee beams, as well as flat hollow-core, solid, and
stemmed floor assemblies, were tested in accordance with ASTM E119 (2008) standard test
provisions. Using the data from 43 beam and 4 slab fire tests, a prescriptive-based table of fire
ratings for 1, 2, 3, and 4 hours are shown in Table 2.1 was developed for beams and slabs in
terms of concrete cover and cross-sectional area. Based on the analysis of test data the authors
12
concluded that restraint effect, which develop during fire exposure, improves the fire resistance
of PPC elements, but this effect is difficult to account for in fire resistance calculations due to
complexities associated with this concept. This comprehensive test data resulted in establishing
critical factors that govern fire resistance of PPC elements. Accordingly:
• Lightweight aggregate concrete has better thermal resistance than normal weight
aggregate concrete.
• Type of aggregate (siliceous or carbonate) has minimal effect on fire performance of
structural members.
• Higher moisture content (exceeding 70 percent of relative humidity) in PPC members
leads to fire induced spalling.
• Addition of insulation layers increases fire resistance of PPC components.
• Failure of unrestrained PPC members generally occurs when strand temperatures exceed
critical limiting temperature, while in the case of restrained members failure occurs
through heat transmission criteria.
Selvaggio and Carlson (1963) undertook fire tests on six PPC double T-beams exposed to
standard fire conditions to study the effect of fire induced restraint. The cross-section used for
all six T-beams is shown in Figure 2.2. All the beams were of 5.45 m (17 ft 10½ in.) span and
loaded with 7.8 kPa (163 psf) of live load computed based on U=1.8(D+L) (where U = ultimate
load at ambient temperatures, D = dead load and L = live load). Different degrees of restraint
were incorporated through limiting axial deformation (expansion) from resulting fire exposure.
The series of tests provided an insight into the effects of degree of restraint. The tests confirmed
that moisture content plays an important role in determining the fire performance of T-beams.
More specifically, over drying during fabrication reduces fire resistance times, while excessive
13
moisture leads to fire induced spalling in stems near supports. Also the test data revealed that
strand temperatures and midspan deflections do not govern the fire resistance of restrained
members, if adequate restraint is provided. However, it is unlikely that the thermal restraint
developed to resist the thermal expansion is greater than most buildings can provide. Thus,
restraint improves the fire resistance of PPC T-beams through plastic flow (compressive
deformations without an increase in stress) and fire induced thermal moments.
Selvaggio and Carlson (1964) performed fire tests to study the influence of aggregate type and
load intensity on the fire resistance of restrained and simply supported PPC I-beams under
standard fire exposure. All tested beams had a span of 6.10 m (20 ft) and three different
aggregates, normal weight (dolomite and siliceous) and lightweight (expanded shale’s) were
investigated. The beams were loaded with a live load of 35.8, 28.5, and 21.2 kN/m (2455, 1950,
and 1450 lb/ft), with the larger two loads computed based on U=1.2D+2.4L and U=1.8(D+L),
respectively. The lower load was arbitrarily selected. The test results revealed that aggregate
type has a significant influence on the midspan deflection, thermal thrust, and heat transmission
characteristics in PPC beams. It was found that lightweight aggregate concrete provides better
fire resistance than normal weight aggregate concrete. The authors concluded that the load
intensity has significant effect on the fire resistance, with higher loads leading to lower fire
resistance. The shape and size of the compression zone has a significant impact on the fire
performance of simply supported PPC T-beams. Restrained beams exhibited 22% better fire
performance than unrestrained beams.
Abrams et al. (1971) conducted fire tests on multiple concrete joist floor and roof assemblies to
compare the results of unexposed surface temperatures with five RC double T-beams. Figure 2.3
illustrates the cross-section of the joist assemblies tested, while Figure 2.4 show the cross-
14
sections of the T-beams used in the comparison. A span of 5.49 m (18 ft) was used for floor joist
fire tests, while the T-beams had spans of 5.41 m (17 ft 9 in.) and 5.45 m (17 ft 10½ in.),
respectively. Different aggregate and insulation types were included, as well as various degrees
of longitudinal and lateral restraint. The specimens were subjected to ASTM E119 (2008)
standard fire exposure and were subjected to a load in the range of 3.9 to 5.3 kPa (82 to 110 psf).
The test data indicated that fire resistance of slabs depends on unexposed surface temperatures,
rather than on structural (strength) considerations. Furthermore, it was concluded that unexposed
surface temperatures can be determined strictly through testing slabs with no considerations for
assembly type. Intermediate degrees of restraint improved fire resistance of concrete floor/roof
assemblies. A series of thermal interaction diagram envelopes were developed from the test
results and proved to be an excellent measure of structural integrity of PPC beams.
Abrams and Gustaferro (1972) conducted tests on four PPC double T-beams coated with spray-
applied insulation, by exposing them to ASTM E119 (2008) standard fire to assess the fire
resistance. Figure 2.5 illustrates the cross-sections and dimensions of each test specimen. All of
the specimens had spans of 6.10 m (20 ft) and were loaded with a live load ranging from 4.1 to
4.8 kPa (85 to 100 psf). Two types of cross-sections were considered in the test program and
vermiculite acoustical plastic, as well as mineral fiber insulation was applied independently to
the beams. Results from the fire tests indicated that both types of insulation are effective and
maintained adhesion during fire exposure. Therefore, spray-applied insulation is a feasible
alternative to improving the fire resistance of PPC beams. Overall, vermiculite insulation
provides slightly better fire resistance than mineral fiber insulation. These findings were used to
develop a prescriptive-based tabulated approach for 2 and 3 hour ratings, based on stem width,
concrete cover, insulation type and thickness of PPC beams.
15
Lin et al. (1981) performed a series of fire tests on RC beams of rectangular cross-section and
PPC double T-beams to study the effect of shear and moment redistribution of continuously
supported flexural members. Both simply and continuously supported beams were tested under
ASTM E119 (2008) standard fire exposure. The cross-sections of the RC beams are illustrated
in Figure 2.6 and the reinforcement schemes (top, bottom, and stirrup reinforcements) for each
cross-section are tabulated in Table 2.3. The details for the T-beam at the midspan and the
supports are shown in Figure 2.7, respectively. All of the beams were loaded with a series of
37.8 kN (8.5 kip) point loads to represent a uniformly distributed load. Based on the test results,
the authors concluded that the fire resistance of simply supported concrete beams can be
estimated by accounting for reduced strength in steel and concrete. However, to accurately
determine the fire performance of continuous members, redistribution of moments has to be
considered. The fire test data on indeterminate beams revealed that the additional intermediate
supports restrain rotation and thus cause an increase in negative moments, hence a reduction in
positive moments. This redistribution of moments enhances the fire performance of
continuously supported beams as compared to that of simply supported beams.
Franssen and Bruls (1997) tested two PPC double T-beams to develop a proprietary fire rating
for a precast manufacturer. Both specimens were scaled to a total length of approximately 7.0 m
(23 ft) and subjected to ISO 834 (1975) standard fire exposure. Two point loads of 233.8 kN
(52.6 kips) were applied to the T-beams, with equidistant spacing between the loads and
supports. In order to assure that 2 hour fire rating could be achieved, an initial design of the
double T-beam, shown in Figure 2.8(a), was tested. During the fire test, this double T-beam
developed vertical cracking resulting in loss of bond and failed in 79 minutes. An improved
section of the double T-beam, shown in Figure 2.8(b) was designed and tested. The
16
improvements included modifying the strand pattern into two columns, hooped shear
reinforcement, and reduced aggregate size to maximize bond strength. The modified beam when
tested achieved a 2 hour fire rating. The test proved that a single column of vertically aligned
prestressing strands are susceptible to hairline cracks that promote bond failure. Furthermore,
this study proved that bond failure can be minimized with appropriate detailing of prestressing
strands, shear reinforcement, and concrete mix design.
Anderson and Lauridsen (1999) conducted fire tests to investigate the effect of fire induced
spalling on fire resistance of three PPC double T-beams made with high strength concrete
(HSC). Figure 2.9 shows the generalized cross-section used for all three T-beams and the three
different strand arrangements. The simply supported beams had a span of approximately 6.12 m
(20 ft 1 in.) and were exposed to ISO 834 (1975) standard fire exposure. Four point loads
ranging from 364 to 374.8 kN (81.8 to 84.3 kips) were applied on the T-beams. Based on the
test results the authors concluded that HSC is prone to explosive spalling within the first 20
minutes of fire exposure, especially at the junction of the stem and bottom surface of the slab.
Another observation was that scaled specimens are more prone to bond failure because of the
dramatic increase in the shear envelope.
The experimental studies presented above have proven to be invaluable in identifying key factors
governing fire resistance of PPC beams and also common failure modes under fire conditions.
These tests indicate that the primary factors affecting fire performance of PPC beams are
moisture content, aggregate type, concrete density, restraint, insulation, continuity, and load
intensity. The typical failure in simply supported beam is dictated by its strand temperatures,
while in continuous beams the failure is governed by unexposed slab temperatures. Many of
these studies have been utilized to establish proprietary fire ratings, as well as prescriptive design
17
provisions. The design provisions are typically based on concrete cover thickness, aggregate
type, and either cross-sectional area or beam width. The fire ratings are prescriptive since these
ratings were derived based on standard fire conditions, without full consideration for load,
restraint or design fire scenario. Although, some studies did incorporate restraint, much work is
still required to quantify its influence in practical scenarios.
2.2.2. Analytical Studies
The review of literature indicates that there is limited number of analytical studies relating to the
fire performance of PPC beams. The reported analytical studies range from applying simple
empirical methods to advanced calculation approaches for evaluating fire resistance of PPC
beams. This section provides an overview of the analytical studies:
Boon and Monnier (1976) developed an analytical approach for evaluating fire resistance of PPC
beams based on shear and flexural failure criterion. This approach, developed utilizing available
data from fire tests on PPC beams, is applicable to simply supported beams exposed to standard
fire scenarios and subjected to service loads. Fundamentally, the approach is similar to generic
gravity load design with the exception that ambient strength properties of concrete,
reinforcement, and prestressing steel are reduced to account for the degradation of strength and
stiffness associated with elevated temperature. The reduced material properties in prestressing
steel at a given time is based on the temperature of each strand relative to its location from the
surface. For shear reinforcement, strength is computed based on actual fire temperatures. To
estimate such temperatures in the prestressing steel, time-temperature profiles based on concrete
cover thickness is provided. Similarly, plots are also supplemented to estimate the reduced
material properties for a given temperature. The reduced material properties are used to evaluate
18
the reduction in the beams’ shear and flexural capacity at a given fire exposure time. At any
given time, if applied loads (moments) exceed the member’s capacity, failure is said to occur due
to loss of prestressing strength, horizontal cracking of the stem and bond degradation.
Franssen and Bruls (1997) performed finite-element analysis on a PPC double T-beam to
evaluate its fire response. SAFIR (2004), a special purpose computer program, was utilized to
evaluate fire resistance based on flexural considerations only. To verify the results of the
analysis, a beam was tested under ISO 834 (1975) standard fire conditions. Contrary to author’s
assumption that flexural strength would govern, the beam failed in the fire test due to shear
considerations. Since SAFIR cannot handle shear considerations, Eurocode 2 (2004) provisions
were applied to determine ultimate shear capacity of the beam. The analysis indicated that shear
failure occurred in the beam at about 80 minutes, which coincided well with the Eurocode
predictions of 79 minutes. Results from this analysis were utilized to redesign the beam section
to enhance its shear resistance at both ambient and fire conditions. The analysis of the revised
section indicated that the fire resistance improved to 135 and 130 minutes based on shear and
flexural considerations, respectively. This upgraded beam when tested in the laboratory yielded
a fire resistance time of 144 minutes. This study clearly illustrated the usefulness of detailed
finite-element analysis to improve the member’s design for enhancing fire resistance.
Fellinger et al. (2001) attempted to develop an elasto-plastic bond slip model for 7-wire
prestressed strands embedded in concrete at ambient and elevated temperatures. The analysis
was carried out using a 2D finite-element computer program, named DIANA. The cross-section,
discretized into concrete, prestressing strand, and bond interface components, was represented
with plane stress triangular, truss, and plane stress quadrilateral elements, respectively. The
model captured changes in bond stress due to slip, Poison’s effect, concrete confinement, pitch,
19
splitting of concrete, and differential thermal expansions of steel and concrete. The mechanical
properties of the constituent materials were in accordance with Eurocode 2 (2004) relationships
and due consideration was given to thermal elongation, transient creep, plasticity, and fracture
energy. The model was validated by comparing the results with test data on hollow-core slabs.
The ambient temperature results indicated that the development of prestress, effect of shrinkage
and creep, and change of steel stress after development of flexural cracks can be predicted
reasonably well. However, under elevated temperatures, the model proved to be inconsistent due
to lack of temperature dependent input parameters (high temperature material properties such as
bond). Nonetheless, this study identified that the two key parameters, friction coefficient and
bond strength, have significant influence on fire performance of prestressing strands.
The above analytical studies indicate that both simplistic and advanced finite-element methods
can be applied in evaluating fire resistance of PPC beams. It should be noted that the models
used for analytical studies were validated only under standard fire conditions, without due
consideration to realistic load, restraint, and fire scenarios.
2.2.3. Provisions in Codes/Standards
In USA fire design provisions for concrete and masonry elements are specified in ACI 216
(1997), PCI Design Handbook (2004), ASCE/SEI/SFPE 29-05 (2007) and International Building
Code (2006). These codes and design standards offer three different alternatives to assess fire
ratings of PPC double T-beams exposed to three-sided standard fire exposure. The simplest and
quickest procedure consists of tabulated fire ratings based on minimum concrete cover thickness
to prestressing strands. The specified concrete cover thickness is based on a combination of
aggregate type (carbonate, siliceous, lightweight, semi-lightweight, or all), restraint (restrained or

20
unrestrained), and beam width or area considerations. These concrete cover thickness provisions
were derived from fire test data and assumes that failure occurs in the beam when temperature in
the strand reaches a limiting temperature of 427°C (800°F).
The PCI (2004) design standard offers an alternative to the tabulated fire ratings approach
through the use of simplified calculations. This approach is similar to ambient temperature
calculations in that flexural resistance is evaluated to determine if the beam can withstand the
load effects at a specified fire exposure time. The reduced capacity at any given fire exposure
time is evaluated by taking into consideration the loss of strength in prestressing steel,
reinforcing steel, and concrete. The strength loss is estimated using temperature-strength
relationships (graphs) derived from high temperature material test data. The strand temperatures
are estimated from temperature profiles (graphs) given for different beam dimensions and
aggregate type. If the computed capacity is less than the applied moment, failure is said to occur
and this fire exposure time is termed as “fire resistance.” One advantage in using this approach,
as compared to tabulated ratings, is that it accounts for the effect of load intensity.
In addition to flexural strength considerations, PCI (2004) design standard also require PPC
double T-beams to satisfy insulation (heat transmission) criteria, since the member acts as a
floor/roof (barrier) assembly. Accordingly, failure is said to occur when the unexposed
temperature on the slab exceeds 181°C (325°F) at any one point or an average of 139°C (250°F).
This limiting temperature ensures compartmentation functionality and corresponds to a critical
temperature required to ignite cotton waste. The tabulated fire ratings for the heat transmission
criterion of RC (PPC) slabs are expressed in the PCI Design Handbook as function of aggregate
type and concrete thickness. Additional heat transmission fire ratings are provided for insulated
and built-up concrete floor/roof assemblies based on slab thickness, insulation type (sprayed
21
mineral fiber, vermiculite cementitious material, mineral board, and glass fiber board), and
insulation thickness. Once both heat transmission and strength fire ratings are evaluated the
minimum of these two values represents the fire rating of PPC double T-beam and is generally
assigned to be as 1, 1½, 2, 3, or 4 hours ratings.
In Canada, the National Building Code of Canada (2005) and CPCI Design Manual (2007) are
two main guidance documents which set forth fire provisions for PPC structures. These
provisions are very much similar to those in US codes/standards. The tabulated fire ratings are
based on concrete cover to prestressing strands, but the specified cover thickness is only based
on aggregate type in concrete and beam area. Three aggregate types namely type S, N, and L
represent concrete composed of siliceous, calcareous, or lightweight aggregates, respectively.
No consideration for restraint is included because it is assumed that the unrestrained member
governs and will suffice for restrained conditions. Except for minor difference in tabulated fire
ratings, the simplified calculation method is virtually identical to provisions in US code
provisions. The only other significant difference in Canadian fire provisions is that heat
transmission criteria for insulated concrete floor/roof assemblies’ utilize multiplying factors
rather than tabulated data. The multiplying factors modify the effective thickness of the
insulation material (multiple types of plaster, gypsum wallboard, cellular concrete, vermiculite
and perlite concrete, portland cement with sand aggregates, and terrazzo) to determine a
equivalent concrete thickness based on its thermal properties. This equivalent thickness is then
used to determine the tabulated fire rating, similar to US fire provisions. Based on these three
criteria a fire rating, corresponding to a minimum value, is assigned for PPC double T-beam as
½, ¾, 1, 1½, 2, 3 or 4 hours.
22
In Europe fire provisions for PPC structures are specified in the Eurocode. The tabulated fire
ratings for PPC beams set forth in Eurocode 2 (2004) are similar to US and Candian fire
provisions, except they are based on combinations of web width and axis distance to strand
centroid for both simply and continuously supported beams. An additional set of tabulated fire
ratings is provided for four-sided exposure (in addition to three-sided exposure) in beams.
Neither set of tabulating fire ratings in the Eurocode take in to consideration the influence of
aggregate type on fire resistance. In addtion to these prescriptive-based approaches, Eurocode
fire provisions also permit the use of advanced analysis for evaluating fire resistance of PPC
members. Application of these advanced analysis techniques require detailed thermal and
mechanical analysis with due consideration to realistic fire scenarios, actual load intensities, and
restraint conditions to evaluate fire resistance under performaced-based codes. Fire rating
provisions specified in US, Canadian, and European fire codes and standards are tabulated in
Table 2.4.
To illustrate the variation in US, Canadian, and Eurocode fire provisions, fire ratings were
evaluated for two PPC double T-beams (10DT24+2 and 12DT32+2). Ratings computed based
on tabulated data, simplified calculation, and heat transmission approaches are shown in Table
2.5. The detailed calculations for these results are in Appendix A. The tabulated fire ratings of
both beams yield 1½ hour as per US standards, while Canadian and Eurocode fire provisions
produce 1½ hour for 10DT24+2 and 2 hour rating for beam 12DT32+2. This variation in fire
ratings is mainly due to the consideration given to different factors in each code such as the use
of effective flange thickness in Canadian code and neglecting aggregate type in Eurocode.
Further deviations are observed in simplified calculation fire ratings, where Eurocode and
Canadian provisions result in a 1½ hour fire rating for both beams. However, the US fire
23
provisions produce 1½ and 2 hour fire ratings for beam 10DT24+2 and 12DT32+2, respectively.
The main reason for these differences in fire ratings is due to the load combinations utilized in
standard fire tests. In heat transmission criteria US and Canadian fire provisions yield 1 hour fire
rating for both beams, while the Eurocode provisions result in 1½ hour fire rating for both beams
and this is due to the lack of consideration for aggregate type in Eurocode. It should be noted
that all these provisions are based on the standard fire exposure without any consideration for
realistic fire, loading, and restraint scenarios.
2.3. High Temperature Material Properties
2.3.1. General
The fire resistance of PPC beams is dependent on the high temperature material properties of its
constituent materials, namely concrete, mild reinforcing steel and prestressing steel. The three
properties that influence fire response of structural members are thermal, mechanical, or
deformation properties. Thermal properties (specific heat, thermal conductivity, and density)
influence heat transfer characteristics, mechanical properties (compressive strength, yield
strength, and elastic modulus) affect strength and stiffness attributes, and deformation (thermal
elongation, creep, and transient strain) properties control the deflections of a material. In
addition to these inherent material properties, physical characteristics, such as fire-induced
concrete spalling or bond strength, also affect the fire resistance of PPC beams.
In today’s technology driven society it is common practice to utilize computer software to
predict the fire resistance of PPC beams. These software programs require high temperature
constitutive models as input for each unique material type included in the analysis. Generally,
these material relationships are developed based on an exhaustive number of high temperature
24
material tests. Two widely accepted sources for high temperature constitutive models are ASCE
Manual of Practice No. 78 (1992) and Eurocode 2 (2004). The following sections provide an
overview of these high temperature constitutive models for normal strength (conventional)
concrete, high strength prestressing steel, and mild reinforcing steel. To view the empirical
relationships for these constitutive models refer to Appendix A.1. In addition, the findings of
several studies used to establish similar material relationships are highlighted.
2.3.2. Concrete
High temperature material properties which influence the fire resistance of concrete are thermal,
mechanical, and deformation properties. Fire induced spalling is a physical characteristic which
also impacts the fire resistance of concrete.
2.3.2.1. Thermal Properties
Thermal properties which influence concrete temperatures are specific heat, thermal
conductivity, and density. Limited research (Saad et. al 1996, Kodur and Sultan 2003, Arioz
2007, Shin et. al 2007, Kodur et. al 2008, and Kodur and Harmaty 2008) has been performed to
quantify high temperature relationships for normal strength concrete due the difficulty associated
with measuring these properties under fire. In addition, the results of these studies reveal large
discrepancies due to differences in test methods, procedures, conditions, and measurement
techniques (Kodur et. al 2008). Despite these complications, ASCE (1992) and Eurocode (2004)
provide relationships for thermal properties of normal strength concrete.
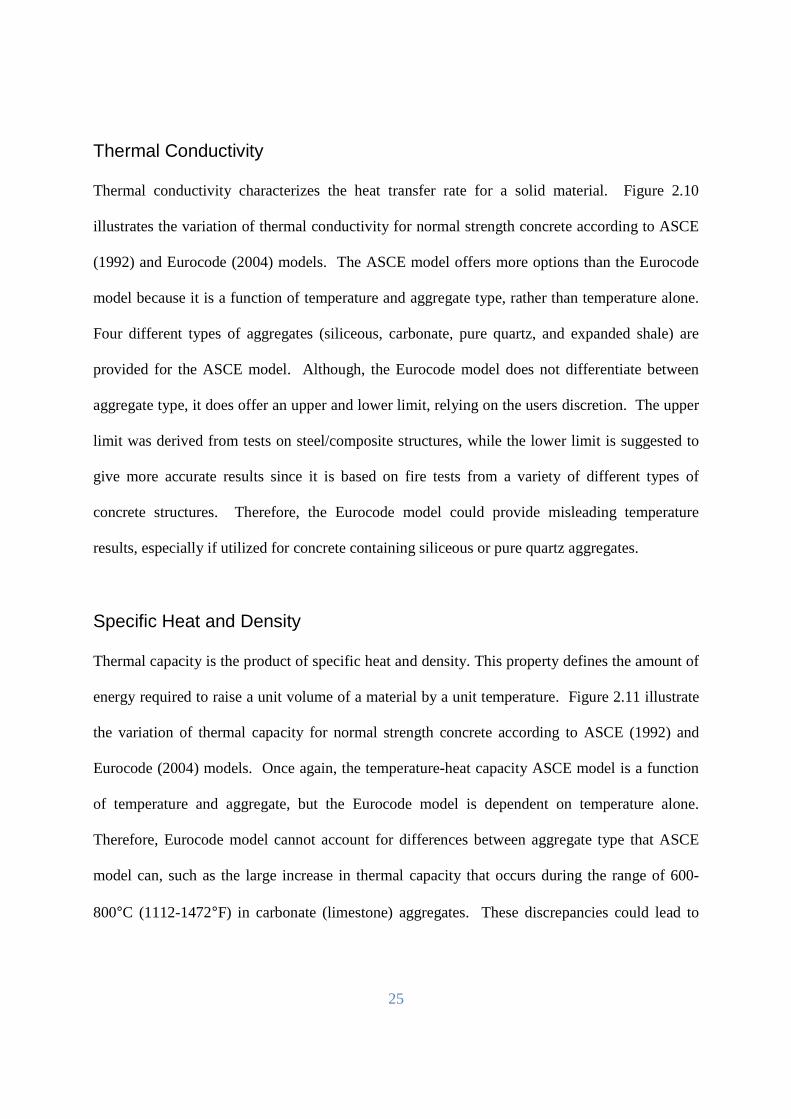
25
Thermal Conductivity
Thermal conductivity characterizes the heat transfer rate for a solid material. Figure 2.10
illustrates the variation of thermal conductivity for normal strength concrete according to ASCE
(1992) and Eurocode (2004) models. The ASCE model offers more options than the Eurocode
model because it is a function of temperature and aggregate type, rather than temperature alone.
Four different types of aggregates (siliceous, carbonate, pure quartz, and expanded shale) are
provided for the ASCE model. Although, the Eurocode model does not differentiate between
aggregate type, it does offer an upper and lower limit, relying on the users discretion. The upper
limit was derived from tests on steel/composite structures, while the lower limit is suggested to
give more accurate results since it is based on fire tests from a variety of different types of
concrete structures. Therefore, the Eurocode model could provide misleading temperature
results, especially if utilized for concrete containing siliceous or pure quartz aggregates.
Specific Heat and Density
Thermal capacity is the product of specific heat and density. This property defines the amount of
energy required to raise a unit volume of a material by a unit temperature. Figure 2.11 illustrate
the variation of thermal capacity for normal strength concrete according to ASCE (1992) and
Eurocode (2004) models. Once again, the temperature-heat capacity ASCE model is a function
of temperature and aggregate, but the Eurocode model is dependent on temperature alone.
Therefore, Eurocode model cannot account for differences between aggregate type that ASCE
model can, such as the large increase in thermal capacity that occurs during the range of 600-
800°C (1112-1472°F) in carbonate (limestone) aggregates. These discrepancies could lead to
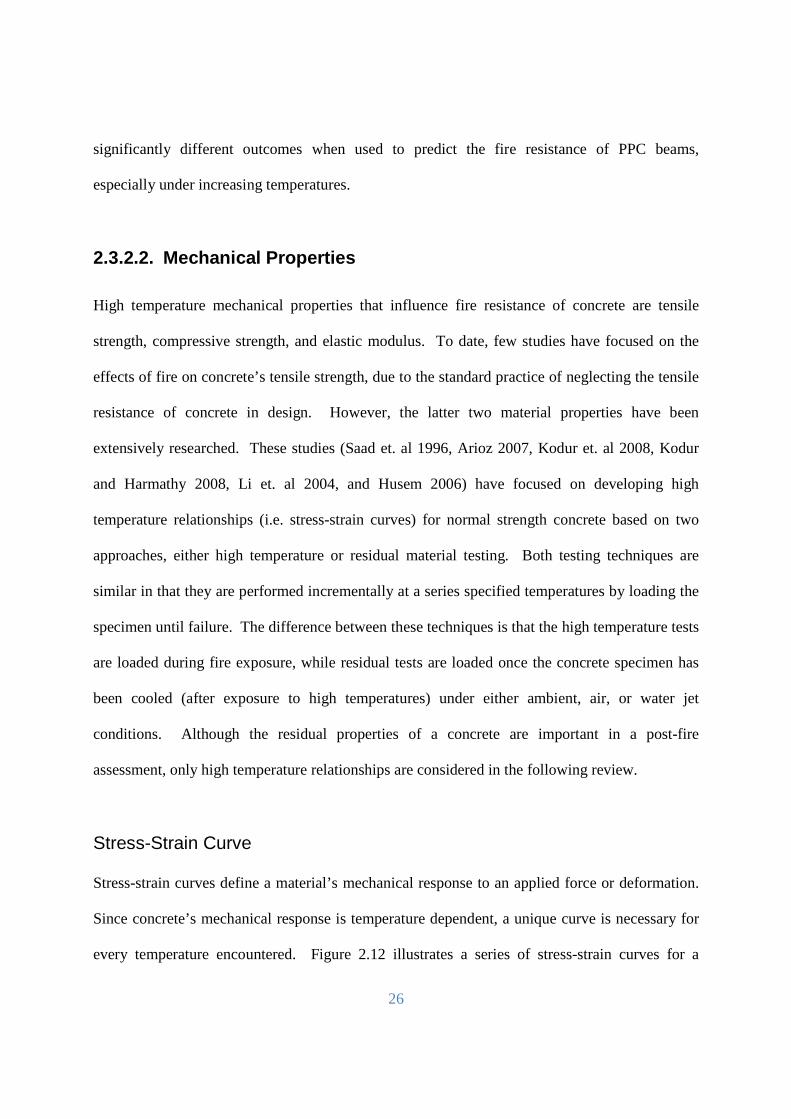
26
significantly different outcomes when used to predict the fire resistance of PPC beams,
especially under increasing temperatures.
2.3.2.2. Mechanical Properties
High temperature mechanical properties that influence fire resistance of concrete are tensile
strength, compressive strength, and elastic modulus. To date, few studies have focused on the
effects of fire on concrete’s tensile strength, due to the standard practice of neglecting the tensile
resistance of concrete in design. However, the latter two material properties have been
extensively researched. These studies (Saad et. al 1996, Arioz 2007, Kodur et. al 2008, Kodur
and Harmathy 2008, Li et. al 2004, and Husem 2006) have focused on developing high
temperature relationships (i.e. stress-strain curves) for normal strength concrete based on two
approaches, either high temperature or residual material testing. Both testing techniques are
similar in that they are performed incrementally at a series specified temperatures by loading the
specimen until failure. The difference between these techniques is that the high temperature tests
are loaded during fire exposure, while residual tests are loaded once the concrete specimen has
been cooled (after exposure to high temperatures) under either ambient, air, or water jet
conditions. Although the residual properties of a concrete are important in a post-fire
assessment, only high temperature relationships are considered in the following review.
Stress-Strain Curve
Stress-strain curves define a material’s mechanical response to an applied force or deformation.
Since concrete’s mechanical response is temperature dependent, a unique curve is necessary for
every temperature encountered. Figure 2.12 illustrates a series of stress-strain curves for a

27
normal weight concrete at various temperatures according to ASCE (1992) and Eurocode (2004).
The Eurocode model provides a curve for carbonate and siliceous aggregate types, while ASCE
model utilizes a single curve for siliceous, carbonate, and expanded shale aggregate types. Both
models initially behave similar, until the maximum stress is reached. Beyond this point, both
curves begin their descent, but the Eurocode model incorporates a linear trend, while the ASCE
model utilizes a nonlinear relationship that is much more prolonged. Although not illustrated in
the figure, the Eurocode model does offer a nonlinear option that is comparable its linear
alternative. The Eurocode model reveals that concrete members made of carbonate aggregates
possess a greater fire resistance than those made of siliceous aggregates. At lower temperatures
the ASCE model envelopes the Eurocode model, but as temperatures rise the ASCE model
eventually provides a lower fire resistance than the Eurocode model. These models are further
examined in the following discussion on elastic modulus and compressive strength.
Elastic Modulus
Elastic modulus describes how a solid material elastically deforms under stress. In solid
mechanics, it is defined mathematically as the initial slope of the stress-strain curve and can be
easily identified for each stress-strain curve in Figure 2.12. Figure 2.13 illustrates the variation
of elastic modulus of concrete with respect to temperature, according to ASCE (1992) and
Eurocode (2004) models. The ASCE model initially degrades at a slower rate than the Eurocode
model, until approximately 800°C (1472°F). The greatest difference between these models
occurs at temperatures below 300°C (572°F). The elastic modulus curves for the Eurocode
model further reinforces the fact that carbonate aggregate concrete provides better fire resistance
than siliceous aggregate concrete.
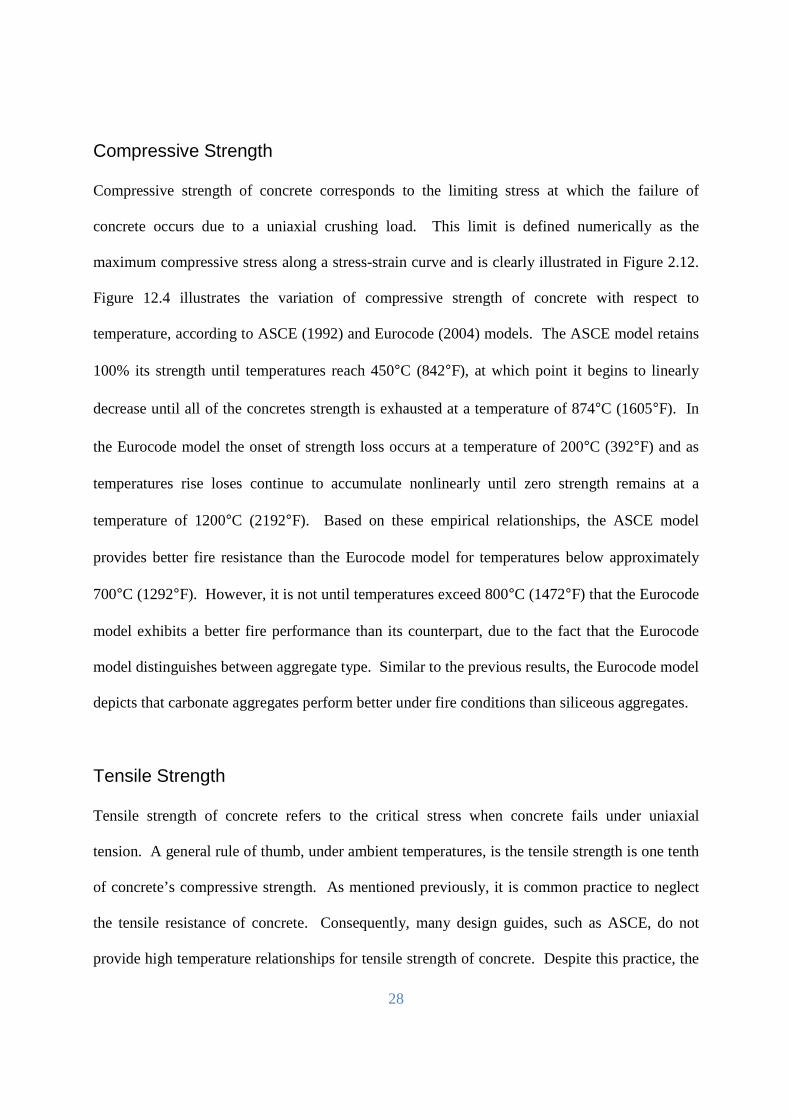
28
Compressive Strength
Compressive strength of concrete corresponds to the limiting stress at which the failure of
concrete occurs due to a uniaxial crushing load. This limit is defined numerically as the
maximum compressive stress along a stress-strain curve and is clearly illustrated in Figure 2.12.
Figure 12.4 illustrates the variation of compressive strength of concrete with respect to
temperature, according to ASCE (1992) and Eurocode (2004) models. The ASCE model retains
100% its strength until temperatures reach 450°C (842°F), at which point it begins to linearly
decrease until all of the concretes strength is exhausted at a temperature of 874°C (1605°F). In
the Eurocode model the onset of strength loss occurs at a temperature of 200°C (392°F) and as
temperatures rise loses continue to accumulate nonlinearly until zero strength remains at a
temperature of 1200°C (2192°F). Based on these empirical relationships, the ASCE model
provides better fire resistance than the Eurocode model for temperatures below approximately
700°C (1292°F). However, it is not until temperatures exceed 800°C (1472°F) that the Eurocode
model exhibits a better fire performance than its counterpart, due to the fact that the Eurocode
model distinguishes between aggregate type. Similar to the previous results, the Eurocode model
depicts that carbonate aggregates perform better under fire conditions than siliceous aggregates.
Tensile Strength
Tensile strength of concrete refers to the critical stress when concrete fails under uniaxial
tension. A general rule of thumb, under ambient temperatures, is the tensile strength is one tenth
of concrete’s compressive strength. As mentioned previously, it is common practice to neglect
the tensile resistance of concrete. Consequently, many design guides, such as ASCE, do not
provide high temperature relationships for tensile strength of concrete. Despite this practice, the
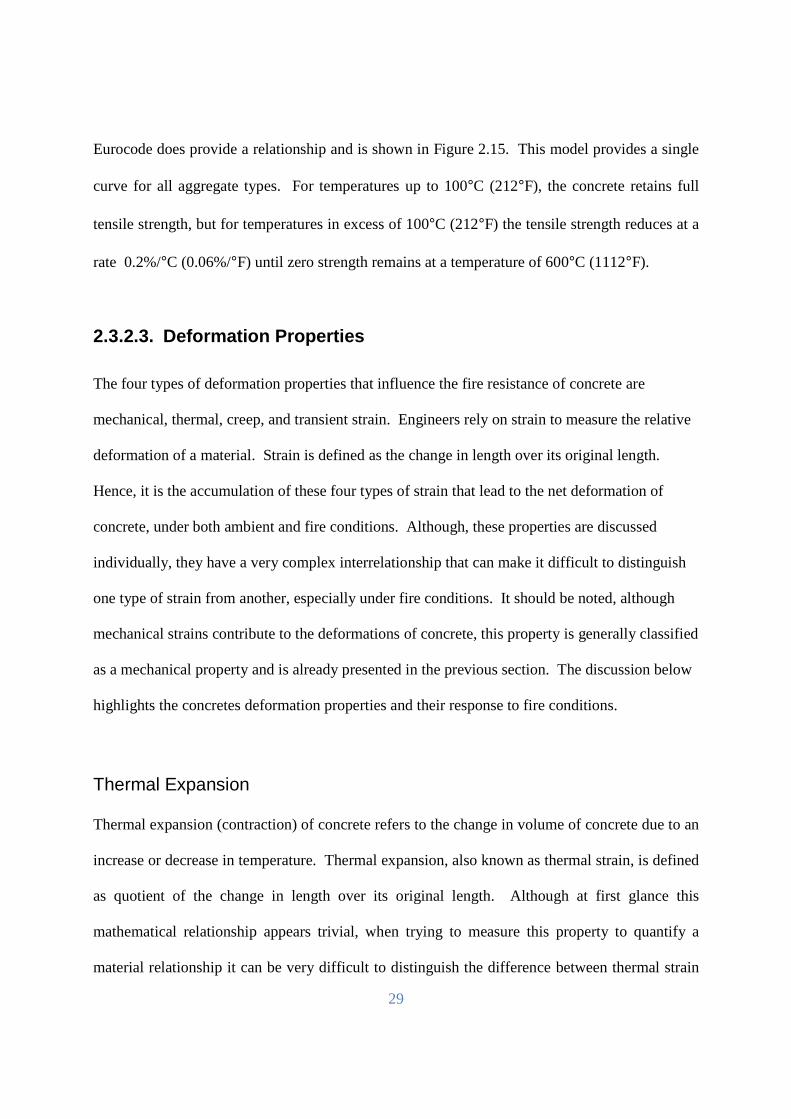
29
Eurocode does provide a relationship and is shown in Figure 2.15. This model provides a single
curve for all aggregate types. For temperatures up to 100°C (212°F), the concrete retains full
tensile strength, but for temperatures in excess of 100°C (212°F) the tensile strength reduces at a
rate 0.2%/°C (0.06%/°F) until zero strength remains at a temperature of 600°C (1112°F).
2.3.2.3. Deformation Properties
The four types of deformation properties that influence the fire resistance of concrete are
mechanical, thermal, creep, and transient strain. Engineers rely on strain to measure the relative
deformation of a material. Strain is defined as the change in length over its original length.
Hence, it is the accumulation of these four types of strain that lead to the net deformation of
concrete, under both ambient and fire conditions. Although, these properties are discussed
individually, they have a very complex interrelationship that can make it difficult to distinguish
one type of strain from another, especially under fire conditions. It should be noted, although
mechanical strains contribute to the deformations of concrete, this property is generally classified
as a mechanical property and is already presented in the previous section. The discussion below
highlights the concretes deformation properties and their response to fire conditions.
Thermal Expansion
Thermal expansion (contraction) of concrete refers to the change in volume of concrete due to an
increase or decrease in temperature. Thermal expansion, also known as thermal strain, is defined
as quotient of the change in length over its original length. Although at first glance this
mathematical relationship appears trivial, when trying to measure this property to quantify a
material relationship it can be very difficult to distinguish the difference between thermal strain
30
and shrinkage. Despite this fact, many researchers (Kodur and Sultan 2003, Naus 2005,
Harmathy 1967, Petterson 1965, Saito 1965, and Anderberg and Thelandersson 1976) have
conducted studies to develop high-temperature relationships for numerous concrete types. Most
of the studies relied on commercially available dilatometric equipment to measure the volume
changes, while other simply mounted radial and longitudinal strain gauges to a specimen and
place in a furnace. Several factors that have been identified to influence this parameter are
aggregate type, cement type, water/cement ratio, and moisture content.
Figure 2.16 illustrates variation of concrete thermal expansion as a function of temperature
according to ASCE (1992) and Eurocode (2004) models. These models reveal that with
increasing temperatures the thermal strain increase. The ASCE model provides a single curve
for all aggregate types and gradually increases as a function of temperature. The Eurocode
model provides two separate curves, one for carbonate aggregates and another for siliceous
aggregates. Both of these curves tend to increase at a faster rate until they plateau around 700 or
800°C (1292 or 1472°F), depending on the aggregate type. The Eurocode model reveals that
carbonate aggregates are much more sensitive to temperature than siliceous aggregates. Another,
interesting feature of this model is that for high temperatures, thermal expansion no longer
increases with temperature for neither type of concrete.
Creep Strain
Creep refers to the time-dependent plastic deformations of a material. More specifically, creep is
when a material deforms permanently from a stress that is less than its yield point. Under
ambient conditions, this type of deformations occurs very slowly, over a long period of time, and
as a result of high stress levels. However, in the presence of fire, it only takes moderate stress

31
levels to rapidly generate large creep strains in concrete. One reason for this behavior is that
high temperature creep in concrete is caused by the migration of water within its microstructure
and upon heating this movement of moisture is accelerated. Another reason is that with
increasing temperatures, materials degrade and lend themselves to be more susceptible to the
effects of creep. High temperature creep influences the fire resistance of concrete, because it can
lead to large defections, a redistribution of stresses, and/or relieve unwanted tensile stresses.
Literature reveals that the main factors influencing high temperature creep in concrete are
composition, load duration and intensity, temperature and exposure time. The composition, such
as aggregate type, mix proportions and type of cement, have been found to influence the creep of
concrete at high temperatures. As for the remaining factors, creep has proven to increase with
larger loads applied for longer durations, as well as under higher temperatures for longer
exposure times. Despite these findings, limited research has been undertaken to develop
practical high temperature creep curves due to its complexity. This lack of data is one reason
why the effects of high temperature creep are not generally explicitly included in manual or
computer-based fire resistance calculations. However, part of high temperature creep is still
accounted for in fire resistance calculations implicitly through the use of stress-strain curves
which have built-in allowances for typical amounts of creep strain encountered in fire tests of
concrete members.
Transient Strain
Transient strain is an irrecoverable strain that develops the very first time, and only the first time
when loaded concrete is exposed to elevated temperatures. This type of strain is very complex, it
accounts for deformations resulting from concretes’ chemical decomposition and thermal
32
instability under fire conditions. Two examples of the type of chemical decomposition that
occur in concrete is the breakdown of hydration products in the cement paste and phase changes
that aggregates undergo. Whereas, the thermal instabilities in concrete are caused by a variance
in the thermal expansion of aggregates and cement paste. The combined effects of the
deterioration and varying thermal expansion induce stress-concentrations that lead to micro-
cracking and deformations. This behavior provides a degree of relaxation and is one reason why
concrete does not degrade completely when heated.
Research (Gernay & Franssen 2011, Anderberg and Thelandersson 1976, Fletcher, et. al. 2007,
Bastami and Aslani 2010) to study the behavior of transient strain in different types of concrete
has been limited. One of the reasons for this is that there is no direct test procedure to measure
transient strain. In fact, commonly, transient and creep strain are measured together by
measuring the total strain and deducting both mechanical and free thermal strain. This lumped
measurement is often called, transient creep strain. Although neither the ASCE (1992), nor the
Eurocode (2004) models provide a direct relationship for transient strain or transient creep strain.
As mentioned previously, these effects are included implicitly by providing an allowance for
such behavior in the stress-strain relationships. This approach has been argued by some
Anderberg and Thelandersson 1976) to have implications on the elastic modulus of concrete.
2.3.2.4. Physical Properties
The primary physical property that influences the fire resistance of concrete is fire-induced
spalling. Fire-induced spalling refers to the act of large and/or small pieces or layers of concrete
breaking off during a fire as a result of temperature effects. Of the four types of spalling
(explosive, surface, aggregate, and corner), explosive spalling has the potential to be the most
33
damaging, because it occurs suddenly in a violent fashion and results in large voids of missing
concrete. One of the consequences of fire-induced spalling is that it directly exposes the steel
reinforcement to the deleterious effects of fire, causing a rapid decay in strength and stiffness. In
addition, the missing concrete also contributes to a reduction in stiffness and load bearing
capacity. Fire-induced spalling can also trigger bond loss between the concrete and
reinforcement. All of these effects can be detrimental on the fire resistance of concrete.
A review of literature (Khoury and Anderberg (2000), Husem (2006), Fletcher et. al. (2007),
Naus (2005), Jansson (2008), and Kodur and Dwaikat (2008)) reveals that numerous studies
have been undertaken to study fire-induced spalling. These studies indicate the factors that
influence fire-induced spalling are heat rate, heating profile, section size, section shape, moisture
content, pore pressure, permeability, age of concrete, concrete strength, restraint, type of
aggregate, aggregate size, cracking, reinforcement, concrete cover, supplementary reinforcement,
steel fibers, polypropylene fibers, and air-entrainment. Despite these findings, fire-induced
spalling is still quite unpredictable. This is in part due to the complexity associated with the
phenomenon and also to lack of high temperature material properties and calculation
methodologies. Therefore, neither the ASCE (1992), nor the Eurocode (2004) models provide a
high-temperature relationship to predict the fire-induced spalling.
2.3.3. Prestressing and Mild Reinforcing Steel
Similar to concrete, the high temperature material properties which influence the fire resistance
of steel reinforcement are thermal, mechanical, and deformation properties. At any temperature,
the material properties of steel reinforcement are greatly influenced by composition, forging
procedure, and heat treatment employed during creation. In the following sections, two types of
34
steel reinforcement are presented, prestressing steel and mild reinforcing steel. Prestressing steel
is produced by cold working the steel, while reinforcing steel is formed through a hot-rolling
process. As a result of the different techniques used to manufacture these products, their
behavior and response to high temperature varies. To compare and contrast these differences,
the material properties for both types of steel reinforcement are presented simultaneously in the
following sections.
2.3.3.1. Thermal Properties
Thermal conductivity and specific heat are thermal properties that influence heat distribution and
temperature rise in reinforcing and prestressing steel. A number of studies (Yafei et. al 2009,
Kodur and Harmathy 2008, Harmathy 1988) have been undertaken to study the behavior of these
material properties under fire conditions. These studies reveal at ambient temperatures, thermal
properties are influenced by metallurgical composition, type of reinforcement, and temperature,
but under fire conditions, temperature is the only variable which has a significant influence. At
any temperature, all types of steel possess a relatively high thermal conductivity and low specific
heat compared to other construction materials. Despite the minor variation in thermal properties
due to temperature, the thermal response of the both types of steel reinforcement lead to rapid
temperature rise and uniform distribution of heat. In the case of PPC members, this temperature
rise in the steel reinforcement is further exemplified by the slender cross-sections. Therefore,
when predicting the fire resistance of PPC members the thermal properties of reinforcing steel or
prestressing steel are ignored and idealized as a perfect conductor. In essence, the temperature of
the steel reinforcement is equivalent to the surrounding concrete. Based on this assumption,
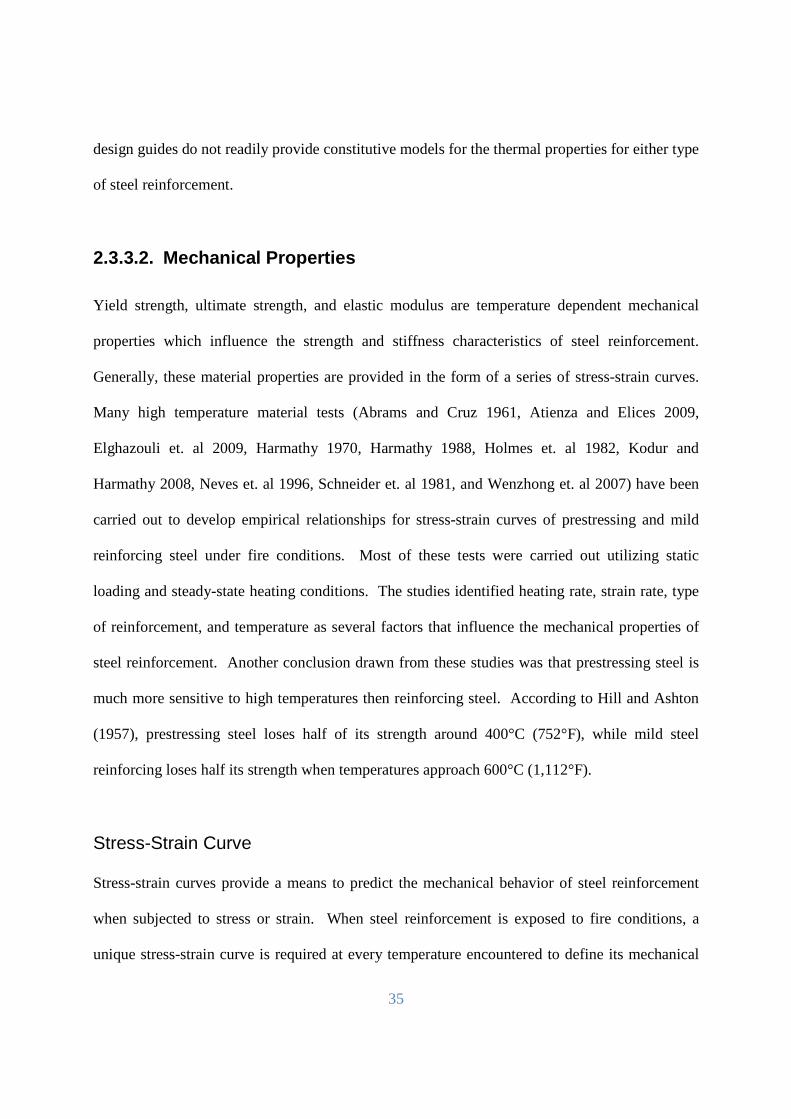
35
design guides do not readily provide constitutive models for the thermal properties for either type
of steel reinforcement.
2.3.3.2. Mechanical Properties
Yield strength, ultimate strength, and elastic modulus are temperature dependent mechanical
properties which influence the strength and stiffness characteristics of steel reinforcement.
Generally, these material properties are provided in the form of a series of stress-strain curves.
Many high temperature material tests (Abrams and Cruz 1961, Atienza and Elices 2009,
Elghazouli et. al 2009, Harmathy 1970, Harmathy 1988, Holmes et. al 1982, Kodur and
Harmathy 2008, Neves et. al 1996, Schneider et. al 1981, and Wenzhong et. al 2007) have been
carried out to develop empirical relationships for stress-strain curves of prestressing and mild
reinforcing steel under fire conditions. Most of these tests were carried out utilizing static
loading and steady-state heating conditions. The studies identified heating rate, strain rate, type
of reinforcement, and temperature as several factors that influence the mechanical properties of
steel reinforcement. Another conclusion drawn from these studies was that prestressing steel is
much more sensitive to high temperatures then reinforcing steel. According to Hill and Ashton
(1957), prestressing steel loses half of its strength around 400°C (752°F), while mild steel
reinforcing loses half its strength when temperatures approach 600°C (1,112°F).
Stress-Strain Curve
Stress-strain curves provide a means to predict the mechanical behavior of steel reinforcement
when subjected to stress or strain. When steel reinforcement is exposed to fire conditions, a
unique stress-strain curve is required at every temperature encountered to define its mechanical
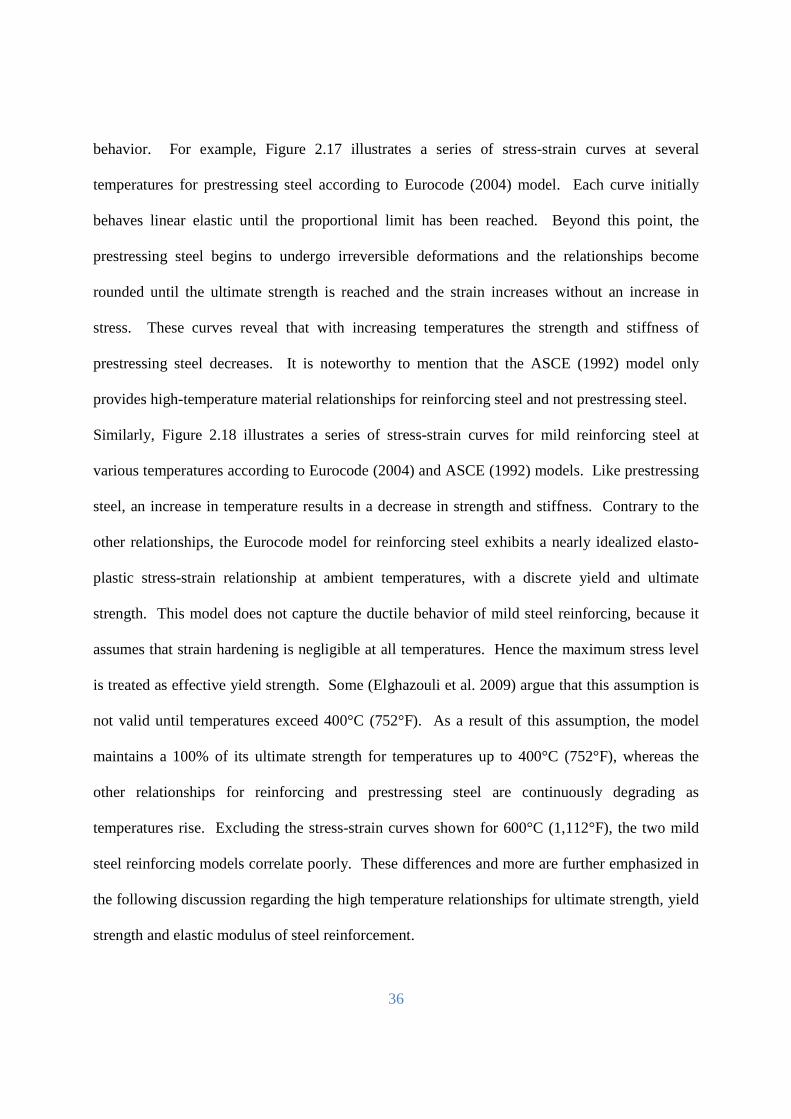
36
behavior. For example, Figure 2.17 illustrates a series of stress-strain curves at several
temperatures for prestressing steel according to Eurocode (2004) model. Each curve initially
behaves linear elastic until the proportional limit has been reached. Beyond this point, the
prestressing steel begins to undergo irreversible deformations and the relationships become
rounded until the ultimate strength is reached and the strain increases without an increase in
stress. These curves reveal that with increasing temperatures the strength and stiffness of
prestressing steel decreases. It is noteworthy to mention that the ASCE (1992) model only
provides high-temperature material relationships for reinforcing steel and not prestressing steel.
Similarly, Figure 2.18 illustrates a series of stress-strain curves for mild reinforcing steel at
various temperatures according to Eurocode (2004) and ASCE (1992) models. Like prestressing
steel, an increase in temperature results in a decrease in strength and stiffness. Contrary to the
other relationships, the Eurocode model for reinforcing steel exhibits a nearly idealized elasto-
plastic stress-strain relationship at ambient temperatures, with a discrete yield and ultimate
strength. This model does not capture the ductile behavior of mild steel reinforcing, because it
assumes that strain hardening is negligible at all temperatures. Hence the maximum stress level
is treated as effective yield strength. Some (Elghazouli et al. 2009) argue that this assumption is
not valid until temperatures exceed 400°C (752°F). As a result of this assumption, the model
maintains a 100% of its ultimate strength for temperatures up to 400°C (752°F), whereas the
other relationships for reinforcing and prestressing steel are continuously degrading as
temperatures rise. Excluding the stress-strain curves shown for 600°C (1,112°F), the two mild
steel reinforcing models correlate poorly. These differences and more are further emphasized in
the following discussion regarding the high temperature relationships for ultimate strength, yield
strength and elastic modulus of steel reinforcement.
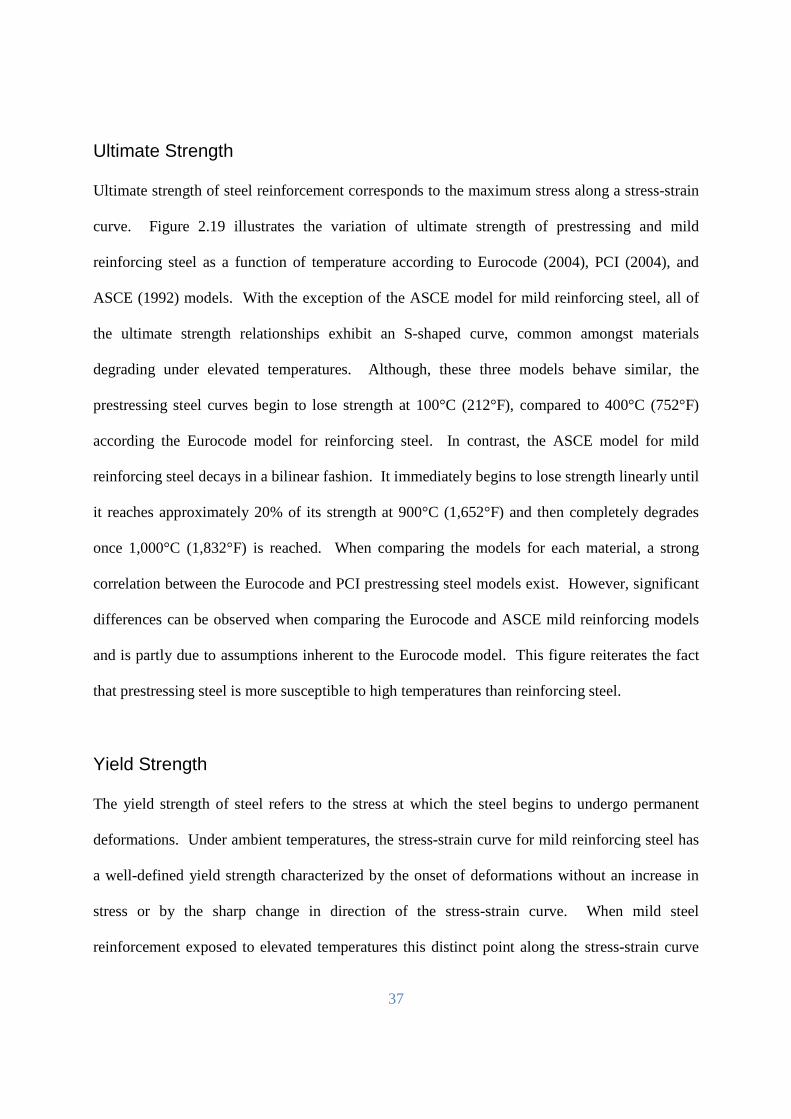
37
Ultimate Strength
Ultimate strength of steel reinforcement corresponds to the maximum stress along a stress-strain
curve. Figure 2.19 illustrates the variation of ultimate strength of prestressing and mild
reinforcing steel as a function of temperature according to Eurocode (2004), PCI (2004), and
ASCE (1992) models. With the exception of the ASCE model for mild reinforcing steel, all of
the ultimate strength relationships exhibit an S-shaped curve, common amongst materials
degrading under elevated temperatures. Although, these three models behave similar, the
prestressing steel curves begin to lose strength at 100°C (212°F), compared to 400°C (752°F)
according the Eurocode model for reinforcing steel. In contrast, the ASCE model for mild
reinforcing steel decays in a bilinear fashion. It immediately begins to lose strength linearly until
it reaches approximately 20% of its strength at 900°C (1,652°F) and then completely degrades
once 1,000°C (1,832°F) is reached. When comparing the models for each material, a strong
correlation between the Eurocode and PCI prestressing steel models exist. However, significant
differences can be observed when comparing the Eurocode and ASCE mild reinforcing models
and is partly due to assumptions inherent to the Eurocode model. This figure reiterates the fact
that prestressing steel is more susceptible to high temperatures than reinforcing steel.
Yield Strength
The yield strength of steel refers to the stress at which the steel begins to undergo permanent
deformations. Under ambient temperatures, the stress-strain curve for mild reinforcing steel has
a well-defined yield strength characterized by the onset of deformations without an increase in
stress or by the sharp change in direction of the stress-strain curve. When mild steel
reinforcement exposed to elevated temperatures this distinct point along the stress-strain curve
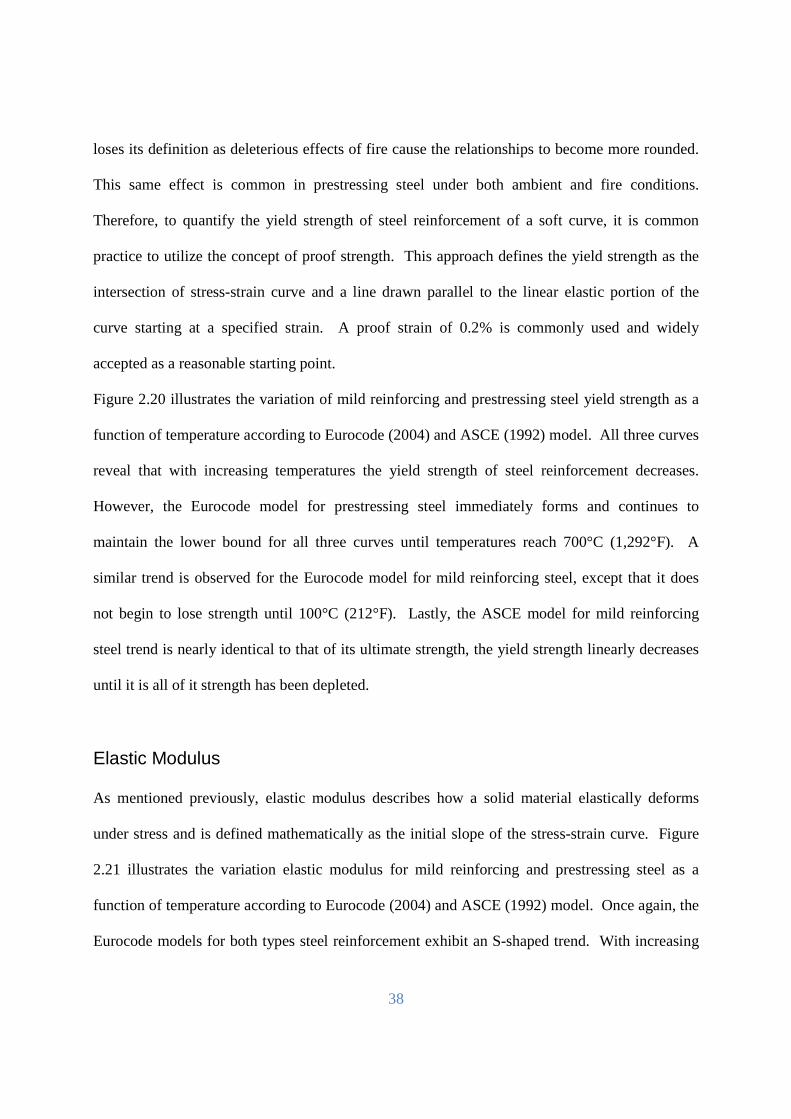
38
loses its definition as deleterious effects of fire cause the relationships to become more rounded.
This same effect is common in prestressing steel under both ambient and fire conditions.
Therefore, to quantify the yield strength of steel reinforcement of a soft curve, it is common
practice to utilize the concept of proof strength. This approach defines the yield strength as the
intersection of stress-strain curve and a line drawn parallel to the linear elastic portion of the
curve starting at a specified strain. A proof strain of 0.2% is commonly used and widely
accepted as a reasonable starting point.
Figure 2.20 illustrates the variation of mild reinforcing and prestressing steel yield strength as a
function of temperature according to Eurocode (2004) and ASCE (1992) model. All three curves
reveal that with increasing temperatures the yield strength of steel reinforcement decreases.
However, the Eurocode model for prestressing steel immediately forms and continues to
maintain the lower bound for all three curves until temperatures reach 700°C (1,292°F). A
similar trend is observed for the Eurocode model for mild reinforcing steel, except that it does
not begin to lose strength until 100°C (212°F). Lastly, the ASCE model for mild reinforcing
steel trend is nearly identical to that of its ultimate strength, the yield strength linearly decreases
until it is all of it strength has been depleted.
Elastic Modulus
As mentioned previously, elastic modulus describes how a solid material elastically deforms
under stress and is defined mathematically as the initial slope of the stress-strain curve. Figure
2.21 illustrates the variation elastic modulus for mild reinforcing and prestressing steel as a
function of temperature according to Eurocode (2004) and ASCE (1992) model. Once again, the
Eurocode models for both types steel reinforcement exhibit an S-shaped trend. With increasing
39
temperatures, the two relationships crisscross several times until temperatures reach 700°C
(1,292°F) when they begin coincide as temperatures continue to rise. In contrast, the ASCE
model for mild reinforcing steel illustrates a steady reduction in stiffness from ambient
temperatures until temperatures reach 1,000°C (1,832°F). When compared the Eurocode
models, the ASCE model also exhibits greater relative losses in stiffness until temperatures reach
600°C (1,112°F).
2.3.3.3. Deformation Properties
The three types of deformation properties that influence the fire resistance of steel reinforcement
are mechanical, thermal, and creep strain. As mentioned previously, strain is used to measure
the relative deformation of a material and is defined as the change in length divided by its
original length. Therefore, the net deformation or strain of steel reinforcement is the summation
of these three types of strain. Although, these properties are discussed individually, they have a
very complex interrelationship that can make it difficult to distinguish one type of strain from
another, especially under fire conditions. The mechanical strains contribute to the deformations
of steel reinforcement, but this property is generally classified as a mechanical property and is
presented as one in the previous section. The discussion below highlights the deformation
properties and their response to fire conditions for prestressing and mild reinforcing steel
reinforcement.
Thermal Expansion
The thermal strain of mild steel reinforcement is characterized by the deformation property
known as thermal expansion. Thermal expansion (contraction) of steel reinforcement refers to
40
the change in volume of steel due to an increase or decrease in temperature. Many studies
(Schneider et. al 1981, Elghazouli et al. 2009, Anderberg 1986, and Harmathy 1988) have been
undertaken to establish high temperature relationships for both mild reinforcing and prestressing
steel. Generally, these high temperature material relationships were on developed based
unloaded specimens and under transient heating regimes. The test results revealed only minor
differences between minor reinforcing and prestressing steel. Types of steel and strength have
no bearing on the thermal expansion of either type of steel reinforcement.
Figure 2.22 illustrates the variation of mild reinforcing and prestressing steel thermal expansion
as a function of temperature according to the ASCE (1992) and Eurocode (2004). In general, all
three relationships primarily exhibit a linear increase in thermal strain with increasing
temperatures. Furthermore, the two curves for reinforcing steel also tend to produce higher
strains than that of the prestressing steel. One variation between these relationship occurs
between the temperatures of 800°C (1,472°F) and 860°C (1,580°F) when the Eurocode
reinforcing steel strains flatten and maintain a constant value until temperatures exceed this
range. This sudden change in behavior is a result of an austenitic transformation of steel, where
the crystalline structure of steel transforms from ferrite into austenite. This transformation
requires large amounts of energy and consequently has a direct influence on the materials’
physical properties of steel. Despite this minor inconsistency, all three curves correlate well.
Furthermore, these curves prove to be representative of how well the different studies correlated
amongst one another, hence the reason why design guides commonly prescribe a constant value
of 14x10-6
/°C for the coefficient of thermal expansion.
41
Creep Strain
Creep strain in steel reinforcement refers to the irrecoverable strains that result from high stress
levels sustained over long periods of time and/or from exposure to high temperatures. Typically,
high temperature creep does not influence the fire resistance of prestressing steel until
temperatures exceed approximately 250°C (482°F) (Anderberg, 2008), while in reinforcing steel
the effects of creep do not come into play until temperatures are around 400°C (752°F) to 500°C
(932°F) (Elghazouli et. al, 2009). Creep is characterized by three distinct phases: a primary,
secondary, and tertiary phase. In the primary phase, the creep strain increases parabolically at
decreasing rate with respect to time and temperature. Next, the secondary phase exhibits
constant rate of increase in strain over time and temperature. Lastly, the tertiary phase leads to
an accelerated increase in strain until rupture, better known as runaway strain. According to Leir
(1993), it is not essential to capture the tertiary phase of creep strain in steel reinforcement
because creep strains in the later part of the secondary phase produce a structural response that is
deemed unacceptable.
Numerous studies (Williams-Leir 1983, Harmathy and Stanzak 1970, Harmathy 1988, Dwaikat
and Kodur 2008) have been undertaken to develop to high temperature material relationships for
creep strains in prestressing and reinforcing steel. These relationships are based on a variety of
factors, such as stress, temperature, activation energy, and duration of stress. Historically,
Harmathy’s model based on Dorn’s (1955) creep theory has been the most widely accepted
approach for predicting high temperature creep. Despite its acceptance, it has several drawbacks.
For example, it assumes constant stress, which does not hold true for restrained members. Also,
it is based on the assumption that the material remains physiochemically stable, but between the
temperatures of 371°C (700°F) and 704°C (1,300°F) carbon steel begins to soften and the
42
assumption is no longer valid. In lieu of these arduous relationships, code-based equations avoid
the complexities associated with predicting creep strain in fire resistance calculations by
implicitly including through the stress-strain relationships based on strength and stiffness as a
function of temperature.
2.3.3.4. Physical Properties
Bond strength is a physical property of steel reinforcement that is based on the adhesion and
friction developed between steel reinforcement and concrete. The characteristics of steel
reinforcement that influence these mechanisms are reinforcement type (smooth bars, ribbed,
strands, and tendons), diameter, coating (none or epoxy), size and spacing of ribs, and whether
the reinforcement is in compression or tension. In concrete, it is the proportions and ingredients
included in the concrete mix design (cement type, admixtures, and water-cement ratios), as well
as shrinkage when present, that impact bond strength. In addition to these factors, under fire
conditions, fire-induced spalling of the concrete immediately in the vicinity of steel
reinforcement can cause the bond to degrade rapidly or can result in complete bond loss. In the
event of bond loss, the steel reinforcement slips, leading to an increase in concrete stress and
reduction in capacity and often pursued by structural failure.
The bond strength of mild reinforcing and prestressing steel under ambient temperatures is well
studied, but under elevated temperature research has been limited. In a literature review
developed by Naus (2005) the findings of a small collection of studies reveal that the bond
strength of steel reinforcement decreases with increasing temperatures, but significant losses are
not sustained until temperatures exceed 400°C (752°F). Also, prestressing steel provides better
bond strength at higher temperatures than mild reinforcing steel. Furthermore, when comparing
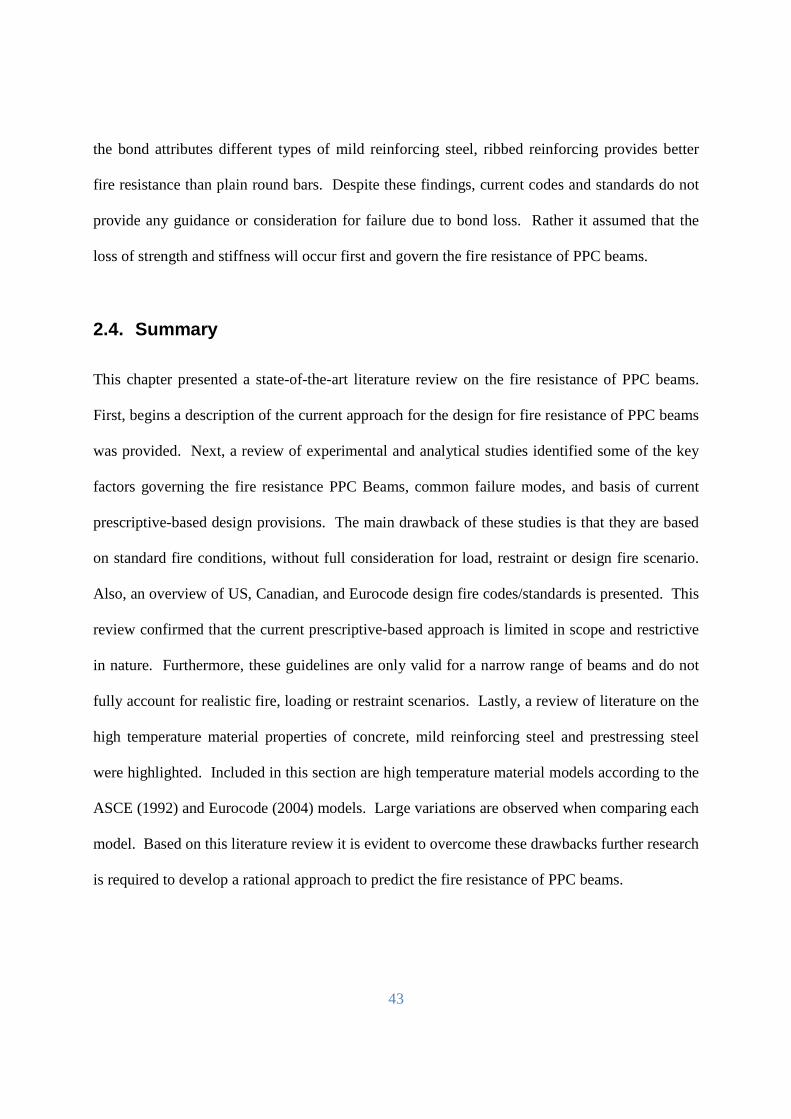
43
the bond attributes different types of mild reinforcing steel, ribbed reinforcing provides better
fire resistance than plain round bars. Despite these findings, current codes and standards do not
provide any guidance or consideration for failure due to bond loss. Rather it assumed that the
loss of strength and stiffness will occur first and govern the fire resistance of PPC beams.
2.4. Summary
This chapter presented a state-of-the-art literature review on the fire resistance of PPC beams.
First, begins a description of the current approach for the design for fire resistance of PPC beams
was provided. Next, a review of experimental and analytical studies identified some of the key
factors governing the fire resistance PPC Beams, common failure modes, and basis of current
prescriptive-based design provisions. The main drawback of these studies is that they are based
on standard fire conditions, without full consideration for load, restraint or design fire scenario.
Also, an overview of US, Canadian, and Eurocode design fire codes/standards is presented. This
review confirmed that the current prescriptive-based approach is limited in scope and restrictive
in nature. Furthermore, these guidelines are only valid for a narrow range of beams and do not
fully account for realistic fire, loading or restraint scenarios. Lastly, a review of literature on the
high temperature material properties of concrete, mild reinforcing steel and prestressing steel
were highlighted. Included in this section are high temperature material models according to the
ASCE (1992) and Eurocode (2004) models. Large variations are observed when comparing each
model. Based on this literature review it is evident to overcome these drawbacks further research
is required to develop a rational approach to predict the fire resistance of PPC beams.
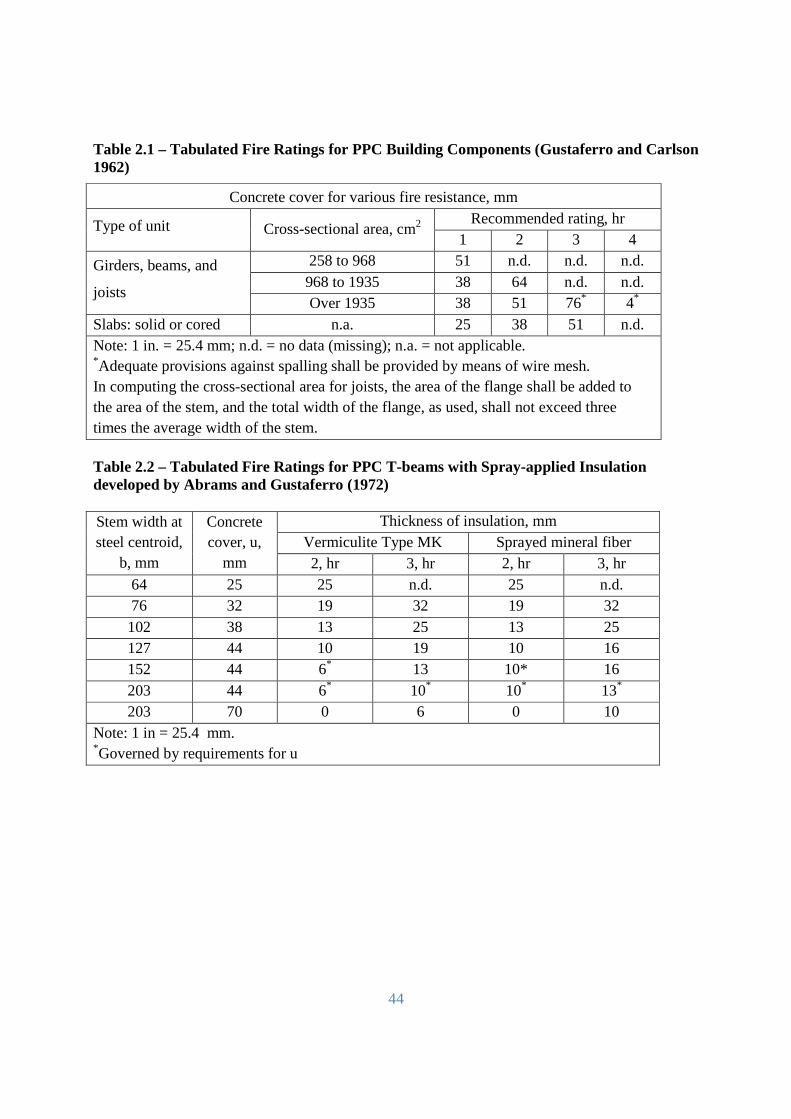
44
Table 2.1 – Tabulated Fire Ratings for PPC Building Components (Gustaferro and Carlson 1962)
Concrete cover for various fire resistance, mm
Type of unit Cross-sectional area, cm2 Recommended rating, hr
1 2 3 4
Girders, beams, and
joists
258 to 968 51 n.d. n.d. n.d. 968 to 1935 38 64 n.d. n.d. Over 1935 38 51 76* 4*
Slabs: solid or cored n.a. 25 38 51 n.d. Note: 1 in. = 25.4 mm; n.d. = no data (missing); n.a. = not applicable.
*Adequate provisions against spalling shall be provided by means of wire mesh. In computing the cross-sectional area for joists, the area of the flange shall be added to the area of the stem, and the total width of the flange, as used, shall not exceed three times the average width of the stem. Table 2.2 – Tabulated Fire Ratings for PPC T-beams with Spray-applied Insulation developed by Abrams and Gustaferro (1972) Stem width at steel centroid,
b, mm
Concrete cover, u,
mm
Thickness of insulation, mm Vermiculite Type MK Sprayed mineral fiber 2, hr 3, hr 2, hr 3, hr
64 25 25 n.d. 25 n.d. 76 32 19 32 19 32 102 38 13 25 13 25 127 44 10 19 10 16 152 44 6* 13 10* 16 203 44 6* 10* 10* 13* 203 70 0 6 0 10
Note: 1 in = 25.4 mm. *Governed by requirements for u
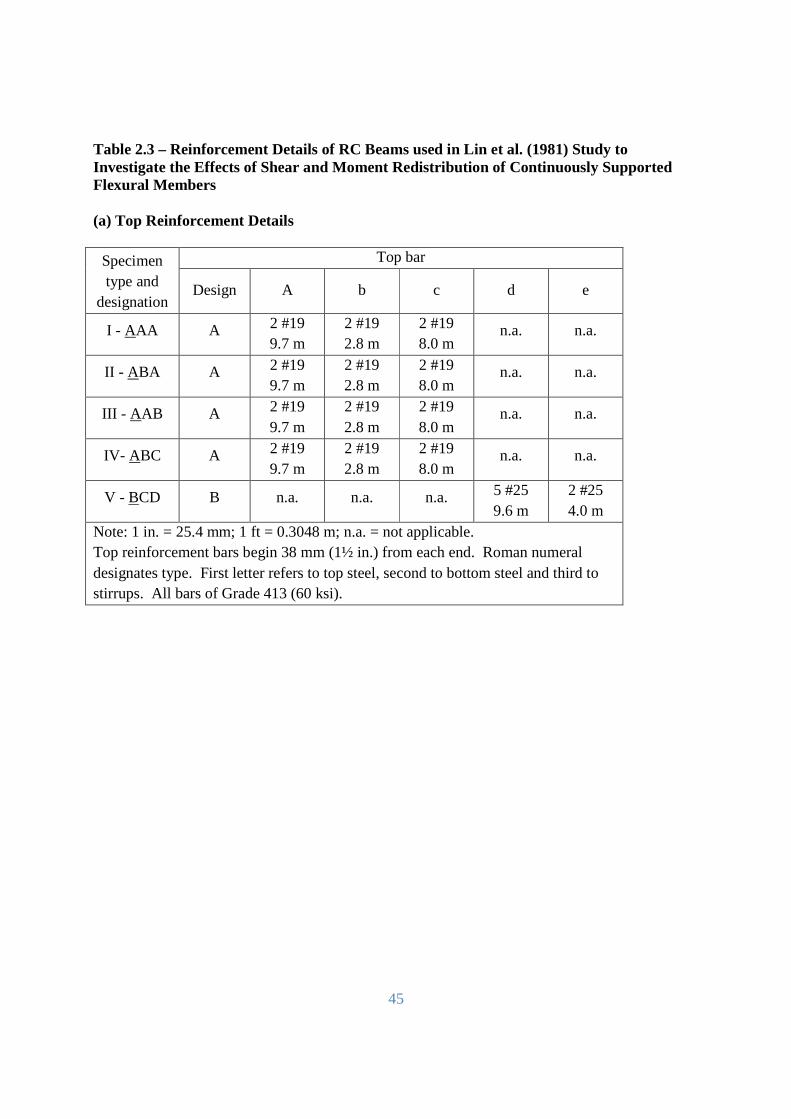
45
Table 2.3 – Reinforcement Details of RC Beams used in Lin et al. (1981) Study to Investigate the Effects of Shear and Moment Redistribution of Continuously Supported Flexural Members (a) Top Reinforcement Details
Specimen type and
designation
Top bar
Design A b c d e
I - AAA A 2 #19 9.7 m
2 #19 2.8 m
2 #19 8.0 m
n.a. n.a.
II - ABA A 2 #19 9.7 m
2 #19 2.8 m
2 #19 8.0 m
n.a. n.a.
III - A AB A 2 #19 9.7 m
2 #19 2.8 m
2 #19 8.0 m
n.a. n.a.
IV- ABC A 2 #19 9.7 m
2 #19 2.8 m
2 #19 8.0 m
n.a. n.a.
V - BCD B n.a. n.a. n.a. 5 #25 9.6 m
2 #25 4.0 m
Note: 1 in. = 25.4 mm; 1 ft = 0.3048 m; n.a. = not applicable. Top reinforcement bars begin 38 mm (1½ in.) from each end. Roman numeral designates type. First letter refers to top steel, second to bottom steel and third to stirrups. All bars of Grade 413 (60 ksi).
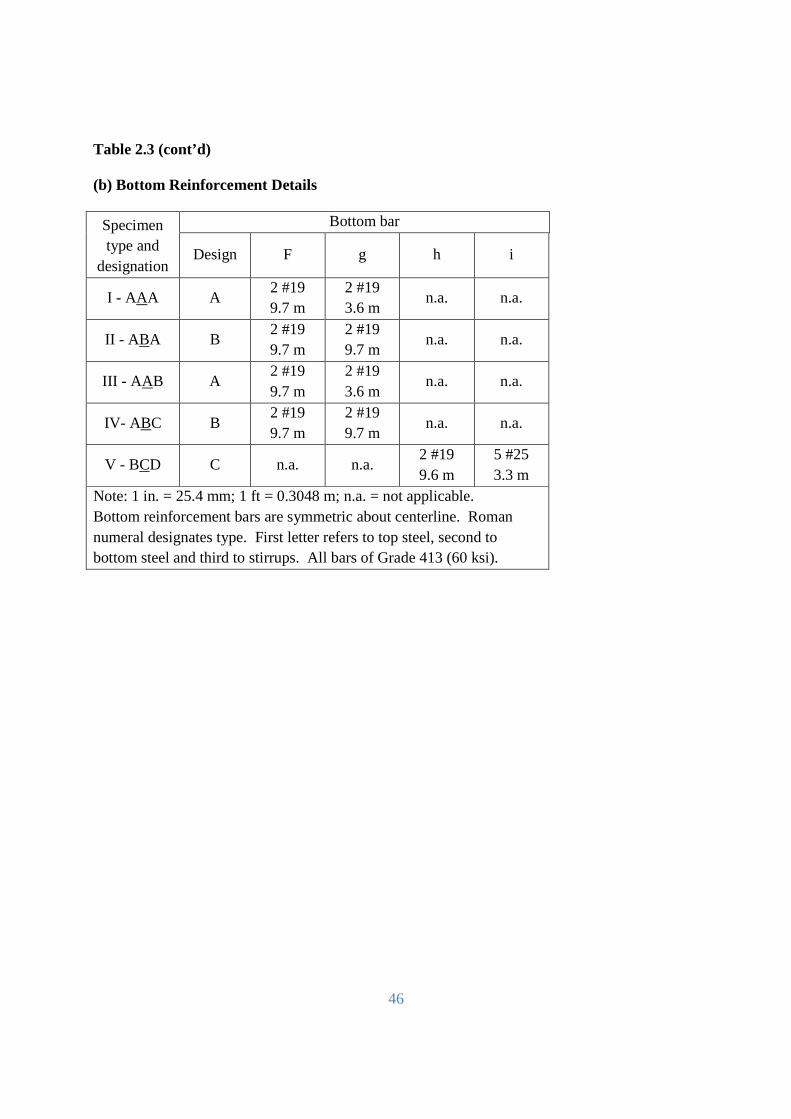
46
Table 2.3 (cont’d) (b) Bottom Reinforcement Details
Specimen type and
designation
Bottom bar
Design F g h i
I - AAA A 2 #19 9.7 m
2 #19 3.6 m
n.a. n.a.
II - ABA B 2 #19 9.7 m
2 #19 9.7 m
n.a. n.a.
III - AA B A 2 #19 9.7 m
2 #19 3.6 m
n.a. n.a.
IV- ABC B 2 #19 9.7 m
2 #19 9.7 m
n.a. n.a.
V - BCD C n.a. n.a. 2 #19 9.6 m
5 #25 3.3 m
Note: 1 in. = 25.4 mm; 1 ft = 0.3048 m; n.a. = not applicable. Bottom reinforcement bars are symmetric about centerline. Roman numeral designates type. First letter refers to top steel, second to bottom steel and third to stirrups. All bars of Grade 413 (60 ksi).
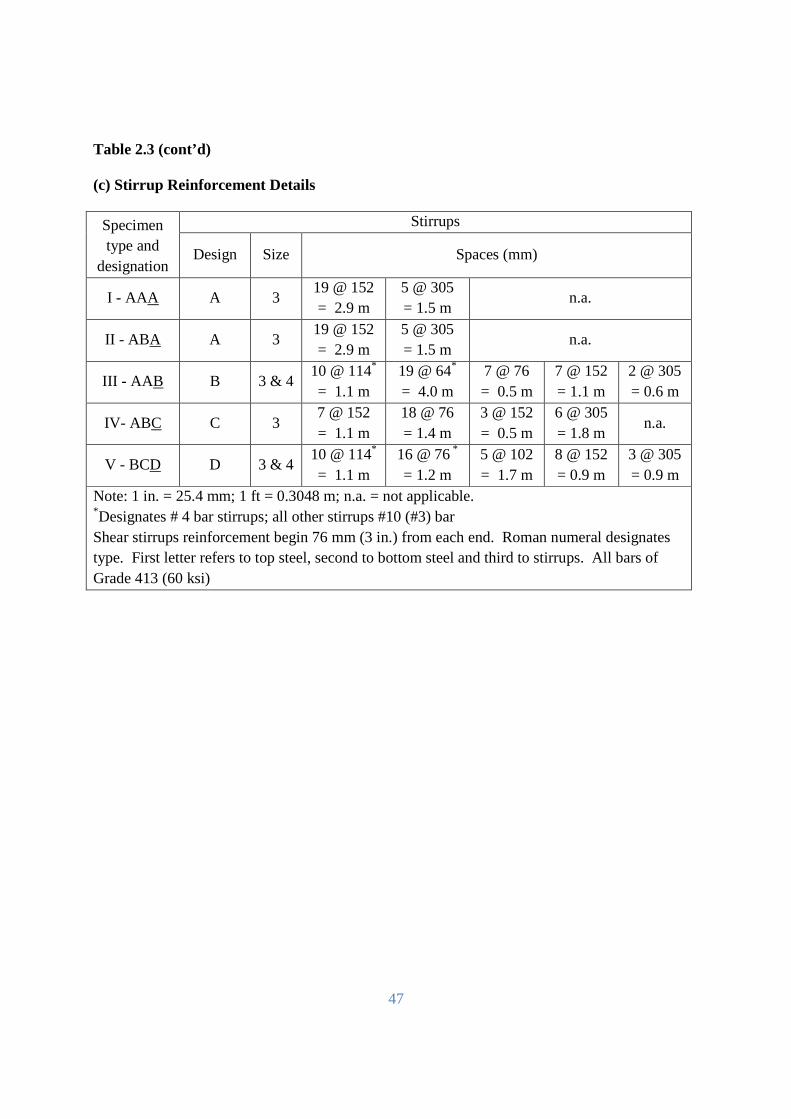
47
Table 2.3 (cont’d) (c) Stirrup Reinforcement Details
Specimen type and
designation
Stirrups
Design Size Spaces (mm)
I - AAA A 3 19 @ 152 = 2.9 m
5 @ 305 = 1.5 m
n.a.
II - ABA A 3 19 @ 152 = 2.9 m
5 @ 305 = 1.5 m
n.a.
III - AAB B 3 & 4 10 @ 114* = 1.1 m
19 @ 64* = 4.0 m
7 @ 76 = 0.5 m
7 @ 152 = 1.1 m
2 @ 305 = 0.6 m
IV- ABC C 3 7 @ 152 = 1.1 m
18 @ 76 = 1.4 m
3 @ 152 = 0.5 m
6 @ 305 = 1.8 m
n.a.
V - BCD D 3 & 4 10 @ 114* = 1.1 m
16 @ 76 * = 1.2 m
5 @ 102 = 1.7 m
8 @ 152 = 0.9 m
3 @ 305 = 0.9 m
Note: 1 in. = 25.4 mm; 1 ft = 0.3048 m; n.a. = not applicable. *Designates # 4 bar stirrups; all other stirrups #10 (#3) bar Shear stirrups reinforcement begin 76 mm (3 in.) from each end. Roman numeral designates type. First letter refers to top steel, second to bottom steel and third to stirrups. All bars of Grade 413 (60 ksi)
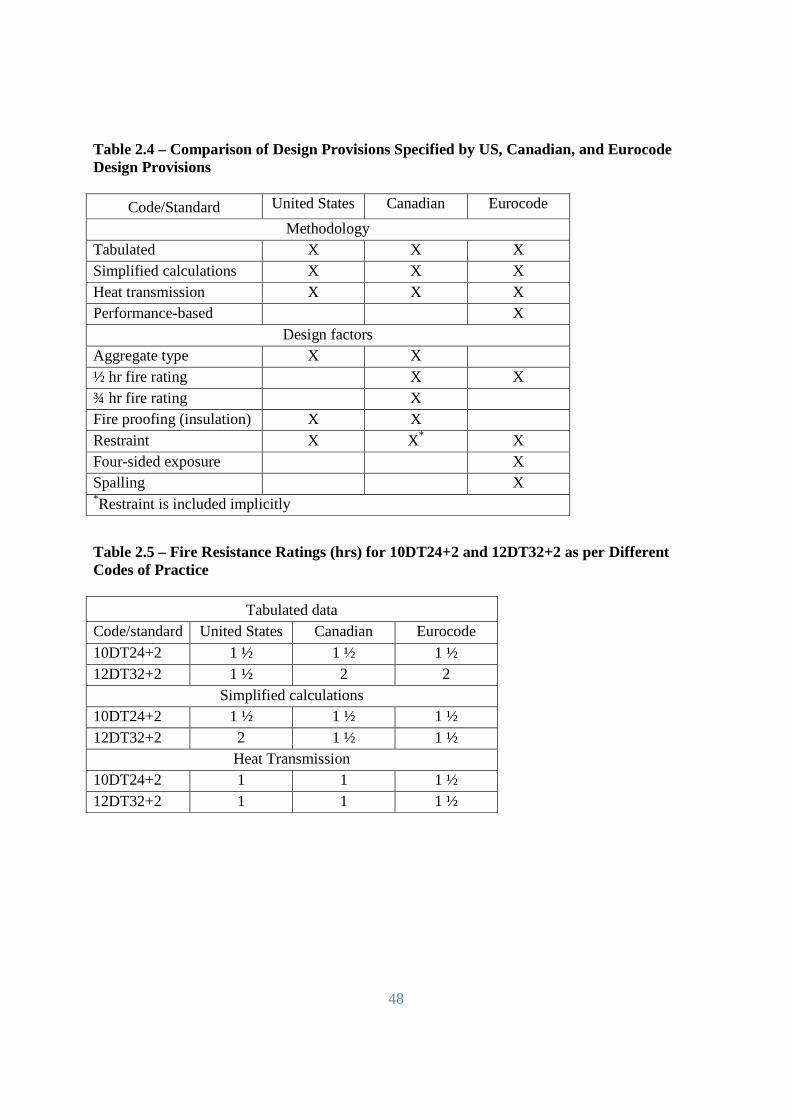
48
Table 2.4 – Comparison of Design Provisions Specified by US, Canadian, and Eurocode Design Provisions
Code/Standard United States Canadian Eurocode
Methodology Tabulated X X X Simplified calculations X X X Heat transmission X X X Performance-based X
Design factors Aggregate type X X ½ hr fire rating X X ¾ hr fire rating X Fire proofing (insulation) X X Restraint X X* X Four-sided exposure X Spalling X *Restraint is included implicitly
Table 2.5 – Fire Resistance Ratings (hrs) for 10DT24+2 and 12DT32+2 as per Different Codes of Practice
Tabulated data Code/standard United States Canadian Eurocode 10DT24+2 1 ½ 1 ½ 1 ½ 12DT32+2 1 ½ 2 2
Simplified calculations 10DT24+2 1 ½ 1 ½ 1 ½ 12DT32+2 2 1 ½ 1 ½
Heat Transmission 10DT24+2 1 1 1 ½ 12DT32+2 1 1 1 ½
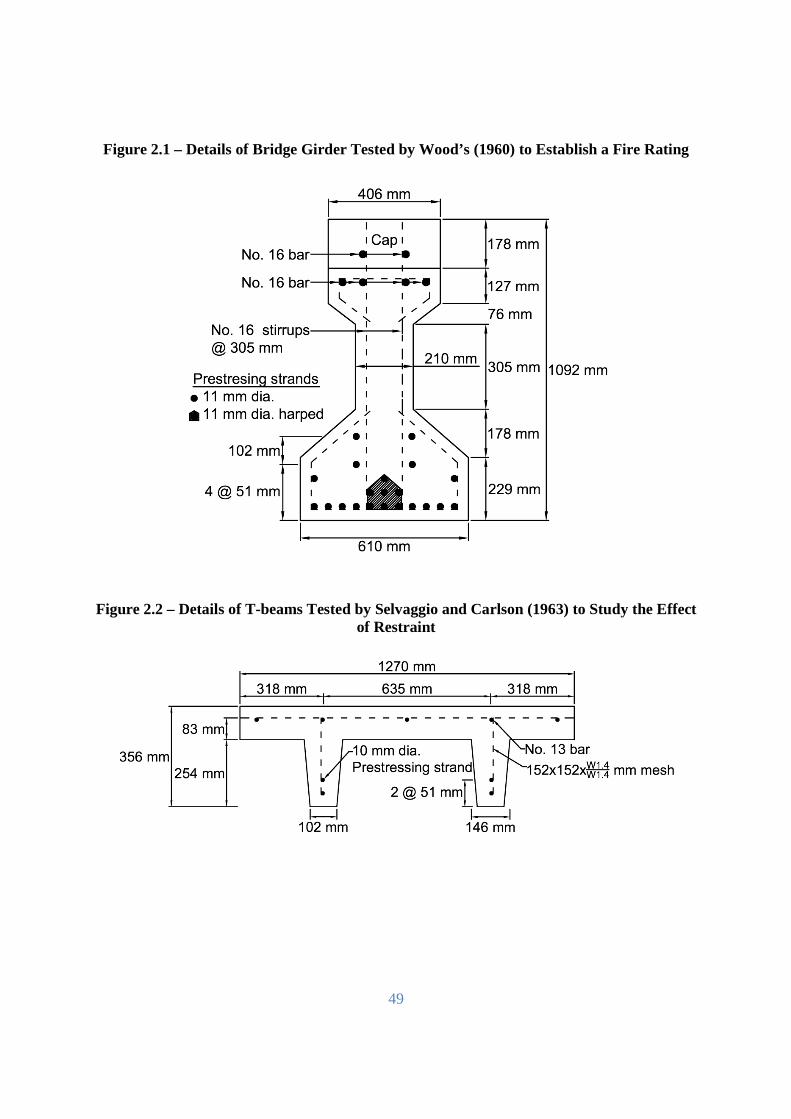
49
Figure 2.1 – Details of Bridge Girder Tested by Wood’s (1960) to Establish a Fire Rating
Figure 2.2 – Details of T-beams Tested by Selvaggio and Carlson (1963) to Study the Effect of Restraint
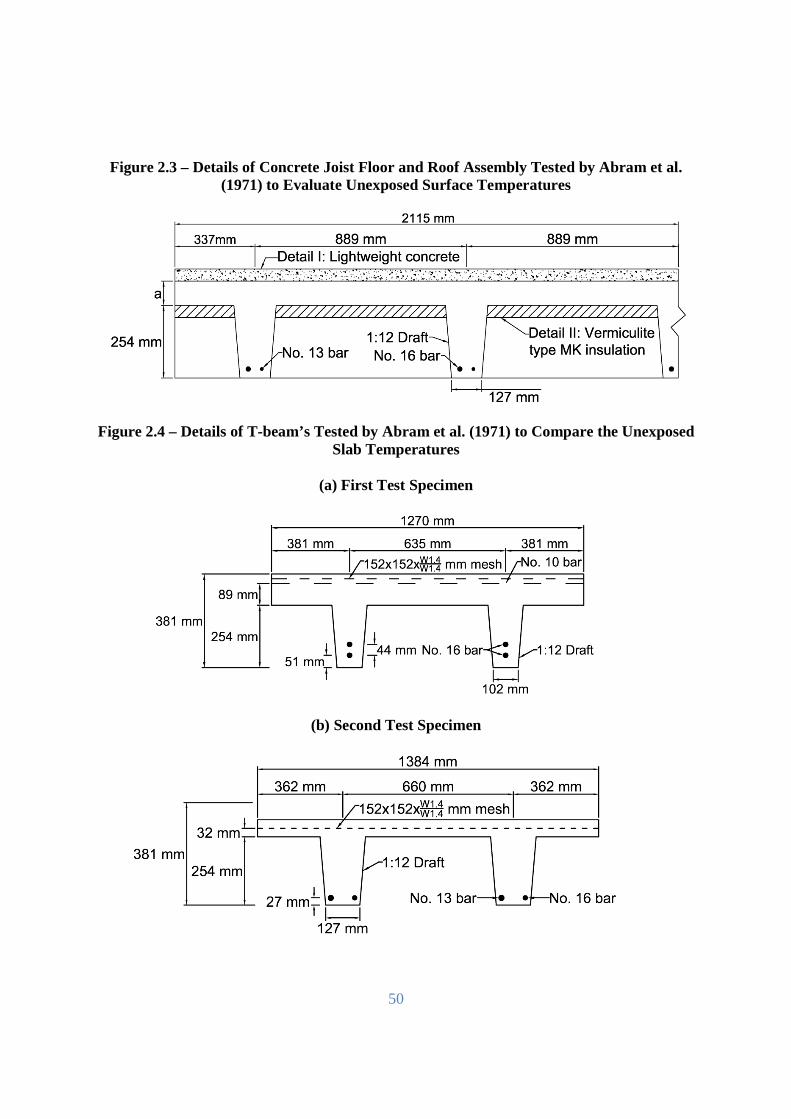
50
Figure 2.3 – Details of Concrete Joist Floor and Roof Assembly Tested by Abram et al.
(1971) to Evaluate Unexposed Surface Temperatures
Figure 2.4 – Details of T-beam’s Tested by Abram et al. (1971) to Compare the Unexposed Slab Temperatures
(a) First Test Specimen
(b) Second Test Specimen
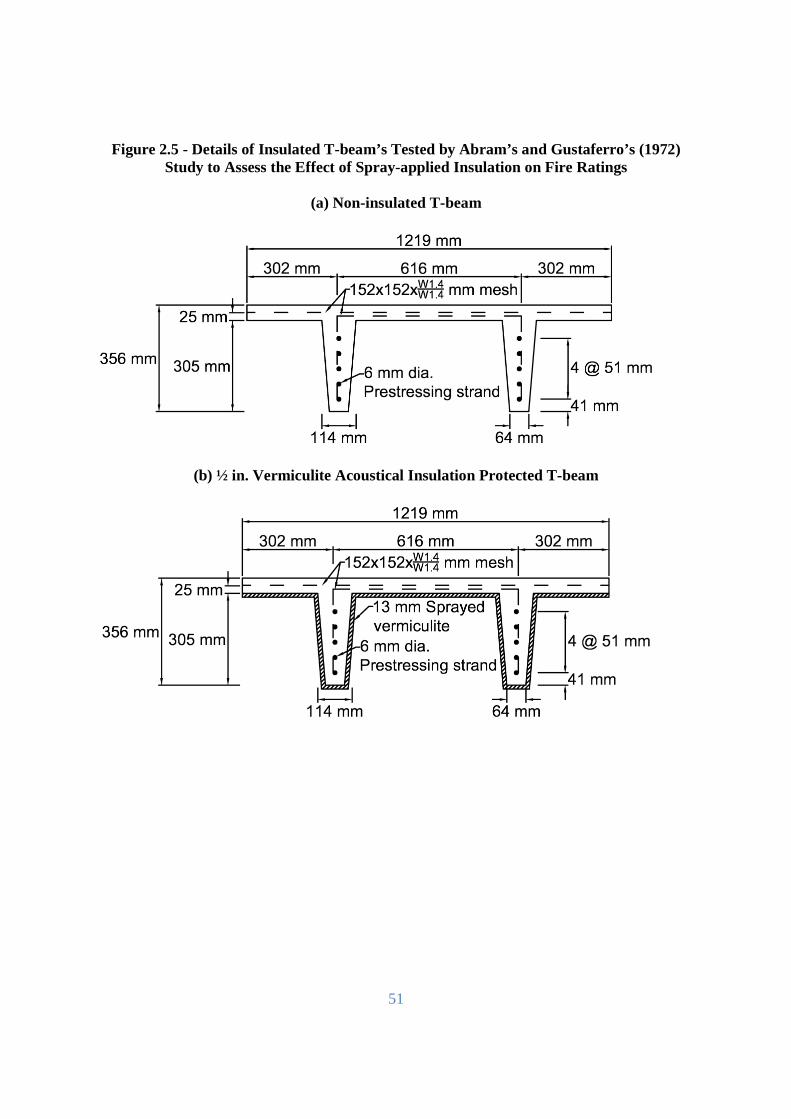
51
Figure 2.5 - Details of Insulated T-beam’s Tested by Abram’s and Gustaferro’s (1972) Study to Assess the Effect of Spray-applied Insulation on Fire Ratings
(a) Non-insulated T-beam
(b) ½ in. Vermiculite Acoustical Insulation Protected T-beam
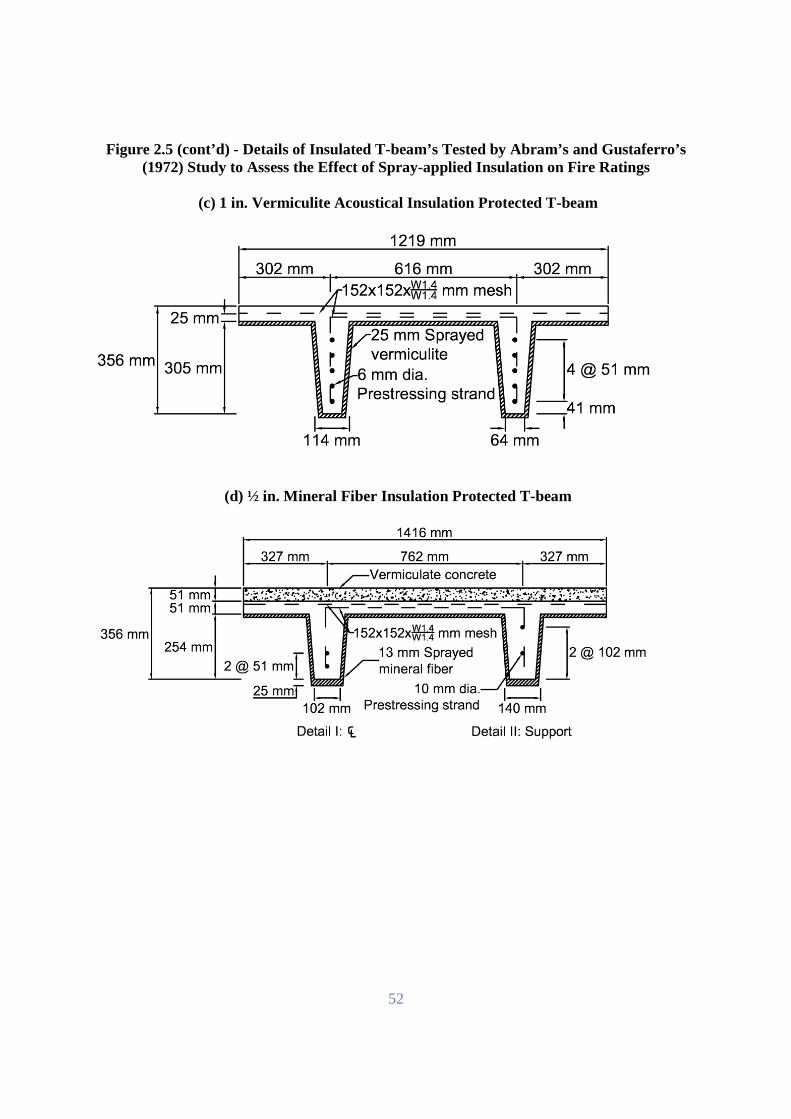
52
Figure 2.5 (cont’d) - Details of Insulated T-beam’s Tested by Abram’s and Gustaferro’s (1972) Study to Assess the Effect of Spray-applied Insulation on Fire Ratings
(c) 1 in. Vermiculite Acoustical Insulation Protected T-beam
(d) ½ in. Mineral Fiber Insulation Protected T-beam
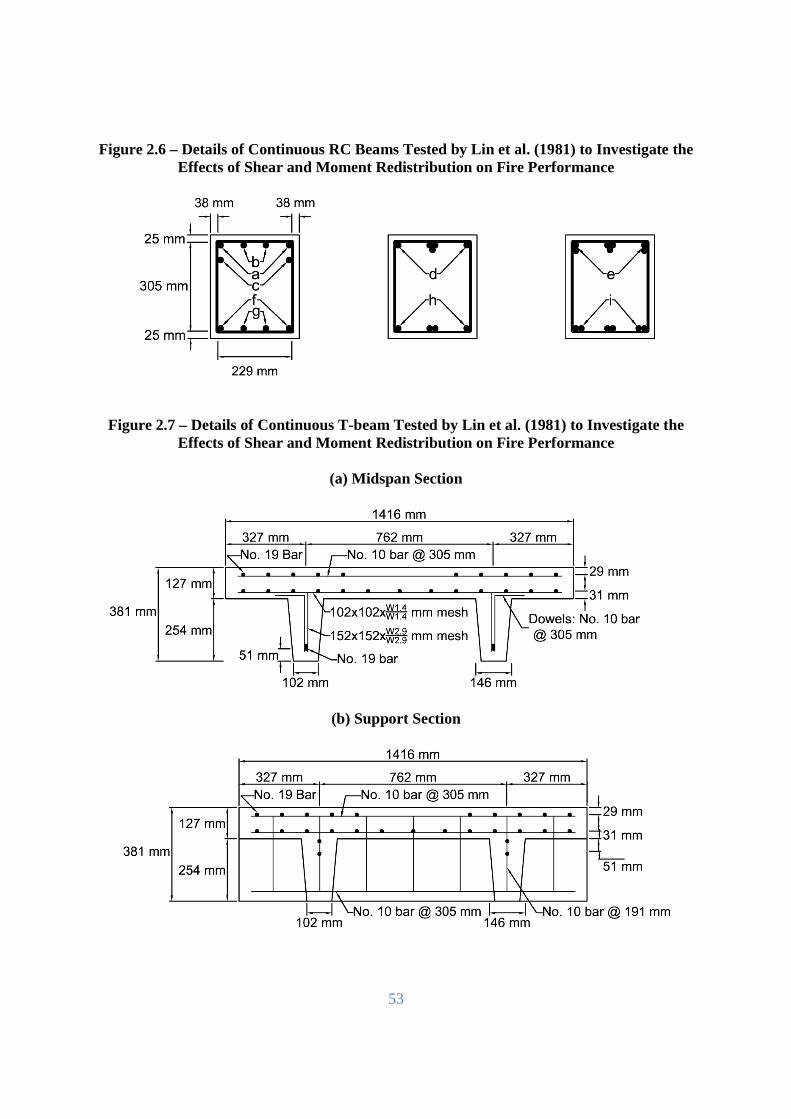
53
Figure 2.6 – Details of Continuous RC Beams Tested by Lin et al. (1981) to Investigate the Effects of Shear and Moment Redistribution on Fire Performance
Figure 2.7 – Details of Continuous T-beam Tested by Lin et al. (1981) to Investigate the Effects of Shear and Moment Redistribution on Fire Performance
(a) Midspan Section
(b) Support Section
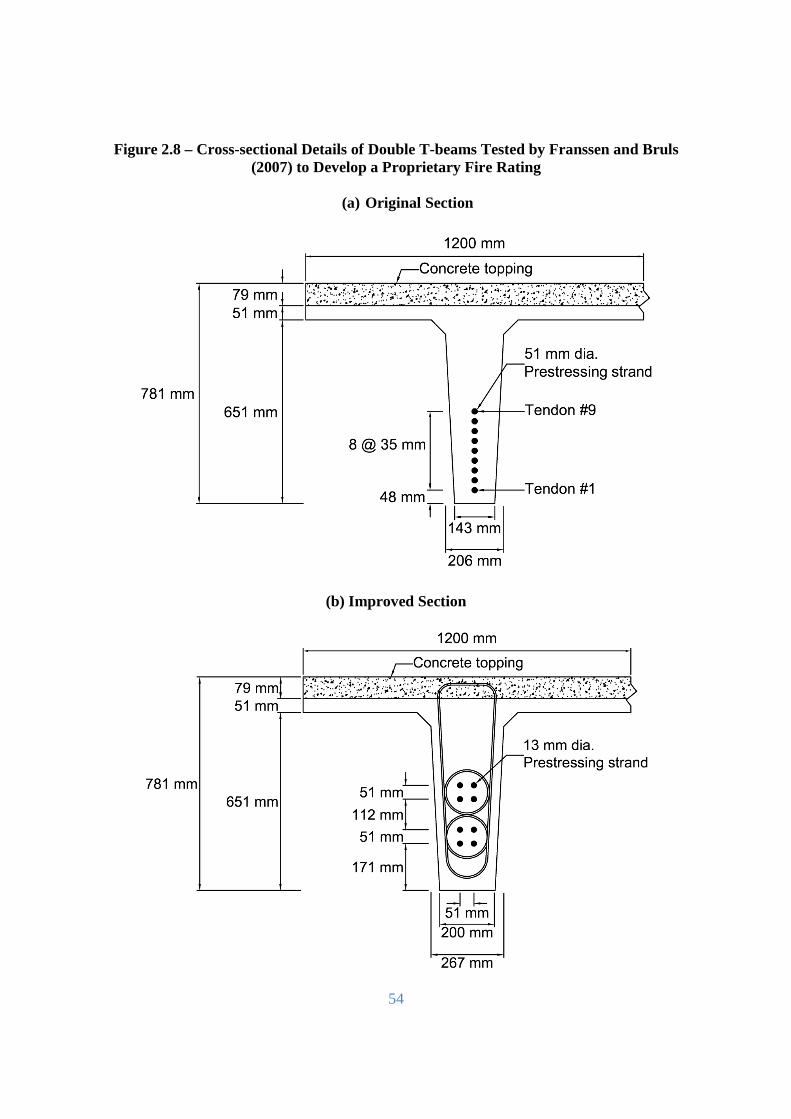
54
Figure 2.8 – Cross-sectional Details of Double T-beams Tested by Franssen and Bruls (2007) to Develop a Proprietary Fire Rating
(a) Original Section
(b) Improved Section
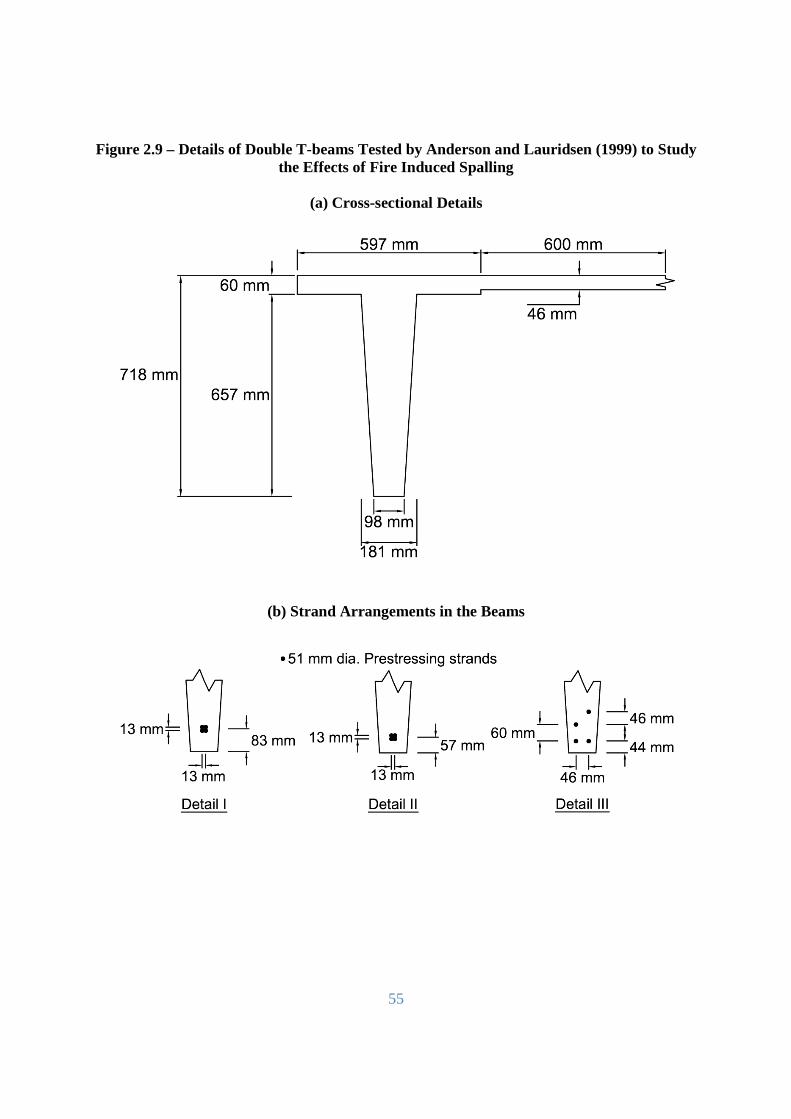
55
Figure 2.9 – Details of Double T-beams Tested by Anderson and Lauridsen (1999) to Study the Effects of Fire Induced Spalling
(a) Cross-sectional Details
(b) Strand Arrangements in the Beams
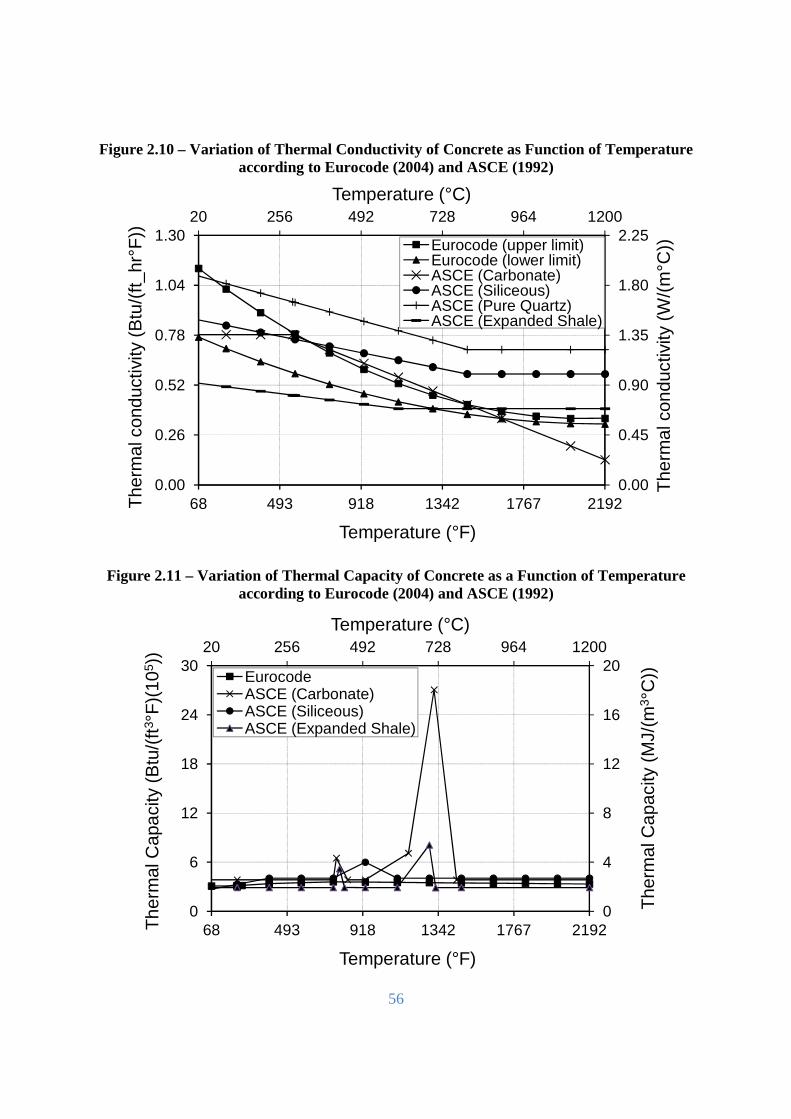
56
Figure 2.10 – Variation of Thermal Conductivity of Concrete as Function of Temperature according to Eurocode (2004) and ASCE (1992)
Figure 2.11 – Variation of Thermal Capacity of Concrete as a Function of Temperature according to Eurocode (2004) and ASCE (1992)
0.00
0.45
0.90
1.35
1.80
2.2520 256 492 728 964 1200
0.00
0.26
0.52
0.78
1.04
1.30
68 493 918 1342 1767 2192
The
rmal
con
duct
ivity
(W
/(m
°C))
Temperature (°C)
The
rmal
con
duct
ivity
(B
tu/(
ft_hr
°F))
Temperature (°F)
Eurocode (upper limit)Eurocode (lower limit)ASCE (Carbonate)ASCE (Siliceous)ASCE (Pure Quartz)ASCE (Expanded Shale)
0
4
8
12
16
2020 256 492 728 964 1200
0
6
12
18
24
30
68 493 918 1342 1767 2192
The
rmal
Cap
acity
(M
J/(m
3 °C
))Temperature (°C)
The
rmal
Cap
acity
(B
tu/(
ft3°F
)(10
5 ))
Temperature (°F)
EurocodeASCE (Carbonate)ASCE (Siliceous)ASCE (Expanded Shale)
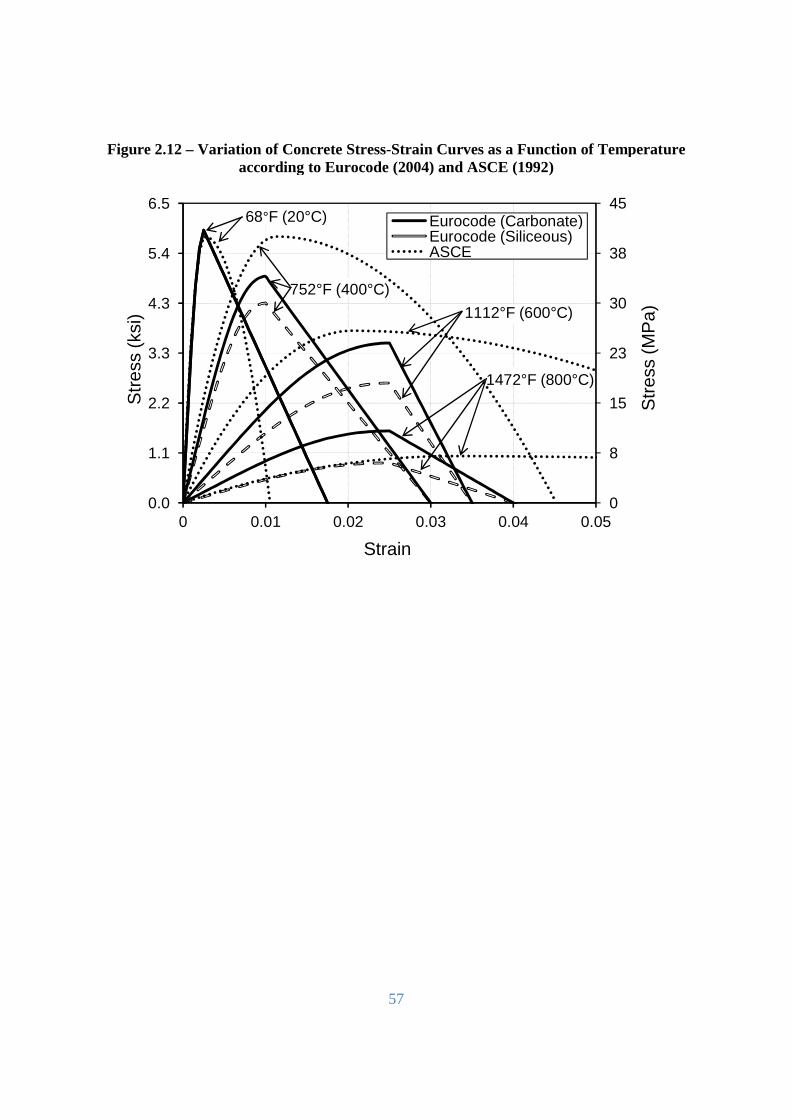
Figure 2.12 – Variation of according to
0.0
1.1
2.2
3.3
4.3
5.4
6.5
0 0.01
Str
ess
(ksi
)
68°F (20
57
Variation of Concrete Stress-Strain Curves as a Function of Temperature according to Eurocode (2004) and ASCE (1992)
0.01 0.02 0.03 0.04
Strain
Eurocode (Carbonate)Eurocode (Siliceous)ASCE
F (20°C)
1472°F (800
1112°F (600°C)
752°F (400°C)
a Function of Temperature
0
8
15
23
30
38
45
0.05
Str
ess
(MP
a)
Eurocode (Carbonate)Eurocode (Siliceous)
F (800°C)
C)
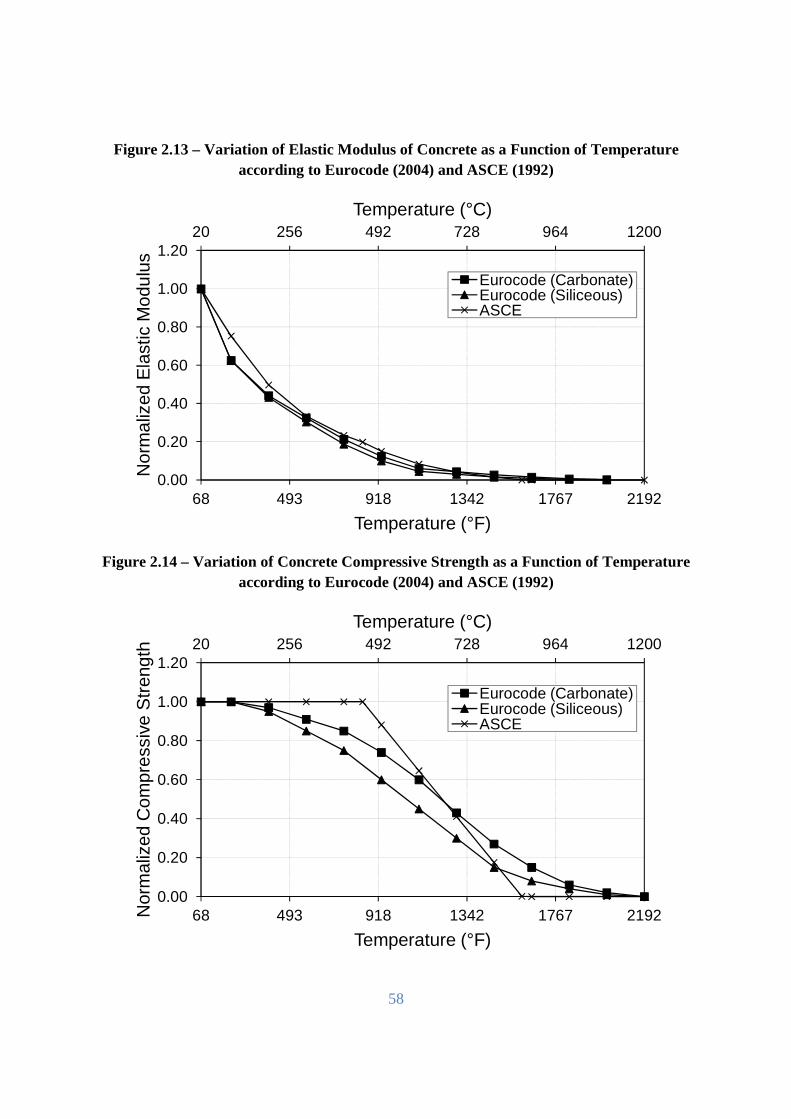
58
Figure 2.13 – Variation of Elastic Modulus of Concrete as a Function of Temperature according to Eurocode (2004) and ASCE (1992)
Figure 2.14 – Variation of Concrete Compressive Strength as a Function of Temperature
according to Eurocode (2004) and ASCE (1992)
20 256 492 728 964 1200
0.00
0.20
0.40
0.60
0.80
1.00
1.20
68 493 918 1342 1767 2192
Temperature (°C)
Nor
mal
ized
Ela
stic
Mod
ulus
Temperature (°F)
Eurocode (Carbonate)Eurocode (Siliceous)ASCE
20 256 492 728 964 1200
0.00
0.20
0.40
0.60
0.80
1.00
1.20
68 493 918 1342 1767 2192
Temperature (°C)
Nor
mal
ized
Com
pres
sive
Str
engt
h
Temperature (°F)
Eurocode (Carbonate)Eurocode (Siliceous)ASCE
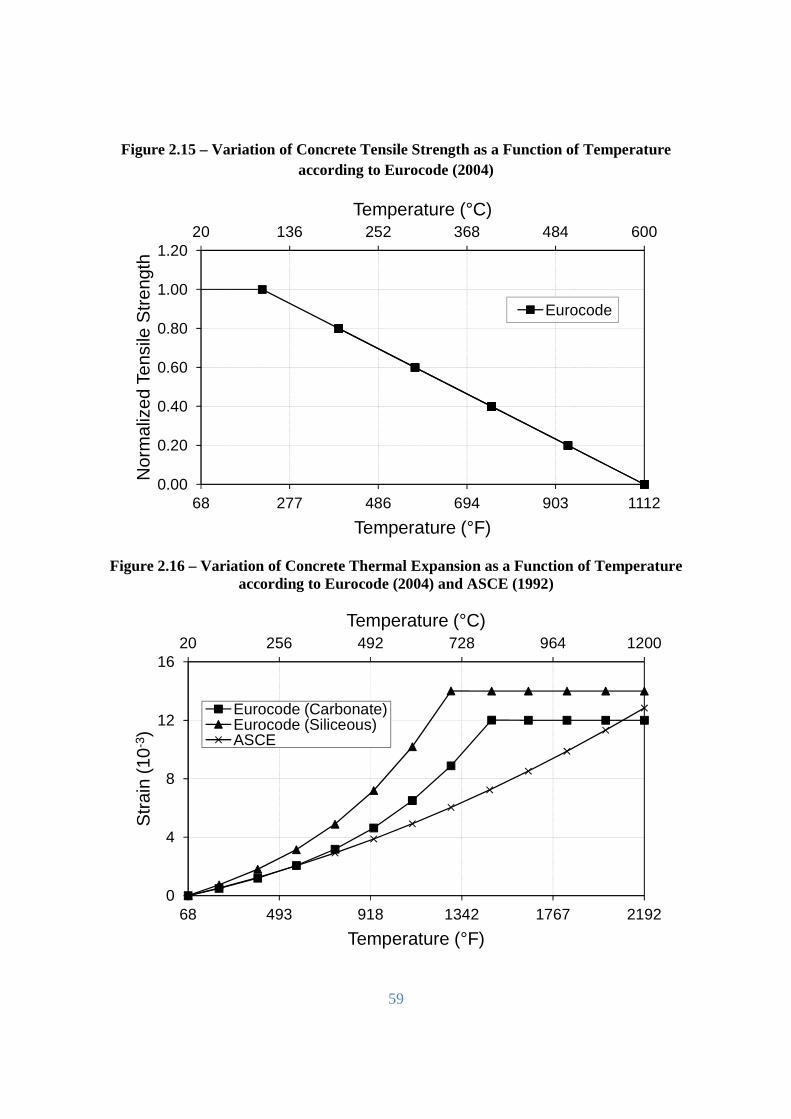
59
Figure 2.15 – Variation of Concrete Tensile Strength as a Function of Temperature according to Eurocode (2004)
Figure 2.16 – Variation of Concrete Thermal Expansion as a Function of Temperature
according to Eurocode (2004) and ASCE (1992)
20 136 252 368 484 600
0.00
0.20
0.40
0.60
0.80
1.00
1.20
68 277 486 694 903 1112
Temperature (°C)
Nor
mal
ized
Ten
sile
Str
engt
h
Temperature (°F)
Eurocode
20 256 492 728 964 1200
0
4
8
12
16
68 493 918 1342 1767 2192
Temperature (°C)
Str
ain
(10-
3 )
Temperature (°F)
Eurocode (Carbonate)Eurocode (Siliceous)ASCE
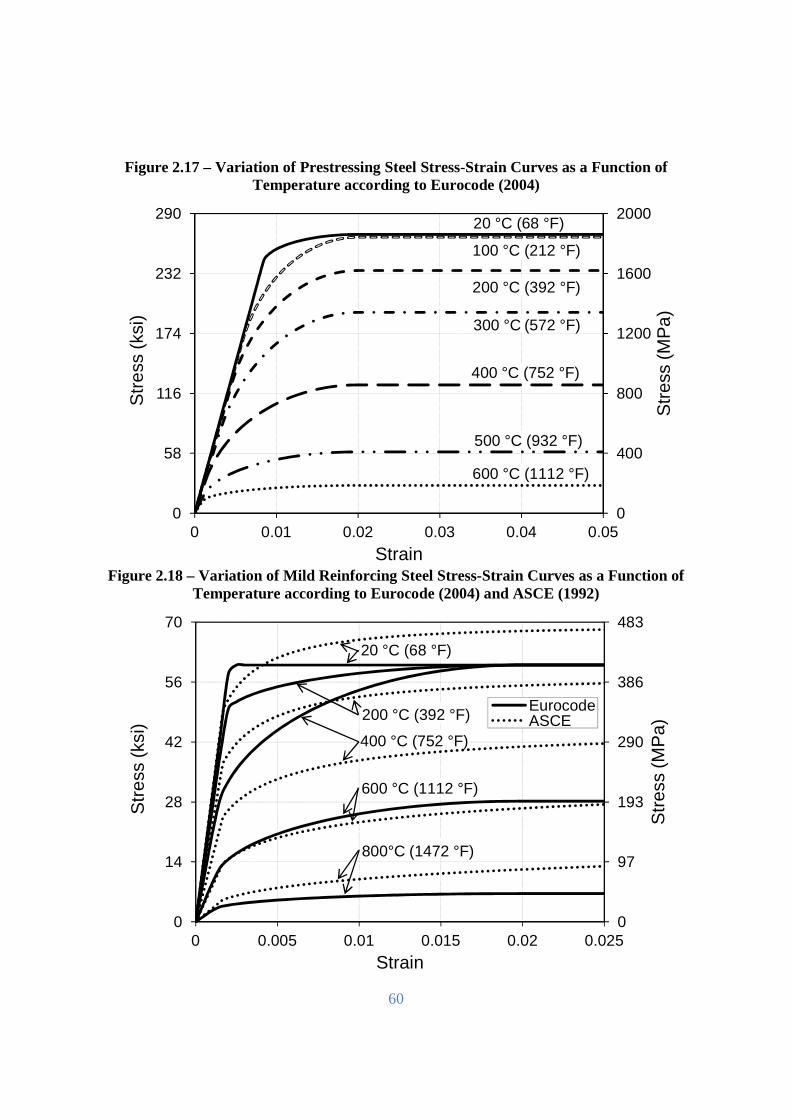
60
Figure 2.17 – Variation of Prestressing Steel Stress-Strain Curves as a Function of
Temperature according to Eurocode (2004)
Figure 2.18 – Variation of Mild Reinforcing Steel Stress-Strain Curves as a Function of
Temperature according to Eurocode (2004) and ASCE (1992)
0
400
800
1200
1600
2000
0
58
116
174
232
290
0 0.01 0.02 0.03 0.04 0.05
Str
ess
(MP
a)
Str
ess
(ksi
)
Strain
20 °C (68 °F)
100 °C (212 °F)
200 °C (392 °F)
300 °C (572 °F)
400 °C (752 °F)
500 °C (932 °F)
600 °C (1112 °F)
0
97
193
290
386
483
0
14
28
42
56
70
0 0.005 0.01 0.015 0.02 0.025
Str
ess
(MP
a)
Str
ess
(ksi
)
Strain
EurocodeASCE
20 °C (68 °F)
800°C (1472 °F)
600 °C (1112 °F)
400 °C (752 °F)
200 °C (392 °F)
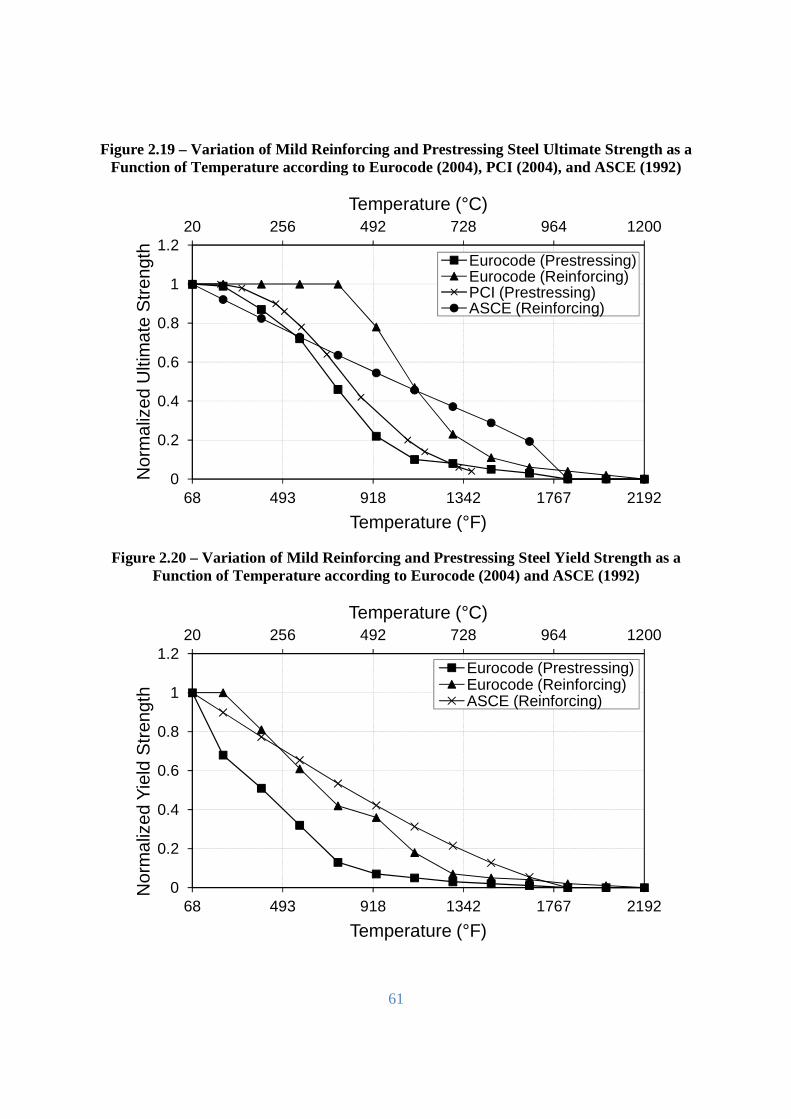
61
Figure 2.19 – Variation of Mild Reinforcing and Prestressing Steel Ultimate Strength as a Function of Temperature according to Eurocode (2004), PCI (2004), and ASCE (1992)
Figure 2.20 – Variation of Mild Reinforcing and Prestressing Steel Yield Strength as a
Function of Temperature according to Eurocode (2004) and ASCE (1992)
20 256 492 728 964 1200
0
0.2
0.4
0.6
0.8
1
1.2
68 493 918 1342 1767 2192
Temperature (°C)
Nor
mal
ized
Ulti
mat
e S
tren
gth
Temperature (°F)
Eurocode (Prestressing)Eurocode (Reinforcing)PCI (Prestressing)ASCE (Reinforcing)
20 256 492 728 964 1200
0
0.2
0.4
0.6
0.8
1
1.2
68 493 918 1342 1767 2192
Temperature (°C)
Nor
mal
ized
Yie
ld S
tren
gth
Temperature (°F)
Eurocode (Prestressing)Eurocode (Reinforcing)ASCE (Reinforcing)
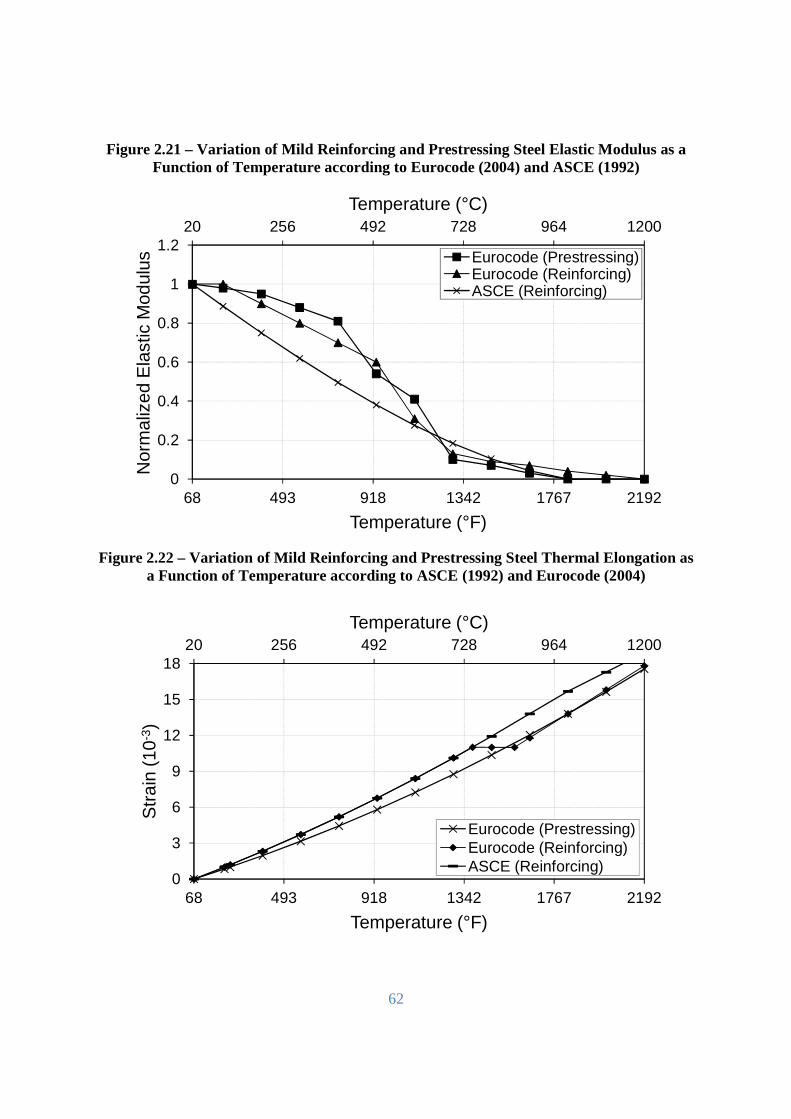
62
Figure 2.21 – Variation of Mild Reinforcing and Prestressing Steel Elastic Modulus as a Function of Temperature according to Eurocode (2004) and ASCE (1992)
Figure 2.22 – Variation of Mild Reinforcing and Prestressing Steel Thermal Elongation as
a Function of Temperature according to ASCE (1992) and Eurocode (2004)
20 256 492 728 964 1200
0
0.2
0.4
0.6
0.8
1
1.2
68 493 918 1342 1767 2192
Temperature (°C)
Nor
mal
ized
Ela
stic
Mod
ulus
Temperature (°F)
Eurocode (Prestressing)Eurocode (Reinforcing)ASCE (Reinforcing)
20 256 492 728 964 1200
0
3
6
9
12
15
18
68 493 918 1342 1767 2192
Temperature (°C)
Str
ain
(10-
3 )
Temperature (°F)
Eurocode (Prestressing)Eurocode (Reinforcing)ASCE (Reinforcing)
63
Chapter 3
3. Numerical Model 3.1. General
In this chapter, details of SAFIR, the finite-element computer program utilized to carry out
numerical studies on precast/prestressed concrete (PPC) double T-beams, is presented. The
chapter begins with a discussion on the rationale behind why SAFIR was selected to perform the
fire resistance analysis. Next, a brief overview of SAFIR is presented, followed by a detailed
description of the general analysis procedure. Also, the specifics of both the thermal and
structural analysis procedures are highlighted, as well as the material properties used in each
analysis. A summary of SAFIR’s software features are mentioned and the findings of the
sensitivity analysis to investigate the influence of mesh density and element length on the
64
accuracy of thermal and structural models are provided. At the conclusion of this chapter two
separate studies are presented to validate the model and the information is summarized.
3.2. Selection of Computer Model
SAFIR, a special-purpose, finite-element program was selected to perform the numerical studies
for this research. The reason why SAFIR (2004) was selected, rather than other commercially
available finite-element software packages, such as ANSYS (2011) or ABAQUS (2011), is
because this program has been developed for the sole purpose of modeling structures in fire.
Although, these other highly sophisticated programs are more than capable of achieving the same
goal, they can require a significant amount of effort to develop a working model, as well as to
validate the model. In contrast, SAFIR has been well validated for modeling the fire response of
numerous types of members and materials. Furthermore, the program has reached a level of
refinement where even the subtle nuances that require years of experience are already accounted
for in the model. In addition, SAFIR offers the convenience of a library of predefined high
temperature material models and fire curves. It also, limits the number structural element to only
the most relevant elements required to model the types of structures encountered in civil
applications.
3.3. Computer Program SAFIR
As mentioned, numerical studies of PPC double T-beams are carried out using a special-purpose
finite-element computer program SAFIR (2004), developed at the University of Liege in
Belgium, which is capable of predicting the fire response of structural systems. This software is
well validated for evaluating fire resistance of steel and RC members. However, SAFIR is
65
utilized to assess the fire resistance of PPC members in a limited way (Franssen and Bruls 1997
and Franssen 1993). In this computer program, the fire resistance of a structural system is
analyzed through a two-fold thermo-mechanical analysis. For thermal analysis, the cross-section
is discretized into triangular and quadrilateral solid elements in 2-dimensions or prismatic (6 or 8
nodes) elements in 3-dimensions. For structural analysis, the member is discretized into truss,
beam, frame, shell, or prismatic beam elements. The elements can be discretized into irregular-
shaped cross-sections with multiple materials. Any fire exposure (design or standard) scenario
can be incorporated in the analysis by providing relevant time–temperature data. In the analysis
the computer program accounts for high-temperature material properties, large displacements,
both heating and cooling phases of a fire, torsion, and residual stresses.
3.3.1. General Analysis Procedure
The thermal mechanical analysis utilized in SAFIR is based on a time-step approach. Figure 3.1
illustrates a flowchart of the iterative step-by-step procedure utilized in SAFIR. At the beginning
of every analysis and iteration, the exposure temperatures are calculated based on the time-
temperature relationship. These exposure temperatures are then applied to the thermal model as
boundary conditions. Next, the thermal analysis is performed based on the exposure
temperature, residual temperature, and high temperature thermal properties to determine the new
temperatures within the structure. The temperature results from the thermal analysis are then
used in the structural analysis to evaluate the temperature reduced mechanical properties for the
structural model. Based on the structural models’ mechanical properties, support conditions, and
applied loading a structural analysis is undertaken to evaluate the stresses, strains, internal forces,
and deflections of the structure. At the end of every iteration failure is checked. If failure

66
occurs, then the analysis procedure ends, if failure does not occur another iteration begins and
analysis procedure repeats itself.
3.3.2. Thermal Analysis
The thermal analysis model used in the numerical studies is based on fundamental heat transfer
principles to generate temperature profiles within a two/three-dimensional nonlinear geometric
cross-section. The PPC beams’ cross-section is modeled as composed of three different
materials (concrete topping, member, and steel prestressing strands) and discretized into
triangular and quadrilateral solid elements, as illustrated in Figure 3.2. The Eurocode
temperature-dependent thermal properties (thermal conductivity, specific heat, density, and
thermal expansion) of concrete, prestressing steel, and mild reinforcing steel are built into the
program and as an illustration are reproduced in the Appendix C. In thermal calculations, energy
required to evaporate moisture within the concrete is considered, but the effect of fire-induced
spalling that occurs in concrete is neglected.
3.3.3. Structural Analysis
The structural analysis model utilizes large deflection theory for tracing the mechanical response
under fire conditions. The thermal analysis is linked to structural analysis by assuming that each
triangular or quadrilateral element formed in the thermal analysis is represented as a fiber-based
beam element. Each fiber is assigned a nonlinear temperature-dependent material property
(Poisson’s ratio, compressive strength, tensile strength, elastic modulus, and yield strength) in
accordance with Eurocode 2 (2004) and is constant along the length of the beam element. The
material properties incorporated in the model are reproduced in the Appendix C. The
67
culmination of these fibers determine the stiffness of the beam elements and mechanical
response at a given time step. Therefore, for a given time increment, the temperatures of all the
fibers are generated from the thermal analysis and utilized in the structural analysis to estimate
the reduction in strength and stiffness of that beam element.
For the analysis of a PPC beam, the discretization is a series (single line) of beam elements, as
illustrated in Figure 3.3. Each beam element utilizes two integration points to assess the internal
forces resulting from the applied loading. For simulating restraint effects, a truss element is
incorporated and various degrees of restraint are simulated by modifying the cross-sectional area
of the member. The output parameters at each time step include temperatures, support reactions,
internal forces, and longitudinal and midspan deflections. Failure is defined as a loss of stiffness
in the member or when the material strains are exceeded which typically corresponds to the
strength limit state. The Newton–Raphson procedure is applied to solve the system of nonlinear
equations. Although the structural model has numerous advantages, it cannot account for shear
effects, fire-induced spalling in concrete, and bond degradation between prestressing strands and
concrete.
3.3.4. Material Models
As mentioned, the material properties incorporated in both the thermal and structural analysis
model are based on Eurocode 2 (2004). The empirical relationships and material models are
reproduced in the Appendix C. The specific behavior of each these material properties has been
discussed in detail in Chapter 2.

68
3.3.5. Software Features
SAFIR has numerous software features and its developers are continuously adding new features
to the programs’ repertoire. To mention a few, SAFIR provides the user with a easy to use
graphical user interface pre-processor (depending on type of section) and post-processor
allowing the user to visualize the models geometry, temperature isotherms, internal forces, and
deflections, graphically. It also offers the user the option of matrix optimization, a feature that
shortens the time required for analysis by renumbering the system of equations in a more
efficient manner. Another feature is the option to include master-slave relations by imposing
identical displacements and temperatures between nodes. SAFIR is also capable of torsional
analysis, dynamic analysis for the local failure of members, and 3D thermal analysis. It also has
the ability to model composite members.
3.4. Sensitivity Analysis
In a finite element model, the level of refinement used to discretize the model influences the
accuracy of the results. In general, the finer the discretization, more accurate the results will be.
Therefore, to assure an acceptable level of accuracy when assessing the fire resistance of PPC
Beams in SAFIR, a sensitivity analysis was undertaken to study the influence of mesh density
and element length in thermal and structural analyses, respectively. The study consisted of
developing three models for each type of analysis. To investigate the influence of mesh density
in the thermal analysis, a base model was discretized under the premise that a single quadrilateral
element would represent one prestressing strand; hence the dimensions for the square element
were derived from the strands cross-sectional area. The discretization utilized for the remaining
elements were of similar size and proportion. As for the other two models, they were developed
69
by either decreasing or increasing the mesh density by a factor of two. Figure 3.4 illustrates the
three cases considered and are labeled as I, II, and III. The first case, model I, corresponds to the
model with the coarsest mesh, while model III has the finest mesh. To investigate the influence
of element length in the structural analysis, the original model was discretized into twenty 0.61
m (2 ft) long elements (model II). Similarly, two more models were discretized, one with ten
1.22 m (4 ft) (model I) and another with forty 0.30 m (1 ft) long elements (model III). The
following discussion presents the finding of the sensitivity analysis.
Figure 3.5 illustrates strand and average slab temperature results from the three thermal models
(I, II, and III). The strand temperatures are based on the lowest strand and were arbitrarily
selected for the purpose of comparison. The results reveal that a finer mesh density produces
higher temperatures. When comparing the results the average percent difference between the
models range from 0.6 to 2.0% for the strand temperatures and 0.9 to 4.4% for the average slab
temperatures. The greatest difference observed was between model I and III. The largest
difference in individual data occurs within the first 20 minutes for the strand temperatures and
between 20 and 50 minutes for the average slab temperatures with a maximum percent difference
ranging from 7.9 to 27.3% and 4.3 to 19.6%, respectively. Based on these results it evident that
model I produces the least accurate results. As for case II and III the results are nearly identical,
excluding the difference of 7.9% that occurs early on in the fire and is short lived.
Figure 3.6 shows the midspan deflections for the three structural models developed to investigate
the influence of beam length on fire resistance of PPC beams. As mentioned previously, the
longest elements are utilized in model I and shortest elements in model III. In general, the three
models correlate well with one another until the deflections begin to increase significantly at
approximately 50 minutes, just prior to failure. The average percent difference between the
70
deflections for each model range from 0.3 to 7.1%. When comparing failure times, model I fails
first at 53 minutes with corresponding deflection of -0.46 m (-18.2 in.). Models II and III fail at
56 and 57 minutes with corresponding deflections of -1.12 m (-44.3 in.) and -1.39 m (-54.9 in.),
respectively. These results indicate that model I provides the least accuracy, while only minor
variations exist between models II and III. Based on the findings of the sensitivity analysis,
model II will be used as the basis for discretization of the thermal and structural models used in
the parametric study to investigate the factors that influence the fire resistance of PPC beams.
3.5. Model Validation
The numerical model, SAFIR (2004), was validated by comparing predictions from the model
with measured data from fire tests on two PPC double T-beams. There is very limited
experimental data on fire performance of PPC double T-beams. Due to lack of comprehensive
test data (such as temperatures and deflections) for any one tested beam, test data from the first
beam was utilized to compare the predicted unexposed slab temperatures, while the data from the
second beam was utilized to compare strand temperatures and deflections.
The first beam selected for validation is a PPC double T-beam tested at Underwriter’s
Laboratories (UL) (1996) to establish proprietary fire ratings under ASTM E119 (2008) standard
fire exposure. The cross-sectional details of the tested beam are shown in Figure 3.7. In the tests
failure occurred when the unexposed surface temperature exceeded the limiting temperature
criterion, which is 181°C (325°F). Results from fire tests were used to generate fire ratings of
30, 60, 90, 120, and 180 minutes by increasing the slab thicknesses (h) from 51, 76, 102, 121,
and 152 mm (2, 3, 4, 4¾, and 6 in.). This beam was analyzed using SAFIR with various slab
thicknesses. For the analysis, a normal weight concrete comprising carbonate aggregate with a
71
moisture content of 3% by weight was assumed. High temperature properties, as specified in
Eurocode, are used in the analysis. These properties are similar to those in ASCE manual of
practice and are reproduced in Appendix C.
The unexposed slab temperatures predicted by SAFIR are plotted in Figure 3.8 as a function of
fire exposure time for varying slab thicknesses. Also plotted in the figure is the limiting heat
transmission temperature of 181°C (325°F). In all cases the temperatures in the unexposed side
of the slab initially rises slowly in a linear fashion until all of the free moisture has completely
evaporated. After this point, the temperatures increase at a higher rate and follow a similar trend
as that of ASTM E119 fire curve. These temperature trends reveal that a thicker slab delays the
temperature rise in the unexposed slab’s surface than a thinner slab. Figure 3.9 shows a
comparison of predicted fire resistance ratings with that of UL listed ratings for beams with
different slab thicknesses. The predicted fire resistance values are close to UL listed ratings over
the entire range with the data points lying within 10%. These comparisons indicate that the
unexposed slab temperatures can be predicted reasonably well with SAFIR if relevant high
temperature thermal properties (concrete type, moisture content, and density) are accounted for
in the analysis.
The second beam selected for validation was the one tested by Gustaferro et al. (1962) to study
the response of a simply supported PPC double T-beam under ASTM E119 (2008) fire exposure.
In the test a uniform live load of 4.8 KN/m2 (100 psf) was applied over the 6.1 m (20 ft) span of
the beam whose cross-section is shown in Figure 3.10. A summary of test data namely, strand
temperatures, midspan deflections, and fire resistance time, is listed in Table 3.1. This beam was
analyzed using SAFIR computer program. In the analysis the moisture content within the
concrete was assumed to be 3% by weight. The strand temperatures generated from SAFIR
72
analysis are plotted in Figure 3.11, where strands 5 and 1 correspond to the strand with the
greatest and least concrete cover, respectively. In all strands the temperatures gradually increase,
with temperatures in strand 1 rising more rapidly than strand 5. Also, shown in Figure 3.11 are
the minimum, average, and maximum strand temperatures at failure as measured in the test. The
results indicate a strong correlation between the model and test data, with average strand
temperatures falling within 9% of each other. The difference in the strand temperatures can be
attributed to variation of the concrete moisture content and thermal properties of concrete used in
the analysis. These values had to be assumed based on best guess estimates, since they are not
provided in the test report.
The predicted midspan deflections are compared with measured deflections from the test in
Figure 3.12. The deflections gradually decrease with time up to about 40 minutes due to
deterioration of the members’ stiffness. After 40 minutes, the measured deflections increase at a
faster rate compared to predicted deflections. This can be primarily attributed to faster
degradation of strength and also to the fact that high temperature creep plays significant role and
the model accounts for only part of this creep. The predicted deflections are within 24% of
measured values and this kind of variation is not uncommon in fire resistance analysis. The
failure times (fire resistance) match well with only a difference of 4 minutes. The strand
temperature, midspan deflection and failure time results indicate that SAFIR is capable of
reasonably predicting thermal and structural response of PPC beams exposed to fire.
3.6. Summary
This chapter provided a comprehensive explanation of the finite element analysis program
SAFIR used in the numerical studies of chapter 4 to predict the fire response of PPC double T-
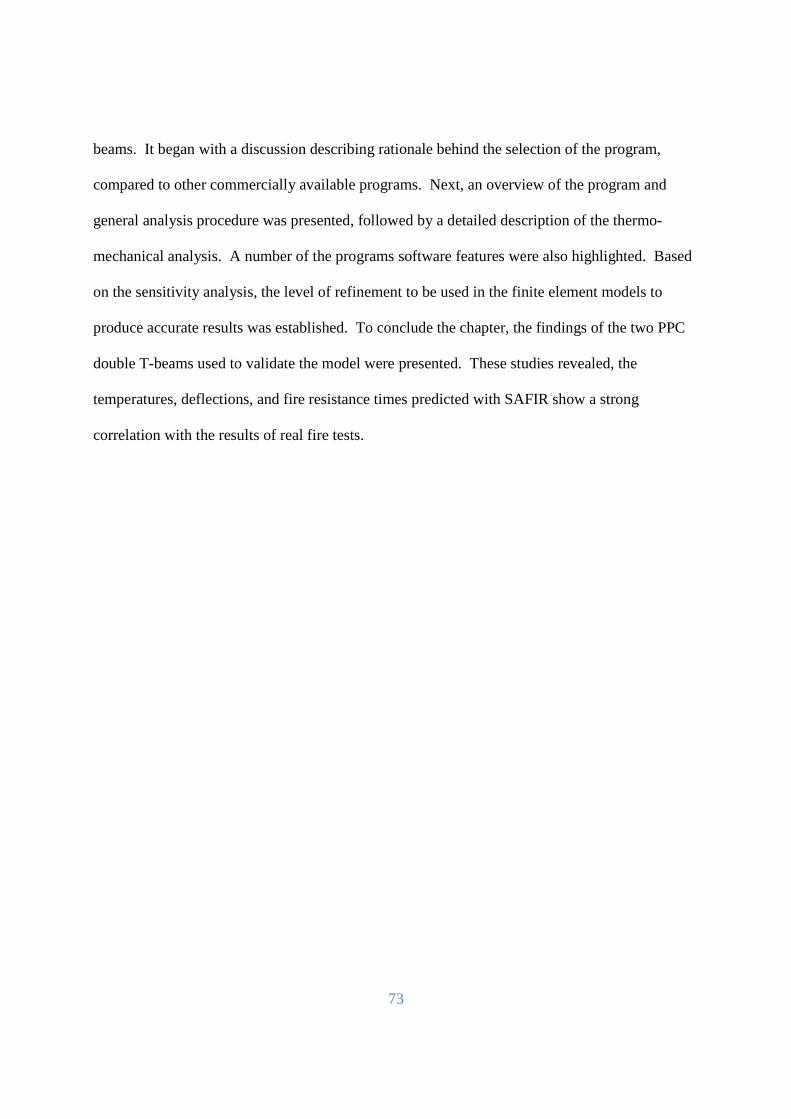
73
beams. It began with a discussion describing rationale behind the selection of the program,
compared to other commercially available programs. Next, an overview of the program and
general analysis procedure was presented, followed by a detailed description of the thermo-
mechanical analysis. A number of the programs software features were also highlighted. Based
on the sensitivity analysis, the level of refinement to be used in the finite element models to
produce accurate results was established. To conclude the chapter, the findings of the two PPC
double T-beams used to validate the model were presented. These studies revealed, the
temperatures, deflections, and fire resistance times predicted with SAFIR show a strong
correlation with the results of real fire tests.
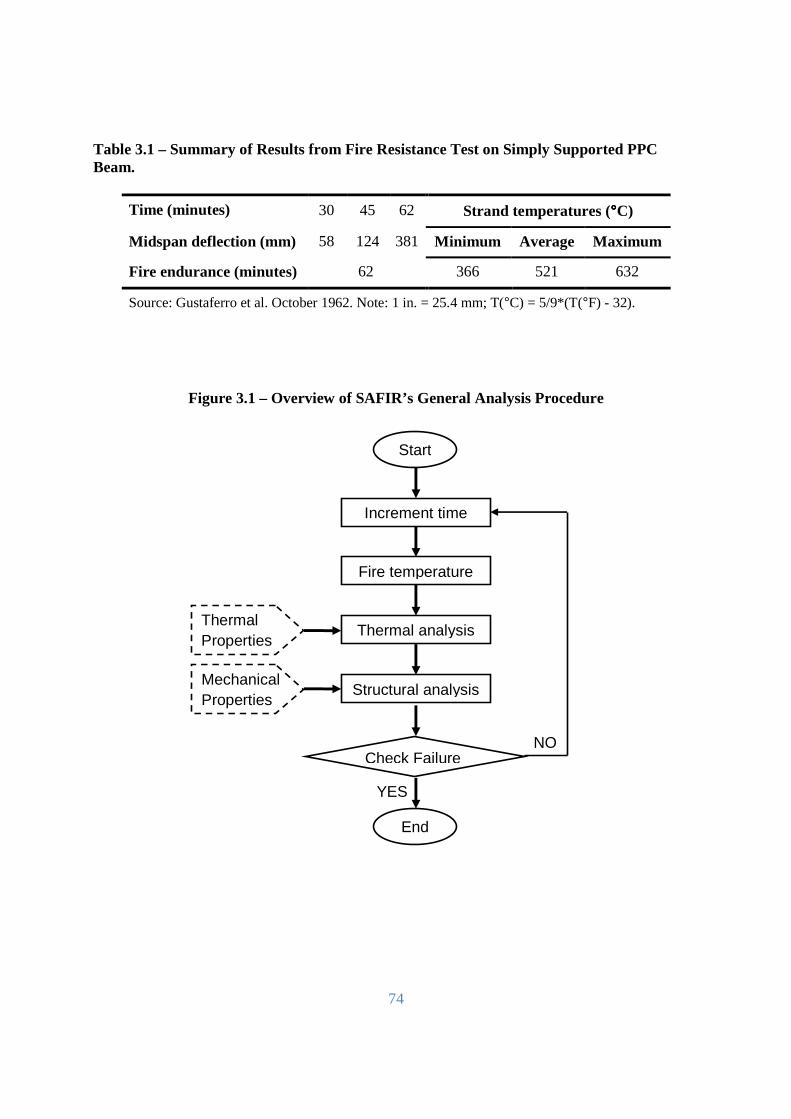
74
Table 3.1 – Summary of Results from Fire Resistance Test on Simply Supported PPC Beam.
Figure 3.1 – Overview of SAFIR’s General Analysis Procedure
Time (minutes) 30 45 62 Strand temperatures (°°°°C)
Midspan deflection (mm) 58 124 381 Minimum Average Maximum
Fire endurance (minutes) 62 366 521 632
Source: Gustaferro et al. October 1962. Note: 1 in. = 25.4 mm; T(°C) = 5/9*(T(°F) - 32).
NO
YES
Start
Increment time
Fire temperature
Thermal analysis
Structural analysis
Check Failure
End
Thermal Properties
Mechanical Properties
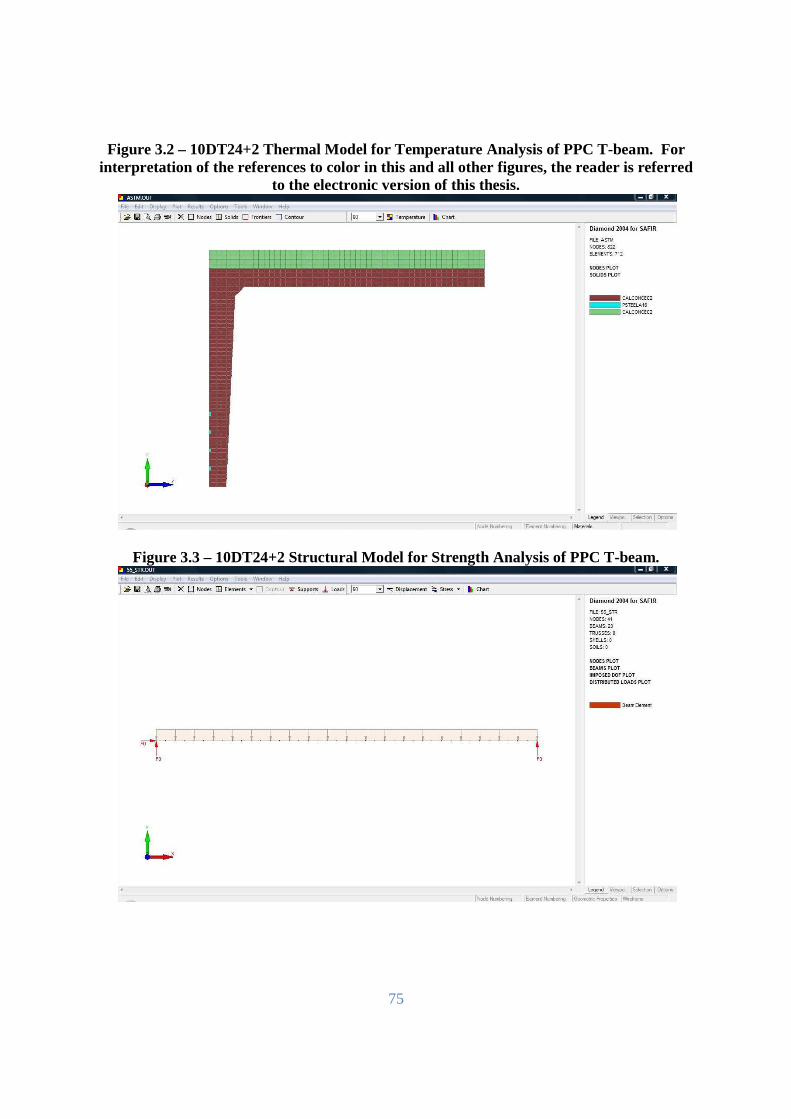
75
Figure 3.2 – 10DT24+2 Thermal Model for Temperature Analysis of PPC T-beam. For interpretation of the references to color in this and all other figures, the reader is referred
to the electronic version of this thesis.
Figure 3.3 – 10DT24+2 Structural Model for Strength Analysis of PPC T-beam.
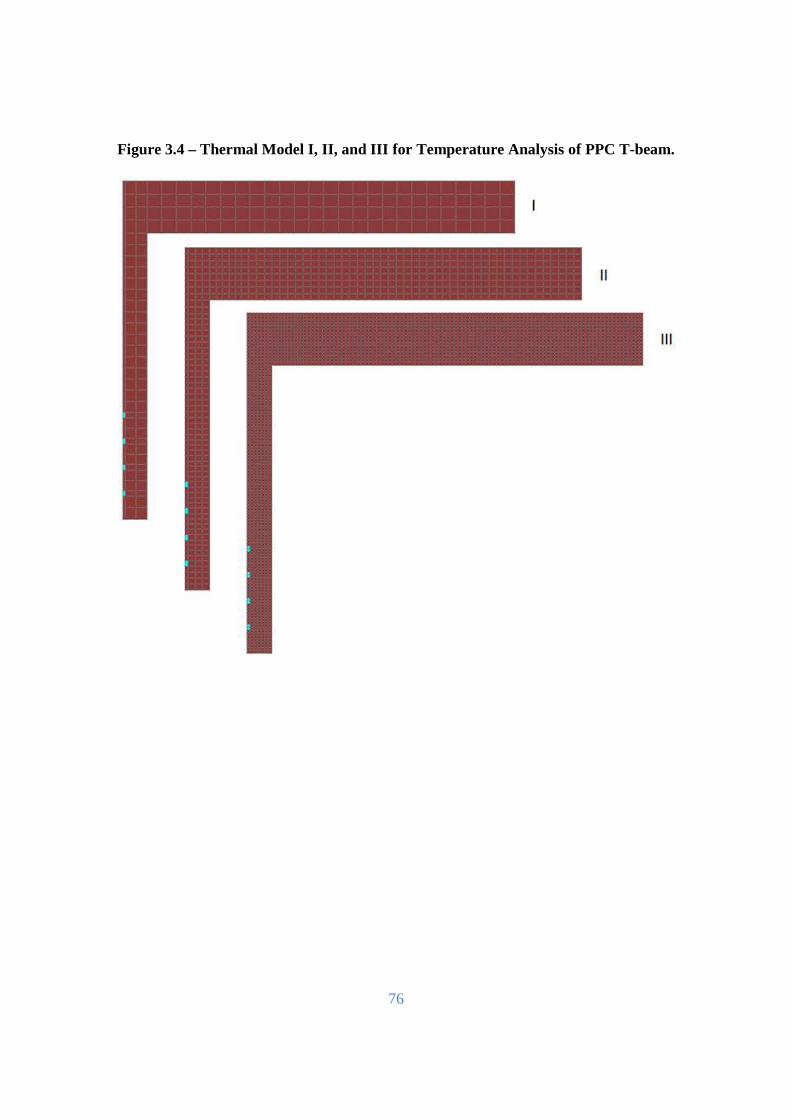
76
Figure 3.4 – Thermal Model I, II, and III for Temperature Analysis of PPC T-beam.
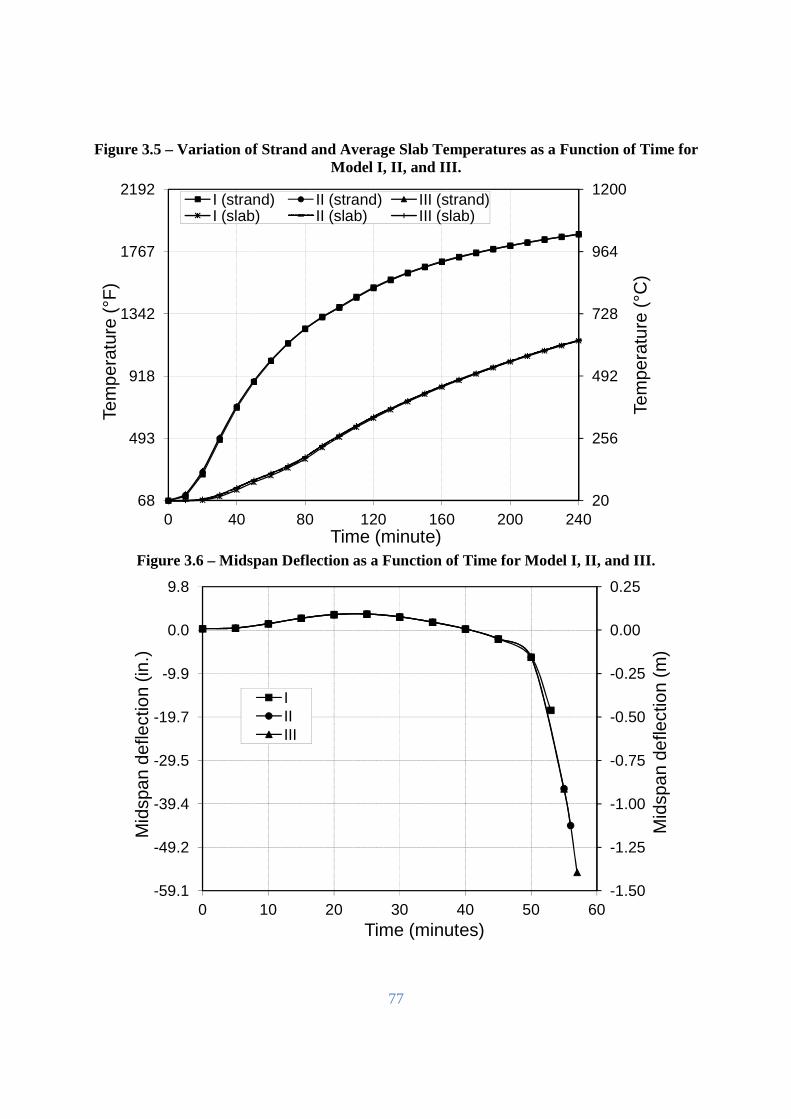
77
Figure 3.5 – Variation of Strand and Average Slab Temperatures as a Function of Time for Model I, II, and III.
Figure 3.6 – Midspan Deflection as a Function of Time for Model I, II, and III.
20
256
492
728
964
1200
68
493
918
1342
1767
2192
0 40 80 120 160 200 240
Tem
pera
ture
(°C
)
Tem
pera
ture
(°F
)
Time (minute)
I (strand) II (strand) III (strand)I (slab) II (slab) III (slab)
-1.50
-1.25
-1.00
-0.75
-0.50
-0.25
0.00
0.25
-59.1
-49.2
-39.4
-29.5
-19.7
-9.9
0.0
9.8
0 10 20 30 40 50 60
Mid
span
def
lect
ion
(m)
Mid
span
def
lect
ion
(in.)
Time (minutes)
IIIIII
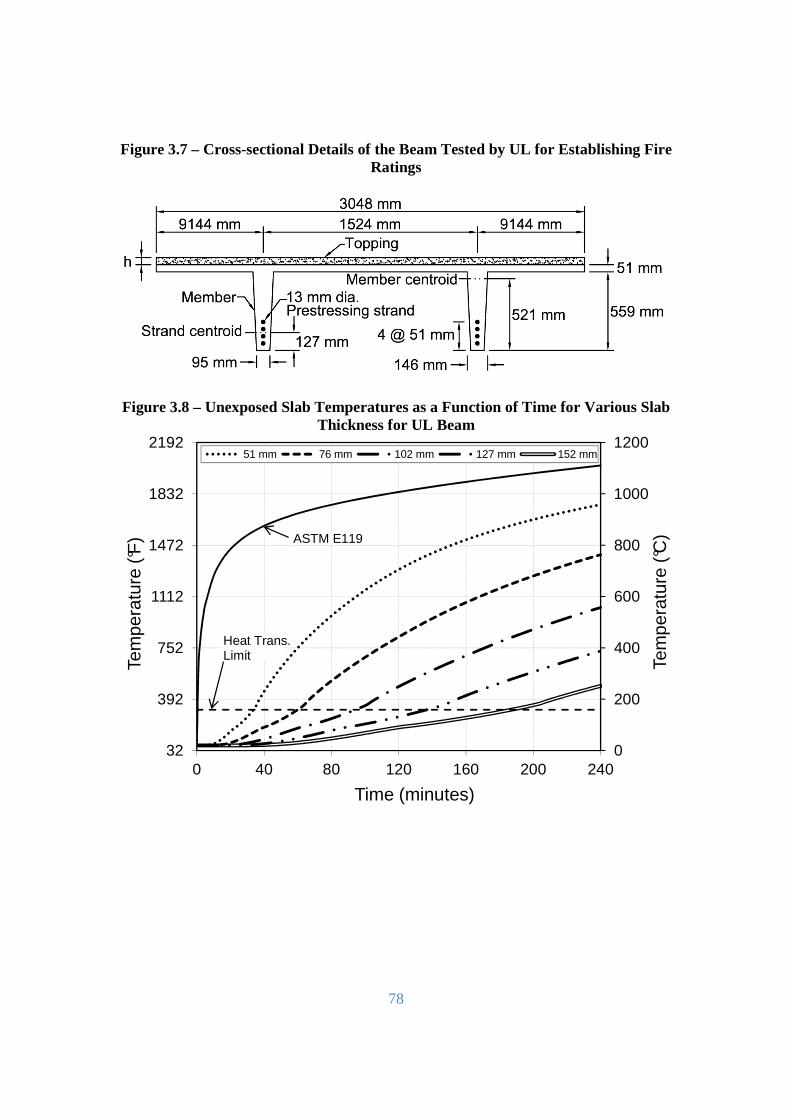
78
Figure 3.7 – Cross-sectional Details of the Beam Tested by UL for Establishing Fire Ratings
Figure 3.8 – Unexposed Slab Temperatures as a Function of Time for Various Slab Thickness for UL Beam
0
200
400
600
800
1000
1200
32
392
752
1112
1472
1832
2192
0 40 80 120 160 200 240
Tem
pera
ture
(°C
)
Tem
pera
ture
(°F
)
Time (minutes)
51 mm 76 mm 102 mm 127 mm 152 mm
ASTM E119
Heat Trans.Limit

79
Figure 3.9 – Comparison of Predicted Fire Resistance (SAFIR) with Measured Test Data.
Figure 3.10 – Cross-sectional details of Gusaferro et. al. Beam used in Validation Study.
25 51 76 102 127 152 178
0
40
80
120
160
200
240
1 2 3 4 5 6 7
Slab thickness (mm)
Fire
res
ista
nce
(min
)
Slab thickness (in.)
Predicted (SAFIR)Test data
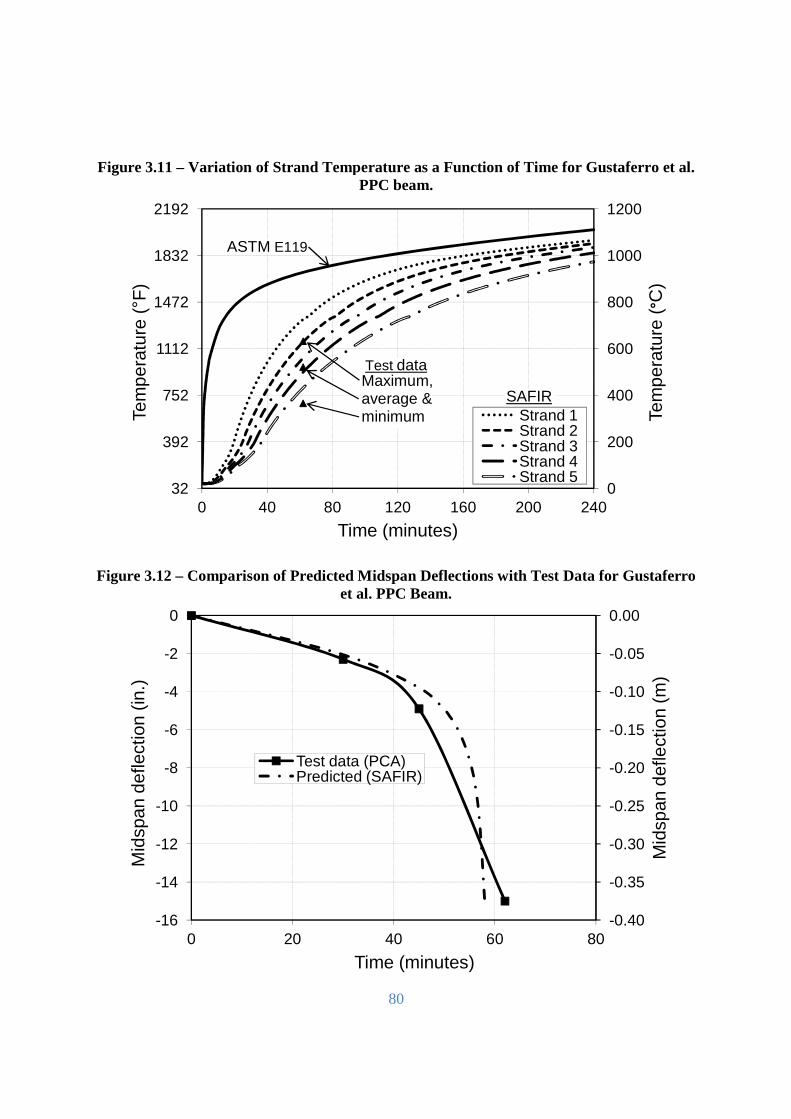
Figure 3.11 – Variation of Strand Temperature as a Function of Time for Gustaferro et al.
Figure 3.12 – Comparison of Predicted Midspan Deflections with
32
392
752
1112
1472
1832
2192
0 40
Tem
pera
ture
(°F
)
ASTM E119
-16
-14
-12
-10
-8
-6
-4
-2
0
0
Mid
span
def
lect
ion
(in.)
80
Variation of Strand Temperature as a Function of Time for Gustaferro et al.
PPC beam.
Comparison of Predicted Midspan Deflections with Test Data for Gustaferro et al. PPC Beam.
80 120 160 200
Time (minutes)
Strand 1Strand 2Strand 3Strand 4Strand 5
SAFIR
Test data
E119
Maximum,average &minimum
20 40 60
Time (minutes)
Test data (PCA)Predicted (SAFIR)
Variation of Strand Temperature as a Function of Time for Gustaferro et al.
Test Data for Gustaferro
0
200
400
600
800
1000
1200
240
Tem
pera
ture
(°C
)
Strand 1Strand 2Strand 3Strand 4Strand 5
-0.40
-0.35
-0.30
-0.25
-0.20
-0.15
-0.10
-0.05
0.00
80
Mid
span
def
lect
ion
(m)

81
Chapter 4
4. Parametric Studies 4.1. General
To study the influence of various factors on the fire response of precast/prestressed concrete
(PPC) double T-beams, a parametric study was carried out using SAFIR. For the study, two
cross-sections, namely 10DT24+2 and 12DT32+2, were selected from the PCI Design Handbook
(2004). The sections were selected to represent a typical PPC beam found in a parking
garage/building structure. The factors considered in the parametric study are fire scenario,
concrete compressive strength, axial restraint, load intensity, aggregate type, and failure criteria.
Results from the SAFIR analysis were applied to evaluate failure and the time to failure was
taken as fire resistance. For all parameters, except when the failure criterion was the focus,
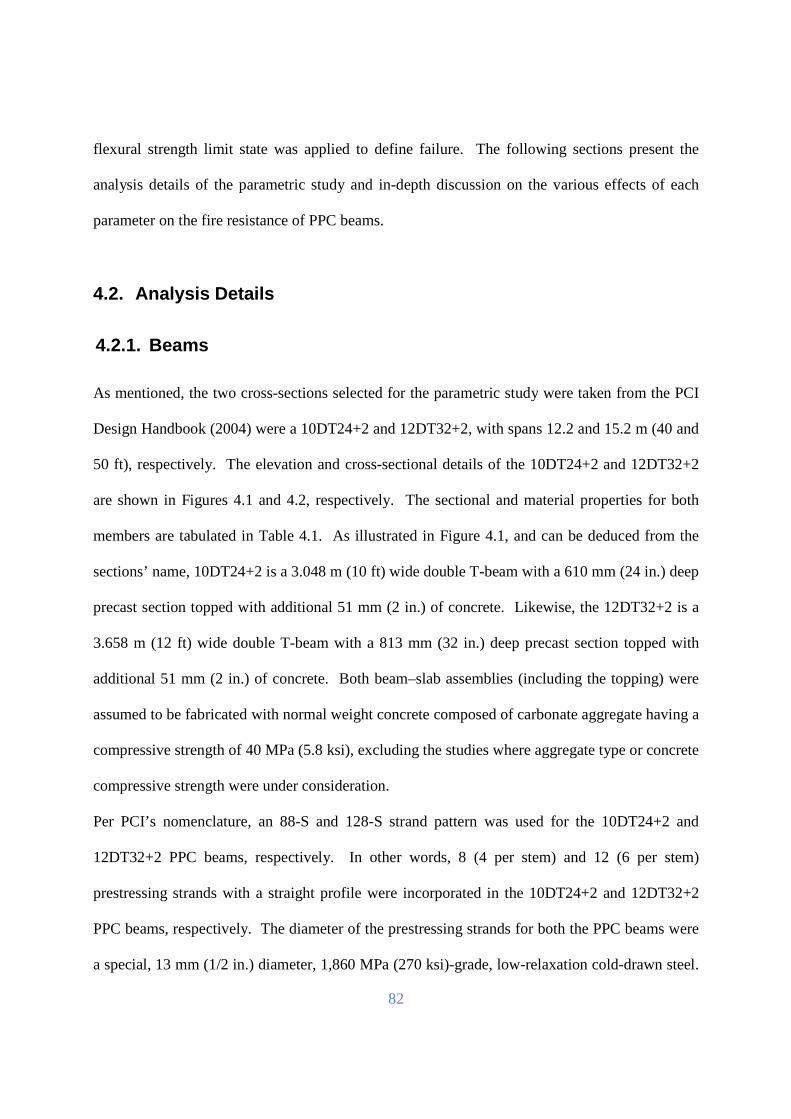
82
flexural strength limit state was applied to define failure. The following sections present the
analysis details of the parametric study and in-depth discussion on the various effects of each
parameter on the fire resistance of PPC beams.
4.2. Analysis Details
4.2.1. Beams
As mentioned, the two cross-sections selected for the parametric study were taken from the PCI
Design Handbook (2004) were a 10DT24+2 and 12DT32+2, with spans 12.2 and 15.2 m (40 and
50 ft), respectively. The elevation and cross-sectional details of the 10DT24+2 and 12DT32+2
are shown in Figures 4.1 and 4.2, respectively. The sectional and material properties for both
members are tabulated in Table 4.1. As illustrated in Figure 4.1, and can be deduced from the
sections’ name, 10DT24+2 is a 3.048 m (10 ft) wide double T-beam with a 610 mm (24 in.) deep
precast section topped with additional 51 mm (2 in.) of concrete. Likewise, the 12DT32+2 is a
3.658 m (12 ft) wide double T-beam with a 813 mm (32 in.) deep precast section topped with
additional 51 mm (2 in.) of concrete. Both beam–slab assemblies (including the topping) were
assumed to be fabricated with normal weight concrete composed of carbonate aggregate having a
compressive strength of 40 MPa (5.8 ksi), excluding the studies where aggregate type or concrete
compressive strength were under consideration.
Per PCI’s nomenclature, an 88-S and 128-S strand pattern was used for the 10DT24+2 and
12DT32+2 PPC beams, respectively. In other words, 8 (4 per stem) and 12 (6 per stem)
prestressing strands with a straight profile were incorporated in the 10DT24+2 and 12DT32+2
PPC beams, respectively. The diameter of the prestressing strands for both the PPC beams were
a special, 13 mm (1/2 in.) diameter, 1,860 MPa (270 ksi)-grade, low-relaxation cold-drawn steel.
83
Each prestressing strand was assumed to be stressed to 1,172 MPa (170 ksi) to account for the
initial jacking force (0.75 fpu where fpu is the ultimate tensile strength of strand) and minimum
stress loss 207 MPa (30 ksi) as per the provisions specified in PCI Design Handbook (2004) to
account for all losses.
The 10DT24+2 and 12DT32+2 PPC beams were subjected to a uniformly distributed live load of
2.4 kPa (50 psf). This load was selected in accordance with the ASCE 7-05 (2005) design loads
for a parking garage/building. The uniformly distributed dead load for each beam was
comprised only of the self weight of concrete and calculated to be 3.4 and 4.1 kPa (72 and 85
psf) for the 10DT24+2 and 12DT32+2 PPC beams, respectively. The loads were evaluated
based on a load combination of U = 1.2D + 0.5L under fire conditions. The loading resulted in
load ratios 37% and 41% for the 10DT24+2 and 12DT32+2, respectively. See Appendix D for
the load ratio calculations.
4.2.2. SAFIR Models
In this section, the specifics (discretization, boundary conditions, and pertinent assumptions)
regarding the SAFIR models used to predict fire response of 10DT24+2 and 12DT32+2 PPC
beams for the parametric study are divulged. The general procedure used to perform the
thermal-structural analysis in SAFIR is as described in Chapter 3. In addition, the level of
refinement for the discretization of these models is based on the finding s of sensitivity analysis,
which is also presented in Chapter 3. Below, is a brief overview of thermal and structural
analysis models, including the underlying assumptions, developed to capture the fire response of
the PPC beams in the parametric study.
84
In the thermal model, the PPC beams’ cross-section is modeled with three different materials
(concrete topping, member, and steel prestressing strands) and discretized into triangular and
quadrilateral solid elements, as illustrated for 10DT24+2 PPC beam in Figure 3.2 of Chapter 3.
A total of 712 elements and 822 nodes were used for the 10DT24+2 thermal analysis and 1078
elements and 1209 nodes were used to discretize the 12DT32+2 thermal model. A concrete
moisture content of 1% by weight was assumed for the normal weight concrete comprised of
carbonate aggregates. Three-sided fire exposure was utilized for every fire scenario considered
to emulate a PPC beam that is placed side-by-side with other beams in a structure that is exposed
to a burning fire from below. Therefore, the boundary conditions for the thermal model are
based on ambient temperatures at the top and side surfaces of the top slab, while the remaining
surfaces were subjected to a constant uniform temperature distribution based on the time-
temperature relationship.
The structural models for 10DT24+2 and 12DT32+2 PPC beams were discretized into 20 beam
elements, each with two integration points, for a total of 41 nodes. The PPC beams were
modeled as simply supported, with a pin support (vertical and horizontal translations restrained)
at one end and a roller support (vertical translations restrained) at the other end. In addition to
these boundary conditions, when investigating the influence of axial restraint, a truss element
was introduced into the analysis to provide variable axial restraint. It was assumed the concrete
topping and member act monolithically, based on the assumption that adequate shear
reinforcement is provided to tie the topping to the member. A residual stress is applied in the
thermal model to include the effects of prestressing, which is translated into the structural model
through longitudinal strains based on a fiber based approach.
85
4.2.3. High Temperature Material Properties
For the analysis, high temperature properties of concrete and prestressing steel, per Eurocode 2
(2004), are used. These constitutive material models are preprogrammed into SAFIR. Details
regarding the nature of these properties are presented in chapter 2 where in-depth discussion is
provided on each individual material property. In addition, Appendix C provides empirical
relationships for each material property and Appendix D provides an illustration of the thermal
(thermal conductivity, specific heat, density, and thermal expansion) and mechanical properties
for both materials accounted for in the parametric study.
4.2.4. Failure Criteria
Results from the SAFIR analysis were applied to evaluate failure and the time to failure was
taken as fire resistance. For all parameters, except when the failure criterion is the focus,
flexural strength limit state was applied to define failure. This limit state was selected for the
parametric study because it represents the most probable and realistic failure mode for a PPC
beam. No consideration was given to shear failure, as it assumed this failure mode is unlikely if
adequate shear reinforcement is provided. A summary of the fire resistance times is provided in
Table 4.2. Also included in this table are the fire resistance times from the prescriptive-based
failure limit states, heat transmission (unexposed slab surface temperature) and critical strand
temperatures, determined for the failure criteria parameter.
86
4.3. Factors Governing Fire Resistance
The literature review identified the critical factors that govern the fire resistance of PPC beams
are fire scenario, concrete compressive strength, axial restraint, load intensity, aggregate type,
and failure criteria. Based on these factors and the assumptions mentioned above, a set of
numerical studies were carried out using SAFIR to study the influence of each of these factors on
the fire resistance of PPC beams. The following sections present in-depth discussion on the
various effects of each parameter on the fire resistance of PPC beams.
4.3.1. Effect of Fire Scenario
The effect of varying the fire scenario on fire resistance was evaluated by subjecting the
10DT24+2 and 12DT32+2 PPC beams to five different fire scenarios. Figure 4.3 shows two
standard fires (ASTM E119 (2008) and ASTM E1529 (1993) hydrocarbon fire) and three
parametric (design) fires used in the analysis. The current provisions for fire ratings are based on
fire tests carried out under ASTM E119 (or ISO 834) fire exposure. There are many drawbacks
with this standard fire exposure including the lack of a decay (cooling) phase.
In order to develop a wide range of realistic fire scenarios for the analysis, three additional
parametric time–temperature relationships were generated through the guidelines provided in
Eurocode 1 (2002). The fire scenario in a room is a function of fuel load and ventilation
characteristics of a compartment. For generating these design fires, ventilation factors 0.03,
0.05, and 0.07 m-1/2 (0.05, 0.09, and 0.13 ft-1/2) and fuel loads 125, 200, and 400 MJ/m2 (11,007,
17,611, and 35,222 Btu/ft2), respectively, were assumed. The three different cases were selected
to represent mild, medium, and severe fires, respectively. The medium and severe fires were
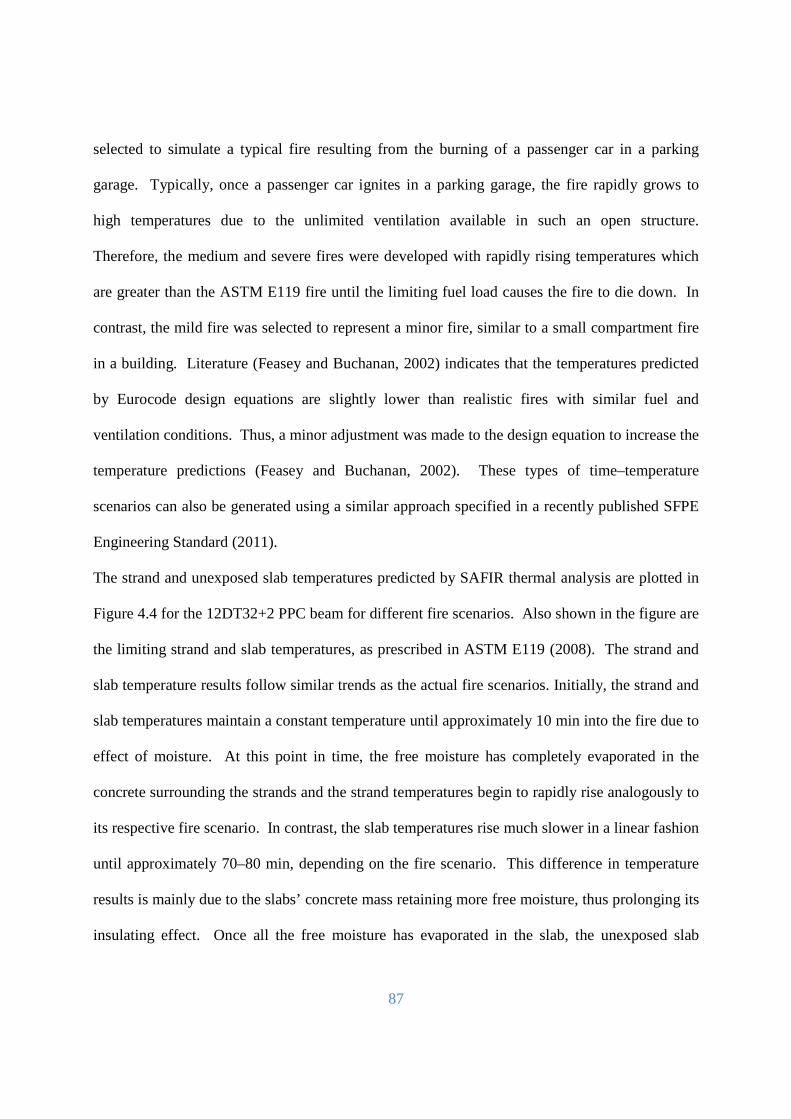
87
selected to simulate a typical fire resulting from the burning of a passenger car in a parking
garage. Typically, once a passenger car ignites in a parking garage, the fire rapidly grows to
high temperatures due to the unlimited ventilation available in such an open structure.
Therefore, the medium and severe fires were developed with rapidly rising temperatures which
are greater than the ASTM E119 fire until the limiting fuel load causes the fire to die down. In
contrast, the mild fire was selected to represent a minor fire, similar to a small compartment fire
in a building. Literature (Feasey and Buchanan, 2002) indicates that the temperatures predicted
by Eurocode design equations are slightly lower than realistic fires with similar fuel and
ventilation conditions. Thus, a minor adjustment was made to the design equation to increase the
temperature predictions (Feasey and Buchanan, 2002). These types of time–temperature
scenarios can also be generated using a similar approach specified in a recently published SFPE
Engineering Standard (2011).
The strand and unexposed slab temperatures predicted by SAFIR thermal analysis are plotted in
Figure 4.4 for the 12DT32+2 PPC beam for different fire scenarios. Also shown in the figure are
the limiting strand and slab temperatures, as prescribed in ASTM E119 (2008). The strand and
slab temperature results follow similar trends as the actual fire scenarios. Initially, the strand and
slab temperatures maintain a constant temperature until approximately 10 min into the fire due to
effect of moisture. At this point in time, the free moisture has completely evaporated in the
concrete surrounding the strands and the strand temperatures begin to rapidly rise analogously to
its respective fire scenario. In contrast, the slab temperatures rise much slower in a linear fashion
until approximately 70–80 min, depending on the fire scenario. This difference in temperature
results is mainly due to the slabs’ concrete mass retaining more free moisture, thus prolonging its
insulating effect. Once all the free moisture has evaporated in the slab, the unexposed slab
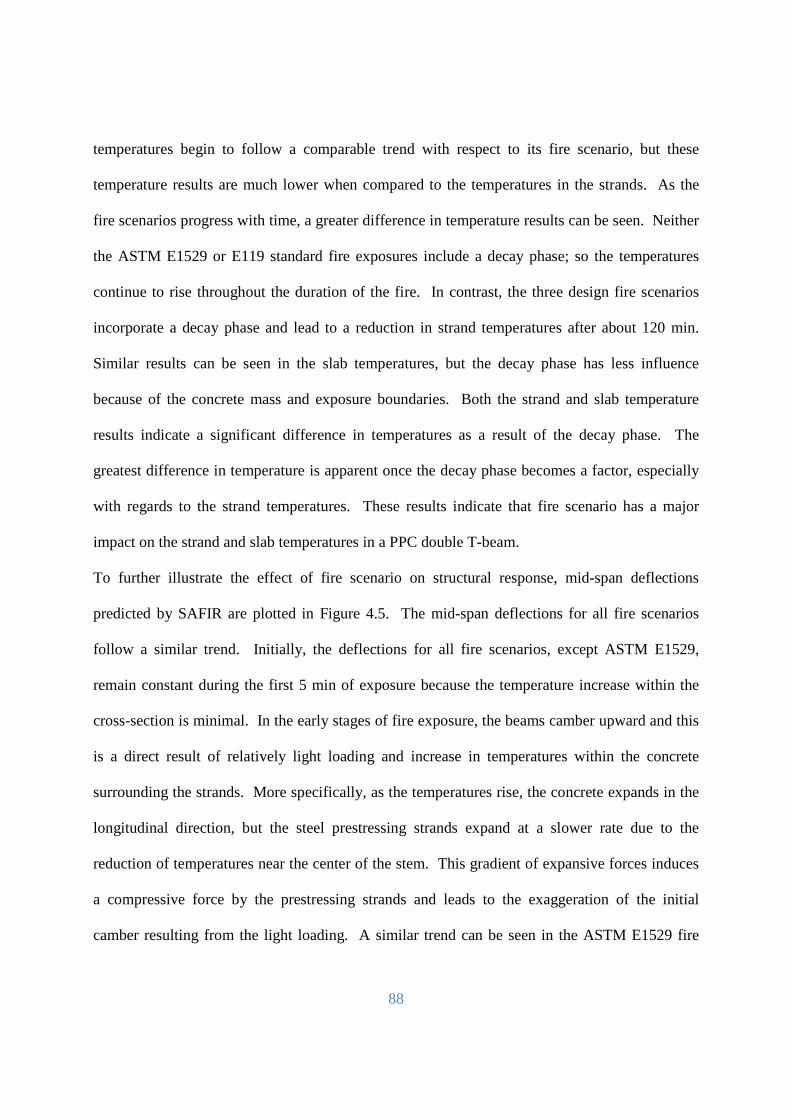
88
temperatures begin to follow a comparable trend with respect to its fire scenario, but these
temperature results are much lower when compared to the temperatures in the strands. As the
fire scenarios progress with time, a greater difference in temperature results can be seen. Neither
the ASTM E1529 or E119 standard fire exposures include a decay phase; so the temperatures
continue to rise throughout the duration of the fire. In contrast, the three design fire scenarios
incorporate a decay phase and lead to a reduction in strand temperatures after about 120 min.
Similar results can be seen in the slab temperatures, but the decay phase has less influence
because of the concrete mass and exposure boundaries. Both the strand and slab temperature
results indicate a significant difference in temperatures as a result of the decay phase. The
greatest difference in temperature is apparent once the decay phase becomes a factor, especially
with regards to the strand temperatures. These results indicate that fire scenario has a major
impact on the strand and slab temperatures in a PPC double T-beam.
To further illustrate the effect of fire scenario on structural response, mid-span deflections
predicted by SAFIR are plotted in Figure 4.5. The mid-span deflections for all fire scenarios
follow a similar trend. Initially, the deflections for all fire scenarios, except ASTM E1529,
remain constant during the first 5 min of exposure because the temperature increase within the
cross-section is minimal. In the early stages of fire exposure, the beams camber upward and this
is a direct result of relatively light loading and increase in temperatures within the concrete
surrounding the strands. More specifically, as the temperatures rise, the concrete expands in the
longitudinal direction, but the steel prestressing strands expand at a slower rate due to the
reduction of temperatures near the center of the stem. This gradient of expansive forces induces
a compressive force by the prestressing strands and leads to the exaggeration of the initial
camber resulting from the light loading. A similar trend can be seen in the ASTM E1529 fire
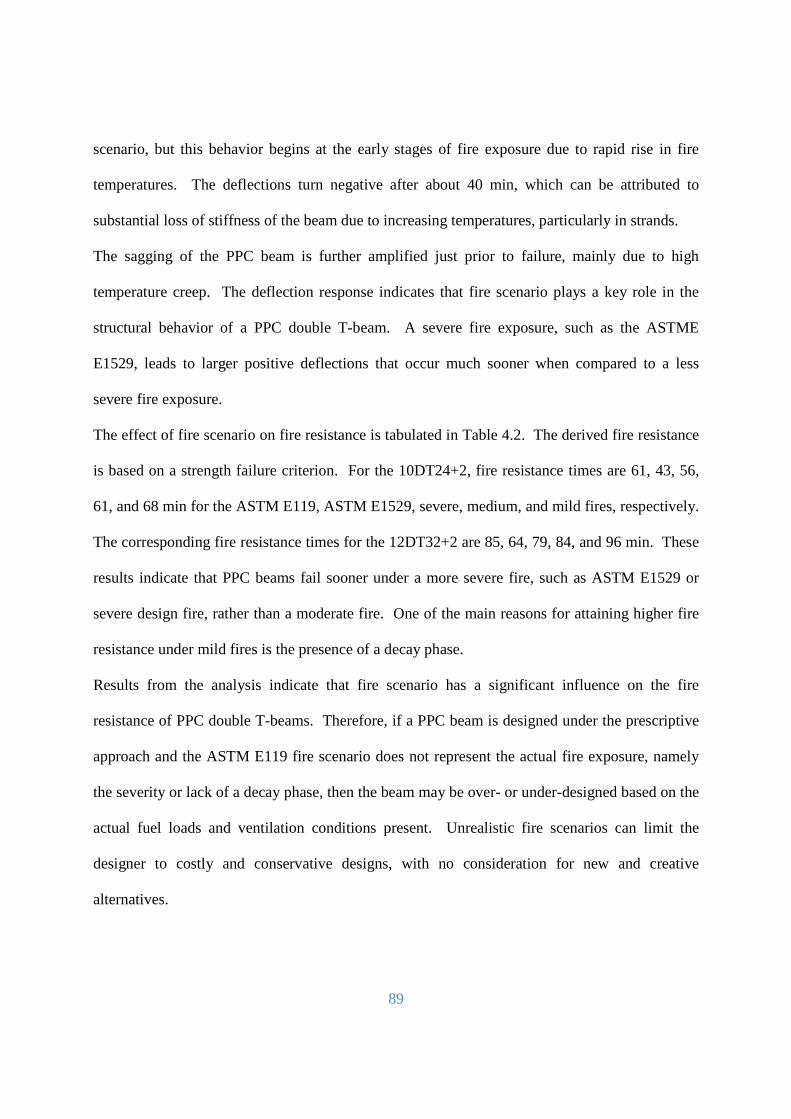
89
scenario, but this behavior begins at the early stages of fire exposure due to rapid rise in fire
temperatures. The deflections turn negative after about 40 min, which can be attributed to
substantial loss of stiffness of the beam due to increasing temperatures, particularly in strands.
The sagging of the PPC beam is further amplified just prior to failure, mainly due to high
temperature creep. The deflection response indicates that fire scenario plays a key role in the
structural behavior of a PPC double T-beam. A severe fire exposure, such as the ASTME
E1529, leads to larger positive deflections that occur much sooner when compared to a less
severe fire exposure.
The effect of fire scenario on fire resistance is tabulated in Table 4.2. The derived fire resistance
is based on a strength failure criterion. For the 10DT24+2, fire resistance times are 61, 43, 56,
61, and 68 min for the ASTM E119, ASTM E1529, severe, medium, and mild fires, respectively.
The corresponding fire resistance times for the 12DT32+2 are 85, 64, 79, 84, and 96 min. These
results indicate that PPC beams fail sooner under a more severe fire, such as ASTM E1529 or
severe design fire, rather than a moderate fire. One of the main reasons for attaining higher fire
resistance under mild fires is the presence of a decay phase.
Results from the analysis indicate that fire scenario has a significant influence on the fire
resistance of PPC double T-beams. Therefore, if a PPC beam is designed under the prescriptive
approach and the ASTM E119 fire scenario does not represent the actual fire exposure, namely
the severity or lack of a decay phase, then the beam may be over- or under-designed based on the
actual fuel loads and ventilation conditions present. Unrealistic fire scenarios can limit the
designer to costly and conservative designs, with no consideration for new and creative
alternatives.
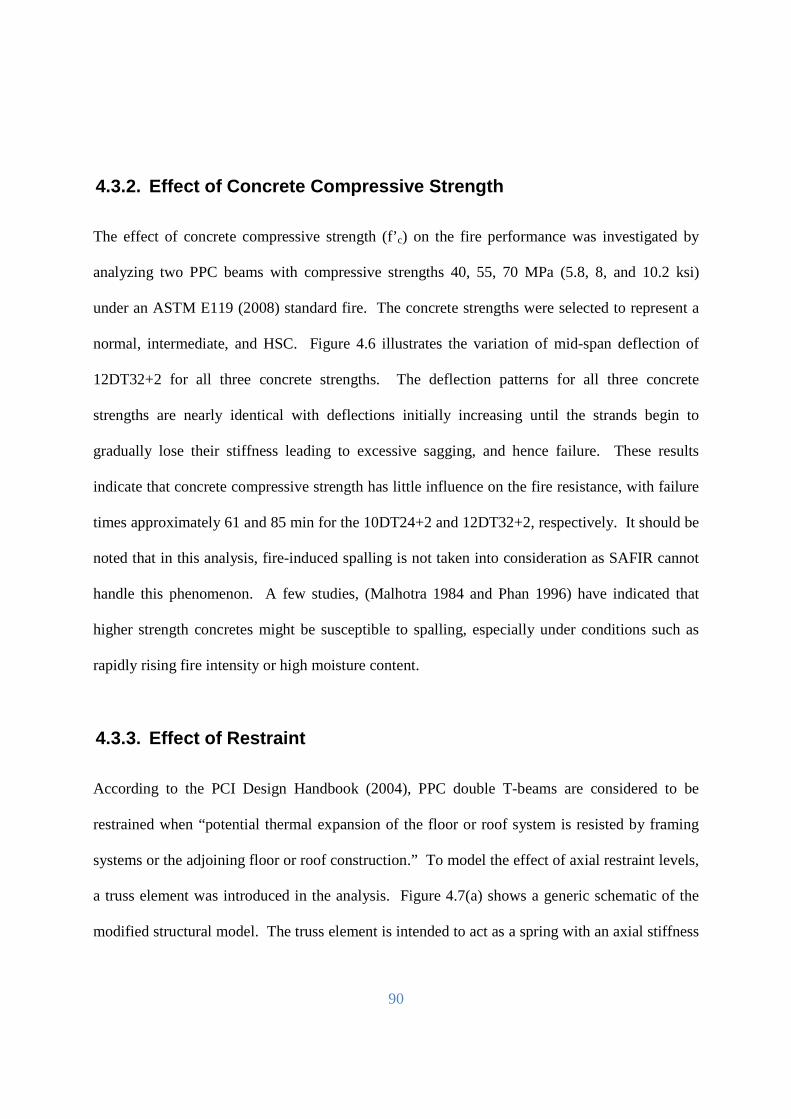
90
4.3.2. Effect of Concrete Compressive Strength
The effect of concrete compressive strength (f’c) on the fire performance was investigated by
analyzing two PPC beams with compressive strengths 40, 55, 70 MPa (5.8, 8, and 10.2 ksi)
under an ASTM E119 (2008) standard fire. The concrete strengths were selected to represent a
normal, intermediate, and HSC. Figure 4.6 illustrates the variation of mid-span deflection of
12DT32+2 for all three concrete strengths. The deflection patterns for all three concrete
strengths are nearly identical with deflections initially increasing until the strands begin to
gradually lose their stiffness leading to excessive sagging, and hence failure. These results
indicate that concrete compressive strength has little influence on the fire resistance, with failure
times approximately 61 and 85 min for the 10DT24+2 and 12DT32+2, respectively. It should be
noted that in this analysis, fire-induced spalling is not taken into consideration as SAFIR cannot
handle this phenomenon. A few studies, (Malhotra 1984 and Phan 1996) have indicated that
higher strength concretes might be susceptible to spalling, especially under conditions such as
rapidly rising fire intensity or high moisture content.
4.3.3. Effect of Restraint
According to the PCI Design Handbook (2004), PPC double T-beams are considered to be
restrained when “potential thermal expansion of the floor or roof system is resisted by framing
systems or the adjoining floor or roof construction.” To model the effect of axial restraint levels,
a truss element was introduced in the analysis. Figure 4.7(a) shows a generic schematic of the
modified structural model. The truss element is intended to act as a spring with an axial stiffness
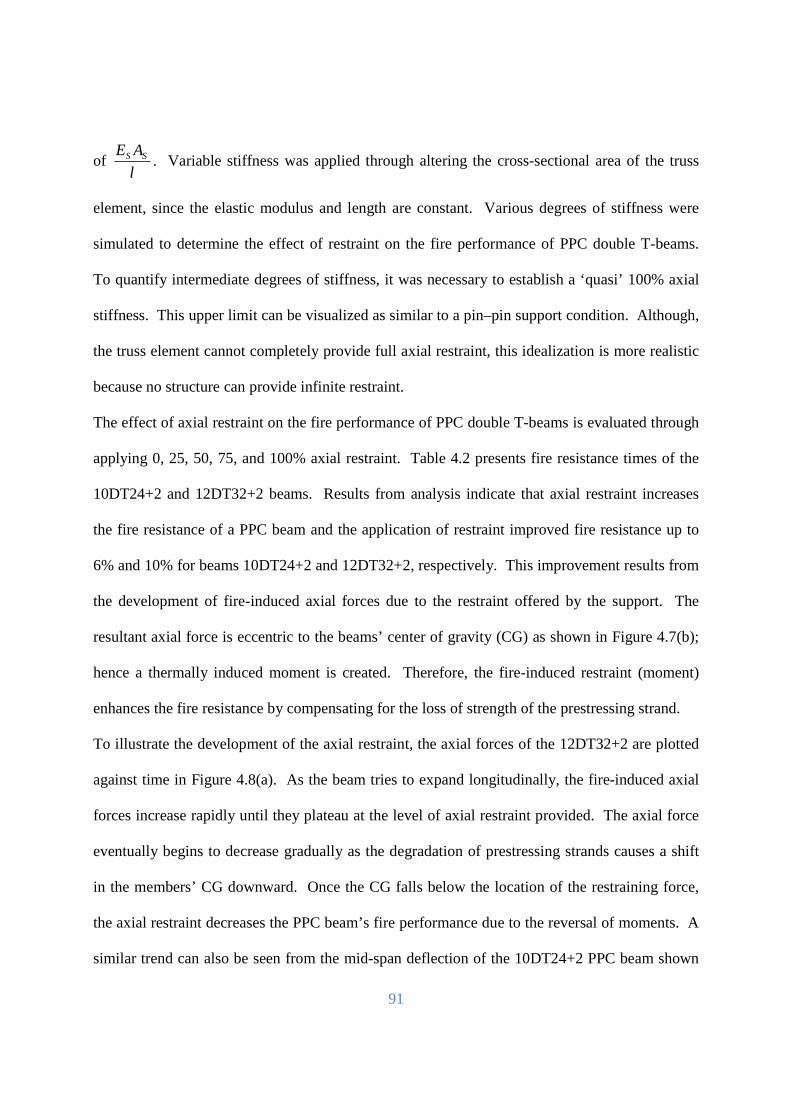
91
of l
AE SS . Variable stiffness was applied through altering the cross-sectional area of the truss
element, since the elastic modulus and length are constant. Various degrees of stiffness were
simulated to determine the effect of restraint on the fire performance of PPC double T-beams.
To quantify intermediate degrees of stiffness, it was necessary to establish a ‘quasi’ 100% axial
stiffness. This upper limit can be visualized as similar to a pin–pin support condition. Although,
the truss element cannot completely provide full axial restraint, this idealization is more realistic
because no structure can provide infinite restraint.
The effect of axial restraint on the fire performance of PPC double T-beams is evaluated through
applying 0, 25, 50, 75, and 100% axial restraint. Table 4.2 presents fire resistance times of the
10DT24+2 and 12DT32+2 beams. Results from analysis indicate that axial restraint increases
the fire resistance of a PPC beam and the application of restraint improved fire resistance up to
6% and 10% for beams 10DT24+2 and 12DT32+2, respectively. This improvement results from
the development of fire-induced axial forces due to the restraint offered by the support. The
resultant axial force is eccentric to the beams’ center of gravity (CG) as shown in Figure 4.7(b);
hence a thermally induced moment is created. Therefore, the fire-induced restraint (moment)
enhances the fire resistance by compensating for the loss of strength of the prestressing strand.
To illustrate the development of the axial restraint, the axial forces of the 12DT32+2 are plotted
against time in Figure 4.8(a). As the beam tries to expand longitudinally, the fire-induced axial
forces increase rapidly until they plateau at the level of axial restraint provided. The axial force
eventually begins to decrease gradually as the degradation of prestressing strands causes a shift
in the members’ CG downward. Once the CG falls below the location of the restraining force,
the axial restraint decreases the PPC beam’s fire performance due to the reversal of moments. A
similar trend can also be seen from the mid-span deflection of the 10DT24+2 PPC beam shown
92
in Figure 4.8(b). Notice how the deflection of the axial restrained beam shifts gradually from
positive to negative once the prestressing strands begin to lose significant stiffness. However,
when the unrestrained beam starts to lose significant stiffness, there is no external effect to delay
its failure. Thus, axial restraint can improve the fire resistance of PPC beams.
The above results suggest axial restraint can improve the fire resistance of a PPC double T-beam.
However, it should be noted that these findings only represent a single type of support condition.
In reality, numerous support configurations are possible in structural systems and this can
influence the vertical location of the restraining force and ultimately the fire performance of a
PPC beam. For instance, if the resultant restraining force is located at the deck of a PPC double
T-beam, the thermally induced moment can have a negative effect and may lead to early failure.
Also, each building is unique and exhibits variable stiffness characteristics. Such factors are not
taken into consideration in the current approach of evaluating fire ratings. Another shortcoming
of the current prescriptive fire provisions is the lack of a more specific definition to distinguish
the difference between flexural and axial restrained beams. As reported in Dwaikat and Kodur
(2008), these two restraint conditions exhibit different behaviors; the flexural restrained beams
benefit from the redistribution of moments, while axial restrained beams rely on the location and
magnitude of the restraining force. In order to accurately assess the effects of restraining forces
of a PPC beam, the type of restraint, support condition (vertical location of support), and
stiffness should be considered on a case-by-case basis.
4.3.4. Effect of Load Intensity
Previous studies (Gustaferro and Carlson 1962 and Selv aggio and Carlson 1964) have shown
that load ratio has a significant influence on fire resistance of concrete members. The load ratio
93
is defined as the ratio of the expected load effect (moments) under fire conditions to the nominal
(flexural) capacity under ambient conditions.
The fire resistance analysis was carried out by subjecting the two PPC beams to three load ratios,
namely 30%, 50%, and 70%. Results plotted in Figure 4.9(a) and tabulated in Table 4.2 show
that fire resistance decreases with an increasing load ratio. The fire resistance times are 57, 54,
and 45 min for the 10DT24+2 and 81, 78, and 64 min for the 12DT32+2, respectively. The
effect of load intensity on fire response is further illustrated through a mid-span deflection plot
for the PPC beam 10DT24+2 in Figure 4.9(b). It can be seen that the mid-span deflection of the
30% and 50% load ratio scenarios follow a similar trend to the previous results for an
unrestrained member, because the loading is very similar. However, in the case of 70% load
ratio, no cambering effects are noticed and the beams’ deflections gradually decrease due to high
level of load. These results indicate that the load intensity has a significant influence on the fire
performance of PPC double T-beams. In spite of these trends, tabulated methods in codes and
standards prescribe fire ratings of a structural member based on the sectional dimensions,
concrete cover, and aggregate type, with no consideration for load intensity. Therefore, if
tabulated approaches are utilized to prescribe a fire rating for highly loaded PPC beams, it may
not lead to realistic designs.
4.3.5. Effect of Aggregate Type
The aggregate type used in the concrete mix has an influence on the fire resistance of concrete
members. The two most common aggregates used in concrete are siliceous and carbonate
aggregates. Siliceous aggregate mainly consists of quartzite, granite, and basalt, while carbonate
aggregates are primarily composed of either limestone or dolomite. The fire resistance analysis
94
is carried out by analyzing two PPC beams fabricated from siliceous and carbonate aggregate
concrete under standard fire exposure. Results from the analysis indicate that carbonate
aggregate concrete provides better fire resistance than siliceous aggregate concrete. For instance,
the fire resistance of the 10DT24+2 increases from 56 to 61 min, while the 12DT32+2 beam fire
resistance increases from 71 to 81 min.
The effect of aggregate type on fire response of PPC beams is illustrated in Figure 4.10, which
shows the mid-span deflection as a function of time for a 12DT32+2 beam. For both types of
aggregates, the deflection initially increases until the strands begin to gradually lose their
stiffness, leading to excessive sagging and then failure. The deflections for a siliceous aggregate
concrete beam produce larger camber effects and lead to sagging much sooner, hence a lower
fire resistance. This difference in the beam’s behavior is primarily due to the variation in high
temperature properties of the two concrete types. Carbonate aggregate concrete has a much
higher heat capacity than siliceous aggregate concrete in the 650–700°C (1202–1292°F)
temperature range due to disassociation of dolomite as a result of an endothermic reaction. This
reaction results in very high heat capacity, about 10 times higher than siliceous aggregate
concrete, and is beneficial to fire resistance. In addition, carbonate aggregate has slightly lower
thermal conductivity when compared to siliceous aggregates. Furthermore, carbonate aggregate
concrete has lower thermal elongation and better resistance to strength loss. These properties of
carbonate aggregates produce lower temperatures, deflections, and greater fire resistance. Both
Eurocode and ASCE provisions recognize these differences in properties, but in a different
manner. The Eurocode distinguishes these differences through mechanical properties, while
ASCE relies on the thermal properties to make the distinction between the two aggregate types.

95
Therefore, the effect of aggregates must be taken into consideration when designing for the fire
resistance of PPC beams.
4.3.6. Effect of Failure Criteria
ASTM E119 and other fire test standards specify three limiting criteria, namely, strength, heat
transmission (unexposed slab surface temperatures), and critical strand temperatures for defining
the failure of PPC beams. While the critical strand and unexposed slab temperatures represent
prescriptive failure limit states, the strength limit state represents a realistic failure condition.
These three failure criteria are applied to determine the fire resistance values of all analyzed PPC
beams and the results are tabulated in Table 4.2.
The fire resistance results for the different failure criteria shown in Table 4.2 reveal that
prescriptive limit states generally predict lower fire resistance than actual failure conditions. For
instance, a lower fire resistance results for 10DT24+2 when the critical strand temperature
criterion is applied, while the heat transmission criterion produces lower fire resistance in the
case of a 12DT32+2 PPC beam. The only exception to this generalization is when load ratios
equal to or greater than 50% are applied, at which time the strength criterion produces a lower
fire resistance as can be seen from Table 4.2. Therefore, fire resistance of PPC beams is
governed by prescriptive limit states, unless relatively large load levels are applied. The specific
prescriptive limit state is dependent on the bulkiness of the beams’ cross-section, as can be seen
when an additional 13 to 25 mm (1/2 to 1 in.) of concrete cover thickness is provided to
prestressing strands of 12DT32+2, resulting in lower temperatures in the prestressing strands and
consequently altering its failure criterion from critical strand temperature to heat transmission.
96
The lower fire resistance produced by the prescriptive failure criteria, compared to actual failure
conditions, should raise the question whether such limit states are viable considerations in
evaluating fire resistance of PPC beams. To address one aspect of this question, recall that the
intent of the heat transmission criterion is to maintain compartmentation within a structure. The
necessity to prevent spread of fire beyond the first compartment indicates that this prescriptive
limit state is a viable consideration. However, when considering the viability of the critical
strand temperature limit state, it becomes clear that this simplified approach consistently
underestimates the fire resistance of PPC beams, except when larger loads are applied, in which
case it dangerously results in an overestimation. Therefore, the critical strand temperature failure
criterion does not reflect a realistic limit state and may lead to under-prediction of the fire
resistance of PPC beams.
4.4. Summary
Results from the parametric study revealed that critical factors that influence the fire resistance
of PPC beams are fire scenario, axial restraint, load level, aggregate type, and failure criteria.
Fire scenario proved to have significant influence on fire resistance of PPC beams and depending
on the severity of a real fire, the ASTM E119 fire scenario can lead to over- or under-designed
PPC beams. Axial restraint also has significant influence on fire resistance of PPC beams and
the level of restraint is a function of type of restraint, support condition, and variable stiffness
offered by adjoining members. Load level proved to be inversely proportional to fire resistance,
while aggregate type has only a moderate influence on the fire resistance of PPC beams.
However, carbonate aggregates do provide higher fire resistance than siliceous aggregate
concrete. Failure criteria revealed that PPC beams are often governed by limiting strand
97
temperatures for slender stems and heat transmission for bulkier stems where adequate cover
thickness is provided. This parameter also identified that critical strand temperature limit state
underestimates the actual failure of a PPC beam, unless high load levels are present and then it
would actually over-estimate the fire resistance. In contrast to the other parameters, concrete
compressive strength proved to have little to no effect on fire resistance of PPC beams. In
conclusion, the parametric study provided insight in the fire resistance of PPC beams and
exemplified the necessity to move from a prescriptive-based approach to performance-based
approach to capture influence of fire scenarios, restraint, and load level.
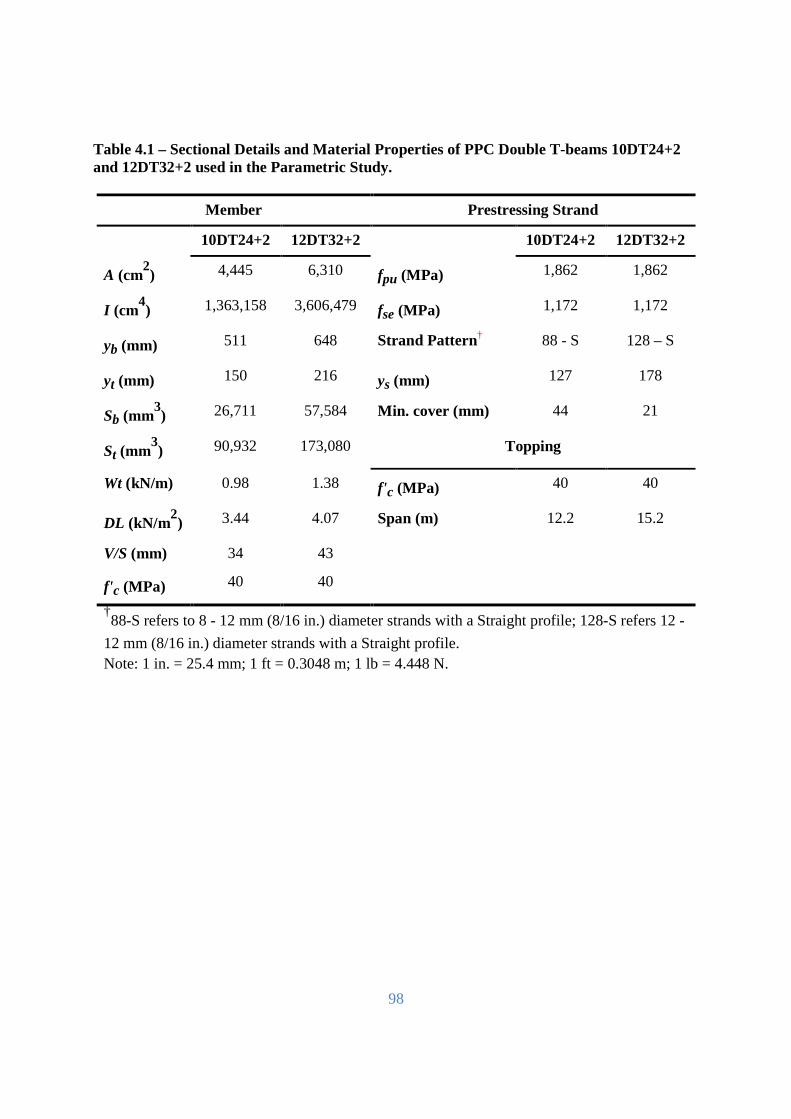
98
Table 4.1 – Sectional Details and Material Properties of PPC Double T-beams 10DT24+2 and 12DT32+2 used in the Parametric Study.
Member Prestressing Strand
10DT24+2 12DT32+2 10DT24+2 12DT32+2
A (cm2) 4,445 6,310 fpu (MPa) 1,862 1,862
I (cm4) 1,363,158 3,606,479 fse (MPa) 1,172 1,172
yb (mm) 511 648 Strand Pattern† 88 - S 128 – S
yt (mm) 150 216 ys (mm) 127 178
Sb (mm3) 26,711 57,584 Min. cover (mm) 44 21
St (mm3) 90,932 173,080 Topping
Wt (kN/m) 0.98 1.38 f' c (MPa) 40 40
DL (kN/m2) 3.44 4.07 Span (m) 12.2 15.2
V/S (mm) 34 43
f' c (MPa) 40 40
†88-S refers to 8 - 12 mm (8/16 in.) diameter strands with a Straight profile; 128-S refers 12 -
12 mm (8/16 in.) diameter strands with a Straight profile. Note: 1 in. = 25.4 mm; 1 ft = 0.3048 m; 1 lb = 4.448 N.
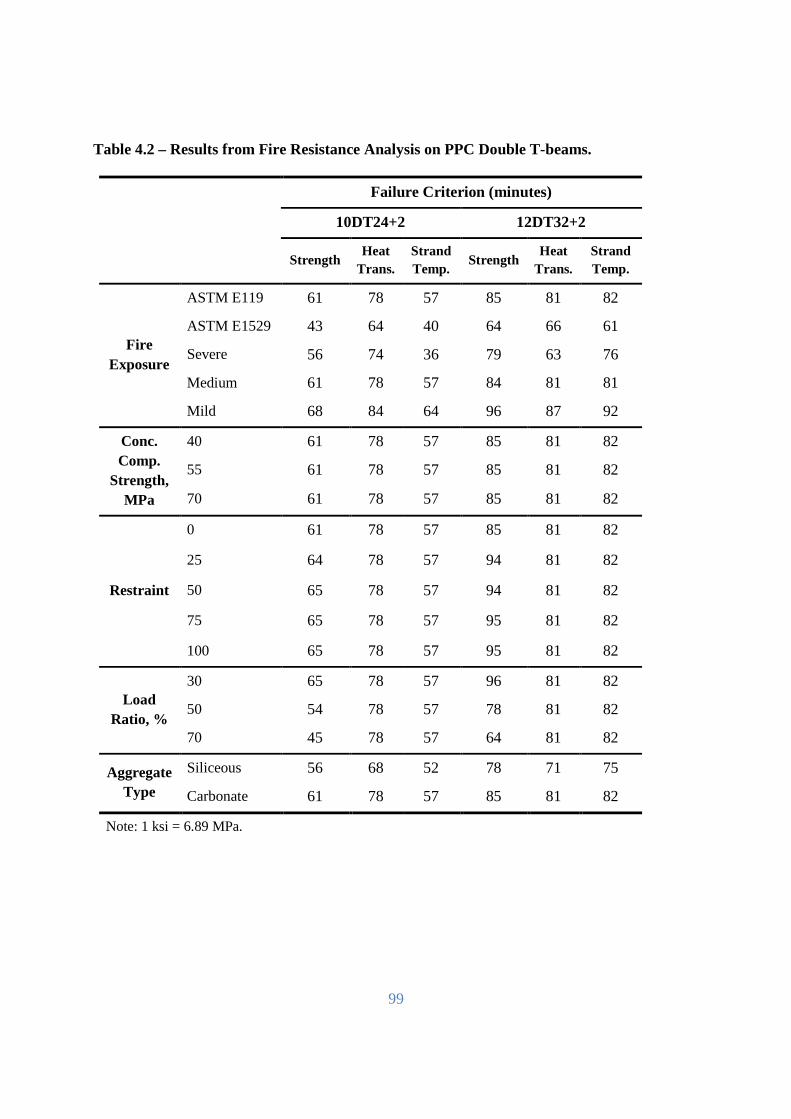
99
Table 4.2 – Results from Fire Resistance Analysis on PPC Double T-beams.
Failure Criterion (minutes)
10DT24+2 12DT32+2
Strength Heat
Trans. Strand Temp.
Strength Heat
Trans. Strand Temp.
Fire Exposure
ASTM E119 61 78 57 85 81 82
ASTM E1529 43 64 40 64 66 61
Severe 56 74 36 79 63 76
Medium 61 78 57 84 81 81
Mild 68 84 64 96 87 92
Conc. Comp.
Strength, MPa
40 61 78 57 85 81 82
55 61 78 57 85 81 82
70 61 78 57 85 81 82
Restraint
0 61 78 57 85 81 82
25 64 78 57 94 81 82
50 65 78 57 94 81 82
75 65 78 57 95 81 82
100 65 78 57 95 81 82
Load Ratio, %
30 65 78 57 96 81 82
50 54 78 57 78 81 82
70 45 78 57 64 81 82
Aggregate Type
Siliceous 56 68 52 78 71 75
Carbonate 61 78 57 85 81 82
Note: 1 ksi = 6.89 MPa.
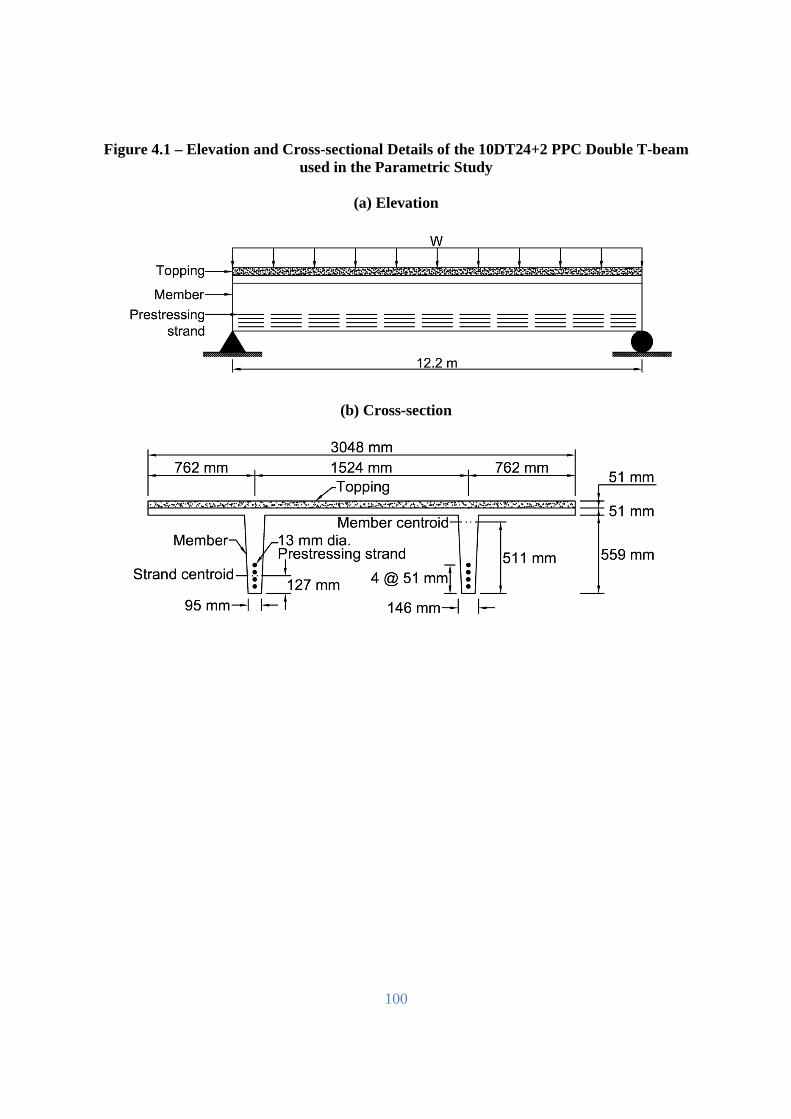
100
Figure 4.1 – Elevation and Cross-sectional Details of the 10DT24+2 PPC Double T-beam used in the Parametric Study
(a) Elevation
(b) Cross-section
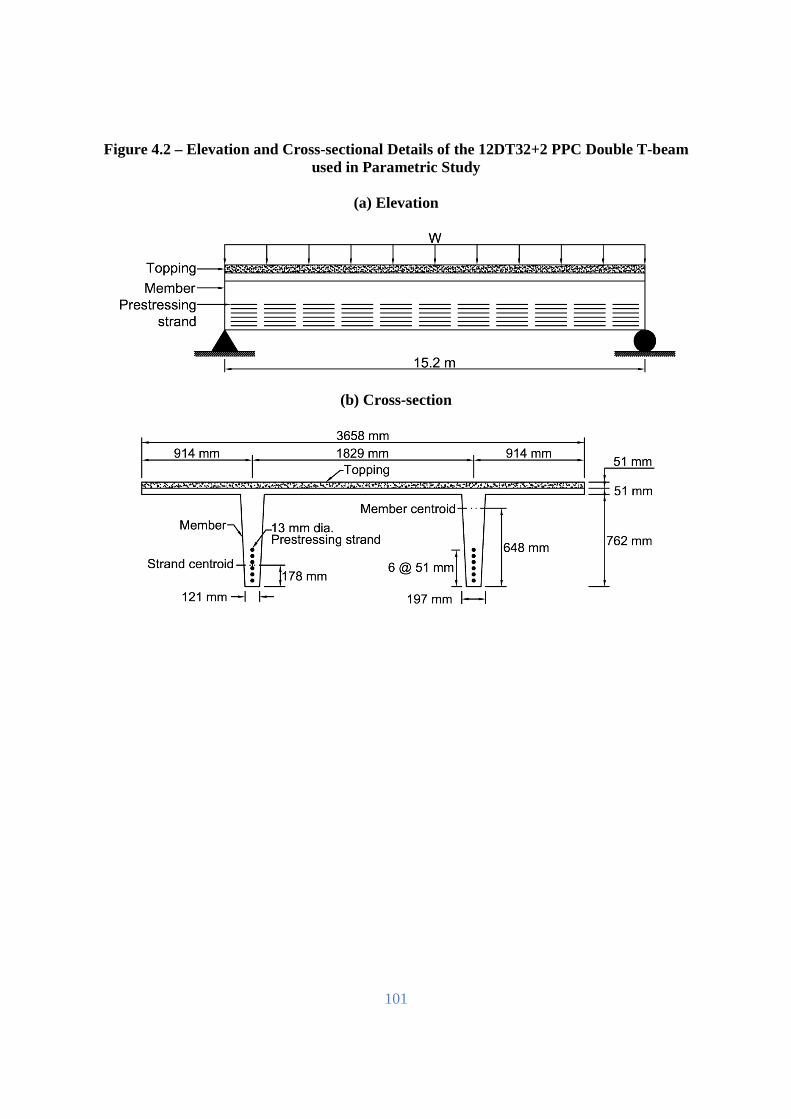
101
Figure 4.2 – Elevation and Cross-sectional Details of the 12DT32+2 PPC Double T-beam used in Parametric Study
(a) Elevation
(b) Cross-section
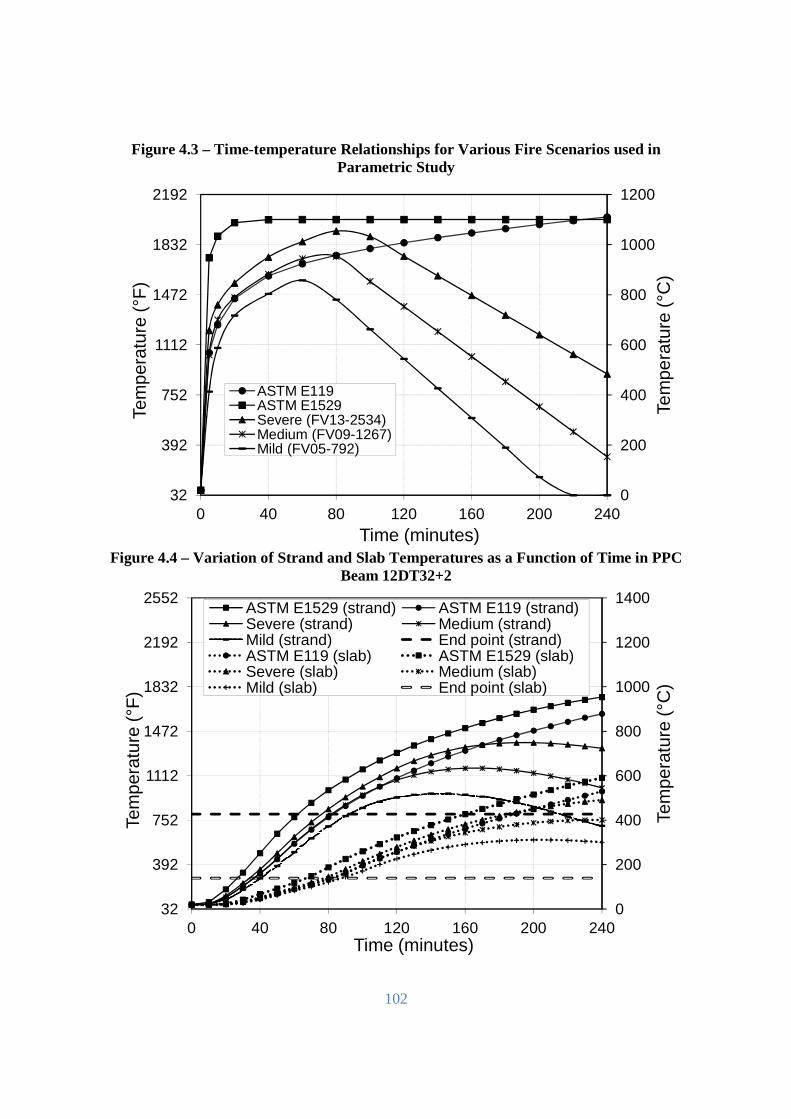
102
Figure 4.3 – Time-temperature Relationships for Various Fire Scenarios used in Parametric Study
Figure 4.4 – Variation of Strand and Slab Temperatures as a Function of Time in PPC
Beam 12DT32+2
0
200
400
600
800
1000
1200
32
392
752
1112
1472
1832
2192
0 40 80 120 160 200 240
Tem
pera
ture
(°C
)
Tem
pera
ture
(°F
)
Time (minutes)
ASTM E119ASTM E1529Severe (FV13-2534)Medium (FV09-1267)Mild (FV05-792)
0
200
400
600
800
1000
1200
1400
32
392
752
1112
1472
1832
2192
2552
0 40 80 120 160 200 240
Tem
pera
ture
(°C
)
Tem
pera
ture
(°F
)
Time (minutes)
ASTM E1529 (strand) ASTM E119 (strand)Severe (strand) Medium (strand)Mild (strand) End point (strand)ASTM E119 (slab) ASTM E1529 (slab)Severe (slab) Medium (slab)Mild (slab) End point (slab)
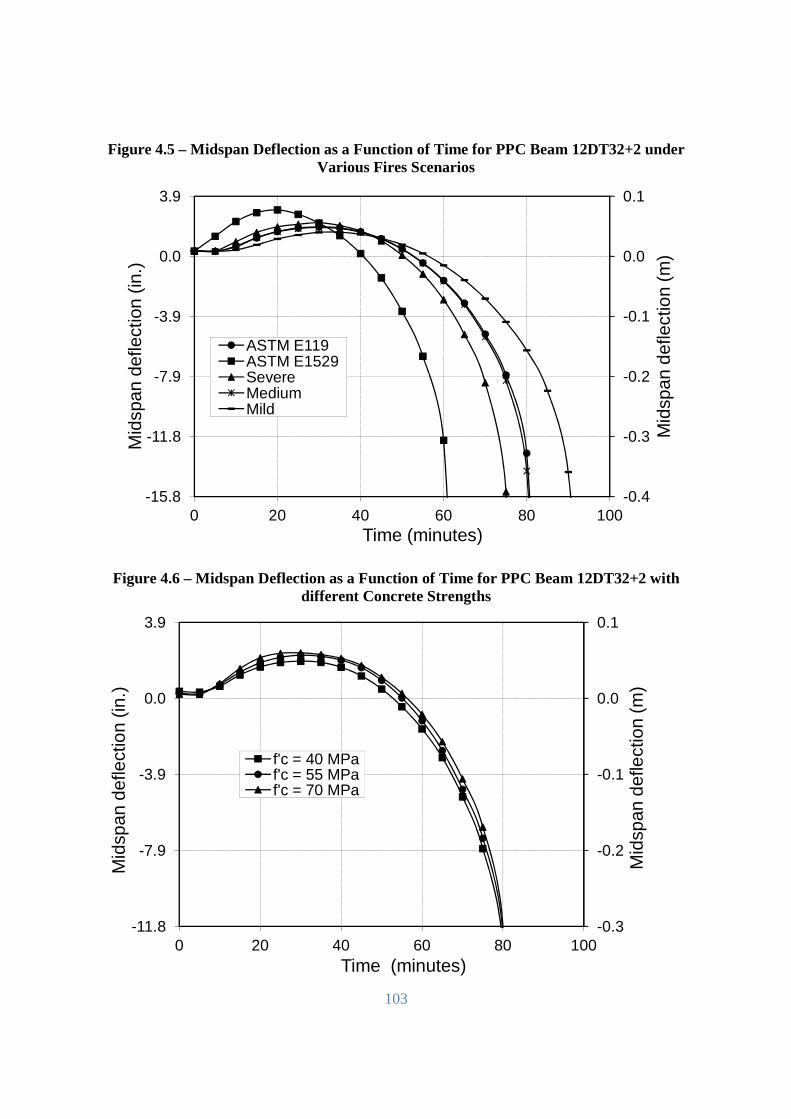
103
Figure 4.5 – Midspan Deflection as a Function of Time for PPC Beam 12DT32+2 under Various Fires Scenarios
Figure 4.6 – Midspan Deflection as a Function of Time for PPC Beam 12DT32+2 with different Concrete Strengths
-0.4
-0.3
-0.2
-0.1
0.0
0.1
-15.8
-11.8
-7.9
-3.9
0.0
3.9
0 20 40 60 80 100
Mid
span
def
lect
ion
(m)
Mid
span
def
lect
ion
(in.)
Time (minutes)
ASTM E119ASTM E1529SevereMediumMild
-0.3
-0.2
-0.1
0.0
0.1
-11.8
-7.9
-3.9
0.0
3.9
0 20 40 60 80 100
Mid
span
def
lect
ion
(m)
Mid
span
def
lect
ion
(in.)
Time (minutes)
f'c = 40 MPaf'c = 55 MPaf'c = 70 MPa
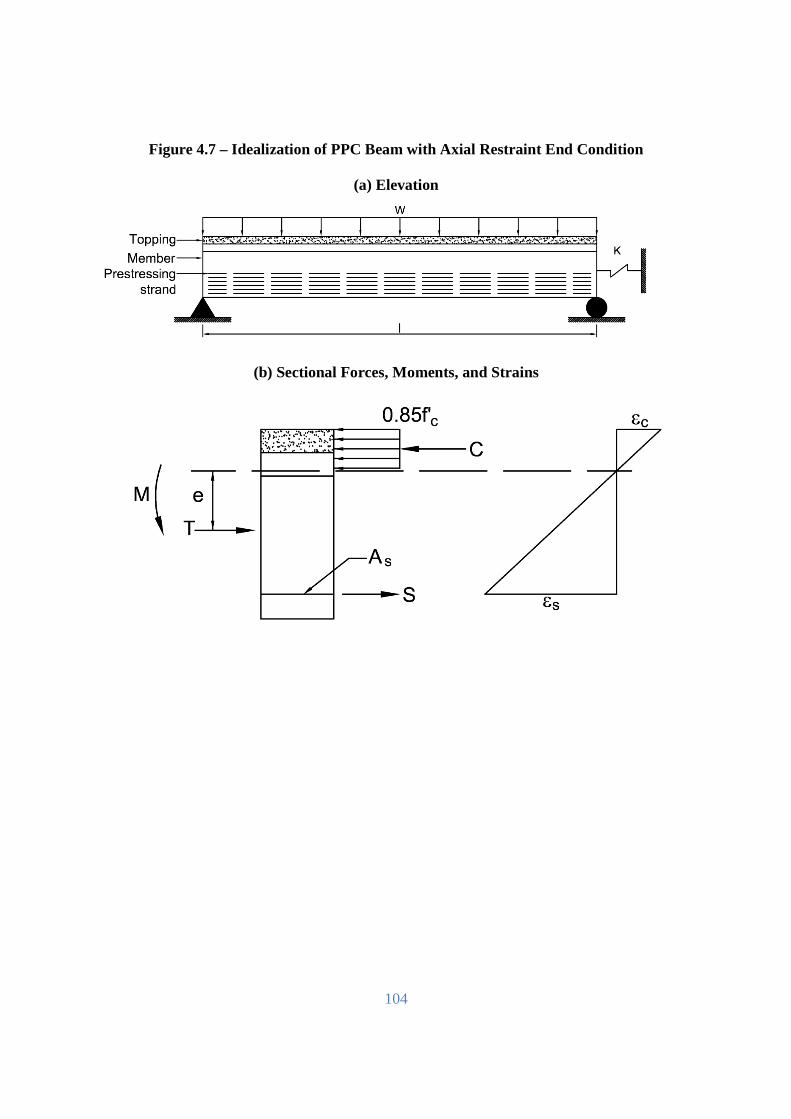
104
Figure 4.7 – Idealization of PPC Beam with Axial Restraint End Condition
(a) Elevation
(b) Sectional Forces, Moments, and Strains
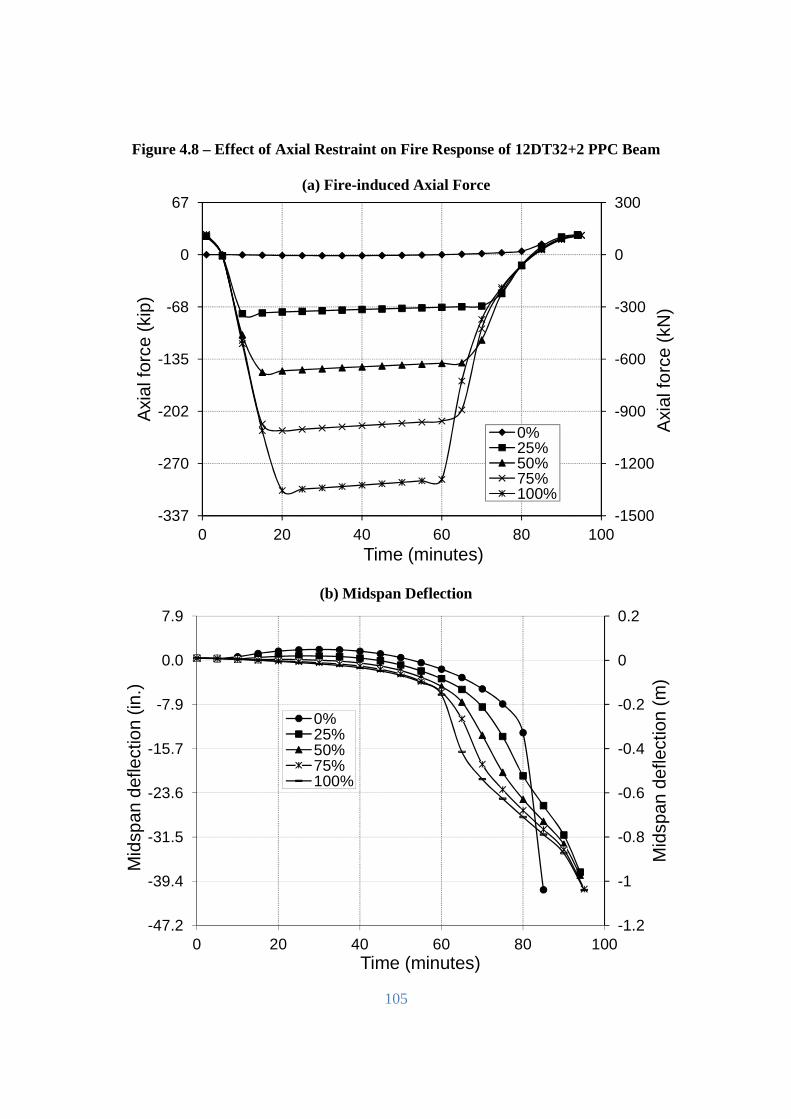
105
Figure 4.8 – Effect of Axial Restraint on Fire Response of 12DT32+2 PPC Beam
(a) Fire-induced Axial Force
(b) Midspan Deflection
-1500
-1200
-900
-600
-300
0
300
-337
-270
-202
-135
-68
0
67
0 20 40 60 80 100
Axi
al fo
rce
(kN
)
Axi
al fo
rce
(kip
)
Time (minutes)
0%25%50%75%100%
-1.2
-1
-0.8
-0.6
-0.4
-0.2
0
0.2
-47.2
-39.4
-31.5
-23.6
-15.7
-7.9
0.0
7.9
0 20 40 60 80 100
Mid
span
def
lect
ion
(m)
Mid
span
def
lect
ion
(in.)
Time (minutes)
0%25%50%75%100%
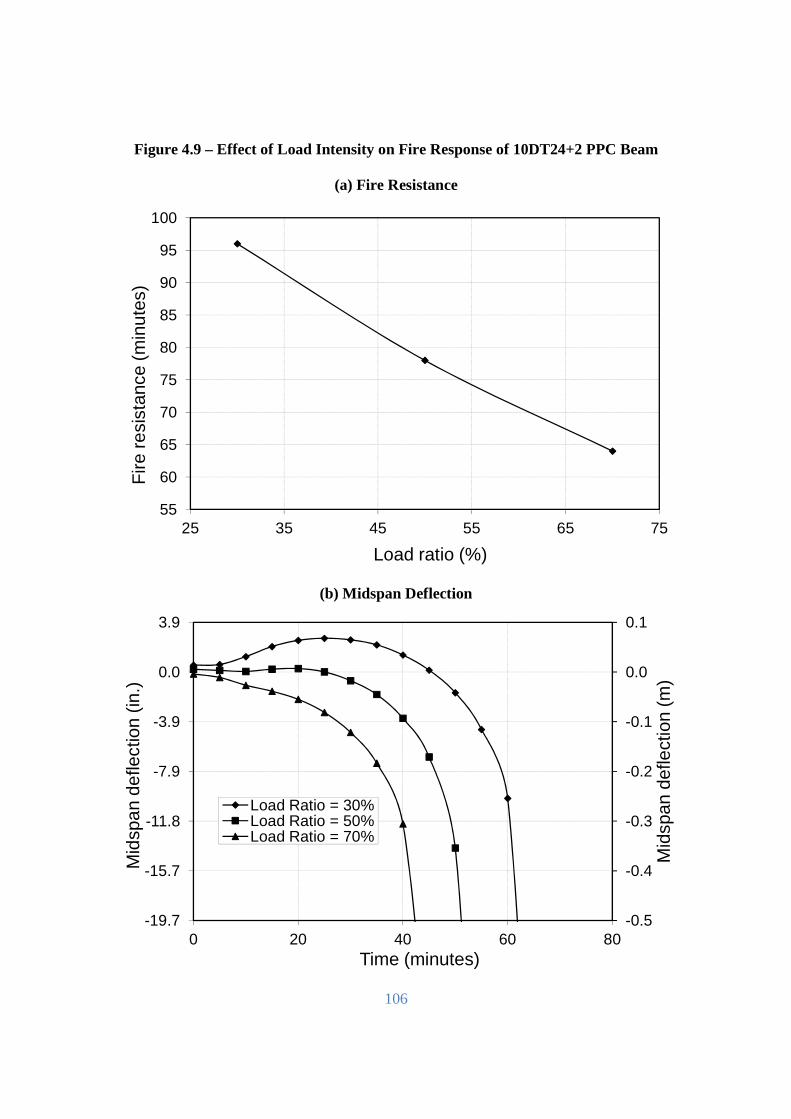
106
Figure 4.9 – Effect of Load Intensity on Fire Response of 10DT24+2 PPC Beam
(a) Fire Resistance
(b) Midspan Deflection
55
60
65
70
75
80
85
90
95
100
25 35 45 55 65 75
Fire
res
ista
nce
(min
utes
)
Load ratio (%)
-0.5
-0.4
-0.3
-0.2
-0.1
0.0
0.1
-19.7
-15.7
-11.8
-7.9
-3.9
0.0
3.9
0 20 40 60 80
Mid
span
def
lect
ion
(m)
Mid
span
def
lect
ion
(in.)
Time (minutes)
Load Ratio = 30%Load Ratio = 50%Load Ratio = 70%
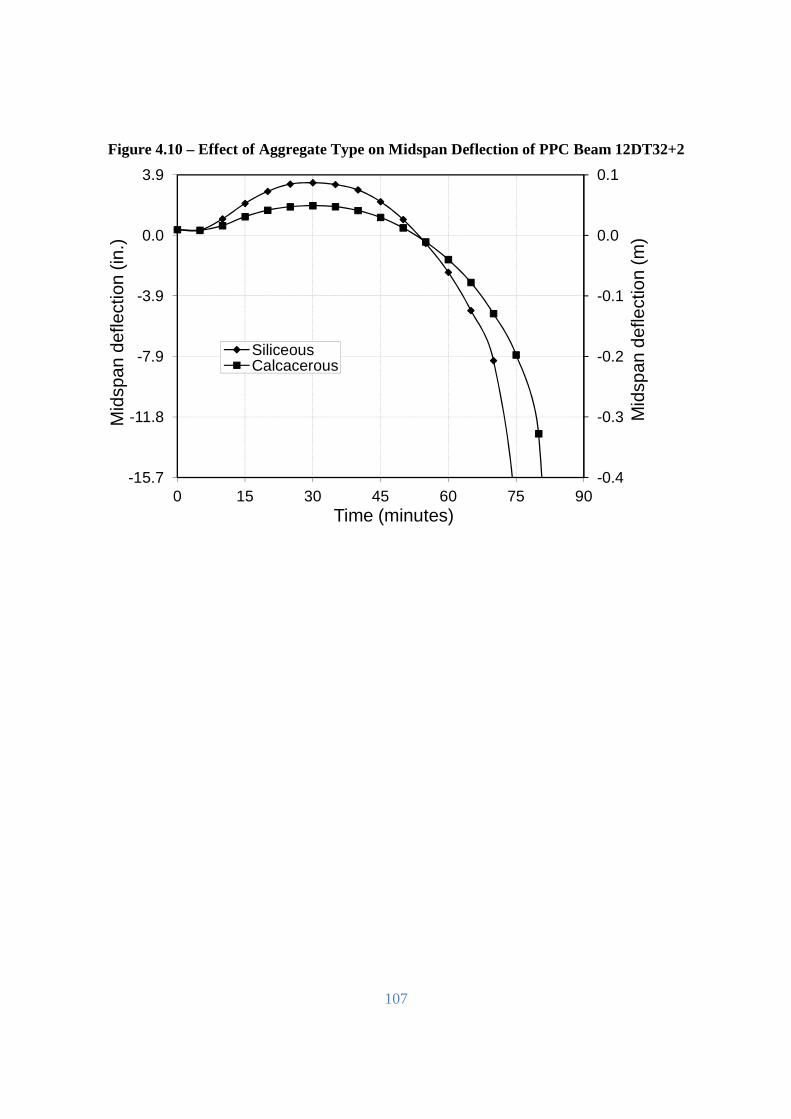
107
Figure 4.10 – Effect of Aggregate Type on Midspan Deflection of PPC Beam 12DT32+2
-0.4
-0.3
-0.2
-0.1
0.0
0.1
-15.7
-11.8
-7.9
-3.9
0.0
3.9
0 15 30 45 60 75 90
Mid
span
def
lect
ion
(m)
Mid
span
def
lect
ion
(in.)
Time (minutes)
SiliceousCalcacerous
108
Chapter 5
5. Performance-Based Approach 5.1. General
In recent years, there has been a strong push by the fire research community to move towards a
performance-based approach in fire safety provisions, in attempt to overcome the shortcomings
of current prescriptive-based methods. Based on the findings of the literature review and
parametric study presented in this thesis it is evident that the current approach does not account
for realistic fire scenarios, load level, restraint, and failure criteria. These factors must be given
due consideration to accurately predict the fire resistance of a precast/prestressed concrete (PPC)
beam. Therefore, in effort to offer a rational and cost-effective approach, this chapter is
dedicated to scripting a detailed approach for undertaking a performance-based approach for
assessing the fire resistance of PPC beams.
109
5.2. Performance-Based Approach
The following performance-based approach is a rational calculation methodology that accounts
for the critical factors (i.e. fire scenario, axial restraint, load level, aggregate type, and failure
criteria) that influence fire resistance of PPC beams. This approach offers designers the
flexibility to create innovation through design, construction, and materials. It also holds the
potential to generate equal, if not improved fire safety than the current approach and maximizes
the benefit/cost ratio potential. All of these advantages can be achieved through applying the
following steps for evaluating fire resistance of PPC beams. The steps associated with the fire
resistance assessment include:
1. Develop design fire and loading scenarios.
2. Select relevant high-temperature material properties.
3. Perform detailed thermal and structural analysis to generate fire response.
4. Apply relevant failure criteria.
5. Develop practical alternatives, as needed, to achieve required fire resistance.
5.2.1. Fire Scenario
To develop relevant fire scenarios for a compartment fire, parametric time–temperature
relationships provided in Eurocode 1 (2002), by SFPE (2011), or design tables specified in the
literature (Magnusson and Thelandersson 1970) can be used. For using these relationships, fuel
load and ventilation characteristics are prescribed or estimated as input parameters. The fuel
load can either be calculated based on fuel content, including wall and ceiling linings, or can be
found directly from design tables in the literature based on compartment type (Parkinson and
Kodur 2007). Likewise, the ventilation factor can be determined from the layout of windows
110
and door openings (Feasey and Buchanan 2002) Figure 4.3 illustrates three design fires
developed under the Eurocode provisions which were based on fuel loads and ventilation factors
selected to represent mild, medium and severe fires.
5.2.2. Loading Scenario
The loading scenario selected for fire resistance calculations in a performance-based approach
should reflect realistic conditions. A fire event is considered an extreme loading condition. In
turn, this means there is a low probability that ambient temperature and extreme load
combinations will occur simultaneously during a fire event. In fact, a reduction in live load is
expected; as it is assumed that the occupants will be evacuated by the time temperature effects
begin to significantly influence the structures’ strength and stiffness. Dead loads should remain
unaltered, as they are inherent characteristic of the structure. As for other types of loading,
depending on the structures geographical and topographical location, snow and wind loads may
also need to be considered. In general, some degree of wind load should be considered to assure
lateral stability of the structure. Snow loads should also be included when considering roof
elements in regions where snow loads are significant and frequent.
For checking the fire resistance of a structure or structural element (i.e. PPC beam) to withstand
the effect of a fire event (i.e. extraordinary event), ASCE-07 (2005) design standard provides
two load combinations 1.2D + (0.5L or 0.2S) and (0.9 or 1.2)D + 0.2W that capture a realistic
loading scenario for a fire event. The first load combination is intended to envelope the vertical
demands on a structure or structural element, while the second load combination checks the
lateral stability. It’s noteworthy to mention, the term Ak, corresponding to loads from fire
effects, are not included in these expressions, because they (temperature and restraint) are
111
captured through boundary conditions and time-temperature relationships utilized in numerical
model. Furthermore, these effects are multiplied by a factor of unity (1.0) due to uncertainty
associated with this event and do not need to be modified.
5.2.3. High Temperature Material Properties
To predict the fire resistance of PPC beams with a numerical model, each material must be
assigned a high temperature material model to define its fire response. The material models that
are of interest for fire resistance analysis are thermal and mechanical properties and these
properties vary with temperature. Numerous high-temperature material models are available to
be utilized in the fire resistance calculations for a performance-based approach. However, to
yield accurate results, it must be emphasized, that special precaution needs to be taken when
selecting a material model. Two widely accepted material property models for concrete,
prestressing steel, and reinforcing steel are present in Eurocode 2 (2004) and ASCE Manual of
Practice No. 78 (1992). Both these models provide temperature dependent empirical
relationships to define specific materials high temperature properties and these relationships are
reproduced in Appendix B. For a detailed explanation of high temperature properties of these
materials refer to Chapter 2. It should be noted, ASCE model does not provide high-temperature
constitutive relationships for prestressing steel and in order to use this model for PPC beams an
alternative stress-strain relationship is required such as relationship provided in Eurocode 2.
112
5.2.4. Thermal and Structural Analysis
The third step is to perform a thermo-mechanical analysis to predict the fire response of a PPC
beam. The complexity involved in such an analysis requires the use of a finite element-based
program, such as SAFIR (2004), ANSYS (2011) or ABAQUS (2011). These programs utilize
heat transfer and mechanics principles to perform a coupled heat transfer/strain equilibrium
analysis at incremental time steps. The analysis is carried out in three main steps: calculation of
fire exposure temperature, calculation of temperature distribution within the PPC beam due to
the fire exposure, and calculation of residual strength, internal forces, stresses, strains, and
deflections. The estimated fire scenario, structural loads, as well as geometric and material
properties form the input to these computer models. The critical component of the input is high-
temperature constitutive models of concrete, reinforcing steel, and prestressing steel because
these properties define the thermal and mechanical response of a material. These properties vary
with temperature and have a significant influence on fire resistance predictions. In SAFIR,
Eurocode properties are built into the computer program, but the ASCE recommended high
temperature property relationships can also be coded into the program.
When selecting a finite-element based computer program to perform a thermo-mechanical
analysis the following requirements must be satisfied to be deemed acceptable. For starters, the
numerical formulation utilized in the thermal analysis must be based on fundamental heat
transfer principals to generate temperatures accurately. Similarly, the mechanical analysis shall
be based on mechanics principles to generate deflections, internal forces, and stresses. Another
basic requirement is that the software program must be capable of performing a time-dependent
analysis, so that results can be checked for failure at every time step. Furthermore, to obtain
reliable results, the program must be capable of accounting for nonlinear high-temperature
113
material properties, standard and user (i.e. design or parametric) defined fire scenarios, different
concrete types, high temperature creep, second-order effects (i.e. P-delta), and failure criteria.
The numerical model should also be able to handle multiple materials (i.e. concrete, prestressing
steel, and reinforcing steel) in a model within a nonlinear geometry and to incorporate the effect
of prestressing or residual stress. These requirements must be met to ensure the finite-element
program is capable of yielding accurate fire resistance results.
5.2.5. Failure Criteria
Failure criteria to be selected for the performance-based approach are based on stability,
insulation, and integrity requirements. The stability limit state, also known as strength limit
state, defines failure as the time when a structural element can no longer maintain its load-
bearing capacity and collapses. Flexure and shear are the two primary failure modes that must
be considered for PPC beams. For each failure mode, respective limiting material strain is used
to define failure. The latter two failure criteria, insulation and integrity, are intended to prevent
the spread of fire. These failure criteria are of special importance for PPC beams, since the
floor/roof systems must not only provide structural support, but also act as a barrier between
compartments. The insulation (heat transmission) criterion defines failure when the unexposed
temperature on the slab exceeds 181°C (325°F) at any one point or an average of 139°C (250°F).
These limiting temperatures ensure compartmentation functionality and are based on the critical
temperature required to ignite cotton waste. Lastly, the integrity criterion establishes failure as
time when cracks or fissures form in the concrete slab, allowing flame or hot gasses to path
through the assembly. This criterion can be very difficult to quantify, but should be met through
either data from fire tests or calculations based assumptions regarding material loss. The main
114
reason for this criterions existence is to assure engineers select materials and assemblies that can
be relied upon to maintain integrity. Fire resistance shall be based on the lesser failure time of
the three limits, when all three criteria are applicable.
5.2.6. Practical Alternatives
Results from the performance-based analysis can be utilized to develop practical alternatives for
achieving required fire resistance in PPC beams. As an example, if the fire resistance of a PPC
beam is just short of the required fire resistance by a few minutes, then one solution is to replace
the siliceous aggregate in the concrete with carbonate aggregate to get additional fire resistance.
Other options include changing sectional dimensions, increasing the slab depth, or modifying
load level depending on the criteria governing the fire resistance of the PPC beam. Another
option to improve fire resistance is to include the effects of axial restraint when appropriate. The
fact that many of these options can be explained through numerical analysis, without the need for
expensive fire tests, offers an attractive proposition for designers. These suggestions are just
some of the several possibilities to improve the fire resistance of a PPC beam.
5.3. Summary
This chapter presented a performance-based approach to calculate the fire resistance of PPC
beams. It was developed in attempt to overcome the shortcomings of the current prescriptive-
based methods. It accounts for the critical factors, namely, realistic fire scenarios, load level,
restraint, and failure criteria, which influence fire resistance of PPC beams. To undertake the fire
resistance calculations, a step-by-step procedure is provided. At every step, a detailed discussion
describing that steps goal, as well as suggestions on how it can be accomplished through readily

115
available resources. As a result, this approach offers a rational and cost-effective calculation
methodology for predicting the fire resistance of PPC beams. The performance-based approach
offers designers the flexibility for innovation, potential to generate better fire safety, and
opportunity to maximize benefit/cost ratio.
116
Chapter 6
6. Conclusions and Recommendations 6.1. General
This thesis presented results from numerical studies aimed at overcoming the current fire
resistance limitations of precast/prestressed concrete (PPC) double T-beams. A performance-
based approach was applied in the fire resistance analysis of two PPC double T-beams. A
10DT24+2 and 12DT32+2 PPC double T-beam were analyzed using SAFIR under different fire
scenarios, loading and restraint. In the numerical studies high temperature material properties,
various load and restraint levels, and material and geometric nonlinearity were accounted for, as
well as realistic failure criterion were included to evaluate the fire response and determine
failure. Prior to the analysis, SAFIR was validated using published fire test data from the
Portland Cement Association (PCA) and Underwriters Laboratories (UL). The validation studies
117
revealed, the temperatures, deflections, and fire resistance predicted with SAFIR show a strong
correlation with the results of real fire tests. In addition, a sensitivity analysis was also
undertaken to confirm that the level of refinement selected for discretization of the thermal and
structural models were refined enough to produce accurate results. Next, the numerical model
was used to conduct parametric studies to quantify the influence of various factors on fire
response of PPC double T-beams. The critical factors influencing the fire resistance were found
to be fire scenario, axial restraint, load level, aggregate type, and failure criterion. Based on the
findings of the parametric studies, guidelines for a performance-based assessment approach were
developed to offer a rational approach for determining the fire resistance of PPC double T-
beams. The guidelines outline the specific requirements for the selection of the fire scenario,
material model, numerical model, and failure criteria. The proposed design approach accounts
for significant factors that influence the fire resistance of PPC double T-beams, and thus
provides better fire resistance estimates as compared to current code provisions.
6.2. Conclusions
Based on the information presented in this thesis, the following conclusions can be drawn:
• Current approaches for evaluating the fire resistance of a PPC double T-beam are based
on prescriptive methods and may not yield realistic fire resistance.
• The main factors that influence the fire response of PPC beams are load intensity, fire
scenario, aggregate type, restraint, and cover thickness.
• Load intensity is inversely proportional to fire resistance of PPC beams and can
drastically reduce the fire resistance for very high load levels. A 10% increase in load
can decrease fire resistance by approximately 7 minutes.
118
• Fire scenario has a significant influence on the fire response of a PPC double T-beam. If
a PPC beam is designed under the prescriptive approach, then the beam may be over- or
under-designed when compared to the actual fuel loads and ventilation conditions
present.
• The type of aggregate used in concrete has a moderate influence on fire resistance of PPC
beams. Carbonate aggregate concrete provide higher fire resistance (about 10% in most
cases) than siliceous aggregate concrete.
• Axial restraint can improve fire resistance of PPC double T-beams by up to 12%, but the
level of restraint depends on the type of restraint, support condition, and variable stiffness
offered by the adjoining members.
• Fire resistance of PPC beams is often governed by limiting strand temperatures for
slender stems and heat transmission for bulkier stems where adequate cover thickness is
provided.
• Performance-based fire design can be used to develop rational and innovative solutions
by introducing realistic fire scenarios, load intensity, and restraint conditions.
6.3. Recommendations for Future Research
While herein lies a state-of-the-art approach for assessing the fire resistance of PPC beams; more
research is still needed to develop a better understanding of the subtle nuances and other
scenarios not considered in this study with respect to the fire resistance of PPC beams. Below is
a list of recommendations for future research in attempt to achieve this goal:
• The effects of restraint presented in this manuscript could be expanded upon by
performing a comprehensive stand-alone study that would investigate numerous support
119
conditions, types of restraint (axial, moment, and membrane action), and varying degrees
of stiffness found in building applications. This research would lay the ground work for
future design provisions and additional insight into the beneficial or detrimental effects of
restraint.
• The high temperature constitutive relationships presented in this study revealed several
discrepancies between the models and in the case of prestressing steel, even a lack of
information. Therefore, future research should focus on further developing and
confirming the high temperature material properties for new and existing types of
concrete, reinforcing steel, and especially prestressing steel. To assure the accuracy of
these models special consideration should be given to capture high temperature creep and
in the case of concrete only, transient strains.
• Physical properties, such as fire-induced spalling of concrete and bond loss between
prestressing steel and concrete under fire conditions need to be further studied. These
properties can have the potential to be catastrophic on the fire resistance of PPC beams
and subsequent collapse of an entire structure. As seen in the literature review, little is
understood about the nature of either these physical properties and to date, neither
property has been developed to a point where it can be predicted under fire conditions.
• A series of fire tests must be undertaken to validate results from numerical models
utilized in a performance-based approach. These fire tests will help the performance
based approach gain acceptance and instill confidence amongst the engineering
community so that one day it will no longer be necessary to perform costly fire tests.
• The influence of a localized fire or thermal gradient about the cross-sectional depth
and/or along the length of the PPC beam due to the dynamics of a real fire. These two

120
fire exposure scenarios to need to be considered to give insight into the potential for shear
failure or potential for issues regarding principal stresses when developing guidelines for
the fire design of PPC beams.

121
APPENDICES
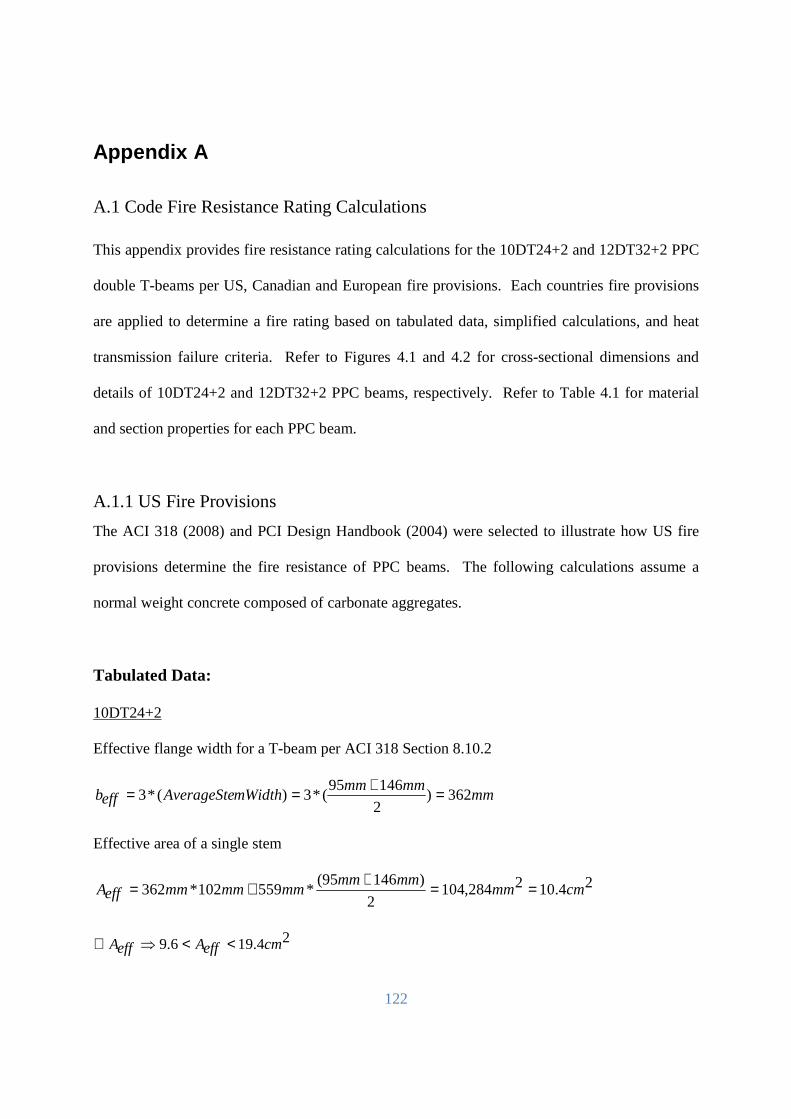
122
Appendix A
A.1 Code Fire Resistance Rating Calculations This appendix provides fire resistance rating calculations for the 10DT24+2 and 12DT32+2 PPC
double T-beams per US, Canadian and European fire provisions. Each countries fire provisions
are applied to determine a fire rating based on tabulated data, simplified calculations, and heat
transmission failure criteria. Refer to Figures 4.1 and 4.2 for cross-sectional dimensions and
details of 10DT24+2 and 12DT32+2 PPC beams, respectively. Refer to Table 4.1 for material
and section properties for each PPC beam.
A.1.1 US Fire Provisions
The ACI 318 (2008) and PCI Design Handbook (2004) were selected to illustrate how US fire
provisions determine the fire resistance of PPC beams. The following calculations assume a
normal weight concrete composed of carbonate aggregates.
Tabulated Data:
10DT24+2
Effective flange width for a T-beam per ACI 318 Section 8.10.2
mmmmmm
mWidthAverageSteeffb 362)2
14695(*3)(*3 =+==
Effective area of a single stem
24.102284,1042
)14695(*559102*362 cmmm
mmmmmmmmmmeffA ==++=
24.196.9 cmeffAeffA <<⇒∴
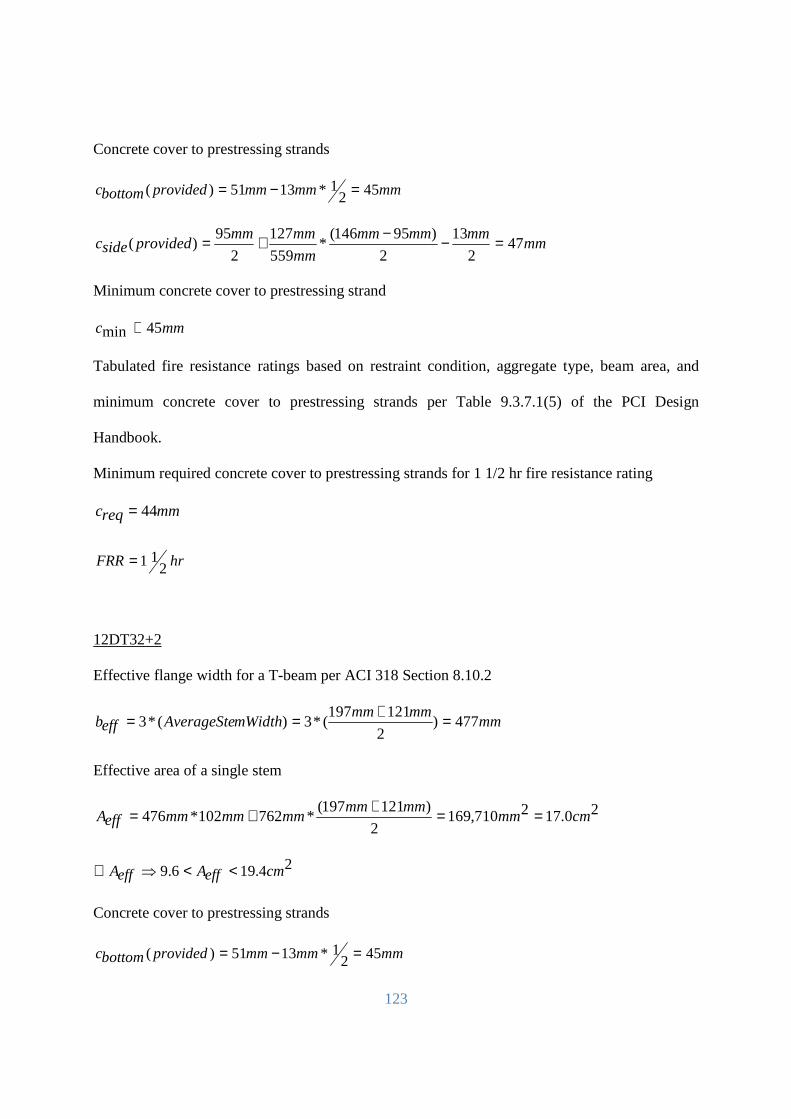
123
Concrete cover to prestressing strands
mmmmmmprovidedbottomc 4521*1351)( =−=
mmmmmmmm
mm
mmmmprovidedsidec 47
2
13
2
)95146(*
559
127
2
95)( =−−+=
Minimum concrete cover to prestressing strand
mmc 45min ≅
Tabulated fire resistance ratings based on restraint condition, aggregate type, beam area, and
minimum concrete cover to prestressing strands per Table 9.3.7.1(5) of the PCI Design
Handbook.
Minimum required concrete cover to prestressing strands for 1 1/2 hr fire resistance rating
mmreqc 44=
hrFRR 211=
12DT32+2
Effective flange width for a T-beam per ACI 318 Section 8.10.2
mmmmmm
mWidthAverageSteeffb 477)2
121197(*3)(*3 =+==
Effective area of a single stem
20.172710,1692
)121197(*762102*476 cmmm
mmmmmmmmmmeffA ==++=
24.196.9 cmeffAeffA <<⇒∴
Concrete cover to prestressing strands
mmmmmmprovidedbottomc 4521*1351)( =−=
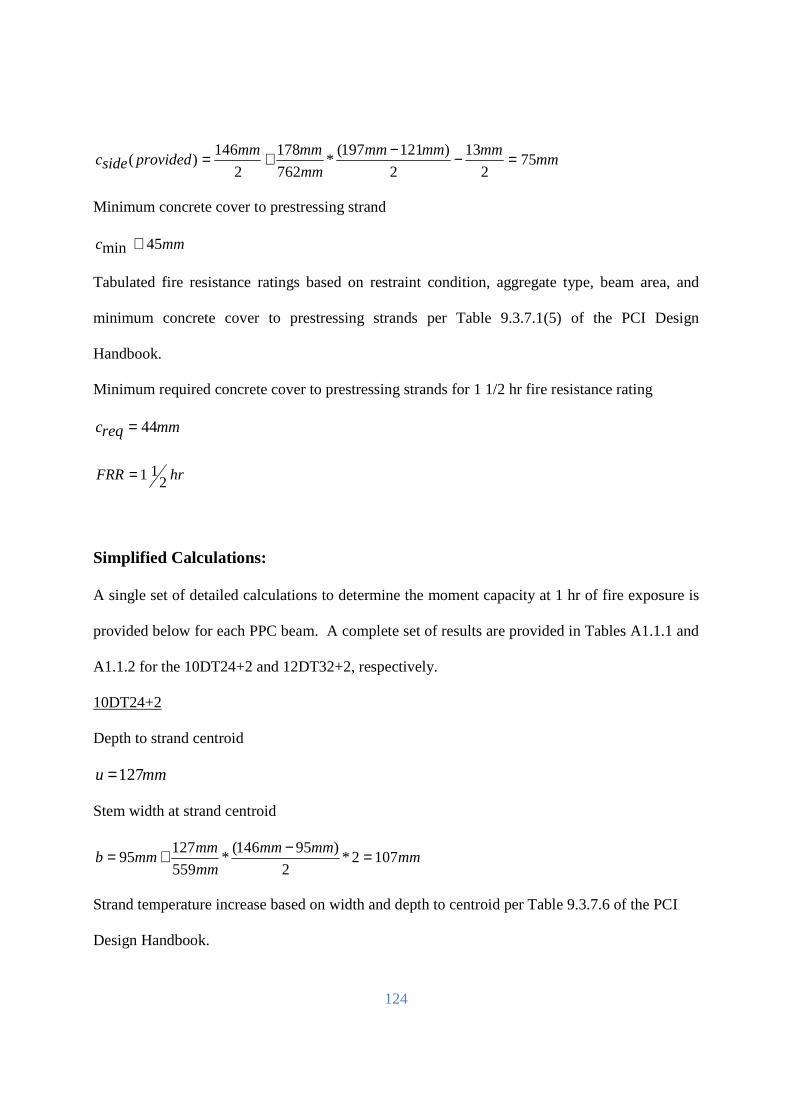
124
mmmmmmmm
mm
mmmmprovidedsidec 75
2
13
2
)121197(*
762
178
2
146)( =−−+=
Minimum concrete cover to prestressing strand
mmc 45min ≅
Tabulated fire resistance ratings based on restraint condition, aggregate type, beam area, and
minimum concrete cover to prestressing strands per Table 9.3.7.1(5) of the PCI Design
Handbook.
Minimum required concrete cover to prestressing strands for 1 1/2 hr fire resistance rating
mmreqc 44=
hrFRR 211=
Simplified Calculations:
A single set of detailed calculations to determine the moment capacity at 1 hr of fire exposure is
provided below for each PPC beam. A complete set of results are provided in Tables A1.1.1 and
A1.1.2 for the 10DT24+2 and 12DT32+2, respectively.
10DT24+2
Depth to strand centroid
mmu 127=
Stem width at strand centroid
mmmmmm
mm
mmmmb 1072*
2
)95146(*
559
12795 =−+=
Strand temperature increase based on width and depth to centroid per Table 9.3.7.6 of the PCI
Design Handbook.
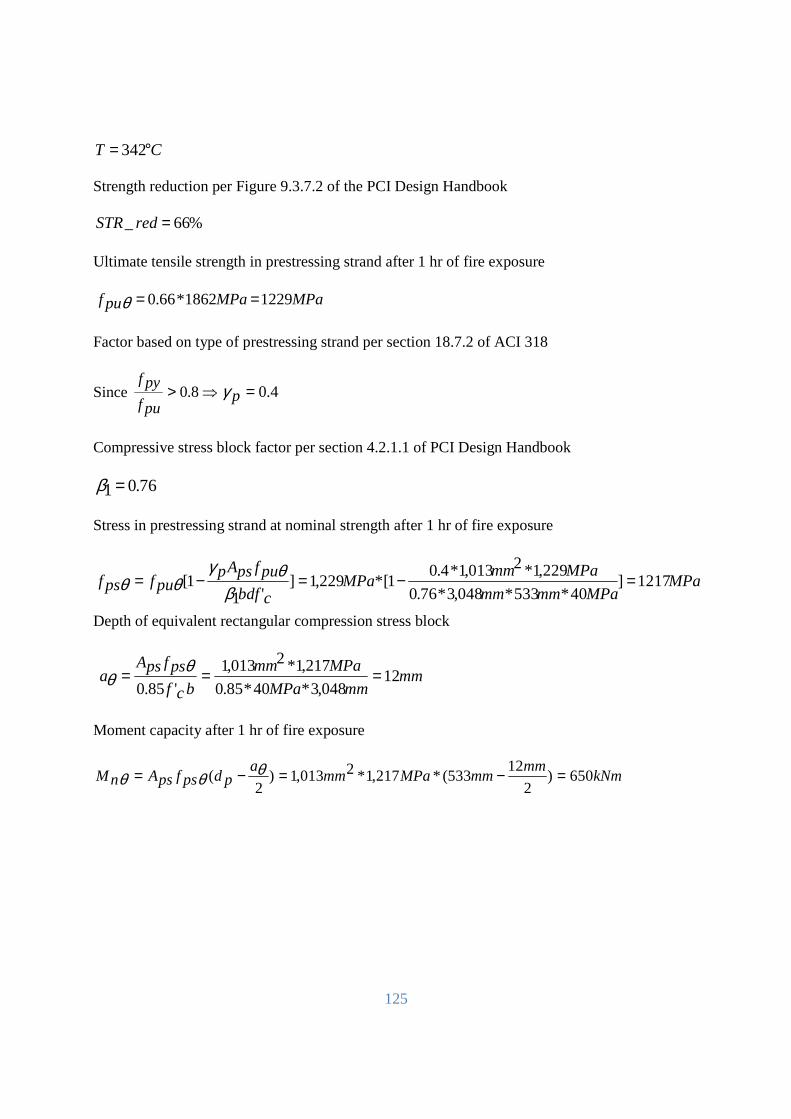
125
CT °= 342
Strength reduction per Figure 9.3.7.2 of the PCI Design Handbook
%66_ =redSTR
Ultimate tensile strength in prestressing strand after 1 hr of fire exposure
MPaMPapuf 12291862*66.0 ==θ
Factor based on type of prestressing strand per section 18.7.2 of ACI 318
Since ⇒> 8.0puf
pyf4.0=pγ
Compressive stress block factor per section 4.2.1.1 of PCI Design Handbook
76.01=β
Stress in prestressing strand at nominal strength after 1 hr of fire exposure
MPaMPammmm
MPammMPa
cbdf
pufpsAppufpsf 1217]
40*533*048,3*76.0
229,1*2013,1*4.01[*229,1]
'11[ =−=−=
βθγ
θθ
Depth of equivalent rectangular compression stress block
mm
mmMPa
MPamm
bcf
psfpsAa 12
048,3*40*85.0
217,1*2013,1
'85.0=== θ
θ
Moment capacity after 1 hr of fire exposure
kNmmm
mmMPamma
pdpsfpsAnM 650)2
12533(*217,1*2013,1)
2( =−=−= θθθ
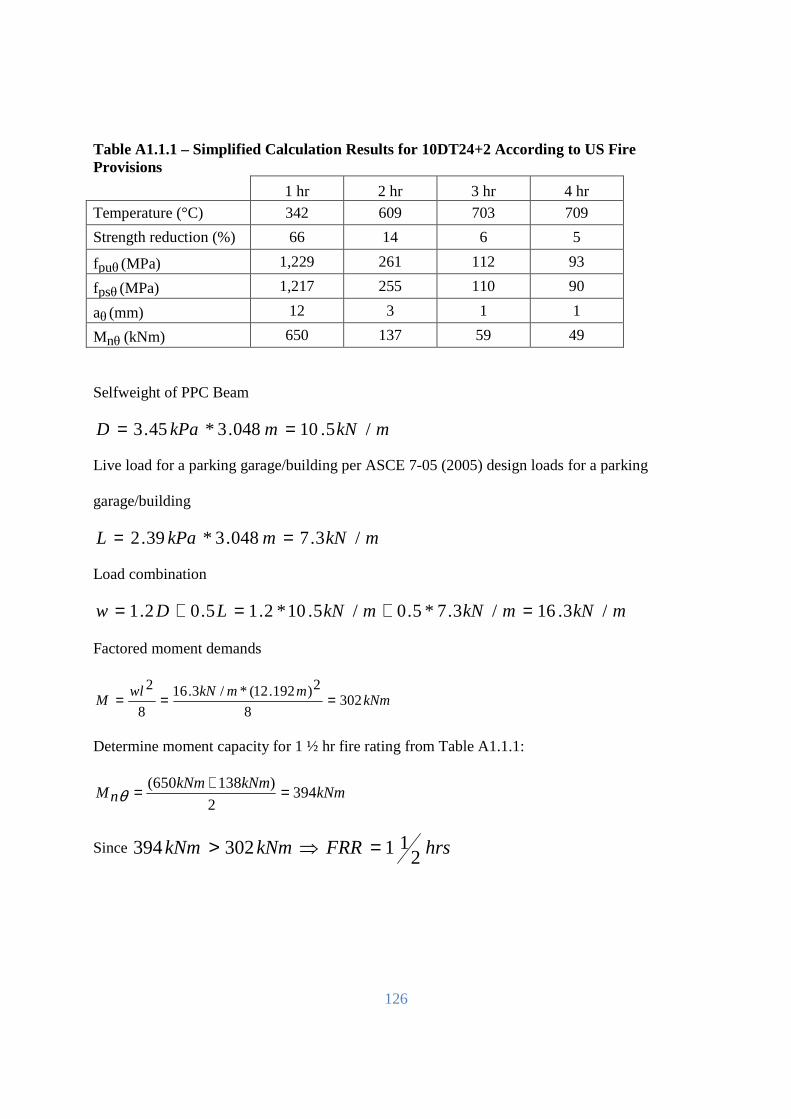
126
Table A1.1.1 – Simplified Calculation Results for 10DT24+2 According to US Fire Provisions 1 hr 2 hr 3 hr 4 hr
Temperature (°C) 342 609 703 709
Strength reduction (%) 66 14 6 5
fpuθ (MPa) 1,229 261 112 93
fpsθ (MPa) 1,217 255 110 90
aθ (mm) 12 3 1 1
Mnθ (kNm) 650 137 59 49
Selfweight of PPC Beam
mkNmkPaD /5.10048.3*45.3 ==
Live load for a parking garage/building per ASCE 7-05 (2005) design loads for a parking
garage/building
mkNmkPaL /3.7048.3*39.2 ==
Load combination
mkNmkNmkNLDw /3.16/3.7*5.0/5.10*2.15.02.1 =+=+=
Factored moment demands
kNmmmkNwl
M 3028
2)192.12(*/3.16
8
2===
Determine moment capacity for 1 ½ hr fire rating from Table A1.1.1:
kNmkNmkNm
nM 3942
)138650( =+=θ
Since hrsFRRkNmkNm 211302394 =⇒>
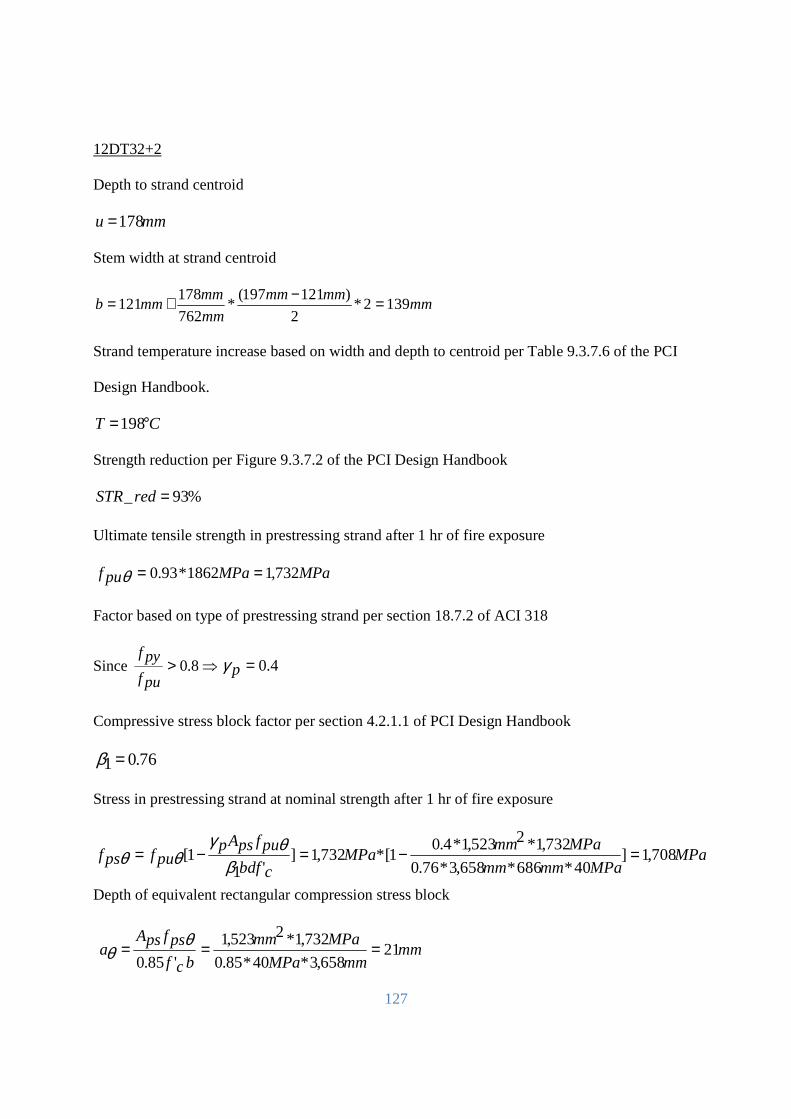
127
12DT32+2
Depth to strand centroid
mmu 178=
Stem width at strand centroid
mmmmmm
mm
mmmmb 1392*
2
)121197(*
762
178121 =−+=
Strand temperature increase based on width and depth to centroid per Table 9.3.7.6 of the PCI
Design Handbook.
CT °=198
Strength reduction per Figure 9.3.7.2 of the PCI Design Handbook
%93_ =redSTR
Ultimate tensile strength in prestressing strand after 1 hr of fire exposure
MPaMPapuf 732,11862*93.0 ==θ
Factor based on type of prestressing strand per section 18.7.2 of ACI 318
Since ⇒> 8.0puf
pyf4.0=pγ
Compressive stress block factor per section 4.2.1.1 of PCI Design Handbook
76.01=β
Stress in prestressing strand at nominal strength after 1 hr of fire exposure
MPaMPammmm
MPammMPa
cbdf
pufpsAppufpsf 708,1]
40*686*658,3*76.0
732,1*2523,1*4.01[*732,1]
'11[ =−=−=
βθγ
θθ
Depth of equivalent rectangular compression stress block
mm
mmMPa
MPamm
bcf
psfpsAa 21
658,3*40*85.0
732,1*2523,1
'85.0=== θ
θ

128
Moment capacity after 1 hr of fire exposure
kNmmm
mmMPamma
pdpsfpsAnM 782,1)2
21686(*732,1*2523,1)
2( =−=−= θθθ
Table A1.1.2 – Simplified Calculation Results for 12DT32+2 According to Canadian Fire Provisions 1 hr 2 hr 3 hr 4 hr Temperature (°C) 198 431 576 592
Strength reduction (%) 93 45 18 16
fpuθ (MPa) 1,732 838 335 298
fpsθ (MPa) 1,708 832 334 297
aθ (mm) 21 10 4 4
Mnθ (kNm) 1,782 863 348 309
Selfweight of PPC Beam
mkNmkPaD /9.146576.3*08.4 ==
Live load for a parking garage/building per ASCE 7-05 (2005) design loads for a parking
garage/building
mkNmkPaL /7.86576.3*39.2 ==
Load combination
mkNmkNmkNLDw /2.22/7.8*5.0/9.14*2.15.02.1 =+=+=
Factored moment demands
kNmmmkNwl
M 6458
2)24.15(*/2.22
8
2===
Since hrsFRRkNmkNm 2645863 =⇒>

129
Heat Transmission:
10DT24+2
Slab thickness
mmmmmmtoppingflangeh 1025151 =+=+=
Heat transmission fire resistance rating based on type of concrete and slab thickness per Table
9.3.6.1 of the PCI Design Handbook.
hrFRR 1=
12DT32+2
Slab thickness
mmmmmmtoppingflangeh 1025151 =+=+=
Heat transmission fire resistance rating based on type of concrete and slab thickness per Table
9.3.6.1 of the PCI Design Handbook.
hrFRR 1=
A.1.2 Canadian Fire Provisions
The National Building Code of Canada (2005) and CPCI Design Manual (2007) were selected to
illustrate how Canadian fire provisions determine the fire resistance of PPC beams. The
following calculations assume a normal weight concrete (Type N) composed of calcareous
(carbonate) aggregates.
Tabulated Data:
10DT24+2
Effective flange width for a T-beam per CAN3-D-2.10
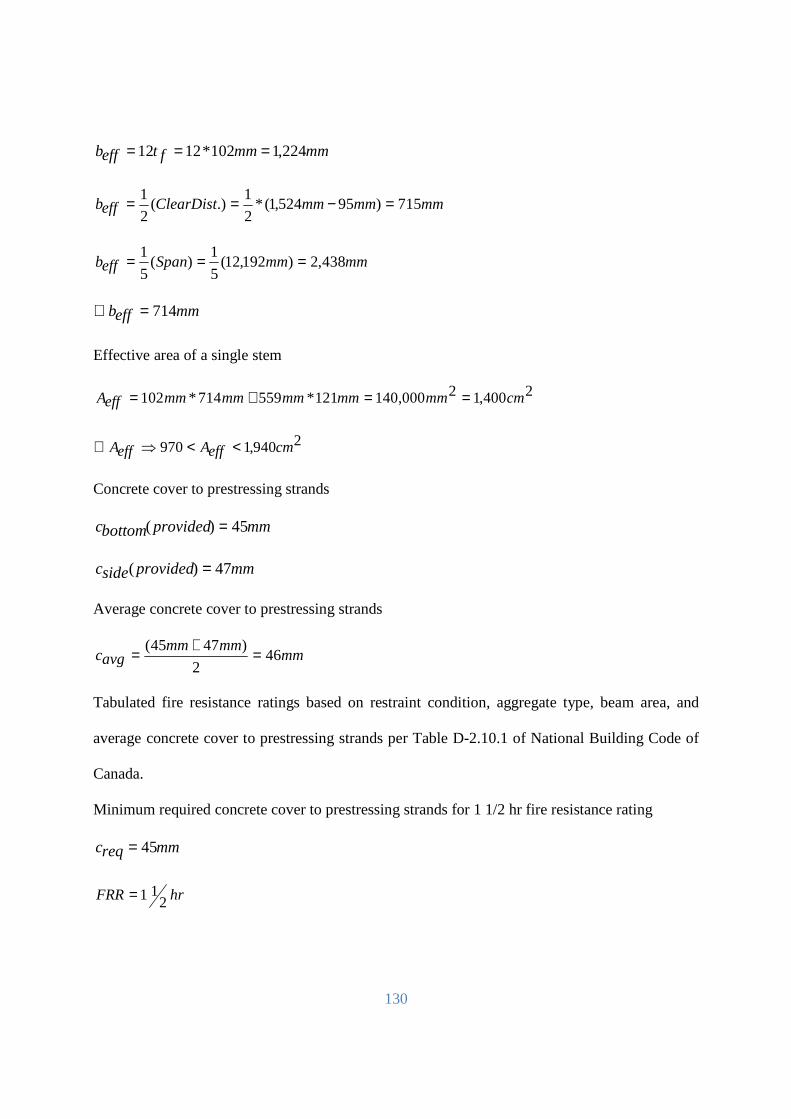
130
mmmmfteffb 224,1102*1212 ===
mmmmmmClearDisteffb 715)95524,1(*2
1.)(
2
1 =−==
mmmmSpaneffb 438,2)192,12(5
1)(
5
1 ===
mmeffb 714=∴
Effective area of a single stem
2400,12000,140121*559714*102 cmmmmmmmmmmmeffA ==+=
2940,1970 cmeffAeffA <<⇒∴
Concrete cover to prestressing strands
mmprovidedbottomc 45)( =
mmprovidedsidec 47)( =
Average concrete cover to prestressing strands
mmmmmm
avgc 462
)4745( =+=
Tabulated fire resistance ratings based on restraint condition, aggregate type, beam area, and
average concrete cover to prestressing strands per Table D-2.10.1 of National Building Code of
Canada.
Minimum required concrete cover to prestressing strands for 1 1/2 hr fire resistance rating
mmreqc 45=
hrFRR 211=
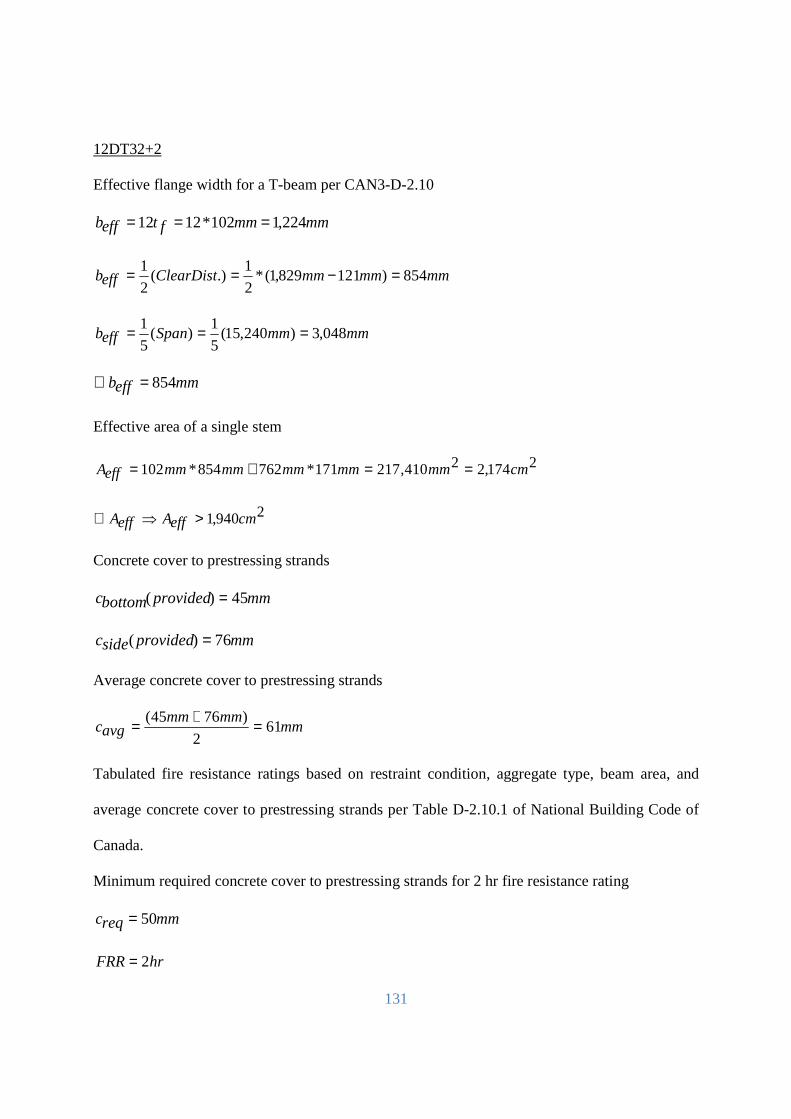
131
12DT32+2
Effective flange width for a T-beam per CAN3-D-2.10
mmmmfteffb 224,1102*1212 ===
mmmmmmClearDisteffb 854)121829,1(*2
1.)(
2
1 =−==
mmmmSpaneffb 048,3)240,15(5
1)(
5
1 ===
mmeffb 854=∴
Effective area of a single stem
2174,22410,217171*762854*102 cmmmmmmmmmmmeffA ==+=
2940,1 cmeffAeffA >⇒∴
Concrete cover to prestressing strands
mmprovidedbottomc 45)( =
mmprovidedsidec 76)( =
Average concrete cover to prestressing strands
mmmmmm
avgc 612
)7645( =+=
Tabulated fire resistance ratings based on restraint condition, aggregate type, beam area, and
average concrete cover to prestressing strands per Table D-2.10.1 of National Building Code of
Canada.
Minimum required concrete cover to prestressing strands for 2 hr fire resistance rating
mmreqc 50=
hrFRR 2=
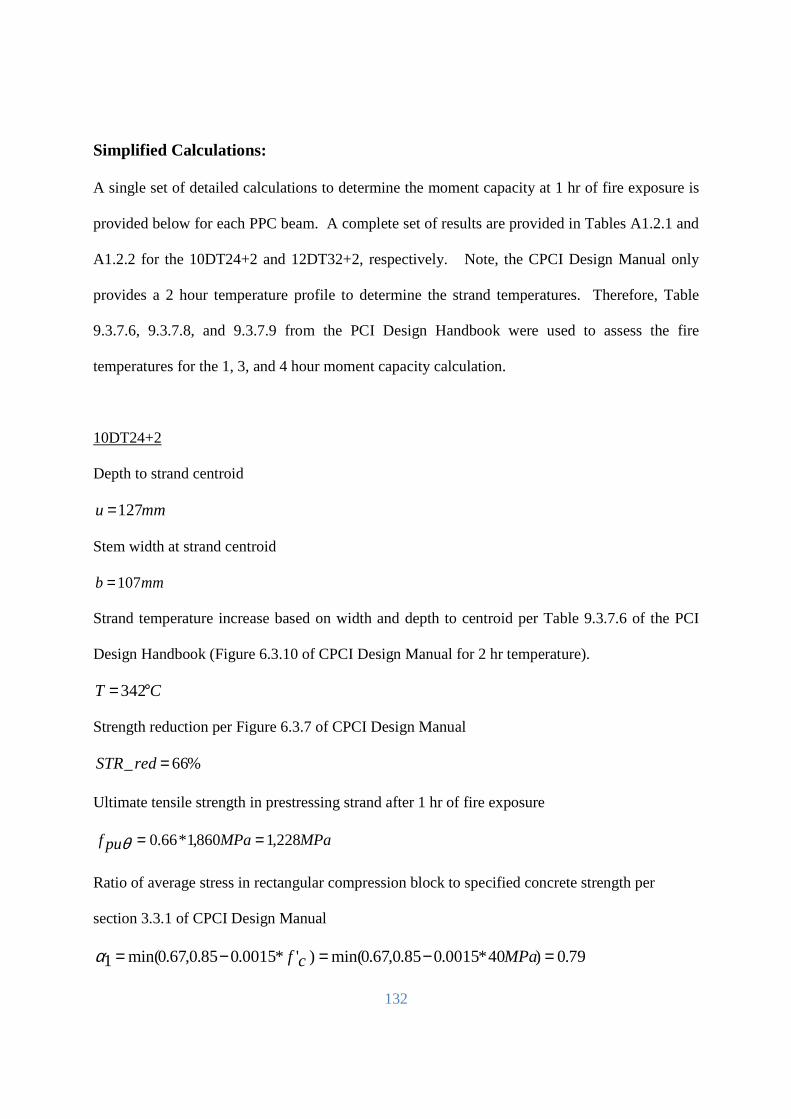
132
Simplified Calculations:
A single set of detailed calculations to determine the moment capacity at 1 hr of fire exposure is
provided below for each PPC beam. A complete set of results are provided in Tables A1.2.1 and
A1.2.2 for the 10DT24+2 and 12DT32+2, respectively. Note, the CPCI Design Manual only
provides a 2 hour temperature profile to determine the strand temperatures. Therefore, Table
9.3.7.6, 9.3.7.8, and 9.3.7.9 from the PCI Design Handbook were used to assess the fire
temperatures for the 1, 3, and 4 hour moment capacity calculation.
10DT24+2
Depth to strand centroid
mmu 127=
Stem width at strand centroid
mmb 107=
Strand temperature increase based on width and depth to centroid per Table 9.3.7.6 of the PCI
Design Handbook (Figure 6.3.10 of CPCI Design Manual for 2 hr temperature).
CT °= 342
Strength reduction per Figure 6.3.7 of CPCI Design Manual
%66_ =redSTR
Ultimate tensile strength in prestressing strand after 1 hr of fire exposure
MPaMPapuf 228,1860,1*66.0 ==θ
Ratio of average stress in rectangular compression block to specified concrete strength per
section 3.3.1 of CPCI Design Manual
79.0)40*0015.085.0,67.0min()'*0015.085.0,67.0min(1 =−=−= MPacfα
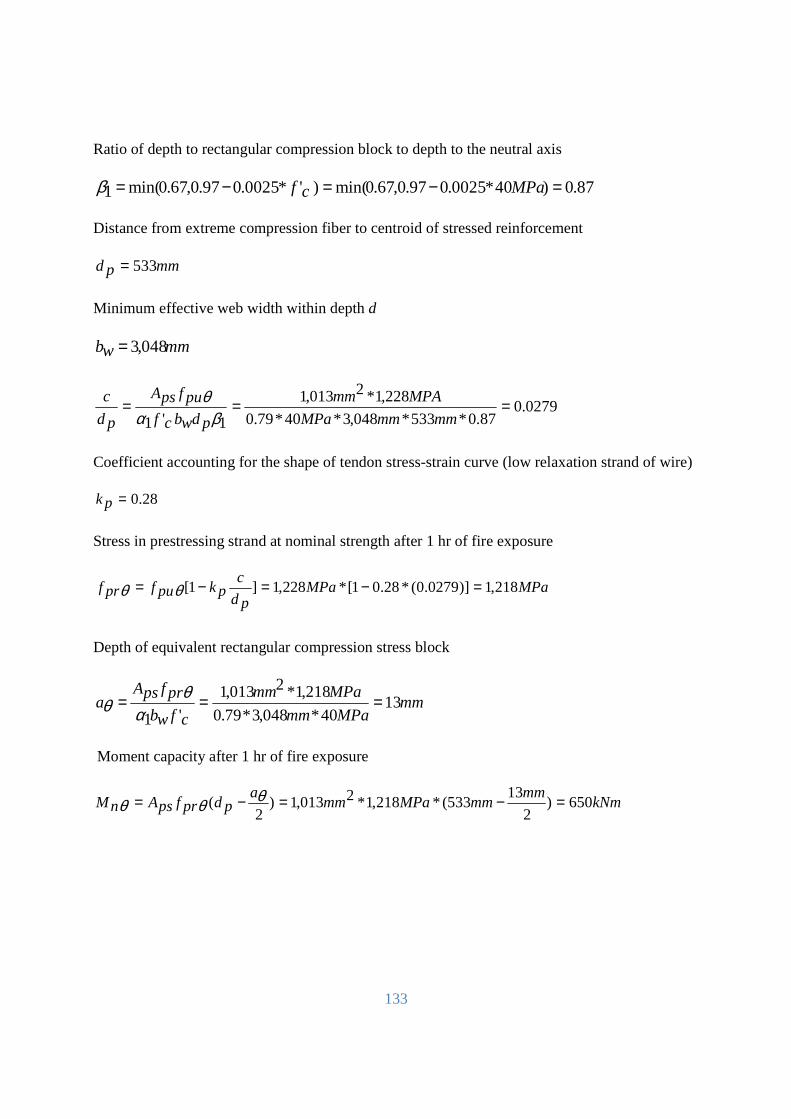
133
Ratio of depth to rectangular compression block to depth to the neutral axis
87.0)40*0025.097.0,67.0min()'*0025.097.0,67.0min(1 =−=−= MPacfβ
Distance from extreme compression fiber to centroid of stressed reinforcement
mmpd 533=
Minimum effective web width within depth d
mmwb 048,3=
0279.087.0*533*048,3*40*79.0
228,1*2013,1
1'1===
mmmmMPa
MPAmm
pdwbcf
pufpsA
pd
c
βαθ
Coefficient accounting for the shape of tendon stress-strain curve (low relaxation strand of wire)
28.0=pk
Stress in prestressing strand at nominal strength after 1 hr of fire exposure
MPaMPapd
cpkpufprf 218,1)]0279.0(*28.01[*228,1]1[ =−=−= θθ
Depth of equivalent rectangular compression stress block
mmMPamm
MPamm
cfwb
prfpsAa 13
40*048,3*79.0
218,1*2013,1
'1===
αθ
θ
Moment capacity after 1 hr of fire exposure
kNmmm
mmMPamma
pdprfpsAnM 650)2
13533(*218,1*2013,1)
2( =−=−= θθθ
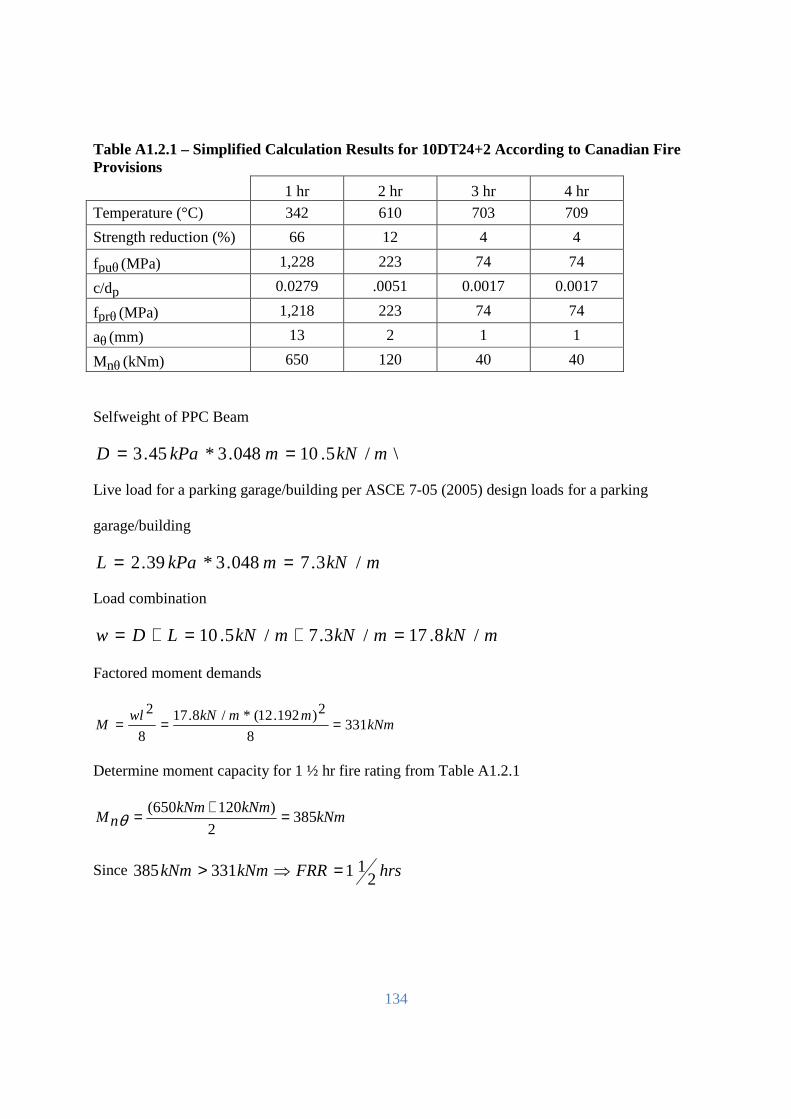
134
Table A1.2.1 – Simplified Calculation Results for 10DT24+2 According to Canadian Fire Provisions 1 hr 2 hr 3 hr 4 hr
Temperature (°C) 342 610 703 709
Strength reduction (%) 66 12 4 4
fpuθ (MPa) 1,228 223 74 74
c/dp 0.0279 .0051 0.0017 0.0017
fprθ (MPa) 1,218 223 74 74
aθ (mm) 13 2 1 1
Mnθ (kNm) 650 120 40 40
Selfweight of PPC Beam
\/5.10048.3*45.3 mkNmkPaD ==
Live load for a parking garage/building per ASCE 7-05 (2005) design loads for a parking
garage/building
mkNmkPaL /3.7048.3*39.2 ==
Load combination
mkNmkNmkNLDw /8.17/3.7/5.10 =+=+=
Factored moment demands
kNmmmkNwl
M 3318
2)192.12(*/8.17
8
2===
Determine moment capacity for 1 ½ hr fire rating from Table A1.2.1
kNmkNmkNm
nM 3852
)120650( =+=θ
Since hrsFRRkNmkNm 211331385 =⇒>
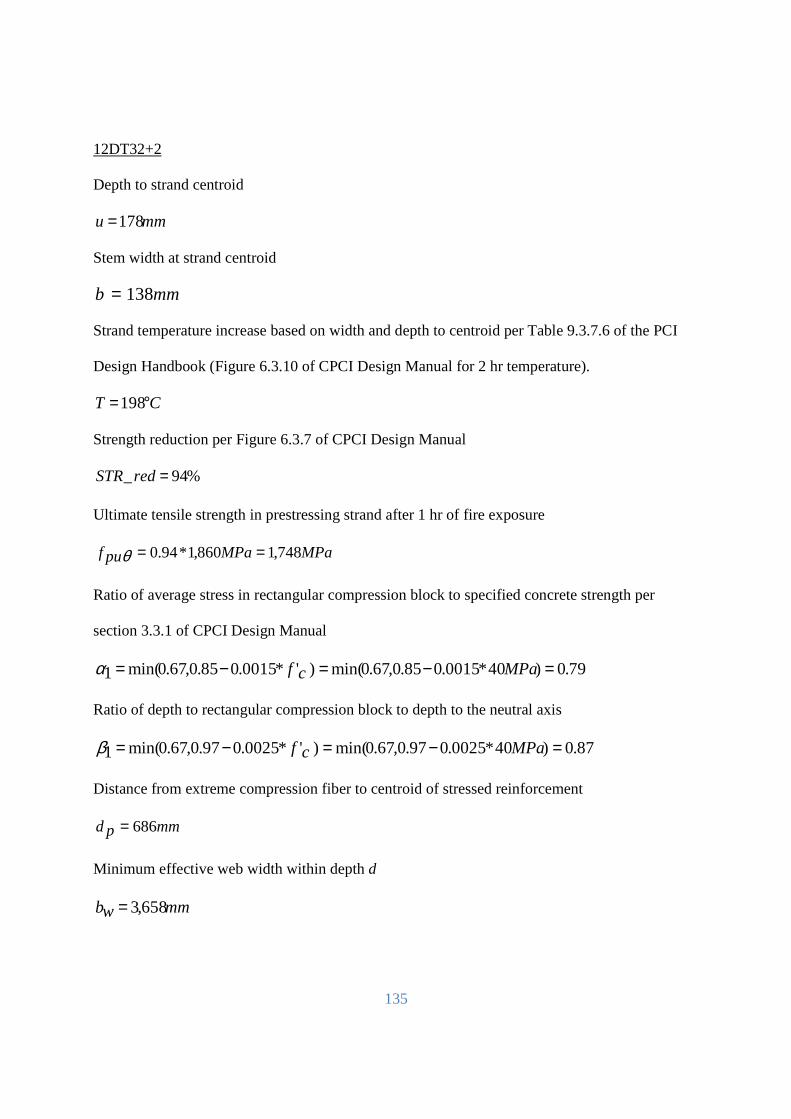
135
12DT32+2
Depth to strand centroid
mmu 178=
Stem width at strand centroid
mmb 138=
Strand temperature increase based on width and depth to centroid per Table 9.3.7.6 of the PCI
Design Handbook (Figure 6.3.10 of CPCI Design Manual for 2 hr temperature).
CT °=198
Strength reduction per Figure 6.3.7 of CPCI Design Manual
%94_ =redSTR
Ultimate tensile strength in prestressing strand after 1 hr of fire exposure
MPaMPapuf 748,1860,1*94.0 ==θ
Ratio of average stress in rectangular compression block to specified concrete strength per
section 3.3.1 of CPCI Design Manual
79.0)40*0015.085.0,67.0min()'*0015.085.0,67.0min(1 =−=−= MPacfα
Ratio of depth to rectangular compression block to depth to the neutral axis
87.0)40*0025.097.0,67.0min()'*0025.097.0,67.0min(1 =−=−= MPacfβ
Distance from extreme compression fiber to centroid of stressed reinforcement
mmpd 686=
Minimum effective web width within depth d
mmwb 658,3=

136
0257.087.0*686*658,3*40*79.0
748,1*2013,1
1'1===
mmmmMPa
MPAmm
pdwbcf
pufpsA
pd
c
βαθ
Coefficient accounting for the shape of tendon stress-strain curve (low relaxation strand of wire)
28.0=pk
Stress in prestressing strand at nominal strength after 1 hr of fire exposure
MPaMPapd
cpkpufprf 735,1)]0257.0(*28.01[*748,1]1[ =−=−= θθ
Depth of equivalent rectangular compression stress block
mmMPamm
MPamm
cfwb
prfpsAa 15
40*658,3*79.0
735,1*2013,1
'1===
αθ
θ
Moment capacity after 1 hr of fire exposure
kNmmm
mmMPamma
pdprfpsAnM 192,1)2
15686(*735,1*2013,1)
2( =−=−= θθθ
Table A1.2.2 – Simplified Calculation Results for 12DT32+2 According to Canadian Fire Provisions 1 hr 2 hr 3 hr 4 hr Temperature (°C) 198 460 703 709
Strength reduction (%) 94 35 15 13
fpuθ (MPa) 1,748 651 279 242
c/dp 0.0257 .0096 0.0041 0.0036
fprθ (MPa) 1,735 649 279 242
aθ (mm) 15 6 2 2
Mnθ (kNm) 1,192 449 194 168
Selfweight of PPC Beam
mkNmkPaD /9.146576.3*08.4 ==
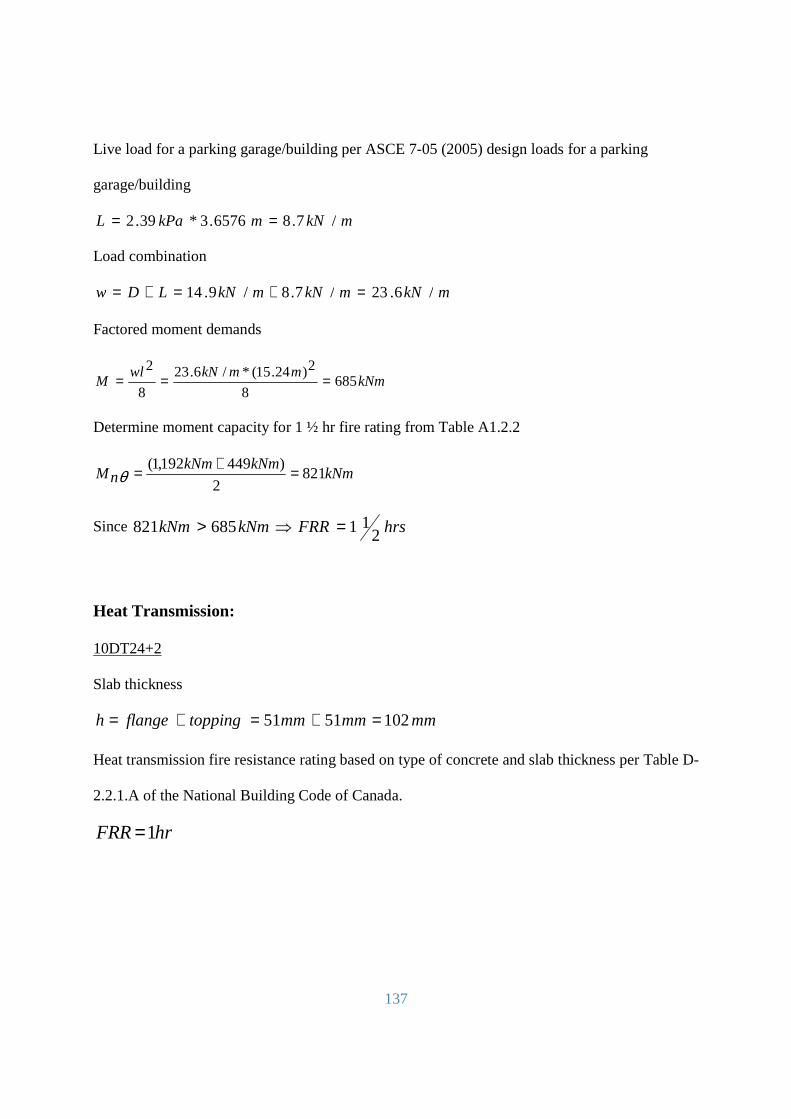
137
Live load for a parking garage/building per ASCE 7-05 (2005) design loads for a parking
garage/building
mkNmkPaL /7.86576.3*39.2 ==
Load combination
mkNmkNmkNLDw /6.23/7.8/9.14 =+=+=
Factored moment demands
kNmmmkNwl
M 6858
2)24.15(*/6.23
8
2===
Determine moment capacity for 1 ½ hr fire rating from Table A1.2.2
kNmkNmkNm
nM 8212
)449192,1( =+=θ
Since hrsFRRkNmkNm 211685821 =⇒>
Heat Transmission:
10DT24+2
Slab thickness
mmmmmmtoppingflangeh 1025151 =+=+=
Heat transmission fire resistance rating based on type of concrete and slab thickness per Table D-
2.2.1.A of the National Building Code of Canada.
hrFRR 1=
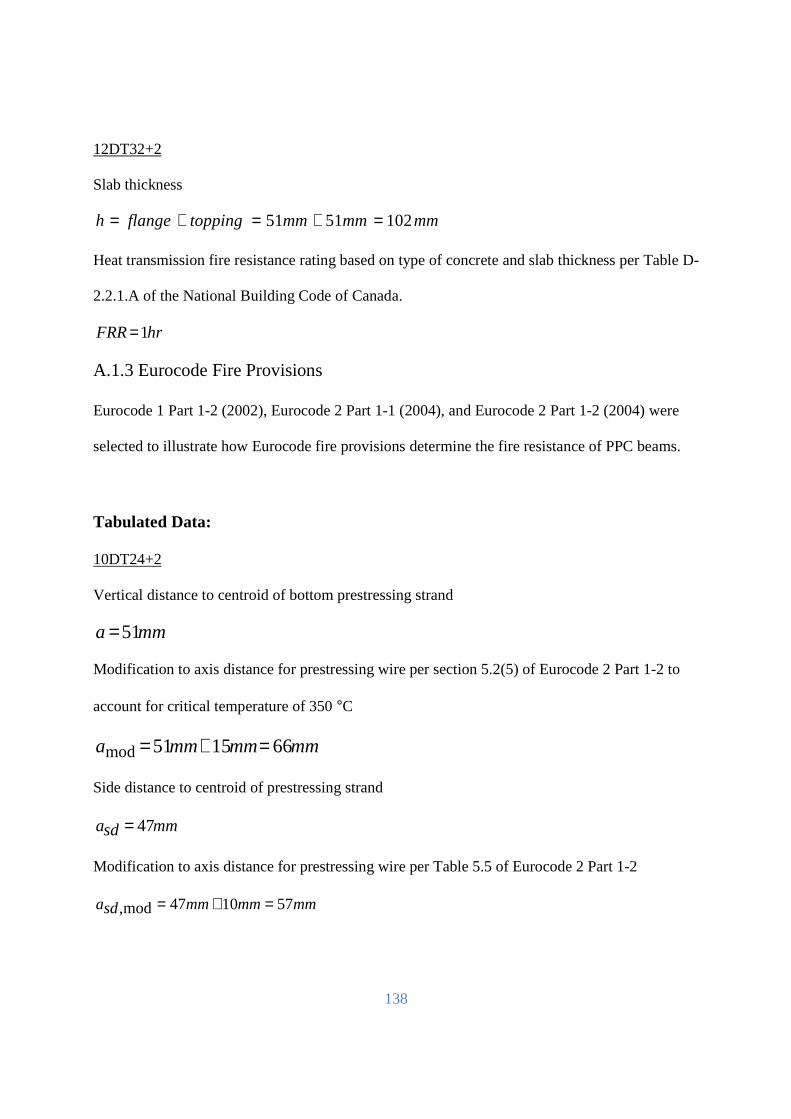
138
12DT32+2
Slab thickness
mmmmmmtoppingflangeh 1025151 =+=+=
Heat transmission fire resistance rating based on type of concrete and slab thickness per Table D-
2.2.1.A of the National Building Code of Canada.
hrFRR 1=
A.1.3 Eurocode Fire Provisions
Eurocode 1 Part 1-2 (2002), Eurocode 2 Part 1-1 (2004), and Eurocode 2 Part 1-2 (2004) were
selected to illustrate how Eurocode fire provisions determine the fire resistance of PPC beams.
Tabulated Data:
10DT24+2
Vertical distance to centroid of bottom prestressing strand
mma 51=
Modification to axis distance for prestressing wire per section 5.2(5) of Eurocode 2 Part 1-2 to
account for critical temperature of 350 °C
mmmmmma 661551mod =+=
Side distance to centroid of prestressing strand
mmsda 47=
Modification to axis distance for prestressing wire per Table 5.5 of Eurocode 2 Part 1-2
mmmmmmsda 571047mod, =+=
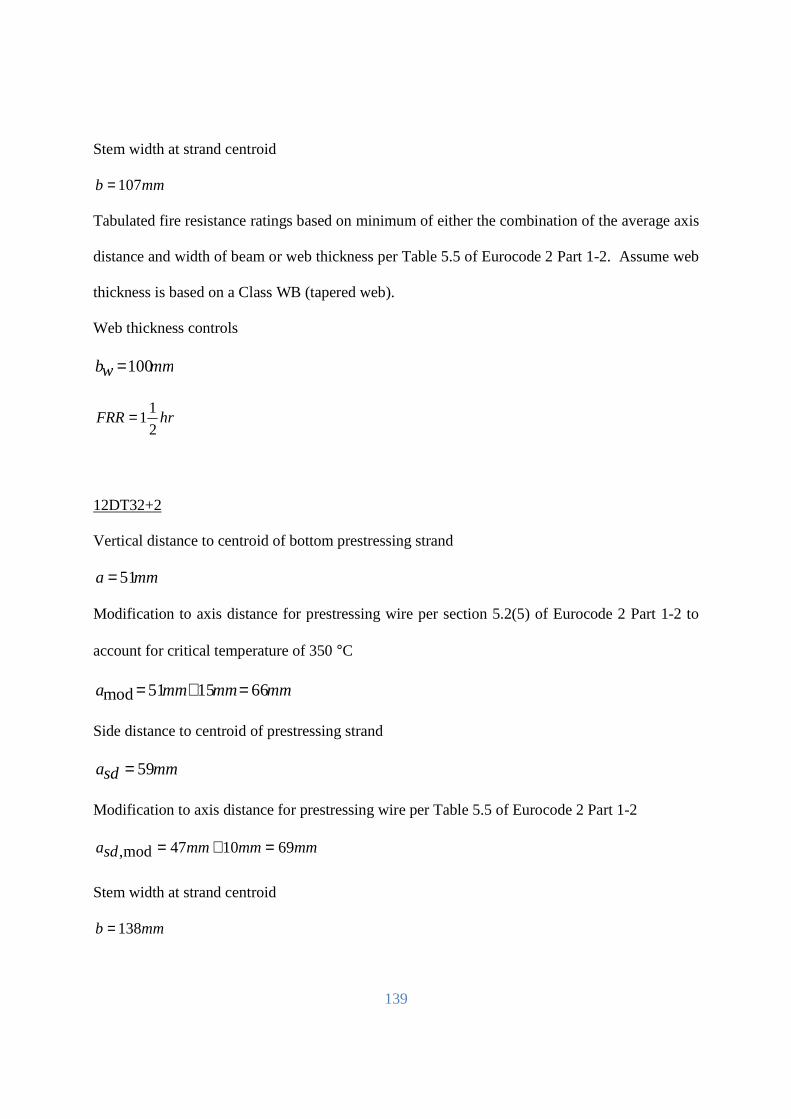
139
Stem width at strand centroid
mmb 107=
Tabulated fire resistance ratings based on minimum of either the combination of the average axis
distance and width of beam or web thickness per Table 5.5 of Eurocode 2 Part 1-2. Assume web
thickness is based on a Class WB (tapered web).
Web thickness controls
mmwb 100=
hrFRR2
11=
12DT32+2
Vertical distance to centroid of bottom prestressing strand
mma 51=
Modification to axis distance for prestressing wire per section 5.2(5) of Eurocode 2 Part 1-2 to
account for critical temperature of 350 °C
mmmmmma 661551mod =+=
Side distance to centroid of prestressing strand
mmsda 59=
Modification to axis distance for prestressing wire per Table 5.5 of Eurocode 2 Part 1-2
mmmmmmsda 691047mod, =+=
Stem width at strand centroid
mmb 138=
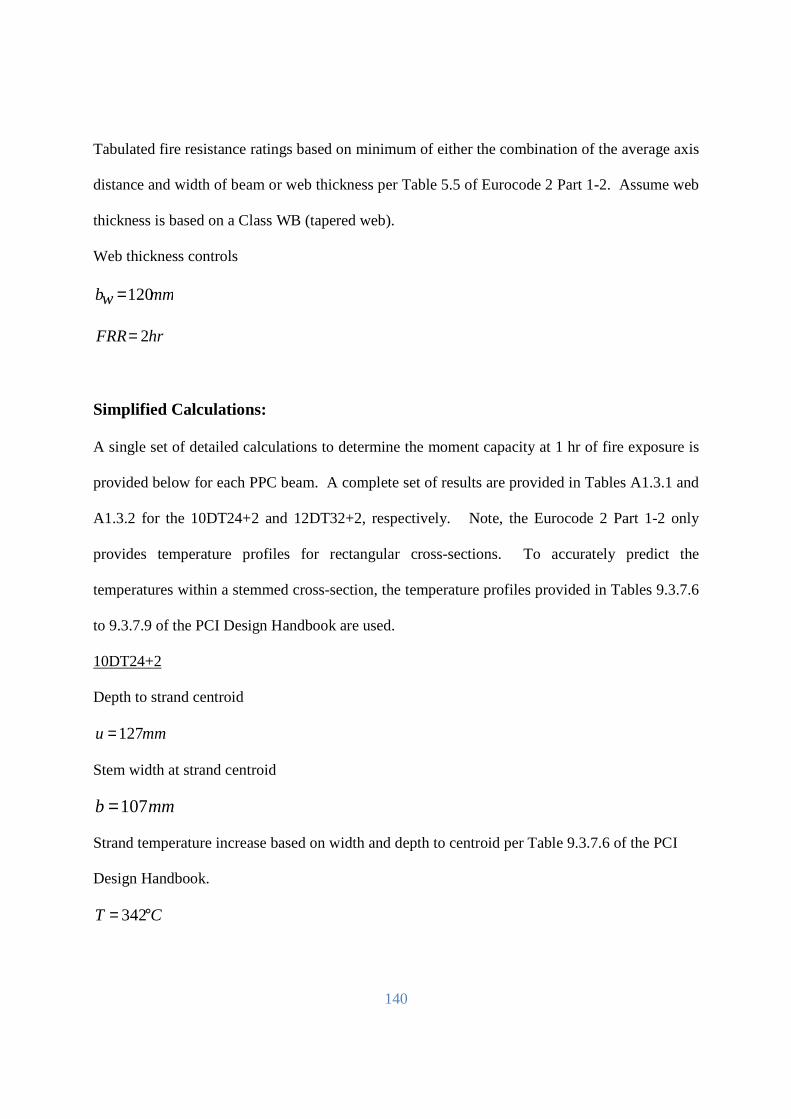
140
Tabulated fire resistance ratings based on minimum of either the combination of the average axis
distance and width of beam or web thickness per Table 5.5 of Eurocode 2 Part 1-2. Assume web
thickness is based on a Class WB (tapered web).
Web thickness controls
mmwb 120=
hrFRR 2=
Simplified Calculations:
A single set of detailed calculations to determine the moment capacity at 1 hr of fire exposure is
provided below for each PPC beam. A complete set of results are provided in Tables A1.3.1 and
A1.3.2 for the 10DT24+2 and 12DT32+2, respectively. Note, the Eurocode 2 Part 1-2 only
provides temperature profiles for rectangular cross-sections. To accurately predict the
temperatures within a stemmed cross-section, the temperature profiles provided in Tables 9.3.7.6
to 9.3.7.9 of the PCI Design Handbook are used.
10DT24+2
Depth to strand centroid
mmu 127=
Stem width at strand centroid
mmb 107=
Strand temperature increase based on width and depth to centroid per Table 9.3.7.6 of the PCI
Design Handbook.
CT °= 342
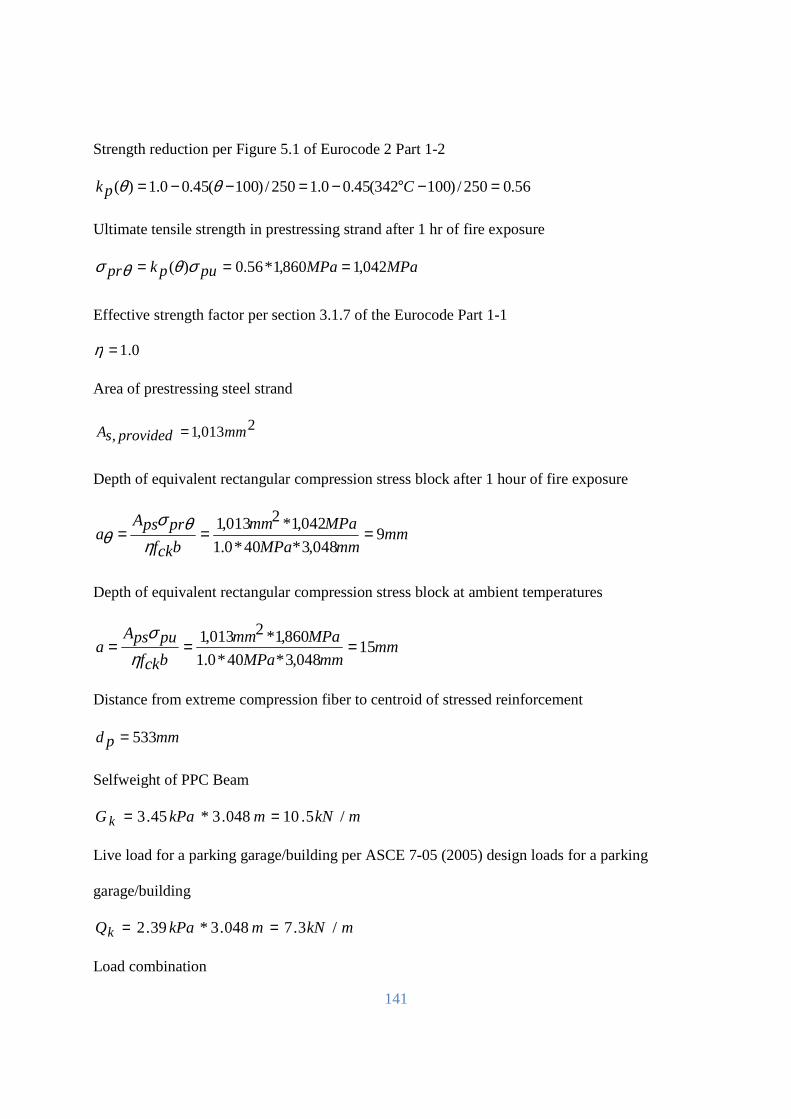
141
Strength reduction per Figure 5.1 of Eurocode 2 Part 1-2
56.0250/)100342(45.00.1250/)100(45.00.1)( =−°−=−−= Cpk θθ
Ultimate tensile strength in prestressing strand after 1 hr of fire exposure
MPaMPapupkpr 042,1860,1*56.0)( === σθθσ
Effective strength factor per section 3.1.7 of the Eurocode Part 1-1
0.1=η
Area of prestressing steel strand
2013,1, mmprovidedsA =
Depth of equivalent rectangular compression stress block after 1 hour of fire exposure
mmmmMPa
MPamm
bckf
prpsAa 9
048,3*40*0.1
042,1*2013,1 ===η
θσθ
Depth of equivalent rectangular compression stress block at ambient temperatures
mmmmMPa
MPamm
bckf
pupsAa 15
048,3*40*0.1
860,1*2013,1 ===η
σ
Distance from extreme compression fiber to centroid of stressed reinforcement
mmpd 533=
Selfweight of PPC Beam
mkNmkPaGk /5.10048.3*45.3 ==
Live load for a parking garage/building per ASCE 7-05 (2005) design loads for a parking
garage/building
mkNmkPaQk /3.7048.3*39.2 ==
Load combination
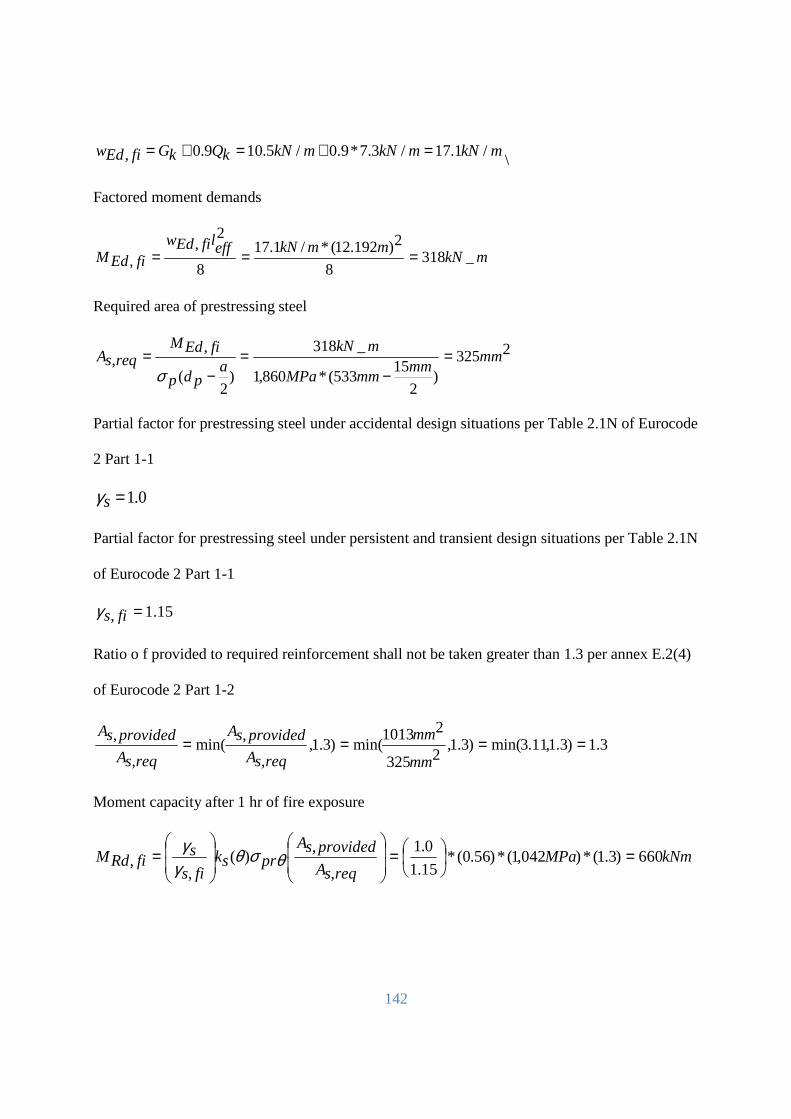
142
mkNmkNmkNkQkGfiEdw /1.17/3.7*9.0/5.109.0, =+=+=\
Factored moment demands
mkNmmkNefflfiEdw
fiEdM _3188
2)192.12(*/1.17
8
2,
, ===
Required area of prestressing steel
2325)
2
15533(*860,1
_318
)2
(
,, mm
mmmmMPa
mkNa
pdp
fiEdMreqsA =
−=
−=
σ
Partial factor for prestressing steel under accidental design situations per Table 2.1N of Eurocode
2 Part 1-1
0.1=sγ
Partial factor for prestressing steel under persistent and transient design situations per Table 2.1N
of Eurocode 2 Part 1-1
15.1, =fisγ
Ratio o f provided to required reinforcement shall not be taken greater than 1.3 per annex E.2(4)
of Eurocode 2 Part 1-2
3.1)3.1,11.3min()3.1,2325
21013min()3.1,
,
,min(
,
, ====mm
mm
reqsA
providedsA
reqsA
providedsA
Moment capacity after 1 hr of fire exposure
kNmMPareqsA
providedsAprsk
fis
sfiRdM 660)3.1(*)042,1(*)56.0(*
15.1
0.1
,
,)(
,, =
=
= θσθ
γγ
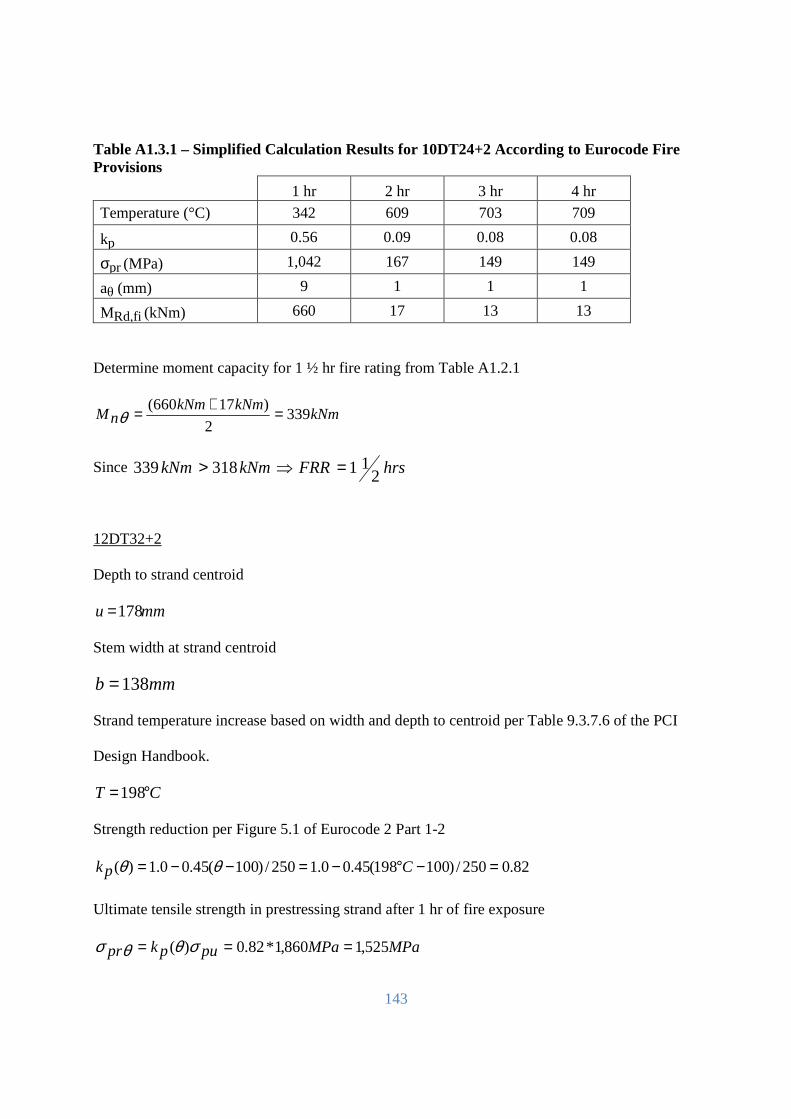
143
Table A1.3.1 – Simplified Calculation Results for 10DT24+2 According to Eurocode Fire Provisions 1 hr 2 hr 3 hr 4 hr
Temperature (°C) 342 609 703 709
kp 0.56 0.09 0.08 0.08
σpr (MPa) 1,042 167 149 149
aθ (mm) 9 1 1 1
MRd,fi (kNm) 660 17 13 13
Determine moment capacity for 1 ½ hr fire rating from Table A1.2.1
kNmkNmkNm
nM 3392
)17660( =+=θ
Since hrsFRRkNmkNm 211318339 =⇒>
12DT32+2
Depth to strand centroid
mmu 178=
Stem width at strand centroid
mmb 138=
Strand temperature increase based on width and depth to centroid per Table 9.3.7.6 of the PCI
Design Handbook.
CT °=198
Strength reduction per Figure 5.1 of Eurocode 2 Part 1-2
82.0250/)100198(45.00.1250/)100(45.00.1)( =−°−=−−= Cpk θθ
Ultimate tensile strength in prestressing strand after 1 hr of fire exposure
MPaMPapupkpr 525,1860,1*82.0)( === σθθσ
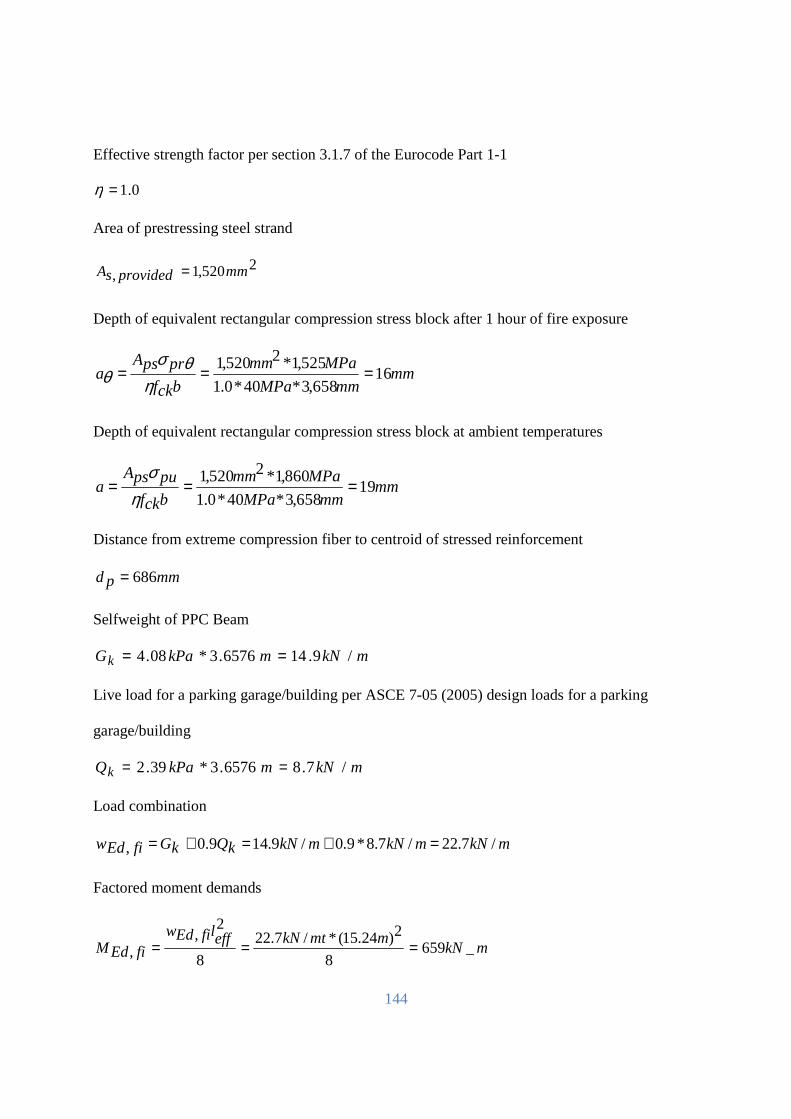
144
Effective strength factor per section 3.1.7 of the Eurocode Part 1-1
0.1=η
Area of prestressing steel strand
2520,1, mmprovidedsA =
Depth of equivalent rectangular compression stress block after 1 hour of fire exposure
mmmmMPa
MPamm
bckf
prpsAa 16
658,3*40*0.1
525,1*2520,1 ===η
θσθ
Depth of equivalent rectangular compression stress block at ambient temperatures
mmmmMPa
MPamm
bckf
pupsAa 19
658,3*40*0.1
860,1*2520,1 ===η
σ
Distance from extreme compression fiber to centroid of stressed reinforcement
mmpd 686=
Selfweight of PPC Beam
mkNmkPaGk /9.146576.3*08.4 ==
Live load for a parking garage/building per ASCE 7-05 (2005) design loads for a parking
garage/building
mkNmkPaQk /7.86576.3*39.2 ==
Load combination
mkNmkNmkNkQkGfiEdw /7.22/7.8*9.0/9.149.0, =+=+=
Factored moment demands
mkNmmtkNefflfiEdw
fiEdM _6598
2)24.15(*/7.22
8
2,
, ===
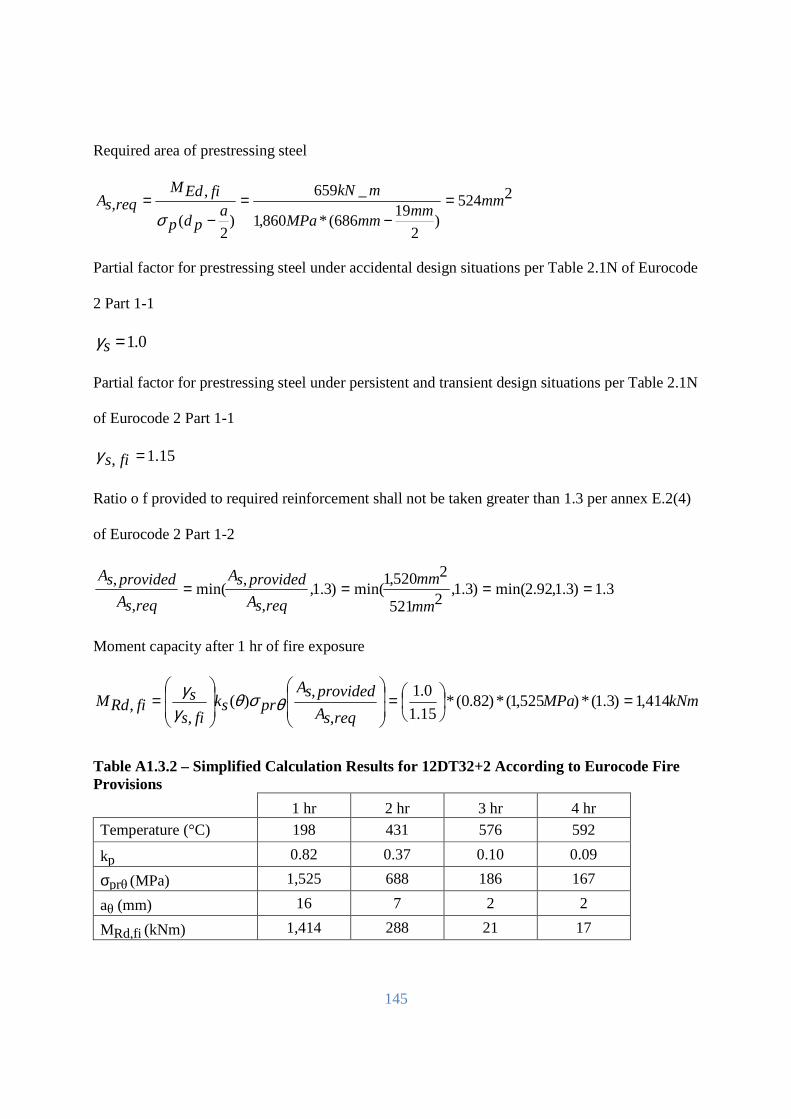
145
Required area of prestressing steel
2524)
2
19686(*860,1
_659
)2
(
,, mm
mmmmMPa
mkNa
pdp
fiEdMreqsA =
−=
−=
σ
Partial factor for prestressing steel under accidental design situations per Table 2.1N of Eurocode
2 Part 1-1
0.1=sγ
Partial factor for prestressing steel under persistent and transient design situations per Table 2.1N
of Eurocode 2 Part 1-1
15.1, =fisγ
Ratio o f provided to required reinforcement shall not be taken greater than 1.3 per annex E.2(4)
of Eurocode 2 Part 1-2
3.1)3.1,92.2min()3.1,2521
2520,1min()3.1,
,
,min(
,
, ====mm
mm
reqsA
providedsA
reqsA
providedsA
Moment capacity after 1 hr of fire exposure
kNmMPareqsA
providedsAprsk
fis
sfiRdM 414,1)3.1(*)525,1(*)82.0(*
15.1
0.1
,
,)(
,, =
=
= θσθ
γγ
Table A1.3.2 – Simplified Calculation Results for 12DT32+2 According to Eurocode Fire Provisions 1 hr 2 hr 3 hr 4 hr Temperature (°C) 198 431 576 592
kp 0.82 0.37 0.10 0.09
σprθ (MPa) 1,525 688 186 167
aθ (mm) 16 7 2 2
MRd,fi (kNm) 1,414 288 21 17
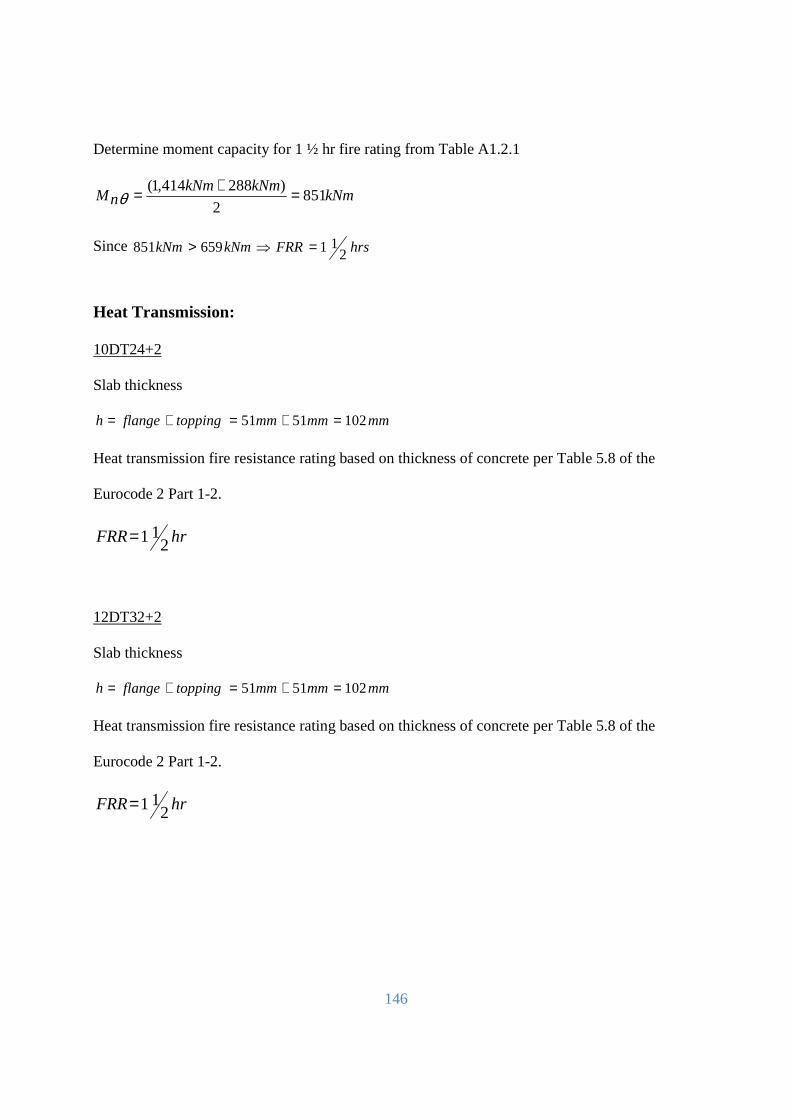
146
Determine moment capacity for 1 ½ hr fire rating from Table A1.2.1
kNmkNmkNm
nM 8512
)288414,1( =+=θ
Since hrsFRRkNmkNm 211659851 =⇒>
Heat Transmission:
10DT24+2
Slab thickness
mmmmmmtoppingflangeh 1025151 =+=+=
Heat transmission fire resistance rating based on thickness of concrete per Table 5.8 of the
Eurocode 2 Part 1-2.
hrFRR 211=
12DT32+2
Slab thickness
mmmmmmtoppingflangeh 1025151 =+=+=
Heat transmission fire resistance rating based on thickness of concrete per Table 5.8 of the
Eurocode 2 Part 1-2.
hrFRR 211=
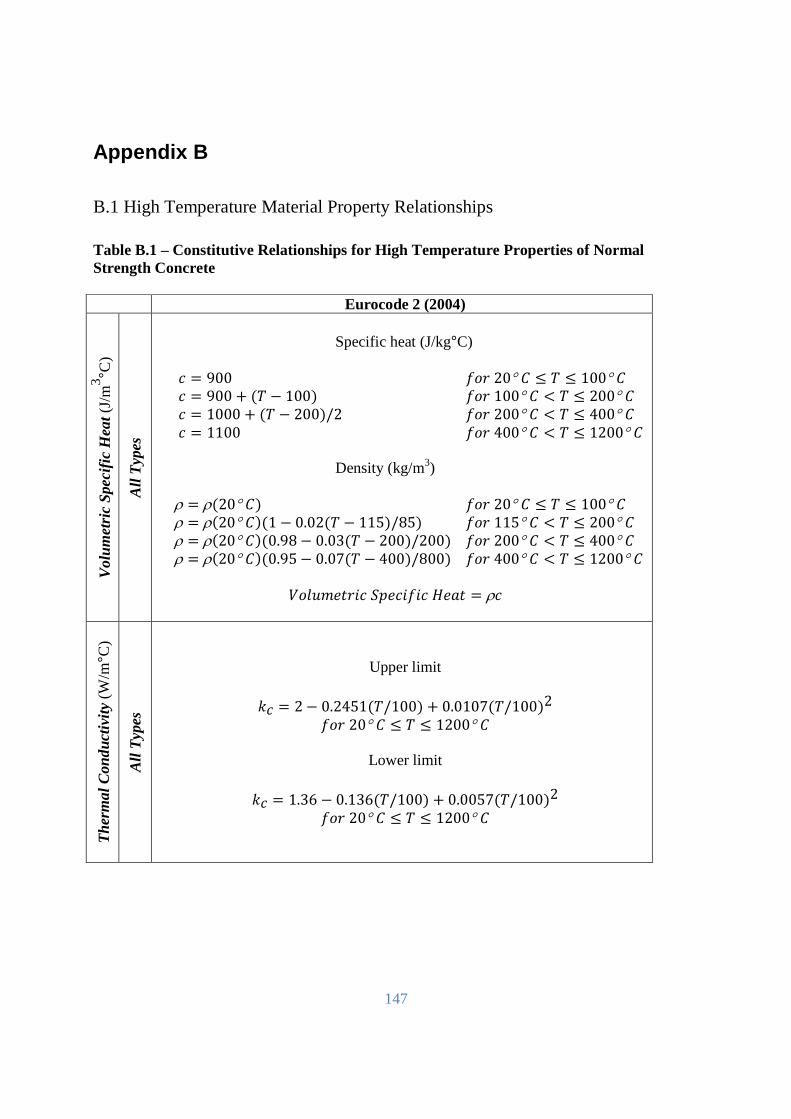
147
Appendix B
B.1 High Temperature Material Property Relationships
Table B.1 – Constitutive Relationships for High Temperature Properties of Normal Strength Concrete
Eurocode 2 (2004)
Vol
umet
ric S
peci
fic H
eat (J
/m3 °C
)
All
Typ
es
Specific heat (J/kg°C)
� = 900 ��� 20° ≤ � ≤ 100° � = 900 + (� − 100) ��� 100° < � ≤ 200° � = 1000 + (� − 200)/2 ��� 200° < � ≤ 400° � = 1100 ��� 400° < � ≤ 1200°
Density (kg/m3)
ρ = ρ(20° ) ��� 20° ≤ � ≤ 100° ρ = ρ(20° )(1 − 0.02(� − 115)/85) ��� 115° < � ≤ 200° ρ = ρ(20° )(0.98 − 0.03(� − 200)/200) ��� 200° < � ≤ 400° ρ = ρ(20° )(0.95 − 0.07(� − 400)/800) ��� 400° < � ≤ 1200°
�������� � !"�� � � #�$� = ρ�
The
rmal
Con
duc
tivity
(W
/m°C
)
All
Typ
es
Upper limit %� = 2 − 0.2451(�/100) + 0.0107(�/100)2 ��� 20° ≤ � ≤ 1200°
Lower limit %� = 1.36 − 0.136(�/100) + 0.0057(�/100)2 ��� 20° ≤ � ≤ 1200°
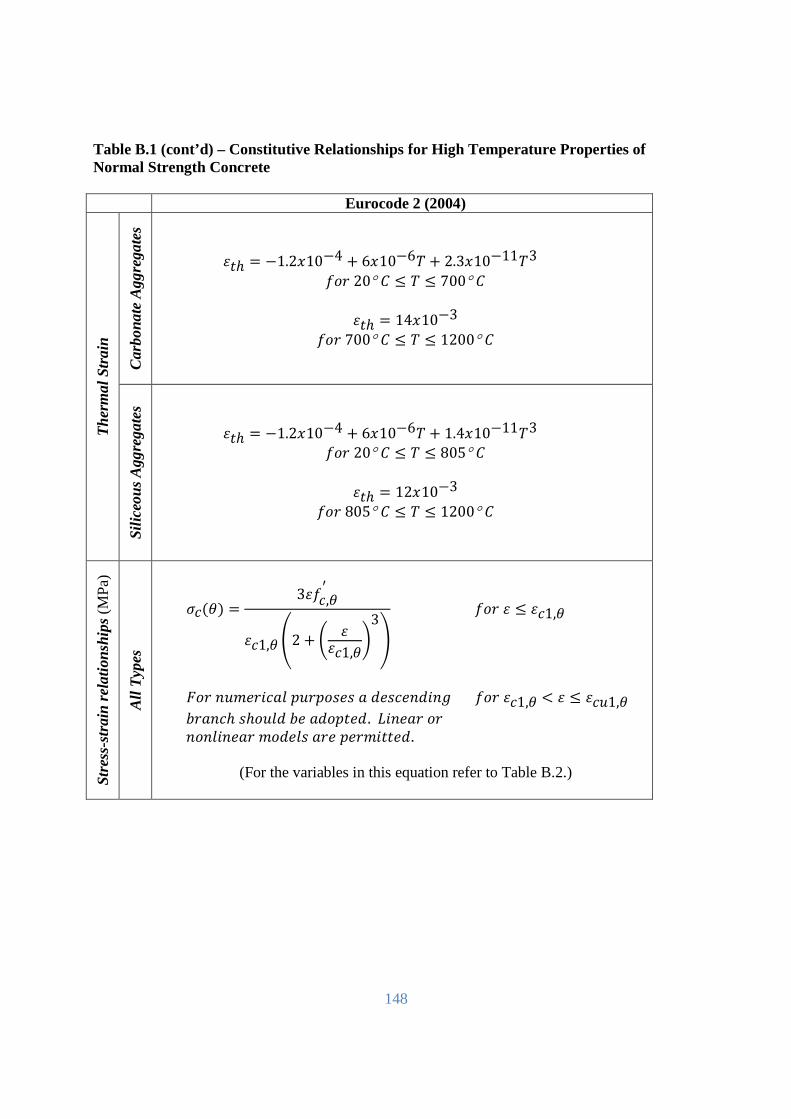
148
Table B.1 (cont’d) – Constitutive Relationships for High Temperature Properties of Normal Strength Concrete
Eurocode 2 (2004)
The
rmal
Str
ain
Car
bona
te A
ggre
gate
s
'�ℎ = −1.2)10−4 + 6)10−6� + 2.3)10−11�3 ��� 20° ≤ � ≤ 700° '�ℎ = 14)10−3 ��� 700° ≤ � ≤ 1200°
Sili
ceou
s A
ggre
gate
s
'�ℎ = −1.2)10−4 + 6)10−6� + 1.4)10−11�3 ��� 20° ≤ � ≤ 805° '�ℎ = 12)10−3 ��� 805° ≤ � ≤ 1200°
Str
ess-
stra
in r
elat
ions
hips
(MP
a)
All
Typ
es
*�(+) = 3'��,+′'�1,+ .2 + / ''�1,+031
��� ' ≤ '�1,+ 2�� 3���� �$� "��"�4�4 $ 5�4��35 36 ��� '�1,+ < ' ≤ '��1,+ 7�$3�ℎ 4ℎ���5 7� $5�"��5. 8 3�$� �� 3�3� 3�$� ��5��4 $�� "��� ���5.
(For the variables in this equation refer to Table B.2.)
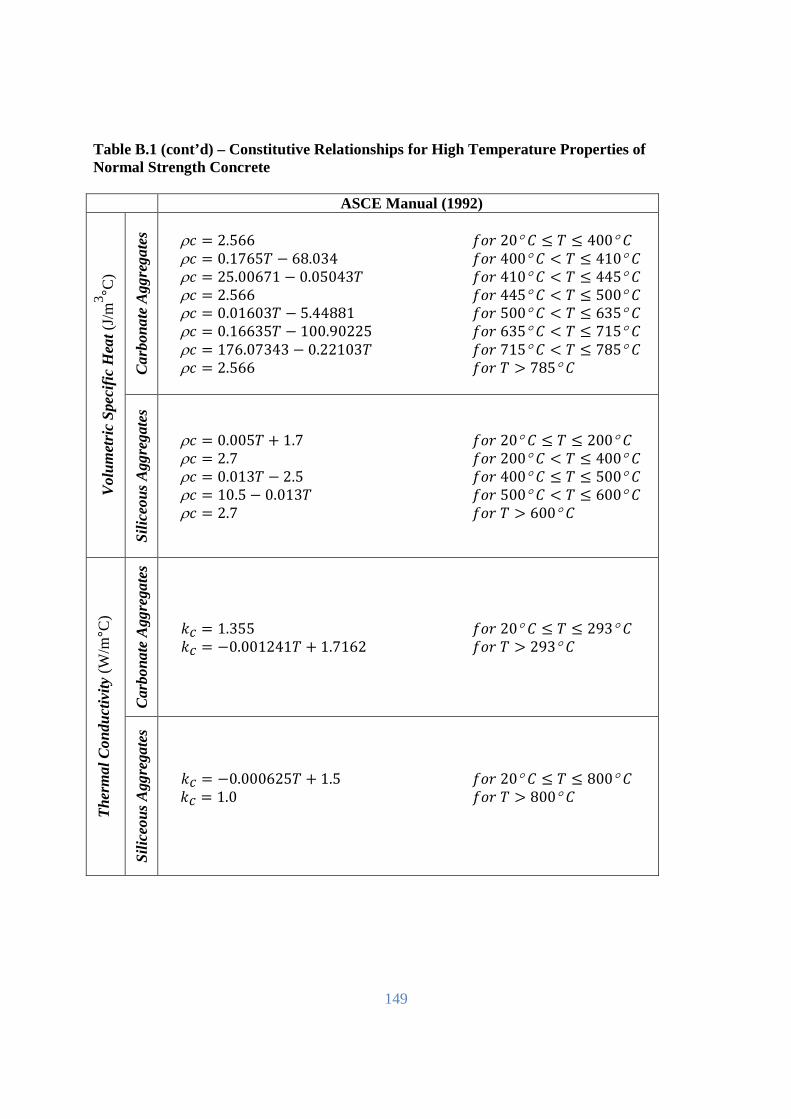
149
Table B.1 (cont’d) – Constitutive Relationships for High Temperature Properties of Normal Strength Concrete
ASCE Manual (1992)
Vol
umet
ric S
peci
fic H
eat (J
/m3 °C
)
Car
bona
te A
ggre
gate
s ρ� = 2.566 ��� 20° ≤ � ≤ 400° ρ� = 0.1765� − 68.034 ��� 400° < � ≤ 410° ρ� = 25.00671 − 0.05043� ��� 410° < � ≤ 445° ρ� = 2.566 ��� 445° < � ≤ 500° ρ� = 0.01603� − 5.44881 ��� 500° < � ≤ 635° ρ� = 0.16635� − 100.90225 ��� 635° < � ≤ 715° ρ� = 176.07343 − 0.22103� ��� 715° < � ≤ 785° ρ� = 2.566 ��� � > 785°
Sili
ceou
s A
ggre
gate
s ρ� = 0.005� + 1.7 ��� 20° ≤ � ≤ 200° ρ� = 2.7 ��� 200° < � ≤ 400° ρ� = 0.013� − 2.5 ��� 400° ≤ � ≤ 500° ρ� = 10.5 − 0.013� ��� 500° < � ≤ 600° ρ� = 2.7 ��� � > 600°
The
rmal
Con
duct
ivity
(W
/m°C
)
Car
bona
te A
ggre
gate
s
%� = 1.355 ��� 20° ≤ � ≤ 293° %� = −0.001241� + 1.7162 ��� � > 293°
Sili
ceou
s A
ggre
gate
s
%� = −0.000625� + 1.5 ��� 20° ≤ � ≤ 800° %� = 1.0 ��� � > 800°
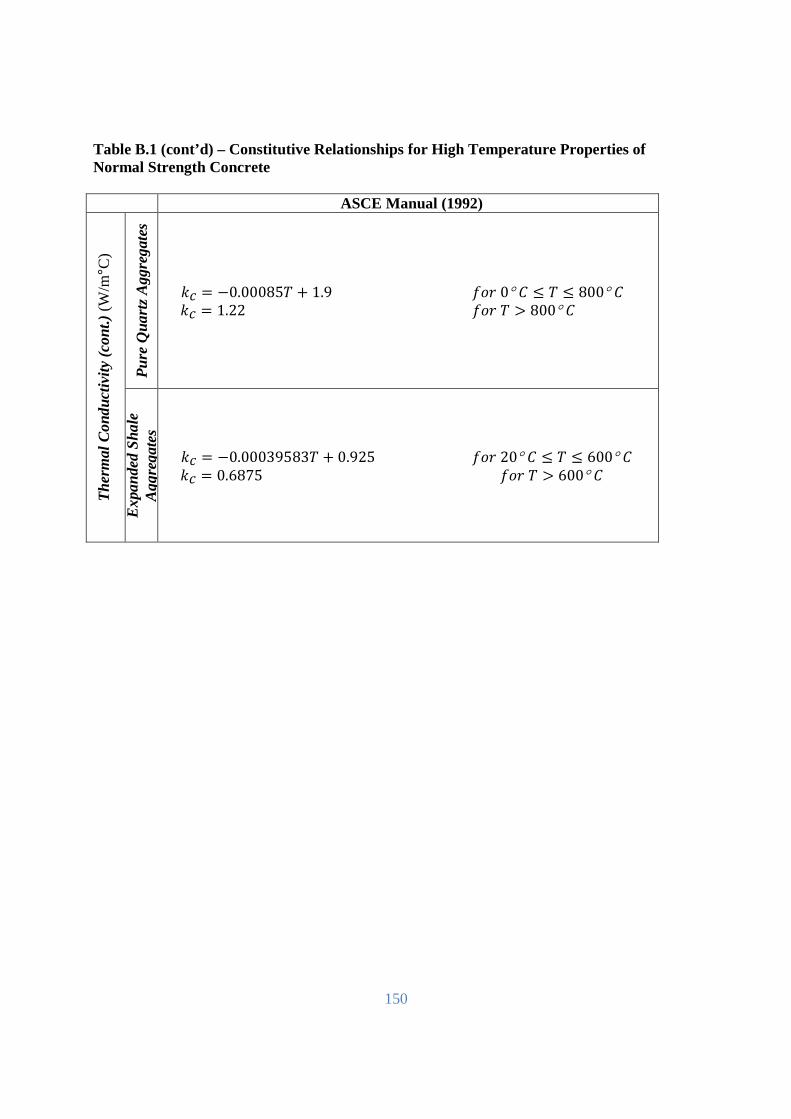
150
Table B.1 (cont’d) – Constitutive Relationships for High Temperature Properties of Normal Strength Concrete
ASCE Manual (1992)
The
rmal
Con
duc
tivity
(co
nt.) (
W/m
°C)
Pur
e Q
uart
z A
ggre
gate
s
%� = −0.00085� + 1.9 ��� 0° ≤ � ≤ 800° %� = 1.22 ��� � > 800°
Exp
ande
d S
hale
A
ggre
gate
s
%� = −0.00039583� + 0.925 ��� 20° ≤ � ≤ 600° %� = 0.6875 ��� � > 600°
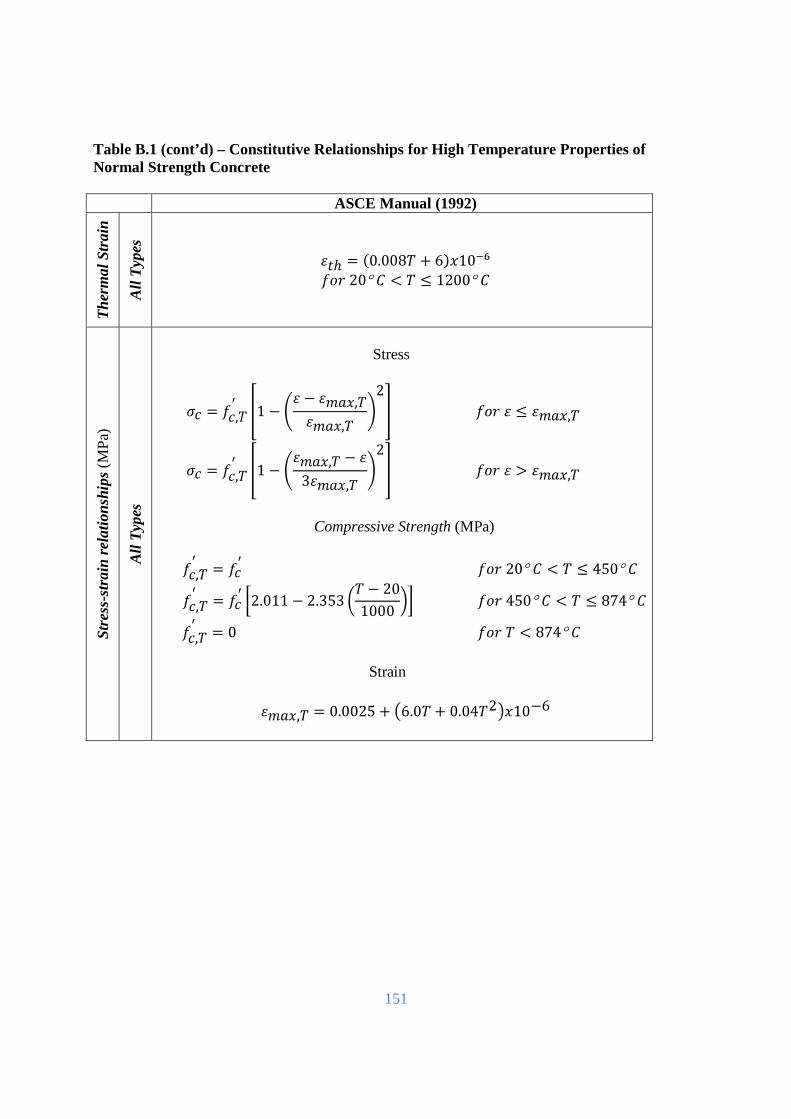
151
Table B.1 (cont’d) – Constitutive Relationships for High Temperature Properties of Normal Strength Concrete
ASCE Manual (1992)
The
rmal
Str
ain
All
Typ
es
'�ℎ = (0.008� + 6))10:; ��� 20° < � ≤ 1200°
Str
ess-
stra
in r
elat
ions
hips
(MP
a)
All
Typ
es
Stress
*� = ��,�′ <1 − /' − '�$),�'�$),� 02= ��� ' ≤ '�$),�
*� = ��,�′ <1 − /'�$),� − '3'�$),� 02= ��� ' > '�$),�
Compressive Strength (MPa)
��,�′ = ��′ ��� 20° < � ≤ 450°
��,�′ = ��′ >2.011 − 2.353 ?� − 201000 @A ��� 450° < � ≤ 874°
��,�′ = 0 ��� � < 874° Strain '�$),� = 0.0025 + B6.0� + 0.04�2C)10−6
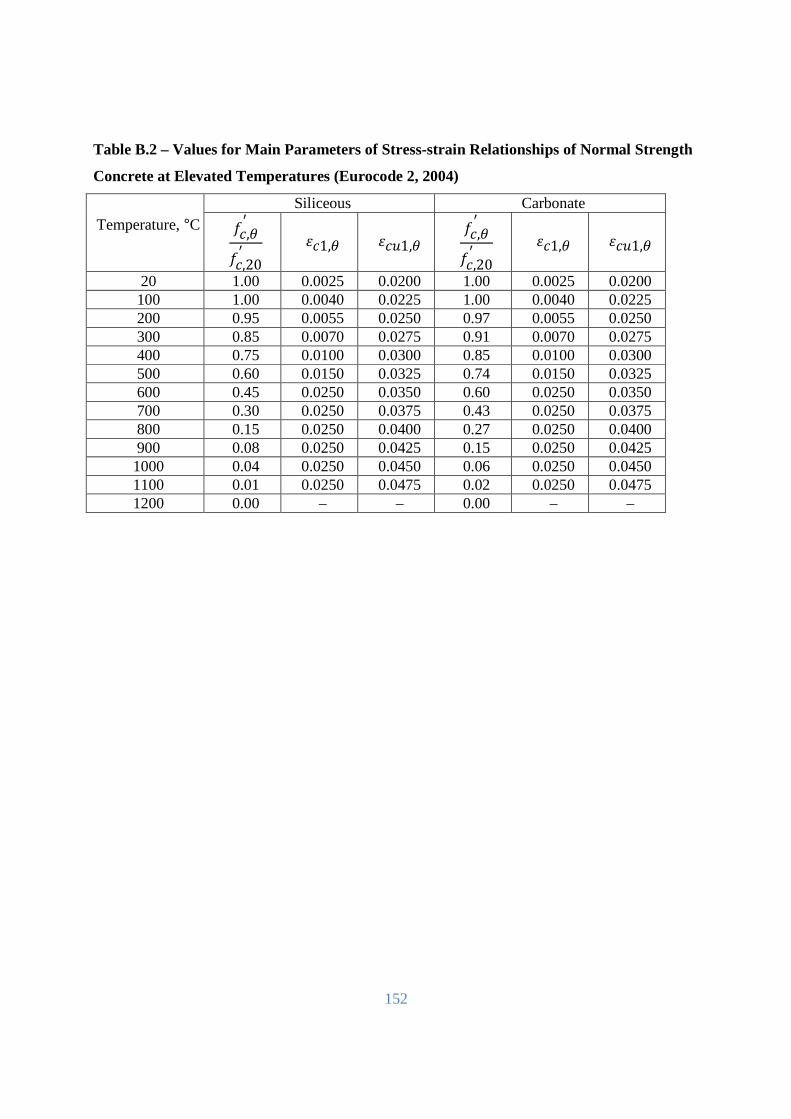
152
Table B.2 – Values for Main Parameters of Stress-strain Relationships of Normal Strength
Concrete at Elevated Temperatures (Eurocode 2, 2004)
Temperature, °C
Siliceous Carbonate ��,+′��,20′ '�1,+ '��1,+
��,+′��,20′ '�1,+ '��1,+
20 1.00 0.0025 0.0200 1.00 0.0025 0.0200 100 1.00 0.0040 0.0225 1.00 0.0040 0.0225 200 0.95 0.0055 0.0250 0.97 0.0055 0.0250 300 0.85 0.0070 0.0275 0.91 0.0070 0.0275 400 0.75 0.0100 0.0300 0.85 0.0100 0.0300 500 0.60 0.0150 0.0325 0.74 0.0150 0.0325 600 0.45 0.0250 0.0350 0.60 0.0250 0.0350 700 0.30 0.0250 0.0375 0.43 0.0250 0.0375 800 0.15 0.0250 0.0400 0.27 0.0250 0.0400 900 0.08 0.0250 0.0425 0.15 0.0250 0.0425 1000 0.04 0.0250 0.0450 0.06 0.0250 0.0450 1100 0.01 0.0250 0.0475 0.02 0.0250 0.0475 1200 0.00 – – 0.00 – –
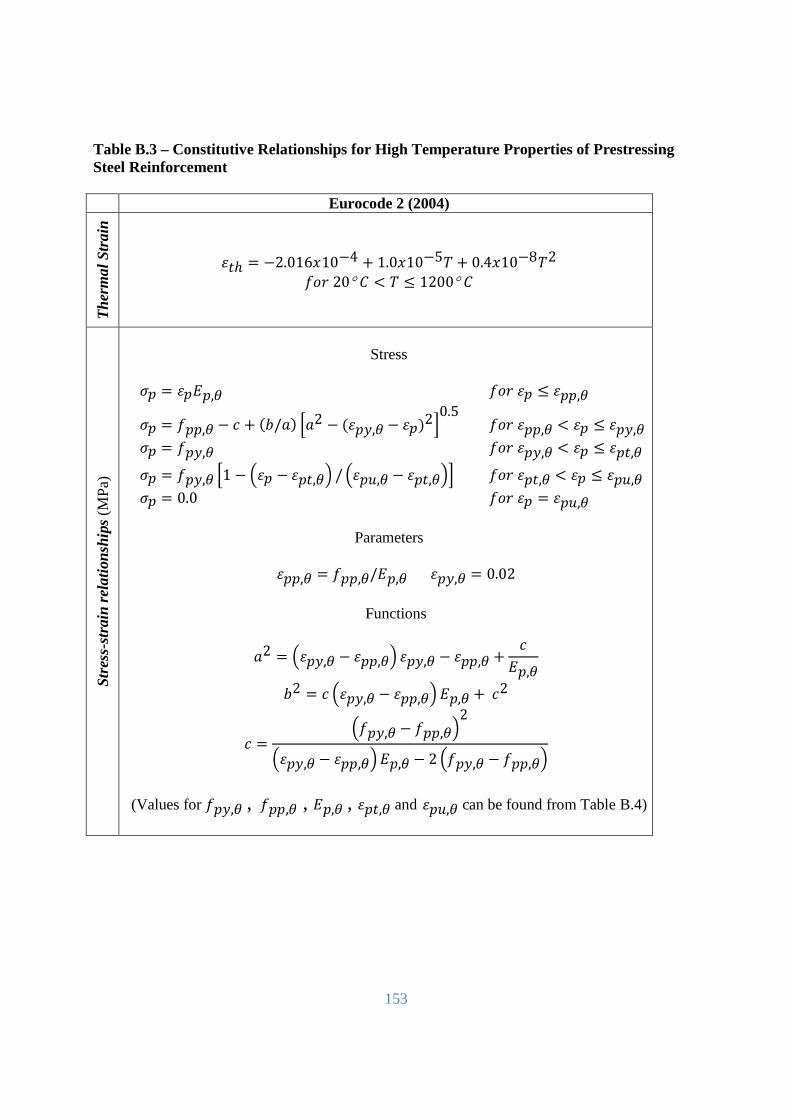
153
Table B.3 – Constitutive Relationships for High Temperature Properties of Prestressing Steel Reinforcement
Eurocode 2 (2004)
The
rmal
Str
ain
'�ℎ = −2.016)10−4 + 1.0)10−5� + 0.4)10−8�2 ��� 20° < � ≤ 1200°
Str
ess-
stra
in r
elat
ions
hips
(MP
a)
Stress
*" = '"D",+ ��� '" ≤ '"",+
*" = �"",+ − � + (7/$) E$2 − ('"F,+ − '")2G0.5 ��� '"",+ < '" ≤ '"F,+ *" = �"F,+ ��� '"F,+ < '" ≤ '"�,+ *" = �"F,+ E1 − H'" − '"�,+I / H'"�,+ − '"�,+IG ��� '"�,+ < '" ≤ '"�,+ *" = 0.0 ��� '" = '"�,+
Parameters
'"",+ = �"",+/D",+ '"F,+ = 0.02
Functions
$2 = H'"F,+ − '"",+I '"F,+ − '"",+ + �D",+
72 = � H'"F,+ − '"",+I D",+ + �2
� = H�"F,+ − �"",+I2H'"F,+ − '"",+I D",+ − 2 H�"F,+ − �"",+I
(Values for �"F,+ , �"",+ , D",+ , '"�,+ and '"�,+ can be found from Table B.4)
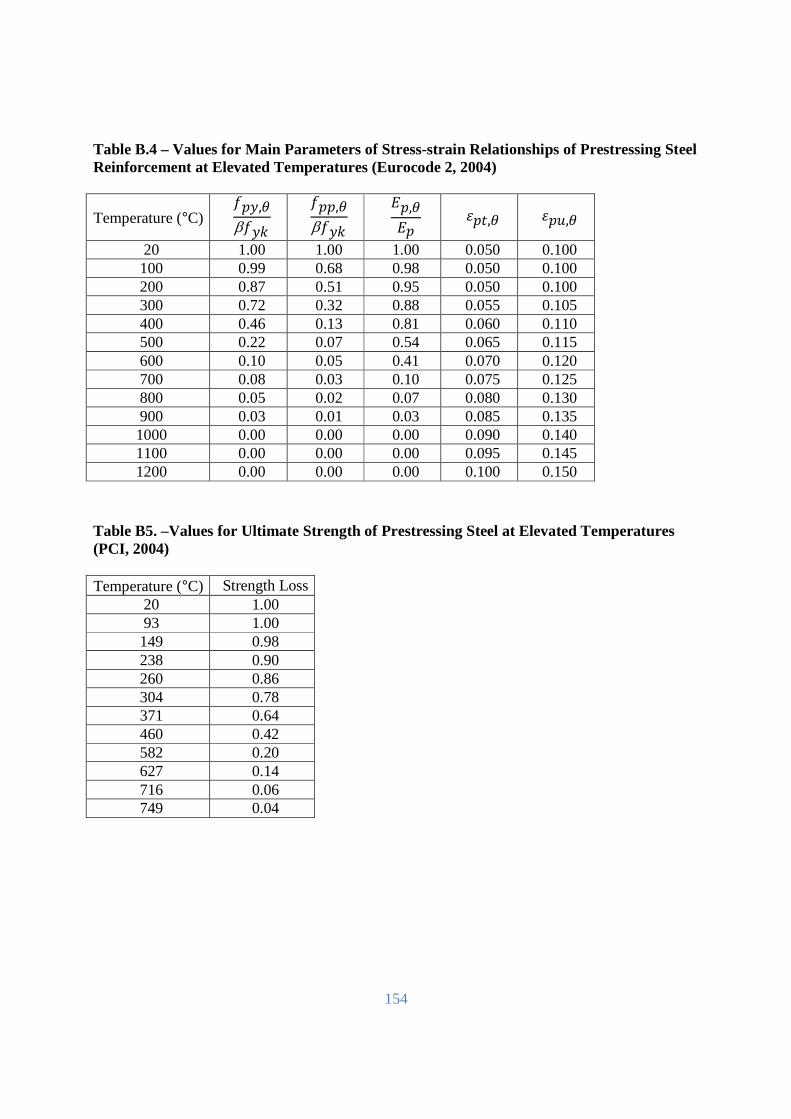
154
Table B.4 – Values for Main Parameters of Stress-strain Relationships of Prestressing Steel Reinforcement at Elevated Temperatures (Eurocode 2, 2004)
Temperature (°C) �"F,+β�F%
�"",+β�F%
D",+D" '"�,+ '"�,+
20 1.00 1.00 1.00 0.050 0.100 100 0.99 0.68 0.98 0.050 0.100 200 0.87 0.51 0.95 0.050 0.100 300 0.72 0.32 0.88 0.055 0.105 400 0.46 0.13 0.81 0.060 0.110 500 0.22 0.07 0.54 0.065 0.115 600 0.10 0.05 0.41 0.070 0.120 700 0.08 0.03 0.10 0.075 0.125 800 0.05 0.02 0.07 0.080 0.130 900 0.03 0.01 0.03 0.085 0.135 1000 0.00 0.00 0.00 0.090 0.140 1100 0.00 0.00 0.00 0.095 0.145 1200 0.00 0.00 0.00 0.100 0.150
Table B5. –Values for Ultimate Strength of Prestressing Steel at Elevated Temperatures (PCI, 2004) Temperature (°C) Strength Loss
20 1.00 93 1.00 149 0.98 238 0.90 260 0.86 304 0.78 371 0.64 460 0.42 582 0.20 627 0.14 716 0.06 749 0.04
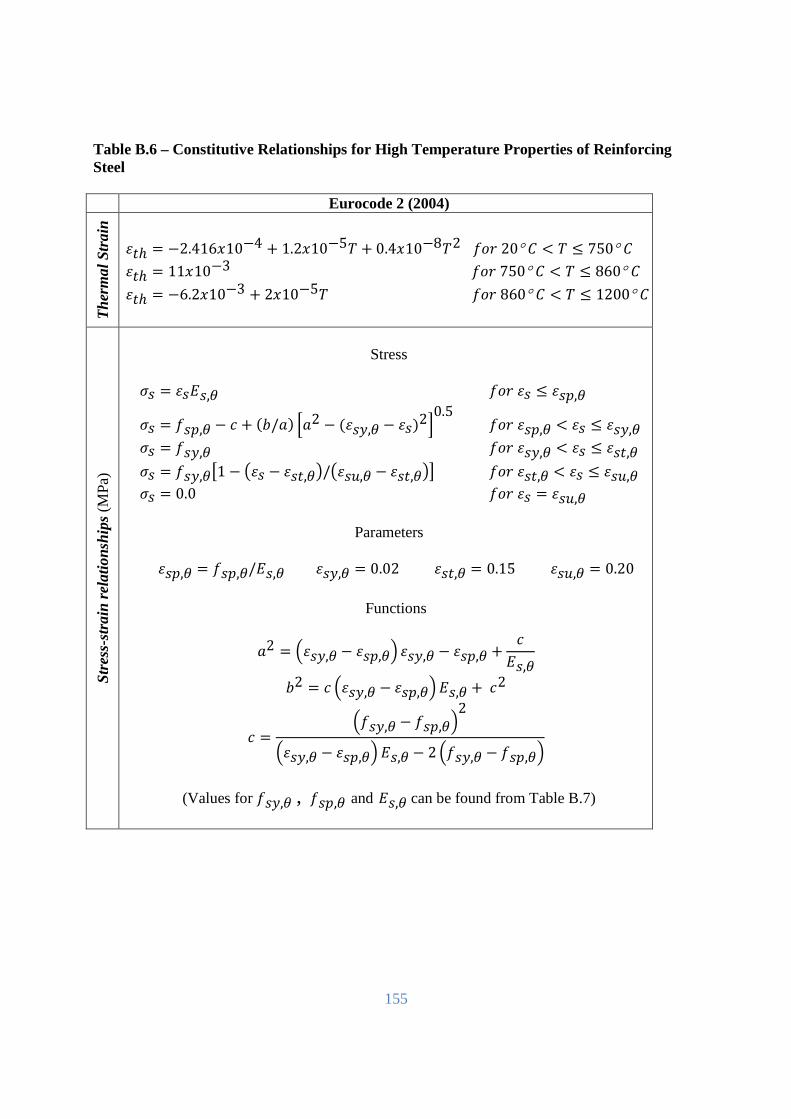
155
Table B.6 – Constitutive Relationships for High Temperature Properties of Reinforcing Steel
Eurocode 2 (2004)
The
rmal
Str
ain '�ℎ = −2.416)10−4 + 1.2)10−5� + 0.4)10−8�2 ��� 20° < � ≤ 750° '�ℎ = 11)10−3 ��� 750° < � ≤ 860° '�ℎ = −6.2)10−3 + 2)10−5� ��� 860° < � ≤ 1200°
Str
ess-
stra
in r
elat
ions
hips
(MP
a)
Stress
*4 = '4D4,+ ��� '4 ≤ '4",+
*4 = �4",+ − � + (7/$) E$2 − ('4F,+ − '4)2G0.5 ��� '4",+ < '4 ≤ '4F,+ *4 = �4F,+ ��� '4F,+ < '4 ≤ '4�,+ *4 = �4F,+J1 − B'4 − '4�,+C/B'4�,+ − '4�,+CK ��� '4�,+ < '4 ≤ '4�,+ *4 = 0.0 ��� '4 = '4�,+
Parameters
'4",+ = �4",+/D4,+ '4F,+ = 0.02 '4�,+ = 0.15 '4�,+ = 0.20
Functions
$2 = H'4F,+ − '4",+I '4F,+ − '4",+ + �D4,+
72 = � H'4F,+ − '4",+I D4,+ + �2
� = H�4F,+ − �4",+I2H'4F,+ − '4",+I D4,+ − 2 H�4F,+ − �4",+I
(Values for �4F,+ , �4",+ and D4,+ can be found from Table B.7)
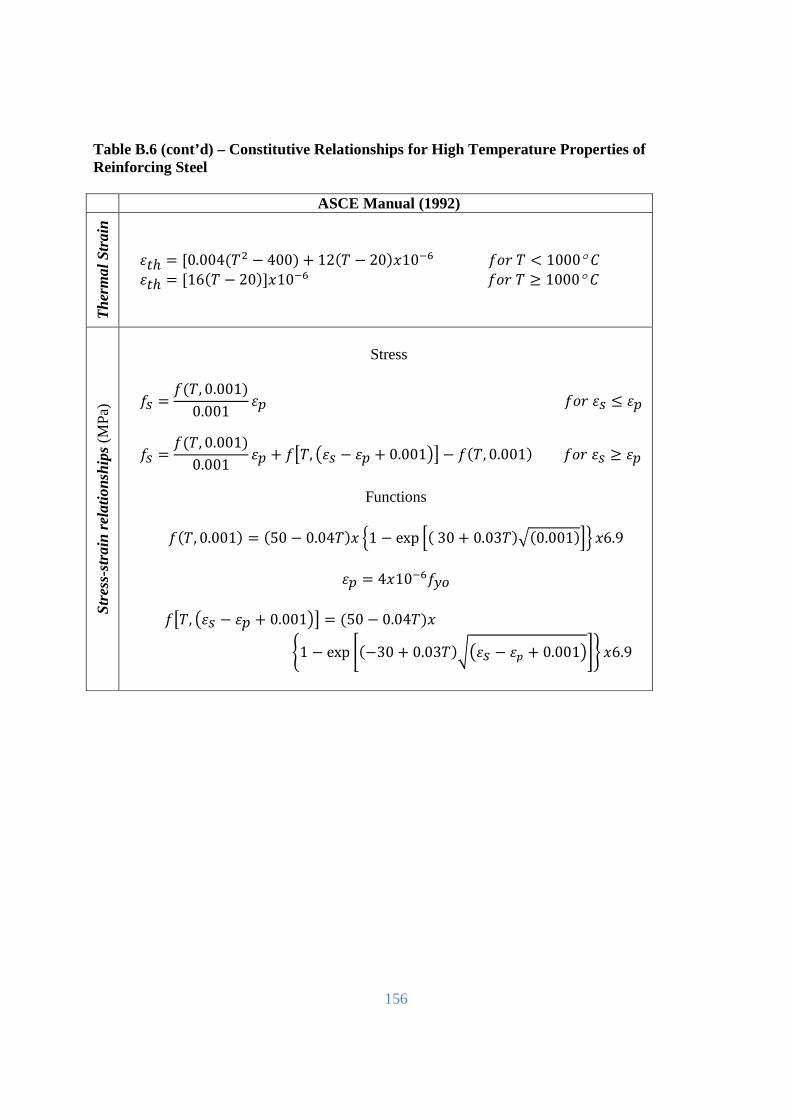
156
Table B.6 (cont’d) – Constitutive Relationships for High Temperature Properties of Reinforcing Steel
ASCE Manual (1992)
The
rmal
Str
ain
'�ℎ = [0.004(�M − 400) + 12(� − 20))10:; ��� � < 1000° '�ℎ = [16(� − 20)])10:; ��� � ≥ 1000°
Str
ess-
stra
in r
elat
ions
hips
(MP
a)
Stress
�4 = �(�, 0.001)0.001 '" ��� '4 ≤ '"
�4 = �(�, 0.001)0.001 '" + �J�, B'4 − '" + 0.001CK − �(�, 0.001) ��� '4 ≥ '"
Functions �(�, 0.001) = (50 − 0.04�)) P1 − exp E( 30 + 0.03�)T(0.001)GU )6.9
'" = 4)10:;�F�
�J�, B'4 − '" + 0.001CK = (50 − 0.04�))
V1 − exp W(−30 + 0.03�)XB'4 − 'Y + 0.001CZ[ )6.9
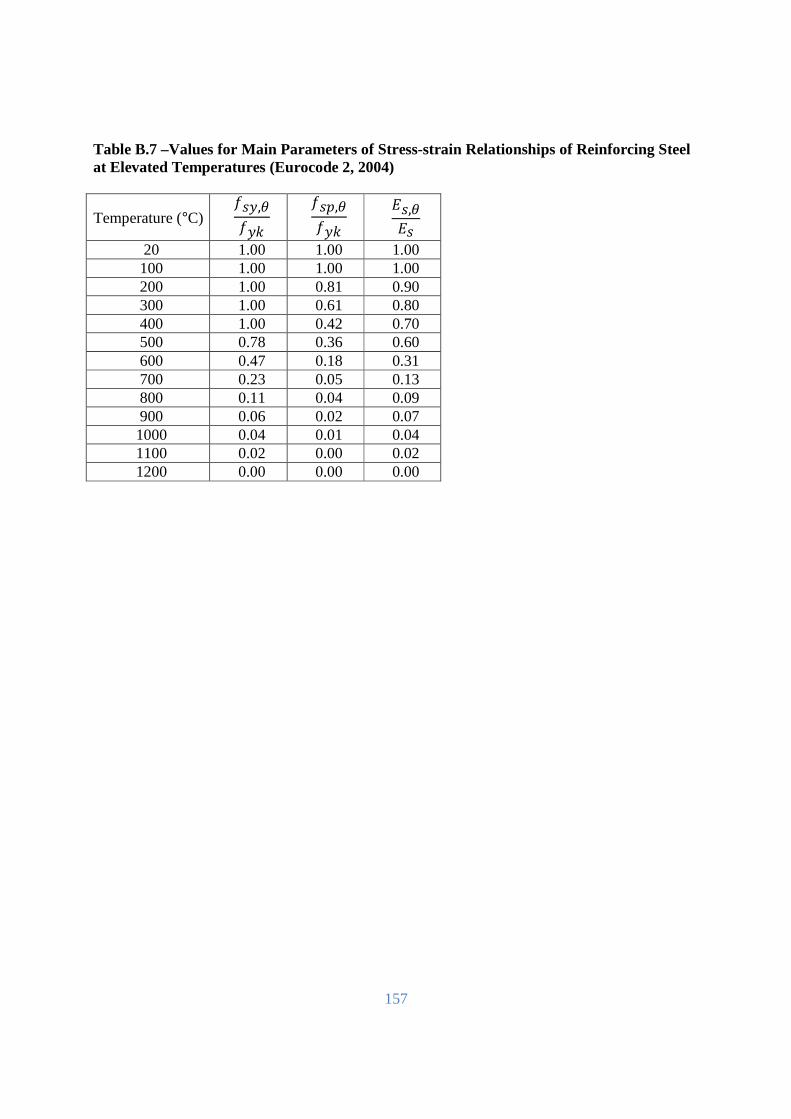
157
Table B.7 –Values for Main Parameters of Stress-strain Relationships of Reinforcing Steel at Elevated Temperatures (Eurocode 2, 2004)
Temperature (°C) �4F,+�F%
�4",+�F% D4,+D4
20 1.00 1.00 1.00 100 1.00 1.00 1.00 200 1.00 0.81 0.90 300 1.00 0.61 0.80 400 1.00 0.42 0.70 500 0.78 0.36 0.60 600 0.47 0.18 0.31 700 0.23 0.05 0.13 800 0.11 0.04 0.09 900 0.06 0.02 0.07 1000 0.04 0.01 0.04 1100 0.02 0.00 0.02 1200 0.00 0.00 0.00
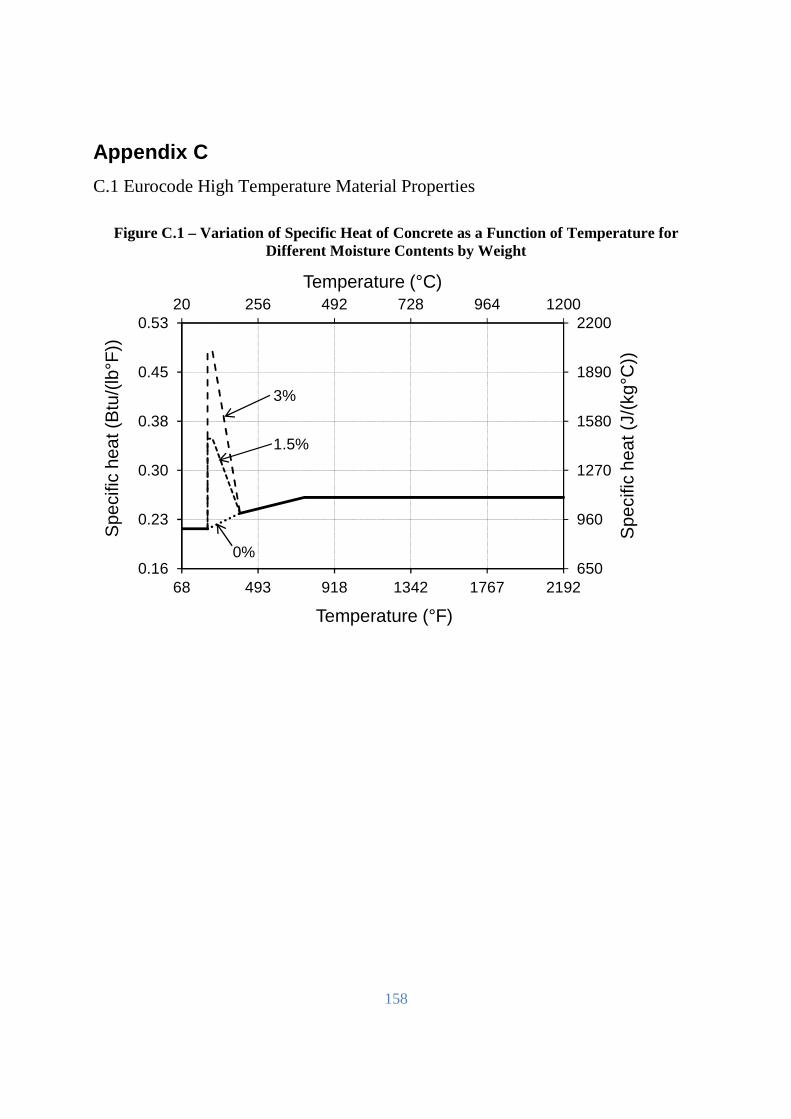
158
Appendix C
C.1 Eurocode High Temperature Material Properties
Figure C.1 – Variation of Specific Heat of Concrete as a Function of Temperature for Different Moisture Contents by Weight
650
960
1270
1580
1890
220020 256 492 728 964 1200
0.16
0.23
0.30
0.38
0.45
0.53
68 493 918 1342 1767 2192
Spe
cific
hea
t (J/
(kg°
C))
Temperature (°C)
Spe
cific
hea
t (B
tu/(
lb°F
))
Temperature (°F)
3%
1.5%
0%

159
Figure C.2 – Variation of Volumetric Specific Heat of Concrete as a Function of Temperature for Different Moisture Contents by Weight
Figure C.3 – Variation of Thermal Conductivity of Concrete as a Function of Temperature
1.3
2.0
2.7
3.3
4.0
4.7
5.320 256 492 728 964 1200
2
3
4
5
6
7
8
68 493 918 1342 1767 2192
Vol
umet
ric s
peci
fic h
eat
(M
J/(m
3 °C
))
Temperature (°C)
Vol
umet
ric s
peci
fic h
eat
(Btu
/(ft3
°F)(
105 )
)
Temperature (°F)
3%
1.5%
0%
0.00
0.45
0.90
1.35
1.80
2.2520 256 492 728 964 1200
0.00
0.26
0.52
0.78
1.04
1.30
68 493 918 1342 1767 2192
The
rmal
con
duct
ivity
(W
/(m
°C))
Temperature (°C)
The
rmal
con
duct
ivity
(B
tu/(
ft_hr
°F))
Temperature (°F)
Upper limit
Lower limit
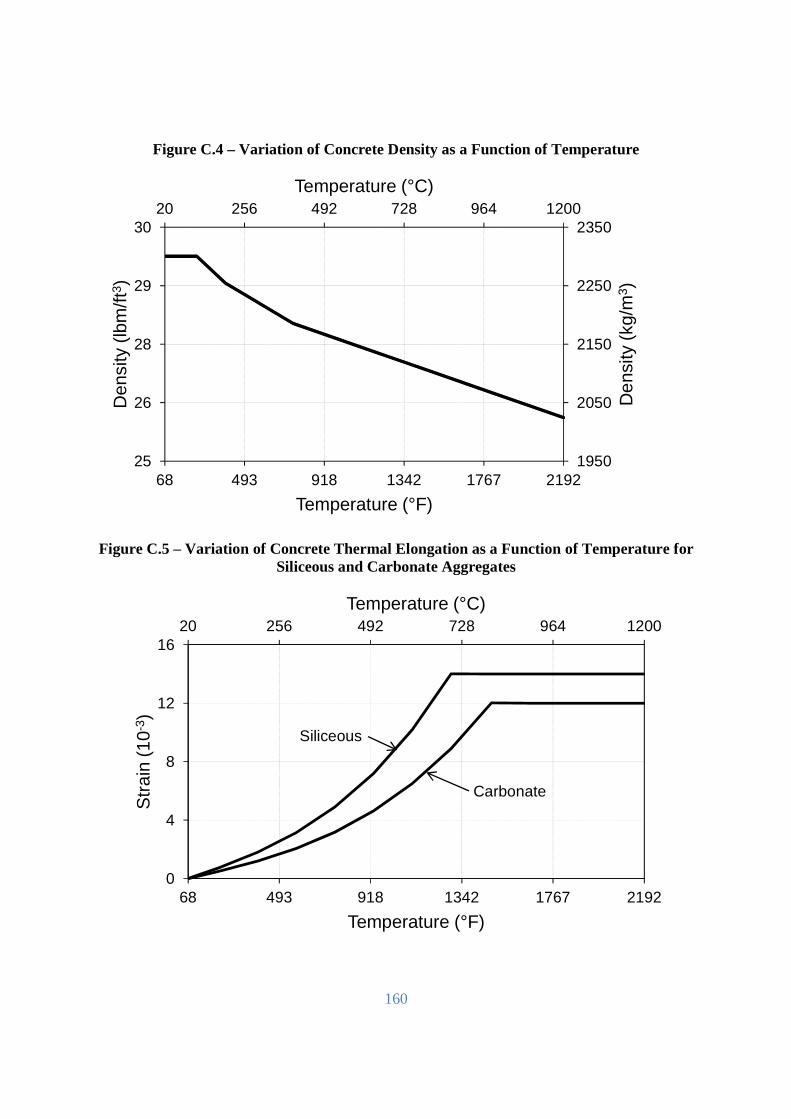
160
Figure C.4 – Variation of Concrete Density as a Function of Temperature
Figure C.5 – Variation of Concrete Thermal Elongation as a Function of Temperature for Siliceous and Carbonate Aggregates
1950
2050
2150
2250
235020 256 492 728 964 1200
25
26
28
29
30
68 493 918 1342 1767 2192
Den
sity
(kg
/m3 )
Temperature (°C)
Den
sity
(lb
m/ft
3 )
Temperature (°F)
20 256 492 728 964 1200
0
4
8
12
16
68 493 918 1342 1767 2192
Temperature (°C)
Str
ain
(10-
3 )
Temperature (°F)
Siliceous
Carbonate
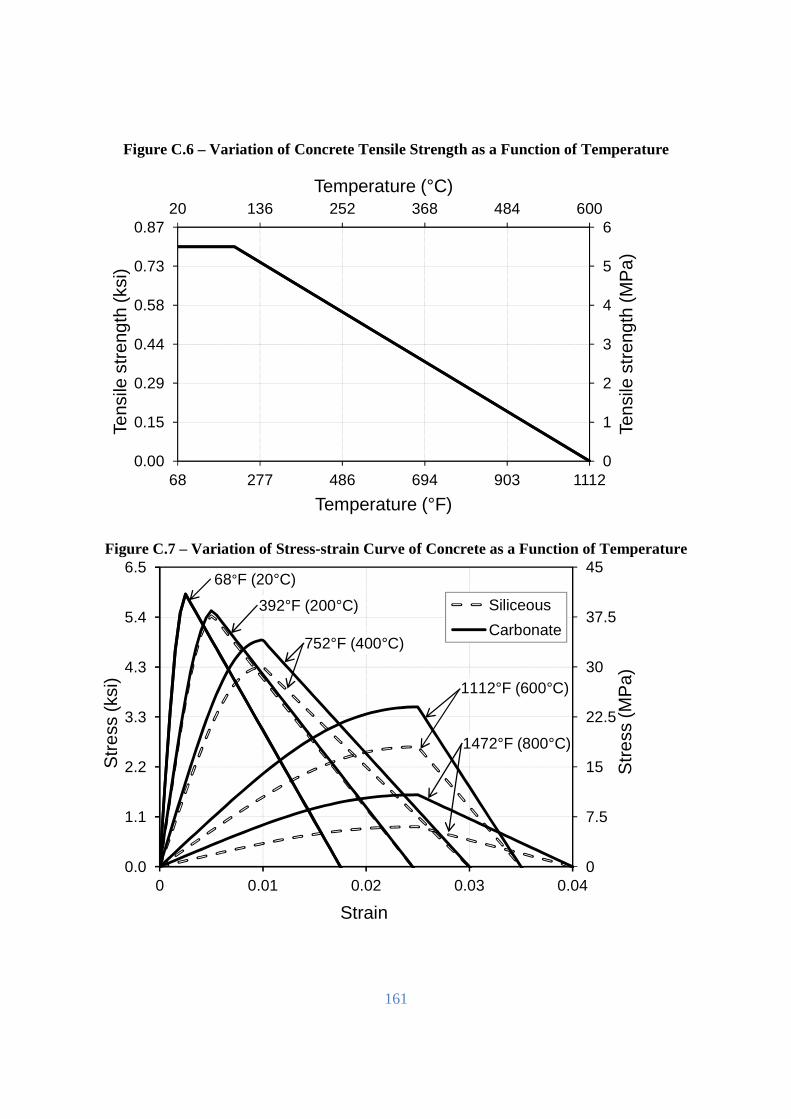
161
Figure C.6 – Variation of Concrete Tensile Strength as a Function of Temperature
Figure C.7 – Variation of Stress-strain Curve of Concrete as a Function of Temperature
0
1
2
3
4
5
620 136 252 368 484 600
0.00
0.15
0.29
0.44
0.58
0.73
0.87
68 277 486 694 903 1112
Tens
ile s
tren
gth
(MP
a)
Temperature (°C)
Tens
ile s
tren
gth
(ksi
)
Temperature (°F)
0
7.5
15
22.5
30
37.5
45
0.0
1.1
2.2
3.3
4.3
5.4
6.5
0 0.01 0.02 0.03 0.04
Str
ess
(MP
a)
Str
ess
(ksi
)
Strain
Siliceous
Carbonate752°F (400°C)
68°F (20°C)
392°F (200°C)
1472°F (800°C)
1112°F (600°C)
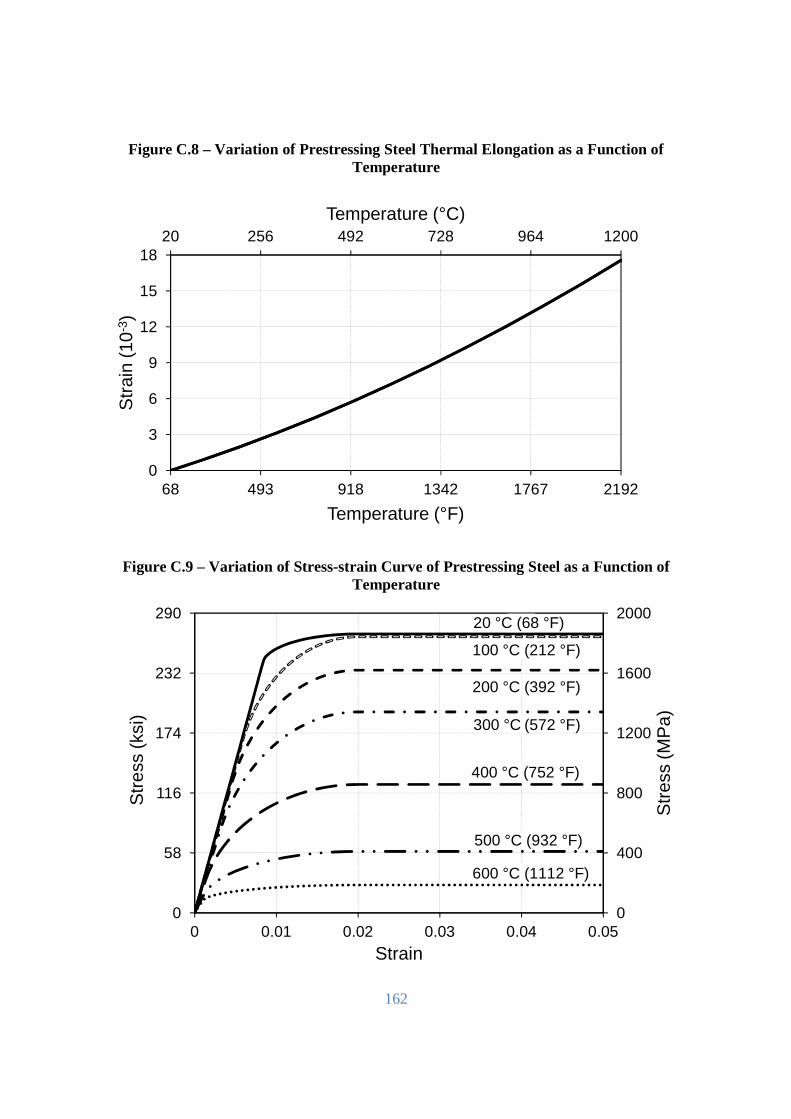
162
Figure C.8 – Variation of Prestressing Steel Thermal Elongation as a Function of Temperature
Figure C.9 – Variation of Stress-strain Curve of Prestressing Steel as a Function of Temperature
20 256 492 728 964 1200
0
3
6
9
12
15
18
68 493 918 1342 1767 2192
Temperature (°C)
Str
ain
(10-
3 )
Temperature (°F)
0
400
800
1200
1600
2000
0
58
116
174
232
290
0 0.01 0.02 0.03 0.04 0.05
Str
ess
(MP
a)
Str
ess
(ksi
)
Strain
20 °C (68 °F)
100 °C (212 °F)
200 °C (392 °F)
300 °C (572 °F)
400 °C (752 °F)
500 °C (932 °F)
600 °C (1112 °F)
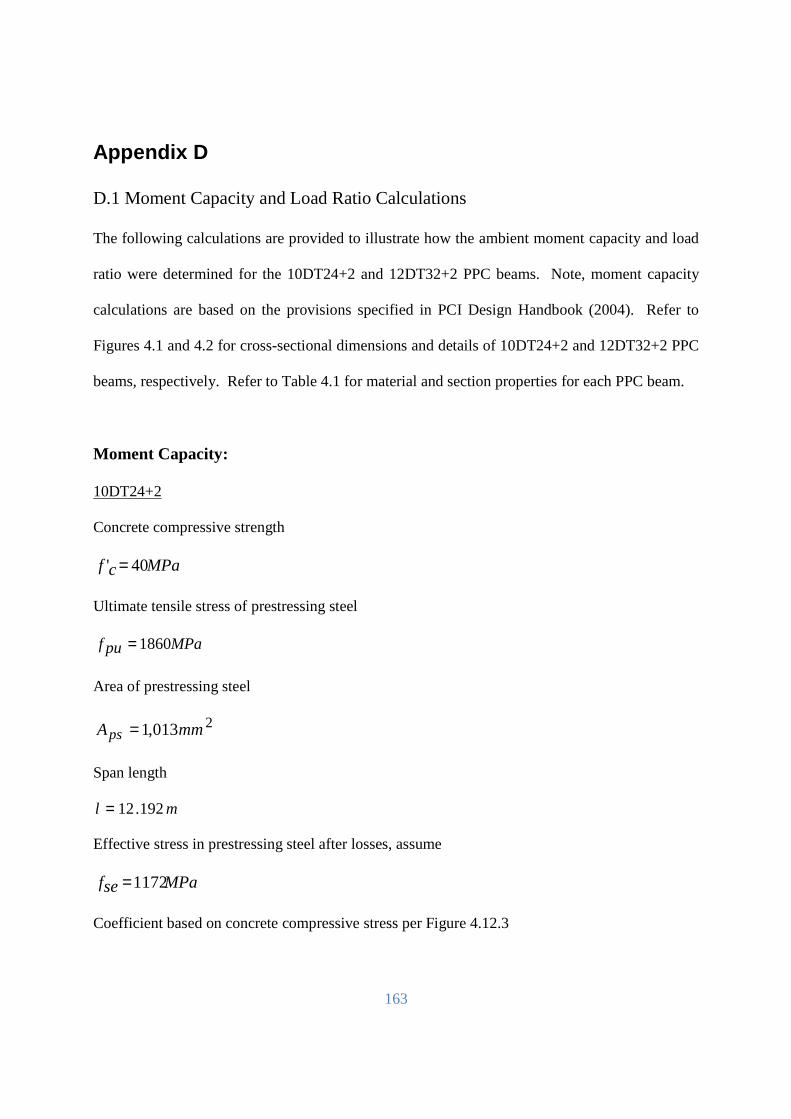
163
Appendix D
D.1 Moment Capacity and Load Ratio Calculations
The following calculations are provided to illustrate how the ambient moment capacity and load
ratio were determined for the 10DT24+2 and 12DT32+2 PPC beams. Note, moment capacity
calculations are based on the provisions specified in PCI Design Handbook (2004). Refer to
Figures 4.1 and 4.2 for cross-sectional dimensions and details of 10DT24+2 and 12DT32+2 PPC
beams, respectively. Refer to Table 4.1 for material and section properties for each PPC beam.
Moment Capacity:
10DT24+2
Concrete compressive strength
MPacf 40' =
Ultimate tensile stress of prestressing steel
MPapuf 1860=
Area of prestressing steel
2013,1 mmAps =
Span length
ml 192.12=
Effective stress in prestressing steel after losses, assume
MPasef 1172=
Coefficient based on concrete compressive stress per Figure 4.12.3
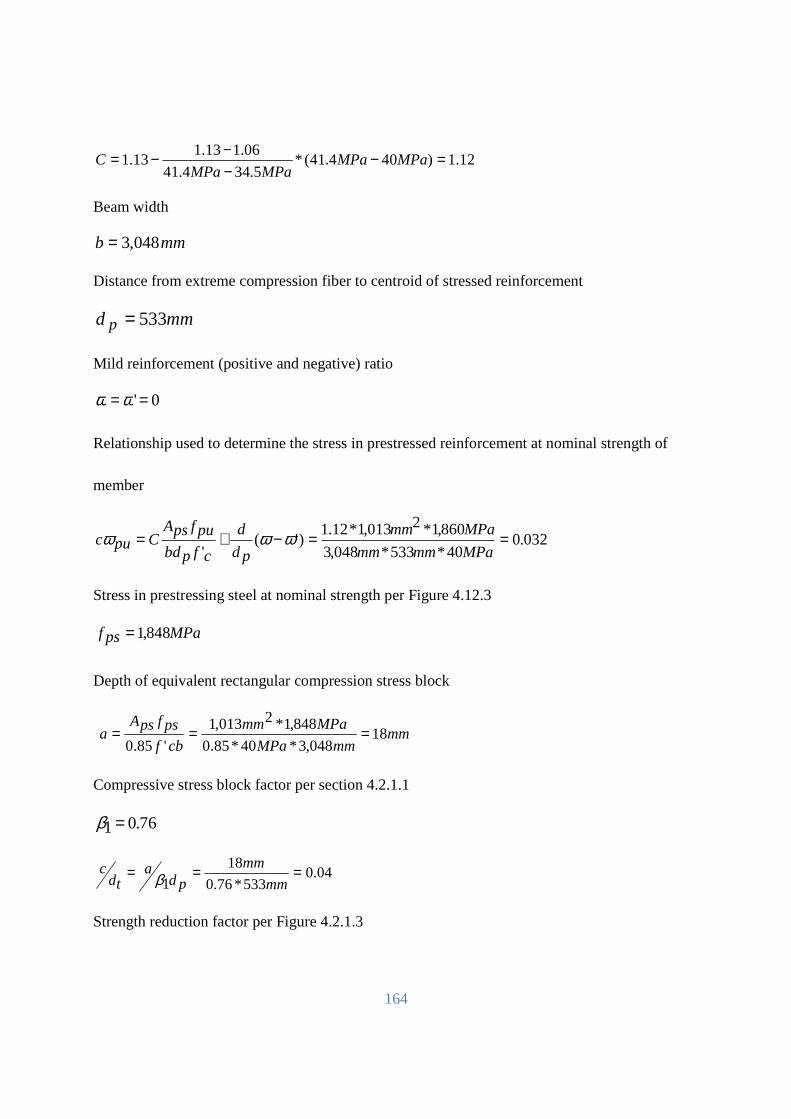
164
12.1)404.41(*5.344.41
06.113.113.1 =−
−−−= MPaMPa
MPaMPaC
Beam width
mmb 048,3=
Distance from extreme compression fiber to centroid of stressed reinforcement
mmd p 533=
Mild reinforcement (positive and negative) ratio
0'== ωω
Relationship used to determine the stress in prestressed reinforcement at nominal strength of
member
032.040*533*048,3
860,1*2013,1*12.1)'(
'==−+=
MPammmm
MPamm
pd
d
cfpbd
pufpsACpuc ωωω
Stress in prestressing steel at nominal strength per Figure 4.12.3
MPapsf 848,1=
Depth of equivalent rectangular compression stress block
mm
mmMPa
MPamm
cbf
psfpsAa 18
048,3*40*85.0
848,1*2013,1
'85.0===
Compressive stress block factor per section 4.2.1.1
76.01=β
04.0533*76.0
18
1===
mm
mm
pda
tdc
β
Strength reduction factor per Figure 4.2.1.3
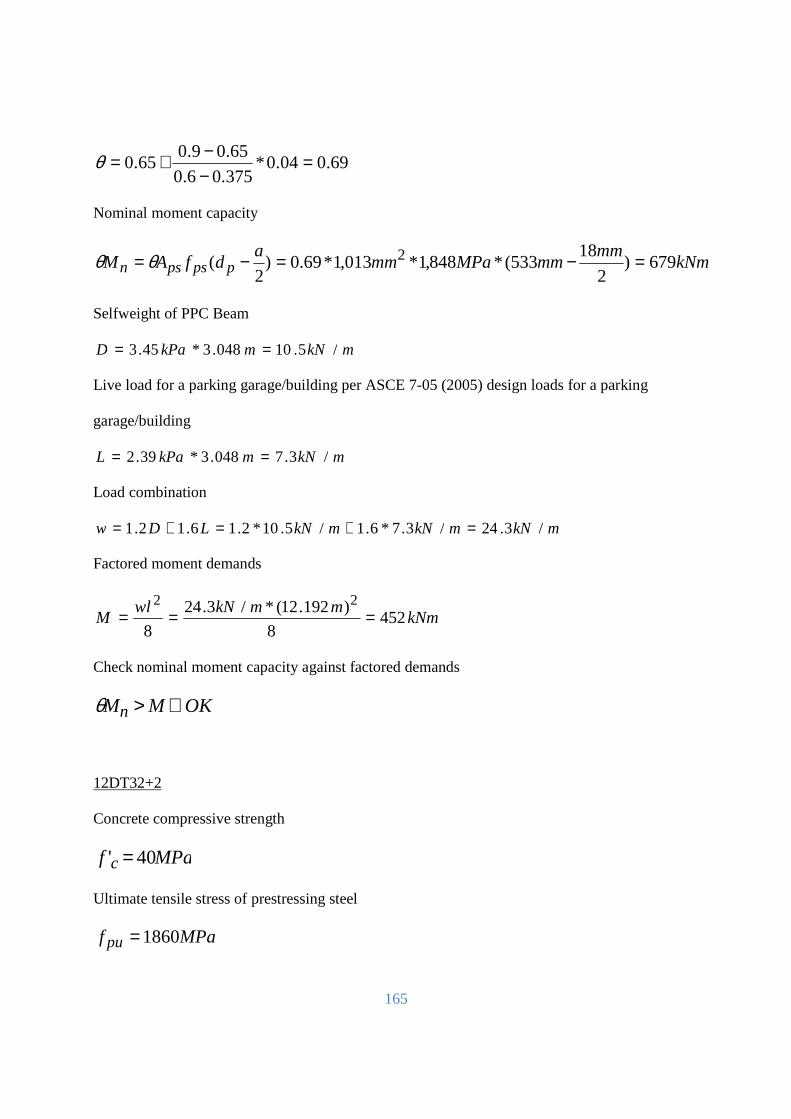
165
69.004.0*375.06.0
65.09.065.0 =
−−+=θ
Nominal moment capacity
kNmmm
mmMPamma
dfAM ppspsn 679)2
18533(*848,1*013,1*69.0)
2( 2 =−=−= θθ
Selfweight of PPC Beam
mkNmkPaD /5.10048.3*45.3 ==
Live load for a parking garage/building per ASCE 7-05 (2005) design loads for a parking
garage/building
mkNmkPaL /3.7048.3*39.2 ==
Load combination
mkNmkNmkNLDw /3.24/3.7*6.1/5.10*2.16.12.1 =+=+=
Factored moment demands
kNmmmkNwl
M 4528
)192.12(*/3.24
8
22===
Check nominal moment capacity against factored demands
OKMMn ∴>θ
12DT32+2
Concrete compressive strength
MPaf c 40' =
Ultimate tensile stress of prestressing steel
MPaf pu 1860=

166
Area of prestressing steel
2523,1 mmAps =
Span length
ml 24.15=
Effective stress in prestressing steel after losses, assume
MPasef 1172=
Coefficient based on concrete compressive stress per Figure 4.12.3
12.1)404.41(*5.344.41
06.113.113.1 =−
−−−= MPaMPa
MPaMPaC
Beam width
mmb 658,3=
Distance from extreme compression fiber to centroid of stressed reinforcement
mmd p 686=
Mild reinforcement (positive and negative) ratio
0'==ωω
Relationship used to determine the stress in prestressed reinforcement at nominal strength of
member
032.040*686*658,3
860,1*2523,1*12.1)'(
'==−+=
MPammmm
MPamm
pd
d
cfpbd
pufpsACpuc ωωω
Stress in prestressing steel at nominal strength per Figure 4.12.3
MPapsf 848,1=
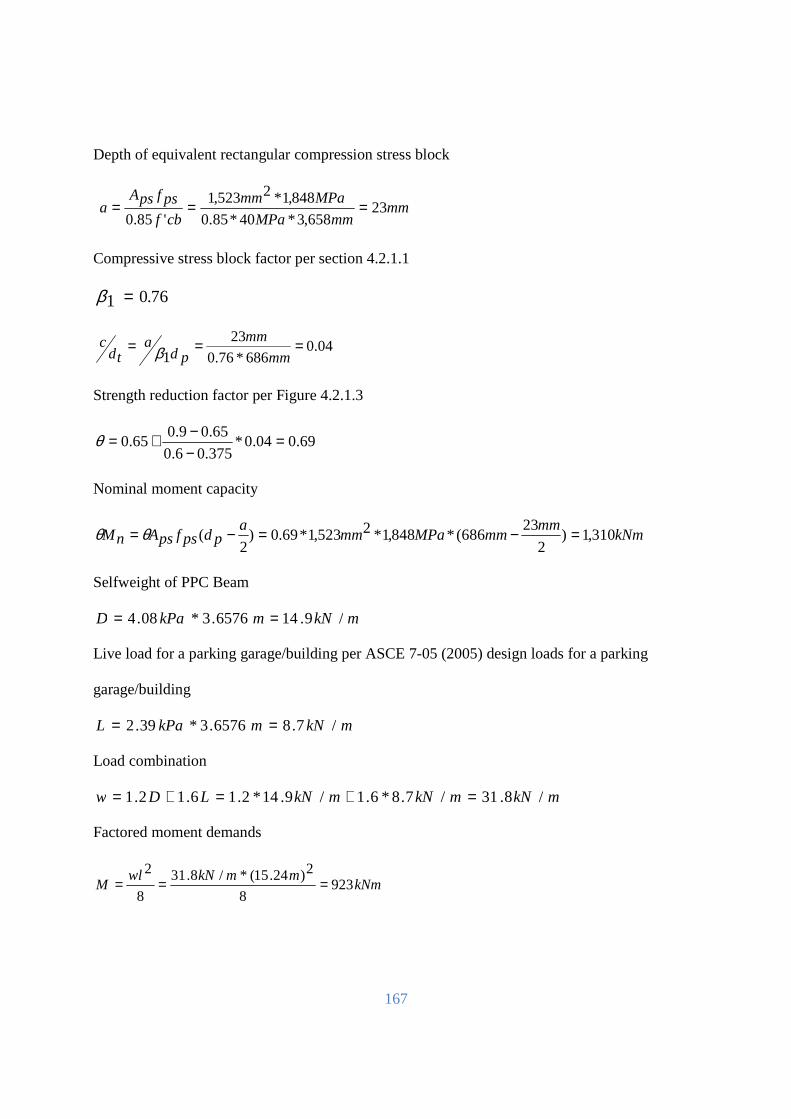
167
Depth of equivalent rectangular compression stress block
mm
mmMPa
MPamm
cbfpsfpsA
a 23658,3*40*85.0
848,1*2523,1
'85.0===
Compressive stress block factor per section 4.2.1.1
76.01 =β
04.0686*76.0
23
1===
mm
mm
pda
tdc
β
Strength reduction factor per Figure 4.2.1.3
69.004.0*375.06.0
65.09.065.0 =
−−+=θ
Nominal moment capacity
kNmmm
mmMPamma
pdpsfpsAnM 310,1)2
23686(*848,1*2523,1*69.0)
2( =−=−= θθ
Selfweight of PPC Beam
mkNmkPaD /9.146576.3*08.4 ==
Live load for a parking garage/building per ASCE 7-05 (2005) design loads for a parking
garage/building
mkNmkPaL /7.86576.3*39.2 ==
Load combination
mkNmkNmkNLDw /8.31/7.8*6.1/9.14*2.16.12.1 =+=+=
Factored moment demands
kNmmmkNwl
M 9238
2)24.15(*/8.31
8
2===
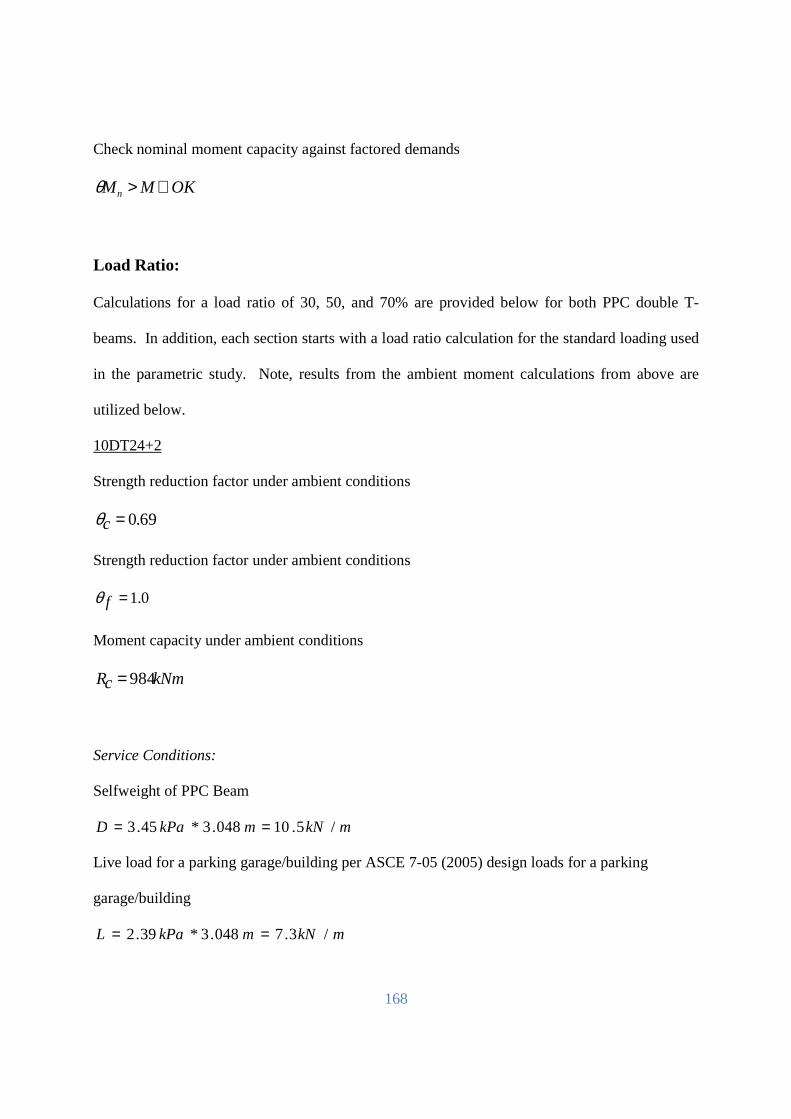
168
Check nominal moment capacity against factored demands
OKMMn ∴>θ
Load Ratio:
Calculations for a load ratio of 30, 50, and 70% are provided below for both PPC double T-
beams. In addition, each section starts with a load ratio calculation for the standard loading used
in the parametric study. Note, results from the ambient moment calculations from above are
utilized below.
10DT24+2
Strength reduction factor under ambient conditions
69.0=cθ
Strength reduction factor under ambient conditions
0.1=fθ
Moment capacity under ambient conditions
kNmcR 984=
Service Conditions:
Selfweight of PPC Beam
mkNmkPaD /5.10048.3*45.3 ==
Live load for a parking garage/building per ASCE 7-05 (2005) design loads for a parking
garage/building
mkNmkPaL /3.7048.3*39.2 ==
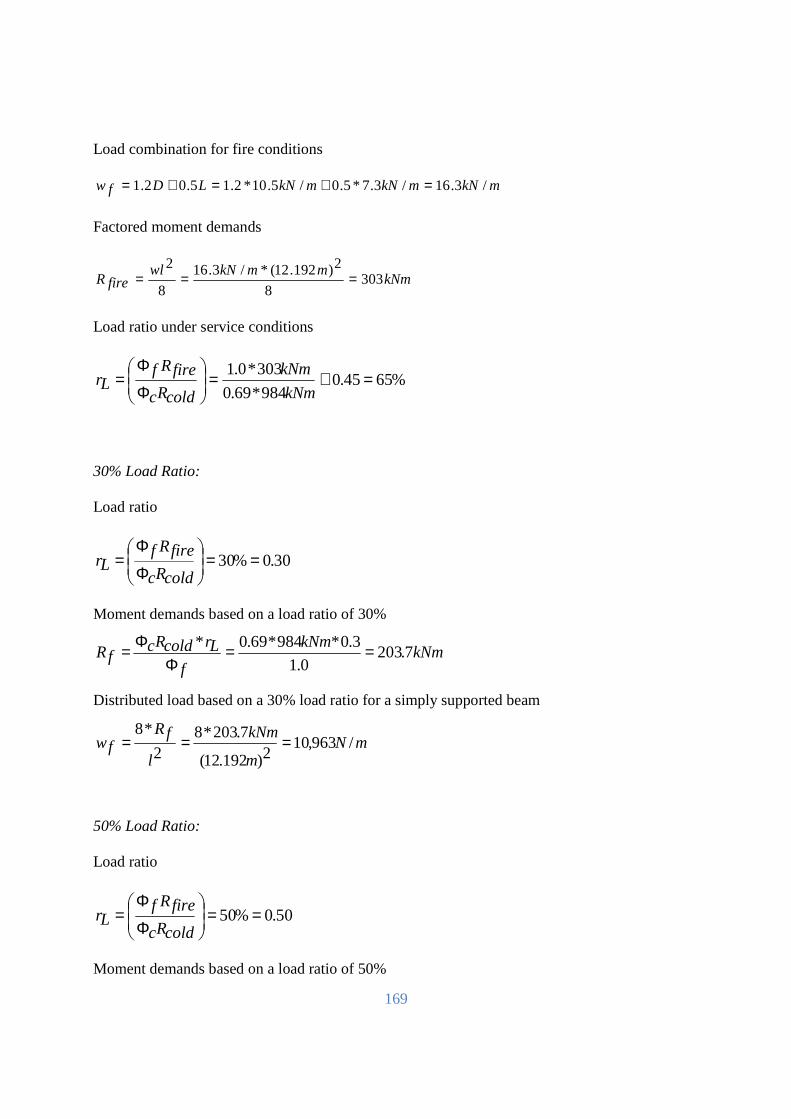
169
Load combination for fire conditions
mkNmkNmkNLDfw /3.16/3.7*5.0/5.10*2.15.02.1 =+=+=
Factored moment demands
kNmmmkNwl
fireR 3038
2)192.12(*/3.16
8
2===
Load ratio under service conditions
%6545.0984*69.0
303*0.1 =≅=
Φ
Φ=
kNm
kNm
coldRc
fireRfLr
30% Load Ratio:
Load ratio
30.0%30 ==
Φ
Φ=
coldRc
fireRfLr
Moment demands based on a load ratio of 30%
kNmkNm
f
LrcoldRcfR 7.203
0.1
3.0*984*69.0* ==Φ
Φ=
Distributed load based on a 30% load ratio for a simply supported beam
mNm
kNm
l
fRfw /963,10
2)192.12(
7.203*82
*8===
50% Load Ratio:
Load ratio
50.0%50 ==
Φ
Φ=
coldRc
fireRfLr
Moment demands based on a load ratio of 50%
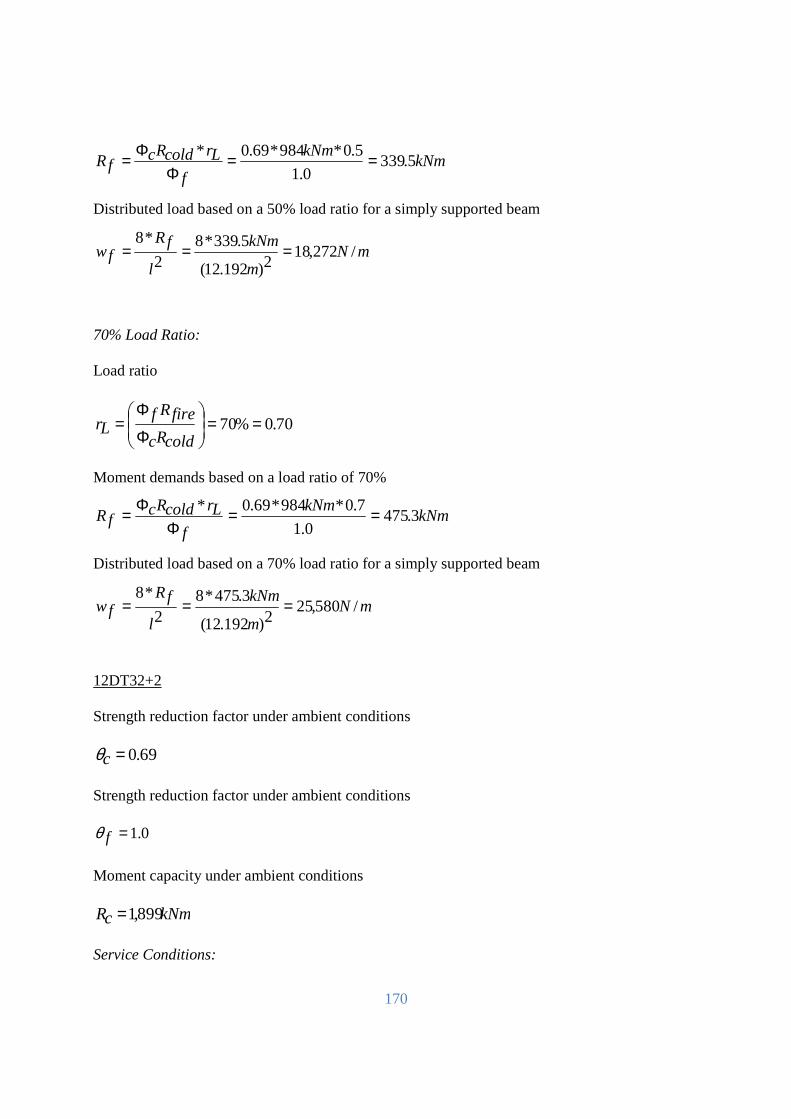
170
kNmkNm
f
LrcoldRcfR 5.339
0.1
5.0*984*69.0* ==Φ
Φ=
Distributed load based on a 50% load ratio for a simply supported beam
mNm
kNm
l
fRfw /272,18
2)192.12(
5.339*82
*8===
70% Load Ratio:
Load ratio
70.0%70 ==
Φ
Φ=
coldRc
fireRfLr
Moment demands based on a load ratio of 70%
kNmkNm
f
LrcoldRcfR 3.475
0.1
7.0*984*69.0* ==Φ
Φ=
Distributed load based on a 70% load ratio for a simply supported beam
mNm
kNm
l
fRfw /580,25
2)192.12(
3.475*82
*8===
12DT32+2
Strength reduction factor under ambient conditions
69.0=cθ
Strength reduction factor under ambient conditions
0.1=fθ
Moment capacity under ambient conditions
kNmcR 899,1=
Service Conditions:
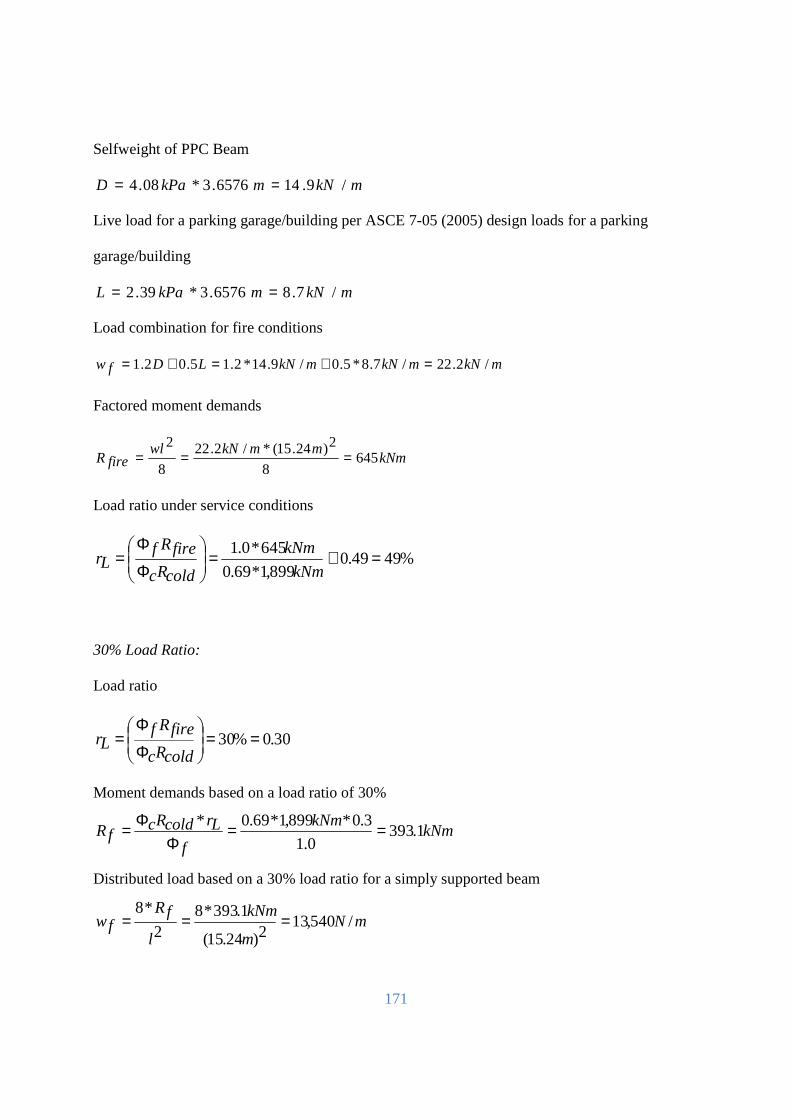
171
Selfweight of PPC Beam
mkNmkPaD /9.146576.3*08.4 ==
Live load for a parking garage/building per ASCE 7-05 (2005) design loads for a parking
garage/building
mkNmkPaL /7.86576.3*39.2 ==
Load combination for fire conditions
mkNmkNmkNLDfw /2.22/7.8*5.0/9.14*2.15.02.1 =+=+=
Factored moment demands
kNmmmkNwl
fireR 6458
2)24.15(*/2.22
8
2===
Load ratio under service conditions
%4949.0899,1*69.0
645*0.1 =≅=
Φ
Φ=
kNm
kNm
coldRc
fireRfLr
30% Load Ratio:
Load ratio
30.0%30 ==
Φ
Φ=
coldRc
fireRfLr
Moment demands based on a load ratio of 30%
kNmkNm
f
LrcoldRcfR 1.393
0.1
3.0*899,1*69.0* ==Φ
Φ=
Distributed load based on a 30% load ratio for a simply supported beam
mNm
kNm
l
fRfw /540,13
2)24.15(
1.393*82
*8===
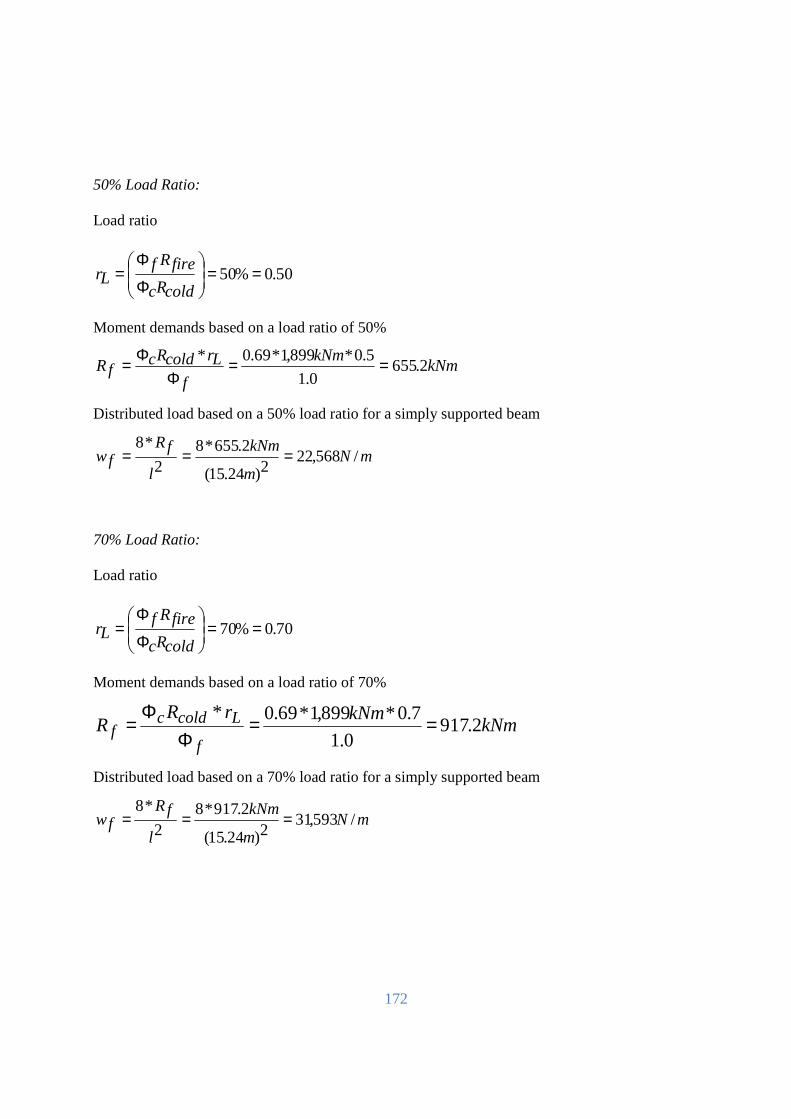
172
50% Load Ratio:
Load ratio
50.0%50 ==
Φ
Φ=
coldRc
fireRfLr
Moment demands based on a load ratio of 50%
kNmkNm
f
LrcoldRcfR 2.655
0.1
5.0*899,1*69.0* ==Φ
Φ=
Distributed load based on a 50% load ratio for a simply supported beam
mNm
kNm
l
fRfw /568,22
2)24.15(
2.655*82
*8===
70% Load Ratio:
Load ratio
70.0%70 ==
Φ
Φ=
coldRc
fireRfLr
Moment demands based on a load ratio of 70%
kNmkNmrR
Rf
Lcoldcf 2.917
0.1
7.0*899,1*69.0*==
ΦΦ
=
Distributed load based on a 70% load ratio for a simply supported beam
mNm
kNm
l
fRfw /593,31
2)24.15(
2.917*82
*8===
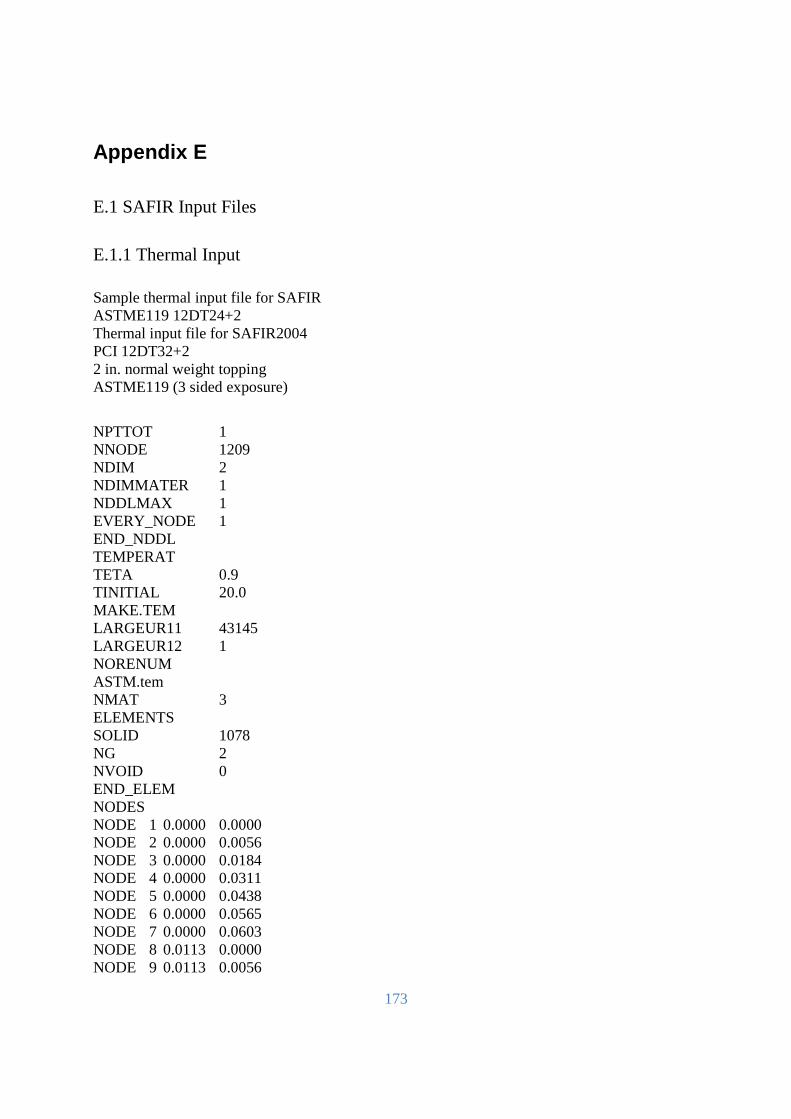
173
Appendix E
E.1 SAFIR Input Files E.1.1 Thermal Input Sample thermal input file for SAFIR ASTME119 12DT24+2 Thermal input file for SAFIR2004 PCI 12DT32+2 2 in. normal weight topping ASTME119 (3 sided exposure)
NPTTOT 1 NNODE 1209 NDIM 2 NDIMMATER 1 NDDLMAX 1 EVERY_NODE 1 END_NDDL TEMPERAT TETA 0.9 TINITIAL 20.0 MAKE.TEM LARGEUR11 43145 LARGEUR12 1 NORENUM ASTM.tem NMAT 3 ELEMENTS SOLID 1078 NG 2 NVOID 0 END_ELEM NODES NODE 1 0.0000 0.0000 NODE 2 0.0000 0.0056 NODE 3 0.0000 0.0184 NODE 4 0.0000 0.0311 NODE 5 0.0000 0.0438 NODE 6 0.0000 0.0565 NODE 7 0.0000 0.0603 NODE 8 0.0113 0.0000 NODE 9 0.0113 0.0056
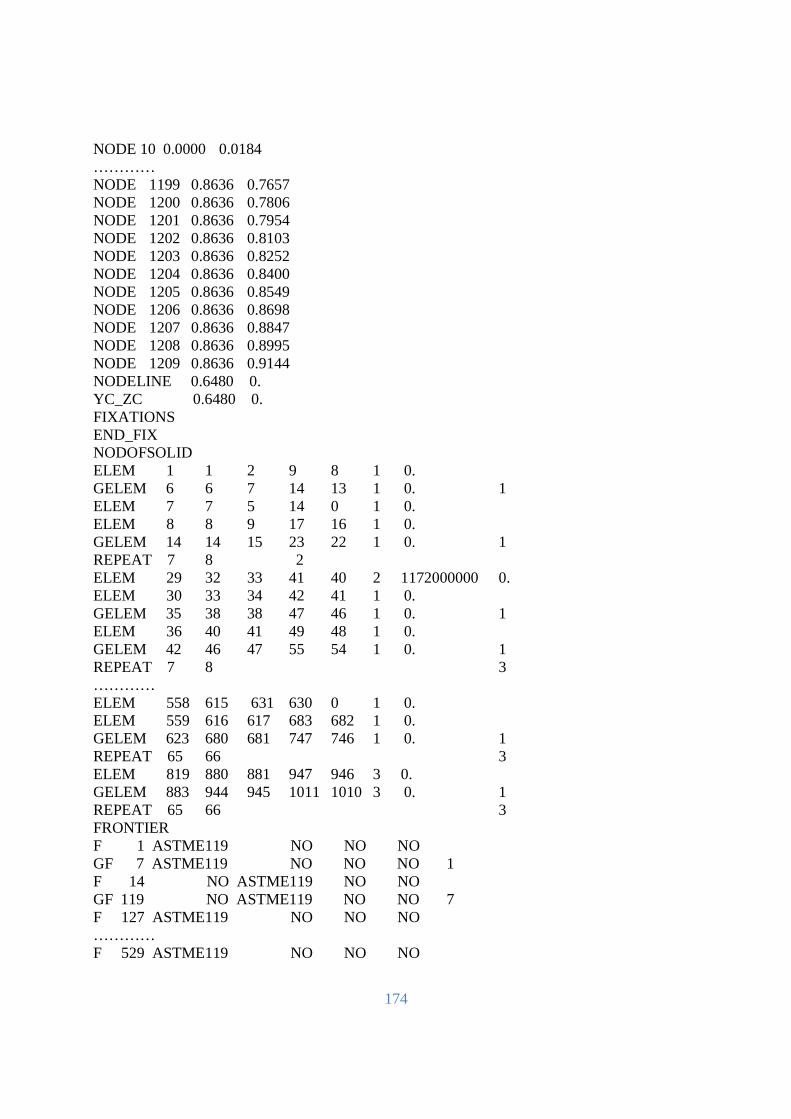
174
NODE 10 0.0000 0.0184 ………… NODE 1199 0.8636 0.7657 NODE 1200 0.8636 0.7806 NODE 1201 0.8636 0.7954 NODE 1202 0.8636 0.8103 NODE 1203 0.8636 0.8252 NODE 1204 0.8636 0.8400 NODE 1205 0.8636 0.8549 NODE 1206 0.8636 0.8698 NODE 1207 0.8636 0.8847 NODE 1208 0.8636 0.8995 NODE 1209 0.8636 0.9144 NODELINE 0.6480 0. YC_ZC 0.6480 0. FIXATIONS END_FIX NODOFSOLID ELEM 1 1 2 9 8 1 0. GELEM 6 6 7 14 13 1 0. 1 ELEM 7 7 5 14 0 1 0. ELEM 8 8 9 17 16 1 0. GELEM 14 14 15 23 22 1 0. 1 REPEAT 7 8 2 ELEM 29 32 33 41 40 2 1172000000 0. ELEM 30 33 34 42 41 1 0. GELEM 35 38 38 47 46 1 0. 1 ELEM 36 40 41 49 48 1 0. GELEM 42 46 47 55 54 1 0. 1 REPEAT 7 8 3 ………… ELEM 558 615 631 630 0 1 0. ELEM 559 616 617 683 682 1 0. GELEM 623 680 681 747 746 1 0. 1 REPEAT 65 66 3 ELEM 819 880 881 947 946 3 0. GELEM 883 944 945 1011 1010 3 0. 1 REPEAT 65 66 3 FRONTIER F 1 ASTME119 NO NO NO GF 7 ASTME119 NO NO NO 1 F 14 NO ASTME119 NO NO GF 119 NO ASTME119 NO NO 7 F 127 ASTME119 NO NO NO ………… F 529 ASTME119 NO NO NO
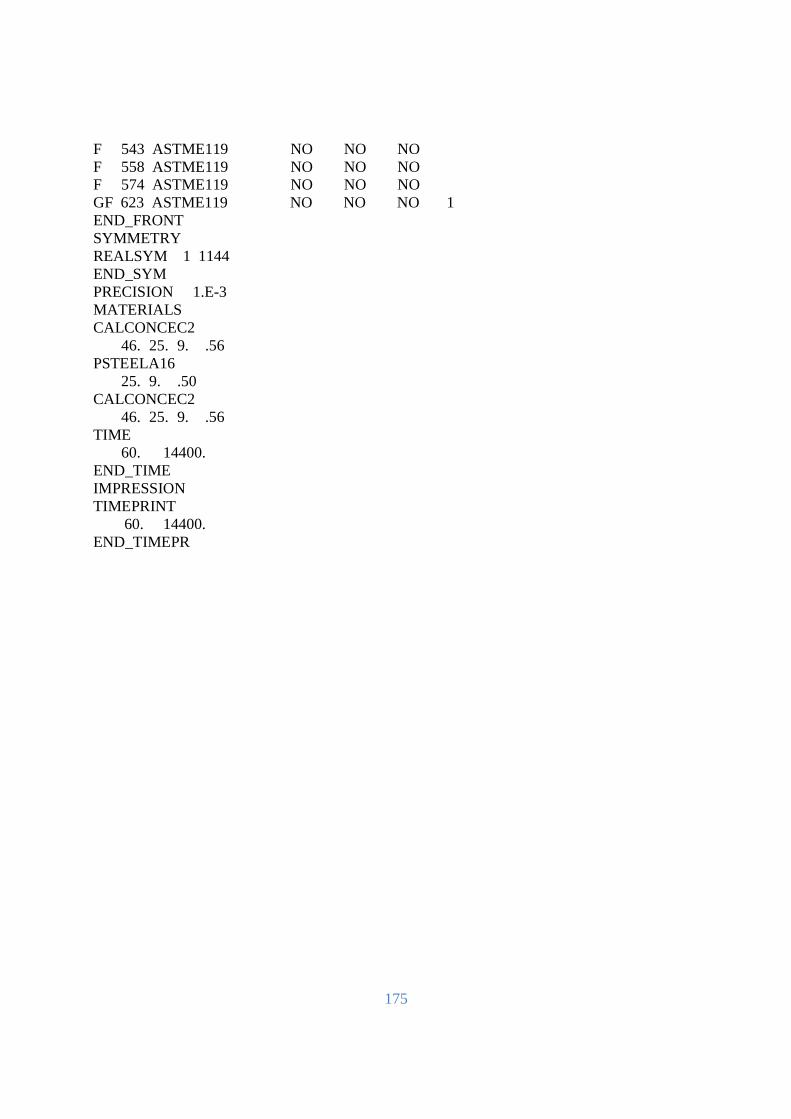
175
F 543 ASTME119 NO NO NO F 558 ASTME119 NO NO NO F 574 ASTME119 NO NO NO GF 623 ASTME119 NO NO NO 1 END_FRONT SYMMETRY REALSYM 1 1144 END_SYM PRECISION 1.E-3 MATERIALS CALCONCEC2
46. 25. 9. .56 PSTEELA16
25. 9. .50 CALCONCEC2
46. 25. 9. .56 TIME
60. 14400. END_TIME IMPRESSION TIMEPRINT 60. 14400. END_TIMEPR
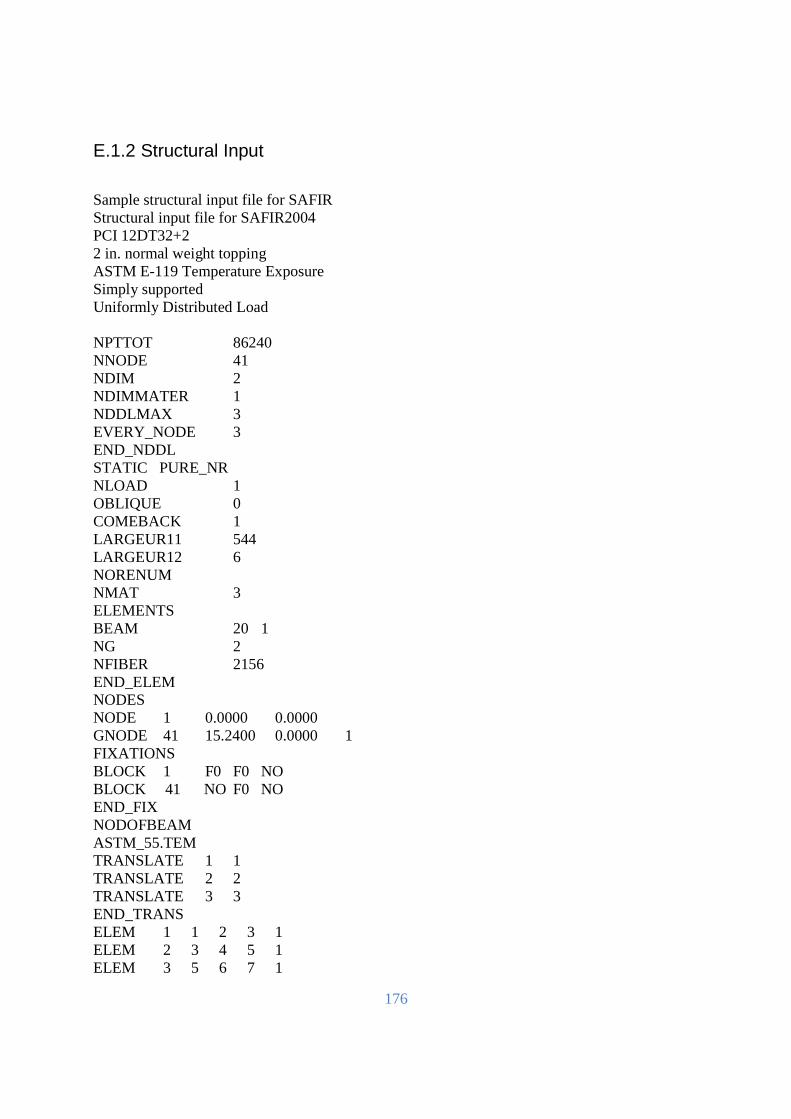
176
E.1.2 Structural Input
Sample structural input file for SAFIR Structural input file for SAFIR2004 PCI 12DT32+2 2 in. normal weight topping ASTM E-119 Temperature Exposure Simply supported Uniformly Distributed Load NPTTOT 86240 NNODE 41 NDIM 2 NDIMMATER 1 NDDLMAX 3 EVERY_NODE 3 END_NDDL STATIC PURE_NR NLOAD 1 OBLIQUE 0 COMEBACK 1 LARGEUR11 544 LARGEUR12 6 NORENUM NMAT 3 ELEMENTS BEAM 20 1 NG 2 NFIBER 2156 END_ELEM NODES NODE 1 0.0000 0.0000 GNODE 41 15.2400 0.0000 1 FIXATIONS BLOCK 1 F0 F0 NO BLOCK 41 NO F0 NO END_FIX NODOFBEAM ASTM_55.TEM TRANSLATE 1 1 TRANSLATE 2 2 TRANSLATE 3 3 END_TRANS ELEM 1 1 2 3 1 ELEM 2 3 4 5 1 ELEM 3 5 6 7 1
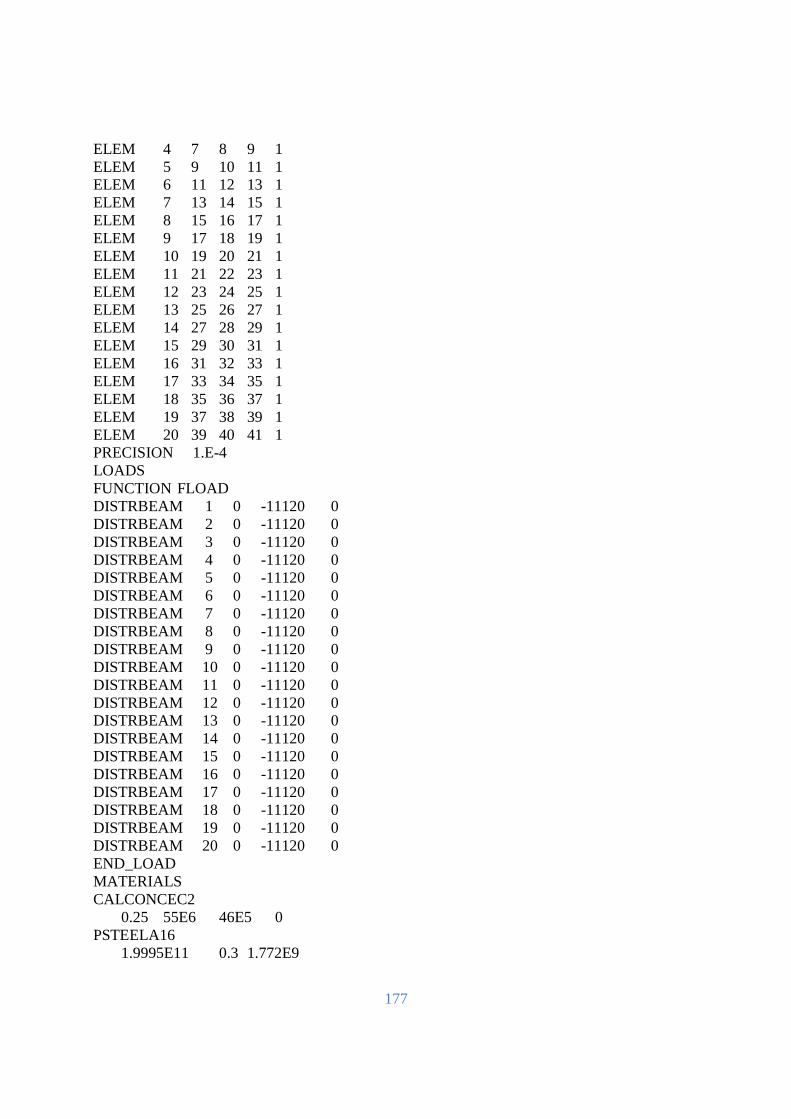
177
ELEM 4 7 8 9 1 ELEM 5 9 10 11 1 ELEM 6 11 12 13 1 ELEM 7 13 14 15 1 ELEM 8 15 16 17 1 ELEM 9 17 18 19 1 ELEM 10 19 20 21 1 ELEM 11 21 22 23 1 ELEM 12 23 24 25 1 ELEM 13 25 26 27 1 ELEM 14 27 28 29 1 ELEM 15 29 30 31 1 ELEM 16 31 32 33 1 ELEM 17 33 34 35 1 ELEM 18 35 36 37 1 ELEM 19 37 38 39 1 ELEM 20 39 40 41 1 PRECISION 1.E-4 LOADS FUNCTION FLOAD DISTRBEAM 1 0 -11120 0 DISTRBEAM 2 0 -11120 0 DISTRBEAM 3 0 -11120 0 DISTRBEAM 4 0 -11120 0 DISTRBEAM 5 0 -11120 0 DISTRBEAM 6 0 -11120 0 DISTRBEAM 7 0 -11120 0 DISTRBEAM 8 0 -11120 0 DISTRBEAM 9 0 -11120 0 DISTRBEAM 10 0 -11120 0 DISTRBEAM 11 0 -11120 0 DISTRBEAM 12 0 -11120 0 DISTRBEAM 13 0 -11120 0 DISTRBEAM 14 0 -11120 0 DISTRBEAM 15 0 -11120 0 DISTRBEAM 16 0 -11120 0 DISTRBEAM 17 0 -11120 0 DISTRBEAM 18 0 -11120 0 DISTRBEAM 19 0 -11120 0 DISTRBEAM 20 0 -11120 0 END_LOAD MATERIALS CALCONCEC2
0.25 55E6 46E5 0 PSTEELA16
1.9995E11 0.3 1.772E9
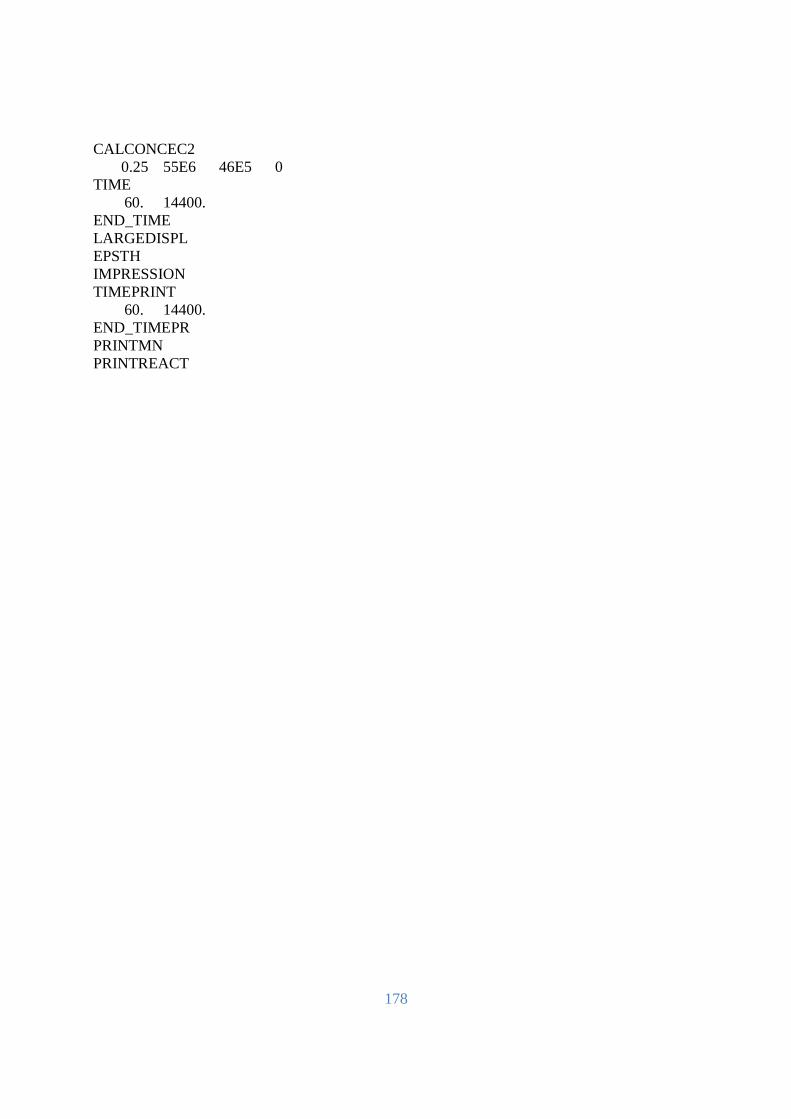
178
CALCONCEC2 0.25 55E6 46E5 0 TIME 60. 14400. END_TIME LARGEDISPL EPSTH IMPRESSION TIMEPRINT 60. 14400. END_TIMEPR PRINTMN PRINTREACT

179
REFERENCES
180
References
1. ABAQUS (2011), ABAQUS 6.11 Analysis User’s Manual, DCS Simulia.
2. Abrams M.S. and Cruz C.R. (1961), “The Behavior at High Temperature of Steel Strand for Prestressed Concrete”, Journal of the Portland Cement Association Research and Development Laboratories, 3(3), pp. 8 – 19.
3. Abrams M.S. and Gustaferro A.H. (1972), “Fire Endurance of Prestressed Concrete
Unit Coated with Spray-Applied Insulation”, Prestressed Concrete Institute,17(1), pp. 82 – 103.
4. Abrams M.S., Gustaferro A.H., and Salse E.A.B. (1971), “Fire Tests of Concrete Joist Floors and Roofs”, R&D Bulletin RD006B, Portland Cement Association, Skokie, IL, USA.
5. ACI Committee 216 (2007). “Standard Method for Determining Fire Resistance of
Concrete and Masonry Construction Assemblies”, American Concrete Institute, Detroit, MI, USA.
6. ACI Committee 318 (2008). “Building Code Requirements for Reinforced Concrete”, ACI 318-08 and Commentary, American Concrete Institute, Detroit, Michigan, USA.
7. Anderberg, Y. and Thelandersson, S. (1976). “Stress and Deformation Characteristics
of Concrete at High Temperatures – Experimental Investigation and Material Behavior Model”, Bulletin 54, Division of Structural Mechanics and Concrete Construction, Lund Institute of Technology, Lund, Sweden.
8. Anderberg Y. (2008), “The Impact of Various Material Models on Structural Fire
Behavior Prediction”, Proceedings of Fifth International Conference on Structures in Fire, Singapore, pp. 12.
9. Anderberg Y. (1986), “Modeling Steel Behaviour”, Report LUTVDG, Division of
Building Fire Safety and Technology, Lund Institute of Technology, Lund, Sweden.
10. ANSYS (2011), Structural Analysis Guide, ANSYS, Inc.
11. Proceedings of International Conference on High Performance Materials in Bridges, Kona, HI, USA, pp. 21 – 33.
181
12. Anderson N.E. and Laurisden D.H. (1999), “TT-roof slabs”, Technical Report X52650, Part 1, Danish Institute of Fire Technology, København, Denmark.
13. Arioz O. (2007), “Effects of Elevated Temperatures on Properties of Concrete”, Fire
Safety Journal, 42(8), pp. 516 – 522.
14. ASCE 7-05 (2005). “Minimum Design Loads for Buildings and Other Structures”, American Society of Civil Engineers, Reston, VA, USA.
15. ASCE Manual of Practice No. 78 (1992). “Structural Fire Protection”, ASCE
Committee on Fire Protection, Structural Division, American Society of Civil Engineers, NY, USA.
16. ASCE/SEI 7-05 (2005). “Minimum Design Loads for buildings and Other
Structures”, American Society of Civil Engineers, Reston, VA, USA.
17. ASCE/SEI/SFPE 29-05 (2007), “Standard Calculation Methods for Structural Fire Protection”, American Society of Civil Engineers, Reston, VA, USA.
18. ASTM E119 (2008), “Standard Methods of Fire Test of Building Construction and
Materials”, American Society for Testing and Materials, West Conshohocken, PA, USA .
19. ASTM E1529 (1993), “Standard Test Methods for Determining Effects of Large
Hydrocarbon Pool Fires on Structural Members and Assemblies”, American Society for Testing and Materials, West Conshohocken, PA, USA.
20. Atienza J.M. and Elices M. (2009), “Behavior of Prestressing Steels After a Simulated
Fire: Fire-induced Damages”, Construction and Building Materials, 23(8), pp. 2932 – 2940.
21. Bastami, M. and Aslani, F. (2010), “Preloaded High-Temperature Constitutive
Models and Relationships for Concrete”, Scientia Iranica, 17(1), pp. 11-25.
22. Boon J. and Monnier T. (1976), “Calculation of the Fire Resistance of Prestressed Concrete Beams”, Heron, 21(1), pp. 37 – 44.
23. Canadian Standards Association (2005), “Code for the Design of Concrete Structures
for Buildings”, CAN3-D-2.10, Rexdale, Canada.
182
24. Cook R.A., Fagundo F.E., and Richarson D. (1997). “Effect of External Elevated Temperatures on the Bond Performance of Epoxy-Coated Prestressing Strands”, Prestressed Concrete Institute, 42(1), pp. 68-75.
25. Canadian Precast and Prestressed Concrete Institute (2007), “Design Manual: Precast
and Prestressed Concrete”, 4th ed., Ottawa, Canada.
26. Dwaikat, M.B. and Kodur, V.K.R. (2007), “A Numerical Approach for Modeling the Fire Induced Restraint Effects in Reinforced Concrete Beams”, Fire Safety Journal, 43(4), pp. 291-307.
27. Dilek, U., Caldwell T., Sharpe F.E., and Leming M. (2003), “Fire Damage
Assessment, Prestressed Concrete Double-Tees at Parking Deck”, Proceedings of the Third Concgress, San Diego, CA, USA, pp. 247 – 258.
28. Dorn, J.E. (1955), “Some Fundamental Experiments on High-Temperature Creep”,
Journal of the Mechanics and Physics of Solids, 3, pp. 85 – 116.
29. Dwaikat M.B. and Kodur V.K.R. (2008) “Effect of Fire Induced Spalling on the Response of Reinforced Concrete Beams”, International Journal of Concrete Structures and Materials, 2(2), pp. 71-81.
30. Elghazouli, A.Y., Cashell, K.A., and Izzuddin, B.A. (2009), “Experimental
Evaluation of the Mechanical Properties of Steel Reinforcement at Elevated Temperature”, Fire Safety Journal, 44, pp. 909-919.
31. Eurocode 1 (2002), “EN 1991-1-2: Actions on Structures. Part 1-2: General Actions
– Actions on Structures Exposed to Fire”, European Committee for Standardization, Brussels, Belgium.
32. Eurocode 2 (2004), “EN 1992-1-1: Design of Concrete Structures. Part 1-1: General
Rules and Rules for Building”, European Committee for Standardization, Brussels, Belgium.
33. Eurocode 2 (2004), “EN 1992-1-2: Design of Concrete Structures. Part 1-2: General Rules – Structural Fire Design”, European Committee for Standardization, Brussels, Belgium.
183
34. Falkner H. and Gerritzen D. (2005), The Continued Use of Pre-tensioned Concrete Parts After Exposure to Fire”, Betonwerk und Fertigteik/Concrete Precasting Plant and Technology, 71(2), pp. 178 – 179.
35. Feasey R. and Buchanan A.H. (2002), “Post Flash-Over Fires for Structural Design”,
Fire Safety Journal, 37(1), pp. 83 – 105.
36. Fellinger J.H.H., Starck, J.W.B., and Warave J.C. (2001), “Bond Model for Prestressed Strands in Fire Exposed Concrete”, Proceedings of International Conference on High Performance Materials in Bridges, Kona, HI, USA, pp. 21 – 33.
37. Fletcher, I.A., Welch, S., Torero, J.L., Carvel, R.O., and Usmani, A. (2007). “The
Behaviour of Concrete Structures under Fire”, Thermal Science, 11(2), pp. 37-52.
38. Franssen J.M. and Bruls A. (1997), “Design and Tests of Prestressed Concrete Beams”, Proceedings of the 5th International Symposium on Fire Safety Science, Melbourn, Australia, pp. 1081 – 1092.
39. Franssen J.M., Kodur V.R., and Mason, J. (2004), User Manual for SAFIR, University
of Liege, Belgium.
40. Gales J., Bisby, L.A., MacDougall C., and MacLean K. (2009) “Transient High-Temperature Stress Relaxation of Prestressing Tendons in Unbonded Construction”, Fire Safety Journal, 44(4), pp. 570-579.
41. Gernay, T. and Franssen, J.M. (2011), “A Comparison Between Explicit and Implicit
Modeling of Transient Creep Strain in Concrete Uniaxial Constitutive Relationships”, Proceedings of the Fire and Materials 2011 Conference”, San Francisco, USA.
42. Gustaferro A.H. and Carlson C.C. (1962), “An Interpretation of Results of Fire Tests
of Prestressed Concrete Building Components”, Prestressed Concrete Institute, 7(1), pp. 14 – 43.
43. Harmathy T.Z. (1988), “Properties of Building Materials “, The SFPE Handbook of
Fire Protection Engineering, (1)26, p. 378 – 391.
44. Harmathy T.Z. (1967), “A Comprehensive Creep Model”, Journal of Basic Engineering Transaction of the ASME, (89), pp. 496-502.
184
45. Harmathy T.Z. and Stanzak W.W. (1970), “Elevate-Temperature Tensile and Creep Properties of Some Structural and Prestressing Steels”, Special Technical Publication 464, American Society for Testing and Materials, West Conshohocken, PA, USA.
46. Hill, A.W. and Ashton A.L. (1957), “The Fire Resistance of Prestressed Concrete”,
Civil Engineering an Public Works Review, 52(617), pp. 1249-1253.
47. Holmes M., Anchor R.D., Cook G.M.E., and Crook R.N. (1982), “Effects of Elevated Temperatures of the Strength Properties of Reinforcing and Prestressing Steel”, Structural Engineer, 60B(1), pp. 7 – 13.
48. Husem M. (2006), “The Effects of High Temperature on Compressive and Flexural
Strengths of Ordinary and High-Performance Concrete”, Fire Safety Journal, 41(2), pp. 155-163.
49. International Code Council (2006), “International Building Code”, Falls Church, VA,
USA.
50. Industry Handbook Committee (2004), “PCI Design Handbook: Precast and Prestressed Concrete Institute”, 6th ed., PCI MNL 120-04, Skokie, IL, USA.
51. ISO 834 (1975), “Fire Resistance Tests – Elements of Building Construction.
International Organization for Standardization”.
52. Jansson R. (2008). “Material Properties of Fire Spalling of Concrete”, Rep. No. TVBM-3143, Division of Building Fire Safety and Technology, Lund Institute of Technology, Lund University, Sweden.
53. Kodur V.K.R. and Dwaikat M.D. (2008) “Effect of Fire Induced Spalling on the
Response of Reinforced Concrete Beams”, International Journal of Concrete Structures and Materials, 2(2), pp. 71 – 81.
54. Kodur V.K.R., Dwaikat M.M.S., and Dwaikat M.B. (2008), “High Temperature
Properties of Concrete for Fire Resistance Modeling of Structures”, ACI Material Journal, 105(5), pp. 517 – 527.
55. Kodur V. R. and Harmathy T.Z. (2008), “Properties of building materials” Editor:
DiNenno P.J., SFPE Handbook of Fire Protection Engineering, 4th ed., National Fire Protection Association, Quincy, MA, pp. 1.167-1.195.
185
56. Kodur V.K.R. and Sultan M.A. (2003), “ Effect of Temperature on Thermal and Properties of High Strength Concrete”, Journal of Materials in Civil Engineering, 15(2), pp. 101 – 107.
57. Khoury, G.A. and Anderberg, Y. (2000), “Concrete Spalling – Review, Fire Safety
Design, Report Submitted to Swedish National Road Administration, Borlange, Sweden .
58. LeClair P.J. and Shaikh A.F. (1996), “Effect of Elevated Temeprature on Bond
Strength of Epoxy-Coated Prestressing Strand”, Prestressed Concrete Institute, 41(4), pp. 54 – 60.
59. Li M., Qian C.X., and Sun W. (2004), “Mechanical Properties of High-Strength
Concrete After Fire”, Cement and Concrete Research, 34(6), pp. 1001 – 1005.
60. Lier G. (1983), “Creep of Structural Steel Fire: Analytical Expressions.” Fire and Materials, 7(2), pp. 73-78.
61. Lin T.D., Gustaferro A.H., and Abrams M.S. (1981), “Fire Endurance of Continuous
Reinforced Concrete Beams”, R&D Bulletin RD006B, Portland Cement Association, Skokie, IL, USA.
62. MacLean K. (2007), “Post-fire Assessment of Unbonded Post-tensioned Concrete
Slabs: Strand Deterioration and Prestress Loss”, M.S. Thesis, Department of Civil Engineering, Queens University, Kingston, Ontario, Canada.
63. Magnusson S.E. and Thelandersson S. (1970), “Temperature-time Curves of
Complete Process of Fire Development. Theoretical Study of Wood Fuel Fires in Enclosed Spaces”, Acta Polytechnica Scandanavia Civil Engineering and Building Construction, 65(1), pp. 1 – 181.
64. Malhorta H.L. (1984), “Spalling of Concrete in Fires”, Technical Note No. 118,
Construction Industry Research and Information Association, London, England.
65. Naus, D. G. (2005). “The Effect of Elevated Temperature on Concrete Materials and Structures – A Literature Review”, NRC Fin No. Y6741, U.S. Nuclear Regulatory Commission, Oak Ridge, TN, USA.
186
66. Neves I.C., Rodrigues J.P.C., and Loureiro A.D.P. (1996), “Mechanical Properties of Reinforcing and Prestressing Steel After Heating”, Journal of Materials in Civil Engineering, 8(4), pp. 189 – 194.
67. Parkinson D.L. and Kodur V.K.R. (2007), “Performance-Based Design of Structural
Steel for Fire Conditions – A Calculation Methodology”, International Journal of Steel Structures, 7(3), pp. 219 – 226.
68. Pettersson, O. (1965). “Structural fire engineering research today and tomorrow.”
Acta Polytechnica Scandinavica, Civil Engineering and Building Construction Series No. 33, Stockholm, pp. 42-55.
69. Phan L.T. (1996), “Fire Performance of High-strength concrete. A Report of the
State-of-the-Art”, NISTIR 5934, National Institute of Standards and Technology, Gaithersburg, MD, USA.
70. Saad M., Abo-El-Enein S.A., Hanna G.B., and Kotkata M.F. (1996), “Effect of
Temperature on Physical and Mechanical Properties of Concrete Containing Silica Fume”, Cement and Concrete Research, 26(5), pp. 669 – 675.
71. Saito, H. (1965). “Explosive spalling of prestressed concrete in fire.” BRI Occasional
Report No. 22, Building Research Institute, Ministry of Construction, Tokyo, pp. 18.
72. Schneider, U., Diedrichs, U., and Ehm, C. (1981), “Effect of Temperature on Steel and Concrete for PCRV’s”, Nuclear Engineering and Design, 67, pp. 245-258.
73. Shin K.Y., Kim S.B., Kim J.H., and Jung P.S. (2002), “Thermo-Physical Properties
and Transient Heat Transfer of Concrete at Elevated Temperatures”, Nuclear Engineering and Design, 212(1-3), pp. 233-241.
74. Selvaggio S.L. and Carlson C.C. (1963), “Effect of Restraint on Fire Resistance of
Prestressed Concrete”, Special Technical Publication 344, American Society for Testing and Materials, West Conshohocken, PA, USA.
75. Selvaggio S.L. and Carlson C.C. (1964), “Fire Resistance of Prestressed Concrete
Beams Study: Influence of Aggregate and Load Intensity”, Prestressed Concrete Institute, 6(4), pp. 10 – 25.
76. Society of Fire Protection Engineers (2011), “SFPE Standard on Calculating Fire
Exposures to Structures”, Bethesda, MD, USA.
187
77. UL Fire Resistance Directory (1996), “Online Certification Directory BXUV.J945-
J947,” Underwriters Laboratories Inc, Camas, WA, USA.
78. Wang T.C., Cheng F.P. and Kodur V.K.R. (2004), “Predicting the Fire Resistance Behavior of High Strength Concrete Columns”, Cement and Concrete Composites, 26(2), pp. 141 – 153.
79. Wenzhong, Z., Qiong, H., and Haoyu, Z. (2007), “Experimental Research on the
Mechanical Property of Prestressing Wire During and After Heating”, Frontiers of Architecture and Civil Engineering in China, 1(2), pp. 247-254.
80. Woods H. (1960), “Research on Fire Resistance of Prestressed Concrete”, Journal of
Structural Division, Proceedings of the American Society of Civil Engineers, 86(11), pp. 53 – 56.
81. Yafei, S., Yongjun, T., Jing, S., and Dongjie, N. (2009), “Effect of Temperature and
Composition on Thermal Properties of Carbon Steel”, Proceedings of the 21st Annual International Conference on Chinese Control and Decision Conference”, Guilin, China, pp. 3756-3760.
82. Zheng W., Hu Q., and Zhang H. (2007), “Experimental Research on the Mechnaical
Property of Prestressing Steel Wire During and After Heating”, Frontiers of Architecture and Civil Engineering in China, 1(2), pp. 247 – 254.
83. Zollman C.C. and Garavaglia M.G. (1960), “Prestressed Concrete Resists Fire
Damage”, Civil Engineering, 30(12), pp. 36 – 41.