performance measurement & evaluation: overview and example ... · pdf fileperformance...
TRANSCRIPT

1 U.S. Department of Transportation
Performance Measurement & Evaluation:
Overview and Example Case Study
6 April 2017

2 U.S. Department of Transportation
1. Performance Measurement and Evaluation Overview
2. Best Practice for Performance Measurement and Evaluation using a Hypothetical Example
3. Tampa THEA CV Pilot Site Performance Measurement (Additional material)
4. Questions
AGENDA

3 U.S. Department of Transportation
PERFORMANCE MEASUREMENT & EVALUATION
Performance Measurement □ Means of assessing the progress made towards attaining established goals □ Not just about data collection, verification, and cleaning but also about using the
data to understand the system
Performance Monitoring □ Ongoing tracking of performance to assess if targets have been or are likely to be
met □ Enables system managers to take corrective and proactive actions to control and
manage the system □ Allows system managers to understand the impacts of investments and policies
Performance Evaluation □ Systematic and objective examination of measures and outcomes to understand
the impacts of investments and policies on performance, thus improving current and future planning and investment decisions
□ Conducted by an independent party who has no vested interest or stake in the project

4 U.S. Department of Transportation
BEST PRACTICE FOR PERFORMANCE MEASUREMENT AND EVALUATION
Source: Methodology to Evaluate the Benefits of Cooperative System Applications Report

5 U.S. Department of Transportation
HYPOTHETICAL CORRIDOR FACING SIGNIFICANT ISSUES DURING AM TRAVEL Stakeholder Concerns • High number of crashes • Reduced safety during inclement weather • Low throughput • High emissions

6 U.S. Department of Transportation
STEP 1: IDENTIFY STAKEHOLDERS AND NEEDS
Purpose Identify stakeholders and operational needs for the transportation network
Approach Identify people or groups with direct interest in or will be impacted by any
improvements in a transportation network Diagnose transportation issues and operational needs Identify evaluation needs and incorporate them into the ConOps
Example (for the Hypothetical Corridor) Stakeholders include:
□ State DOT, Metropolitan Planning Organization (MPO), State Highway Patrol, the Driving Public
Operational needs include: □ Reduce the high number of crashes on the corridor □ Improve safety conditions on the corridor, including during inclement weather □ Increase vehicle throughput on the corridor □ Reduce vehicle emissions on the corridor
During the concept development process, stakeholders decide to implement a Speed Harmonization Application to mitigate the problems

7 U.S. Department of Transportation
STEP 2: DEFINE GOALS AND OBJECTIVES
Purpose Define goals and objectives of the deployment
Approach Formulate research questions to be solved by deployment Align project objectives with agency’s long term goals
Example (for the Hypothetical Corridor) Project goals are to improve safety, enhance mobility, and minimize
negative environmental impacts Evaluation objectives are:
□ To assess the safety, mobility, sustainability, and public agency efficiency impacts of deploying the speed harmonization cooperative system application on the hypothetical corridor
□ To measure the driver perception / acceptance of the speed harmonization cooperative system application

8 U.S. Department of Transportation
STEP 3: STATE HYPOTHESES AND ASSUMPTIONS
Purpose State hypotheses and assumptions about the application deployment
Approach State initial propositions of the potential impacts of cooperative system
application State assumptions to be considered in the evaluation process
Example (for the Hypothetical Corridor) Hypotheses:
□ Deployment of speed harmonization application will significantly improve safety, mobility, sustainability, and public agency efficiency in the corridor
□ Drivers will find the speed harmonization application useful and valuable as they drive through the corridor
Assumptions: □ All communications in the CV environment will be exclusively DSRC □ Compliance rates will be the same from year to year

9 U.S. Department of Transportation
STEP 4: IDENTIFY EVALUATION INDICATORS
Purpose To identify the right, appropriate, and consistent evaluation indicators to be used in
assessing the effectiveness of cooperative system applications
Approach Need both quantitative and qualitative evaluation indicators Key attributes of good evaluation indicators should be considered*
□ Purpose: Chosen evaluation indicators must reflect goals of application deployment □ Credibility: Chosen evaluation indicators should be supported by stakeholders □ Availability: Data necessary to estimate chosen evaluation indicators must be
available □ Clarity: Chosen evaluation indicators should be easy to interpret □ Validity: Chosen evaluation indicators should be a valid representation of what it
claims to measure □ Reliability: Chosen evaluation indicators should have a high likelihood of yielding
the same results in repeated trials, so there are low levels of random error in measurement
□ Responsiveness: Chosen evaluation indicators should be able to detect change □ Abuse-Proof: Guarding against unintended consequences
* Source: Revised Freeway Management and Operations Handbook

10 U.S. Department of Transportation
STEP 4: IDENTIFY EVALUATION INDICATORS (CONT.)
Example (for the Hypothetical Corridor) Safety Evaluation Indicators
□ Number of lane changes, number of hard braking events □ Speed variance □ Number of crashes
Mobility Evaluation Indicators □ Average delay/Travel time savings □ Travel time reliability □ Vehicle throughput
Sustainability Evaluation Indicators □ Fuel consumption □ Emissions
Public Agency Efficiency Evaluation Indicators □ Agency staff time in managing incidents □ Accuracy of targeted speed advisories
User Acceptance / Satisfaction Indicators □ Percent compliance with recommended speed advisories □ Perceived usefulness of deployed cooperative system application

11 U.S. Department of Transportation
STEP 5: FRAME EVALUATION USING LOGIC MODELS
Purpose To establish interdependencies and secure stakeholder buy-in
Approach Use Pictorial representation to relate your input, output and outcomes.
Identify all assumptions and external factors.
Source: Comparison of Evaluation Tools and Methods Used in the United States (U.S.) and Japan Report

12 U.S. Department of Transportation
STEP 5: FRAME EVALUATION USING LOGIC MODELS (CONT.)
Logic Model for Hypothetical Corridor Source: Methodology to Evaluate the Benefits of Cooperative System Applications

13 U.S. Department of Transportation
STEP 6: DEVELOP EVALUATION DESIGN
Purpose Develop evaluation design to account for confounding factors and isolate
impacts of the deployment
Approach Three main types of evaluation designs
□ Non-experimental design (Simple before and after) □ Randomized Experimental Design with control and treatment groups □ Quasi Experimental Design with non-randomized control and treatment
groups
Example (for the Hypothetical Corridor) Limited use of randomized design supplemented with before/after depending
on the evaluation indicators

14 U.S. Department of Transportation
STEP 6A: NON-EXPERIMENTAL DESIGN Impact of deployment is assessed by examining changes in the post-
deployment period given the trend in the pre-deployment period
Weakest design type since it has no control group, does not account for confounding factors, and doesn’t control for other threats to internal validity, possibly leading to false conclusions
Example: Before/After Studies, Longitudinal Studies
Not Recommended

15 U.S. Department of Transportation
Study subjects are randomly assigned to the control and treatment groups
Most effective in controlling for confounding factors and other threats to internal validity; provides the most assurance that outcomes are the result of the deployment
If the chosen evaluation indicators (e.g., number of hard braking events) require disaggregate vehicle data from equipped vehicles then this is the only option
STEP 6B: RANDOMIZED EXPERIMENTAL DESIGN

16 U.S. Department of Transportation
Approximation of randomized experimental design; no random assignment Results may not be conclusive, since control and treatment groups cannot
be assumed to be similar (possible selection bias)
STEP 6C: QUASI-EXPERIMENTAL DESIGN

17 U.S. Department of Transportation
Purpose To collect, process, and archive data that will be used for measuring
performance and assessing impacts of the deployment
Approach Collect data from multiple sources according to the evaluation design Process and verify data Archive data
Example (for the Hypothetical Corridor) Time-stamped Roadside Unit (RSU) logs, time stamped speed harmonization
messages, time-stamped Onboard Unit (OBU) messages, traffic data, etc. Collected data are cleaned and validity checks conducted Raw and cleaned data are stored in the state DOT’s database
STEP 7: COLLECT, PROCESS, AND ARCHIVE DATA

18 U.S. Department of Transportation
Purpose Analyze collected and verified data to calculate evaluation indicators using
appropriate measurement methodologies
Approach Use appropriate methods to measure evaluation indicators
□ Field and user survey data □ Analytical tools ▪ Sketch planning tools, deterministic tools, and traffic simulation tools
Compare evaluation indicators to determine impacts (benefits) of the deployment
Example (for the Hypothetical Corridor) Using field data
□ Average delay & travel time savings will be calculated using speed data from ITS devices and CVs
Using analytical tool □ Number of lane changes will be measured using microscopic traffic
simulation (e.g., VISSIM)
STEP 8: MEASURE EVALUATION INDICATORS
19 U.S. Department of Transportation
Purpose Conduct benefits-cost analyses to determine the cost-effectiveness of the
deployment
Approach Monetize benefits Estimate costs Calculate benefit-cost ratio and net benefit
STEP 9: CONDUCT BENEFITS-COSTS ANALYSES
20 U.S. Department of Transportation
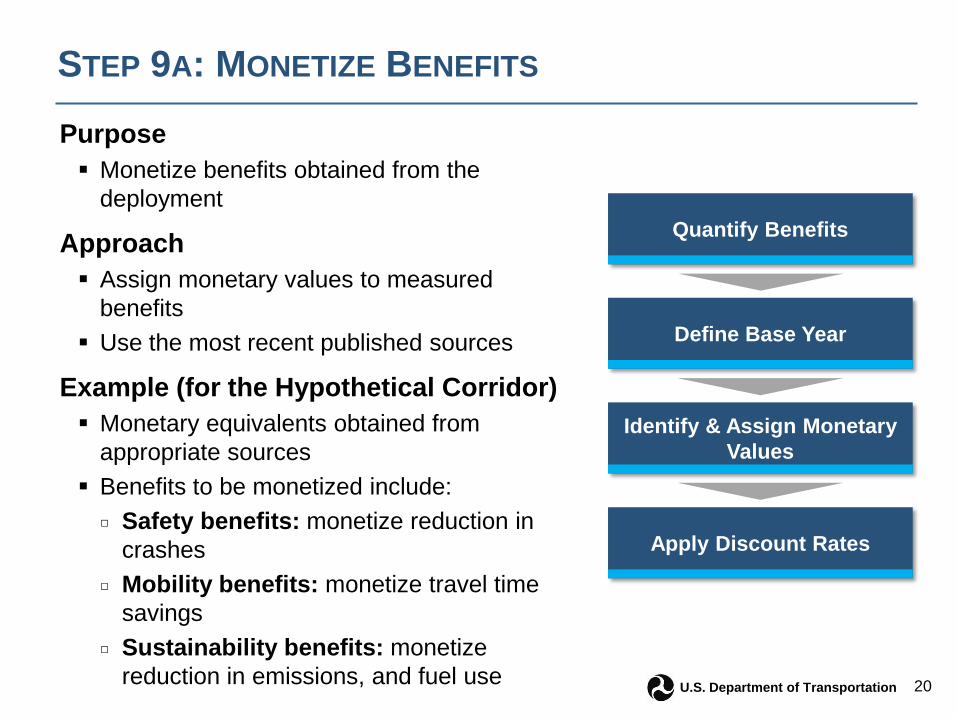
Purpose Monetize benefits obtained from the
deployment
Approach Assign monetary values to measured
benefits Use the most recent published sources
Example (for the Hypothetical Corridor) Monetary equivalents obtained from
appropriate sources Benefits to be monetized include:
□ Safety benefits: monetize reduction in crashes
□ Mobility benefits: monetize travel time savings
□ Sustainability benefits: monetize reduction in emissions, and fuel use
STEP 9A: MONETIZE BENEFITS
Quantify Benefits
Define Base Year
Identify & Assign Monetary Values
Apply Discount Rates

21 U.S. Department of Transportation
Calculated Yearly Benefits for Speed Harmonization Application (Example for the Hypothetical Corridor)
STEP 9A: MONETIZE BENEFITS (CONT.)
Benefit Category Evaluation Indicator Expected Yearly Benefits
Mobility Travel time savings 10,000 Hours
Safety Number of crashes 1. Reduce critical injuries by 1 2. Reduce property damaged only crashes by 3
Sustainability 1. Emissions 2. Fuel use
1. Reduce each emission type by 10 tons 2. Reduce fuel use by 20,000 gallons
22 U.S. Department of Transportation
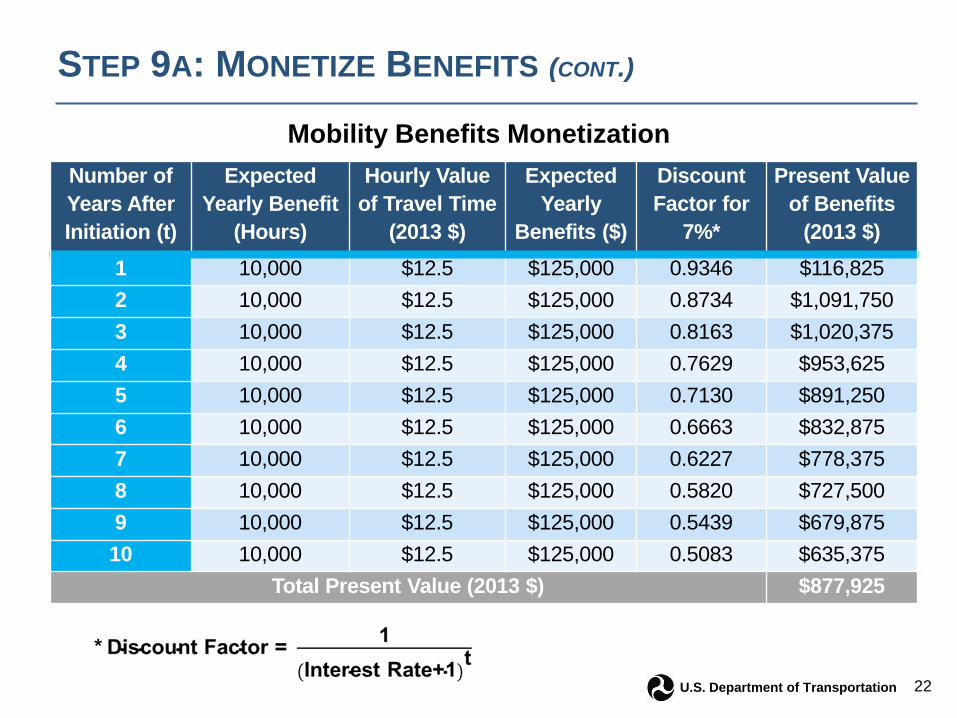
Mobility Benefits Monetization
STEP 9A: MONETIZE BENEFITS (CONT.)
Number of Years After Initiation (t)
Expected Yearly Benefit
(Hours)
Hourly Value of Travel Time
(2013 $)
Expected Yearly
Benefits ($)
Discount Factor for
7%*
Present Value of Benefits
(2013 $) 1 10,000 $12.5 $125,000 0.9346 $116,825 2 10,000 $12.5 $125,000 0.8734 $1,091,750 3 10,000 $12.5 $125,000 0.8163 $1,020,375 4 10,000 $12.5 $125,000 0.7629 $953,625 5 10,000 $12.5 $125,000 0.7130 $891,250 6 10,000 $12.5 $125,000 0.6663 $832,875 7 10,000 $12.5 $125,000 0.6227 $778,375 8 10,000 $12.5 $125,000 0.5820 $727,500 9 10,000 $12.5 $125,000 0.5439 $679,875 10 10,000 $12.5 $125,000 0.5083 $635,375
Total Present Value (2013 $) $877,925

23 U.S. Department of Transportation
Total Monetized Benefits for Speed Harmonization Application
STEP 9A: MONETIZE BENEFITS (CONT.)
Year Mobility Safety Sustainability Annual
Discounted Benefits
1 $116,825.00 $5,221,028.63 $3,596,300.04 $74,622,438.00 2 $109,175.00 $4,879,142.31 $3,363,230.59 $69,738,395.00 3 $102,037.50 $4,560,160.14 $3,145,620.63 $65,181,397.00 4 $95,362.50 $4,261,847.57 $2,940,495.05 $60,918,069.00 5 $89,125.00 $3,983,087.32 $2,749,228.42 $56,934,587.00 6 $83,287.50 $3,722,203.48 $2,569,586.74 $53,205,918.00 7 $77,837.50 $3,478,637.41 $2,401,975.38 $49,724,869.00 8 $72,750.00 $3,251,271.84 $2,245,602.64 $46,475,447.00 9 $67,987.50 $3,038,430.85 $2,098,945.25 $43,433,330.00 10 $63,537.50 $2,839,555.80 $1,961,453.97 $40,590,371.00
Total (2013 $) $48,952,139.86

24 U.S. Department of Transportation
Purpose Estimate costs associated with the deployment
Approach Identify and categorize all sources of cost
□ Capital Cost □ Operation and Maintenance Cost □ Replacement Cost
Example (for the Hypothetical Corridor)
STEP 9B: ESTIMATE COSTS
Capital Costs • Systems engineering cost (e.g.,
planning and design cost) • Software development cost • Roadside equipment cost • Vehicle on-board unit cost • Backhaul comm. upgrade cost • Driver and staff training cost
Operation and Maintenance Cost • Periodic maintenance cost • Re-training of agency staff cost
Replacement Cost • Malfunctioning equipment replacement
cost • Obsolete inductive loop detectors
replacement cost

25 U.S. Department of Transportation
STEP 9B: ESTIMATE COSTS (CONT.)
Cost Component Quantity Average Input Unit Cost (2013 $)
Average Simulated Unit Cost (2013 $)
Average Simulated Total
Cost (2013 $) Capital Costs Driver Training Hours: Light Vehicles 1,000 $20.84 $20.87 $20,865.44
Backhaul Communications Upgrade 20 $27,666.67 $27,494.80 $549,896.04 Inductive Loop Detectors 80 $3,000.00 $2,998.54 $239,883.38
RSE Planning & Design 20 $6,650.00 $6,651.30 $133,026.09
Roadside Equipment (RSEs) 20 $10,683.33 $10,668.26 $213,365.19
Light Vehicle OBU 500 $4,150.00 $4,130.03 $2,065,016.46
Light Vehicle Software Package 500 $2,000.00 $2,001.63 $1,000,813.70
Software Development & Testing 1 $250,000.00 $249,933.54 $249,933.54 Systems Engineering Costs N/A N/A N/A $632,317.08
Outreach Costs N/A N/A N/A $270,993.04
Total Capital Cost $5,376,109.96
Operation and Maintenance (O&M) Costs Operation and Maintenance Costs (Annually)
N/A N/A N/A $360,420.74
Total Operation & Maintenance Cost See next slide
Replacement Costs Replacement Cost-RSEs 2 $10,683.33 $10,682.73 $21,365.45 Replacement Cost-Inductive Loops 4 $3,000.00 $2,996.78 $11,987.12 Total Replacement Costs $33,352.57

26 U.S. Department of Transportation
STEP 9B: ESTIMATE COSTS (CONT.)
Number of Years After Deployment
Expected Yearly O&M Costs ($) Discount Factor for 7%
Present Value of O&M Costs (2013 $)
1 $0.00 0.9346 $0.00 2 $360,420.74 0.8734 $314,791.00 3 $360,420.74 0.8163 $294,211.00 4 $360,420.74 0.7629 $274,965.00 5 $360,420.74 0.713 $256,980.00 6 $360,420.74 0.6663 $240,148.00 7 $360,420.74 0.6227 $224,434.00 8 $360,420.74 0.582 $209,765.00 9 $360,420.74 0.5439 $196,033.00 10 $360,420.74 0.5083 $183,202.00
Total Present Value (2013 $) $2,194,530.00
Cost Category Cost (2013 $) Capital Cost $5,376,109.96 Operation and Maintenance Cost $2,194,529.80 Replacement Cost $33,352.57 Total Present Value (2013 $) $7,603,992.33

27 U.S. Department of Transportation
STEP 9C: CALCULATE BENEFIT-COST RATIO AND NET BENEFIT

28 U.S. Department of Transportation
STEP 9C: CALCULATE BENEFIT-COST RATIO & NET BENEFIT (CONT.)

29 U.S. Department of Transportation
STEP 10: REPORT PERFORMANCE
Purpose To present evaluation results to stakeholders
Approach Identify the various stakeholders and report evaluation results in a way they
will understand There should be a clear link between the reporting of evaluation results and
hypotheses tested Use different formats
□ Dashboards, graphs, charts, tables, etc.
Example (for the Hypothetical Corridor) Evaluation results will be presented in charts and tables

30 U.S. Department of Transportation
Tampa THEA CV Pilot Site Performance Measurement

31 U.S. Department of Transportation
TAMPA (THEA) PILOT DEPLOYMENT OVERVIEW
Objective The objective of this deployment is to alleviate congestion
and improve safety during morning commuting hours. □ Deploy a variety of V2V and V2I safety, mobility, and
agency data applications to create reinforcing benefits for motorists, pedestrians, and transit operation
Source: THEA
Approach Employ DSRC to enable transmissions among approximately
1,600 cars, 10 buses, 10 streetcars, 500 pedestrians with smartphone applications, and approximately 40 roadside units along reversible lanes and major city arterials to provide the following benefits:
□ Reduce morning peak hour queues and related collisions □ Reduce wrong-way entries into the reversible lanes □ Increase pedestrian safety at several street-crossing locations □ Optimize bus rapid transit (BRT) operation through signal priority □ Reduce conflicts between streetcars and turning vehicles □ Improve traffic progression through enhanced signal coordination

32 U.S. Department of Transportation
STEP 1: IDENTIFY STAKEHOLDERS AND NEEDS
Tampa THEA Stakeholders □ City of Tampa □ Hillsborough Area Regional Transit (HART) □ MacDill Air Force Base □ Amalie Arena □ Tampa Downtown Partnership (TDP)
Tampa THEA Site Needs □ Improve safety by reducing number of vehicular and pedestrian
crashes/severity of crashes □ Improve mobility by reducing travel delays during peak periods □ Improve transit operations by reducing transit signal delay □ Mitigate negative environmental impacts due to queuing

33 U.S. Department of Transportation
STEP 2: DEFINE GOALS AND OBJECTIVES
Tampa THEA Site Goals □ Develop and deploy CV Infrastructure to support CV Applications identified □ Improve mobility in the Tampa central business district area □ Improve safety in the pilot area □ Reduce negative environmental impacts of transportation within the pilot area □ Improve agency efficiency in managing the Tampa area transportation system □ Develop business environment for sustainability
Tampa THEA Site Objectives □ Detect and warn of potential conflicts between trolleys, vehicles, and pedestrians □ Help HART buses stay on predictable schedule through TSP applications □ Provide CV mobility and safety applications to improve overall mobility and reduce
stops and idle time within the CBD, thus reducing emissions □ Improve data collection capability, reducing the costs of collecting data □ Work with state and local government to encourage positive legislation and
funding in support of CV technology
34 U.S. Department of Transportation
STEP 3: STATE HYPOTHESES AND ASSUMPTIONS
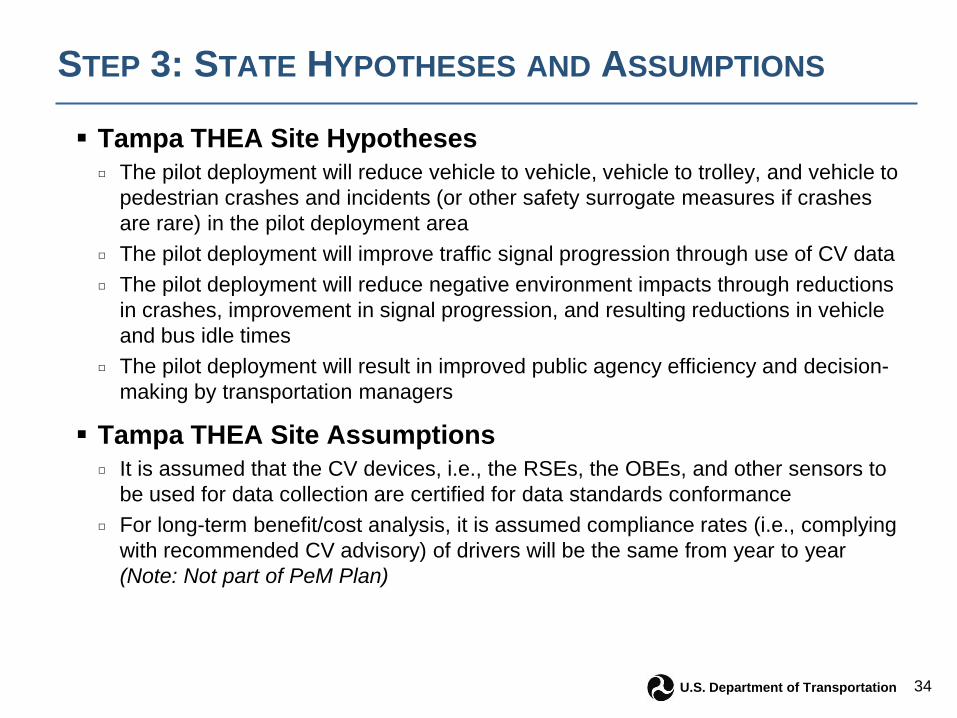
Tampa THEA Site Hypotheses □ The pilot deployment will reduce vehicle to vehicle, vehicle to trolley, and vehicle to
pedestrian crashes and incidents (or other safety surrogate measures if crashes are rare) in the pilot deployment area
□ The pilot deployment will improve traffic signal progression through use of CV data □ The pilot deployment will reduce negative environment impacts through reductions
in crashes, improvement in signal progression, and resulting reductions in vehicle and bus idle times
□ The pilot deployment will result in improved public agency efficiency and decision-making by transportation managers
Tampa THEA Site Assumptions □ It is assumed that the CV devices, i.e., the RSEs, the OBEs, and other sensors to
be used for data collection are certified for data standards conformance □ For long-term benefit/cost analysis, it is assumed compliance rates (i.e., complying
with recommended CV advisory) of drivers will be the same from year to year (Note: Not part of PeM Plan)
35 U.S. Department of Transportation
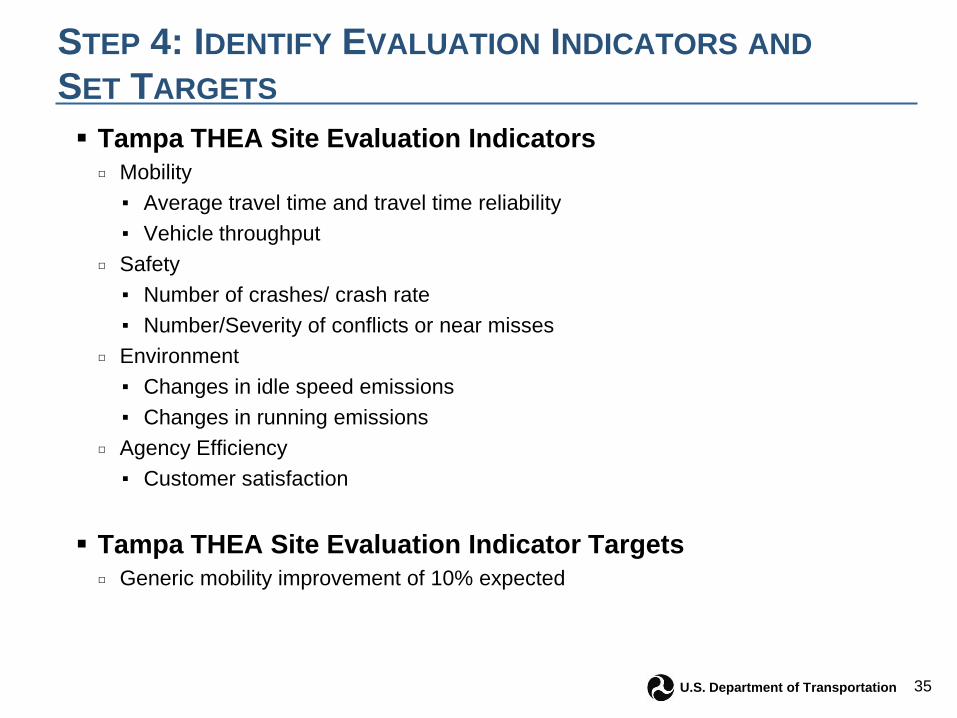
STEP 4: IDENTIFY EVALUATION INDICATORS AND SET TARGETS Tampa THEA Site Evaluation Indicators
□ Mobility ▪ Average travel time and travel time reliability ▪ Vehicle throughput
□ Safety ▪ Number of crashes/ crash rate ▪ Number/Severity of conflicts or near misses
□ Environment ▪ Changes in idle speed emissions ▪ Changes in running emissions
□ Agency Efficiency ▪ Customer satisfaction
Tampa THEA Site Evaluation Indicator Targets □ Generic mobility improvement of 10% expected

36 U.S. Department of Transportation
STEP 5: FRAME EVALUATION USING LOGIC MODELS
Logic Model for Tampa THEA CV Pilot Site (Not part of PeM Plan)

37 U.S. Department of Transportation
STEP 6: DEVELOP EVALUATION DESIGN
Tampa THEA Site Confounding Factors □ Changes in weather conditions between the pre and post deployment periods □ Special events □ Tampa downtown waterfront construction □ Unusually high/low crashes or incidents □ Economic conditions □ Fuel prices
Tampa THEA Site Evaluation Designs □ Randomized experimental design ▪ For use cases that involve applications such as forward collision warning, curve
speed warning □ Quasi-experimental design ▪ For use cases where there are sample collection constraints
□ Non experimental design ▪ For use cases that involve transit operations (transit drivers can’t be randomly
selected or grouped into treatment/control groups due to agency operating parameters)
38 U.S. Department of Transportation
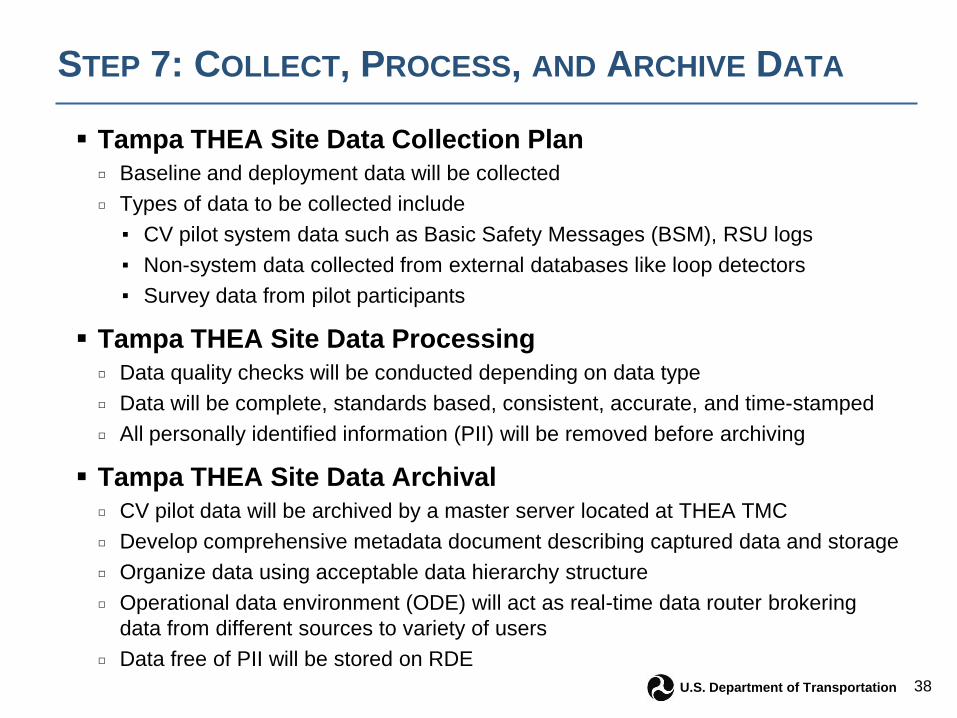
STEP 7: COLLECT, PROCESS, AND ARCHIVE DATA
Tampa THEA Site Data Collection Plan □ Baseline and deployment data will be collected □ Types of data to be collected include ▪ CV pilot system data such as Basic Safety Messages (BSM), RSU logs ▪ Non-system data collected from external databases like loop detectors ▪ Survey data from pilot participants
Tampa THEA Site Data Processing □ Data quality checks will be conducted depending on data type □ Data will be complete, standards based, consistent, accurate, and time-stamped □ All personally identified information (PII) will be removed before archiving
Tampa THEA Site Data Archival □ CV pilot data will be archived by a master server located at THEA TMC □ Develop comprehensive metadata document describing captured data and storage □ Organize data using acceptable data hierarchy structure □ Operational data environment (ODE) will act as real-time data router brokering
data from different sources to variety of users □ Data free of PII will be stored on RDE

39 U.S. Department of Transportation
STEP 8: MEASURE EVALUATION INDICATORS
Tampa THEA Site Evaluation Indicators Measurement □ Appropriate methods will be developed to measure evaluation indicators ▪ For example travel time reliability will be calculated as 90th or 95th
percentile travel time □ Comparison of evaluation indicators to estimate benefits based on use
cases and evaluation design ▪ Randomized experimental design
– Evaluation indicators will be compared between randomly selected treatment and control groups
▪ Quasi-experimental design – Evaluation indicators will be compared between non-randomly
selected treatment and control groups ▪ Non experimental design
– Evaluation indicators will be compared between before (pre) and after (post) periods

40 U.S. Department of Transportation
STEP 9: CONDUCT BENEFITS-COSTS ANALYSES
Tampa THEA Site Benefit/Cost Analysis (Note: Not part of PeM Plan) □ Monetize benefits ▪ Quantify benefits ▪ Define base year ▪ Identify and assign monetary values ▪ Apply discount rates
□ Estimate costs ▪ Identify and categorize costs ▪ Define base year ▪ Apply discount rates and inflation factors ▪ Calculate total cost
□ Calculate benefit/cost ratio ▪ Divide benefits by cost to obtain benefit/cost ratio ▪ Deduct total cost from total benefit to get net-benefit

41 U.S. Department of Transportation
STEP 10: REPORT PERFORMANCE
Tampa THEA Site Performance Reporting □ Reporting to the community and stakeholders ▪ Dashboard
– Uses an interactive infographic approach to track and report performance measures
– Users will be able to assess each of the performance measures ▪ Reporting to independent evaluators
– Data downloads through restricted channels ▪ Website
– Share performance results with the outside world □ Reporting Frequency ▪ For dashboard, performance information will be provided on a daily
basis ▪ IE will receive performance reports based on agreed frequency

42 U.S. Department of Transportation
THANK YOU
Questions?