performance of the 2015 real-time coamps-tc ensemble and
TRANSCRIPT

Performance of the 2015 real-time COAMPS-TC ensembleand combined COAMPS-TC/HWRF/GFDL multi-model ensemble
Jon Moskaitis, Alex Reinecke, Jim Doyle and the COAMPS-TC teamNaval Research Laboratory, Monterey, CA
2015 HFIP Annual Review MeetingWorkshop on Effective Use of Hurricane Ensembles, 17 November 2015
Real-time forecast example: Hurricane Joaquin (11L)
1
2/3
Cat 5
Cat 1
Outline
(1) 2015 COAMPS-TC real-time ensemble demonstration
(2) COAMPS-TC ensemble results & conclusions
(3) COAMPS-TC/HWRF/GFDL combined ensemble results & conclusions
2
(4) Future directions for COAMPS-TC ensemble

2015 COAMPS-TC real-time ensemble demonstration(1)
Number Name Forecasts04L Danny 2506L Fred 3107L Grace 1609L TD9 810L Ida 3811L Joaquin 4007E Felicia 508E TD8 1009E Guillermo 2810E Hilda 3111E TD11 412E Ignacio 114E Kevin 2015E Linda 2016E TD16 217E Marty 1019E Olaf 2620E Patricia 1612W TD12 513W Soudelor 4114W TD14 915W Molave 2416W Goni 4417W Atsani 41
Forecast sample Basic ensemble configuration
158 Atlantic cases173 EastPac cases164 WestPac cases495 Total forecasts
COAMPS-TC model same as ops except 27/9/3 km resolution (instead of 45/15/5 km)and GFS as parent global model (instead of NAVGEM)
Ensemble = 1 unperturbed control + 10 perturbed members
Perturbations to synoptic-scale initial state and TC vortex initial state
Track plot for every 4th
Atlantic basin COAMPS-TC ensemble
forecast

4
2015 COAMPS-TC real-time ensemble demonstration(1)
• Control forecast:• Initialized from the GFS analysis• Vortex initialized with a Rankine vortex based on TC vitals
• 10 ensemble members ICs perturbed about the control:• Synoptic-scale perturbations drawn from WRFVAR cv3 static covariance• Perturb the synoptic-scale initial state and lateral boundary conditions• Vortex ICs based on perturbed TC vitals
Ensemble configuration details
• No data assimilation, no physics perturbations
Changes in ensemble configuration w.r.t 2014 real-time demonstration 2015 version of COAMPS-TC model (new Cd is primary difference) Inner nest size matches ops COAMPS-TC (smaller nests in 2014)

5
Vortex-scale perturbation details
• Vortex position, max wind, and RMW.
• Perturbation variance from:• Torn and Snyder 2012• Landsea and Franklin 2013
• Max wind and RMW covariance derived from 2001-2013 best track data.
• Variances and covariances depend on TC-vital max wind speed.
2015 COAMPS-TC real-time ensemble demonstration(1)

6
COAMPS-TC ensemble results(2)
Deterministic verification: Control vs. Ensemble mean*Track MAE
* Ensemble mean defined to exist if 9 of 11 members present
Atlantic All basins
Sample size Sample size
Unperturbed control member and ensemble mean track forecast accuracy is similar

7
COAMPS-TC ensemble results(2)
Deterministic verification: Control vs. Ensemble mean*
Atlantic All basins
Sample size Sample size
Intensity MAE (solid) and ME (dashed)
* Ensemble mean defined to exist if 9 of 11 members present
Ensemble mean has superior intensity forecast accuracy in both the Atlantic and All basins samples. Mean error is different, reflecting lower average intensity in ensemble mean.
8
COAMPS-TC ensemble results(2)
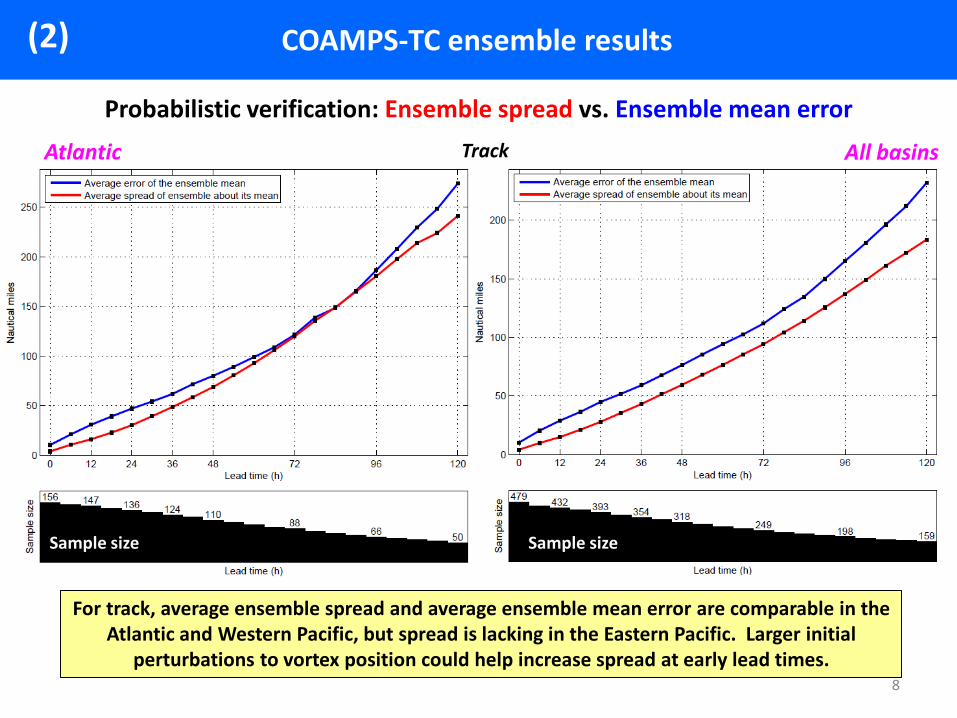
Probabilistic verification: Ensemble spread vs. Ensemble mean errorTrackAtlantic All basins
Sample size Sample size
For track, average ensemble spread and average ensemble mean error are comparable in the Atlantic and Western Pacific, but spread is lacking in the Eastern Pacific. Larger initial
perturbations to vortex position could help increase spread at early lead times.

9
Probabilistic verification: Ensemble spread vs. Ensemble mean error
COAMPS-TC ensemble results(2)
IntensityAtlantic All basins
Ensemble intensity forecasts are underdispersive, especially in the Eastern Pacific and Western Pacific basins. Spread grows with lead time, but not quickly enough.
Sample size Sample size

10
COAMPS-TC ensemble results(2)
Probabilistic verification: Ensemble spread vs. Ensemble mean error
The blue dots represent individual forecasts and red stars are bin-averages (4 equally populated bins) Would like to see red stars line up along diagonal and few blue dots in upper left (large error / low spread)
All Basins, Tau = 48 hTrack Intensity
Spread of ensemble about its mean (kt)Spread of ensemble about its mean (nm)
Erro
r of t
he e
nsem
ble
mea
n (k
t)
Erro
r of t
he e
nsem
ble
mea
n (n
m)

11
COAMPS-TC ensemble results(2)
Probabilistic verification: Ensemble spread vs. Ensemble mean error
All Basins, Tau = 72 hTrack Intensity
Spread of ensemble about its mean (kt)Spread of ensemble about its mean (nm)
Erro
r of t
he e
nsem
ble
mea
n (k
t)
Erro
r of t
he e
nsem
ble
mea
n (n
m)
The blue dots represent individual forecasts and red stars are bin-averages (4 equally populated bins) Would like to see red stars line up along diagonal and few blue dots in upper left (large error / low spread)

12
COAMPS-TC ensemble results(2)
Probabilistic verification: Ensemble spread vs. Ensemble mean error
All Basins, Tau = 96 hTrack Intensity
Spread of ensemble about its mean (kt)Spread of ensemble about its mean (nm)
Erro
r of t
he e
nsem
ble
mea
n (k
t)
Erro
r of t
he e
nsem
ble
mea
n (n
m)
The blue dots represent individual forecasts and red stars are bin-averages (4 equally populated bins) Would like to see red stars line up along diagonal and few blue dots in upper left (large error / low spread)

13
COAMPS-TC ensemble results(2)
Probabilistic verification: Ensemble spread vs. Ensemble mean error
All Basins, Tau = 120 hTrack Intensity
Spread of ensemble about its mean (kt)Spread of ensemble about its mean (nm)
Erro
r of t
he e
nsem
ble
mea
n (k
t)
Erro
r of t
he e
nsem
ble
mea
n (n
m)
For track, larger spread generally implies larger ensemble mean error. However, too many cases
of small spread and large error (Hilda!)
As for track, for intensity larger spread generally implies larger ensemble mean error. Spread is too small though, so red dots above diagonal.
14
COAMPS-TC ensemble results
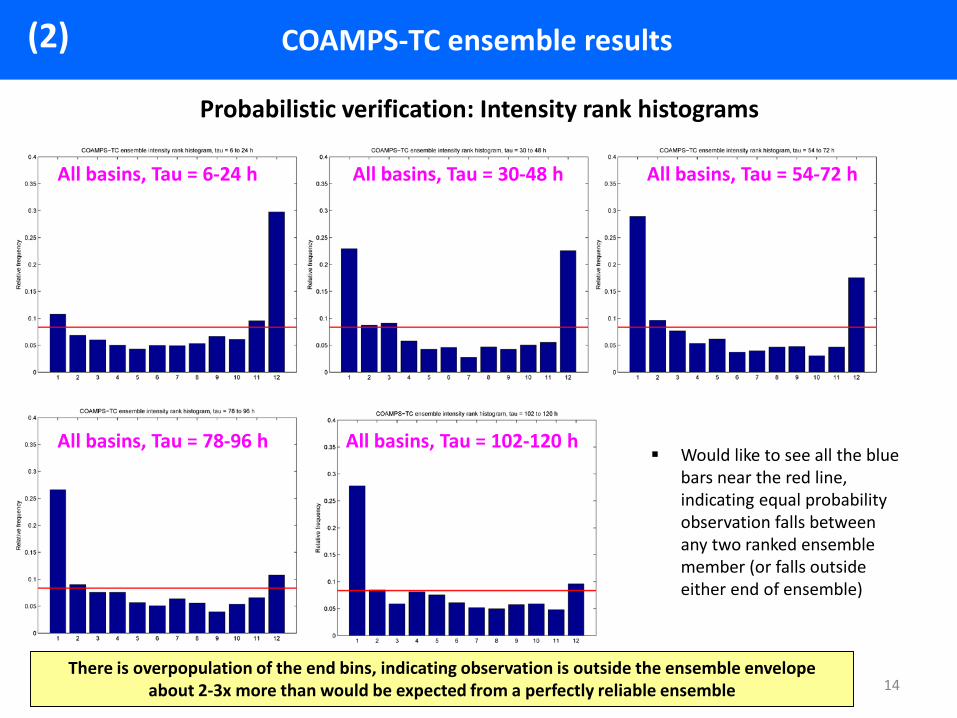
Probabilistic verification: Intensity rank histograms
Would like to see all the blue bars near the red line, indicating equal probability observation falls between any two ranked ensemble member (or falls outside either end of ensemble)
All basins, Tau = 6-24 h All basins, Tau = 30-48 h All basins, Tau = 54-72 h
All basins, Tau = 78-96 h All basins, Tau = 102-120 h
(2)
There is overpopulation of the end bins, indicating observation is outside the ensemble envelope about 2-3x more than would be expected from a perfectly reliable ensemble

COAMPS-TC ensemble results(2)
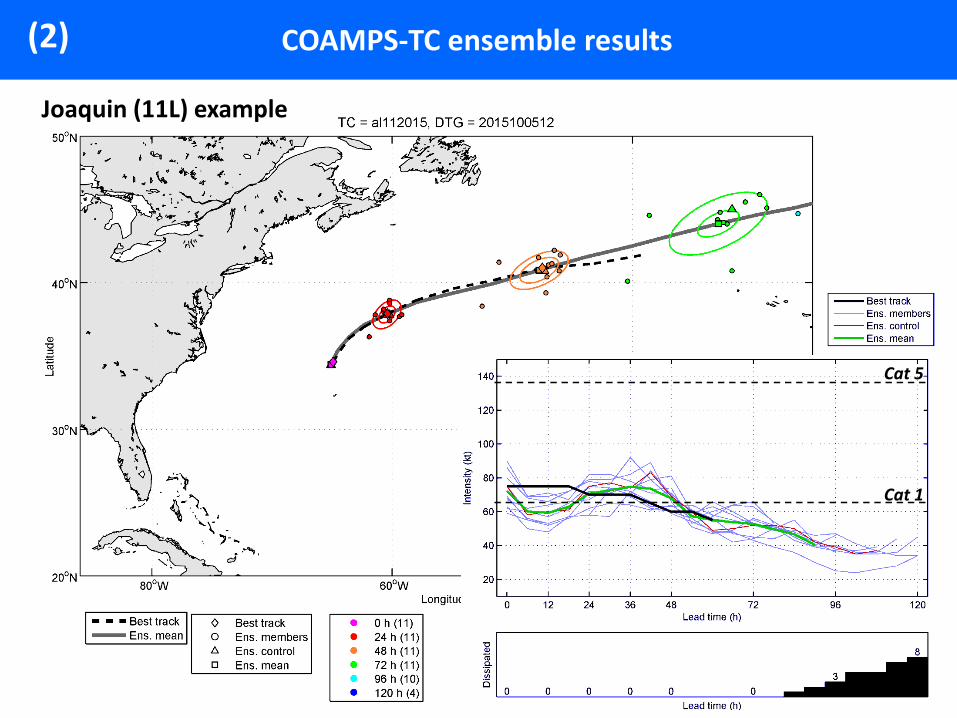
Joaquin (11L) example Track spread: 495 nm (#1 of 159)Intensity spread: 29.3 kt (#1 of 159)
Cat 5
Cat 1

COAMPS-TC ensemble results(2)Track spread: 402 nm (#3 of 159)Intensity spread: 13.0 ktJoaquin (11L) example
Cat 5
Cat 1

COAMPS-TC ensemble results(2)Track spread: 349 nm (#5 of 159)Intensity spread: 20.1 kt (#18 of 159)Joaquin (11L) example
Cat 5
Cat 1

COAMPS-TC ensemble results(2)Track spread: 292 nm (#15 of 159)Intensity spread: 13.1 ktJoaquin (11L) example
Cat 5
Cat 1

COAMPS-TC ensemble results(2)Track spread: 274 nm (#22 of 159)Intensity spread: 9.3 ktJoaquin (11L) example
Cat 5
Cat 1

COAMPS-TC ensemble results(2)
Joaquin (11L) example
Cat 5
Cat 1

COAMPS-TC ensemble results(2)
Joaquin (11L) example
Cat 5
Cat 1
COAMPS-TC ensemble results(2)
Joaquin (11L) example
Cat 5
Cat 1

COAMPS-TC ensemble results(2)
Joaquin (11L) example
Cat 5
Cat 1

COAMPS-TC ensemble results(2)
Joaquin (11L) example
Cat 5
Cat 1

COAMPS-TC ensemble results
Average spread for Joaquin vs. Average spread for all other predicted TCs in 2015
Track spread Intensity spread
Track spread for Joaquin was unusually large relative to the other TCs in the 2015
COAMPS-TC ensemble sample. At the later lead times, Joaquin spread is ~2x
that of the other TCs.
For the later lead times, intensity spread was unusually large relative to the other
TCs in the 2015 COAMPS-TC ensemble sample (up to 2x as large)
(2)

COAMPS-TC ensemble results
Joaquin (11L): Control vs. Ensemble mean
Track MAE Intensity MAE (solid) and ME (dashed)
Sample size Sample size
20 kt
10 kt
Control and ensemble mean track MAE is quite large, relative to that for other TCs (not shown).
Ensemble indicated possibility of unusually large errors.
Control and ensemble mean intensity MAE is low, relative to that for other TCs (not shown).
(2)

Conclusions for COAMPS-TC ensemble(2)
495 forecasts were produced by the real-time demonstration system,for TCs in the Atlantic, Eastern Pacific, and Western Pacific basins
For track, the accuracy of the ensemble mean is similar to that of the control member, but for intensity the ensemble mean is superior
The average spread of the track predictions is consistent with the error of the ensemble mean, and the ensemble can generally distinguish between high and low uncertainty forecasts
The intensity predictions are underdispersive, as shown by the rank histograms and spread-skill comparison. However, the ensemble canstill distinguish between high and low uncertainty forecasts
Results are largely consistent with those of the 2014 real-time demonstration, so with a robust overall sample of ~850 cases we are confident in the
capabilities of the ensemble system and plan to transition it to operations

COAMPS-TC/HWRF/GFDL combined ensemble results(3)
2015 real-time homogeneous forecast sample
Number Name Forecasts
04L Danny 16
06L Fred 27
07L Grace 7
09L TD9 5
10L Ida 19
11L Joaquin 39
Number Name Forecasts
09E Guillermo 1
10E Hilda 9
15E Linda 6
20E Patricia 8
Atlantic Eastern Pacific
Total = 137 forecasts
COAMPS-TC ensemble: 1 control + 10 perturbed members HWRF ensemble: 1 control + 20 perturbed members GFDL ensemble*: 1 control + 11 perturbed members
* Because of a coding error, I only used the control and first 9 GFDL ensemble members in this validation.The track and intensity accuracy of the 10-member and 12-member GFDL ensemble means is nearly identical

COAMPS-TC/HWRF/GFDL combined ensemble results(3)
Deterministic verification: 2015 real-time track
Ensemble mean requirements:COAMPS-TC: 9 of 11 membersHWRF: 17 of 21 membersGFDL: 8 of 10 membersCombo: 34 of 42 members (fromCOAMPS-TC, HWRF and GFDL)
Control forecasts:COAMPS-TC: C00CHWRF: HW00GFDL: GP00Combo: Consensus of
C00C, HW00, and GP00
For individual model, ensemble mean has accuracy similar to
control member
Sample size

COAMPS-TC/HWRF/GFDL combined ensemble results(3)
Deterministic verification: 2015 real-time track
Control forecasts:Combo : Consensus of
C00C, HW00, and GP002model: Consensus of
C00C, HW00
Ensemble mean requirements:Combo: 34 of 42 members (fromCOAMPS-TC, HWRF and GFDL)2model: 26 of 32 members (fromCOAMPS-TC and HWRF)
COAMPS-TC & HWRF & GFDL
COAMPS-TC & HWRF
COAMPS-TC & HWRF combinationoutperforms COAMPS-TC & HWRF
& GFDL combination.
Sample size

COAMPS-TC/HWRF/GFDL combined ensemble results(3)
Deterministic verification: 2015 real-time track
Ensemble mean requirements:COAMPS-TC: 9 of 11 membersHWRF: 17 of 21 members2model: 26 of 32 members (fromCOAMPS-TC and HWRF)
Control forecasts:COAMPS-TC: C00CHWRF: HW002model: Consensus of
C00C, HW00
COAMPS-TC & HWRF combinationoutperforms the two individual models
COAMPS-TC & HWRF ensemble mean has similar track accuracy to
consensus of COAMPS-TC and HWRF control members
Sample size

COAMPS-TC/HWRF/GFDL combined ensemble results(3)
Deterministic verification: 2015 real-time intensitySolid: Mean absolute error Dashed: Mean error
Ensemble mean requirements:COAMPS-TC: 9 of 11 membersHWRF: 17 of 21 membersGFDL: 8 of 10 membersCombo: 34 of 42 members (fromCOAMPS-TC, HWRF and GFDL)
Control forecasts:COAMPS-TC: C00CHWRF: HW00GFDL: GP00Combo: Consensus of
C00C, HW00, and GP00
For individual model, ensemble mean has accuracy similar to or somewhat better than control
member
Sample size

COAMPS-TC/HWRF/GFDL combined ensemble results(3)
Deterministic verification: 2015 real-time intensitySolid: Mean absolute error Dashed: Mean error
COAMPS-TC & HWRF & GFDL
COAMPS-TC & HWRF
COAMPS-TC & HWRF combinationoutperforms COAMPS-TC & HWRF
& GFDL combination.
Control forecasts:Combo : Consensus of
C00C, HW00, and GP002model: Consensus of
C00C, HW00
Ensemble mean requirements:Combo: 34 of 42 members (fromCOAMPS-TC, HWRF and GFDL)2model: 26 of 32 members (fromCOAMPS-TC and HWRF)
Sample size

COAMPS-TC/HWRF/GFDL combined ensemble results(3)
Deterministic verification: 2015 real-time intensitySolid: Mean absolute error Dashed: Mean error
Ensemble mean requirements:COAMPS-TC: 9 of 11 membersHWRF: 17 of 21 members2model: 26 of 32 members (fromCOAMPS-TC and HWRF)
Control forecasts:COAMPS-TC: C00CHWRF: HW002model: Consensus of
C00C, HW00
COAMPS-TC & HWRF combinationoutperforms the two individual models
Consensus of COAMPS-TC and HWRF controls has superior
accuracy and bias w.r.t COAMPS & HWRF ensemble mean
Sample size

COAMPS-TC/HWRF/GFDL combined ensemble results(3)
Probabilistic verification: Ensemble spread vs. Ensemble mean error
Track COAMPS-TC & HWRF Intensity
For track, ensemble is somewhat underdispersivefor all but the earliest lead times
For track, ensemble needs more spread from12 to 84 h; spread growth is too sluggish
Sample size Sample size

COAMPS-TC/HWRF/GFDL combined ensemble results(3)
Probabilistic verification: Ensemble spread vs. Ensemble mean error
The blue dots represent individual forecasts and red stars are bin-averages (4 equally populated bins) Would like to see red stars line up along diagonal and few blue dots in upper left (large error / low spread)
COAMPS-TC & HWRF, Tau = 48 hTrack Intensity
Spread of ensemble about its mean (kt)Spread of ensemble about its mean (nm)
Erro
r of t
he e
nsem
ble
mea
n (n
m)
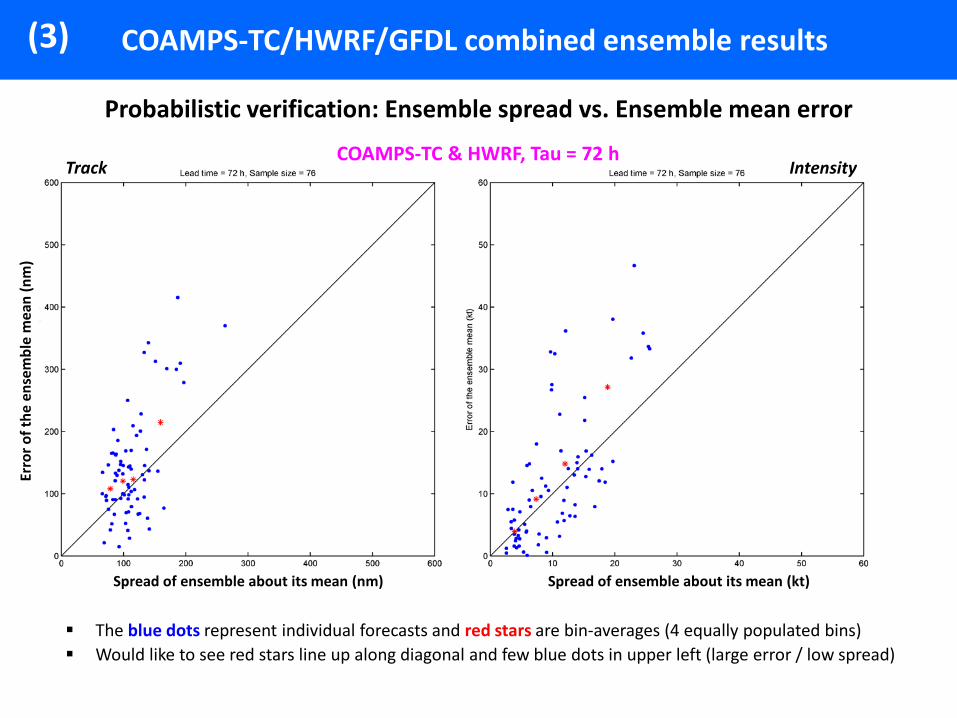
COAMPS-TC/HWRF/GFDL combined ensemble results(3)
Probabilistic verification: Ensemble spread vs. Ensemble mean error
COAMPS-TC & HWRF, Tau = 72 hTrack Intensity
Spread of ensemble about its mean (kt)Spread of ensemble about its mean (nm)
Erro
r of t
he e
nsem
ble
mea
n (n
m)
The blue dots represent individual forecasts and red stars are bin-averages (4 equally populated bins) Would like to see red stars line up along diagonal and few blue dots in upper left (large error / low spread)
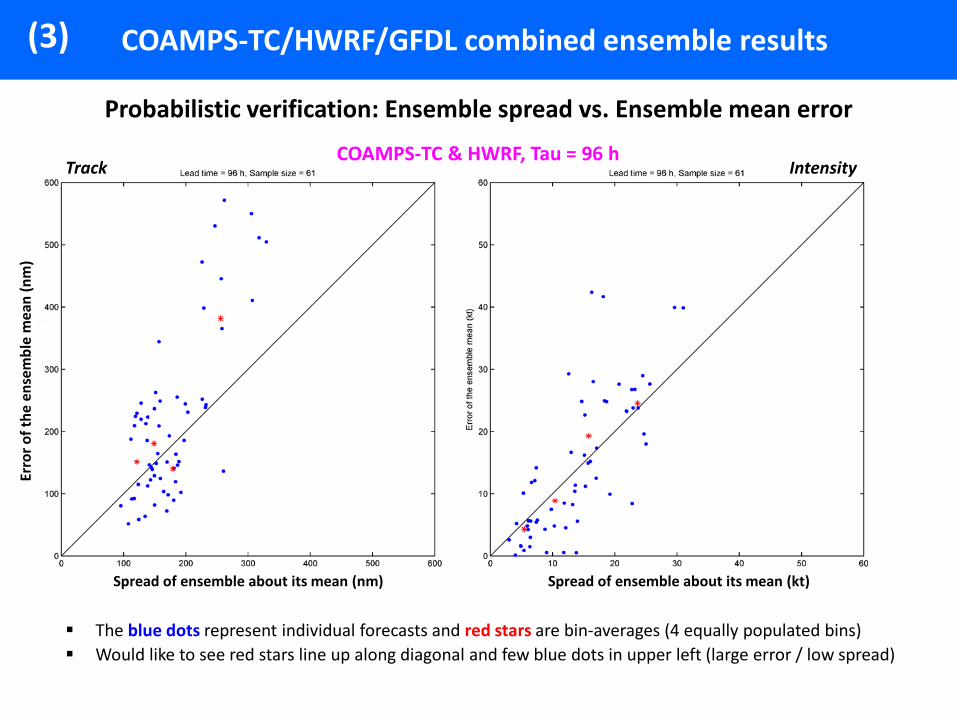
COAMPS-TC/HWRF/GFDL combined ensemble results(3)
Probabilistic verification: Ensemble spread vs. Ensemble mean error
COAMPS-TC & HWRF, Tau = 96 hTrack Intensity
Spread of ensemble about its mean (kt)Spread of ensemble about its mean (nm)
Erro
r of t
he e
nsem
ble
mea
n (n
m)
The blue dots represent individual forecasts and red stars are bin-averages (4 equally populated bins) Would like to see red stars line up along diagonal and few blue dots in upper left (large error / low spread)

COAMPS-TC/HWRF/GFDL combined ensemble results(3)
Probabilistic verification: Ensemble spread vs. Ensemble mean error
COAMPS-TC & HWRF, Tau = 120 hTrack Intensity
Spread of ensemble about its mean (kt)Spread of ensemble about its mean (nm)
Erro
r of t
he e
nsem
ble
mea
n (n
m)
As for the COAMPS-TC-only ensemble, the COAMPS-TC & HWRF combined ensemble candistinguish between low-uncertainty and high-uncertainty cases, for both track and intensity.
Large spread = Higher chance of large ensemble mean error

COAMPS-TC/HWRF/GFDL combined ensemble results(3)
Probabilistic verification: Intensity rank histograms
Would like to see all the blue bars near the red line, indicating equal probability observation falls between any two ranked ensemble member (or falls outside either end of ensemble)
COAMPS-TC & HWRFTau = 6-24 h
COAMPS-TC & HWRFTau = 30-48 h
COAMPS-TC & HWRFTau = 54-72 h
COAMPS-TC & HWRFTau = 78-96 h
COAMPS-TC & HWRFTau = 102-120 h
There is overpopulation of the right-most bin (all ensemble member forecasts < observed intensity) for 6-72 h lead time, but reliability is very good at later lead times
(3) Conclusions for combined ensemble
Nearly 140 real-time cases were predicted by all three ensembles, in boththe Atlantic and Eastern Pacific (small sample, but more cases than in 2014)
For this particular sample, the COAMPS-TC & HWRF two model combinationoutperforms the COAMPS-TC & HWRF & GFDL three model combination indeterministic validation
COAMPS-TC & HWRF control consensus and ensemble mean outperform their single-model counterparts in deterministic validation
The combined ensemble (either two or three model) spread is not large enough, particularly for intensity at the earlier lead times. However, theensemble can distinguish between low-uncertainty and high-uncertainty cases, for both track and intensity

(4) Future directions for COAMPS-TC ensemble
New three-year Navy project to transition COAMPS-TC ensemble to operations at FNMOC
FY16: Real-time demo in Atlantic and Western PacificFY17: Transition basic capability into operations (10 members)FY18: Introduce perturbed physics to account for uncertainty due to model error
COAMPS-TC ensemble development challenges
Increase intensity spread without degrading the ability of the ensemble todistinguish between low and high uncertainty cases
Model testing & development: 1 ensemble test run ~ 11 deterministic test runs.EPS uses COAMPS-TC model that has been optimized for deterministic prediction
Product development & validation: Intensification rate probabilities, combiningstatistical and ensemble-based forecast information, input into decision aids.
We would like to continue to partner with NOAA/HFIP to work together on these challenges

EXTRA SLIDES

COAMPS-TC/HWRF/GFDL combined ensemble results
Probabilistic verification: Ensemble spread vs. Ensemble mean error
Track COAMPS-TC & HWRF & GFDL Intensity
Sample size Sample size

COAMPS-TC/HWRF/GFDL combined ensemble results
Probabilistic verification: Ensemble spread vs. Ensemble mean error
The blue dots represent individual forecasts and red stars are bin-averages (4 equally populated bins) Would like to see red stars line up along diagonal and few blue dots in upper left (large error / low spread)
COAMPS-TC & HWRF & GFDL, Tau = 48 hTrack Intensity
Spread of ensemble about its mean (kt)Spread of ensemble about its mean (nm)
Erro
r of t
he e
nsem
ble
mea
n (n
m)

COAMPS-TC/HWRF/GFDL combined ensemble results
Probabilistic verification: Ensemble spread vs. Ensemble mean error
Track Intensity
Spread of ensemble about its mean (kt)Spread of ensemble about its mean (nm)
Erro
r of t
he e
nsem
ble
mea
n (n
m)
The blue dots represent individual forecasts and red stars are bin-averages (4 equally populated bins) Would like to see red stars line up along diagonal and few blue dots in upper left (large error / low spread)
COAMPS-TC & HWRF & GFDL, Tau = 72 h

COAMPS-TC/HWRF/GFDL combined ensemble results
Probabilistic verification: Ensemble spread vs. Ensemble mean error
Track Intensity
Spread of ensemble about its mean (kt)Spread of ensemble about its mean (nm)
Erro
r of t
he e
nsem
ble
mea
n (n
m)
The blue dots represent individual forecasts and red stars are bin-averages (4 equally populated bins) Would like to see red stars line up along diagonal and few blue dots in upper left (large error / low spread)
COAMPS-TC & HWRF & GFDL, Tau = 96 h
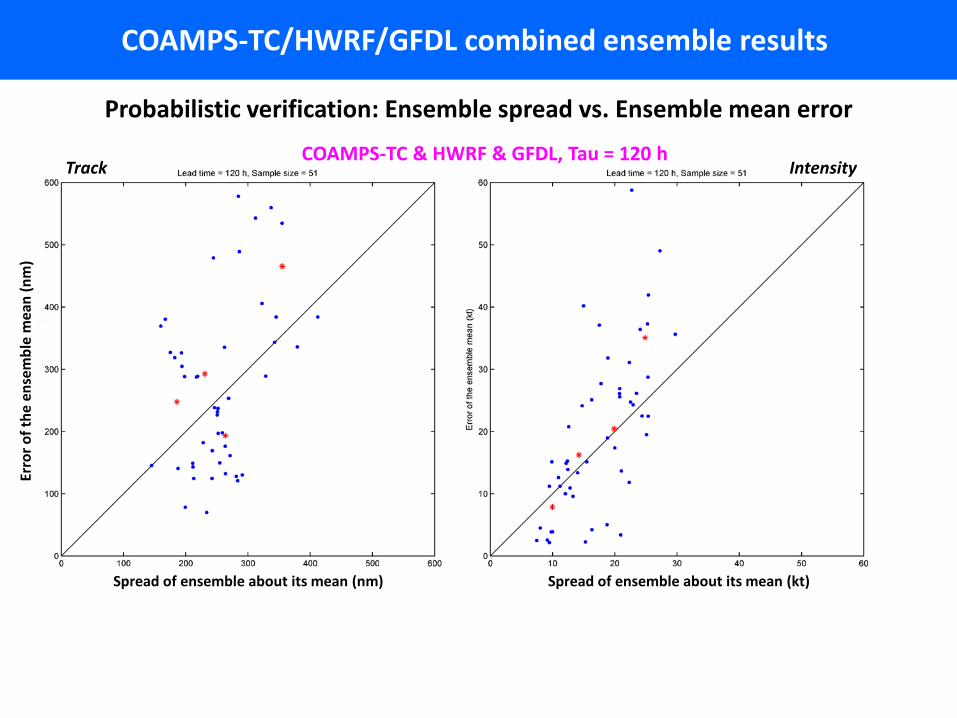
COAMPS-TC/HWRF/GFDL combined ensemble results
Probabilistic verification: Ensemble spread vs. Ensemble mean error
Track Intensity
Spread of ensemble about its mean (kt)Spread of ensemble about its mean (nm)
Erro
r of t
he e
nsem
ble
mea
n (n
m)
COAMPS-TC & HWRF & GFDL, Tau = 120 h

COAMPS-TC/HWRF/GFDL combined ensemble results
Probabilistic verification: Intensity rank histograms
Would like to see all the blue bars near the red line, indicating equal probability observation falls between any two ranked ensemble member (or falls outside either end of ensemble)
COAMPS-TC & HWRF & GFDLTau = 6-24 h
COAMPS-TC & HWRF & GFDLTau = 30-48 h
COAMPS-TC & HWRF & GFDLTau = 54-72 h
COAMPS-TC & HWRF & GFDLTau = 78-96 h
COAMPS-TC & HWRF & GFDLTau = 102-120 h