performance of the hamamatsu r11410 photomultiplier tube
TRANSCRIPT

Preprint typeset in JINST style - HYPER VERSION
Performance of the Hamamatsu R11410Photomultiplier Tube in Cryogenic XenonEnvironments
Laura Baudisa, Annika Behrensa, Alfredo Ferellaa, Alexander Kisha,Teresa Marrodán Undagoitiaa,b, Daniel Mayania, Marc Schumanna,c∗
aPhysik Institut, Universität Zürich, 8057 Zürich, SwitzerlandbMax-Planck-Institut für Kernphysik, 69117 Heidelberg, GermanycAlbert Einstein Center for Fundamental Physics, Universität Bern, 3012 Bern, SwitzerlandE-mail: [email protected]
ABSTRACT: The Hamamatsu R11410 photomultiplier, a tube of 3“ diameter and with a very lowintrinsic radioactivity, is an interesting light sensor candidate for future experiments using liquidxenon (LXe) as target for direct dark matter searches. We have performed several experimentswith the R11410 with the goal of testing its performance in environments similar to a dark matterdetector setup. In particular, we examined its long-term behavior and stability in LXe and itsresponse in various electric field configurations.
KEYWORDS: Xenon; Dark Matter; Photomultiplier.
∗Corresponding author.
arX
iv:1
303.
0226
v2 [
astr
o-ph
.IM
] 2
5 A
pr 2
013

Contents
1. Introduction 1
2. Experimental Setup 2
3. Characterization of the Photomultiplier 53.1 Description of the R11410 53.2 Intrinsic Radioactivity 53.3 Room-Temperature Performance 6
4. Long-Term Stability Tests in Liquid Xenon 84.1 Gain Stability 94.2 Stress Tests with Cooling Cycles 10
5. High-voltage Tests in Gaseous Xenon 125.1 Tests in a Realistic PMT Arrangement 125.2 Performance in the Vicinity of a Strong Electric Field 13
6. Discussion and Conclusion 13
1. Introduction
Numerous astronomical and cosmological observations indicate that the majority of the matter con-tent of our Universe consists of a yet unknown form of dark matter [1]. A well motivated candidatewhich arises naturally in many extensions of the standard model of particle physics is a weakly in-teracting massive particle (WIMP) [2] which might be detected in ultra-low background detectorswith energy thresholds around a few keV or below [3]. In order to protect these from the back-ground caused by cosmic rays they are located in underground laboratories and are further placedinside passive shields against radioactivity from the surroundings. The signature from elastic scat-tering of WIMPs off a target nucleus is a steeply falling nuclear recoil spectrum with a maximumrecoil energy of a few tens of keV.
There are various experimental attempts to directly detect WIMP dark matter [4]. Experi-ments using the noble gas xenon in its liquid form are currently the most sensitive ones. In par-ticular XENON100 [5], located at the Gran Sasso Laboratory (LNGS) [6] in Italy, has recentlypublished the most sensitive upper limits on WIMP-nucleon cross-sections over a large range ofWIMP masses [7, 8]. Liquid xenon detectors are often operated as dual-phase time projectionchambers (TPC), where the scintillation light emitted by the xenon after a particle interaction,as well as the liberated ionization charges are measured simultaneously (see [5] and references
– 1 –

therein). The knowledge of both signals for every event allows reconstructing the interaction ver-tex in 3 dimensions and hence background suppression by selecting the inner part of the TPC viafiducialization, and for effective signal-background discrimination on an event-by-event basis.
The central part of these detectors are two arrays of photosensors, installed below the targetvolume in the liquid xenon (LXe) and above in the gas phase. Typical operation parameters aretemperatures around −100C and absolute pressures of about 2 bar. These sensors detect the pri-mary scintillation signal, leading to typically only a few photoelectrons at threshold, as well asthe charge signal which is amplified by proportional scintillation in the gas phase and thereforelarger [9]. For the current phase of experiments, photomultipliers (PMTs) are used because of theirhigh quantum efficiency (QE), single photoelectron sensitivity, fast timing characteristics, low darkcurrent, and because they can be operated at cryogenic conditions in LXe. The scintillation wave-length of xenon is in the vacuum ultraviolet region (VUV) at 178 nm and the photocathode musthave a high quantum efficiency at this wavelength. Preferentially it should be above 30%, close tothe maximum values achieved to-date.
In spite of ongoing efforts, for example within the DARWIN project [10], to replace photo-multipliers by new types of sensors, such as hybrid photodetectors (QUPID [11]) or gas photomul-tipliers (GPMs [12]), PMTs still will be used in the ton-scale LXe dark matter detectors, as forexample XENON1T [13], LZ [14], and Panda-X [15].
This article describes the Hamamatsu R11410 [16], a 3“ diameter PMT optimized for oper-ation in LXe, which will be used in XENON1T. Its general performance is covered in [17] andits intrinsic radioactivity was evaluated in [18]. Here, we focus on the most important aspect ofthe R11410 as candidate for large dark matter experiments, namely its performance at cryogenictemperatures immersed in LXe (as on the bottom PMT array of a TPC), in gaseous xenon (as onthe top PMT array), and in electric fields (as in a TPC).
In Section 2, we introduce the experimental setups used in the work presented here. Somegeneral features of the PMT are summarized in Section 3. Results regarding the intrinsic radioactivecontamination of this tube, a crucial parameter of any photosensor used for direct dark mattersearches, are summarized in Section 3.2. The major part of this study, the long-term performanceof the R11410 in LXe and the operation of a small test array in various high voltage configurationsare presented in Sections 4 and 5, respectively. In Section 6 we summarize the main findings andgive an outlook.
2. Experimental Setup
In this Section, we briefly describe the various experimental setups operated at the University ofZurich used to characterize the R11410 presented in this study.
Data Acquisition and Gain Analysis To measure the electron amplification gain of the PMTs,the emission of single photoelectrons (SPE) is stimulated by illumination of the photocathode withblue light (λ = 470 nm) from an LED. The position of the peak in the SPE spectrum is proportionalto the number of detected electrons and hence to the gain of the tube. A pulse generator (TelemeterTG4001) is used to bias the LED and to simultaneously trigger the data acquisition. The voltageis chosen such that an SPE pulse is seen on only about 3-5% of the cases in order to suppress
– 2 –

Signal Electrons0 2 4 6 8 10 12 14 16 18 20
610×
Ent
ries
1
10
210
310
410
Figure 1. SPE spectrum of a R11410 PMT immersed in LXe by stimulating the emission of SPEs usingblue LED light. The lowest peak is due to noise (red), the main one from SPEs (solid green), and the tailfrom two PEs (dashed green). The spectrum is fit by a sum of Gaussians, Equation (2.1), and used to derivethe PMT gain from the position of the SPE peak. The full fit-function is shown in blue.
the contribution from two photoelectrons. The data presented here is acquired using a CAENV1724 waveform digitizer with 100 MHz sampling frequency and 40 MHz input bandwidth. Thewaveforms are transferred to a computer and stored for data processing and subsequent analysis,and for later visual inspection.
A peak processor scans the digitized waveforms for excursions from the baseline, integratesthe area around the maximal excursion to obtain the number of electrons contributing to the signal,and histograms the result. One example is shown in Figure 1. The resulting single photoelectronspectrum consists of a large peak around zero, which is due to electronic noise, followed by a(ideally well separated) peak from SPEs. In the analysis the spectrum is described by a sum ofthree Gaussians
f (x) = an×Gauss(µn,σn)+aSPE×Gauss(µSPE,σSPE)+a2×Gauss(2µSPE,√
2σSPE) (2.1)
considering noise (n), the SPE peak, and the peak from two photoelectrons (2). µSPE is given bythe gain. σSPE is the SPE resolution. Mean and σ of the Gaussian describing two photoelectrons(PEs) are fixed by the parameters of the SPE peak. Its amplitude a2 is typically only 2-3% of aSPE.
In some cases, the measurement was triggered by the PMT signal itself using a thresholddiscriminator (LeCroy 621S) to generate the trigger, which led to the same results.
Room-Temperature Characterization The basic characterization, as presented in Section 3,was performed at room temperature in a light-tight black box which can accommodate two R11410PMTs fixed in a PTFE structure. Cables were guided into the box via a light-tight custom madefeedthrough. In order to perform the measurements in a stable and reproducible configuration, theywere started not earlier than 30 minutes after switching the PMT on.
MarmotXS To monitor the performance of the R11410 immersed in LXe over several months,a simple detector chamber, MarmotXS, was designed and built. The cylindrical chamber has aninner diameter of 15 cm and a length of 23 cm, see Figure 2 (left) and allows the installation ofone R11410 PMT facing downwards. To minimize the amount of LXe needed, most of the space
– 3 –
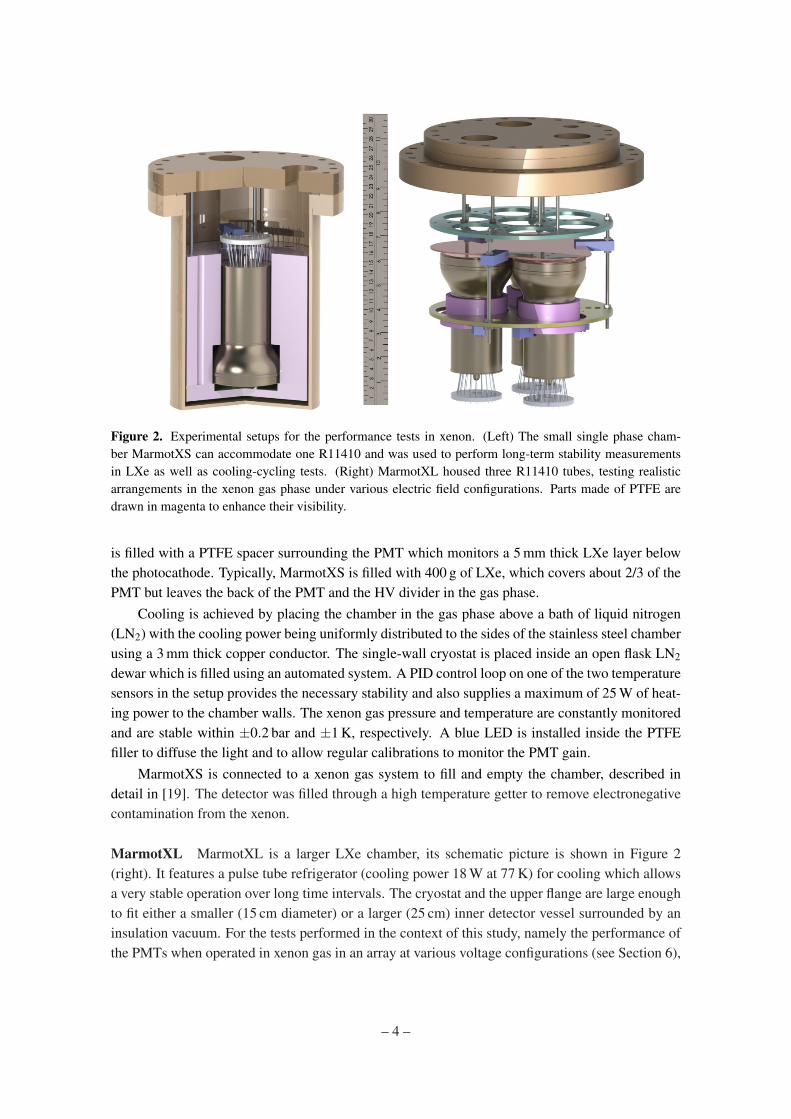
Figure 2. Experimental setups for the performance tests in xenon. (Left) The small single phase cham-ber MarmotXS can accommodate one R11410 and was used to perform long-term stability measurementsin LXe as well as cooling-cycling tests. (Right) MarmotXL housed three R11410 tubes, testing realisticarrangements in the xenon gas phase under various electric field configurations. Parts made of PTFE aredrawn in magenta to enhance their visibility.
is filled with a PTFE spacer surrounding the PMT which monitors a 5 mm thick LXe layer belowthe photocathode. Typically, MarmotXS is filled with 400 g of LXe, which covers about 2/3 of thePMT but leaves the back of the PMT and the HV divider in the gas phase.
Cooling is achieved by placing the chamber in the gas phase above a bath of liquid nitrogen(LN2) with the cooling power being uniformly distributed to the sides of the stainless steel chamberusing a 3 mm thick copper conductor. The single-wall cryostat is placed inside an open flask LN2
dewar which is filled using an automated system. A PID control loop on one of the two temperaturesensors in the setup provides the necessary stability and also supplies a maximum of 25 W of heat-ing power to the chamber walls. The xenon gas pressure and temperature are constantly monitoredand are stable within ±0.2 bar and ±1 K, respectively. A blue LED is installed inside the PTFEfiller to diffuse the light and to allow regular calibrations to monitor the PMT gain.
MarmotXS is connected to a xenon gas system to fill and empty the chamber, described indetail in [19]. The detector was filled through a high temperature getter to remove electronegativecontamination from the xenon.
MarmotXL MarmotXL is a larger LXe chamber, its schematic picture is shown in Figure 2(right). It features a pulse tube refrigerator (cooling power 18 W at 77 K) for cooling which allowsa very stable operation over long time intervals. The cryostat and the upper flange are large enoughto fit either a smaller (15 cm diameter) or a larger (25 cm) inner detector vessel surrounded by aninsulation vacuum. For the tests performed in the context of this study, namely the performance ofthe PMTs when operated in xenon gas in an array at various voltage configurations (see Section 6),
– 4 –
the larger inner chamber was used, which can accommodate three R11410.It was filled with xenon gas at room temperature at an operation pressure around 2 bar absolute.
The xenon was extracted from the bottom of the chamber and constantly purified by passing itthrough a high-temperature getter, before feeding it back to the top of the vessel. In this mode, thehigh voltage performance in ultra-pure xenon gas was studied in a similar configuration as whenoperated in the top array of a LXe detector.
The PMTs were installed in a triangular pattern facing upwards, with the possibility to adjustthe PMT-to-PMT distance. A polished stainless steel plate mounted above the PMT cathodes at avariable distance was biased with a high voltage to study the impact of strong electric fields closeto the photocathode.
3. Characterization of the Photomultiplier
A short description of the R11410 PMT is given in this Section, followed by a summary of mea-surements of its intrinsic radioactivity using a low-background material screening facility. TheSection concludes with the report of several general performance tests which were carried out atroom temperature.
3.1 Description of the R11410
The R11410 is a photomultiplier of 3” diameter produced by Hamamatsu [16]. It is specificallydesigned for low temperature operation (down to−110C) such as in LXe. The quantum efficiency(QE) of its bialkali photocathode (Hamamatsu LT version) has a maximum of typically 30% andhigher at 178 nm [17], fully covering the scintillation wavelength spectrum of xenon. The PMTwindow, made of synthetic silica, is transparent at this wavelength. The collection efficiency (CE)is about 90% [17, 18].
The 12-dynode PMT with a typical gain of 5× 10⁶ has a cobalt free Kovar metal body of11.4 cm length and a maximal (minimal) diameter of 7.8 cm (5.3 cm). The photocathode has aminimum effective diameter of 6.4 cm. The typical voltage applied between anode and cathode isaround 1500 V, with the maximum being 1750 V. The high magnetic permeability of the Kovar (aFe-Ni-Co alloy) allows the operation of the PMT in the Earth’s magnetic field without magneticshielding [17].
Following the initial version of the R11410, which had an intrinsic radioactivity too high forthe next generation of dark matter searches [20], a low radioactivity version (R11410-MOD, laterrenamed to R11410-10 [21]) has been manufactured by Hamamatsu. This version was extensivelytested in the study presented here.
3.2 Intrinsic Radioactivity
Two of the R11410 tubes have been examined using Gator, a low-background, high-purity germa-nium detector [22] for γ-spectroscopy operated underground at LNGS by the Zürich group. Theresults are summarized in Tab. 1. For most isotopes, no significant evidence for a γ-line above thebackground could be found, leading to upper limits on the activity. The results from the two tubes,which came from from independent production batches, agree within their uncertainties. Com-pared to the much smaller R8520, a 2.54× 2.54 cm2 PMT which is used in XENON100 [5, 20],
– 5 –

the intrinsic radioactivity of the tube is 3 times smaller when normalized to unit active area, makingit indeed a good candidate light sensor for next-generation experiments.
Table 1. HPGe screening results of two Hamamatsu R11410 PMTs using the Gator facility at LNGS.To estimate the neutron background from (α,n) reactions correctly, it is important to take into account apossible disequilibrium in the decay chains and to quote the activities for the different parts of the chainsindividually.
Livetime Units 238U 226Ra 228Ra 228Th 235U 40K 60Co 137Cs#1 17 days mBq/PMT <30 <2.1 <3.4 <2.2 <2.0 12±4 3.6±0.5 <1.2#2 33 days mBq/PMT <18 <1.4 <2.9 <2.0 <1.5 17±3 4.3±0.4 <0.7
Two remarks are in order: First, the R11410 is continuously optimized in terms of radioactivityand a new version is under development. Second, for large scale LXe detectors which exploitthe self-shielding capabilities of LXe by fiducialization, the most relevant background is fromneutrons, which in case of the PMTs are produced via (α,n) and spontaneous fission reactions inthe materials. The α-particles are also produced in the early parts of the 238U and 232Th chains,which can be examined with superior sensitivity using methods such as mass spectrometry. Theseresults will be published elsewhere.
3.3 Room-Temperature Performance
The general performance of the R11410 PMT at room-temperature is detailed in [17]. We sum-marize our own measurements here, the results agree with previous works. The resistor values ofthe voltage divider chain were 4 : 1.5 : 2 :1 : 1 : 1 : 1 : 1 : 1 : 1 : 1 : 2 : 1 MΩ between cathode, dynodes1-12, and ground.
Gain versus HV According to Hamamatsu’s specifications, the typical gain of the R11410 is∼ 5×10⁶ at a bias voltage of −1500 V. In the black box we have measured the gain of five PMTsat different voltages from −1350 V to −1750 V in 50 V steps. Not in all cases the SPE peakcould be well separated from the noise at the minimum voltage. The results, shown in Figure 3
Voltage [V]1400 1500 1600 1700
]6
10
×G
ain
[
1
2
10
20ZK5626ZK5629KA0067KA0068KA0070
-1750-1700-1650-1600-1550-1500-1450-1400-1350
Voltage [V]1400 1500 1600 1700
Peak
-to-
Val
ley
Rat
io
0
1
2
3
4
5
6 ZK5626ZK5629KA0067KA0068KA0070
Figure 3. Gain (left) and peak-to-valley ratio (right) for five R11410 PMTs, measured vs. negative highvoltage. The tubes are from two different batches as indicated by the ZK and KA serial numbers.
– 6 –

(left), indicate that there is a ±20% variation around the typical gain. The expected exponentialdependence on the bias voltage is observed in all cases.
The SPE resolution of the PMTs is given by the ratio σSPE/µSPE of the parameters of Equa-tion (2.1). It is almost independent of the applied high voltage and varies between 35% and 40%for all tested units.
Peak-to-Valley Ratio The ability to separate the SPE spectrum from the electronic baseline noisecan be quantified by the peak-to-valley ratio, i.e. the maximum of the SPE peak divided by theheight of the valley which separates it from the noise. Maximum and valley are directly takenfrom the measured spectrum and the peak-to-ratio is shown in Figure 3 (right): it slightly increaseswith the bias voltage, and very good values of 3 and above are reached at the nominal voltage of−1500 V for two of the five tested PMTs. The ratio is ∼15% lower for the remaining tubes butat a bias voltage of −1600 V, all PMTs have a peak-to-valley ratio above 3. This ratio was onlyachieved by a small minority of tubes used successfully in XENON100 [5]. The PMTs with ahigher gain also tend to have a higher peak-to-valley ratio.
Afterpulses Residual-gas molecules inside the PMT are either absorbed by its getter or aretrapped in the surfaces. Molecules trapped by the first dynode can be ionized by light-inducedphotoelectrons and then drift to the PMT cathode where they release further electrons. The ampli-tude of these delayed afterpulses varies depending on the type of residual ion and on the voltageapplied to the PMT. Afterpulses can affect the accurate measurement of small few-photoelectronsignals following a large amplitude pulse and thus must be studied and understood.
s]µTime delay [0 0.5 1 1.5 2 2.5 3 3.5 4
Puls
e ar
ea [
PE]
0
2
4
6
8
10
12
14
1
10
210
A1
A2
A3
s]µTime delay [0 0.5 1 1.5 2 2.5 3 3.5 4
Nor
mal
ized
eve
nts
0.000
0.001
0.002
ZK5626ZK5629KA0068KA0070
Figure 4. (Left) Afterpulse area vs. time spectrum for an R11410 PMT (KA0068). Three regions can beidentified, with clearly visible lines extending up to several PE in region A3. (Right) Time spectra of regionA3. The peaks stem from specific ionized molecules, their relative size and abundance vary for each PMT.
We have studied afterpulses by externally triggering on dark current pulses and searching forpeaks following the triggering signal. As an example, Figure 4 (left) shows the pulse area of anR11410 PMT (KA0068) measured vs. the time after a SPE event. Three distinct regions have beenidentified according to the characteristics of the afterpulses. A1: within a delay of several tensof nanoseconds, a large number of afterpulses are measured with a signal mean of about 1 PE.A2: afterpulses of 1 PE are measured continuously at all times. A3: at distinct time positions,afterpulse peaks appear with pulse areas of up to tens of PE, see also Figure 4 (right) where the A3
– 7 –

spectra of several PMTs are shown normalized to the total number of events. The peaks are due tospecific ionized molecules which are liberated from the first dynode by the initial photoelectrons.Depending on mass and ionization level, the geometry and field in the PMT leads to individualpeaks as in a mass spectrometer. Following [17], the peaks at 0.3 µs and 1.0 µs can be associatedwith H+
2 and CH+4 , respectively. The large peaks around 1.3 µs and 1.6 µs, which are only present
in two PMTs, could be due to CO+ and CO+2 molecules.
The total afterpulse rates, as well as the contribution of each region in Figure 4 (left), is givenin Tab. 2, along with the specific contributions of the peaks observed at various times. We observerather large differences between the 5 studied PMTs, with the total afterpulse rate differing by upto a factor 10. We did not find a correlation with the PMT production batch.
Table 2. Afterpulse rate as a fraction [%] of the total number of acquired events. The total rate (fractionof events followed by an afterpulse) is given, as well as the contributions of the individual populations(A1, A2, A3) and the most dominant peaks (at specific delay times) identified in Figs. 4. The statisticaluncertainties are small, the systematic uncertainty is estimated to be about ±5% as determined by repeatingthe measurements 3 times.
PMT Total % A1 A2 A3 0.27 µs 0.52 µs 0.98 µs 1.32 µs 1.56 µsZK5626 8.6 3.4 2.0 3.2 0.04 0.03 0.62 0.99 0.66ZK5629 2.2 0.5 1.5 0.3 0.04 0.07 0.05 0.02 0.01KA0068 4.6 2.3 0.9 1.4 0.02 0.01 0.29 0.55 0.24KA0067 1.3 0.1 0.8 0.5 0.13 0.12 0.04 0.01 0.01KA0070 1.1 0.3 0.6 0.2 0.01 0.01 0.11 0.02 0.01
For one PMT (KA0067) the afterpulse rate was also studied at LXe temperatures, right afterxenon recuperation and subsequent evacuation (see Section 4.2). The rate was about 20% lowerthan the one observed at room temperature. This is expected since some of the rest gas which isresponsible for the afterpulses gets attached to the cold PMT inner surface.
Afterpulses at the level of a few percent do not significantly affect the capability of LXe de-tectors to operate in dark matter search mode. In recent analyses of LXe detectors [23], an eventwould be discarded if two candidate light pulses are observed in a waveform. In order to reduce theimpact of dark counts, a candidate pulse has to be observed by at least 2 PMTs at the same time.The low energy signals of interest are typically seen by less than 15 PMTs and the likelihood thattwo of these tubes see an afterpulse (assuming an average rate of 3%) within ∆t = 30 ns is only∼ 0.15% and leads to a negligible acceptance loss.
4. Long-Term Stability Tests in Liquid Xenon
The R11410 was developed to be operated at cryogenic temperatures, however, it is mandatory totest its performance immersed in LXe before it can be considered as light sensor for a dark matterdetector. We have performed several tests using the small single phase chamber MarmotXS, withthe main focus on two aspects: the performance of the tube when operated continuously in LXeover several months, and the effect of rather abrupt temperature changes of ∆T ≈ 120 K which arisewhen a LXe detector is filled or emptied.
– 8 –

The test setup was such that the R11410 was almost completely covered by LXe, with onlythe back part with the high voltage divider being in xenon gas. This is an extreme test conditionas stronger temperature gradients will occur than in a dark matter experiment. Moreover, the PMTvoltage divider is tested in the gas, which is a worse electrical insulator than LXe. MarmotXSwas designed for these stability tests but not optimized for measurements using LXe as scintillator.Nevertheless, data were acquired with γ-calibration sources. The full absorption peak of 57Coexhibits a light yield of about 3.3 PE/keV, as shown in Figure 5 (left) with the fit to the peak.
Overall, we have tested 3 tubes in LXe. One of them (the first version without the reducedradioactivity) was cooled down 3 times, with the longest cold period being 6 days. No definitiveconclusions could be made because of instabilities of the cooling system. Longer LXe tests of twoR11410, modified for a lower intrinsic radioactivity, using a more stable setup are described indetail below.
Light signal [PE]0 200 400 600 800 1000
Ent
ries
0
100
200
300
400
500
600
Date [Day/Month]21/03 20/04 20/05 19/06
]6
10
×G
ain
[
5.5
5.6
5.7
5.8
5.9
6.0
6.1
6.2
6.3
Figure 5. (Left) 57Co scintillation light spectrum obtained with a R11410 immersed in LXe in MarmotXS.(Right) Long-term stability of the gain of a R11410 immersed in LXe, as measured over a period of about5 months. The gain is stable within ±2%, as indicated by the dashed lines. Periods in which the gain showslarger variations can be correlated to changing experimental conditions. At the end of the run, the graypoints show the measurements while the corresponding black points are corrected and take into account asudden change in the LXe pressure and temperature. A similar correction cannot be done reliably for theshort spikes in the gain measurements, hence they are presented as measured.
4.1 Gain Stability
The gain of an R11410 has been measured over a period of almost 5 months in which the PMTwas operated without any relevant interruption at a bias voltage of −1600 V. It was automaticallymeasured every 4 hours, with the exception of a few periods where the automatic system failed.Pressure and temperature of the xenon inside the chamber were constantly monitored. As shownin Figure 5 (right) the gain was found to be stable within ±2%, which is the intrinsic uncertaintyof the method to derive the gain [5] by fitting the function given by Equation (2.1) to the SPEspectrum.
At a few occasions, the gain response deviates slightly from this stable behavior, however,these periods can be related to changing experimental conditions: At the beginning of the long-term test, the LXe system was not yet in a stable state and the thermodynamic conditions were stillchanging. The two deviations to lower gain values are most likely not caused by a real gain change,but by a change in the baseline noise condition which has a small but significant impact on the gain
– 9 –

determination. In one case, the voltage of the LED to stimulate SPE emission was set too highand too much light illuminated the PMT for a few hours. In the other case, a malfunction in thecooling system lead to a sudden temperature decrease followed by an increased noise level. Afterall occasions, the stable gain value was reached again. The continuous gain increase observed at theend of the measurement (gray points) is directly correlated with a slight increase in the temperature(+1 K) and pressure (+100 mbar) inside the chamber. The corresponding black points have beencorrected for this effect by subtracting the difference of the average gains before and after thetemperature/pressure increase.
Following this successful long-term measurement, another R11410 was operated in LXe withthe focus on its response to thermal stress associated with repeated cooling cycles. The measure-ments are reported in the next Section.
4.2 Stress Tests with Cooling Cycles
When dark matter detectors operated with LXe are filled, the setup is being cooled down from roomtemperature to about −100C in rather short time of a few hours which imposes thermal stress onthe light sensors. In the past, we experienced that a small fraction of PMTs (XENON100 1-2% [5],using a different PMT model) were not operational after the first cool-down of the detector. In orderto test how the R11410 behaves when exposed to thermal stress, we subsequently went throughseveral cooling cycles with two PMTs. (A third PMT has been only cooled down twice.) After acool-down, the temperature was kept stable at (−99± 1)C for typically 5 days, then raised andkept at (21±3)C for about 5 days, before the chamber was filled with LXe again. The PMTs werenot powered during cool-down or warm-up. None of the tested PMTs showed any indication of aworsened response or malfunctioning during these tests. However, we emphasize that due to thelimited number of considered PMTs, the tests reported here cannot identify cool-down problemswhich might occur at the percent level. Therefore, every tube which is to be installed in a LXedetector should be cooled-down at least once before detector assembly.
Figure 6 (top) shows the gain evolution during 5 cooling cycles performed over more than3 months. The gain of a PMT biased at −1600 V was measured using a blue LED at room temper-ature and at LXe temperature, marked with red and blue horizontal bars, respectively. The gain atroom temperature was systematically and reproducibly found to be about 5% higher than at LXetemperature. However, it took more than 4 weeks to reach a stable gain after cool-down at a ∼10%lower level (compare to Figure 5, right).
Additionally, the dark count rate of the PMT was measured one hour after the LED for the gainmeasurement was turned off. The PMT signal was amplified and data were taken triggering by adiscriminator. Figure 6 (bottom) shows the evolution of the dark count rate defined by the integral ofthe Gaussian function describing the SPE peak, the second part of Equation (2.1). The average darkcount rate at room temperature was (630±110) Hz and (79±8) Hz at LXe temperature. The ratewas determined by integrating the SPE peak above 0.3 PE, and the uncertainties are given by thestandard deviation of all measurements. It was stable during the whole measurement period. Notethat the chamber was filled with gas or liquid xenon at room and LXe temperature, respectively.Therefore these values represent upper limits on the actual dark count rate, since scintillation lightis also observed.
– 10 –

]6
10
×G
ain
[
4.6
4.7
4.8
4.9
5.0
5.1
5.2
Date [Day/Month]30/08 13/09 27/09 11/10 25/10 08/11 22/11 06/12
Dar
k co
unt r
ate
[Hz]
210
310
Figure 6. Time evolution of the gain (top panel) and dark count rate (bottom) of a R11410 PMT duringthermal cycling. The tube was immersed in LXe 5 times and warmed up in between, with each period lastingfrom 5 days to several weeks. After cool-down the gain decreased by ∼5%, while the dark count rate wasreduced by an order of magnitude. The dark count rate shown here was measured in xenon environments andis therefore an upper limit as real scintillation pulses are also counted. The corrected rate at LXe temperaturesis a factor 2 lower (see text). At the end of the run the gain measurements were affected by a changing xenontemperature/pressure: The measured values are shown in gray, the ones corrected for this effect are shownin black. The dark count measurements are not corrected.
To avoid bias by this effect, the dark count rate was also measured in vacuum at the end of thetemperature cycling immediately after LXe recuperation, when the temperature inside the chamberwas still−73C, about 30C warmer than the temperature when filled with LXe. With (40±8)Hz,the measured dark count rate was by about a factor of two lower than in cold xenon gas. This valueincreased to (415±20) Hz when the PMT was operated at room temperature (and in vacuum).
The accidental time coincidence of two dark count pulses can lead to fake scintillation lightpulse candidates. If this happens within an event where the real light and charge signal are clearlyvisible, the event would be discarded at analysis level [23]. Only cases where the real light signalis not found in the trace, the accidental signal could be falsely identified, potentially leading tofake WIMP-like events. Since various parameters must accidentally fall in the right range (e.g.,(false) light to charge ratio, (false) interaction depth, etc.) this scenario is not very likely, but hasto be carefully evaluated for every large dark matter experiment. At a dark count rate of 40 Hz, anaccidental rate of ∼1.5 Hz is expected from 250 PMTs, the typical number of channels for a ton-scale LXe detector [13] and assuming a time coincidence window of 30 ns [23]. While this valuecannot be directly translated into an expected number of background events (this analysis requiresmore detector specific information), it is clear that a smaller dark count rate is beneficial. From thispoint of view, the low rate of 40 Hz as measured here is an important feature of the R11410.
– 11 –
5. High-voltage Tests in Gaseous Xenon
In dual-phase TPCs, about half of the PMTs are operated immersed in LXe below the target region.The other half are located in the gas phase above in order to detect the localized proportionalscintillation light, providing information on the location of the event. (Note that in ZEPLIN-III [24]and the proposed design of the DarkSide-50 liquid argon detector [25], all PMTs are immersed inthe liquid.) While LXe is a very good electrical insulator, problems related to the PMT bias voltagemight arise in the gas phase. This is especially important when a negative voltage is applied to thePMT cathode which means that the whole metal case of the R11410 is at high voltage. However,this is the preferred operation mode for using the PMT in a LXe dark matter detector as it reducesthe radioactivity since a HV-decoupling capacitor is not needed, and it also avoids possible rippleson the signals which are induced by the high voltage biasing the PMT.
5.1 Tests in a Realistic PMT Arrangement
In order to find out the minimal required distance between PMTs, which is relevant for the designof large scale PMT arrays, and to study the performance of such an array in different voltage config-urations, a test setup of 3 R11410 PMTs was built and installed in MarmotXL. It features a variabledistance between the PMTs and has an additional HV electrode (”plate“) installed parallel to thephotocathode to test the PMTs in an external electric field. Various voltage configurations of the3 tubes and the plate have been tried, mimicking situations which can occur in a large PMT array.While the typical bias voltage is around−1500 V, some tubes might be set to higher/lower voltagesto equalize the gain in the array, or a malfunctioning PMT might even require to be switched off.The latter would lead to a rather strong field between working and non-working PMTs (∼ 5 kV/cm).
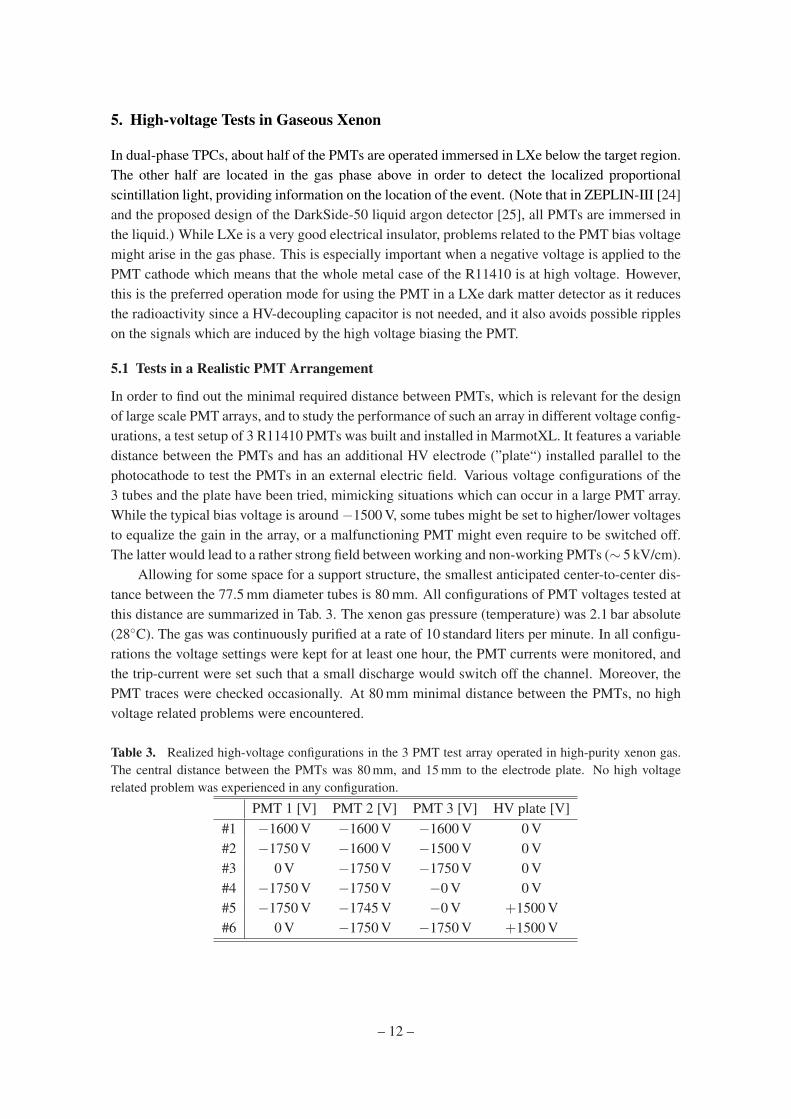
Allowing for some space for a support structure, the smallest anticipated center-to-center dis-tance between the 77.5 mm diameter tubes is 80 mm. All configurations of PMT voltages tested atthis distance are summarized in Tab. 3. The xenon gas pressure (temperature) was 2.1 bar absolute(28C). The gas was continuously purified at a rate of 10 standard liters per minute. In all configu-rations the voltage settings were kept for at least one hour, the PMT currents were monitored, andthe trip-current were set such that a small discharge would switch off the channel. Moreover, thePMT traces were checked occasionally. At 80 mm minimal distance between the PMTs, no highvoltage related problems were encountered.
Table 3. Realized high-voltage configurations in the 3 PMT test array operated in high-purity xenon gas.The central distance between the PMTs was 80 mm, and 15 mm to the electrode plate. No high voltagerelated problem was experienced in any configuration.
PMT 1 [V] PMT 2 [V] PMT 3 [V] HV plate [V]#1 −1600 V −1600 V −1600 V 0 V#2 −1750 V −1600 V −1500 V 0 V#3 0 V −1750 V −1750 V 0 V#4 −1750 V −1750 V −0 V 0 V#5 −1750 V −1745 V −0 V +1500 V#6 0 V −1750 V −1750 V +1500 V
– 12 –

5.2 Performance in the Vicinity of a Strong Electric Field
The PMTs installed below the TPC in a dark matter detector have to operate close to the TPC’scathode electrode. Often a screening grid is placed between PMT and electrode in order to shieldthe PMT from the strong electric field. This grid, however, absorbs some scintillation light and,because of its typically thin wires, might also induce high voltage related problems. It typicallyfeatures a rather large geometric opening in order to reduce light absorption, which in turn allowsfor larger electric field reach-throughs. Hence it is mandatory to ensure that the PMT is operationalwith undisturbed performance close to relatively high electric fields. Possible problems could comefrom charge build up in the quartz window creating light signals in sudden discharges.
Signal Electrons5 10 15 20 25 30
610×
Ent
ries
10
210
310
410
Figure 7. Single photoelectron spectra of a R11410 PMT, operated close to electric fields of 0 kV/cm,7.5 kV/cm, 10 kV/cm, and 11 kV/cm as indicated by the different colors. The x-axis is extended to >10 PEin order to also observe larger light signals possibly induced by the field. No significant field dependence isdetected, the PMT spectra are unaffected by the field above its photocathode.
This has been tested with the same three R11410 PMT array by moving the electrode platevery close to the PMT cathode while biasing it with a positive high voltage. PMT cathode andmetal case have been kept at −1500 V, thus generating fields of 5 kV/cm, 7.5 kV/cm, 10 kV/cm,and 11 kV/cm when biasing the plate with 0 kV, +0.75 kV, +1.5 kV, and +1.8 kV, respectively. AllPMTs remained fully operational, and no variation in their response could be measured. This isshown in Figure 7 which does not indicate any excess of events up to > 10 PE. We conclude thatthe R11410 can be operated in fields up to 11 kV/cm. Higher fields might be possible but could notbe tested in our setup due to voltage instabilities related to the high voltage on the electrode plate.When the R11410s are operated behind a screening grid, the expected remaining field strengths arewell below the tested levels.
6. Discussion and Conclusion
We have performed various tests with the Hamamatsu R11410-10 PMT, in setups which are rel-evant for the next-generation dark matter search experiments using LXe, examining the tube inconfigurations as they occur in a TPC. In particular, we have tested several units immersed in LXeand, using a different setup, in strong electric fields. We show that the R11410 features a stable gain
– 13 –

while being operated continuously in LXe for several months. Repeated cooling cycles from roomtemperature to LXe temperatures around −100C were performed successfully without damagingthe tested PMTs and without observing a change in their response. The PMTs successfully passedseveral high voltage tests in xenon gas, aiming to determine whether they could be operated nextto each other at a minimal distance of 80 mm and in strong electric fields.
Additionally, we have characterized the PMT in terms of room temperature performance, andcould largely confirm the results from Hamamatsu and Ref. [17]. The R11410 features a remark-able single photoelectron response with an excellent peak-to-valley ratio≥ 3 and a high gain around5×106. We have observed that the afterpulse rate varies considerably between tubes (up to a fac-tor 10), and can reach levels up to 10% at room temperature. At LXe temperature, the afterpulserate is slightly reduced by ∼20%. At this temperature, the tube exhibits a very low dark count rateof < 50 Hz.
Sensitive photosensors with a low intrinsic radioactivity are mandatory for future dark matterdetectors using liquid noble gases, such as xenon or argon, as WIMP targets. Based on the studypresented here, we conclude that the Hamamatsu R11410 3” PMT is a good candidate for LXedetectors. Therefore it was chosen to be the light detector for the next-generation experimentXENON1T [13].
Acknowledgments
This work has been supported by the Swiss National Science Foundation (grant #200020_138225)and by the FP7 Marie Curie-ITN action PITN-GA-2011-289442 INVISIBLES. We thank Hama-matsu for kindly providing several samples for these tests and M. Metzger (Hamamatsu Switzer-land) for his support. One early R11410 was kindly provided by K. Ni (SJTU) for screening. Wethank A. James and D. Florin (UZH) for their technical contributions and K. Arisaka (UCLA) andE. Aprile (Columbia) for many helpful discussions.
References
[1] J. Beringer et al. (Particle Data Group), The Review of Particle Physics, Phys. Rev. D 86 (2012)010001, and references therein.
[2] G. Steigman and M. S. Turner, Cosmological constraints on the properties of weakly interactingmassive particles, Nucl. Phys. B 253 (1985) 375; G. Jungman, M. Kamionkowski, and K. Griest,Supersymmetric dark matter, Phys. Rept. 267 (1996) 195.
[3] M. W. Goodman and E. Witten, Detectability of certain dark-matter candidates, Phys. Rev. D 31(1985) 3059.
[4] L. Baudis, Direct dark matter detection: The next decade, Phys. of the Dark Univ. 1, 94 (2012).
[5] E. Aprile et al. (XENON100), The XENON100 Dark Matter Experiment, Astropart. Phys. 35, 573(2012).
[6] http://www.lngs.infn.it
[7] E. Aprile et al. (XENON100), Dark Matter Results from 225 Live Days of XENON100 Data,Phys. Rev. Lett. 109, 131801 (2012).
– 14 –
[8] E. Aprile et al. (XENON100), Limits on spin-dependent WIMP-nucleon cross sections from 225 livedays of XENON100 data, [arXiv:1301.6620].
[9] A.I. Bolozdynya, Two-phase emission detectors and their applications, Nucl. Instr. Meth. A 422 (1999)314.
[10] L. Baudis (DARWIN), DARWIN: dark matter WIMP search with noble liquids,[arXiv:1201.2402]; M. Schumann (DARWIN), DARWIN, [arXiv:1111.6251].
[11] A. Teymourian et al., Characterization of the QUartz Photon Intensifying Detector (QUPID) forNoble Liquid Detectors, Nucl. Instr. Meth. A 654 (2011) 184.
[12] S. Duval et al., On the operation of a Micropattern Gaseous UV-Photomultiplier in Liquid-Xenon,2011 JINST 6 P04007.
[13] E. Aprile (XENON1T). The XENON1T Dark Matter Search Experiment, [arXiv:1206.6288].
[14] D.C. Malling et al. (LZ), Title: After LUX: The LZ Program,[arXiv:1110.0103].
[15] Z. Li et al., The Cryogenic System for the Panda-X Dark Matter Search Experiment, 2013 JINST 8P01002.
[16] http://www.hamamatsu.com
[17] K. Lung et al., Characterization of the Hamamatsu R11410-10 3-Inch Photomultiplier Tube for DarkMatter Direct Detection Experiments, Nucl. Instr. Meth. A 696 (2012) 32.
[18] D.S. Akerib et al., An Ultra-Low Background PMT for Liquid Xenon Detectors, Nucl. Instr. Meth. A703 (2013) 1.
[19] A. Manalaysay et al., Spatially uniform calibration of a liquid xenon detector at low energies using83m-Kr, Rev. Sci. Instrum. 81 (2010) 073303.
[20] E. Aprile et al. (XENON100), Material screening and selection for XENON100 , Astropart. Phys. 35(2012) 43.
[21] Hamamatsu Corp., private communication.
[22] L. Baudis et al., Gator: a low-background counting facility at the Gran Sasso UndergroundLaboratory, 2011 JINST 6 P08010.
[23] E. Aprile et al. (XENON100), Analysis of the XENON100 Dark Matter Search Data,[arXiv:1207.3458].
[24] D.Y. Akimov et al. (ZEPLIN-III), WIMP-nucleon cross-section results from the second science run ofZEPLIN-III, Phys. Lett. B709, 14 (2012).
[25] D. Akimov et al. (DarkSide), Light Yield in DarkSide-10: a Prototype Two-phase Liquid Argon TPCfor Dark Matter Searches, [arXiv:1204.6218].
– 15 –