performances of wind turbine airfoil under oscillating...
TRANSCRIPT
Performances of Wind Turbine Airfoil Under Oscillating Motion
Mohamed Mehdi Oueslati#1, Anouar Wajdi Dahmouni#2, Sassi Ben Nasrallah*3 #Laboratory of Wind Energy Management and Waste Energy Recovery Research and Technologies Center of Energy, Hammam Lif, Tunisia
[email protected] [email protected]
*Laboratory of Studies of Thermal and Energy Systems National Engineering School of Monastir, Monastir, Tunisia
Abstract— The aim of this work is to evaluate the
aerodynamic performances of wind turbine airfoils under sinusoidal and non-sinusoidal pitching motion. Therefore, two dimensional inviscid flow code is developed based on the singularity method to predict the oscillatory flow field and the aerodynamic propriety of the oscillating airfoil for different pitching amplitudes, reduced frequency and airfoil shapes.
Keywords— Inviscid flow; wind turbine airfoils; wake
structure; pitching motion.
I. INTRODUCTION Wind turbines operate in an unsteady flow environment. So
the blade element forces result of ambient turbulence, vary from element to element. Pitch blade control system is used in many commercial wind turbines to optimize the energy extracted from the wind. For that many experimental and numerical researches have been made into the problem of unsteady aerodynamics of oscillating airfoils.
The dynamic stall phenomena of pitching airfoils have been investigated numerically by [1] and [2] using the kω SST turbulence model. Symmetric, NACA0012, and non symmetric airfoils, S809, have been used to study the sinusoidal pitching motion effects on the aerodynamic loads, and the influence of the reduced frequency.
Many experimental studies have been made also to evaluate the performances of pitching airfoils. In [3], the experimental results show that the lift coefficient present hysteresis loop function of the angle of attack and it depends on the pitching amplitude and trailing edge separation characteristics.
For flow over different airfoil sections passing through pure plunging motion, Reference [4] uses a 2D incompressible Unsteady Panel method (UPM) code. Results showed that the variation of the airfoil thickness has a slight effect on thrust generation and propulsive efficiency in the considered frequency and amplitude ranges ( k = 0.01 – 10 and h = 0.1 – 0.4).
The singularity method was applied in many area of research such as the prediction of wind turbine performance and the design of wind turbine blades [5], [6], and [7].
In horizontal axis wind turbine case, the instantaneous pitching motion of the airfoil can be saw tooth trajectory, square trajectory, trapezoidal trajectory or sinusoidal trajectory. As seen, the aerodynamic performances of an oscillating airfoil depend on parameters related to its motion, such as the reduced frequency, the amplitude and the shape of the airfoil trajectory. For that we will investigate the influence of the motion on the airfoil aerodynamics in case of pure sinusoidal and trapezoidal pitching motion.
In this paper we will describe the singularity method used to model the motion of the wind turbine airfoils. The validation of the developed tool in the case of pure plunging motion will be presented. The method is used to compare the performances of two wind turbine airfoils NACA 0012 and NACA 4412 in a pure sinusoidal and trapezoidal pitching motion and the effect of the reduced frequency and the oscillation amplitude on the performance characteristics will be studied.
II. COMPUTATIONAL MODEL The objective of using Panel method is to:
Discrete the body surface in terms of singularity. Fulfill the necessary boundary conditions. Find the resulting distribution of singularity
on the surface to obtain fluid dynamic properties of the flow.
The body geometry is represented in terms of smaller subunits called panels, is subdivided into smaller subunits called panels. Each one is characterized by some kind of singularity distribution which can be sources, doublets, or vortices. On each panel the singularity order can be constant, linear, parabolic, or even higher . It depends on the accuracy, computational speed and other factors.
The panel method is based on the resolution of Laplace’s equation Eq.(1). This is through the superposition of simpler solutions of elementary flows distributed all over the body. This formulation makes the method faster, because it is not needed to discrete all the flow domains. The Laplace equation is given by:
(1)
The total potential can be described as: (2) Where is the free stream potential, is the source
potential, is the vortex potential, and is the wake potential.
The steps of calculation and the detail of the mathematical model of the steady state case are discussed in [8].
The airfoil surface continues to be described by singularity distributions of source strength qj (1…N) and vorticity γ inducing (N +1) unknowns as in steady flow. However, for unsteady flow, these later are time dependent [9], [10].
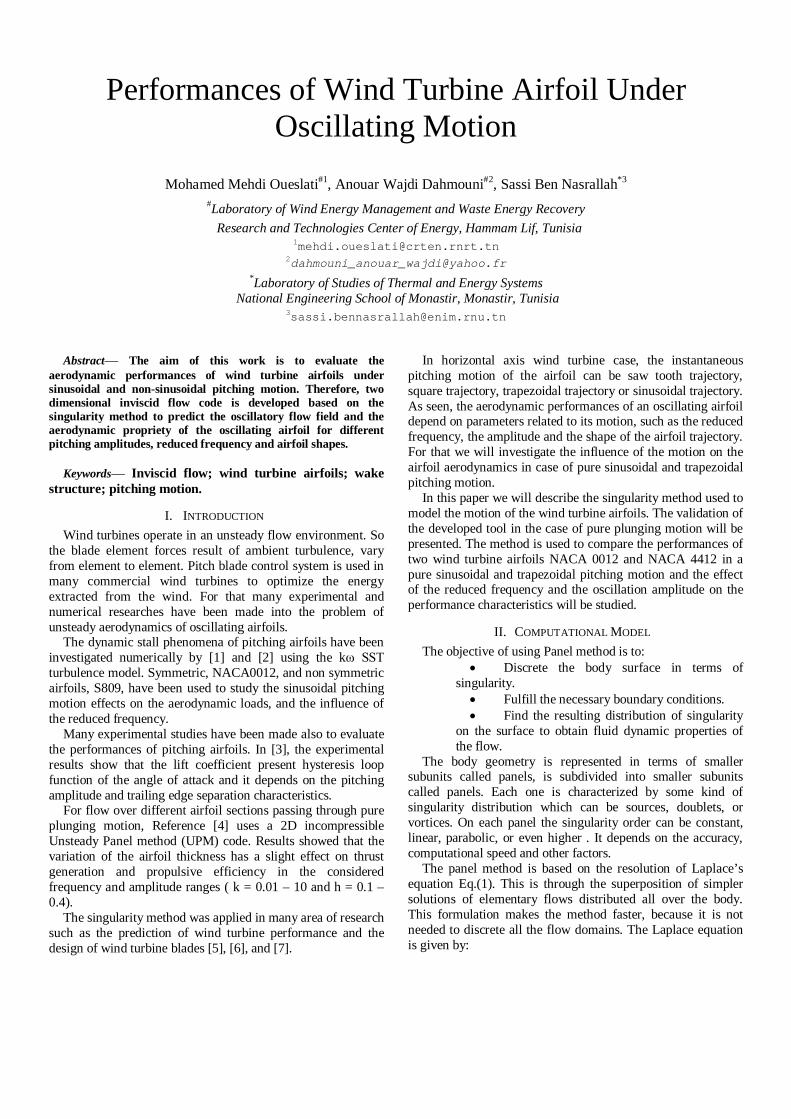
Assuming that the total circulation in the flow field must be conserved, according to Helmholtz theorem, any changes in the circulation Γ on the airfoil surface must be adjusted by an equal and opposite change in the wake vorticity. This later conducts to vortex shedding at the trailing edge of the airfoil. In the unsteady panel method, the vortex shedding is described by an additional wake element, “the shed vorticity panel” connected to the trailing edge with uniform vorticity distribution (γ sh )k (fig. 1).
If the length of the shed vorticity panel is denoted by Δk and its inclination angle to the x-axis by and the overall circulation of the airfoil surface at time step by and denoting the perimeter of the airfoil, then the Helmholtz theorem can be considered as:
(3) (4) Here and represent respectively the overall
circulation on the airfoil surface and the vorticity strength determined at time step .
From time step to , we assume that the shed vorticity panel is detached from the trailing edge and convects downstream as a concentrated free vortex, with circulation equal to . The convection velocity of the free vortex is given by the local flow velocity at the center of the vortex. Meanwhile, a new shed vorticity panel is formed and the vortex shedding process is repeated. Consequently, a string of concentrated core vortices is formed in the wake behind the airfoil as shown in figure 1.
Fig. 1. Representation of a smooth airfoil with straight line segments.
Two additional relations are essentials and can be derived
from the assumptions recommended by Basu and Hancock:
The shed vorticity panel is oriented along the direction of the local flow velocity at the panel midpoint by an angle . The length of the shed vorticity panel is
equal to the product of the local flow velocity at the panel midpoint and the size of the time-step.
To this point, the two additional relations can be written as (5) (6) where and are the flow velocity components at the
panel midpoint in the x- and y-directions, respectively. The flow tangency conditions remains similar to those of
steady flows illustrted by : (7) Where is the normal component velocity at midpoint
of each panel at time step . However, the Kutta condition should now introduce the
change rate of velocity potential. According to the unsteady Bernoulli's equation, the Kutta condition can be expressed by:
(8) (9) Where and are the tangential velocities
components at midpoint of the first and Nth panel of the airfoil at time step .
The unsteady flow of Bernoulli’s equation for the pressure coefficients on the airfoil surface must be written with respect to the airfoil fixed coordinate system as follow:
2 2
2
21/ 2
stream totalU Up pCpU U U U t
(11)
Where p is the pressure at the midpoint of the panel, U is
the free stream velocity, streamU is the unsteady stream
velocity which describes the airfoil motion, totalU is the total velocity resulting from the tangential and the normal components and is the total potential.
III. RESULTS AND DISCUSSIONS
A. Validation Case The code is validated with the experimental results shown in
[11] in the case of pure plunging motion in the y-direction described by:
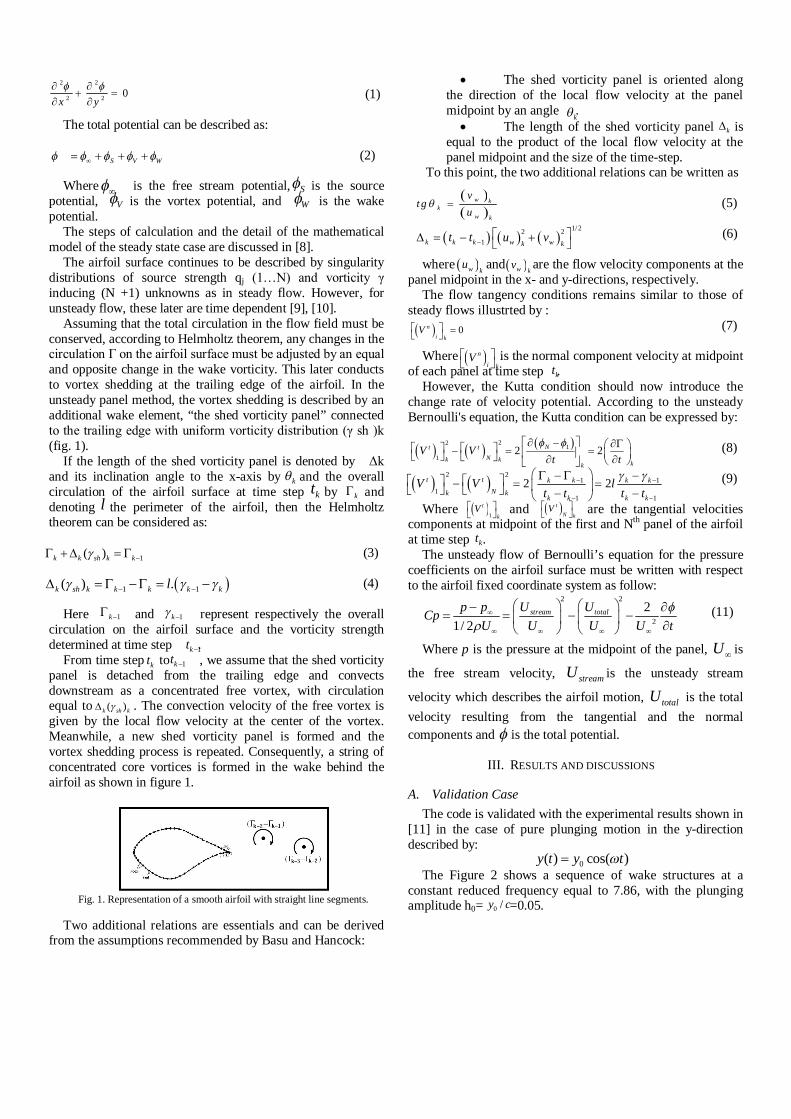
The Figure 2 shows a sequence of wake structures at a
constant reduced frequency equal to 7.86, with the plunging amplitude h0= =0.05.
2 2
2 2 0x y
S V W
w kk
w k
vt g
u
1/22 2
1k k k w wk kt t u v
0n
i kV
22 1
12 2Nt t
Nk k kk
V Vt t
22
1 11
1 1
2 2t t k k k kNk k
k k k k
V V lt t t t
1( )k k sh k k
1 1( ) .k sh k k k k kl
kkt k
l
1k 1k
1 kt
kt 1kt
( )k sh k
w ku w k
v
n
i kV
kt
1
t
kV
tN k
V
kt
kk
0( ) cos( )y t y t
0 /y c
SV W
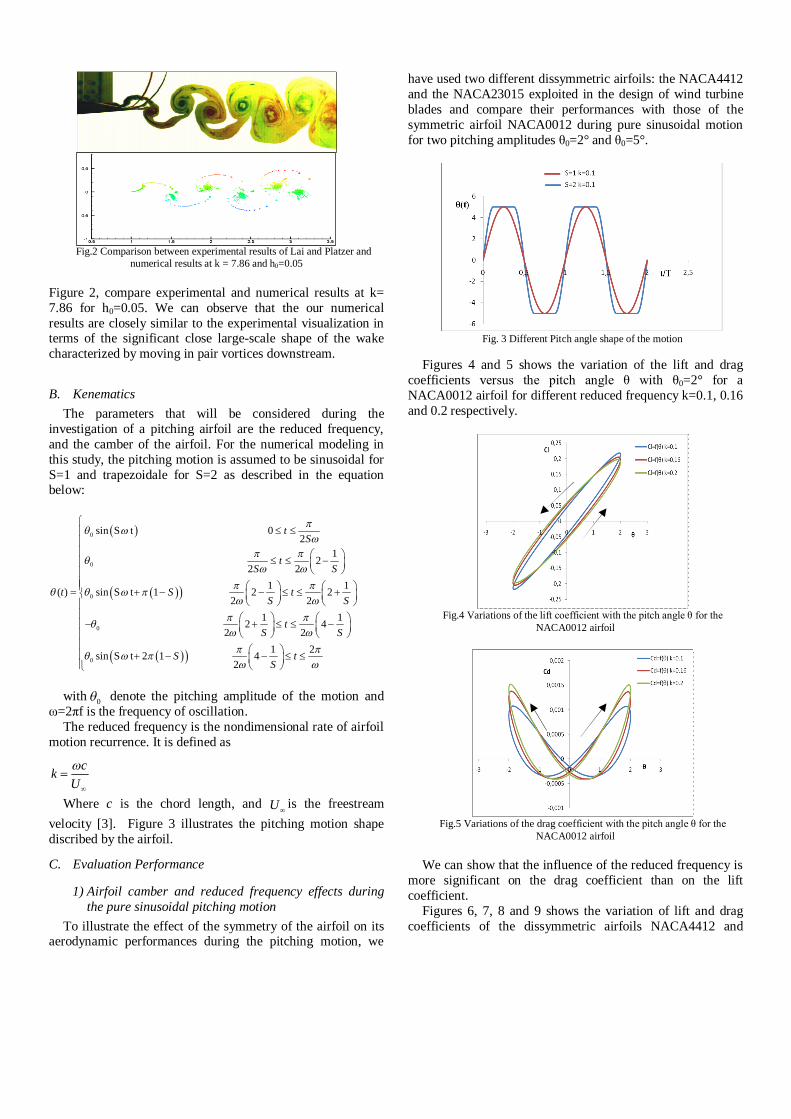
Fig.2 Comparison between experimental results of Lai and Platzer and numerical results at k = 7.86 and h0=0.05
Figure 2, compare experimental and numerical results at k= 7.86 for h0=0.05. We can observe that the our numerical results are closely similar to the experimental visualization in terms of the significant close large-scale shape of the wake characterized by moving in pair vortices downstream.
B. Kenematics The parameters that will be considered during the
investigation of a pitching airfoil are the reduced frequency, and the camber of the airfoil. For the numerical modeling in this study, the pitching motion is assumed to be sinusoidal for S=1 and trapezoidale for S=2 as described in the equation below:
0
0
0
sin S t 02
1 22 2
1 1( ) sin S t 1 2 22 2
tS
tS S
t S tS S
0
0
1 1 2 42 2
1 2sin S t 2 1 42
tS S
S tS
with denote the pitching amplitude of the motion and
ω=2πf is the frequency of oscillation. The reduced frequency is the nondimensional rate of airfoil
motion recurrence. It is defined as Where c is the chord length, and U
is the freestream velocity [3]. Figure 3 illustrates the pitching motion shape discribed by the airfoil.
C. Evaluation Performance
1) Airfoil camber and reduced frequency effects during the pure sinusoidal pitching motion
To illustrate the effect of the symmetry of the airfoil on its aerodynamic performances during the pitching motion, we
have used two different dissymmetric airfoils: the NACA4412 and the NACA23015 exploited in the design of wind turbine blades and compare their performances with those of the symmetric airfoil NACA0012 during pure sinusoidal motion for two pitching amplitudes θ0=2° and θ0=5°.
Fig. 3 Different Pitch angle shape of the motion
Figures 4 and 5 shows the variation of the lift and drag
coefficients versus the pitch angle θ with θ0=2° for a NACA0012 airfoil for different reduced frequency k=0.1, 0.16 and 0.2 respectively.
Fig.4 Variations of the lift coefficient with the pitch angle θ for the
NACA0012 airfoil
Fig.5 Variations of the drag coefficient with the pitch angle θ for the
NACA0012 airfoil We can show that the influence of the reduced frequency is
more significant on the drag coefficient than on the lift coefficient.
Figures 6, 7, 8 and 9 shows the variation of lift and drag coefficients of the dissymmetric airfoils NACA4412 and
ckU
0

NACA23015 with pitch angle for different reduced frequency k.
The lift coefficient Cl of the NACA4412 and NACA23015, presents the same trend of variation such the lift coefficient of the symmetric airfoil NACA0012. The maximum values are obtained at the maximum pitch angle and the increase of the reduced frequency has not a noticeable effect on the lift loop and hysteresis.
The effect of the reduced frequency is mainly observed on the drag coefficients which present one loop and begin expanded when increasing k. Furthermore, the increasing of k induce an increase in the maximum drag coefficient occurring at the maximum angle of attack, 2°, during the upstroke motion but this increase in drag has not the same importance in the downstroke motion at the minimum angle of attack -2°.
Fig.6 Variations of the lift coefficient versus the pitch angle θ for different
reduced frequency of the NACA4412 airfoil
Fig.7 Variations of the drag coefficient versus the pitch angle θ for different
reduced frequency of the NACA4412 airfoil To compare the performances of different airfoil shapes,
Fig.10 shows the variation of the mean thrust coefficient of the NACA4412 and NACA23015 airfoils for different reduced frequency for θ0=2° and θ0=5° which is defined as: (12) Cd is the instantaneous drag coefficient and T is the period of the motion.
In the case of θ0=2°, we can observe that the NACA4412 airfoil produces the lower drag forces in all cases of reduced frequency. However the NACA23015 is the airfoil which produces the highest drag forces with increasing the reduced frequency k.
By increasing the pitching amplitude to θ0=5°, the difference in the thrust coefficient between the airfoils
decrease but the NACA23015 is more produced drag force than the other airfoils.
Fig.8 Variations of the lift coefficient versus the pitch angle θ for different
reduced frequency of the NACA23015 airfoil
Fig.9 Variations of the drag coefficient versus the pitch angle θ for different
reduced frequency of the NACA23015 airfoil
Fig.10 Variation of the mean thrust coefficient versus the reduced frequency
a) pitching amplitude θ0=2° and b) pitching amplitude θ0=5° for the three airfoil shapes.
2) Trapezoidal pitching motion
To demonstrate the effect of the shape of the pitching motion on the NACA0012 airfoil, a trapezoidal shape has been used for S=2, θ0=5° and reduced frequency k =0.1.
0
1 ( )T
t dC C t dtT
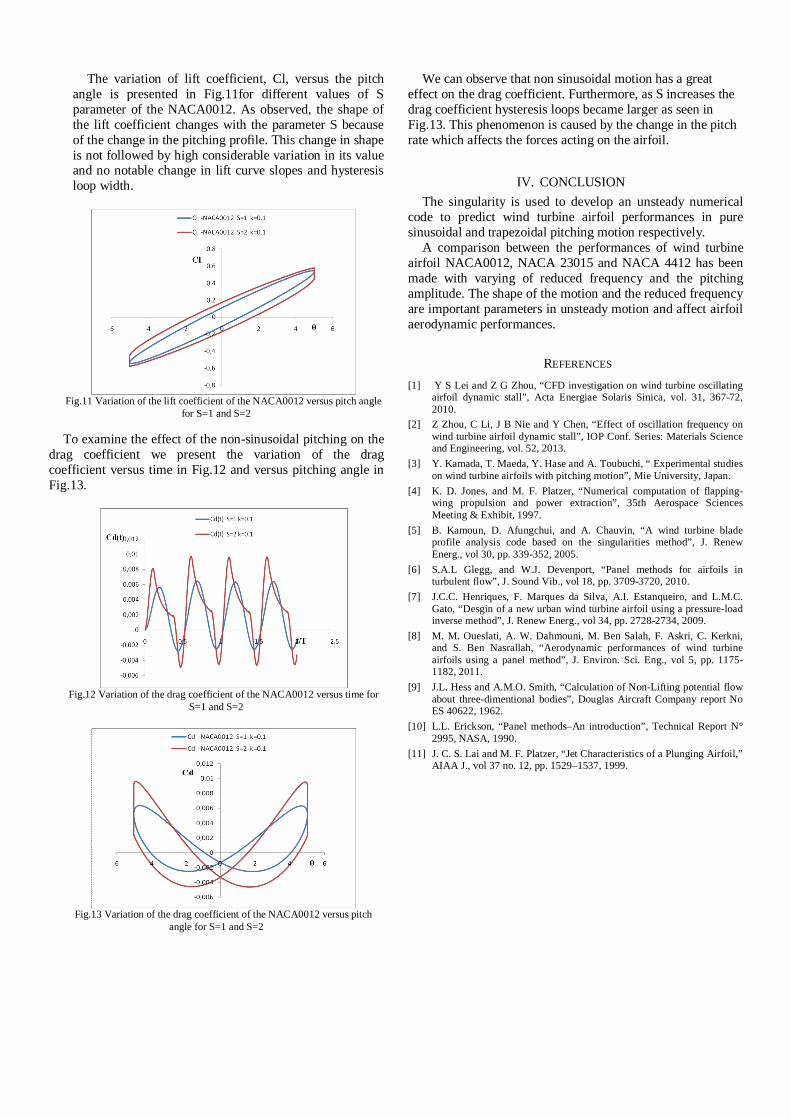
The variation of lift coefficient, Cl, versus the pitch angle is presented in Fig.11for different values of S parameter of the NACA0012. As observed, the shape of the lift coefficient changes with the parameter S because of the change in the pitching profile. This change in shape is not followed by high considerable variation in its value and no notable change in lift curve slopes and hysteresis loop width.
Fig.11 Variation of the lift coefficient of the NACA0012 versus pitch angle
for S=1 and S=2
To examine the effect of the non-sinusoidal pitching on the drag coefficient we present the variation of the drag coefficient versus time in Fig.12 and versus pitching angle in Fig.13.
Fig.12 Variation of the drag coefficient of the NACA0012 versus time for
S=1 and S=2
Fig.13 Variation of the drag coefficient of the NACA0012 versus pitch
angle for S=1 and S=2
We can observe that non sinusoidal motion has a great effect on the drag coefficient. Furthermore, as S increases the drag coefficient hysteresis loops became larger as seen in Fig.13. This phenomenon is caused by the change in the pitch rate which affects the forces acting on the airfoil.
IV. CONCLUSION The singularity is used to develop an unsteady numerical
code to predict wind turbine airfoil performances in pure sinusoidal and trapezoidal pitching motion respectively.
A comparison between the performances of wind turbine airfoil NACA0012, NACA 23015 and NACA 4412 has been made with varying of reduced frequency and the pitching amplitude. The shape of the motion and the reduced frequency are important parameters in unsteady motion and affect airfoil aerodynamic performances.
REFERENCES [1] Y S Lei and Z G Zhou, “CFD investigation on wind turbine oscillating
airfoil dynamic stall”, Acta Energiae Solaris Sinica, vol. 31, 367-72, 2010.
[2] Z Zhou, C Li, J B Nie and Y Chen, “Effect of oscillation frequency on wind turbine airfoil dynamic stall”, IOP Conf. Series: Materials Science and Engineering, vol. 52, 2013.
[3] Y. Kamada, T. Maeda, Y. Hase and A. Toubuchi, “ Experimental studies on wind turbine airfoils with pitching motion”, Mie University, Japan.
[4] K. D. Jones, and M. F. Platzer, “Numerical computation of flapping-wing propulsion and power extraction”, 35th Aerospace Sciences Meeting & Exhibit, 1997.
[5] B. Kamoun, D. Afungchui, and A. Chauvin, “A wind turbine blade profile analysis code based on the singularities method”, J. Renew Energ., vol 30, pp. 339-352, 2005.
[6] S.A.L Glegg, and W.J. Devenport, “Panel methods for airfoils in turbulent flow”, J. Sound Vib., vol 18, pp. 3709-3720, 2010.
[7] J.C.C. Henriques, F. Marques da Silva, A.I. Estanqueiro, and L.M.C. Gato, “Desgin of a new urban wind turbine airfoil using a pressure-load inverse method”, J. Renew Energ., vol 34, pp. 2728-2734, 2009.
[8] M. M. Oueslati, A. W. Dahmouni, M. Ben Salah, F. Askri, C. Kerkni, and S. Ben Nasrallah, “Aerodynamic performances of wind turbine airfoils using a panel method”, J. Environ. Sci. Eng., vol 5, pp. 1175-1182, 2011.
[9] J.L. Hess and A.M.O. Smith, “Calculation of Non-Lifting potential flow about three-dimentional bodies”, Douglas Aircraft Company report No ES 40622, 1962.
[10] L.L. Erickson, “Panel methods–An introduction”, Technical Report N° 2995, NASA, 1990.
[11] J. C. S. Lai and M. F. Platzer, “Jet Characteristics of a Plunging Airfoil,” AIAA J., vol 37 no. 12, pp. 1529–1537, 1999.