personalized presentation annotations using … presentation annotations using optical hmds 3 how...
TRANSCRIPT

Noname manuscript No.(will be inserted by the editor)
Personalized Presentation Annotations Using Optical HMDs
Wyko Rijnsburger · Sven Kratz
Received: date / Accepted: date
Abstract It is difficult to adjust the content of traditional slide presentations to theknowledge level, interest and role of individuals. This might force presenters to in-clude content that is irrelevant for part of the audience, which negatively affects theknowledge transfer of the presentation. In this work, we present a prototype that isable to eliminate non-pertinent information from slides by presenting annotationsfor individual attendees on optical head-mounted displays. We first create guidelinesfor creating optimal annotations by evaluating several types of annotations alongsidedifferent types of slides. Then we evaluate the knowledge acquisition of presenta-tion attendees using the prototype versus traditional presentations. Our results showthat annotations with a limited amount of information, such as text up to 5 words,can significantly increase the amount of knowledge gained from attending a grouppresentation. Additionally, presentations where part of the information is moved toannotations are judged more positively on attributes such as clarity and enjoyment.
Keywords head-mounted device (HMD);smart spaces;presentations;annotations;
Sven Kratz3174 Porter DrivePalo Alto, CA, 94304USATel.: +1-650-842-4800E-mail: [email protected]
Wijko RijnsburgerUniversity of Amsterdam1012 WX AmsterdamNetherlandsTel.: [email protected]

2 Wyko Rijnsburger, Sven Kratz
1 Introduction
Nowadays, presentations are a widely used means for transferring knowledge withina company or in an educational setting. A typical setting for a presentation is anindividual standing in the front of a room, directed towards a physically presentaudience of more than two people [40]. To transfer knowledge in the most efficientway, the presenter adjusts his or her content to the knowledge level and interest of theaudience. The visual element of a presentation is most often a set of slides created inPowerPoint [24] or similar presentation software.
However, it is difficult to adjust slides to the knowledge level, interests and rolesof specific attendees or groups with differing backgrounds. According to Tufte [35],presentations stand or fall on the quality and relevance of the content. Bartsch andCobern [1] conclude that non-pertinent information included in slides can decreasethe amount of knowledge acquired by the attendees from the presentation.
One way of eliminating non-pertinent information from slides is by present-ing personalized content for individual attendees on optical head-mounted-displays(OHMDs).
OHMDs can be used to show information personalized for each presentationattendee by showing it on a display directly in the wearer’s field of vision. Various bigtech companies are introducing OHMDs, such as Google with Glass [9] and Microsoftwith HoloLens [23]. These devices differ in many ways, but their goal is the same: topresent information to the user in a hands-free manner and to augment the existingreality with relevant data for the user’s current information need.
This approach offers several advantages. First, only relevant content is shown toattendees, which reduces the amount of information they have to process. Secondly,privacy-sensitive information can be shared during group meetings: imagine attendinga company meeting where employee bonuses are awarded, but the amount of theindividual bonuses is not public information. In this case, the bonus amounts could beshown in an annotation on an OHMD for each employee to view their bonus whilekeeping it hidden from other attendees. Lastly, showing individualized content onOHMDs allows users to process information at their own speed. During parts of apresentation that users perceive as being irrelevant to their interest, they can reviewprevious information that was relevant to them.
In this work, we discuss and evaluate a prototype that presents individuals with per-sonalized annotations on an optical head-mounted display during group presentations.In a first study, we evaluate several ways of presenting OHMD-based annotationsalongside several standard (main) slide designs, resulting in a set of design guide-lines for creating annotations for OHMDs. Then, in a second study, we evaluateand compare two types of presentations: a traditional slide-based presentation and aslide-based presentation with individualized, OHMD-based annotations created usingthe guidelines from the previous study. We compare both presentations by looking atqualitative factors and at the knowledge gain from viewing the presentation.
We present the following core contributions in this work: (1) a prototype presen-tation systems that allows authoring presentations with personalized OHMD-basedannotations. (2) We present insights from an eye-tracking experiment studying howusers experience watching OHMD-based annotations. We were able to determine

Personalized Presentation Annotations Using Optical HMDs 3
how much time users spend looking at the display and how this changes based on thecontent that is displayed. (3) We present results from an experiment that compares astandard presentation with one enhanced with OHMD-based annotations and showthat personalized annotations can significantly enhance the knowledge gain frompresentations, and make the presented content (subjectively) easier to understand andless overwhelming.
The remainder of this work is structured as follows: first, we discuss related workand introduce our prototype. Then, we describe the setup and the results of our twostudies. Finally, we summarize our findings and discuss possible directions for futureresearch.
2 Related Work
The following section provides an overview of related work regarding presentations,cognitive overload, head-mounted displays and user modeling.
2.1 Presentations
Savoy et al. [31] indicate that the effectiveness of slide presentations in an educationalsetting depends on the type of knowledge that needs to be transferred. Student’sretention of graphic information (i.e. figures and tables) was better when the lecturerused PowerPoint compared to a lecture without a slide presentation. There was nodifference in the retention of alphanumeric information (i.e. text and numbers), but theretention of auditory information (i.e. verbalized) was worse when using PowerPoint.Additionally, even when the information retention was worse, students still preferredlectures with slide presentations to traditional lectures.
Lai et al. [16] have created and evaluated a dual-slide PowerPoint Presentation inan educational classroom environment. They conclude that PowerPoint presentationsenhanced with extra annotations on a second projector enhances the students compre-hension of the learning material because students could select the annotations that bestfit their needs and preferences. Their results indicate that personalized annotationsmay be even more helpful.
A number of recent works have researched ways of improving presentation cre-ation, quality, structuring, linking and audience reception: Karrer et al. [17] analyzedthe authoring process as well as audience reception of canvas-based presentationsvs. standard slide-based presentations. Pschetz et al. [26] examined presentation au-thoring from a storytelling perspective. Lastly, Trinh et al. examined the use of avirtual avatar acting as a co-presenter [34]. The main goal of their system was toincrease speaker confidence and boost presentation quality through the help of thevirtual co-presenter. Hyperslides [6] investigated the process of presenting and usedthese insights to create a markup language for hyperlinked presentations.
We position our current work within this line of previous research by contributingand investigating a technique to improve (personal) content retention for viewers andsuggest design guidelines for applying this technique to small OHMDs.

4 Wyko Rijnsburger, Sven Kratz
2.2 Cognitive Overload
Mayer and Moreno [22] indicate that humans can only process limited amountsof visual information at a time. When someone’s processing capacity is exceeded,cognitive overload occurs. This decreases the person’s ability to understand and retaininformation. They propose several solutions to reduce cognitive overload in multimedialearning situations, one of which is ‘weeding’. Weeding eliminates extraneous contentto make a multimedia narration, which in our case is a presentation, as concise andcoherent as possible. This approach proved to be effective in increasing understandingof content in an educational setting [21], which suggests this might also be the casefor presentations.
2.3 Head-Mounted Displays
There are two types of head-mounted displays [37]. Virtual reality (VR) devicesreplace the user’s entire vision with computer generated graphics. Through the useof external cameras that provide a feed of the real-world, these devices can becomevideo see-through devices that replace the user’s vision with a virtual representationof reality. VR devices were not suitable for this project, because we believe that theconversion from reality to a virtual representation of reality would harm the user’sinteractivity with the presenter and other attendees.
Optical head-mounted displays (OHMDs) are wearable devices that can enhance auser’s vision by overlaying computer generated images on the real world [30]. Whilewearing such a device, a user is immersed in an augmented reality, in which the realworld is supplemented with computer data such as audio or imagery [28]. OMHDs aimto increase the accessibility of information by providing it in such a way that does notrequire the user to use devices such as smartphones or laptops, which would distractthe user’s attention from the real world. Additionally, they can be used hands-free.This could mean that the user could take notes while viewing both the information onthe shared presentation and the personalized information shown on the OHMD.
Various implementations of OHMDs attach the display onto a traditional glassesframe. These devices are called smartglasses [18]. Smartglasses are a good way tointegrate OHMDs into traditional working environments, because they are not asintrusive and noticeable as other types of HMDs and thus are more likely to enjoysocial acceptance [3].
Hong [12] indicates that there is a negative sentiment towards OHMDs withattached camera units because of their recording capabilities. People have arguedthat OHMDs may enable the infringement of privacy due to their ability to recorddata without this being apparent. However, Hong argues that the effect of OHMDs onprivacy is yet to be determined because it is not yet clear how the general public willuse these devices. Mann [19] argues that as these devices become more widespread,new protocols and social attitudes toward the capture and sharing of visual informationhave to be adapted, but that these protocols should not discriminate against users ofthese devices.

Personalized Presentation Annotations Using Optical HMDs 5
This literature suggests that introducing our prototype into a working environmentmight result in a negative sentiment to the wearer’s of the prototype. However, thissentiment is likely to change in the future with wider adoption of head-mounteddevices.
2.4 User Modeling
To determine what information needs to be shown to users through the OHMD, weneed to build a model of the user. A user model allows the system to adapt a user’sspecific needs [15]. User modeling can capture the user’s interest in a working domain,which forms the basis for providing personalized information [13].
There are different approaches to modeling the user. Stereotype modeling classifiesusers into common stereotypes and has the advantage of requiring little data. Adaptiveuser models adapt to the specifics of a single user based on gathered data for that user.For Study 2, we use a stereotype modeling approach to group presentation attendeesinto certain roles, such as ‘developer’ or ‘sales manager’.
3 Prototype
We created a prototype implementation capable of presenting presentation attendeeswith personalized annotations in order to answer the following research questionsthrough controlled user experiments:
1. How can we format annotations on an OHMD in such a way that it enhances theunderstanding of a presentation?
2. Can personalized annotations during group presentations increase the amount ofknowledge gained by attendees from the presentation?
In this section, we describe the individual components of prototype. First, wediscuss our choice of OHMD. Then, we show how we created presentations withannotations. Finally, we discuss how these annotations are send to a real-time databaseand shown on the OHMD. Figure 1 shows an overview of how an annotation getsfrom the presentation to the user’s device.
Fig. 1: Diagram detailing the different parts of the system along with the associated technologies.

6 Wyko Rijnsburger, Sven Kratz
3.1 Hardware
The field of OHMDs is rapidly developing, e.g., as Microsoft’s recent announcementof its new OHMD HoloLens [23] has shown.
However, for this experiment we chose to use Glass, an OHMD developed byGoogle, for two reasons: it is arguably the most mature OHMD on the market and itruns on the Android platform. This offers several development advantages such as theuse of existing libraries and a large knowledge and support base.
3.2 Presentations
We created presentations using a modified version of Reveal.js, a JavaScript presenta-tion framework [8]. This framework allowed us to create presentations in HTML andadd extra, optional fields where annotations can be added. An annotation consists of upto 200 characters of text, an image, or both. The style in which the annotation is shown,which will be discussed in the next section, can be set directly in HTML. Multipleannotations can be added to an individual slide by duplicating the slide and creatingseparate annotations. This way, the presenter can control when the next annotation isshown.
3.3 Real-time Database
To enable real-time synchronization of state changes between the presentation clientand the HMD, we created and hosted a real-time database using Firebase [7]. Areal-time database instantly informs clients when certain data is updated and thusdoes not require periodic checking for state changes. When a presenter changes slides,the new annotation, consisting of text, an image or both, is send to the database andstored under the unique key for that presentation using the Firebase JavaScript library.The Glass application for displaying annotations listens for changes in that document,fetches the annotation and automatically displays it on the screen.
3.4 Google Glass Application
We created a Google Glass application using the Glass Development Kit [10]. Syn-chronized via the real-time database, the application shows the annotation for thecurrent slide and also allows users to scroll through previously shown annotations.
3.4.1 Pairing
We tested two methods of pairing the Glass application with a presentation: using aQR-code and using image recognition.
By placing a QR-code at the start of the presentation, users can scan the codeusing the built-in camera and pair with the presentation. However, attendees joining

Personalized Presentation Annotations Using Optical HMDs 7
Fig. 2: An attendee pairs with a presentation by scanning the slides with Google Glass’s built-incamera.
a: Example of an annotation asdisplayed on the Glass display.
b: Gesture used to scroll betweenannotations using the Glass touch-pad.
Fig. 3: Example of an annotation and explanation of gesture used to scroll between annotations.
the presentation at a later state are not able to scan the code and thus cannot completethe pairing.
The other approach uses image recognition to recognize the presentation slides. Apresentation attendee aims his or her Glass at the presentation and activates the camera,as demonstrated in Figure 2. This was implemented using the Wikitude AugmentedReality SDK [39]. We use screenshots of each slide of a presentation, to extract visualfeatures. These features are then used as targets for image recognition. When an imagefrom a slide is recognized, the unique key associated with that presentation is used bythe Glass application to fetch correct annotations from the real-time database.
There are, however, two cases in which this approach does not work correctly.Firstly, slides with little content, such as slides containing only a title, do not haveenough unique features to be recognizable. Secondly, slides containing videos oranimated images cannot be recognized since their features change over time. Theseproblems could potentially be fixed by putting unique markers in the sides or cornersof the presentation.

8 Wyko Rijnsburger, Sven Kratz
Several factors influence the reliability of both approaches, such as the distanceand the angle at which the user is looking at the slides, the lightning in the room, andthe amount of unique features of the displayed slide.
3.4.2 Annotations
After the application has been successfully paired with a presentation, the applicationshows the annotation for the current slide. Anytime the presenter switches to a newslide, the new annotation is ‘inserted’ after the previous annotation. This is indicatedto the user through an animation where we zoom out on the previous annotation,after which a new annotation appears beside it, on which we then zoom in. When thepresenter switches back to a previous slide, a similar animation transfers the user backto the associated annotation.
Users can view annotations from previous slides by sliding back and forth on theGlass touchpad, as shown in Figure 3b. A scrolling bar at the bottom indicates theuser’s scrolling position within the annotations. When a slide without an annotation isshown, the Glass screen dims. However, users are still able to scroll back to previousannotations. Figure 3a shows an example of an annotation, which is seen by the useron a Google Glass display.
4 Study 1
In a first study, we evaluated several combinations of layout styles for annotations andslides, in order to determine what type of annotation layout design is most suitable forviewers of presentations.
One of the challenges of head-mounted devices is that they generally have a narrowfield of vision. The field of vision is the extent of the observable world that is seen atany given moment, which is 150 to 200 degrees for normal humans combining eye andhead rotation [36]. While the initial trend was to create OMHDs with a wide displayand a wide field of vision, recent devices have opted for devices with a more narrowdisplay, because this increases the pixel density of the display [29]. Google Glass hasa display that compares to viewing a normal 24" display from a distance of 2.4 meters.This means that the information must be communicated to the individual in a smallpart of their vision.
Slides vary widely in their format. Some slides contain images, while others maycontain videos, bullet points or just a title. Annotations can also be displayed in avariety of ways. Google Glass offers several ways to present text and images on thedisplay. Table 1 shows the most common slide and annotation styles that we haveidentified.
In order to present information on an OHMD in the most effective way possible,we conducted a study in which we gathered guidelines for creating visually optimalannotations.

Personalized Presentation Annotations Using Optical HMDs 9
Slide Style Annotation StyleS1: Title A1: No annotationS2: Title & Image A2: Text (1-5 words)S3: Video A3: Text (6-25 words)S4: Title & Bullet Points A4: ImageS5: Title & Image & Bullet Points A5: Image & Text (side by side)
A6: Image & Text (1-5 words)(Overlay)A7: Image & Text (6-25 words)(Overlay)
Table 1: The most common slide and annotation styles that we have identified.
4.1 Hypotheses and Research Questions
In particular, the study aimed to answer the following questions:
1. How can annotations on a Head-Mounted Display be presented to optimize theknowledge gained from a slide presentation?
2. How long do users look at the annotations and does this differ per annotationformat?
Prior to the study, we formulated the following hypotheses:
– H1: Users spend more time looking at an annotation as the amount of content inthe annotation increases.
– H2: When the distraction level of an annotation increases, the understanding of apresentation decreases.
– H3: Annotations with images will be regarded as the most visually pleasant.
4.2 Methods
The experiment tested the effect of two independent variables: annotation style andslide style. To test all possible combinations of the seven annotation styles and the fiveslide styles, we created a total of 35 presentations.
4.2.1 Choice of Topic
We used 35 different cities in the United States as the topics for the presentations.Cities can be described using standard information available for every city, such asthe population, the state and the date of establishment. Additionally, facts about citiesshould be understandable for any participant regardless of prior knowledge.
The 35 cities were chosen randomly from a list of the 295 most populous citiesin the United States [38], and the information about the cities was taken from theirrespective Wikipedia pages. For the seven video presentations, we used existing videosabout cities. For four of the cities, we used the first 30 seconds of the city’s “ExpediaTravel Guide”, e.g., the guide for Dallas, Texas [41]. There was no such guide availablefor the other three cities, so we used a video made by the city’s tourist board.

10 Wyko Rijnsburger, Sven Kratz
Fig. 4: Presenter inserted into the lower right corner of the presentation.
Since each slide used a standard format and style, we wrote the content of thepresentations in JSON, which we then converted into HTML using semantic templatescreated using the Handlebars.js framework [11].
4.2.2 Presentation Set-up
To allow us to perform gaze tracking, subjects needed to sit in a consistent place infront of a display and an eye tracker. This made it impossible to give a presentationin-person. However, a presentation consisting of just audio and slides, without a visualembodiment, is not representative of a real presentation setting. According to Kelleyand Gorham [14], eye contact and physical immediacy account for 20 percent of theoverall variance in the recall of information.
Therefore, we chose to record the presentations in front of a green-screen andintegrate the recordings into the presentation slides, as shown in Figure 4. Thissetup was the best approximation for a real-world setup while fitting our constraints.Additionally, this removed any inevitable inconsistencies that would occur whengiving the same presentation multiple times to different participants.
The end result is a collection of 35 presentations about cities combining all differentannotation layouts with all slide layouts, with a presenter integrated into the slides.
4.2.3 Experiment Design
We used a within-subjects factorial design, with annotation style and slide style asindependent factors, which meant that all participants evaluated all 35 presentations.The order of the 35 presentations was randomized for each participant as to compensatefor potential carryover effects. The experiment was conducted using an adjustedversion of the prototype described in the previous section. Unnecessary features,

Personalized Presentation Annotations Using Optical HMDs 11
Fig. 5: Study 1 experiment setup and eye-tracking positioning.
such as presentation pairing and annotation scrolling, were removed. After eachpresentation, we asked the subject to express his or her opinion about the shownpresentation and annotation through three statements on a five-point Likert scale, eachmeasuring a single variable. The three statements along with their variables were:
– Distraction: The annotation distracted me from the slides and/or the presenter.– Understanding: I followed and understood everything shown in the presentation
and the annotation.– Visual Pleasantness: The annotation was pleasant to look at.
The statements for distraction and visual pleasantness were only applicable whenan annotation was shown, thus we added an extra option to the Likert scale for thesestatements: “No annotation shown”.
Additionally, we tested the participant’s understanding of the content of eachpresentation with a three-option multiple-choice question. As an example, the multiplechoice question for the presentation about Cincinnati was: “How did Cincinnati rankamong US cities by population in 1840?". These questions also made sure that theparticipants remained focused on the presentations and the annotations.
4.2.4 Eye Tracking
During the experiment, we captured the participant’s focus of attention using eyetracking. While attending a presentation using our prototype, an attendee’s focus ofattention is divided between the following elements: Slide Content, Presenter, GlassDisplay and Miscellaneous.
For eye-tracking, we initially tried using a mobile eye tracker. However, we raninto radio-frequency interference issues of the eye tracker signal, likely caused by theradios and electronics of Glass. So instead, we used a conventional eye tracker fromEye Tribe [33]. This eye tracker runs at 60 Hz and has an average accuracy of 0.5°. Itwas placed at the bottom of the display on which the presentations were shown and

12 Wyko Rijnsburger, Sven Kratz
placed in such a way that the prism of Glass did not block the eye tracker’s view ofthe subject’s pupils, as shown in Figure 5.
When a subject sits at the recommended 65 centimeter distance from the eyetracker, the tracking area of the eye tracker is 40 by 30 centimeters. Therefore both thepresentation display and the glass screen needed to be in the 30 centimeter verticalrange. To maximize the quality of the eye tracking data, subjects were instructed tolimit their head movement and keep the glass display between an area, which wemarked on the display where the presentations were shown.
We took great care in ensuring the validity of the eye-tracking data we did gather.We discarded the results of several participants after evaluating the eye-tracking data.We used a large (27 inch diagonal) monitor where only the center portion of the screenwas occupied by the presentation. If the participant looked at the Glass display, theparticipant’s effective gaze was in a measured area on the top part of the screen. Wetested this setup extensively and found that we were able to accurately measure if aparticipant was looking at either Glass, the presentation or the presenter (or somewhereelse entirely).
The presentations were run in iBrowser, a web browser that is able to synchronizeeye tracking data with browser actions [27]. The eye tracking was calibrated andtested for each subject before the start of the experiment. During the experiment, wemonitored the accuracy of the eye tracker and made adjustments to the angle of theeye tracker and the posture of the participant when necessary. Participants viewed all35 presentations and completed their associated questionnaires in one sitting of aboutforty minutes.
After all presentations were finished, we asked the participants two open-endedquestions, aimed at gathering information to improve the prototype:
– How did the annotations distract you from the presentation?– How would you improve the annotations?
In the final part of the experiment, subjects ranked all annotation styles accordingto their preferences. For each annotation style, two examples were shown. The startingorder of the ranking was randomized for each participant to eliminate any influencethe order might have on the results.
4.3 Results
Ten participants (two female) from an industrial research lab between the age of 24and 38 evaluated a total of 350 half-minute presentations. Six of the ten participantshad used a Google Glass device before. They did not receive compensation for theirparticipation.
4.3.1 Content Questions
Figure 6 shows the amount of correct answers to the questions about the contentof the presentation, grouped by the style in which in the annotation was shown. Intotal, participants answered 66.3% of the content questions correctly. More correct

Personalized Presentation Annotations Using Optical HMDs 13
Fig. 6: The amount of correct answers (out of 50) per annotation style.
answers were given when an annotation was shown, with the exception of the twostyles displaying more than five words of text (A3 and A7). However, using logisticregression (with α = 0.05), we can conclude that only text annotations with 6-25 words(A3) performed significantly worse and text up to 5 words with an image background(A6) performed significantly better.
4.3.2 Questionnaire
For the analysis of the presentation questionnaire, we excluded all presentations with-out an annotation. For the 50 presentations without an annotation, subjects correctlyidentified that there was no annotation in 49 of the 50 cases.
Although Likert scales nominally provide ordinal data, we treated the data ascontinuous, as argued by Norman [25], in order to perform an ANOVA.
The blue bars in Figure 8d show that subjects considered the textual annotationwith up to 5 words (A2) to be the least distracting. Using a one-way ANOVA (α =
0.05), the style of the annotation significantly determined the perceived distraction(p < .001). A Tukey HSD pairwise comparison showed that the perceived distractionfor styles text (6-25 words) (A3) and image + text (6-25 words) (A7) was significantlyhigher than for the other styles.
The annotation style also significantly determined the visual pleasantness of theslide (p < .001). Styles ‘image’ (A4) and ‘text + image (side by side)’ (A5) wereregarded to be the most visually pleasant (Figure 8d, gray bars). However, they onlysignificantly differ from styles A3 and A7 and not from the other two styles.
The perceived understanding (Figure 8d, orange bars) of the content followedthe same trend. It was significantly determined by the annotation style (p < .001),but with a lower number of significant differences: A3 had a significant perceivedunderstanding compared to styles A2, A4 and A5.

14 Wyko Rijnsburger, Sven Kratz
Fig. 7: Example gaze data visualization. The red dots represent user fixations for this session.
The style of the slide does not have a significant impact on the perceived distraction(p = .0615) or the visual pleasantness of the annotation (p = .1972). However, there isa significant impact on the perceived understanding (p < .001). Participants indicatedthat they understood slides showing a video (S3) significantly better than the otherstyles of slides. This is supported by the amount of correct answers to the contentquestions for video slides: 77.1% compared to 63.6% for the other types of slides. Thiscould be attributed to the fact that the videos were travel guides which conveyed lessinformation in the same amount of time that the presenter did in the other presentations.
4.3.3 Eye Tracking Analysis
We analyzed the eye tracking data in two ways. First, we visualized the raw gazedata using the iBrowser visualization tool, as shown in Figure 7. This was done toverify the accuracy of the data. For example, we checked if the gaze points matchedactual content, such as the presenter, instead of a collection of random points onthe screen. Secondly, for each individual presentation we calculated a distribution ofthe participants gaze by classifying the users fixations as either looking at the ’glassdisplay’, ’slide’ or ’presenter’ based on the smoothed X and Y coordinates gatheredby the eye tracker. The areas used for classification are marked with a red border inFigure 7. Fixations outside these predefined areas, which made up about 15% of thetotal fixations, were discarded.
A one-way ANOVA indicated that the annotation style significantly determinedthe amount of time spent looking at the Glass display (p < .001). Figure 8a showsthat subjects spent 36.5% of the time looking at annotations with more than 6 wordsand an image background (A7) while only 17.2% looking at textual annotations of

Personalized Presentation Annotations Using Optical HMDs 15
a: Gaze distribution per annotation style. b: Gaze distribution per slide style.
c: The voting distribution for the ranking ofthe annotation styles by preference.
d: Average distraction, understanding and vi-sual pleasantness scores based on a five-pointLikert scale for each annotation style.
Fig. 8: Results of study 1.
up to 5 words (A2). A Tukey HSD pairwise comparison showed that subjects spentsignificantly less time looking at style A2.
The style of the slide significantly impacted the time spent looking at slide, com-pared to the presenter or the Glass display (p < .001). Figure 8b shows that during avideo slide (S5), participants spent 71.7% of the time looking at the slide, comparedto 23.6% during slides containing just a title (S1), which is a significant difference.This is also reflected in the percentages for the other parts of the presentation. Duringslides with style S1, participants spent significantly more time (38.9%) looking atannotations than during slides with other designs.
4.4 Ranking
The different rankings of the annotation styles were aggregated according to theSchultz method [32] using the online tool Condorcet Vote [4]. The results are shownin the following list:
1. Image

16 Wyko Rijnsburger, Sven Kratz
2. Text + image side by side3. Tie: Text (1-5 words) + image (overlay) / Text (1-5 words)4. No Annotation5. Text (6-25 words)6. Text (6-25 words) + image (overlay)
Figure 8c shows a visualization of the vote distribution.
4.5 Open Questions
Almost all participants indicated that annotations with large amounts of text distractedthem. One participant (P3) said that “reading long sentences from a heads-up displayrequired focus and distracted from listening to the audio”. Another participant (P6)thought “text overlapping on images was hard to read”.
Subjects indicated that annotations should contain only a small amount of informa-tion. P3 indicated that “maps and little pieces of information were easier.”. P8 advisedus to “keep the annotation short and clean” and to only use key words or pictures.
4.6 Discussion
The eye tracking data shows that the participants spent significantly more time lookingat annotations with more content, thus we accept H1. There is also a clear correlationbetween the perceived understanding and the distraction level. The annotation styleswith the highest distraction (A3 & A7) have the lowest perceived understanding, whichsuccessfully affirms H2. Although the annotation styles image and text + image (sideby side) are regarded to be the most visually pleasant and were ranked as the mostpreferred styles, there is no significant difference with the textual annotation of 1-5words, thus we reject H3.
While the results might be influenced by pre-existing knowledge, we can see initialsigns that the use of annotations with small amounts of information correlates withan increased amount of correct answers to questions about content conveyed in apresentation. Annotations with 6+ words (A3 & A7) that are perceived as distractingresulted in less correct answers.
The annotation style text (1-5 words) + image (A6) differed significantly in gazetime compared to an image without text, when in fact it has less content. This mightmean that subjects saw the image as simply a background and did not process theinformation from the image.
To summarize our findings, we formulate the following guidelines that a presentershould use when creating OHMD-based annotations:
– Annotations should contain no more than five words.– If the content of an image is important, do not overlay text on the image– Image annotations should be simple and convey a single concept.

Personalized Presentation Annotations Using Optical HMDs 17
5 Study 2
To evaluate the effectiveness of our proposed system in combination with the guide-lines formed in the previous study, we conducted a further user study. We comparedseveral factors, such as the knowledge gained from a presentation and the perceptionof a presentation between two groups. One group of subjects used the prototype whileviewing a presentation where part of the information had been moved into annotations.A control group viewed a traditional presentation without using the prototype. Bothparticipant groups, however, were exposed to the same amount of information: addi-tional content was displayed on the slides for the control group, whereas participantsfrom the prototype group saw this content on their OHMD.
5.1 Methods
For the purposes of setting up a presentation scenario for the study, we created a fictivepresentation. The topic of this presentation was the internal announcement of a newfictional technology product within a fictional company. We used the same setup as inthe first study, with participants sitting in front of a display looking at presentationslides with the presenter inserted into the bottom corner. Eye tracking was not neededfor this study, thus we ran the presentations in a standard browser (Google Chrome).We chose a fictional subject in order to test the knowledge gained from watching apresentation without the possibility of preexisting knowledge influencing the results.This removed the necessity of a test controlling for preexisting knowledge, as allinformation in the fictive presentation is new to all participants.
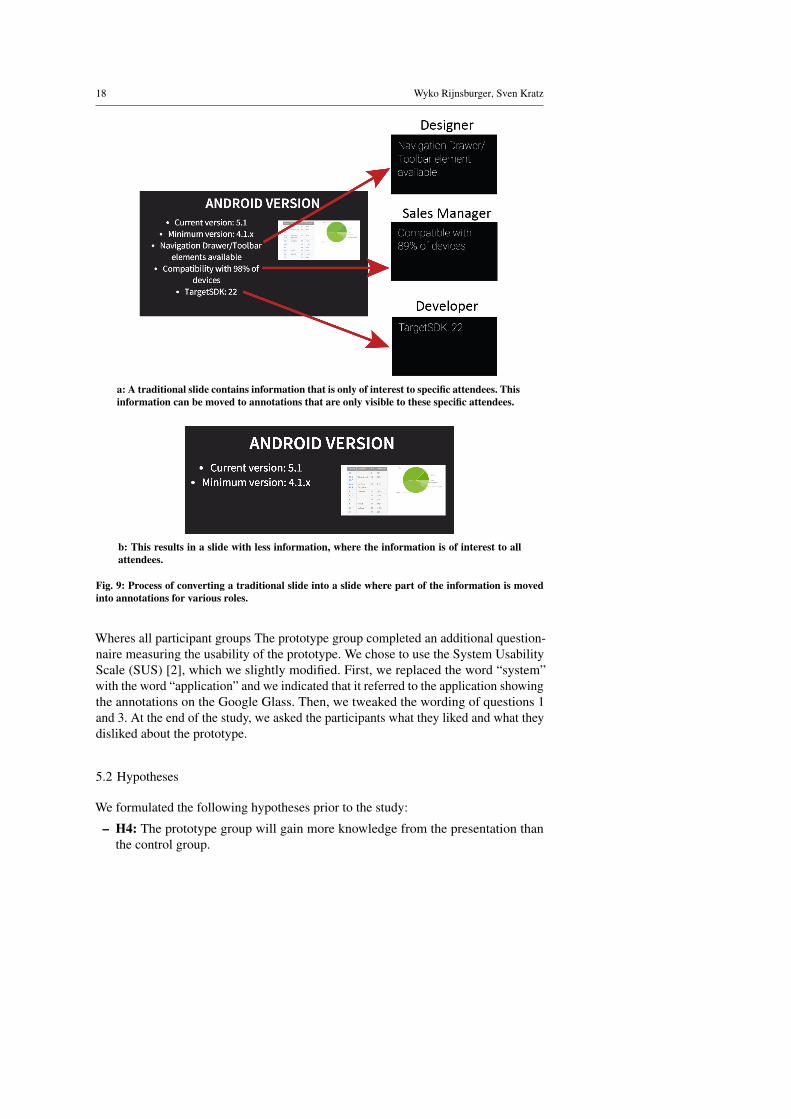
We first created a traditional presentation, containing information that might onlybe relevant to specific attendees, such as designers, developers or sales managers. Forthe condition with annotations, we moved part of the information off the original slidesto annotations for specific roles, as shown in Figure 9a. This resulted in main slideswith less information, as shown by the example slide in Figure 9b.
Participants were randomly assigned to either the control group (no annotations) orthe prototype group (annotations shown). Participants were instructed to imagine theywere attending a presentation as Scotty, an Android developer at the fictional companyInstaCorp. Participants of the prototype group were then then shown an instructionaltext and an animation explaining how to scroll through annotations. Afterwards, thepresentation was shown.
Directly after the presentation, each subject completed a questionnaire that testedtheir knowledge of the conveyed information. The questionnaire consisted of 20four-option multiple choice questions. Afterwards, we asked participants to judge thepresentation on the following five aspects on a five-point Likert scale:
– Understanding: I was able to follow and understand the presentation.– Clarity: The presentation was coherent and clear.– Overwhelmingness: I was overwhelmed by the amount of information in the
presentation.– Enjoyment: I enjoyed the presentation.– Visual pleasantness: The presentation was pleasant to look at.
18 Wyko Rijnsburger, Sven Kratz
a: A traditional slide contains information that is only of interest to specific attendees. Thisinformation can be moved to annotations that are only visible to these specific attendees.
b: This results in a slide with less information, where the information is of interest to allattendees.
Fig. 9: Process of converting a traditional slide into a slide where part of the information is movedinto annotations for various roles.
Wheres all participant groups The prototype group completed an additional question-naire measuring the usability of the prototype. We chose to use the System UsabilityScale (SUS) [2], which we slightly modified. First, we replaced the word “system”with the word “application” and we indicated that it referred to the application showingthe annotations on the Google Glass. Then, we tweaked the wording of questions 1and 3. At the end of the study, we asked the participants what they liked and what theydisliked about the prototype.
5.2 Hypotheses
We formulated the following hypotheses prior to the study:
– H4: The prototype group will gain more knowledge from the presentation thanthe control group.

Personalized Presentation Annotations Using Optical HMDs 19
Fig. 10: Chart showing the difference in opinions stated in the Likert scale questions between thetraditional presentation and the prototype presentation where information has been partially movedto the annotations.
– H5: The presentation using the prototype will be judged more positively by thefollowing criteria: understanding, clarity, overwhelmingness, enjoyment and visualpleasantness.
5.3 Results
30 subjects (9 female) from an industrial research lab between the age of 17 and 52participated in the study, divided evenly over the control group and the prototypegroup. 6 of the 15 participants in the prototype group had previously used GoogleGlass. One participant had to be reassigned from the prototype group to the controlgroup due to the Google Glass not fitting well over his glasses.
The results for the SUS and the open questions had to be discarded for oneparticipant who interpreted the questions as being about the fictional product insteadof the Google Glass application. This left us with 14 valid SUS’s.
5.3.1 Content Questions
Nominal logistic regression indicated that the group using the prototype answeredsignificantly more questions correctly than the control group (p = .007). The prototypegroup answered 72% percent of the questions correctly in contrast to the 61% for thecontrol group.
5.3.2 Presentation Questions
The presentation for the prototype group was judged more positively on all measuredfactors, as shown in Figure 10, although not necessarily significantly. Perceived

20 Wyko Rijnsburger, Sven Kratz
understanding of the prototype presentation was higher with a small significant effect(p = .040), as was the clarity with a stronger significant effect (p = .012). Theprototype group felt less overwhelmed by the presentation with a small significanteffect (p = .029). While the prototype group judged the enjoyment and the visualpleasantness of the presentation more positively, there was no significant difference(p = .115 and p = .178).
5.3.3 SUS
A SUS score was calculated by aggregating all individual scales. Our prototype systemgot a score of 65.36, which indicates average usability.
5.3.4 Open Questions
Subjects were generally positive about the prototype. P1 mentioned that it eliminatedthe need to “search through slides to find the snippet of information that pertainsto me". P10 liked the sliding functionality: “I liked that I can scroll back and seeslides with past information". P12 felt that it made attending the presentation a “moreinteractive" experience.
However, participants were also critical of several aspects. P12 indicated that thescreen of the Google Glass was hard to see and that looking at it was uncomfortable.Two participants (P1 & P25) mentioned that they were distracted from the presentationby the annotations. P22 indicated that it was confusing that the display was emptyduring slides with no annotation: “I didn’t know if it was not working or if therewas no content". Finally, the scrolling functionality was not clear to some users. P26mentioned that it “wasn’t clear when I could scroll for more information" and P27thought it was “hard to use".
5.4 Discussion
Our results indicate that personalized annotations can significantly enhance the knowl-edge gained from attending a group presentation. Additionally, moving informationfrom the presentation to annotations makes the presentation clearer, easier to under-stand and less overwhelming. However, the presentation is not significantly morevisually pleasant, nor is the enjoyment of the presentation significantly higher. Thus,we can fully accept H4 and partially accept H5.
While these results are encouraging, we think they can be further improved byadjusting the prototype. Comments from the participants and the average usabilityscore both indicate that the prototype needs to be made more usable, specificallyregarding the following points.
First, users need to be made more aware when they can scroll through annotations.This could be done by permanently showing the scrolling bar whenever scrollingis possible. Secondly, we need to add extra visual cues to the application to makeusers more aware of the annotations. While the current prototype uses an animation toindicate that an annotation is available, this is not sufficient for some users. Finally,

Personalized Presentation Annotations Using Optical HMDs 21
empty annotations cause confusion, with some users wondering if the system stoppedworking. We should add a visual cue indicating that the system is still running withoutdistracting from the presentation, which is the point of an empty annotation.
The discomfort that occurs when looking at the display remains a problem, evenafter limiting the amount of information shown in the annotation based on the resultsof our first study. This seems to be a specific limitation of the design and positioningof the Google Glass display.
6 Conclusion and Future Work
In this work we have presented a prototype that allows the removal of non-pertinentinformation from slides by showing individual attendees personalized annotationson optical head-mounted displays. In a first study, we evaluated several ways offormatting annotations. We concluded that annotations on small displays such asGoogle Glass should contain a limited amount of information, such as a single imagerepresenting a single concept or text up to five words, to prevent distraction from themain presentation.
In a second study, we used these guidelines to compare two presentations: a tra-ditional presentation and a presentation where part of the presentation content wasmoved to annotations shown on OHMDs. Our results indicate that using these guide-lines, providing individuals with personalized annotations on OHMDs, significantlyincreases the knowledge gained from group presentations. Additionally, our results in-dicate that it positively influences an attendee’s opinion about a presentation regardingfactors such as enjoyment and clarity.
We think that these benefits will only increase as OHMDs are improved and peoplebecome familiar with using them. In this study, we used Google Glass, a device with anarrow display, to show the annotations. Novel devices with a wider display offer waysto present the annotations in ways that are less distracting and more comfortable to theuser. As the quality of the devices improves, we think that the benefits of personalizedinformation will only increase. One way that a wider display could be used is byshowing the annotations in an augmented reality (AR).
To evaluate the feasibility of this approach, we built an AR version of our prototypeusing the Wikitude SDK [39]. Slides from the presentation are recognized and imageand textual annotations are placed alongside or over the recognized slides, as shownin Figure 11. Annotations are formatted and added to the slides in the same way as thenormal version of the application.
While we argue that Google Glass’s small display is not suitable for AR, we thinkthat future HMDs with a wide display that approximates our human vision, such asMicrosoft’s Hololens, can utilize this approach to present annotations in an immersiveway that limits distraction from the main presentation.
In the future, we are interested in studying the effects of our prototype on thelength of presentations. Certain information could be communicated solely throughannotations, which should make presentations shorter and more concise. Additionally,we want to explore the possibility of including automatically generated annotations,using the content on the slide and a profile of the user to query internal knowledge

22 Wyko Rijnsburger, Sven Kratz
Fig. 11: Example AR annotation as displayed on the Glass display.
bases within a company or open structured information databases such as DBPedia[5].
A limitation of this research is that our prototype was tested with a tech-savvydemographic, as indicated by the relatively high number of people that had previouslyused Google Glass. Other demographics might react differently to the annotations andOHMDs in general. In the future, we want to test the prototype in real-world situationswith a more varied demographic.
7 Acknowledgements
We would like to thank our study participants, anonymized and anonymized for theirsupervision and help with this research.
References
1. Bartsch, R.A., Cobern, K.M.: Effectiveness of powerpoint presentations in lectures. Computers &Education 41(1), 77–86 (2003)
2. Brooke, J.: Sus-a quick and dirty usability scale. Usability evaluation in industry 189(194), 4–7 (1996)3. Cakmakci, O., Rolland, J.: Head-worn displays: a review. Journal of Display Technology 2(3), 199–216
(2006)4. Condorcet.Vote: Condorcet Vote. Retrieved on 9/16/2015 from http://www.condorcet.vote/
(2015)5. DBpedia: DBpedia. Retrieved on 9/16/2015 from http://wiki.dbpedia.org/ (2015)6. Edge, D., Savage, J., Yatani, K.: Hyperslides: dynamic presentation prototyping. In: Proceedings of
the SIGCHI Conference on Human Factors in Computing Systems, pp. 671–680. ACM (2013)7. Firebase: Firebase. Retrieved on 9/16/2015 from https://www.firebase.com/ (2015)8. GitHub User Hakimel: reveal.js. Retrieved on 9/16/2015 from https://github.com/hakimel/reveal.js/ (2015)
9. Google: Google Developers: Glass. Retrieved on 9/16/2015 from https://developers.google.com/glass/ (2015)

Personalized Presentation Annotations Using Optical HMDs 23
10. Google: Google Glass Development Kit. Retrieved on 9/16/2015 from https://developers.google.com/glass/develop/gdk/ (2015)
11. handlebars.js: Handlebars.js Semantic Web Templates. Retreived on 9/16/2015 from http://handlebarsjs.com/ (2015)
12. Hong, J.: Considering privacy issues in the context of google glass. Commun. ACM 56(11), 10–11(2013)
13. Jiang, X., Tan, A.H.: Learning and inferencing in user ontology for personalized semantic web search.Information sciences 179(16), 2794–2808 (2009)
14. Kelley, D.H., Gorham, J.: Effects of immediacy on recall of information. Communication Education37(3), 198–207 (1988)
15. Kobsa, A.: Generic user modeling systems. In: The adaptive web, pp. 136–154. Springer (2007)16. Lai, Y.S., Tsai, H.H., Yu, P.T.: Integrating annotations into a dual-slide powerpoint presentation for
classroom learning. Educational Technology & Society 14(2), 43–57 (2011)17. Lichtschlag, L., Hess, T., Karrer, T., Borchers, J.: Fly: studying recall, macrostructure understanding,
and user experience of canvas presentations. In: Proceedings of the SIGCHI Conference on HumanFactors in Computing Systems, pp. 1307–1310. ACM (2012)
18. Mann, S.: Wearable computing: A first step toward personal imaging. Computer 30(2), 25–32 (1997)19. Mann, S.: Wearable technology as a human right. MIT Technology Review (2015)20. Mann, S., Nolan, J., Wellman, B.: Sousveillance: Inventing and using wearable computing devices for
data collection in surveillance environments. Surveillance & Society 1(3), 331–355 (2002)21. Mayer, R.E., Heiser, J., Lonn, S.: Cognitive constraints on multimedia learning: When presenting more
material results in less understanding. Journal of educational psychology 93(1), 187 (2001)22. Mayer, R.E., Moreno, R.: Nine ways to reduce cognitive load in multimedia learning. Educational
psychologist 38(1), 43–52 (2003)23. Microsoft: Microsoft Hololens. Retrieved on 9/16/2015 from http://www.microsoft.com/microsoft-hololens/en-us (2015)
24. Microsoft: Powerpoint. Retrieved on 9/16/2015 from http://products.office.com/en-us/powerpoint (2015)
25. Norman, G.: Likert scales, levels of measurement and the “laws" of statistics. Advances in healthsciences education 15(5), 625–632 (2010)
26. Pschetz, L., Yatani, K., Edge, D.: Turningpoint: narrative-driven presentation planning. In: Proceedingsof the 32nd annual ACM conference on Human factors in computing systems, pp. 1591–1594. ACM(2014)
27. Qvarfordt, P., Golovchinsky, G., Dunnigan, T., Agapie, E.: Looking ahead: Query preview in exploratorysearch. In: Proceedings of the 36th international ACM SIGIR conference on Research and developmentin information retrieval, pp. 243–252. ACM (2013)
28. Rolland, J., Cakmakci, O.: Head-worn displays: the future through new eyes. Opt. Photon. News 20(4),20–27 (2009)
29. Rolland, J., Hua, H.: Head-mounted display systems. Encyclopedia of optical engineering pp. 1–13(2005)
30. Rolland, J.P., Fuchs, H.: Optical versus video see-through head-mounted displays in medical visualiza-tion. Presence: Teleoperators and Virtual Environments 9(3), 287–309 (2000)
31. Savoy, A., Proctor, R.W., Salvendy, G.: Information retention from powerpoint and traditional lectures.Computers & Education 52(4), 858–867 (2009)
32. Schulze, M.: A new monotonic and clone-independent single-winner election method. Voting matters17(1), 9–19 (2003)
33. Tribe, T.E.: The Eye Tribe Tracker. Retrieved on 9/16/2015 from https://theeyetribe.com/products/ (2015)
34. Trinh, H., Ring, L., Bickmore, T.: Dynamicduo: Co-presenting with virtual agents. In: Proceedings ofthe 33rd Annual ACM Conference on Human Factors in Computing Systems, CHI ’15, pp. 1739–1748.ACM, New York, NY, USA (2015). DOI 10.1145/2702123.2702584. URL http://doi.acm.org/10.1145/2702123.2702584
35. Tufte, E.R.: The cognitive style of PowerPoint, vol. 2006. Graphics Press Cheshire, CT (2003)36. U.S. Department of Defense: Design Criteria For Military Systems, Equipment, And Facilities, MIL-
STD-1472F. Department of Defense Design Criteria Standard, Human Engineering (1998)37. Van Krevelen, D., Poelman, R.: A survey of augmented reality technologies, applications and limitations.
International Journal of Virtual Reality 9(2), 1 (2010)38. Wikipedia: List of United States Cities by Population. Retrieved on 9/16/2015 from http://en.wikipedia.org/wiki/List_of_United_States_cities_by_population (2015)

24 Wyko Rijnsburger, Sven Kratz
39. Wikitude: Wikitude Augmented Reality SDK. Retrieved on 9/16/2015 from http://www.wikitude.com/products/wikitude-sdk/ (2015)
40. Yates, J., Orlikowski, W.: The powerpoint presentation and its corollaries: how genres shape commu-nicative action in organizations. Communicative practices in workplaces and the professions: Culturalperspectives on the regulation of discourse and organizations pp. 67–91 (2007)
41. Youtube Account of Expedia.com: Expedia Travel Guide for Dallas. Retrieved on 9/16/2015 fromhttps://www.youtube.com/watch?v=Kt7lpqdbNgA (2015)