petroleum marketing monthly - eia - u.s. energy ... petroleum marketing monthly (pmm) provides...
TRANSCRIPT

Petroleum Marketing MonthlyMay 2018
Independent Statistics & Analysiswww.eia.gov
U.S. Department of EnergyWashington, DC 20585

This report was prepared by the U.S. Energy Information Administration (EIA), the statistical and analytical agency within
the U.S. Department of Energy. By law, EIA’s data, analyses, and forecasts are independent of approval by any other offi cer or
employee of the United States Government. The views in this report therefore should not be construed as representing those
of the Department of Energy or other Federal agencies.
U.S. Energy Information Administration | Petroleum Marketing Monthlyii
May 2018
Preface
The Petroleum Marketing Monthly (PMM) provides information and statistical data on a variety of crude oils and refi ned
petroleum products. The publication presents statistics on crude oil costs and refi ned petroleum products sales for use
by industry, government, private sector analysts, educational institutions, and consumers. Data on crude oil include the
domestic fi rst purchase price, the f.o.b. and landed cost of imported crude oil, and the refi ners’ acquisition cost of crude oil.
Refi ned petroleum product sales data include motor gasoline, distillates, residuals, aviation fuels, kerosene, and propane.
The Offi ce of Petroleum and Biofuels Statistics, U.S. Energy Information Administration ensures the accuracy, quality, and
confi dentiality of the published data in the Petroleum Marketing Monthly.
Scope of dataThe data within the Petroleum Marketing Monthly are compiled from fi ve Energy Information Administration (EIA) survey
forms. The crude oil statistics are calculated from data collected on the following three survey forms: Form EIA-182,
“Domestic Crude Oil First Purchase Report”; Form EIA-856, “Monthly Foreign Crude Oil Acquisition Report”; and Form EIA-
14, “Refi ners’ Monthly Cost Report.”
The statistics on petroleum product sales prices and volumes are derived from Form EIA-782A, “Refi ners’/Gas Plant
Operators’ Monthly Petroleum Product Sales Report.”
The data presented in Tables 45 to 47 are derived from aggregations of data from Form EIA-782C, “Monthly Report of Prime
Supplier Sales of Petroleum Products Sold for Local Consumption.”
SectionsMonthly statistics on purchases of crude oil and sales of petroleum products are presented in the Petroleum Marketing
Monthly in six sections:
• Highlights
• Summary Statistics
• Crude Oil Prices
• Prices of Petroleum Products
• Volumes of Petroleum Products
• Prime Supplier Sales Volumes of Petroleum Products for Local Consumption.
The publication highlights salient statistics for the United States in the Summary Statistics section. More detailed geographic
coverage occurs in the other four sections. Geographic coverage for crude oil includes country of origin for foreign crude and
Petroleum Administration for Defense (PAD) Districts and individual States for domestic crude oil. Geographic coverage of
the petroleum products includes PAD Districts and individual States.
Detailed statistics for crude oil, including the price of imported crude oil by country of origin, by gravity, and by crude stream,
can be found in the Crude Oil Prices section.
PAD District and/or State-level statistics for petroleum products are presented in the Prices, Volumes, and Prime Supplier
Sales of Petroleum Products sections. To aid the reader in determining the market changes, the majority of the tables show
data for the report month and previous month for the current year, and the report month for the previous year.
Notes on the tables• For the crude oil statistics referencing Form EIA-182, United States includes the 50 States, the outer continental shelf,
and the District of Columbia. For crude oil statistics referencing either Form EIA-14 or Form EIA-856, United States
U.S. Energy Information Administration | Petroleum Marketing Monthly iii
May 2018
includes the 50 States, the District of Columbia, Puerto Rico, the Virgin Islands, and all American territories and
possessions. For the petroleum products data, United States includes the 50 States and the District of Columbia.
• Prices exclude taxes. Refer to the Explanatory Notes for a tax table on motor fuels.
• Some of the tables use state abbreviations. Refer to the Explanatory Notes for a table of U.S. Postal State abbreviations.
• Sales of leaded gasoline are a component of averages and totals prior to October 1993.
• References to “Refi ners” include gas plant operators (see the Glossary for defi nition of “Gas plant operators”).
• “Prime supplier” refers to a fi rm that produces, imports, or transports any of the selected petroleum products across
State boundaries and local marketing areas and sells the product to local distributors, local retailers, or end users.
• The category “Retail outlet” refers to any company-operated outlet selling gasoline, on-highway diesel fuel, or propane
for on-highway vehicle use (see Glossary).
• No. 2 distillate volumes and prices are classifi ed in accordance with what the product was sold as, regardless of the
actual specifi cations of that product (see defi nitions of No. 2 distillate in the Glossary).
• Beginning with the February 2007 data release, EIA revised the table formats and content for the Petroleum Marketing
Monthly (PMM) to eliminate oxygenated gasoline as a separate category and to revise the categories of diesel fuel
(i.e., ultra-low sulfur, low sulfur, and high sulfur). In conjunction with these changes, the Total columns in certain PMM
tables have been eliminated to help ensure that sensitive data reported to EIA by individual survey respondents may
not be closely estimated using the aggregates published by EIA. Refer to the Product Guide for new table numbers.
• As of January 2012, EIA changed the methodology used to calculate the initial price estimates for refi ner acquisition
costs of crude oil. The price estimate for domestic crude oil comes from a regression model based on West Texas
Intermediate (WTI) crude oil spot market prices. The price estimate for imported crude oil comes from a regression
model that uses a basket of world crude oil prices. The composite price estimate is a weighted average of the domestic
and imported prices based on refi nery receipts data found in the Petroleum Supply Annual.
• Final revisions to 2010 and 2011 monthly and annual values in Tables 1, 1A, and 18-27 were added to the Petroleum
Marketing Monthly in the March 2013 issue.
• As of the March 2016 data release, January and February 2016 OPEC and Non-OPEC crude oil prices in Tables 21 and
22 were revised to include Indonesia in OPEC and exclude it from Non-OPEC.
• Beginning with the November 2017 data release, due to the increase of crude oil activity in the North Dakota region,
EIA replaced the North Dakota Sweet Crude Stream on the EIA-182, Domestic Crude Oil First Purchase Report with
the predominant North Dakota Bakken Crude Stream to provide an accurate price estimate for an important high
volume crude stream regularly traded in domestic crude oil markets.
U.S. Energy Information Administration | Petroleum Marketing Monthlyiv
May 2018
ContentsPreface ........................................................................................................................................................................................................................ iii
Highlights ..................................................................................................................................................................................................................vii
Summary Statistics ....................................................................................................................................................................................................1
Crude Oil Prices ..................................................................................................................................................................................................... 29
Prices of Petroleum Products .............................................................................................................................................................................44
Volume of Petroleum Products ......................................................................................................................................................................... 57
Prime Supplier Sales Volumes of Petroleum Products for Local Consumption .....................................................................................91
U.S. Energy Information Administration | Petroleum Marketing Monthly v
May 2018

TablesTable HL1. U.S. refi ner prices and volumes of petroleum products ...........................................................................................................viii
Summary StatisticsTable 1. Crude oil prices ........................................................................................................................................................................................... 2
Table 1A. Refi ner acquisition cost of crude oil by PAD Districts ..................................................................................................................4
Table 2. U.S. refi ner prices of petroleum products to end users ................................................................................................................... 6
Table 3. U.S. refi ner volumes of petroleum products to end users .............................................................................................................. 8
Table 4. U.S. refi ner prices of petroleum products for resale ...................................................................................................................... 10
Table 5. U.S. refi ner volumes of petroleum sales for resale ..........................................................................................................................12
Table 6. U.S. refi ner motor gasoline prices by grade and sales type ......................................................................................................... 14
Table 7. U.S. refi ner motor gasoline volumes by grade and sales type ..................................................................................................... 16
Table 8. U.S. refi ner conventional motor gasoline prices by grade and sales type ................................................................................ 18
Table 9. U.S. refi ner conventional motor gasoline volumes by grade and sales type .......................................................................... 20
Table 10. U.S. refi ner reformulated motor gasoline prices by grade and sales type .............................................................................22
Table 11. U.S. refi ner reformulated motor gasoline volumes by grade and sales type ..........................................................................24
Table 16. U.S. refi ner residual fuel oil prices .....................................................................................................................................................26
Table 17. U.S. refi ner residual fuel oil volumes ................................................................................................................................................27
Crude Oil Prices Table 18. Domestic crude oil fi rst purchase prices .........................................................................................................................................30
Table 19. Domestic crude oil fi rst purchase prices for selected crude streams .....................................................................................33
Table 20. Domestic crude oil fi rst purchase prices by API gravity ............................................................................................................34
Table 21. F.O.B.[a] costs of imported crude oil by selected country .........................................................................................................35
Table 22. Landed costs of imported crude oil by selected country ...........................................................................................................36
Table 23. F.O.B.[a] costs of imported crude oil by API gravity ...................................................................................................................37
Table 24. Landed costs of imported crude oil by API gravity ......................................................................................................................38
Table 25. Percentages of imported crude oil by API gravity ........................................................................................................................39
Table 26. F.O.B.[a] costs of imported crude oil for selected crude streams .......................................................................................... 40
Table 27. Landed costs of imported crude oil for selected crude streams .............................................................................................. 41
Prices of Petroleum Products Table 31. Refi ner motor gasoline prices by grade, sales type, PAD District, and state .........................................................................45
Table 32. Refi ner prices of aviation fuels and kerosene by PAD District and state .............................................................................. 49
Table 33. Refi ner prices of distillate fuels by PAD District and state ........................................................................................................53
Volume of Petroleum Products Table 39. Refi ner motor gasoline volumes by grade, sales type, PAD District, and state ...................................................................58
Table 40. Refi ner motor gasoline volumes by formulation, sales type, PAD District, and state .......................................................66
Table 41. Refi ner volumes of aviation fuels, kerosene, No. 1 distillate, and propane (consumer grade) by PAD District and
state ............................................................................................................................................................................................................................78
Table 42. Refi ner No. 2 diesel fuel volumes by PAD District and state ....................................................................................................82
Table 43. Refi ner No. 2 distillate and fuel oil volumes by PAD District and state .................................................................................86
Table 44. Refi ner residual fuel oil and no. 4 fuel volumes by PAD District ............................................................................................ 90
Prime Supplier Sales Volumes of Petroleum Products for Local Consumption Table 45. Prime supplier sales volumes of motor gasoline by grade, formulation, PAD District, and state .................................. 92
Table 46. Prime supplier sales volumes of aviation fuels, no. 4 fuel oil, propane, and residual fuel oil by PAD District and
state ......................................................................................................................................................................................................................... 100
Table 47. Prime supplier sales volumes of distillate fuel oils and kerosene by PAD District and state ........................................ 104
FiguresFigure 1. Crude oil prices..........................................................................................................................................................................................3
Figure 2. U.S. Refi ner retail petroleum product prices . ...................................................................................................................................7
Figure 3. U.S. Refi ner retail petroleum product volumes ................................................................................................................................9
Figure 4. U.S. Refi ner wholesale petroleum product prices ...........................................................................................................................11
Figure 5. U.S. Refi ner wholesale petroleum product volumes ...................................................................................................................... 13
Figure 7. U.S. Refi ner residual fuel oil prices .................................................................................................................................................... 28
U.S. Energy Information Administration | Petroleum Marketing Monthlyvi
May 2018

HighlightsCrude oil
• Monthly average crude oil prices fell in February. The average domestic crude oil fi rst purchase price decreased $1.05
(1.7%), to $61.20 per barrel.
• The average free-on-board (f.o.b.) cost of imported crude oil declined $1.92 (3.5%) to $53.69 per barrel. The average
landed cost of foreign crude oil also fell $1.92 (3.3%), to $55.99 per barrel.
• The average refi ner acquisition cost for domestic crude oil decreased $1.40 (2.1%), to $64.68 per barrel. The average
cost of imported crude oil fell $1.45 (2.4%), to $57.94 per barrel. The composite refi ner acquisition cost for crude oil
dropped $1.42 (2.2%), to $61.71 per barrel.
Petroleum productsMotor gasoline
• February monthly average prices for refi ner sales of motor gasoline show mixed trends. The average retail price
increased 1.9 cents to $2.127 per gallon, while the average wholesale price fell 2.6 cents to $1.823 per gallon.
• Refi ner sales of fi nished motor gasoline rose in February. Total sales climbed 13.8 million gallons per day (4.5%) to an
average of 319.4 million gallons per day. Retail sales rose 900,000 gallons per day (4.0%), while wholesales increased
12.9 million gallons per day (4.6%). DTW sales accounted for 7.4% of wholesales, while rack and bulk sales made up
85.6% and 7.1%, respectively.
No. 2 distillate• The direction of refi ner monthly average prices for sales of No. 2 distillates varied in February. The average price
for No. 2 diesel fuel sold to end users fell 3.7 cents to $2.107 per gallon, while the average wholesale price fell 7.0
cents to $1.972 per gallon. The average retail price for No. 2 fuel oil rose 15.9 cents to $2.365 per gallon, while the
average wholesale price decreased 10.0 cents to $1.890 per gallon.
• Refi ner sales of No. 2 ultra-low sulfur diesel declined 800,000 gallons per day (0.5%) to 152.7 million gallons per
day in February. Retail sales rose 200,000 gallons per day (1.8%), while wholesales fell 1.0 million gallons per day
(0.7%).
Residual Fuel Oil• February monthly average prices for residual fuel oil sales by refi ners moved in different directions. The wholesale
price for low-sulfur residual fuel oil declined 8.0 cents to $1.221 per gallon. The price for high-sulfur residual fuel oil fell
6.1 cents to $1.415 per gallon at retail, while the wholesale price rose 0.4 cent to $1.315 per gallon.
• Refi ner residual fuel oil sales declined to 11.1 million gallons per day in February. Retail sales fell 100,000 gallons per
day (2.7%), while wholesales decreased 1.4 million gallons per day (15.7%).
Other products• Refi ner prices for the remaining surveyed products were generally on the decline during February. Propane and
kerosene-type jet fuel prices fell at both the retail and wholesale levels, while prices for No. 1 distillate increased at
retail, but declined at wholesale. Prices for aviation gasoline and kerosene decreased at wholesale.
• During February, refi ner sales of propane decreased at both the retail and wholesale levels. Kerosene-type jet sales fell
at retail, but increased at wholesale, while sales of No. 1 distillate show the opposite trend. Sales of aviation gasoline
rose at the wholesale level, while kerosene sales fell in the same category.
U.S. Energy Information Administration | Petroleum Marketing Monthly vii
May 2018

Table HL1. U.S. refi ner prices and volumes of petroleum productsprices: dollars per gallon excluding taxes, volumes: million gallons per day
Products
Sales to end users Sales for resale
February 2018 January 2018 February 2017 February 2018 January 2018 February 2017
Price Volume Price Volume Price Volume Price Volume Price Volume Price Volume
Motor gasoline 2.127 23.4 2.108 22.5 1.862 23.8 1.823 296.0 1.849 283.1 1.625 289.7Conven onal 1.996 14.7 2.009 14.1 1.748 14.8 1.777 198.7 1.811 190.6 1.577 195.2
Regular 1.948 13.0 1.963 12.4 1.701 13.1 1.744 178.6 1.779 171.0 1.544 175.9Midgrade 2.216 0.7 2.201 0.7 1.956 0.8 1.928 1.3 1.954 1.3 1.719 1.5Premium 2.482 0.9 2.468 0.9 2.210 1.0 2.078 18.8 2.106 18.3 1.890 17.8
Reformulated 2.347 8.7 2.274 8.5 2.053 8.9 1.917 97.3 1.926 92.5 1.723 94.5Regular 2.246 6.5 2.182 6.3 1.953 6.5 1.866 81.5 1.878 77.3 1.670 78.8Midgrade 2.534 0.9 2.437 0.8 2.225 0.9 2.053 0.7 2.049 0.7 1.861 0.8Premium 2.703 1.4 2.602 1.3 2.390 1.5 2.185 15.2 2.175 14.5 2.000 14.9
Avia on gasoline W W W W W W 2.893 0.3 2.900 0.3 2.592 0.4Kerosene-type jet fuel 1.970 27.8 2.012 29.1 1.615 30.6 1.910 41.2 1.969 41.1 1.592 32.8Propane (consumer grade) 0.951 3.1 0.971 3.5 0.814 6.4 0.889 39.5 0.990 46.8 0.792 37.3Kerosene W W W W W W 2.086 1.5 2.209 2.3 1.657 1.3No. 1 dis llate 2.510 0.1 2.506 0.1 2.190 0.1 2.295 2.5 2.430 3.2 1.882 1.8No. 2 dis llate 2.110 12.0 2.145 12.0 1.757 12.1 1.966 156.5 2.036 163.4 1.634 145.6
No. 2 fuel oil 2.365 0.1 2.206 0.3 2.033 0.1 1.890 12.0 1.990 17.5 1.553 11.3No. 2 diesel fuel 2.107 11.8 2.144 11.7 1.755 12.0 1.972 144.5 2.042 145.8 1.641 134.3
Ultra low sulfur 2.109 11.6 2.150 11.4 1.755 11.6 1.976 141.1 2.045 142.1 1.644 131.1Low sulfur W W W W W W W W W W W WHigh sulfur W W W W W W W W W W W W
No. 4 fuel[a] - - - - W W W W W W W WResiden al fuel oil 1.490 3.6 1.507 3.7 1.291 4.4 1.310 7.5 1.310 8.9 1.121 6.2
Sulfur content not > 1% W W W W W W 1.221 0.4 1.301 0.4 1.174 0.6Sulfur content > 1% 1.415 W 1.476 W 1.243 W 1.315 7.1 1.311 8.5 1.115 5.6
NA = Not available.- = No data reported.W = Withheld to avoid disclosure of individual company data.[a] Includes No. 4 fuel oil and No. 4 diesel fuel.Notes: - Beginning January 2007, oxygenated gasoline is included in conven onal gasoline. - In January 2007, ultra low-sulfur diesel fuel was added. - All on-highway diesel must be ultra low-sulfur as of December 1, 2010 - Values shown for the current month are preliminary. Values shown for previous months are revised. Data through 2016 are fi nal. Total volumes may not equal the sum of the components due to roundingSource: U.S. Energy Informa on Administra on Form EIA-782A, "Refi ners'/Gas Plant Operators' Monthly Petroleum Product Sales Report."
U.S. Energy Information Administration�|�Petroleum Marketing Monthlyviii
May 2018
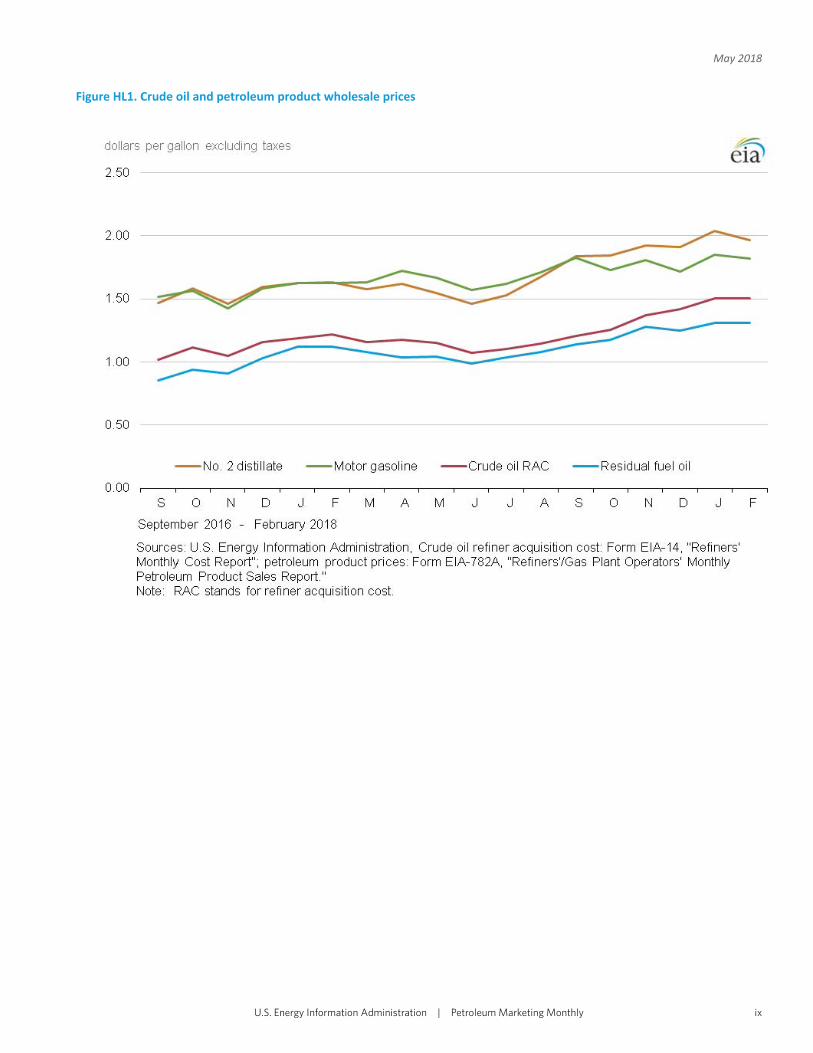
Figure HL1. Crude oil and petroleum product wholesale prices
U.S. Energy Information Administration�|�Petroleum Marketing Monthly ix
May 2018

Summary Statistics
U.S. Energy Information Administration�|�Petroleum Marketing Monthly

Table 1. Crude oil pricesdollars per barrel
Year monthDomes c fi rst purchase
pricesAverage F.O.B.[a] cost
of crude oil imports[b]Average landed cost of
crude oil imports[b]
Refi ner acquisi on cost of crude oil
Domes c Imported Composite
1997 average 17.23 16.94 18.11 19.61 18.53 19.041998 average 10.87 10.76 11.84 13.18 12.04 12.521999 average 15.56 16.47 17.23 17.90 17.26 17.512000 average 26.72 26.27 27.53 29.11 27.70 28.262001 average 21.84 20.46 21.82 24.33 22.00 22.952002 average 22.51 22.63 23.91 24.65 23.71 24.102003 average 27.56 25.86 27.69 29.82 27.71 28.532004 average 36.77 33.75 36.07 38.97 35.90 36.982005 average 50.28 47.60 49.29 52.94 48.86 50.242006 average 59.69 57.03 59.11 62.62 59.02 60.242007 average 66.52 66.36 67.97 69.65 67.04 67.942008 average 94.04 90.32 93.33 98.47 92.77 94.742009 average 56.35 57.78 60.23 59.49 59.17 59.292010 average 74.71 74.19 76.50 78.01 75.86 76.692011 average 95.73 101.66 102.92 100.71 102.63 101.872012 average 94.52 99.78 101.00 100.72 101.09 100.932013 average 95.99 96.56 96.99 102.91 98.11 100.492014 average 87.39 85.65 88.16 94.05 89.56 92.022015 average 44.39 41.91 45.38 49.94 46.38 48.39
2016January 27.02 23.67 27.36 32.17 27.48 29.99February 25.52 24.68 27.04 30.28 26.66 28.53March 31.87 29.74 32.06 35.29 32.24 33.82April 35.59 32.73 35.43 39.30 35.90 37.71May 41.02 38.31 40.73 44.77 40.88 42.88June 43.96 41.92 43.55 47.57 44.13 45.96July 40.71 38.76 41.05 44.88 41.48 43.26August 40.46 38.26 40.40 44.18 41.21 42.70September 40.55 38.28 40.81 44.47 40.86 42.73October 45.00 42.36 43.97 48.66 44.76 46.85November 41.65 40.12 42.59 46.10 41.80 44.06December 47.12 44.52 46.74 50.45 46.72 48.66
2016 average 38.29 36.37 38.56 42.41 38.75 40.66
2017January 48.19 44.63 47.05 51.81 48.12 49.99February 49.41 45.88 48.10 53.15 49.38 51.24March 46.39 44.08 46.22 50.60 46.53 48.65April 47.23 43.58 46.00 51.34 47.47 49.47May 45.19 43.74 46.13 49.58 46.94 48.34June 42.19 41.35 43.82 46.17 43.93 45.17July 43.42 42.09 44.70 47.44 45.02 46.32August 44.96 44.18 46.92 48.71 47.61 48.19September 47.17 46.47 49.74 51.14 50.37 50.79October 49.13 47.22 50.93 53.69 51.80 52.86November 55.19 52.13 56.20 58.85 56.36 57.75December 56.98 R53.69 R56.95 60.97 57.56 59.53
2017 average 48.05 R45.56 R48.47 52.01 49.14 50.68
2018January 62.25 R55.61 R57.91 66.08 59.39 63.13February 61.20 53.69 55.99 R64.68 R57.94 R61.71March [c] NA NA NA E64.82 E59.12 E62.18
NA = Not available.E = Es mated data.R = Revised data.[a] Free on Board. See Glossary.[b] Values refl ect the month of acquisi on, which can be the month of loading, the month of landing, or some me between those events. Prices for crude oil can be determined at a me other than the acquisi on date. See the Explanatory Notes sec on.[c] Data are ini al es mates calculated using regression models based on past and present values, spot prices and other internally computed data. For an explana on of es ma on methodology, see the Preface.Notes: - In November 2017, a new crude stream was added and a selected crude stream was deleted for North Dakota. In January 2004, new crude streams were added and selected crude streams were discon nued for California, Gulf Coast, Oklahoma, and Texas. - Values for Domes c First Purchase Price and Refi ner Acquisi on Cost for the current 2 months, and for Average F.O.B. and Average Landed Costs, for the current 3 months are preliminary. Values shown for previous months may be revised. Data through 2016 are fi nal.Sources: Domes c fi rst purchase prices -- See "Source" from Table 18. Crude oil imports costs -- See "Sources" from Table 21. Refi ner acquisi on costs -- U.S. Energy Informa on Administra on, Form EIA-14, "Refi ners' Monthly Cost Report."
U.S. Energy Information Administration�|�Petroleum Marketing Monthly2
May 2018
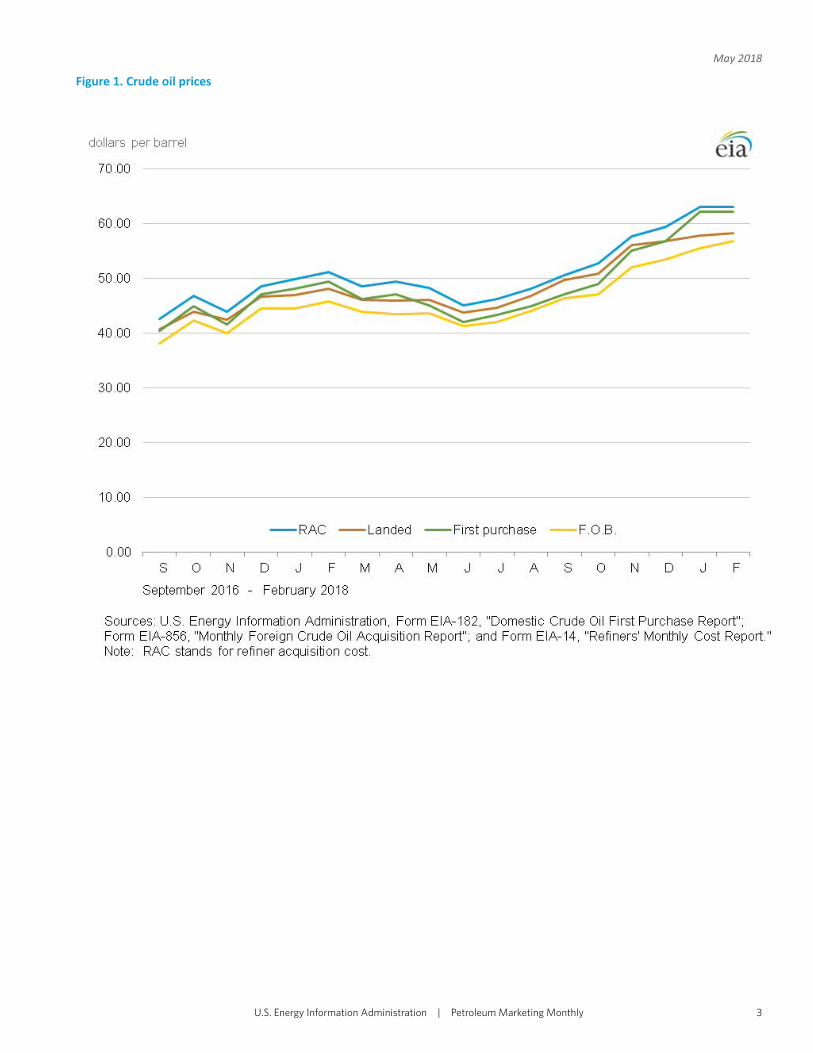
Figure 1. Crude oil prices
U.S. Energy Information Administration�|�Petroleum Marketing Monthly 3
May 2018

Table 1A. Refi ner acquisi on cost of crude oil by PAD Districtsdollars per barrel
Year month
U.S. PAD District 1 PAD District 2
Domes c Imported Composite Domes c Imported Composite Domes c Imported Composite
2004 38.97 35.90 36.98 40.75 38.29 38.34 40.80 35.63 38.382005 52.94 48.86 50.24 56.89 53.29 53.35 54.57 46.11 50.752006 62.62 59.02 60.24 66.92 63.53 63.60 63.66 55.19 59.702007 69.65 67.04 67.94 70.62 72.48 72.44 71.10 62.17 66.902008 98.47 92.77 94.74 100.30 96.90 96.97 100.98 88.45 94.932009 59.49 59.17 59.29 59.64 61.68 61.63 60.00 57.00 58.642010 78.01 75.86 76.69 75.90 80.03 79.91 78.85 72.24 75.922011 100.71 102.63 101.87 98.88 111.53 111.01 96.81 89.15 93.182012 100.72 101.09 100.93 104.45 112.27 111.50 95.04 83.90 89.442013 102.91 98.11 100.49 106.98 106.74 106.80 100.63 85.43 93.262014 94.05 89.56 92.02 96.95 96.51 96.70 93.08 81.66 87.512015 49.94 46.38 48.39 52.60 50.40 51.37 49.33 42.70 46.13
2016January 32.17 27.48 29.99 33.12 31.44 32.02 32.47 25.60 28.85February 30.28 26.66 28.53 32.90 30.86 31.36 30.65 24.00 27.01March 35.29 32.24 33.82 39.12 36.17 36.91 36.37 29.60 32.80April 39.30 35.90 37.71 43.85 39.19 40.32 40.29 34.08 37.04May 44.77 40.88 42.88 49.14 43.95 45.24 46.03 38.48 42.47June 47.57 44.13 45.96 50.67 47.17 48.12 49.34 41.86 45.81July 44.88 41.48 43.26 48.37 45.03 45.61 45.70 39.13 42.60August 44.18 41.21 42.70 48.18 45.15 45.63 45.57 38.43 42.10September 44.47 40.86 42.73 47.25 44.33 44.98 45.61 37.69 41.79October 48.66 44.76 46.85 51.04 48.09 48.57 50.17 43.02 46.74November 46.10 41.80 44.06 48.91 46.25 46.70 46.61 39.20 42.79December 50.45 46.72 48.66 54.67 50.46 51.30 51.86 43.82 47.51
2016 42.41 38.75 40.66 44.58 42.54 43.00 43.76 36.19 39.95
2017January 51.81 48.12 49.99 55.35 52.87 53.34 52.83 44.53 48.26February 53.15 49.38 51.24 55.90 52.80 53.29 53.56 46.04 49.59March 50.60 46.53 48.65 55.85 51.98 52.62 50.84 42.91 46.64April 51.34 47.47 49.47 54.99 51.26 51.64 51.93 44.12 48.06May 49.58 46.94 48.34 54.64 50.66 51.17 49.72 44.64 47.27June 46.17 43.93 45.17 52.47 47.87 48.38 46.39 41.59 44.14July 47.44 45.02 46.32 54.32 48.41 48.92 47.81 42.13 44.99August 48.71 47.61 48.19 56.03 50.70 51.02 49.34 44.57 46.95September 51.14 50.37 50.79 56.14 54.06 54.24 51.08 45.39 48.22October 53.69 51.80 52.86 58.25 55.31 55.55 53.16 45.71 49.59November 58.85 56.36 57.75 62.13 60.85 61.00 58.26 50.75 54.69December 60.97 57.56 59.53 64.57 63.94 64.04 59.64 50.87 55.54
2017 52.01 49.14 50.68 56.98 53.46 53.87 52.03 45.21 48.63
2018January 66.08 59.39 63.13 66.24 65.97 66.01 65.21 51.67 58.61February R64.68 R57.94 R61.71 66.09 64.96 65.16 63.69 48.42 56.43
See footnotes at end of table.
U.S. Energy Information Administration�|�Petroleum Marketing Monthly4
May 2018
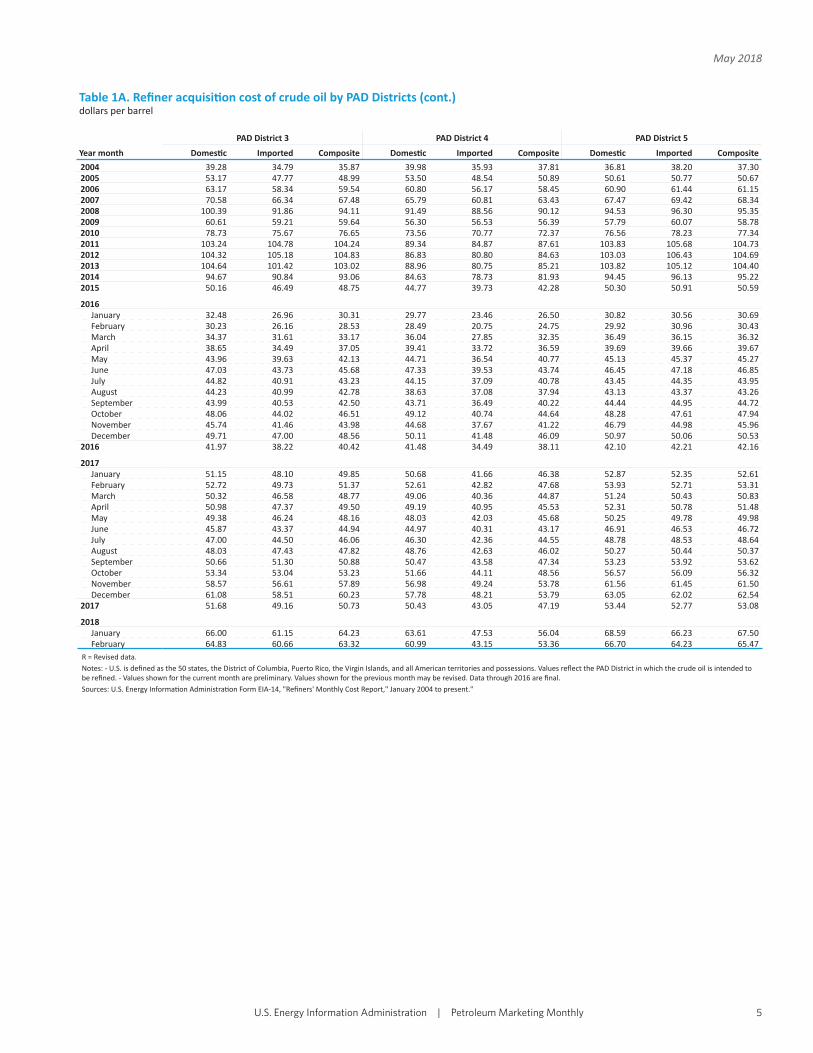
Table 1A. Refi ner acquisi on cost of crude oil by PAD Districts (cont.)dollars per barrel
Year month
PAD District 3 PAD District 4 PAD District 5
Domes c Imported Composite Domes c Imported Composite Domes c Imported Composite
2004 39.28 34.79 35.87 39.98 35.93 37.81 36.81 38.20 37.302005 53.17 47.77 48.99 53.50 48.54 50.89 50.61 50.77 50.672006 63.17 58.34 59.54 60.80 56.17 58.45 60.90 61.44 61.152007 70.58 66.34 67.48 65.79 60.81 63.43 67.47 69.42 68.342008 100.39 91.86 94.11 91.49 88.56 90.12 94.53 96.30 95.352009 60.61 59.21 59.64 56.30 56.53 56.39 57.79 60.07 58.782010 78.73 75.67 76.65 73.56 70.77 72.37 76.56 78.23 77.342011 103.24 104.78 104.24 89.34 84.87 87.61 103.83 105.68 104.732012 104.32 105.18 104.83 86.83 80.80 84.63 103.03 106.43 104.692013 104.64 101.42 103.02 88.96 80.75 85.21 103.82 105.12 104.402014 94.67 90.84 93.06 84.63 78.73 81.93 94.45 96.13 95.222015 50.16 46.49 48.75 44.77 39.73 42.28 50.30 50.91 50.59
2016January 32.48 26.96 30.31 29.77 23.46 26.50 30.82 30.56 30.69February 30.23 26.16 28.53 28.49 20.75 24.75 29.92 30.96 30.43March 34.37 31.61 33.17 36.04 27.85 32.35 36.49 36.15 36.32April 38.65 34.49 37.05 39.41 33.72 36.59 39.69 39.66 39.67May 43.96 39.63 42.13 44.71 36.54 40.77 45.13 45.37 45.27June 47.03 43.73 45.68 47.33 39.53 43.74 46.45 47.18 46.85July 44.82 40.91 43.23 44.15 37.09 40.78 43.45 44.35 43.95August 44.23 40.99 42.78 38.63 37.08 37.94 43.13 43.37 43.26September 43.99 40.53 42.50 43.71 36.49 40.22 44.44 44.95 44.72October 48.06 44.02 46.51 49.12 40.74 44.64 48.28 47.61 47.94November 45.74 41.46 43.98 44.68 37.67 41.22 46.79 44.98 45.96December 49.71 47.00 48.56 50.11 41.48 46.09 50.97 50.06 50.53
2016 41.97 38.22 40.42 41.48 34.49 38.11 42.10 42.21 42.16
2017January 51.15 48.10 49.85 50.68 41.66 46.38 52.87 52.35 52.61February 52.72 49.73 51.37 52.61 42.82 47.68 53.93 52.71 53.31March 50.32 46.58 48.77 49.06 40.36 44.87 51.24 50.43 50.83April 50.98 47.37 49.50 49.19 40.95 45.53 52.31 50.78 51.48May 49.38 46.24 48.16 48.03 42.03 45.68 50.25 49.78 49.98June 45.87 43.37 44.94 44.97 40.31 43.17 46.91 46.53 46.72July 47.00 44.50 46.06 46.30 42.36 44.55 48.78 48.53 48.64August 48.03 47.43 47.82 48.76 42.63 46.02 50.27 50.44 50.37September 50.66 51.30 50.88 50.47 43.58 47.34 53.23 53.92 53.62October 53.34 53.04 53.23 51.66 44.11 48.56 56.57 56.09 56.32November 58.57 56.61 57.89 56.98 49.24 53.78 61.56 61.45 61.50December 61.08 58.51 60.23 57.78 48.21 53.79 63.05 62.02 62.54
2017 51.68 49.16 50.73 50.43 43.05 47.19 53.44 52.77 53.08
2018January 66.00 61.15 64.23 63.61 47.53 56.04 68.59 66.23 67.50February 64.83 60.66 63.32 60.99 43.15 53.36 66.70 64.23 65.47
R = Revised data.Notes: - U.S. is defi ned as the 50 states, the District of Columbia, Puerto Rico, the Virgin Islands, and all American territories and possessions. Values refl ect the PAD District in which the crude oil is intended to be refi ned. - Values shown for the current month are preliminary. Values shown for the previous month may be revised. Data through 2016 are fi nal.Sources: U.S. Energy Informa on Administra on Form EIA-14, "Refi ners' Monthly Cost Report," January 2004 to present."
U.S. Energy Information Administration�|�Petroleum Marketing Monthly 5
May 2018

Table 2. U.S. refi ner prices of petroleum products to end usersdollars per gallon excluding taxes
Year monthMotor
gasolineAvia on gasoline
Kerosene type jet fuel
Propane (consumer
grade) KeroseneNo. 1
dis llate
No. 2 dis llate
No. 4 fuel[a]Residual
fuel oilNo. 2 diesel
fuel No. 2 fuel oil Average
1985 0.912 1.201 0.796 0.717 1.030 0.880 0.789 0.849 0.799 0.773 0.6101986 0.624 1.011 0.529 0.745 0.790 0.620 0.478 0.560 0.491 0.489 0.3431987 0.669 0.907 0.543 0.701 0.770 0.604 0.551 0.581 0.556 0.513 0.4231988 0.673 0.891 0.513 0.714 0.738 0.564 0.50 0.544 0.507 0.461 0.3341989 0.756 0.995 0.592 0.615 0.709 0.661 0.585 0.587 0.585 0.512 0.3851990 0.883 1.120 0.766 0.745 0.923 0.819 0.725 0.734 0.726 0.622 0.4441991 0.797 1.047 0.652 0.730 0.838 0.740 0.648 0.665 0.650 0.580 0.3401992 0.787 1.027 0.610 0.643 0.788 0.666 0.619 0.627 0.620 0.526 0.3361993 0.759 0.990 0.580 0.673 0.754 0.666 0.602 0.602 0.602 0.501 0.3371994 0.738 0.957 0.534 0.530 0.660 0.640 0.554 0.572 0.556 0.501 0.3521995 0.765 1.005 0.540 0.492 0.589 0.620 0.560 0.562 0.560 0.505 0.3921996 0.847 1.116 0.651 0.605 0.740 0.726 0.681 0.673 0.680 0.603 0.4551997 0.839 1.128 0.613 0.552 0.745 0.689 0.642 0.636 0.642 0.565 0.4231998 0.673 0.975 0.452 0.405 0.501 0.551 0.494 0.482 0.492 0.428 0.3051999 0.781 1.059 0.543 0.458 0.605 0.621 0.584 0.558 0.580 0.474 0.3742000 1.106 1.306 0.899 0.603 1.123 0.988 0.935 0.927 0.934 0.769 0.6022001 1.032 1.323 0.775 0.506 1.045 0.902 0.842 0.829 0.840 0.679 0.5312002 0.947 1.288 0.721 0.419 0.990 0.828 0.762 0.737 0.759 0.657 0.5692003 1.156 1.493 0.872 0.577 1.224 1.017 0.944 0.933 0.942 0.856 0.6982004 1.435 1.819 1.207 0.839 1.160 1.262 1.243 1.173 1.235 1.017 0.7392005 1.829 2.231 1.735 1.089 1.957 1.832 1.786 1.705 1.777 W 1.0482006 2.128 2.682 1.998 1.358 2.244 2.137 2.096 1.982 2.091 W 1.2182007 2.345 2.849 2.165 1.489 2.263 2.286 2.267 2.241 2.266 W 1.3742008 2.775 3.273 3.052 1.892 3.283 2.983 3.150 2.986 3.143 W 1.9642009 1.888 2.442 1.704 1.220 2.675 2.141 1.834 1.962 1.840 W 1.3412010 2.301 3.028 2.201 1.481 3.063 2.705 2.314 2.462 2.318 W 1.7132011 3.050 3.803 3.054 1.709 3.616 3.467 3.117 3.193 3.119 W 2.4012012 3.154 3.971 3.104 1.139 3.843 3.580 3.202 3.358 3.206 W 2.5922013 3.049 3.932 2.979 1.028 3.842 3.483 3.122 3.335 3.126 W 2.4822014 2.855 3.986 2.772 1.097 W 3.117 2.923 3.329 2.924 W 2.3252015 2.003 W 1.629 0.481 W 1.822 1.819 2.016 1.821 W 1.285
2016January 1.505 W 1.038 0.377 W NA 1.198 1.450 1.201 W 0.710February 1.332 W 1.032 0.409 W NA 1.185 1.407 1.187 - 0.632March 1.552 W 1.133 0.481 W 1.610 1.317 1.555 1.318 - 0.693April 1.725 W 1.187 0.472 W 1.706 1.386 1.631 1.388 W 0.782May 1.869 W 1.342 0.533 W W 1.555 1.733 1.555 - 0.922June 1.961 W 1.464 0.514 W 2.041 1.661 1.861 1.662 W 0.983July 1.804 W 1.393 0.491 W 1.911 1.577 1.814 1.578 W 1.030August 1.754 W 1.330 0.460 W 1.890 1.577 NA 1.578 W 0.990September 1.788 W 1.394 0.507 W 1.977 1.601 1.805 1.602 W 1.076October 1.819 W 1.506 0.599 W 2.048 1.706 1.941 1.708 W 1.115November 1.759 W 1.426 0.557 W 2.050 1.599 1.787 1.601 - 1.106December 1.849 W 1.539 0.666 W NA 1.718 1.997 1.721 - 1.230
2016 1.730 W 1.319 0.498 W 1.702 1.511 1.716 1.512 W 0.945
2017January 1.900 W 1.584 0.774 W 2.138 1.747 NA 1.750 W 1.309February 1.862 W 1.615 0.814 W 2.190 1.755 2.033 1.757 W 1.291March 1.904 W 1.554 0.657 W 2.142 1.699 1.909 1.701 W 1.239April 1.997 W 1.595 0.652 W W 1.747 2.081 1.748 W 1.201May 1.963 W 1.492 0.650 2.637 W 1.693 NA 1.694 W 1.213June 1.906 W 1.434 0.611 2.600 2.018 1.618 1.739 1.618 W 1.195July 1.871 W 1.478 0.667 2.621 W 1.665 1.728 1.665 - 1.211August 1.952 W 1.613 0.768 2.579 W 1.792 1.904 1.793 W 1.204September 2.154 W 1.795 0.895 2.703 2.382 1.959 2.044 1.959 W 1.314October 2.042 W 1.743 0.972 W 2.452 1.982 2.048 1.983 - 1.304November 2.122 W 1.831 1.011 W 2.466 2.047 2.134 2.048 - 1.413December 2.034 W 1.869 1.028 W 2.423 2.037 2.263 2.039 - 1.484
2017 1.976 W 1.629 0.772 W 2.230 1.811 2.010 1.813 W 1.287
2018January 2.108 W R2.012 0.971 W 2.506 2.144 2.206 R2.145 - 1.507February 2.127 W 1.970 0.951 W 2.510 2.107 2.365 2.110 - 1.490
NA = Not available.- = No data reported.W = Withheld to avoid disclosure of individual company data.R = Revised data.[a] Includes No. 4 fuel oil and No. 4 diesel fuel.Notes: - Motor gasoline averages and totals prior to October 1993 include leaded gasoline. - Values shown for the current month are preliminary. Values shown for previous months may be revised. Data through 2017 are fi nal.Sources: U.S. Energy Informa on Administra on Form EIA-782A, "Refi ners'/Gas Plant Operators' Monthly Petroleum Product Sales Report."
U.S. Energy Information Administration�|�Petroleum Marketing Monthly6
May 2018

Figure 2. U.S. Refi ner retail petroleum product prices
U.S. Energy Information Administration�|�Petroleum Marketing Monthly 7
May 2018

Table 3. U.S. refi ner volumes of petroleum products to end usersmillion gallons per day
Year monthMotor
gasolineAvia on gasoline
Kerosene type jet fuel
Propane (consumer
grade) KeroseneNo. 1
dis llate
No. 2 dis llate
No. 4 fuel[a]Residual
fuel oilNo. 2 diesel
fuel No. 2 fuel oil Average
1985 57.5 0.3 34.6 3.7 0.3 0.5 25.0 5.0 29.9 0.5 25.21986 61.2 0.3 35.1 3.4 0.3 0.4 24.4 4.4 28.8 0.7 31.61987 61.0 0.2 36.8 3.8 0.3 0.4 24.1 4.5 28.5 0.8 29.01988 61.0 0.2 38.2 4.3 0.3 0.4 24.5 4.6 29.1 1.1 30.21989 61.2 0.2 40.1 2.8 0.3 0.5 24.3 4.5 28.8 0.9 30.41990 60.3 0.2 39.9 2.7 0.2 0.5 22.2 3.6 25.9 0.8 25.91991 61.2 0.2 38.5 3.1 0.2 0.5 21.1 3.2 24.4 0.7 24.01992 59.0 0.2 39.8 3.8 0.2 0.5 21.5 3.1 24.6 0.6 22.41993 57.2 0.2 41.7 3.5 0.2 0.4 20.8 2.9 23.8 0.6 17.21994 55.0 0.2 45.2 2.2 0.4 0.4 21.3 3.4 24.6 0.8 13.51995 55.9 0.2 45.7 3.2 0.6 0.3 21.6 3.3 24.9 0.5 11.61996 57.5 0.2 48.7 3.1 0.4 0.3 21.9 3.1 25.0 0.4 12.91997 61.1 0.2 49.7 3.2 0.3 0.4 22.0 3.0 25.0 0.3 13.41998 63.3 0.2 48.9 3.1 0.4 0.4 21.1 3.2 24.3 0.3 14.41999 62.0 0.1 47.0 3.6 0.2 0.3 21.1 3.0 24.1 0.3 13.92000 60.9 0.2 49.3 2.9 0.2 0.3 22.6 2.8 25.4 0.3 13.12001 62.0 0.1 49.7 3.6 0.2 0.3 22.9 3.0 26.0 0.4 14.82002 63.6 0.1 49.1 2.6 0.1 0.3 19.6 3.0 22.6 0.4 10.42003 63.8 0.1 44.0 2.5 0.1 0.3 16.7 2.7 19.5 0.3 10.72004 58.4 0.1 46.4 2.7 0.5 0.2 16.9 2.4 19.3 0.3 10.22005 59.0 0.1 45.2 3.2 0.1 0.3 17.0 2.1 19.1 W 10.42006 60.0 0.1 42.1 2.7 0.1 0.2 24.2 1.2 25.4 W 10.42007 57.7 0.1 40.1 3.3 0.1 0.2 23.6 0.8 24.3 W 10.92008 55.1 0.1 39.9 2.7 NA 0.1 19.9 0.9 20.8 W 8.42009 49.8 0.2 38.0 3.7 NA 0.1 16.9 0.9 17.8 W 8.52010 44.7 0.1 34.8 3.9 0.0 0.1 15.3 0.4 15.8 W 7.62011 39.0 0.1 33.3 4.5 0.0 0.1 13.4 0.4 13.8 W 6.42012 29.7 0.1 32.5 5.6 0.0 0.1 12.2 0.3 12.5 W 5.52013 24.7 0.0 31.4 5.3 0.0 0.1 11.5 0.2 11.7 W 5.22014 21.6 0.0 31.3 4.9 W 0.1 11.9 0.1 11.9 W 4.62015 25.5 W 33.4 5.6 W 0.1 12.6 0.1 12.7 W 4.0
2016January 24.4 W 31.0 8.6 W NA 12.1 0.1 12.2 W 4.1February 25.2 W 28.5 7.4 W NA 12.6 0.1 12.8 - 3.9March 25.2 W 30.8 6.1 W 0.1 12.2 0.1 12.3 - 4.1April 25.9 W 30.6 5.8 W 0.1 12.1 0.1 12.1 W 4.2May 26.0 W 30.9 5.5 W W 12.5 0.1 12.5 - 3.9June 26.7 W 32.7 6.0 W 0.0 12.5 0.1 12.6 W 3.8July 26.3 W 32.1 4.2 W 0.0 12.6 0.0 12.6 W 4.3August 26.5 W 32.7 6.9 W 0.0 13.6 0.1 13.7 W 4.4September 26.4 W 32.2 6.3 W 0.0 13.2 0.1 13.3 W 4.7October 25.9 W 30.2 5.0 W 0.1 13.1 0.1 13.2 W 4.4November 24.6 W 31.6 5.3 W 0.1 13.2 0.2 13.3 - 4.0December 24.1 W 31.3 6.4 W NA 11.9 0.1 12.0 - 4.2
2016 25.6 W 31.2 6.1 W 0.1 12.6 0.1 12.7 W 4.2
2017January 22.9 W 28.7 5.7 W 0.1 12.2 NA 12.4 W 3.9February 23.8 W 30.6 6.4 W 0.1 12.0 0.1 12.1 W 4.4March 24.5 W 33.1 5.1 W 0.1 12.8 0.1 12.9 W 4.6April 24.3 W 30.9 5.8 W W 12.0 0.1 12.0 W 3.8May 24.9 W 31.6 6.7 0.0 W 12.4 NA 12.5 W 3.8June 25.7 W 33.2 5.0 0.0 0.0 12.3 0.0 12.3 W 3.7July 24.8 W 32.7 5.0 0.0 W 12.0 0.1 12.1 - 3.4August 25.2 W 32.1 5.8 0.0 W 12.7 0.1 12.8 W 3.7September 24.6 W 30.4 4.9 0.0 0.1 12.4 0.1 12.4 W 4.1October 24.9 W 29.5 3.9 W 0.1 12.3 0.1 12.4 - 3.5November 24.3 W 30.4 4.4 W 0.1 12.7 0.2 12.9 - 4.3December 24.1 W 28.8 3.1 W 0.1 11.4 0.1 11.5 - 4.6
2018January 22.5 W R29.1 3.5 W 0.1 11.7 0.3 R12.0 - 3.7February 23.4 W 27.8 3.1 W 0.1 11.8 0.1 12.0 - 3.6
NA = Not available.- = No data reported.W = Withheld to avoid disclosure of individual company data.R = Revised data.[a] Includes No. 4 fuel oil and No. 4 diesel fuel.Notes: - Motor gasoline averages and totals prior to October 1993 include leaded gasoline. - Values shown for the current month are preliminary. Values shown for previous months are revised. Data through 2017 are fi nal. Totals may not equal the sum of the components due to rounding.Sources: U.S. Energy Informa on Administra on Form EIA-782A, "Refi ners'/Gas Plant Operators' Monthly Petroleum Product Sales Report."
U.S. Energy Information Administration�|�Petroleum Marketing Monthly8
May 2018
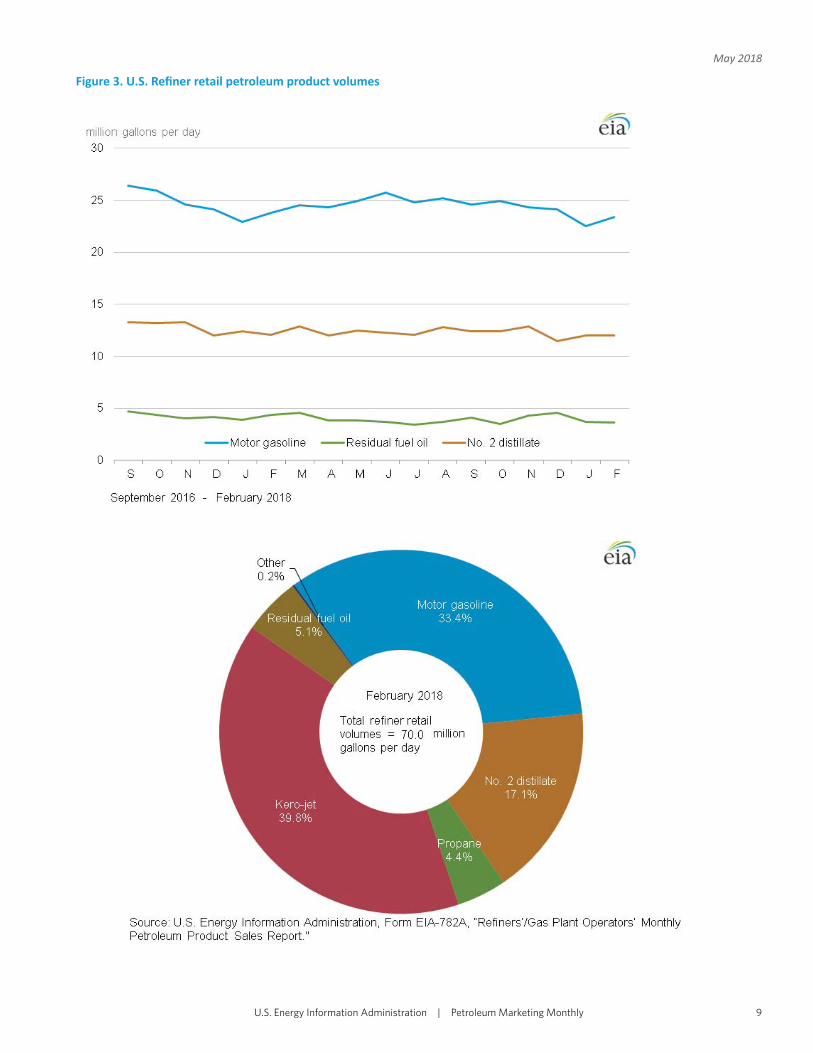
Figure 3. U.S. Refi ner retail petroleum product volumes
U.S. Energy Information Administration�|�Petroleum Marketing Monthly 9
May 2018
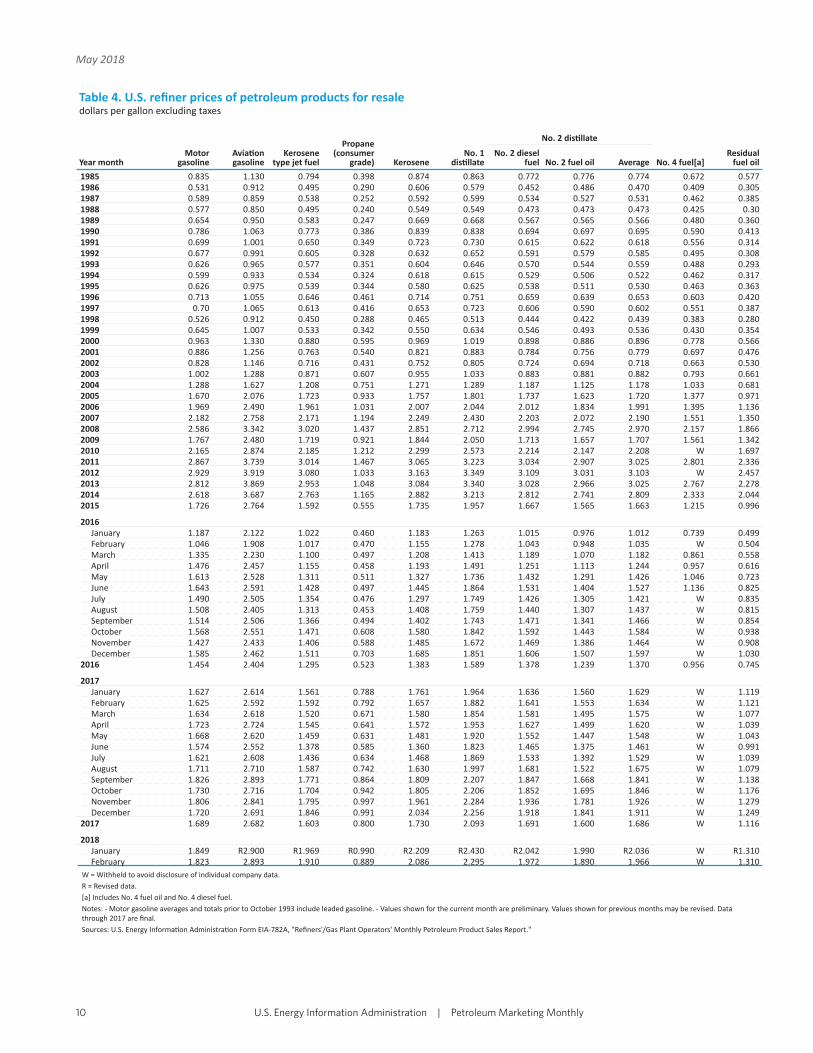
Table 4. U.S. refi ner prices of petroleum products for resaledollars per gallon excluding taxes
Year monthMotor
gasolineAvia on gasoline
Kerosene type jet fuel
Propane (consumer
grade) KeroseneNo. 1
dis llate
No. 2 dis llate
No. 4 fuel[a]Residual
fuel oilNo. 2 diesel
fuel No. 2 fuel oil Average
1985 0.835 1.130 0.794 0.398 0.874 0.863 0.772 0.776 0.774 0.672 0.5771986 0.531 0.912 0.495 0.290 0.606 0.579 0.452 0.486 0.470 0.409 0.3051987 0.589 0.859 0.538 0.252 0.592 0.599 0.534 0.527 0.531 0.462 0.3851988 0.577 0.850 0.495 0.240 0.549 0.549 0.473 0.473 0.473 0.425 0.301989 0.654 0.950 0.583 0.247 0.669 0.668 0.567 0.565 0.566 0.480 0.3601990 0.786 1.063 0.773 0.386 0.839 0.838 0.694 0.697 0.695 0.590 0.4131991 0.699 1.001 0.650 0.349 0.723 0.730 0.615 0.622 0.618 0.556 0.3141992 0.677 0.991 0.605 0.328 0.632 0.652 0.591 0.579 0.585 0.495 0.3081993 0.626 0.965 0.577 0.351 0.604 0.646 0.570 0.544 0.559 0.488 0.2931994 0.599 0.933 0.534 0.324 0.618 0.615 0.529 0.506 0.522 0.462 0.3171995 0.626 0.975 0.539 0.344 0.580 0.625 0.538 0.511 0.530 0.463 0.3631996 0.713 1.055 0.646 0.461 0.714 0.751 0.659 0.639 0.653 0.603 0.4201997 0.70 1.065 0.613 0.416 0.653 0.723 0.606 0.590 0.602 0.551 0.3871998 0.526 0.912 0.450 0.288 0.465 0.513 0.444 0.422 0.439 0.383 0.2801999 0.645 1.007 0.533 0.342 0.550 0.634 0.546 0.493 0.536 0.430 0.3542000 0.963 1.330 0.880 0.595 0.969 1.019 0.898 0.886 0.896 0.778 0.5662001 0.886 1.256 0.763 0.540 0.821 0.883 0.784 0.756 0.779 0.697 0.4762002 0.828 1.146 0.716 0.431 0.752 0.805 0.724 0.694 0.718 0.663 0.5302003 1.002 1.288 0.871 0.607 0.955 1.033 0.883 0.881 0.882 0.793 0.6612004 1.288 1.627 1.208 0.751 1.271 1.289 1.187 1.125 1.178 1.033 0.6812005 1.670 2.076 1.723 0.933 1.757 1.801 1.737 1.623 1.720 1.377 0.9712006 1.969 2.490 1.961 1.031 2.007 2.044 2.012 1.834 1.991 1.395 1.1362007 2.182 2.758 2.171 1.194 2.249 2.430 2.203 2.072 2.190 1.551 1.3502008 2.586 3.342 3.020 1.437 2.851 2.712 2.994 2.745 2.970 2.157 1.8662009 1.767 2.480 1.719 0.921 1.844 2.050 1.713 1.657 1.707 1.561 1.3422010 2.165 2.874 2.185 1.212 2.299 2.573 2.214 2.147 2.208 W 1.6972011 2.867 3.739 3.014 1.467 3.065 3.223 3.034 2.907 3.025 2.801 2.3362012 2.929 3.919 3.080 1.033 3.163 3.349 3.109 3.031 3.103 W 2.4572013 2.812 3.869 2.953 1.048 3.084 3.340 3.028 2.966 3.025 2.767 2.2782014 2.618 3.687 2.763 1.165 2.882 3.213 2.812 2.741 2.809 2.333 2.0442015 1.726 2.764 1.592 0.555 1.735 1.957 1.667 1.565 1.663 1.215 0.996
2016January 1.187 2.122 1.022 0.460 1.183 1.263 1.015 0.976 1.012 0.739 0.499February 1.046 1.908 1.017 0.470 1.155 1.278 1.043 0.948 1.035 W 0.504March 1.335 2.230 1.100 0.497 1.208 1.413 1.189 1.070 1.182 0.861 0.558April 1.476 2.457 1.155 0.458 1.193 1.491 1.251 1.113 1.244 0.957 0.616May 1.613 2.528 1.311 0.511 1.327 1.736 1.432 1.291 1.426 1.046 0.723June 1.643 2.591 1.428 0.497 1.445 1.864 1.531 1.404 1.527 1.136 0.825July 1.490 2.505 1.354 0.476 1.297 1.749 1.426 1.305 1.421 W 0.835August 1.508 2.405 1.313 0.453 1.408 1.759 1.440 1.307 1.437 W 0.815September 1.514 2.506 1.366 0.494 1.402 1.743 1.471 1.341 1.466 W 0.854October 1.568 2.551 1.471 0.608 1.580 1.842 1.592 1.443 1.584 W 0.938November 1.427 2.433 1.406 0.588 1.485 1.672 1.469 1.386 1.464 W 0.908December 1.585 2.462 1.511 0.703 1.685 1.851 1.606 1.507 1.597 W 1.030
2016 1.454 2.404 1.295 0.523 1.383 1.589 1.378 1.239 1.370 0.956 0.745
2017January 1.627 2.614 1.561 0.788 1.761 1.964 1.636 1.560 1.629 W 1.119February 1.625 2.592 1.592 0.792 1.657 1.882 1.641 1.553 1.634 W 1.121March 1.634 2.618 1.520 0.671 1.580 1.854 1.581 1.495 1.575 W 1.077April 1.723 2.724 1.545 0.641 1.572 1.953 1.627 1.499 1.620 W 1.039May 1.668 2.620 1.459 0.631 1.481 1.920 1.552 1.447 1.548 W 1.043June 1.574 2.552 1.378 0.585 1.360 1.823 1.465 1.375 1.461 W 0.991July 1.621 2.608 1.436 0.634 1.468 1.869 1.533 1.392 1.529 W 1.039August 1.711 2.710 1.587 0.742 1.630 1.997 1.681 1.522 1.675 W 1.079September 1.826 2.893 1.771 0.864 1.809 2.207 1.847 1.668 1.841 W 1.138October 1.730 2.716 1.704 0.942 1.805 2.206 1.852 1.695 1.846 W 1.176November 1.806 2.841 1.795 0.997 1.961 2.284 1.936 1.781 1.926 W 1.279December 1.720 2.691 1.846 0.991 2.034 2.256 1.918 1.841 1.911 W 1.249
2017 1.689 2.682 1.603 0.800 1.730 2.093 1.691 1.600 1.686 W 1.116
2018January 1.849 R2.900 R1.969 R0.990 R2.209 R2.430 R2.042 1.990 R2.036 W R1.310February 1.823 2.893 1.910 0.889 2.086 2.295 1.972 1.890 1.966 W 1.310
W = Withheld to avoid disclosure of individual company data.R = Revised data.[a] Includes No. 4 fuel oil and No. 4 diesel fuel.Notes: - Motor gasoline averages and totals prior to October 1993 include leaded gasoline. - Values shown for the current month are preliminary. Values shown for previous months may be revised. Data through 2017 are fi nal.Sources: U.S. Energy Informa on Administra on Form EIA-782A, "Refi ners'/Gas Plant Operators' Monthly Petroleum Product Sales Report."
U.S. Energy Information Administration�|�Petroleum Marketing Monthly10
May 2018

Figure 4. U.S. Refi ner wholesale petroleum product prices
Source: U.S. Energy Information Administration, Form EIA-782A, “Refi ners’/Gas Plant Operators’ Monthly Petroleum Product
Sales Report.”
Soooururururcececec : U.U S.S EEEEEEnergy yyyyy InI fof rmrrrr attioiooooon AdAdddddmiiniiststssss ratitionoooo , FoFoorm EEIAIAAAAA-778282222A,A ““ReReRRRR fi fineeeeers’/’///GaGaaaas PlPlanaaaaa t t OpOppppperattoroooo s’’ MMMMMMonththlylllll Petroleum Product
Sales Reportr .”
U.S. Energy Information Administration�|�Petroleum Marketing Monthly 11
May 2018

Table 5. U.S. refi ner volumes of petroleum sales for resalemillion gallons per day
Year monthMotor
gasolineAvia on gasoline
Kerosene type jet fuel
Propane (consumer
grade) KeroseneNo. 1
dis llate
No. 2 dis llate
No. 4 fuel[a]Residual
fuel oilNo. 2 diesel
fuel No. 2 fuel oil Average
1985 256.9 0.7 7.6 29.2 2.4 2.7 43.3 53.9 97.3 1.2 19.91986 257.2 0.7 9.2 26.3 2.4 2.5 46.4 53.8 100.3 1.2 18.61987 257.2 0.8 10.1 27.0 2.3 2.0 44.3 49.3 93.6 1.5 16.91988 263.7 0.7 10.0 27.7 2.7 2.6 47.8 50.1 97.9 1.2 18.91989 260.7 0.7 8.6 25.9 2.7 2.7 50.7 46.7 97.5 1.2 21.01990 264.8 0.7 8.8 25.5 2.2 2.4 51.9 45.9 97.8 0.8 17.91991 261.3 0.7 8.7 25.4 2.1 2.4 51.5 46.9 98.3 0.4 17.81992 265.4 0.7 8.0 26.7 2.2 2.3 50.8 48.9 99.7 0.4 15.21993 266.9 0.6 8.3 27.9 2.3 2.3 58.0 43.6 101.7 0.4 12.61994 276.7 0.7 9.1 28.4 2.5 1.9 72.4 32.9 105.3 0.4 12.81995 288.8 0.6 9.9 30.6 2.4 1.7 75.9 31.0 106.9 0.3 13.61996 293.6 0.6 11.5 32.9 2.7 1.8 83.7 33.1 116.8 0.3 13.81997 292.7 0.6 11.3 32.2 2.5 1.6 88.7 31.2 119.9 0.2 11.51998 300.4 0.6 12.2 32.7 2.2 1.4 91.9 27.3 119.2 0.1 15.41999 306.9 0.7 15.2 33.6 2.4 1.7 95.5 24.3 119.9 0.2 11.52000 304.4 0.6 15.7 34.8 2.3 1.5 98.8 23.3 122.1 0.2 10.52001 305.2 0.6 14.3 35.0 2.2 1.4 101.3 25.2 126.4 0.1 10.32002 311.8 0.6 12.1 32.9 2.0 1.3 100.8 23.6 124.4 0.1 8.82003 311.6 0.5 12.2 36.5 2.3 1.2 108.9 20.9 129.8 0.1 6.72004 316.4 0.6 12.7 40.3 2.1 1.3 116.5 19.6 136.1 NA 5.92005 321.8 0.5 15.2 35.1 2.0 1.4 118.7 20.6 139.3 NA 4.72006 315.6 0.5 15.2 39.4 1.4 1.3 123.2 16.7 139.9 0.3 6.52007 319.8 0.5 16.6 41.7 1.4 0.9 135.3 14.5 149.8 0.3 8.22008 306.4 0.4 16.5 34.2 1.0 1.0 138.7 14.9 153.6 0.2 9.52009 307.4 0.4 15.2 31.8 1.3 1.0 128.0 15.1 143.1 0.1 9.82010 312.0 0.4 20.3 28.3 1.4 0.9 135.5 11.5 147.0 W 10.72011 296.3 0.4 23.0 28.6 1.2 1.0 134.6 10.7 145.3 0.1 12.22012 294.7 0.4 23.5 27.6 1.2 0.8 136.9 10.7 147.6 W 8.82013 291.0 0.4 26.4 34.9 1.3 1.0 142.9 7.7 150.6 0.1 9.02014 289.2 0.4 27.5 32.9 1.4 1.4 146.3 7.0 153.3 0.1 8.02015 298.7 0.4 28.6 31.6 1.2 1.2 146.5 6.7 153.2 0.2 8.1
2016January 285.3 0.3 29.3 45.5 1.6 2.4 130.5 12.3 142.8 0.2 9.3February 295.0 0.4 28.6 43.8 1.5 1.7 132.9 12.8 145.7 W 9.3March 303.8 0.4 28.5 29.1 0.6 0.7 137.7 8.5 146.2 0.2 9.2April 302.5 0.6 28.2 26.1 0.8 0.3 137.4 7.7 145.1 0.2 9.0May 305.8 0.4 29.7 27.4 0.9 0.1 137.5 6.8 144.3 0.1 9.9June 314.9 0.5 30.9 25.5 0.7 0.1 138.6 4.8 143.4 0.1 8.9July 315.9 0.5 31.2 24.1 0.9 0.1 131.3 4.9 136.3 W 7.6August 314.8 0.6 31.8 29.2 1.5 0.2 142.3 3.8 146.1 W 8.1September 307.8 0.4 32.0 28.4 1.0 0.5 142.8 6.0 148.8 W 7.9October 301.9 0.4 30.9 33.1 1.2 1.0 144.3 8.2 152.4 W 7.1November 299.6 0.4 30.4 35.4 1.4 1.7 142.9 9.1 151.9 W 7.2December 298.5 0.4 32.3 41.2 1.9 3.2 141.0 14.4 155.4 W 7.6
2016 303.8 0.4 30.3 32.4 1.2 1.0 138.3 8.2 146.5 0.1 8.4
2017January 277.9 0.3 30.2 38.5 1.4 2.5 129.6 13.7 143.4 W 6.6February 289.7 0.4 32.8 37.3 1.3 1.8 134.3 11.3 145.6 W 6.2March 297.2 0.4 31.8 28.0 0.7 0.9 138.0 9.6 147.5 W 5.9April 302.9 0.4 40.2 23.3 0.7 0.2 139.3 8.0 147.3 W 6.2May 306.0 0.4 40.2 20.0 0.8 0.1 152.1 5.5 157.6 W 5.9June 309.7 0.6 40.2 21.5 0.6 0.1 156.7 6.8 163.5 W 8.2July 304.0 0.5 39.7 20.0 0.7 0.1 146.1 4.2 150.3 W 6.3August 314.9 0.5 40.2 24.7 0.7 0.2 151.2 5.4 156.6 W 8.4September 302.5 0.5 39.6 27.2 0.8 0.3 150.2 5.5 155.6 W 7.8October 305.9 0.5 39.4 30.4 1.0 1.0 159.1 6.9 166.0 W 8.4November 304.8 0.4 38.5 36.7 1.3 2.3 153.5 10.7 164.2 W 7.2December 302.2 0.5 43.6 39.7 1.6 2.8 147.1 14.5 161.6 W 8.1
2017 301.5 0.4 38.1 28.9 1.0 1.0 146.5 8.5 155.0 W 7.1
2018January 283.1 0.3 R41.1 46.8 R2.3 3.2 R145.8 17.5 R163.4 W 8.9February 296.0 0.3 41.2 39.5 1.5 2.5 144.5 12.0 156.5 W 7.5
NA = Not available.W = Withheld to avoid disclosure of individual company data.R = Revised data.[a] Includes No. 4 fuel oil and No. 4 diesel fuel.Notes: - Motor gasoline averages and totals prior to October 1993 include leaded gasoline. - Values shown for the current month are preliminary. Values shown for previous months are revised. Data through 2017 are fi nal. Totals may not equal the sum of the components due to rounding.Sources: U.S. Energy Informa on Administra on Form EIA-782A, "Refi ners'/Gas Plant Operators' Monthly Petroleum Product Sales Report."
U.S. Energy Information Administration�|�Petroleum Marketing Monthly12
May 2018
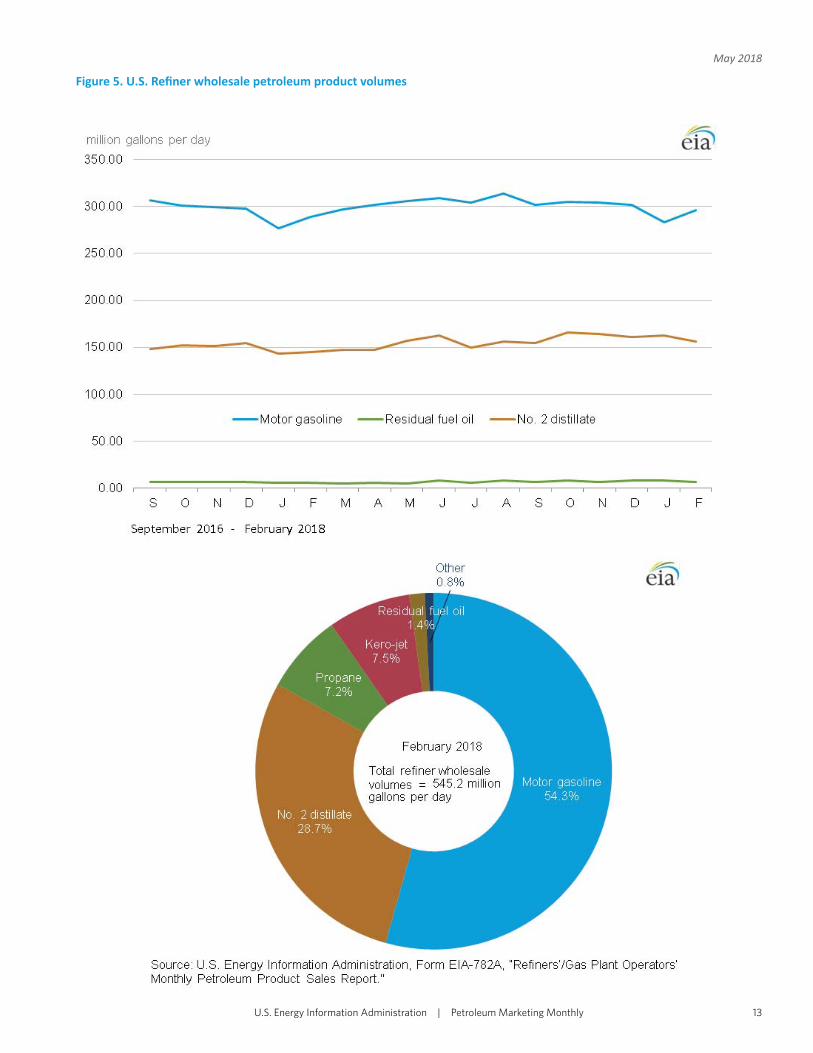
Figure 5. U.S. Refi ner wholesale petroleum product volumes
U.S. Energy Information Administration�|�Petroleum Marketing Monthly 13
May 2018

Table 6. U.S. refi ner motor gasoline prices by grade and sales typedollars per gallon excluding taxes
Year month
Regular Midgrade
Sales to end users Sales for resale Sales to end users Sales for resale
Through retail
outlets Average[a] DTW Rack Bulk Average
Through retail
outlets Average[a] DTW Rack Bulk Average
1985 0.925 0.917 - - - 0.843 - - - - - -1986 0.624 0.616 - - - 0.522 - - - - - -1987 0.659 0.650 - - - 0.569 - - - - - -1988 0.649 0.641 - - - 0.548 - - - - - -1989 0.720 0.714 - - - 0.618 0.796 0.793 - - - 0.6861990 0.853 0.849 - - - 0.758 0.923 0.921 - - - 0.8141991 0.764 0.761 - - - 0.672 0.847 0.843 - - - 0.7331992 0.746 0.743 - - - 0.645 0.831 0.827 - - - 0.7081993 0.716 0.712 - - - 0.593 0.810 0.805 - - - 0.6601994 0.695 0.689 0.646 0.547 0.502 0.566 0.791 0.785 0.704 0.584 NA 0.6381995 0.723 0.717 0.682 0.576 0.534 0.593 0.813 0.808 0.737 0.619 NA 0.6701996 0.812 0.807 0.770 0.672 0.622 0.685 0.901 0.896 0.824 0.709 NA 0.7591997 0.803 0.798 0.764 0.656 0.615 0.673 0.898 0.895 0.822 0.694 0.711 0.7491998 0.634 0.630 0.596 0.481 0.449 0.499 0.731 0.728 0.655 0.521 NA 0.5761999 0.747 0.742 0.730 0.605 0.542 0.620 0.838 0.835 0.784 0.639 NA 0.6962000 1.077 1.073 1.042 0.927 0.873 0.942 1.171 1.168 1.099 0.960 - 1.0132001 1 0.997 0.977 0.848 0.786 0.865 1.103 1.10 1.042 0.888 - 0.9452002 0.915 0.912 0.886 0.801 0.735 0.806 1.013 1.010 0.968 0.839 - 0.8852003 1.127 1.123 1.134 0.965 0.888 0.981 1.222 1.218 1.196 1.004 - 1.0612004 1.407 1.404 1.414 1.257 1.182 1.269 1.503 1.499 1.469 1.296 - 1.3402005 1.805 1.802 1.765 1.653 1.568 1.654 1.896 1.893 1.821 1.681 - 1.7082006 2.102 2.099 2.082 1.944 1.866 1.950 2.216 2.213 2.157 1.987 - 2.0162007 2.318 2.315 2.278 2.161 2.074 2.161 2.440 2.438 2.351 2.226 - 2.2452008 2.752 2.748 2.702 2.558 2.525 2.570 2.880 2.879 2.775 2.588 - 2.6102009 1.860 1.856 1.866 1.744 1.668 1.747 1.998 1.997 1.957 1.762 - 1.7842010 2.275 2.270 2.261 2.144 2.073 2.146 2.416 2.416 2.357 2.168 - 2.1852011 3.028 3.021 2.961 2.846 2.762 2.847 3.165 3.165 3.057 2.880 - 2.8932012 3.132 3.118 3.086 2.892 2.836 2.904 3.291 3.290 3.194 2.906 - 2.9252013 3.029 3.010 2.907 2.769 2.747 2.779 3.200 3.199 3.038 2.862 - 2.8762014 2.832 2.811 2.767 2.574 2.520 2.584 3.031 3.030 2.903 2.716 - 2.7382015 1.939 1.938 2.105 1.654 1.604 1.681 2.225 2.224 2.252 1.824 - 1.872
2016January 1.426 1.426 1.648 1.101 1.148 1.142 1.760 1.759 1.794 1.257 - 1.321February 1.257 1.256 1.351 0.977 0.985 1.003 1.555 1.554 1.499 1.118 - 1.165March 1.487 1.485 1.638 1.273 1.198 1.291 1.745 1.744 1.808 1.441 - 1.486April 1.658 1.656 1.757 1.412 1.336 1.431 1.927 1.926 1.886 1.574 - 1.612May 1.806 1.806 1.805 1.559 1.455 1.568 2.047 2.046 1.928 1.716 - 1.741June 1.901 1.900 1.866 1.585 1.513 1.598 2.123 2.121 1.996 1.749 - 1.776July 1.729 1.729 1.781 1.421 1.411 1.444 2.025 2.024 1.893 1.592 - 1.627August 1.687 1.687 1.643 1.458 1.390 1.465 1.945 1.944 1.781 1.619 - 1.637September 1.716 1.716 1.759 1.449 1.438 1.469 1.996 1.995 1.895 1.617 - 1.650October 1.748 1.748 1.791 1.505 1.478 1.523 2.027 2.027 1.935 1.676 - 1.706November 1.685 1.684 1.673 1.361 1.393 1.384 1.987 1.985 1.797 1.521 - 1.552December 1.784 1.783 1.687 1.541 1.473 1.547 2.032 2.031 1.831 1.685 - 1.702
2016 1.661 1.660 1.701 1.392 1.354 1.410 1.935 1.934 1.839 1.552 - 1.586
2017January 1.831 1.830 1.822 1.571 1.583 1.588 2.112 2.111 1.950 1.730 - 1.757February 1.785 1.785 1.897 1.560 1.567 1.583 2.103 2.101 2.056 1.729 - 1.769March 1.826 1.826 1.964 1.562 1.563 1.590 2.146 2.144 2.105 1.735 - 1.780April 1.925 1.924 2.002 1.660 1.616 1.680 2.210 2.206 2.148 1.831 - 1.868May 1.886 1.885 2.005 1.596 1.557 1.620 2.194 2.192 2.143 1.774 - 1.815June 1.829 1.828 1.920 1.500 1.506 1.528 2.143 2.142 2.033 1.677 - 1.715July 1.795 1.794 1.869 1.557 1.518 1.576 2.090 2.089 2.009 1.727 - 1.757August 1.879 1.877 1.962 1.648 1.608 1.666 2.175 2.173 2.105 1.822 - 1.852September 2.082 2.080 2.094 1.763 1.707 1.781 2.386 2.382 2.200 1.948 - 1.977October 1.970 1.968 1.979 1.670 1.660 1.689 2.270 2.268 2.112 1.835 - 1.868November 2.054 2.052 2.037 1.748 1.761 1.767 2.345 2.342 2.170 1.905 - 1.935December 1.964 1.963 1.931 1.662 1.710 1.683 2.258 2.256 2.067 1.813 - 1.844
2017 1.903 1.902 1.957 1.625 1.622 1.647 2.202 2.200 2.090 1.791 - 1.826
2018January 2.039 2.037 2.066 1.791 R1.803 1.810 R2.330 R2.328 2.227 1.953 - 1.986February 2.049 2.047 2.153 1.750 1.837 1.782 2.389 2.386 2.302 1.925 - 1.970
See footnotes at end of table.
U.S. Energy Information Administration�|�Petroleum Marketing Monthly14
May 2018

Table 6. U.S. refi ner motor gasoline prices by grade and sales type (cont.)dollars per gallon excluding taxes
Year month
Premium All grades
Sales to end users Sales for resale Sales to end users Sales for resale
Through retail
outlets Average[a] DTW Rack Bulk Average
Through retail
outlets Average[a] DTW Rack Bulk Average
1985 1.030 1.023 - - - 0.922 0.921 0.912 - - - 0.8351986 0.748 0.737 - - - 0.610 0.632 0.624 - - - 0.5311987 0.790 0.784 - - - 0.671 0.678 0.669 - - - 0.5891988 0.794 0.788 - - - 0.672 0.681 0.673 - - - 0.5771989 0.874 0.868 - - - 0.749 0.763 0.756 - - - 0.6541990 0.990 0.985 - - - 0.874 0.888 0.883 - - - 0.7861991 0.912 0.907 - - - 0.792 0.80 0.797 - - - 0.6991992 0.920 0.914 - - - 0.774 0.792 0.787 - - - 0.6771993 0.896 0.889 - - - 0.722 0.765 0.759 - - - 0.6261994 0.873 0.865 0.787 0.640 0.556 0.695 0.744 0.738 0.693 0.567 0.509 0.5991995 0.897 0.890 0.822 0.673 0.583 0.722 0.771 0.765 0.729 0.598 0.540 0.6261996 0.979 0.972 0.897 0.762 0.669 0.803 0.853 0.847 0.809 0.690 0.627 0.7131997 0.979 0.973 0.895 0.749 0.658 0.792 0.844 0.839 0.803 0.674 0.620 0.701998 0.811 0.805 0.726 0.573 0.489 0.617 0.678 0.673 0.636 0.50 0.454 0.5261999 0.912 0.906 0.851 0.687 0.585 0.726 0.785 0.781 0.765 0.621 0.549 0.6452000 1.250 1.242 1.174 1.017 0.927 1.055 1.111 1.106 1.074 0.940 0.879 0.9632001 1.181 1.175 1.112 0.936 0.830 0.980 1.035 1.032 1.009 0.862 0.791 0.8862002 1.094 1.088 1.030 0.899 0.80 0.928 0.949 0.947 0.922 0.816 0.741 0.8282003 1.312 1.305 1.269 1.064 0.955 1.113 1.160 1.156 1.164 0.978 0.893 1.0022004 1.603 1.596 1.553 1.361 1.274 1.408 1.439 1.435 1.442 1.270 1.187 1.2882005 2 1.992 1.901 1.760 1.696 1.789 1.833 1.829 1.791 1.664 1.576 1.6702006 2.326 2.320 2.231 2.093 1.988 2.117 2.131 2.128 2.110 1.959 1.873 1.9692007 2.558 2.552 2.460 2.339 2.209 2.357 2.349 2.345 2.311 2.180 2.080 2.1822008 2.971 2.965 2.846 2.718 2.689 2.746 2.778 2.775 2.726 2.572 2.532 2.5862009 2.128 2.122 2.059 1.941 1.816 1.958 1.892 1.888 1.899 1.761 1.675 1.7672010 2.543 2.536 2.446 2.334 2.187 2.346 2.306 2.301 2.293 2.162 2.078 2.1652011 3.291 3.283 3.139 3.047 2.873 3.049 3.058 3.050 2.990 2.864 2.769 2.8672012 3.413 3.400 3.273 3.149 3.102 3.163 3.168 3.154 3.117 2.916 2.861 2.9292013 3.320 3.307 3.108 3.076 3.010 3.075 3.068 3.049 2.942 2.801 2.774 2.8122014 3.152 3.138 2.941 2.878 2.783 2.880 2.876 2.855 2.800 2.606 2.548 2.6182015 2.392 2.386 2.312 2.035 1.845 2.061 2.006 2.003 2.148 1.696 1.627 1.726
2016January 1.963 1.958 1.873 1.473 1.309 1.519 1.506 1.505 1.696 1.143 1.164 1.187February 1.760 1.757 1.578 1.322 1.140 1.346 1.333 1.332 1.402 1.016 1.005 1.046March 1.938 1.935 1.892 1.633 1.421 1.656 1.554 1.552 1.694 1.314 1.218 1.335April 2.121 2.119 1.999 1.779 1.526 1.788 1.727 1.725 1.809 1.454 1.366 1.476May 2.242 2.240 2.043 1.928 1.658 1.925 1.871 1.869 1.857 1.602 1.479 1.613June 2.319 2.316 2.109 1.956 1.753 1.962 1.962 1.961 1.919 1.628 1.540 1.643July 2.225 2.223 2.005 1.788 1.576 1.801 1.804 1.804 1.831 1.467 1.428 1.490August 2.143 2.141 1.878 1.813 1.575 1.810 1.755 1.754 1.696 1.501 1.404 1.508September 2.192 2.189 1.999 1.827 1.592 1.836 1.789 1.788 1.813 1.493 1.454 1.514October 2.237 2.234 2.036 1.884 1.669 1.892 1.819 1.819 1.846 1.548 1.501 1.568November 2.199 2.196 1.903 1.729 1.539 1.744 1.760 1.759 1.724 1.403 1.406 1.427December 2.242 2.240 1.937 1.871 1.615 1.861 1.850 1.849 1.743 1.578 1.492 1.585
2016 2.134 2.132 1.939 1.757 1.535 1.767 1.731 1.730 1.754 1.434 1.374 1.454
2017January 2.323 2.320 2.065 1.908 1.761 1.922 1.902 1.900 1.876 1.607 1.601 1.627February 2.322 2.318 2.162 1.908 1.793 1.940 1.863 1.862 1.956 1.598 1.584 1.625March 2.365 2.362 2.213 1.921 1.756 1.953 1.905 1.904 2.019 1.602 1.589 1.634April 2.423 2.421 2.249 2.015 1.821 2.036 1.998 1.997 2.058 1.701 1.636 1.723May 2.411 2.408 2.257 1.963 1.777 1.994 1.964 1.963 2.062 1.639 1.578 1.668June 2.361 2.358 2.149 1.860 1.730 1.892 1.908 1.906 1.971 1.543 1.533 1.574July 2.304 2.300 2.116 1.912 1.757 1.934 1.872 1.871 1.925 1.599 1.544 1.621August 2.387 2.382 2.216 2.008 1.845 2.028 1.954 1.952 2.019 1.691 1.633 1.711September 2.593 2.589 2.335 2.129 2.038 2.152 2.157 2.154 2.147 1.805 1.737 1.826October 2.479 2.475 2.225 2.009 1.862 2.031 2.044 2.042 2.034 1.708 1.681 1.730November 2.558 2.554 2.285 2.070 1.902 2.086 2.125 2.122 2.091 1.784 1.778 1.806December 2.474 2.470 2.167 1.976 1.819 1.990 2.036 2.034 1.984 1.697 1.724 1.720
2017 2.416 2.413 2.204 1.973 1.825 1.997 1.978 1.976 2.013 1.665 1.644 1.689
2018January R2.552 R2.547 2.328 R2.115 R1.992 2.136 2.111 2.108 2.125 1.827 R1.824 1.849February 2.619 2.614 2.413 2.087 1.982 2.126 2.130 2.127 2.211 1.787 1.851 1.823
NA = Not available.- = No data reported.R = Revised data.[a] Includes sales through retail outlets as well as all direct sales to end users that were not made through company-operated retail outlets, e.g., sales to agricultural customers, commercial sales, and industrial sales.Notes: - Motor gasoline averages and totals prior to October 1993 include leaded gasoline. Includes sales through retail outlets as well as all direct sales to end users that were not made through company-operated retail outlets, e.g., sales to agricultural customers, commercial sales, and industrial sales. - Data for the 4th quarter of 1993 were derived from two separate survey systems. The DTW, Rack, and Bulk components were derived from the revised EIA-782 survey system, while the End-Use and Average Resale categories were derived from the predecessor EIA-782 survey system. Therefore, the DTW, Rack, and Bulk components are not consistent with the Average Resale category. Beginning January 1994, all data are from the revised EIA-782 survey system and are consistent. - Values shown for the current month are preliminary. Values shown for previous months may be revised. Data through 2017 are fi nal.Sources: U.S. Energy Informa on Administra on Form EIA-782A, "Refi ners'/Gas Plant Operators' Monthly Petroleum Product Sales Report."
U.S. Energy Information Administration�|�Petroleum Marketing Monthly 15
May 2018
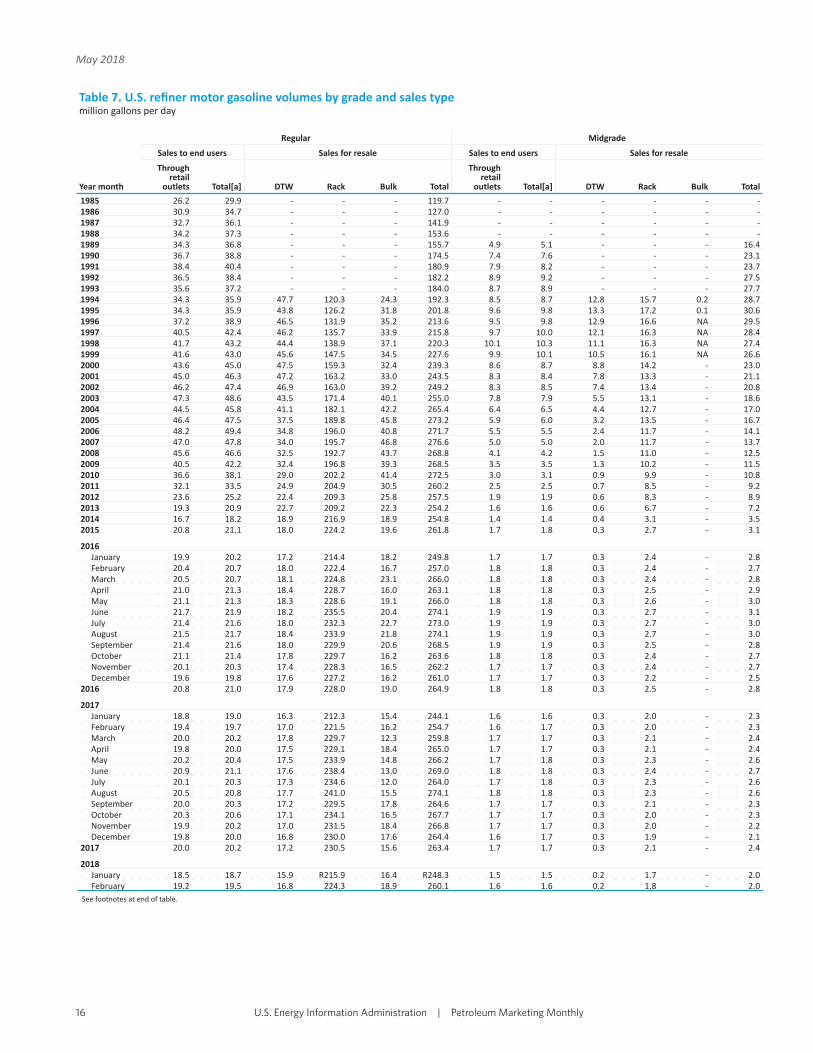
Table 7. U.S. refi ner motor gasoline volumes by grade and sales typemillion gallons per day
Year month
Regular Midgrade
Sales to end users Sales for resale Sales to end users Sales for resale
Through retail
outlets Total[a] DTW Rack Bulk Total
Through retail
outlets Total[a] DTW Rack Bulk Total
1985 26.2 29.9 - - - 119.7 - - - - - -1986 30.9 34.7 - - - 127.0 - - - - - -1987 32.7 36.1 - - - 141.9 - - - - - -1988 34.2 37.3 - - - 153.6 - - - - - -1989 34.3 36.8 - - - 155.7 4.9 5.1 - - - 16.41990 36.7 38.8 - - - 174.5 7.4 7.6 - - - 23.11991 38.4 40.4 - - - 180.9 7.9 8.2 - - - 23.71992 36.5 38.4 - - - 182.2 8.9 9.2 - - - 27.51993 35.6 37.2 - - - 184.0 8.7 8.9 - - - 27.71994 34.3 35.9 47.7 120.3 24.3 192.3 8.5 8.7 12.8 15.7 0.2 28.71995 34.3 35.9 43.8 126.2 31.8 201.8 9.6 9.8 13.3 17.2 0.1 30.61996 37.2 38.9 46.5 131.9 35.2 213.6 9.5 9.8 12.9 16.6 NA 29.51997 40.5 42.4 46.2 135.7 33.9 215.8 9.7 10.0 12.1 16.3 NA 28.41998 41.7 43.2 44.4 138.9 37.1 220.3 10.1 10.3 11.1 16.3 NA 27.41999 41.6 43.0 45.6 147.5 34.5 227.6 9.9 10.1 10.5 16.1 NA 26.62000 43.6 45.0 47.5 159.3 32.4 239.3 8.6 8.7 8.8 14.2 - 23.02001 45.0 46.3 47.2 163.2 33.0 243.5 8.3 8.4 7.8 13.3 - 21.12002 46.2 47.4 46.9 163.0 39.2 249.2 8.3 8.5 7.4 13.4 - 20.82003 47.3 48.6 43.5 171.4 40.1 255.0 7.8 7.9 5.5 13.1 - 18.62004 44.5 45.8 41.1 182.1 42.2 265.4 6.4 6.5 4.4 12.7 - 17.02005 46.4 47.5 37.5 189.8 45.8 273.2 5.9 6.0 3.2 13.5 - 16.72006 48.2 49.4 34.8 196.0 40.8 271.7 5.5 5.5 2.4 11.7 - 14.12007 47.0 47.8 34.0 195.7 46.8 276.6 5.0 5.0 2.0 11.7 - 13.72008 45.6 46.6 32.5 192.7 43.7 268.8 4.1 4.2 1.5 11.0 - 12.52009 40.5 42.2 32.4 196.8 39.3 268.5 3.5 3.5 1.3 10.2 - 11.52010 36.6 38.1 29.0 202.2 41.4 272.5 3.0 3.1 0.9 9.9 - 10.82011 32.1 33.5 24.9 204.9 30.5 260.2 2.5 2.5 0.7 8.5 - 9.22012 23.6 25.2 22.4 209.3 25.8 257.5 1.9 1.9 0.6 8.3 - 8.92013 19.3 20.9 22.7 209.2 22.3 254.2 1.6 1.6 0.6 6.7 - 7.22014 16.7 18.2 18.9 216.9 18.9 254.8 1.4 1.4 0.4 3.1 - 3.52015 20.8 21.1 18.0 224.2 19.6 261.8 1.7 1.8 0.3 2.7 - 3.1
2016January 19.9 20.2 17.2 214.4 18.2 249.8 1.7 1.7 0.3 2.4 - 2.8February 20.4 20.7 18.0 222.4 16.7 257.0 1.8 1.8 0.3 2.4 - 2.7March 20.5 20.7 18.1 224.8 23.1 266.0 1.8 1.8 0.3 2.4 - 2.8April 21.0 21.3 18.4 228.7 16.0 263.1 1.8 1.8 0.3 2.5 - 2.9May 21.1 21.3 18.3 228.6 19.1 266.0 1.8 1.8 0.3 2.6 - 3.0June 21.7 21.9 18.2 235.5 20.4 274.1 1.9 1.9 0.3 2.7 - 3.1July 21.4 21.6 18.0 232.3 22.7 273.0 1.9 1.9 0.3 2.7 - 3.0August 21.5 21.7 18.4 233.9 21.8 274.1 1.9 1.9 0.3 2.7 - 3.0September 21.4 21.6 18.0 229.9 20.6 268.5 1.9 1.9 0.3 2.5 - 2.8October 21.1 21.4 17.8 229.7 16.2 263.6 1.8 1.8 0.3 2.4 - 2.7November 20.1 20.3 17.4 228.3 16.5 262.2 1.7 1.7 0.3 2.4 - 2.7December 19.6 19.8 17.6 227.2 16.2 261.0 1.7 1.7 0.3 2.2 - 2.5
2016 20.8 21.0 17.9 228.0 19.0 264.9 1.8 1.8 0.3 2.5 - 2.8
2017January 18.8 19.0 16.3 212.3 15.4 244.1 1.6 1.6 0.3 2.0 - 2.3February 19.4 19.7 17.0 221.5 16.2 254.7 1.6 1.7 0.3 2.0 - 2.3March 20.0 20.2 17.8 229.7 12.3 259.8 1.7 1.7 0.3 2.1 - 2.4April 19.8 20.0 17.5 229.1 18.4 265.0 1.7 1.7 0.3 2.1 - 2.4May 20.2 20.4 17.5 233.9 14.8 266.2 1.7 1.8 0.3 2.3 - 2.6June 20.9 21.1 17.6 238.4 13.0 269.0 1.8 1.8 0.3 2.4 - 2.7July 20.1 20.3 17.3 234.6 12.0 264.0 1.7 1.8 0.3 2.3 - 2.6August 20.5 20.8 17.7 241.0 15.5 274.1 1.8 1.8 0.3 2.3 - 2.6September 20.0 20.3 17.2 229.5 17.8 264.6 1.7 1.7 0.3 2.1 - 2.3October 20.3 20.6 17.1 234.1 16.5 267.7 1.7 1.7 0.3 2.0 - 2.3November 19.9 20.2 17.0 231.5 18.4 266.8 1.7 1.7 0.3 2.0 - 2.2December 19.8 20.0 16.8 230.0 17.6 264.4 1.6 1.7 0.3 1.9 - 2.1
2017 20.0 20.2 17.2 230.5 15.6 263.4 1.7 1.7 0.3 2.1 - 2.4
2018January 18.5 18.7 15.9 R215.9 16.4 R248.3 1.5 1.5 0.2 1.7 - 2.0February 19.2 19.5 16.8 224.3 18.9 260.1 1.6 1.6 0.2 1.8 - 2.0
See footnotes at end of table.
U.S. Energy Information Administration�|�Petroleum Marketing Monthly16
May 2018

Table 7. U.S. refi ner motor gasoline volumes by grade and sales type (cont.)million gallons per day
Year month
Premium All grades
Sales to end users Sales for resale Sales to end users Sales for resale
Through retail
outlets Total[a] DTW Rack Bulk Total
Through retail
outlets Total[a] DTW Rack Bulk Total
1985 9.2 10.0 - - - 38.0 50.5 57.5 - - - 256.91986 9.0 9.8 - - - 45.1 54.2 61.2 - - - 257.21987 11.2 11.6 - - - 53.0 55.7 61.0 - - - 257.21988 13.8 14.5 - - - 62.4 56.7 61.0 - - - 263.71989 13.5 14.2 - - - 60.8 57.5 61.2 - - - 260.71990 11.2 11.7 - - - 53.7 57.4 60.3 - - - 264.81991 10.5 10.9 - - - 48.3 58.4 61.2 - - - 261.31992 10.3 10.7 - - - 51.7 56.4 59.0 - - - 265.41993 10.3 10.6 - - - 52.8 54.9 57.2 - - - 266.91994 10.0 10.3 22.6 29.9 3.2 55.7 52.8 55.0 83.1 165.9 27.7 276.71995 9.8 10.2 20.8 31.5 4.2 56.4 53.7 55.9 77.9 174.8 36.0 288.81996 8.4 8.8 18.2 28.3 4.1 50.5 55.1 57.5 77.5 176.8 39.3 293.61997 8.4 8.8 16.9 27.6 4.0 48.5 58.7 61.1 75.1 179.6 38.0 292.71998 9.6 9.9 17.4 30.9 4.3 52.7 61.4 63.3 73.0 186.1 41.4 300.41999 8.7 8.9 16.1 31.0 5.7 52.7 60.2 62.0 72.2 194.6 40.2 306.92000 6.9 7.1 13.0 24.4 4.7 42.1 59.1 60.9 69.4 197.9 37.1 304.42001 7.1 7.3 12.3 24.6 3.7 40.6 60.4 62.0 67.4 201.1 36.7 305.22002 7.5 7.8 12.5 25.2 4.1 41.8 62.1 63.6 66.9 201.7 43.3 311.82003 7.1 7.3 10.8 23.9 3.3 38.1 62.2 63.8 59.8 208.4 43.4 311.62004 5.9 6.1 9.4 22.3 2.3 34.0 56.9 58.4 54.8 217.1 44.5 316.42005 5.2 5.4 8.0 20.9 3.0 31.9 57.5 59.0 48.7 224.2 48.9 321.82006 4.9 5.1 7.1 20.3 2.4 29.7 58.6 60.0 44.3 228.0 43.2 315.62007 4.7 4.8 6.9 20.2 2.4 29.5 56.7 57.7 43.0 227.6 49.2 319.82008 4.2 4.3 5.9 17.1 1.9 25.0 53.9 55.1 39.9 220.8 45.7 306.42009 4.0 4.1 6.3 19.1 2.1 27.4 48.0 49.8 39.9 226.1 41.4 307.42010 3.4 3.5 5.7 20.9 2.1 28.7 43.1 44.7 35.7 232.9 43.5 312.02011 2.9 3.0 4.6 20.3 2.0 26.9 37.5 39.0 30.1 233.7 32.5 296.32012 2.5 2.6 4.2 21.6 2.6 28.4 28.0 29.7 27.2 239.2 28.4 294.72013 2.2 2.3 4.3 22.7 2.6 29.6 23.0 24.7 27.6 238.6 24.8 291.02014 1.9 2.0 4.2 24.4 2.3 30.9 19.9 21.6 23.5 244.5 21.2 289.22015 2.6 2.6 4.5 27.3 2.0 33.8 25.1 25.5 22.9 254.2 21.6 298.7
2016January 2.5 2.6 4.6 26.1 2.1 32.8 24.1 24.4 22.1 243.0 20.2 285.3February 2.7 2.7 5.0 27.8 2.5 35.3 24.9 25.2 23.3 252.6 19.1 295.0March 2.7 2.7 4.9 27.7 2.3 35.0 25.0 25.2 23.4 255.0 25.4 303.8April 2.7 2.8 5.0 28.6 3.0 36.5 25.6 25.9 23.7 259.8 19.0 302.5May 2.8 2.8 5.0 29.2 2.5 36.8 25.7 26.0 23.7 260.4 21.7 305.8June 2.8 2.9 5.0 30.1 2.6 37.7 26.4 26.7 23.6 268.3 23.0 314.9July 2.8 2.9 5.0 32.3 2.7 40.0 26.1 26.3 23.3 267.3 25.3 315.9August 2.9 2.9 5.2 30.6 1.9 37.6 26.2 26.5 23.9 267.2 23.7 314.8September 2.9 2.9 5.0 29.1 2.4 36.5 26.2 26.4 23.4 261.5 23.0 307.8October 2.7 2.7 4.9 28.4 2.2 35.5 25.6 25.9 23.0 260.5 18.4 301.9November 2.6 2.6 4.9 28.2 1.7 34.8 24.4 24.6 22.5 258.9 18.2 299.6December 2.5 2.5 4.9 27.5 2.6 35.0 23.8 24.1 22.8 256.9 18.7 298.5
2016 2.7 2.7 5.0 28.8 2.4 36.1 25.3 25.6 23.2 259.3 21.3 303.8
2017January 2.3 2.4 4.5 25.3 1.7 31.5 22.7 22.9 21.2 239.6 17.1 277.9February 2.4 2.4 4.7 26.7 1.3 32.7 23.5 23.8 22.0 250.2 17.5 289.7March 2.5 2.5 4.9 28.1 1.9 34.9 24.2 24.5 23.0 259.9 14.2 297.2April 2.5 2.6 4.9 28.5 2.1 35.5 24.1 24.3 22.7 259.7 20.5 302.9May 2.6 2.7 5.0 30.6 1.6 37.2 24.6 24.9 22.8 266.8 16.4 306.0June 2.7 2.7 5.0 31.2 1.8 38.0 25.4 25.7 22.8 272.1 14.8 309.7July 2.7 2.7 5.0 30.9 1.5 37.4 24.6 24.8 22.6 267.9 13.5 304.0August 2.7 2.7 5.1 31.3 1.8 38.1 24.9 25.2 23.0 274.6 17.3 314.9September 2.6 2.6 4.8 29.0 1.8 35.6 24.3 24.6 22.3 260.6 19.6 302.5October 2.6 2.6 4.9 29.2 1.9 36.0 24.6 24.9 22.3 265.3 18.3 305.9November 2.4 2.4 4.6 28.6 2.5 35.7 24.0 24.3 21.9 262.0 20.9 304.8December 2.4 2.4 4.8 28.3 2.6 35.6 23.8 24.1 21.9 260.1 20.2 302.2
2017 2.5 2.6 4.9 29.0 1.9 35.7 24.2 24.5 22.4 261.6 17.5 301.5
2018January R2.3 2.3 4.5 26.3 2.0 32.8 R22.3 22.5 20.7 R244.0 18.4 283.1February 2.3 2.3 4.7 27.3 2.0 33.9 23.1 23.4 21.8 253.4 20.9 296.0
NA = Not available.- = No data reported.R = Revised data.[a] Includes sales through retail outlets as well as all direct sales to end users that were not made through company-operated retail outlets, e.g., sales to agricultural customers, commercial sales, and industrial sales.Notes: - Motor gasoline averages and totals prior to October 1993 include leaded gasoline. - Data for the 4th quarter of 1993 were derived from two separate survey systems. The DTW, Rack, and Bulk components were derived from the revised EIA-782 survey system, while the End-Use and Average Resale categories were derived from the predecessor EIA-782 survey system. Therefore, the DTW, Rack, and Bulk components are not consistent with the Average Resale category. Beginning January 1994, all data are from the revised EIA-782 survey system and are consistent. - Values shown for the current month are preliminary. Values shown for previous months are revised. Data through 2017 are fi nal. Totals may not equal the sum of the components due to rounding.Sources: U.S. Energy Informa on Administra on Form EIA-782A, "Refi ners'/Gas Plant Operators' Monthly Petroleum Product Sales Report."
U.S. Energy Information Administration�|�Petroleum Marketing Monthly 17
May 2018

Table 8. U.S. refi ner conven onal motor gasoline prices by grade and sales typedollars per gallon excluding taxes
Year month
Regular Midgrade
Sales to end users Sales for resale Sales to end users Sales for resale
Through retail
outlets Average[a] DTW Rack Bulk Average
Through retail
outlets Average[a] DTW Rack Bulk Average
1994 0.687 0.681 0.636 0.545 0.50 0.558 0.784 0.778 0.694 NA NA 0.6271995 0.710 0.704 0.651 0.570 0.525 0.573 0.80 0.794 0.711 0.610 NA 0.6371996 0.797 0.791 0.743 0.665 0.607 0.664 0.884 0.878 0.801 0.70 NA 0.7261997 0.781 0.775 0.719 0.649 0.60 0.648 0.874 0.869 0.783 0.685 W 0.7081998 0.611 0.606 0.551 0.473 0.439 0.473 0.704 0.70 0.613 0.511 W 0.5331999 0.710 0.706 0.676 0.595 0.520 0.590 0.802 0.799 0.734 0.628 - 0.6502000 1.045 1.040 0.994 0.913 0.844 0.909 1.136 1.133 1.052 0.945 - 0.9642001 0.961 0.958 0.914 0.835 0.761 0.830 1.058 1.055 0.984 0.872 - 0.8892002 0.893 0.891 0.836 0.791 0.723 0.782 0.985 0.981 0.906 0.829 - 0.8392003 1.081 1.078 1.040 0.952 0.871 0.942 1.173 1.168 1.108 0.994 - 1.0062004 1.368 1.364 1.325 1.244 1.170 1.234 1.454 1.450 1.391 1.287 - 1.2962005 1.780 1.776 1.709 1.643 1.555 1.629 1.861 1.857 1.781 1.675 - 1.6822006 2.062 2.060 2.054 1.925 1.864 1.918 2.166 2.164 2.134 1.972 - 1.9802007 2.292 2.289 2.242 2.153 2.065 2.138 2.392 2.390 2.298 2.222 - 2.2252008 2.717 2.714 2.698 2.560 2.513 2.555 2.829 2.829 2.734 2.581 - 2.5862009 1.825 1.821 1.817 1.735 1.657 1.723 1.936 1.936 1.877 1.751 - 1.7552010 2.244 2.239 2.244 2.139 2.065 2.128 2.361 2.361 2.336 2.160 - 2.1642011 2.998 2.989 2.916 2.834 2.751 2.825 3.105 3.104 3.033 2.869 - 2.8722012 3.076 3.060 2.999 2.867 2.816 2.864 3.202 3.202 3.117 2.886 - 2.8902013 2.975 2.954 2.797 2.745 2.724 2.745 3.110 3.110 2.947 2.850 - 2.8522014 2.775 2.753 2.706 2.558 2.502 2.556 2.932 2.931 2.858 2.703 - 2.7112015 1.833 1.833 1.858 1.625 1.575 1.625 2.033 2.032 2.090 1.794 - 1.809
2016January 1.304 1.305 1.296 1.073 W 1.083 1.524 1.524 1.578 1.221 - 1.241February 1.167 1.167 1.103 0.960 W 0.964 1.377 1.376 1.349 1.098 - 1.112March 1.413 1.412 1.329 1.248 1.175 1.242 1.602 1.601 1.558 1.408 - 1.416April 1.577 1.576 1.459 1.383 1.310 1.379 1.782 1.781 1.653 1.548 - 1.554May 1.749 1.749 1.604 1.543 1.425 1.535 1.951 1.950 1.743 1.707 - 1.709June 1.855 1.854 1.658 1.562 1.493 1.558 2.043 2.041 1.802 1.735 - 1.738July 1.648 1.649 1.604 1.408 1.392 1.411 1.891 1.890 1.765 1.589 - 1.599August 1.636 1.636 1.529 1.455 W 1.449 1.865 1.866 1.681 1.633 - 1.635September 1.659 1.660 1.620 1.439 W 1.441 1.905 1.905 1.770 1.620 - 1.629October 1.691 1.692 1.648 1.493 1.456 1.493 1.933 1.933 1.796 1.674 - 1.681November 1.613 1.613 1.520 1.346 W 1.351 1.865 1.864 1.703 1.513 - 1.524December 1.740 1.739 1.560 1.532 1.457 1.527 1.953 1.952 1.728 1.680 - 1.683
2016 1.591 1.591 1.497 1.375 1.332 1.374 1.811 1.811 1.681 1.541 - 1.549
2017January 1.768 1.768 1.663 1.557 1.575 1.561 2.009 2.008 1.817 1.724 - 1.730February 1.700 1.701 1.679 1.540 1.546 1.544 1.956 1.956 1.866 1.709 - 1.719March 1.739 1.740 1.766 1.542 W 1.546 1.994 1.992 1.961 1.715 - 1.730April 1.858 1.858 1.831 1.635 1.594 1.636 2.099 2.094 2.003 1.811 - 1.822May 1.803 1.803 1.781 1.563 W 1.566 2.057 2.056 1.977 1.751 - 1.764June 1.746 1.746 1.704 1.475 W 1.480 2.005 2.004 1.906 1.662 - 1.676July 1.721 1.721 1.709 1.532 1.488 1.534 1.967 1.967 1.877 1.714 - 1.723August 1.807 1.806 1.803 1.632 W 1.632 2.056 2.055 1.954 1.817 - 1.825September 2.013 2.011 1.923 1.750 W 1.748 2.279 2.273 2.048 1.948 - 1.954October 1.905 1.904 1.792 1.661 W 1.663 2.171 2.168 1.978 1.838 - 1.847November 1.985 1.984 1.899 1.737 W 1.741 2.235 2.231 2.058 1.902 - 1.912December 1.900 1.899 1.815 1.651 1.700 1.658 2.158 2.155 2.006 1.812 - 1.825
2017 1.829 1.829 1.780 1.607 1.602 1.610 2.082 2.080 1.954 1.781 - 1.791
2018January 1.965 R1.963 1.888 1.776 R1.783 1.779 R2.203 R2.201 2.087 1.945 - 1.954February 1.949 1.948 1.934 1.732 1.827 1.744 2.218 2.216 2.151 1.912 - 1.928
See footnotes at end of table.
U.S. Energy Information Administration�|�Petroleum Marketing Monthly18
May 2018

Table 8. U.S. refi ner conven onal motor gasoline prices by grade and sales type (cont.)dollars per gallon excluding taxes
Year month
Premium All grades
Sales to end users Sales for resale Sales to end users Sales for resale
Through retail
outlets Average[a] DTW Rack Bulk Average
Through retail
outlets Average[a] DTW Rack Bulk Average
1994 0.863 0.855 0.778 0.638 0.555 0.682 0.736 0.729 0.683 0.565 0.507 0.5891995 0.877 0.868 0.790 0.665 0.568 0.684 0.753 0.746 0.693 0.590 0.530 0.5981996 0.960 0.951 0.869 0.755 0.645 0.767 0.834 0.827 0.778 0.682 0.610 0.6851997 0.954 0.946 0.856 0.742 0.641 0.753 0.819 0.813 0.756 0.666 0.604 0.6681998 0.783 0.776 0.684 W 0.474 0.576 0.652 0.647 0.589 0.491 0.442 0.4941999 0.872 0.865 0.801 0.679 0.558 0.681 0.748 0.743 0.711 0.611 0.525 0.6092000 1.211 1.201 1.120 1.002 0.897 1.005 1.076 1.071 1.023 0.926 0.849 0.9252001 1.129 1.123 1.042 0.922 0.806 0.923 0.992 0.989 0.943 0.848 0.765 0.8452002 1.064 1.058 0.978 0.889 0.788 0.886 0.924 0.921 0.867 0.806 0.729 0.7982003 1.253 1.245 1.178 1.051 0.925 1.050 1.109 1.105 1.067 0.965 0.874 0.9572004 1.544 1.534 1.466 1.347 1.248 1.348 1.391 1.387 1.348 1.257 1.174 1.2472005 1.966 1.954 1.857 1.747 1.652 1.746 1.801 1.797 1.732 1.654 1.560 1.6412006 2.274 2.265 2.215 2.070 1.981 2.071 2.084 2.082 2.077 1.940 1.869 1.9332007 2.502 2.494 2.415 2.328 2.181 2.317 2.313 2.309 2.267 2.172 2.070 2.1562008 2.928 2.921 2.851 2.726 2.650 2.726 2.736 2.733 2.716 2.573 2.518 2.5682009 2.062 2.054 2.014 1.927 1.802 1.918 1.845 1.841 1.843 1.750 1.664 1.7382010 2.489 2.478 2.443 2.329 2.172 2.318 2.264 2.259 2.270 2.155 2.069 2.1432011 3.230 3.219 3.105 3.035 2.864 3.018 3.016 3.008 2.939 2.851 2.758 2.8412012 3.316 3.299 3.194 3.116 3.094 3.116 3.098 3.083 3.024 2.887 2.843 2.8862013 3.231 3.213 3.011 3.059 3.004 3.049 2.997 2.977 2.825 2.775 2.755 2.7742014 3.063 3.043 2.901 2.885 2.794 2.875 2.800 2.778 2.736 2.589 2.535 2.5872015 2.216 2.210 2.085 2.016 1.812 1.999 1.869 1.869 1.899 1.663 1.599 1.663
2016January 1.737 1.733 W 1.441 1.272 1.428 1.345 1.346 1.337 1.109 1.137 1.117February 1.593 1.590 W 1.315 1.132 1.297 1.209 1.209 1.143 0.995 0.991 0.998March 1.812 1.808 1.548 1.612 1.381 1.586 1.451 1.450 1.369 1.283 1.194 1.276April 1.995 1.992 1.674 1.763 1.489 1.726 1.617 1.617 1.498 1.421 1.339 1.416May 2.174 2.170 1.809 1.935 1.630 1.898 1.791 1.790 1.641 1.583 1.451 1.573June 2.275 2.270 1.862 1.955 1.723 1.926 1.895 1.894 1.696 1.602 1.522 1.597July 2.122 2.119 1.812 1.787 1.549 1.764 1.696 1.697 1.643 1.451 1.410 1.452August 2.103 2.099 W 1.837 1.559 1.812 1.682 1.682 1.566 1.495 1.393 1.487September 2.142 2.137 W 1.846 1.566 1.817 1.707 1.708 1.658 1.480 1.440 1.480October 2.182 2.178 1.860 1.901 1.642 1.874 1.738 1.738 1.685 1.533 1.479 1.533November 2.112 2.108 W 1.733 1.500 1.715 1.660 1.660 1.557 1.384 1.382 1.388December 2.209 2.204 1.774 1.875 1.587 1.838 1.782 1.781 1.599 1.564 1.476 1.558
2016 2.042 2.037 1.709 1.758 1.510 1.731 1.635 1.634 1.536 1.414 1.353 1.411
2017January 2.265 2.258 1.866 1.908 1.736 1.893 1.813 1.812 1.700 1.590 1.589 1.593February 2.216 2.210 1.911 1.899 1.732 1.890 1.747 1.748 1.721 1.574 1.560 1.577March 2.250 2.247 W 1.916 1.716 1.903 1.786 1.787 1.808 1.578 1.562 1.583April 2.356 2.352 2.059 2.005 1.777 1.988 1.904 1.904 1.872 1.672 1.611 1.671May 2.311 2.306 W 1.950 1.731 1.938 1.851 1.851 1.823 1.604 1.552 1.605June 2.263 2.257 W 1.851 1.695 1.843 1.795 1.795 1.745 1.515 1.503 1.520July 2.227 2.220 1.931 1.902 1.703 1.893 1.770 1.769 1.751 1.572 1.510 1.573August 2.310 2.302 W 2.014 1.800 2.000 1.855 1.854 1.845 1.672 1.605 1.671September 2.523 2.514 W 2.137 2.017 2.128 2.061 2.059 1.960 1.789 1.713 1.786October 2.421 2.412 W 2.027 1.842 2.013 1.953 1.951 1.832 1.697 1.664 1.698November 2.497 2.489 W 2.083 1.880 2.063 2.031 2.029 1.939 1.770 1.764 1.773December 2.426 2.417 2.039 1.987 1.804 1.971 1.947 1.946 1.857 1.684 1.712 1.690
2017 2.338 2.331 2.002 1.973 1.792 1.961 1.876 1.876 1.821 1.643 1.622 1.646
2018January 2.479 2.468 2.118 R2.121 R1.956 R2.106 2.010 R2.009 1.931 1.809 R1.801 1.811February 2.493 2.482 2.176 2.086 1.943 2.078 1.997 1.996 1.980 1.766 1.838 1.777
NA = Not available.- = No data reported.W = Withheld to avoid disclosure of individual company data.R = Revised data.[a] Includes sales through retail outlets as well as all direct sales to end users that were not made through company-operated retail outlets, e.g., sales to agricultural customers, commercial sales, and industrial sales.Notes: - Beginning January 2007, oxygenated gasoline is included in conven onal gasoline. - The 4th quarter of 1993 was a transi onal period between the predecessor EIA-782 survey system and the revised EIA-782 survey sytem. The revised survey system contains addi onal product and sales categories, which may not be consistent with categories derived from the predecessor survey system. Beginning January 1994 all data are from the revised survey system and are consistent. Sales to end users - Values shown for the current month are preliminary. Values shown for previous months may be revised. Data through 2017 are fi nal.Sources: U.S. Energy Informa on Administra on Form EIA-782A, "Refi ners'/Gas Plant Operators' Monthly Petroleum Product Sales Report."
U.S. Energy Information Administration�|�Petroleum Marketing Monthly 19
May 2018

Table 9. U.S. refi ner conven onal motor gasoline volumes by grade and sales typemillion gallons per day
Year month
Regular Midgrade
Sales to end users Sales for resale Sales to end users Sales for resale
Through retail
outlets Total[a] DTW Rack Bulk Total
Through retail
outlets Total[a] DTW Rack Bulk Total
1994 29.7 31.2 36.1 113.5 22.8 172.4 7.6 7.8 10.1 14.6 0.1 24.81995 24.0 25.3 19.4 105.1 26.0 150.5 6.0 6.3 5.1 13.6 0.1 18.71996 24.1 25.4 17.8 108.5 27.1 153.4 5.7 5.9 4.4 12.9 NA 17.31997 25.0 26.4 16.4 110.9 26.4 153.7 5.7 5.9 3.9 12.7 W 16.61998 25.4 26.6 13.7 112.0 28.8 154.5 6.0 6.1 3.4 12.5 W 15.81999 25.0 26.0 13.4 117.4 24.9 155.8 5.9 6.0 3.1 12.2 - 15.32000 26.0 27.1 12.8 125.7 23.9 162.4 4.9 5.0 2.3 10.8 - 13.12001 26.6 27.4 12.0 128.5 24.0 164.5 4.6 4.7 1.9 10.2 - 12.02002 27.2 28.0 11.3 127.9 31.0 170.2 4.7 4.8 1.6 10.4 - 11.92003 27.5 28.3 10.3 131.1 32.4 173.8 4.3 4.4 1.2 10.0 - 11.22004 26.5 27.3 9.7 136.7 36.1 182.5 3.5 3.6 0.9 9.8 - 10.82005 27.4 28.3 9.0 140.1 36.4 185.5 3.1 3.2 0.7 10.8 - 11.52006 28.9 29.8 7.3 143.7 37.4 188.4 2.9 2.9 0.5 9.3 - 9.72007 29.6 30.2 7.4 150.3 43.0 200.7 2.6 2.6 0.5 10.3 - 10.82008 28.9 29.8 7.1 144.5 39.5 191.1 2.1 2.2 0.4 9.9 - 10.32009 26.5 27.8 6.6 147.0 35.9 189.5 1.9 1.9 0.3 9.1 - 9.42010 24.9 26.2 5.9 147.6 37.1 190.7 1.7 1.7 0.2 8.7 - 8.92011 21.3 22.4 5.4 147.3 26.3 179.0 1.3 1.3 0.1 7.4 - 7.52012 14.4 15.7 5.0 149.0 21.7 175.8 0.9 0.9 0.1 7.2 - 7.42013 11.6 13.0 6.2 149.9 18.8 174.9 0.7 0.7 0.1 5.7 - 5.82014 11.1 12.5 4.3 154.9 16.8 176.0 0.6 0.6 0.1 2.1 - 2.32015 14.0 14.3 3.9 160.7 16.8 181.4 0.8 0.8 0.1 1.9 - 2.0
2016January 13.5 13.8 W 153.0 W 172.2 0.8 0.8 0.1 1.7 - 1.8February 14.0 14.2 W 158.9 W 176.8 0.8 0.9 0.1 1.7 - 1.8March 14.0 14.2 4.1 161.9 20.0 186.0 0.9 0.9 0.1 1.7 - 1.8April 14.4 14.6 4.2 164.0 13.5 181.7 0.9 0.9 0.1 1.7 - 1.8May 14.4 14.6 4.2 163.6 15.4 183.3 0.9 0.9 0.1 1.8 - 1.9June 14.7 14.9 4.2 168.5 16.4 189.1 0.9 0.9 0.1 1.9 - 2.0July 14.6 14.8 4.2 167.0 18.9 190.2 0.9 0.9 0.1 1.9 - 2.0August 14.7 14.9 W 167.8 W 191.0 0.9 0.9 0.1 1.8 - 1.9September 14.5 14.8 W 164.5 W 186.1 0.9 0.9 0.1 1.7 - 1.8October 14.4 14.6 4.0 164.4 13.5 181.9 0.9 0.9 0.1 1.7 - 1.8November 13.4 13.6 W 163.9 W 181.0 0.8 0.8 0.1 1.6 - 1.7December 12.9 13.1 3.9 162.6 13.6 180.1 0.8 0.8 0.1 1.5 - 1.6
2016 14.1 14.3 4.1 163.4 15.8 183.3 0.9 0.9 0.1 1.7 - 1.8
2017January 12.3 12.5 3.7 151.5 13.0 168.2 0.7 0.7 0.1 1.4 - 1.5February 12.9 13.1 3.8 158.6 13.4 175.9 0.7 0.8 0.1 1.4 - 1.5March 13.3 13.5 W 164.4 W 178.2 0.8 0.8 0.1 1.5 - 1.6April 13.2 13.4 4.0 163.9 15.6 183.5 0.8 0.8 0.1 1.5 - 1.6May 13.4 13.6 W 168.2 W 184.8 0.8 0.8 0.1 1.6 - 1.7June 13.8 14.1 W 171.5 W 186.0 0.8 0.8 0.1 1.7 - 1.8July 13.3 13.5 4.0 169.6 9.6 183.1 0.8 0.8 0.1 1.6 - 1.7August 13.6 13.9 W 174.5 W 191.7 0.8 0.8 0.1 1.6 - 1.7September 13.2 13.4 W 165.1 W 184.5 0.8 0.8 0.1 1.5 - 1.5October 13.5 13.7 W 167.7 W 184.8 0.8 0.8 0.1 1.4 - 1.5November 13.2 13.5 W 166.0 W 184.7 0.8 0.8 0.1 1.4 - 1.5December 13.2 13.4 3.6 164.5 14.7 182.7 0.8 0.8 0.1 1.3 - 1.4
2017 13.3 13.5 3.9 165.5 13.0 182.4 0.8 0.8 0.1 1.5 - 1.6
2018January 12.2 12.4 3.5 153.8 R13.7 R171.0 0.7 0.7 0.1 1.2 - 1.3February 12.8 13.0 3.6 159.5 15.6 178.6 0.7 0.7 0.1 1.2 - 1.3
See footnotes at end of table.
U.S. Energy Information Administration�|�Petroleum Marketing Monthly20
May 2018

Table 9. U.S. refi ner conven onal motor gasoline volumes by grade and sales type (cont.)million gallons per day
Year month
Premium All grades
Sales to end users Sales for resale Sales to end users Sales for resale
Through retail
outlets Total[a] DTW Rack Bulk Total
Through retail
outlets Total[a] DTW Rack Bulk Total
1994 8.5 8.9 16.5 28.0 2.8 47.2 45.8 47.9 62.7 156.0 25.8 244.51995 6.2 6.4 7.7 25.1 2.9 35.6 36.2 38.0 32.1 143.8 28.9 204.81996 4.9 5.1 5.8 22.5 2.5 30.8 34.7 36.5 28.1 143.8 29.6 201.51997 4.8 5.0 5.1 21.9 2.5 29.5 35.4 37.2 25.4 145.6 28.9 199.81998 5.5 5.7 4.7 W 2.7 31.9 36.9 38.5 21.8 148.9 31.5 202.21999 5.0 5.2 4.3 24.1 3.8 32.2 35.9 37.2 20.8 153.7 28.7 203.32000 3.7 3.9 3.1 18.6 2.8 24.5 34.7 35.9 18.2 155.1 26.7 200.02001 3.7 3.8 2.8 18.7 2.7 24.1 35.0 36.0 16.7 157.4 26.7 200.72002 3.8 4.0 2.6 19.1 3.0 24.7 35.8 36.8 15.5 157.4 34.0 206.92003 3.4 3.5 2.1 17.5 2.4 21.9 35.1 36.3 13.6 158.6 34.8 207.02004 2.6 2.8 1.6 15.8 1.7 19.2 32.6 33.7 12.3 162.3 37.8 212.42005 2.3 2.4 1.4 14.4 1.9 17.7 32.8 33.8 11.0 165.4 38.2 214.62006 2.1 2.2 1.1 13.9 1.7 16.6 33.9 35.0 8.8 166.8 39.1 214.72007 2.1 2.2 1.1 14.4 2.0 17.4 34.3 35.0 9.0 175.0 44.9 228.92008 1.8 1.9 0.9 11.7 1.5 14.2 32.9 33.9 8.4 166.2 41.0 215.62009 1.7 1.8 0.9 12.9 1.8 15.6 30.0 31.5 7.8 169.0 37.7 214.52010 1.5 1.6 0.8 13.5 1.7 15.9 28.2 29.5 6.9 169.8 38.8 215.52011 1.2 1.3 0.7 12.6 1.8 15.1 23.8 25.1 6.2 167.3 28.1 201.62012 1.0 1.1 0.7 13.2 2.4 16.2 16.3 17.7 5.8 169.5 24.1 199.42013 0.8 0.9 0.8 14.0 2.4 17.2 13.1 14.5 7.1 169.6 21.2 197.92014 0.7 0.8 0.7 15.1 2.1 17.9 12.5 14.0 5.1 172.1 18.9 196.22015 1.1 1.1 0.7 16.8 1.8 19.4 15.9 16.2 4.8 179.4 18.6 202.8
2016January 1.1 1.1 W 16.0 W 18.6 15.4 15.7 4.8 170.7 17.0 192.5February 1.1 1.1 W 16.9 W 19.6 15.9 16.2 4.9 177.4 15.8 198.2March 1.1 1.2 0.8 17.0 2.0 19.9 16.0 16.2 5.0 180.6 22.0 207.7April 1.2 1.2 0.8 17.6 2.6 21.0 16.4 16.7 5.1 183.3 16.1 204.5May 1.2 1.2 0.9 18.0 2.2 21.1 16.4 16.7 5.2 183.5 17.7 206.3June 1.2 1.2 0.9 18.6 2.3 21.8 16.8 17.0 5.2 189.0 18.7 212.9July 1.2 1.3 0.9 20.9 2.4 24.2 16.8 17.0 5.1 189.8 21.4 216.3August 1.2 1.2 W 18.9 W 21.4 16.8 17.1 5.2 188.5 20.6 214.4September 1.2 1.2 W 17.8 W 20.8 16.7 16.9 5.1 184.0 19.6 208.6October 1.1 1.1 0.8 17.3 2.0 20.0 16.3 16.6 4.9 183.4 15.4 203.8November 1.0 1.1 W 17.1 W 19.3 15.3 15.5 4.8 182.7 14.6 202.1December 1.0 1.0 0.8 16.5 2.2 19.5 14.7 14.9 4.8 180.7 15.8 201.3
2016 1.1 1.2 0.8 17.7 2.1 20.6 16.1 16.4 5.0 182.8 17.9 205.7
2017January 0.9 0.9 0.7 15.1 1.3 17.1 13.9 14.1 4.5 168.1 14.3 186.8February 1.0 1.0 0.8 16.0 1.0 17.8 14.6 14.8 4.7 176.1 14.4 195.2March 1.0 1.0 W 16.9 W 19.4 15.1 15.3 5.0 182.8 11.4 199.2April 1.0 1.0 0.8 17.3 1.6 19.8 15.0 15.3 4.8 182.7 17.3 204.9May 1.1 1.1 W 19.0 W 21.1 15.3 15.5 4.9 188.8 14.0 207.7June 1.1 1.1 W 19.5 W 21.8 15.8 16.0 4.9 192.6 12.1 209.7July 1.1 1.1 0.9 19.5 1.1 21.4 15.2 15.5 4.9 190.7 10.7 206.3August 1.1 1.1 W 19.6 W 21.9 15.5 15.8 5.0 195.8 14.6 215.3September 1.0 1.1 W 17.8 W 20.1 15.0 15.2 4.7 184.4 17.0 206.1October 1.0 1.0 W 17.8 W 19.9 15.3 15.5 4.7 186.8 14.7 206.2November 1.0 1.0 W 17.3 W 20.2 15.0 15.2 4.4 184.7 17.3 206.4December 1.0 1.0 0.8 17.0 2.0 19.8 14.9 15.1 4.4 182.8 16.6 203.9
2017 1.0 1.0 0.8 17.8 1.5 20.0 15.1 15.3 4.8 184.7 14.5 204.0
2018January 0.9 0.9 0.7 15.9 R1.7 18.3 13.8 14.1 4.3 170.9 R15.4 R190.6February 0.9 0.9 0.7 16.4 1.6 18.8 14.4 14.7 4.4 177.1 17.2 198.7
NA = Not available.- = No data reported.W = Withheld to avoid disclosure of individual company data.R = Revised data.[a] Includes sales through retail outlets as well as all direct sales to end users that were not made through company-operated retail outlets, e.g., sales to agricultural customers, commercial sales, and industrial sales.Notes: - Beginning January 2007, oxygenated gasoline is included in conven onal gasoline. Sales to end users Year month Sales for resale - Values shown for the current month are preliminary. Values shown for previous months are revised. Data through 2017 are fi nal. Totals may not equal the sum of the components due to rounding. - The 4th quarter of 1993 was a transi onal period between the predecessor EIA-782 survey system and the revised EIA-782 survey system. The revised survey system contains addi onal product and sales categories, which may not be consistent with categories derived from the predecessor survey system. Beginning January 1994 all data are from the revised survey system and are consistent.Sources: U.S. Energy Informa on Administra on Form EIA-782A, "Refi ners'/Gas Plant Operators' Monthly Petroleum Product Sales Report."
U.S. Energy Information Administration�|�Petroleum Marketing Monthly 21
May 2018

Table 10. U.S. refi ner reformulated motor gasoline prices by grade and sales typedollars per gallon excluding taxes
Year month
Regular Midgrade
Sales to end users Sales for resale Sales to end users Sales for resale
Through retail
outlets Average[a] DTW Rack Bulk Average
Through retail
outlets Average[a] DTW Rack Bulk Average
1994 0.764 0.758 0.720 0.569 0.543 0.638 0.879 0.873 0.770 0.628 W 0.7281995 0.749 0.744 0.707 0.605 0.573 0.650 0.836 0.833 0.753 0.651 - 0.7231996 0.834 0.830 0.788 0.698 0.677 0.738 0.924 0.921 0.837 0.741 W 0.8091997 0.830 0.828 0.787 0.682 0.668 0.731 0.928 0.925 0.840 0.725 W 0.8071998 0.668 0.665 0.616 0.509 0.484 0.557 0.769 0.767 0.673 0.553 W 0.6381999 0.804 0.80 0.752 0.642 0.601 0.686 0.895 0.892 0.807 0.676 NA 0.7672000 1.126 1.123 1.058 0.978 0.953 1.012 1.219 1.217 1.114 1.014 - 1.0852001 1.059 1.056 1.001 0.893 0.856 0.938 1.166 1.163 1.061 0.942 - 1.0272002 0.946 0.944 0.906 0.834 0.779 0.861 1.052 1.050 0.988 0.875 - 0.9582003 1.196 1.192 1.168 1.006 0.962 1.069 1.293 1.290 1.224 1.047 - 1.1652004 1.472 1.470 1.447 1.299 1.248 1.353 1.572 1.570 1.494 1.340 - 1.4362005 1.850 1.848 1.787 1.682 1.619 1.711 1.945 1.944 1.834 1.726 - 1.7892006 2.166 2.164 2.097 2.002 1.885 2.030 2.275 2.274 2.170 2.078 - 2.1292007 2.362 2.360 2.288 2.186 2.175 2.221 2.490 2.489 2.368 2.256 - 2.3162008 2.812 2.810 2.703 2.553 2.642 2.607 2.934 2.934 2.788 2.652 - 2.7212009 1.927 1.925 1.878 1.770 1.782 1.806 2.066 2.066 1.981 1.855 - 1.9142010 2.342 2.339 2.265 2.159 2.141 2.188 2.485 2.485 2.362 2.229 - 2.2802011 3.089 3.085 2.973 2.874 2.831 2.895 3.233 3.233 3.062 2.954 - 2.9902012 3.219 3.212 3.111 2.956 2.947 2.988 3.372 3.372 3.213 3.047 - 3.0982013 3.110 3.101 2.948 2.830 2.869 2.856 3.268 3.268 3.066 2.939 - 2.9792014 2.946 2.938 2.784 2.614 2.663 2.647 3.111 3.111 2.920 2.746 - 2.7882015 2.159 2.158 2.174 1.728 1.775 1.807 2.404 2.404 2.321 1.892 - 1.989
2016January 1.688 1.687 1.752 1.170 W 1.274 1.981 1.981 1.893 1.341 - 1.468February 1.450 1.449 1.422 1.019 W 1.090 1.721 1.721 1.564 1.164 - 1.260March 1.646 1.644 1.728 1.339 1.347 1.407 1.881 1.881 1.918 1.519 - 1.615April 1.832 1.831 1.845 1.485 1.475 1.548 2.064 2.064 1.985 1.635 - 1.719May 1.928 1.927 1.864 1.598 1.581 1.642 2.135 2.135 2.011 1.736 - 1.799June 1.998 1.997 1.929 1.643 1.591 1.688 2.195 2.195 2.090 1.781 - 1.848July 1.905 1.904 1.834 1.453 1.503 1.519 2.152 2.152 1.955 1.600 - 1.678August 1.797 1.796 1.677 1.466 W 1.502 2.018 2.018 1.830 1.590 - 1.641September 1.839 1.838 1.800 1.475 W 1.531 2.076 2.076 1.957 1.611 - 1.687October 1.869 1.868 1.834 1.536 1.587 1.588 2.112 2.112 2.002 1.682 - 1.754November 1.830 1.829 1.718 1.400 W 1.456 2.093 2.093 1.842 1.539 - 1.606December 1.869 1.869 1.723 1.565 1.553 1.592 2.098 2.098 1.885 1.694 - 1.737
2016 1.808 1.807 1.762 1.433 1.462 1.490 2.047 2.047 1.913 1.579 - 1.655
2017January 1.952 1.951 1.868 1.604 1.625 1.649 2.195 2.194 2.020 1.744 - 1.807February 1.954 1.953 1.960 1.609 1.665 1.670 2.225 2.225 2.151 1.774 - 1.861March 2.000 1.999 2.023 1.615 W 1.685 2.275 2.274 2.180 1.782 - 1.873April 2.060 2.059 2.052 1.724 1.740 1.779 2.303 2.303 2.217 1.876 - 1.952May 2.050 2.050 2.071 1.679 W 1.745 2.309 2.309 2.231 1.828 - 1.914June 1.992 1.991 1.984 1.563 W 1.634 2.260 2.260 2.101 1.711 - 1.793July 1.942 1.941 1.917 1.620 1.637 1.670 2.194 2.193 2.082 1.759 - 1.825August 2.021 2.021 2.009 1.691 W 1.745 2.276 2.276 2.189 1.833 - 1.905September 2.215 2.213 2.143 1.798 W 1.857 2.473 2.473 2.286 1.949 - 2.021October 2.096 2.095 2.032 1.690 W 1.747 2.352 2.352 2.186 1.829 - 1.907November 2.190 2.188 2.073 1.778 W 1.828 2.438 2.438 2.235 1.910 - 1.980December 2.092 2.091 1.962 1.691 1.763 1.737 2.345 2.345 2.101 1.815 - 1.879
2017 2.048 2.047 2.009 1.672 1.717 1.729 2.303 2.303 2.164 1.815 - 1.891
2018January 2.183 2.182 2.116 1.829 R1.907 R1.878 2.437 2.437 2.305 1.973 - 2.049February 2.247 2.246 2.211 1.795 1.886 1.866 2.534 2.534 2.389 1.954 - 2.053
See footnotes at end of table.
U.S. Energy Information Administration�|�Petroleum Marketing Monthly22
May 2018

Table 10. U.S. refi ner reformulated motor gasoline prices by grade and sales type (cont.)dollars per gallon excluding taxes
Year month
Premium All grades
Sales to end users Sales for resale Sales to end users Sales for resale
Through retail
outlets Average[a] DTW Rack Bulk Average
Through retail
outlets Average[a] DTW Rack Bulk Average
1994 0.966 0.958 0.861 0.677 0.558 0.777 0.831 0.824 0.771 0.599 0.547 0.6871995 0.929 0.924 0.841 0.704 0.616 0.785 0.808 0.803 0.756 0.632 0.582 0.6961996 1.002 0.998 0.910 0.791 0.709 0.859 0.882 0.878 0.828 0.720 0.682 0.7741997 1.005 1.003 0.910 0.775 0.686 0.853 0.876 0.874 0.825 0.703 0.671 0.7671998 0.847 0.845 0.741 W 0.516 0.680 0.717 0.714 0.657 0.529 0.489 0.5931999 0.966 0.963 0.870 0.717 0.639 0.798 0.845 0.841 0.788 0.658 0.608 0.7182000 1.297 1.291 1.189 1.064 0.972 1.125 1.164 1.160 1.092 0.993 0.957 1.0392001 1.239 1.234 1.133 0.983 0.890 1.065 1.10 1.096 1.034 0.909 0.859 0.9662002 1.124 1.119 1.046 0.930 0.832 0.991 0.987 0.985 0.944 0.851 0.785 0.8912003 1.366 1.362 1.292 1.099 1.028 1.201 1.233 1.229 1.197 1.021 0.969 1.0972004 1.655 1.652 1.574 1.399 1.348 1.489 1.510 1.507 1.474 1.313 1.257 1.3782005 2.031 2.029 1.912 1.791 1.766 1.847 1.883 1.881 1.812 1.697 1.635 1.7332006 2.369 2.367 2.239 2.149 2.004 2.183 2.202 2.20 2.125 2.020 1.906 2.0552007 2.601 2.599 2.468 2.367 2.346 2.415 2.404 2.402 2.322 2.208 2.192 2.2502008 3.003 3.001 2.845 2.70 2.826 2.772 2.845 2.843 2.728 2.569 2.659 2.6292009 2.177 2.174 2.067 1.968 1.899 2.011 1.971 1.969 1.913 1.793 1.791 1.8342010 2.587 2.584 2.446 2.343 2.247 2.380 2.386 2.383 2.299 2.182 2.150 2.2152011 3.334 3.331 3.145 3.067 2.940 3.090 3.132 3.128 3.003 2.898 2.837 2.9212012 3.478 3.473 3.288 3.201 3.175 3.225 3.265 3.259 3.143 2.986 2.961 3.0202013 3.371 3.365 3.132 3.103 3.071 3.110 3.160 3.152 2.982 2.866 2.882 2.8922014 3.206 3.202 2.949 2.867 2.642 2.886 3.005 2.996 2.818 2.648 2.661 2.6822015 2.516 2.516 2.357 2.066 2.145 2.144 2.242 2.240 2.214 1.777 1.799 1.860
2016January 2.126 2.125 W 1.524 W 1.638 1.792 1.790 1.796 1.221 1.307 1.331February 1.878 1.878 W 1.333 W 1.408 1.554 1.553 1.471 1.066 1.074 1.143March 2.029 2.028 1.960 1.668 1.712 1.749 1.737 1.736 1.783 1.388 1.377 1.463April 2.215 2.215 2.064 1.804 1.779 1.873 1.921 1.921 1.895 1.533 1.514 1.601May 2.293 2.293 2.091 1.915 1.855 1.960 2.012 2.011 1.917 1.645 1.602 1.694June 2.351 2.351 2.160 1.957 1.992 2.011 2.079 2.078 1.983 1.690 1.619 1.740July 2.304 2.304 2.045 1.788 1.824 1.856 1.999 1.998 1.884 1.504 1.524 1.574August 2.172 2.172 W 1.772 W 1.807 1.885 1.885 1.732 1.513 1.479 1.553September 2.228 2.228 W 1.797 W 1.860 1.931 1.931 1.855 1.523 1.537 1.585October 2.275 2.275 2.070 1.857 1.892 1.914 1.963 1.962 1.890 1.584 1.612 1.641November 2.257 2.257 W 1.723 W 1.780 1.929 1.928 1.770 1.448 1.505 1.509December 2.263 2.263 1.968 1.864 1.796 1.890 1.959 1.958 1.781 1.609 1.581 1.640
2016 2.201 2.201 1.986 1.755 1.710 1.816 1.900 1.899 1.814 1.481 1.484 1.543
2017January 2.359 2.359 2.104 1.908 1.833 1.957 2.044 2.043 1.924 1.648 1.658 1.699February 2.391 2.390 2.210 1.922 NA 2.000 2.054 2.053 2.019 1.655 1.697 1.723March 2.439 2.439 W 1.928 W 2.016 2.101 2.100 2.077 1.661 1.698 1.739April 2.468 2.468 2.286 2.031 1.992 2.097 2.154 2.153 2.108 1.769 1.772 1.831May 2.478 2.478 W 1.985 W 2.068 2.149 2.148 2.127 1.726 1.728 1.799June 2.428 2.427 W 1.876 W 1.959 2.092 2.091 2.034 1.611 1.668 1.688July 2.357 2.356 2.155 1.930 1.933 1.988 2.038 2.037 1.974 1.668 1.674 1.723August 2.440 2.440 W 1.998 W 2.065 2.117 2.117 2.068 1.737 1.779 1.798September 2.640 2.640 W 2.116 W 2.184 2.310 2.309 2.198 1.846 1.895 1.911October 2.517 2.517 W 1.980 W 2.052 2.191 2.191 2.089 1.734 1.750 1.797November 2.598 2.598 W 2.048 W 2.115 2.280 2.279 2.129 1.818 1.842 1.874December 2.505 2.505 2.191 1.958 1.866 2.013 2.184 2.183 2.016 1.730 1.782 1.783
2017 2.468 2.468 2.243 1.974 1.960 2.043 2.143 2.142 2.064 1.717 1.747 1.781
2018January 2.602 2.602 2.368 2.106 R2.170 2.175 2.275 2.274 2.175 1.869 R1.936 R1.926February 2.703 2.703 2.458 2.088 2.146 2.185 2.348 2.347 2.269 1.838 1.912 1.917
NA = Not available.- = No data reported.W = Withheld to avoid disclosure of individual company data.[a] Includes sales through retail outlets as well as all direct sales to end users that were not made through company-operated retail outlets, e.g., sales to agricultural customers, commercial sales, and industrial sales.Notes: - Values shown for the current month are preliminary. Values shown for previous months may be revised. Data through 2017 are fi nal.Sources: U.S. Energy Informa on Administra on Form EIA-782A, "Refi ners'/Gas Plant Operators' Monthly Petroleum Product Sales Report."
U.S. Energy Information Administration�|�Petroleum Marketing Monthly 23
May 2018
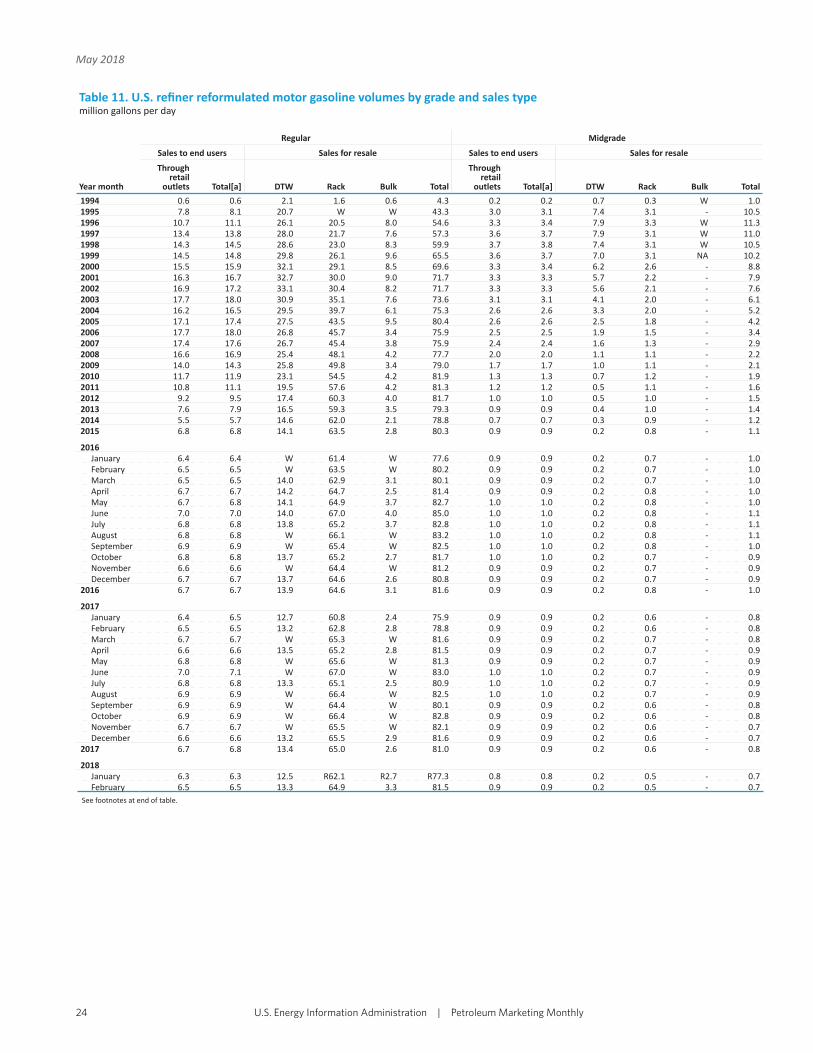
Table 11. U.S. refi ner reformulated motor gasoline volumes by grade and sales typemillion gallons per day
Year month
Regular Midgrade
Sales to end users Sales for resale Sales to end users Sales for resale
Through retail
outlets Total[a] DTW Rack Bulk Total
Through retail
outlets Total[a] DTW Rack Bulk Total
1994 0.6 0.6 2.1 1.6 0.6 4.3 0.2 0.2 0.7 0.3 W 1.01995 7.8 8.1 20.7 W W 43.3 3.0 3.1 7.4 3.1 - 10.51996 10.7 11.1 26.1 20.5 8.0 54.6 3.3 3.4 7.9 3.3 W 11.31997 13.4 13.8 28.0 21.7 7.6 57.3 3.6 3.7 7.9 3.1 W 11.01998 14.3 14.5 28.6 23.0 8.3 59.9 3.7 3.8 7.4 3.1 W 10.51999 14.5 14.8 29.8 26.1 9.6 65.5 3.6 3.7 7.0 3.1 NA 10.22000 15.5 15.9 32.1 29.1 8.5 69.6 3.3 3.4 6.2 2.6 - 8.82001 16.3 16.7 32.7 30.0 9.0 71.7 3.3 3.3 5.7 2.2 - 7.92002 16.9 17.2 33.1 30.4 8.2 71.7 3.3 3.3 5.6 2.1 - 7.62003 17.7 18.0 30.9 35.1 7.6 73.6 3.1 3.1 4.1 2.0 - 6.12004 16.2 16.5 29.5 39.7 6.1 75.3 2.6 2.6 3.3 2.0 - 5.22005 17.1 17.4 27.5 43.5 9.5 80.4 2.6 2.6 2.5 1.8 - 4.22006 17.7 18.0 26.8 45.7 3.4 75.9 2.5 2.5 1.9 1.5 - 3.42007 17.4 17.6 26.7 45.4 3.8 75.9 2.4 2.4 1.6 1.3 - 2.92008 16.6 16.9 25.4 48.1 4.2 77.7 2.0 2.0 1.1 1.1 - 2.22009 14.0 14.3 25.8 49.8 3.4 79.0 1.7 1.7 1.0 1.1 - 2.12010 11.7 11.9 23.1 54.5 4.2 81.9 1.3 1.3 0.7 1.2 - 1.92011 10.8 11.1 19.5 57.6 4.2 81.3 1.2 1.2 0.5 1.1 - 1.62012 9.2 9.5 17.4 60.3 4.0 81.7 1.0 1.0 0.5 1.0 - 1.52013 7.6 7.9 16.5 59.3 3.5 79.3 0.9 0.9 0.4 1.0 - 1.42014 5.5 5.7 14.6 62.0 2.1 78.8 0.7 0.7 0.3 0.9 - 1.22015 6.8 6.8 14.1 63.5 2.8 80.3 0.9 0.9 0.2 0.8 - 1.1
2016January 6.4 6.4 W 61.4 W 77.6 0.9 0.9 0.2 0.7 - 1.0February 6.5 6.5 W 63.5 W 80.2 0.9 0.9 0.2 0.7 - 1.0March 6.5 6.5 14.0 62.9 3.1 80.1 0.9 0.9 0.2 0.7 - 1.0April 6.7 6.7 14.2 64.7 2.5 81.4 0.9 0.9 0.2 0.8 - 1.0May 6.7 6.8 14.1 64.9 3.7 82.7 1.0 1.0 0.2 0.8 - 1.0June 7.0 7.0 14.0 67.0 4.0 85.0 1.0 1.0 0.2 0.8 - 1.1July 6.8 6.8 13.8 65.2 3.7 82.8 1.0 1.0 0.2 0.8 - 1.1August 6.8 6.8 W 66.1 W 83.2 1.0 1.0 0.2 0.8 - 1.1September 6.9 6.9 W 65.4 W 82.5 1.0 1.0 0.2 0.8 - 1.0October 6.8 6.8 13.7 65.2 2.7 81.7 1.0 1.0 0.2 0.7 - 0.9November 6.6 6.6 W 64.4 W 81.2 0.9 0.9 0.2 0.7 - 0.9December 6.7 6.7 13.7 64.6 2.6 80.8 0.9 0.9 0.2 0.7 - 0.9
2016 6.7 6.7 13.9 64.6 3.1 81.6 0.9 0.9 0.2 0.8 - 1.0
2017January 6.4 6.5 12.7 60.8 2.4 75.9 0.9 0.9 0.2 0.6 - 0.8February 6.5 6.5 13.2 62.8 2.8 78.8 0.9 0.9 0.2 0.6 - 0.8March 6.7 6.7 W 65.3 W 81.6 0.9 0.9 0.2 0.7 - 0.8April 6.6 6.6 13.5 65.2 2.8 81.5 0.9 0.9 0.2 0.7 - 0.9May 6.8 6.8 W 65.6 W 81.3 0.9 0.9 0.2 0.7 - 0.9June 7.0 7.1 W 67.0 W 83.0 1.0 1.0 0.2 0.7 - 0.9July 6.8 6.8 13.3 65.1 2.5 80.9 1.0 1.0 0.2 0.7 - 0.9August 6.9 6.9 W 66.4 W 82.5 1.0 1.0 0.2 0.7 - 0.9September 6.9 6.9 W 64.4 W 80.1 0.9 0.9 0.2 0.6 - 0.8October 6.9 6.9 W 66.4 W 82.8 0.9 0.9 0.2 0.6 - 0.8November 6.7 6.7 W 65.5 W 82.1 0.9 0.9 0.2 0.6 - 0.7December 6.6 6.6 13.2 65.5 2.9 81.6 0.9 0.9 0.2 0.6 - 0.7
2017 6.7 6.8 13.4 65.0 2.6 81.0 0.9 0.9 0.2 0.6 - 0.8
2018January 6.3 6.3 12.5 R62.1 R2.7 R77.3 0.8 0.8 0.2 0.5 - 0.7February 6.5 6.5 13.3 64.9 3.3 81.5 0.9 0.9 0.2 0.5 - 0.7
See footnotes at end of table.
U.S. Energy Information Administration�|�Petroleum Marketing Monthly24
May 2018

Table 11. U.S. refi ner reformulated motor gasoline volumes by grade and sales type (cont.)million gallons per day
Year month
Premium All grades
Sales to end users Sales for resale Sales to end users Sales for resale
Through retail
outlets Total[a] DTW Rack Bulk Total
Through retail
outlets Total[a] DTW Rack Bulk Total
1994 0.2 0.2 1.2 0.5 0.2 1.9 1.0 1.0 4.0 2.4 0.8 7.21995 3.1 3.2 12.0 W W 18.9 14.0 14.4 40.1 25.9 6.6 72.61996 3.1 3.2 11.7 5.3 1.5 18.6 17.0 17.6 45.7 29.2 9.6 84.51997 3.4 3.5 11.5 5.3 1.5 18.2 20.3 21.0 47.4 30.1 9.1 86.61998 3.8 3.9 12.2 W 1.6 19.8 21.8 22.2 48.2 32.0 9.9 90.11999 3.4 3.5 11.4 6.3 1.9 19.6 21.5 22.0 48.2 35.6 11.5 95.22000 3.0 3.1 9.6 5.4 1.9 16.8 21.9 22.4 47.9 37.0 10.4 95.22001 3.2 3.2 9.2 5.4 1.1 15.7 22.7 23.3 47.7 37.6 10.0 95.32002 3.4 3.5 9.5 5.6 1.1 16.3 23.6 24.1 48.2 38.0 9.3 95.62003 3.5 3.6 8.5 5.9 1.0 15.3 24.2 24.7 43.5 43.0 8.6 95.12004 3.1 3.1 7.4 6.0 0.6 14.1 21.9 22.3 40.2 47.7 6.7 94.62005 2.8 2.8 6.5 6.0 1.2 13.6 22.6 22.9 36.4 51.2 10.6 98.32006 2.7 2.7 5.9 5.9 0.7 12.5 22.9 23.2 34.6 53.1 4.1 91.82007 2.6 2.7 5.8 5.9 0.4 12.1 22.4 22.7 34.0 52.6 4.3 90.92008 2.4 2.4 5.0 5.4 0.4 10.8 21.0 21.3 31.5 54.6 4.6 90.82009 2.3 2.3 5.3 6.1 0.3 11.8 17.9 18.3 32.1 57.1 3.7 92.92010 1.9 1.9 4.9 7.4 0.4 12.7 14.9 15.2 28.8 63.1 4.7 96.52011 1.7 1.7 3.9 7.7 0.2 11.8 13.7 13.9 23.9 66.4 4.4 94.72012 1.5 1.5 3.5 8.4 0.3 12.1 11.7 12.0 21.4 69.7 4.3 95.42013 1.4 1.4 3.5 8.7 0.2 12.4 9.9 10.2 20.5 69.0 3.7 93.12014 1.2 1.2 3.5 9.4 0.2 13.0 7.5 7.7 18.4 72.3 2.3 93.02015 1.5 1.5 3.8 10.4 0.2 14.4 9.2 9.2 18.1 74.7 3.0 95.8
2016January 1.5 1.5 W 10.1 W 14.2 8.7 8.7 17.3 72.2 3.2 92.8February 1.6 1.6 W 10.9 W 15.6 9.0 9.0 18.4 75.1 3.3 96.8March 1.6 1.6 4.1 10.7 0.3 15.1 9.0 9.0 18.4 74.3 3.4 96.2April 1.6 1.6 4.1 11.0 0.4 15.5 9.2 9.2 18.6 76.5 2.9 98.0May 1.6 1.6 4.2 11.2 0.3 15.7 9.3 9.3 18.5 77.0 4.0 99.5June 1.6 1.6 4.1 11.5 0.3 15.9 9.6 9.7 18.4 79.3 4.3 102.0July 1.6 1.6 4.1 11.4 0.3 15.8 9.3 9.4 18.2 77.5 4.0 99.7August 1.6 1.6 W 11.6 W 16.2 9.4 9.5 18.7 78.6 3.1 100.4September 1.7 1.7 W 11.3 W 15.7 9.5 9.5 18.3 77.5 3.3 99.2October 1.6 1.6 4.1 11.1 0.2 15.5 9.3 9.3 18.0 77.1 3.0 98.1November 1.5 1.5 W 11.1 W 15.4 9.1 9.1 17.7 76.2 3.6 97.5December 1.5 1.5 4.1 11.0 0.3 15.4 9.2 9.2 18.0 76.2 2.9 97.2
2016 1.6 1.6 4.1 11.1 0.3 15.5 9.2 9.2 18.2 76.5 3.4 98.1
2017January 1.4 1.4 3.8 10.1 0.4 14.4 8.8 8.8 16.6 71.5 2.9 91.0February 1.5 1.5 4.0 10.6 0.3 14.9 8.9 8.9 17.3 74.1 3.1 94.5March 1.5 1.5 W 11.1 W 15.5 9.1 9.2 18.0 77.1 2.8 98.0April 1.5 1.5 4.1 11.2 0.4 15.7 9.0 9.1 17.9 77.0 3.2 98.1May 1.6 1.6 W 11.7 W 16.1 9.3 9.3 17.9 78.0 2.4 98.3June 1.6 1.6 W 11.8 W 16.2 9.6 9.6 17.9 79.5 2.7 100.1July 1.6 1.6 4.1 11.5 0.3 16.0 9.3 9.4 17.7 77.3 2.8 97.7August 1.6 1.6 W 11.7 W 16.2 9.4 9.4 18.0 78.8 2.7 99.6September 1.5 1.5 W 11.2 W 15.5 9.3 9.3 17.6 76.2 2.6 96.4October 1.5 1.5 W 11.5 W 16.1 9.4 9.4 17.6 78.5 3.7 99.7November 1.5 1.5 W 11.3 W 15.5 9.0 9.0 17.5 77.3 3.6 98.4December 1.5 1.5 4.0 11.2 0.6 15.9 8.9 9.0 17.4 77.3 3.5 98.3
2017 1.5 1.5 4.1 11.2 0.4 15.7 9.2 9.2 17.6 76.9 3.0 97.5
2018January 1.3 1.3 3.8 10.4 0.3 14.5 8.4 8.5 16.4 R73.1 R3.1 R92.5February 1.4 1.4 3.9 10.8 0.4 15.2 8.7 8.7 17.4 76.3 3.7 97.3
NA = Not available.- = No data reported.W = Withheld to avoid disclosure of individual company data.[a] Includes sales through retail outlets as well as all direct sales to end users that were not made through company-operated retail outlets, e.g., sales to agricultural customers, commercial sales, and industrial sales.Notes: - Values shown for the current month are preliminary. Values shown for previous months are revised. Data through 2017 are fi nal. Totals may not equal the sum of the components due to rounding.Sources: U.S. Energy Informa on Administra on Form EIA-782A, "Refi ners'/Gas Plant Operators' Monthly Petroleum Product Sales Report."
U.S. Energy Information Administration�|�Petroleum Marketing Monthly 25
May 2018

Table 16. U.S. refi ner residual fuel oil pricesdollars per gallon excluding taxes
Year month
Sulfur less than or equal to 1% Sulfur greater than 1% Average
Sales to end users Sales for resale Sales to end users Sales for resale Sales to end users Sales for resale
1985 0.644 0.610 0.582 0.560 0.610 0.5771986 0.372 0.328 0.317 0.289 0.343 0.3051987 0.447 0.412 0.396 0.362 0.423 0.3851988 0.372 0.333 0.30 0.271 0.334 0.301989 0.436 0.407 0.344 0.331 0.385 0.3601990 0.505 0.472 0.40 0.372 0.444 0.4131991 0.402 0.364 0.306 0.292 0.340 0.3141992 0.389 0.351 0.312 0.286 0.336 0.3081993 0.397 0.337 0.303 0.256 0.337 0.2931994 0.401 0.345 0.330 0.287 0.352 0.3171995 0.436 0.383 0.377 0.338 0.392 0.3631996 0.526 0.456 0.433 0.389 0.455 0.4201997 0.488 0.415 0.403 0.366 0.423 0.3871998 0.354 0.299 0.287 0.269 0.305 0.2801999 0.405 0.382 0.362 0.329 0.374 0.3542000 0.708 0.627 0.566 0.512 0.602 0.5662001 0.642 0.523 0.492 0.428 0.531 0.4762002 0.640 0.546 0.544 0.508 0.569 0.5302003 0.804 0.728 0.651 0.588 0.698 0.6612004 0.835 0.764 0.692 0.601 0.739 0.6812005 1.168 1.115 0.974 0.842 1.048 0.9712006 1.342 1.202 1.173 1.085 1.218 1.1362007 1.436 1.406 1.350 1.314 1.374 1.3502008 2.144 1.918 1.889 1.843 1.964 1.8662009 1.413 1.337 1.306 1.344 1.341 1.3422010 1.920 1.756 1.619 1.679 1.713 1.6972011 2.736 2.389 2.257 2.316 2.401 2.3362012 3.025 2.548 2.433 2.429 2.592 2.4572013 2.883 2.363 2.353 2.249 2.482 2.2782014 2.694 2.153 2.221 1.996 2.325 2.0442015 1.529 0.971 1.227 0.999 1.285 0.996
2016January W 0.477 0.641 0.502 0.710 0.499February NA 0.475 0.606 0.508 0.632 0.504March NA 0.582 0.672 0.555 0.693 0.558April W 0.633 0.734 0.614 0.782 0.616May W 0.729 0.868 0.722 0.922 0.723June W 0.850 0.911 0.823 0.983 0.825July W 0.876 0.948 0.834 1.030 0.835August W 0.842 0.924 0.811 0.990 0.815September W 0.846 1.059 0.855 1.076 0.854October W 0.961 1.091 0.935 1.115 0.938November NA 0.920 1.040 0.907 1.106 0.908December W 1.024 1.206 1.031 1.230 1.030
2016 1.138 0.736 0.897 0.746 0.945 0.745
2017January W 1.099 1.249 1.121 1.309 1.119February W 1.174 1.243 1.115 1.291 1.121March W 1.103 1.186 1.075 1.239 1.077April W 1.038 1.147 1.039 1.201 1.039May W 0.986 1.153 1.047 1.213 1.043June W 0.937 1.129 0.995 1.195 0.991July W 1.026 1.154 1.040 1.211 1.039August W 1.042 1.142 1.081 1.204 1.079September W 1.150 1.295 1.137 1.314 1.138October W 1.153 1.249 1.178 1.304 1.176November W 1.302 1.384 1.277 1.413 1.279December W 1.254 1.447 1.249 1.484 1.249
2017 W 1.112 1.237 1.117 1.287 1.116
2018January W R1.301 1.476 R1.311 1.507 R1.310February W 1.221 1.415 1.315 1.490 1.310
NA = Not available.R = Revised data.Notes: - Values shown for the current month are preliminary. Values shown for previous months may be revised. Data through 2017 are fi nal.Sources: U.S. Energy Informa on Administra on Form EIA-782A, "Refi ners'/Gas Plant Operators' Monthly Petroleum Product Sales Report."
U.S. Energy Information Administration�|�Petroleum Marketing Monthly26
May 2018

Table 17. U.S. refi ner residual fuel oil volumesmillion gallons per day
Year month
Sulfur less than or equal to 1% Sulfur greater than 1% Total
Sales to end users Sales for resale Sales to end users Sales for resale Sales to end users Sales for resale
1985 11.4 7.0 13.8 12.9 25.2 19.91986 15.2 7.9 16.4 10.7 31.6 18.61987 15.1 7.8 13.9 9.1 29.0 16.91988 14.2 8.7 15.9 10.3 30.2 18.91989 13.4 7.9 17.0 13.1 30.4 21.01990 11.1 7.4 14.9 10.5 25.9 17.91991 8.6 5.6 15.5 12.2 24.0 17.81992 7.1 5.2 15.3 10.0 22.4 15.21993 6.2 5.7 11.1 6.9 17.2 12.61994 4.2 6.6 9.3 6.2 13.5 12.81995 2.9 7.7 8.7 5.9 11.6 13.61996 3.1 6.3 9.8 7.4 12.9 13.81997 3.2 4.8 10.3 6.7 13.4 11.51998 3.9 5.7 10.5 9.6 14.4 15.41999 3.9 5.3 10.0 6.2 13.9 11.52000 3.3 4.9 9.8 5.6 13.1 10.52001 3.8 5.2 11.0 5.1 14.8 10.32002 2.7 5.1 7.8 3.7 10.4 8.82003 3.3 3.5 7.4 3.2 10.7 6.72004 3.4 2.9 6.8 3.0 10.2 5.92005 4.0 2.2 6.4 2.5 10.4 4.72006 2.8 2.8 7.6 3.6 10.4 6.52007 3.1 3.2 7.8 5.0 10.9 8.22008 2.5 2.9 5.9 6.6 8.4 9.52009 2.8 2.9 5.7 6.9 8.5 9.82010 2.4 2.6 5.2 8.1 7.6 10.72011 1.9 3.4 4.5 8.8 6.4 12.22012 1.5 2.1 4.0 6.8 5.5 8.82013 1.3 2.3 3.9 6.7 5.2 9.02014 1.0 2.4 3.6 5.6 4.6 8.02015 0.8 0.9 3.3 7.1 4.0 8.1
2016January W 1.0 W 8.3 4.1 9.3February NA 1.2 3.4 8.2 3.9 9.3March NA 0.7 3.3 8.5 4.1 9.2April W 1.2 W 7.8 4.2 9.0May W 1.3 W 8.6 3.9 9.9June W 0.6 W 8.3 3.8 8.9July W 0.3 W 7.4 4.3 7.6August W 0.9 W 7.2 4.4 8.1September W 0.5 W 7.4 4.7 7.9October W 1.0 W 6.1 4.4 7.1November NA 0.7 3.1 6.5 4.0 7.2December W 0.6 W 7.0 4.2 7.6
2016 0.8 0.8 3.3 7.6 4.2 8.4
2017January W 0.5 W 6.2 3.9 6.6February W 0.6 W 5.6 4.4 6.2March W 0.4 W 5.5 4.6 5.9April W 0.3 W 5.9 3.8 6.2May W 0.3 W 5.5 3.8 5.9June W 0.5 W 7.6 3.7 8.2July W 0.6 W 5.7 3.4 6.3August W 0.4 W 8.1 3.7 8.4September W 0.7 W 7.2 4.1 7.8October W 0.6 W 7.8 3.5 8.4November W 0.6 W 6.6 4.3 7.2December W 0.3 W 7.7 4.6 8.1
2017 W 0.5 W 6.6 4.0 7.1
2018January W R0.4 W R8.5 3.7 8.9February W 0.4 W 7.1 3.6 7.5
NA = Not available.R = Revised data.Notes: - Values shown for the current month are preliminary. Values shown for previous months are revised. Data through 2017 are fi nal. Totals may not equal the sum of the components due to rounding.Sources: U.S. Energy Informa on Administra on Form EIA-782A, "Refi ners'/Gas Plant Operators' Monthly Petroleum Product Sales Report."
U.S. Energy Information Administration�|�Petroleum Marketing Monthly 27
May 2018

Figure 7. U.S. Refi ner residual fuel oil prices
Source: U.S. Energy Information Administration, Form EIA-782A, “Refi ners’/Gas Plant Operators’ Monthly Petroleum Product
Sales Report.”
U.S. Energy Information Administration�|�Petroleum Marketing Monthly28
May 2018

Crude Oil Prices
U.S. Energy Information Administration�|�Petroleum Marketing Monthly
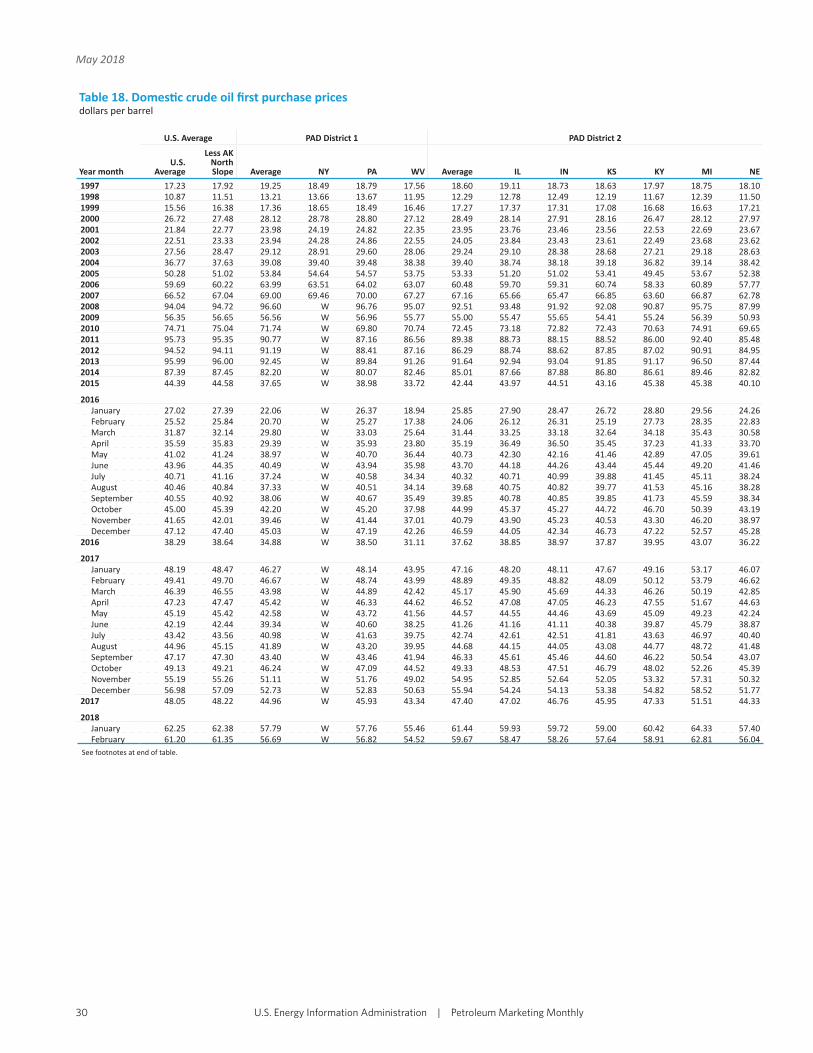
Table 18. Domes c crude oil fi rst purchase pricesdollars per barrel
Year month
U.S. Average PAD District 1 PAD District 2
U.S. Average
Less AK North Slope Average NY PA WV Average IL IN KS KY MI NE
1997 17.23 17.92 19.25 18.49 18.79 17.56 18.60 19.11 18.73 18.63 17.97 18.75 18.101998 10.87 11.51 13.21 13.66 13.67 11.95 12.29 12.78 12.49 12.19 11.67 12.39 11.501999 15.56 16.38 17.36 18.65 18.49 16.46 17.27 17.37 17.31 17.08 16.68 16.63 17.212000 26.72 27.48 28.12 28.78 28.80 27.12 28.49 28.14 27.91 28.16 26.47 28.12 27.972001 21.84 22.77 23.98 24.19 24.82 22.35 23.95 23.76 23.46 23.56 22.53 22.69 23.672002 22.51 23.33 23.94 24.28 24.86 22.55 24.05 23.84 23.43 23.61 22.49 23.68 23.622003 27.56 28.47 29.12 28.91 29.60 28.06 29.24 29.10 28.38 28.68 27.21 29.18 28.632004 36.77 37.63 39.08 39.40 39.48 38.38 39.40 38.74 38.18 39.18 36.82 39.14 38.422005 50.28 51.02 53.84 54.64 54.57 53.75 53.33 51.20 51.02 53.41 49.45 53.67 52.382006 59.69 60.22 63.99 63.51 64.02 63.07 60.48 59.70 59.31 60.74 58.33 60.89 57.772007 66.52 67.04 69.00 69.46 70.00 67.27 67.16 65.66 65.47 66.85 63.60 66.87 62.782008 94.04 94.72 96.60 W 96.76 95.07 92.51 93.48 91.92 92.08 90.87 95.75 87.992009 56.35 56.65 56.56 W 56.96 55.77 55.00 55.47 55.65 54.41 55.24 56.39 50.932010 74.71 75.04 71.74 W 69.80 70.74 72.45 73.18 72.82 72.43 70.63 74.91 69.652011 95.73 95.35 90.77 W 87.16 86.56 89.38 88.73 88.15 88.52 86.00 92.40 85.482012 94.52 94.11 91.19 W 88.41 87.16 86.29 88.74 88.62 87.85 87.02 90.91 84.952013 95.99 96.00 92.45 W 89.84 91.26 91.64 92.94 93.04 91.85 91.17 96.50 87.442014 87.39 87.45 82.20 W 80.07 82.46 85.01 87.66 87.88 86.80 86.61 89.46 82.822015 44.39 44.58 37.65 W 38.98 33.72 42.44 43.97 44.51 43.16 45.38 45.38 40.10
2016January 27.02 27.39 22.06 W 26.37 18.94 25.85 27.90 28.47 26.72 28.80 29.56 24.26February 25.52 25.84 20.70 W 25.27 17.38 24.06 26.12 26.31 25.19 27.73 28.35 22.83March 31.87 32.14 29.80 W 33.03 25.64 31.44 33.25 33.18 32.64 34.18 35.43 30.58April 35.59 35.83 29.39 W 35.93 23.80 35.19 36.49 36.50 35.45 37.23 41.33 33.70May 41.02 41.24 38.97 W 40.70 36.44 40.73 42.30 42.16 41.46 42.89 47.05 39.61June 43.96 44.35 40.49 W 43.94 35.98 43.70 44.18 44.26 43.44 45.44 49.20 41.46July 40.71 41.16 37.24 W 40.58 34.34 40.32 40.71 40.99 39.88 41.45 45.11 38.24August 40.46 40.84 37.33 W 40.51 34.14 39.68 40.75 40.82 39.77 41.53 45.16 38.28September 40.55 40.92 38.06 W 40.67 35.49 39.85 40.78 40.85 39.85 41.73 45.59 38.34October 45.00 45.39 42.20 W 45.20 37.98 44.99 45.37 45.27 44.72 46.70 50.39 43.19November 41.65 42.01 39.46 W 41.44 37.01 40.79 43.90 45.23 40.53 43.30 46.20 38.97December 47.12 47.40 45.03 W 47.19 42.26 46.59 44.05 42.34 46.73 47.22 52.57 45.28
2016 38.29 38.64 34.88 W 38.50 31.11 37.62 38.85 38.97 37.87 39.95 43.07 36.22
2017January 48.19 48.47 46.27 W 48.14 43.95 47.16 48.20 48.11 47.67 49.16 53.17 46.07February 49.41 49.70 46.67 W 48.74 43.99 48.89 49.35 48.82 48.09 50.12 53.79 46.62March 46.39 46.55 43.98 W 44.89 42.42 45.17 45.90 45.69 44.33 46.26 50.19 42.85April 47.23 47.47 45.42 W 46.33 44.62 46.52 47.08 47.05 46.23 47.55 51.67 44.63May 45.19 45.42 42.58 W 43.72 41.56 44.57 44.55 44.46 43.69 45.09 49.23 42.24June 42.19 42.44 39.34 W 40.60 38.25 41.26 41.16 41.11 40.38 39.87 45.79 38.87July 43.42 43.56 40.98 W 41.63 39.75 42.74 42.61 42.51 41.81 43.63 46.97 40.40August 44.96 45.15 41.89 W 43.20 39.95 44.68 44.15 44.05 43.08 44.77 48.72 41.48September 47.17 47.30 43.40 W 43.46 41.94 46.33 45.61 45.46 44.60 46.22 50.54 43.07October 49.13 49.21 46.24 W 47.09 44.52 49.33 48.53 47.51 46.79 48.02 52.26 45.39November 55.19 55.26 51.11 W 51.76 49.02 54.95 52.85 52.64 52.05 53.32 57.31 50.32December 56.98 57.09 52.73 W 52.83 50.63 55.94 54.24 54.13 53.38 54.82 58.52 51.77
2017 48.05 48.22 44.96 W 45.93 43.34 47.40 47.02 46.76 45.95 47.33 51.51 44.33
2018January 62.25 62.38 57.79 W 57.76 55.46 61.44 59.93 59.72 59.00 60.42 64.33 57.40February 61.20 61.35 56.69 W 56.82 54.52 59.67 58.47 58.26 57.64 58.91 62.81 56.04
See footnotes at end of table.
U.S. Energy Information Administration�|�Petroleum Marketing Monthly30
May 2018

Table 18. Domes c crude oil fi rst purchase prices (cont.)dollars per barrel
Year month
PAD District 2 (cont.) PAD District 3
ND OH OK SD Average AL AR LA MS NM TXFederal
Off shore Gulf
1997 17.63 17.77 19.05 17.80 18.69 18.58 17.58 19.22 16.94 19.02 18.66 18.631998 11.39 12.20 12.73 12.29 12.19 12.08 11.10 12.59 10.33 12.36 12.28 12.031999 16.70 16.41 17.77 16.86 17.07 16.71 15.89 17.73 15.42 17.46 17.29 16.662000 28.19 27.49 29.08 28.18 28.22 27.63 26.98 29.03 26.23 28.80 28.60 27.592001 23.55 22.55 24.68 23.89 23.43 23.18 21.82 24.51 21.13 23.72 23.41 23.292002 24.15 22.61 24.49 23.96 23.74 23.39 21.50 24.84 22.11 24.11 23.77 23.492003 29.27 28.18 29.72 28.94 29.08 28.97 26.57 30.52 27.46 29.52 29.13 28.722004 39.30 38.27 39.95 38.40 38.41 38.79 36.67 40.48 37.03 39.25 38.79 37.072005 52.38 53.47 54.46 50.65 51.96 53.26 50.86 54.05 49.58 52.84 52.61 49.782006 56.69 62.89 63.11 51.85 61.49 63.16 58.67 64.23 59.35 61.74 61.31 60.802007 65.30 68.09 69.31 62.78 68.37 71.10 64.25 71.63 68.65 68.94 68.30 67.402008 88.68 96.43 96.15 87.42 97.64 96.71 90.91 100.89 94.60 96.23 96.85 99.102009 53.75 56.35 56.56 50.75 57.77 55.25 53.07 59.18 58.29 57.08 57.40 58.222010 70.26 73.68 75.18 69.04 76.57 75.54 71.01 78.25 76.41 75.64 76.23 77.062011 88.74 90.79 90.94 87.08 96.79 105.99 87.61 106.20 100.43 90.93 91.99 105.652012 84.06 92.87 89.97 83.10 96.11 104.81 89.39 105.97 100.80 88.01 92.50 105.952013 90.22 94.89 94.25 89.28 97.53 103.10 92.98 105.18 100.44 92.13 95.80 103.292014 82.89 83.95 89.25 82.78 88.43 89.73 85.23 94.13 90.81 83.44 87.02 93.332015 41.42 38.40 44.96 42.73 45.61 44.55 43.04 48.43 46.81 44.40 44.95 47.67
2016January 24.80 22.66 27.84 24.32 28.16 26.95 26.11 29.50 27.69 27.48 27.35 30.54February 22.72 22.22 26.40 23.34 26.57 25.39 24.66 28.10 26.13 26.60 26.47 26.75March 30.35 30.64 33.09 30.56 32.38 31.96 32.30 34.98 33.13 32.92 33.01 30.14April 34.54 31.45 36.45 33.60 36.19 35.79 35.07 38.81 36.78 36.15 36.56 34.99May 39.47 40.19 42.71 39.60 41.53 41.58 40.80 44.53 42.52 42.11 42.52 38.48June 42.80 43.41 45.33 42.48 44.95 44.90 42.75 47.30 44.78 44.99 45.35 43.64July 39.58 39.59 41.80 38.72 41.82 40.79 38.99 43.21 41.16 41.25 41.62 42.54August 38.53 39.24 41.63 38.66 41.40 40.46 38.81 43.00 40.94 41.18 41.44 41.29September 38.70 39.89 41.71 38.86 41.40 40.57 38.80 43.07 41.03 41.35 41.55 40.94October 44.37 44.81 46.07 44.24 45.62 45.51 43.45 48.11 45.89 45.79 46.19 43.98November 39.67 40.92 42.53 39.86 42.68 41.27 39.26 44.38 41.79 42.25 42.49 43.22December 45.32 46.90 48.94 45.75 47.74 47.18 45.97 49.97 47.59 48.74 48.76 44.96
2016 36.51 37.04 39.51 36.39 39.19 38.53 37.21 41.08 39.18 39.18 39.35 38.63
2017January 45.87 47.38 49.24 45.92 48.92 47.90 46.32 50.52 47.70 49.44 49.41 47.67February 48.26 48.26 50.23 47.90 50.04 49.21 47.10 51.43 48.68 50.46 50.45 48.97March 44.40 44.39 46.74 43.97 47.08 45.94 43.37 48.11 45.44 46.72 46.77 47.91April 45.62 45.88 48.24 45.38 47.82 47.50 44.73 49.68 46.99 47.29 47.93 47.63May 44.06 43.48 45.74 42.83 45.77 45.47 42.16 47.54 44.96 44.56 45.37 47.09June 40.62 40.91 42.60 39.54 42.90 42.02 38.88 44.27 41.86 41.75 42.52 44.33July 42.08 42.34 44.13 41.42 43.89 43.86 40.16 45.81 43.35 43.33 43.87 44.05August 44.25 43.84 45.79 43.04 45.27 45.56 42.02 47.56 45.33 44.79 45.37 45.05September 46.00 45.63 47.26 45.03 47.47 47.74 43.47 49.36 47.29 46.76 47.52 47.51October 49.93 47.54 48.89 46.67 49.02 50.98 45.09 52.35 50.57 47.75 49.29 48.45November 55.49 52.43 54.87 52.18 55.28 56.94 50.55 58.57 56.65 53.95 55.43 55.09December 56.44 53.80 55.75 53.43 57.39 58.81 51.81 60.10 58.40 55.77 57.27 58.22
2017 47.05 46.14 48.43 45.60 48.50 48.34 44.60 50.37 48.06 47.90 48.56 48.46
2018January 61.75 59.25 61.50 59.18 62.56 63.85 57.22 65.57 63.42 61.57 62.87 61.88February 59.65 58.01 60.22 57.96 61.89 62.04 55.97 63.51 61.25 60.85 61.78 62.60
See footnotes at end of table.
U.S. Energy Information Administration�|�Petroleum Marketing Monthly 31
May 2018

Table 18. Domes c crude oil fi rst purchase prices (cont.)dollars per barrel
Year month
PAD District 4 PAD District 5
Average CO MT UT WY AverageAK North
Slope AK Other CAFederal
Off shore CA
1997 17.80 19.03 17.00 18.57 17.41 15.06 14.84 17.43 15.78 12.971998 11.38 12.56 11.28 12.52 10.70 8.80 8.47 11.55 9.55 6.991999 16.79 17.37 16.54 17.69 16.47 13.10 12.46 17.44 14.08 11.782000 27.60 28.85 27.82 28.53 26.89 24.16 23.62 28.23 24.82 23.322001 22.73 24.82 23.16 24.09 21.55 19.03 18.18 23.30 20.11 18.382002 23.01 25.29 22.76 23.87 21.96 20.39 19.37 24.47 21.87 19.032003 28.09 30.71 28.66 28.88 26.63 24.97 23.78 28.48 26.43 24.252004 37.34 40.38 38.53 39.35 35.10 33.69 33.03 38.76 34.47 32.232005 50.65 55.34 52.66 53.98 45.63 47.03 47.05 54.19 47.08 43.482006 57.38 63.80 56.69 59.70 53.25 57.03 56.86 64.10 57.34 53.372007 62.54 67.04 64.64 62.48 58.34 64.24 63.69 69.60 65.07 59.392008 88.23 90.80 89.96 86.58 86.07 90.16 90.10 95.04 90.47 85.682009 52.16 52.33 52.96 50.22 52.30 55.23 54.41 W 56.11 53.592010 69.72 72.75 70.24 68.09 68.10 73.29 72.33 W 74.51 69.802011 85.64 88.26 88.61 82.53 83.45 100.39 98.79 W 102.50 96.012012 82.91 85.78 82.98 82.73 80.70 101.33 98.70 W 104.10 97.042013 87.16 90.10 88.73 84.79 85.30 99.08 95.79 W 102.53 91.402014 80.92 82.48 80.54 79.04 80.54 89.30 86.41 W 92.14 80.552015 40.58 40.51 40.38 40.69 40.64 43.58 41.11 W 45.63 37.62
2016January 24.42 24.17 23.92 26.10 24.13 24.57 21.65 W 27.15 WFebruary 23.93 23.18 22.16 28.06 23.45 23.42 20.89 W 25.75 WMarch 30.86 31.64 29.68 32.68 29.89 30.56 28.12 W 32.89 WApril 34.19 35.40 33.38 33.38 33.68 33.97 32.02 W 35.69 WMay 39.74 41.31 38.90 38.42 39.16 39.59 37.81 W 41.31 WJune 42.95 44.07 41.90 42.01 42.69 40.17 37.90 W 42.12 WJuly 39.67 41.59 38.35 38.29 39.07 36.36 33.32 W 38.76 WAugust 39.22 41.23 37.45 38.27 38.53 37.46 34.27 W 40.05 WSeptember 39.41 40.61 37.50 39.06 39.07 37.78 34.47 W 40.47 WOctober 44.37 45.26 43.23 43.30 44.32 42.36 39.17 W 45.21 WNovember 40.10 40.70 38.77 39.46 40.22 38.51 36.40 W 40.49 WDecember 45.73 46.21 44.36 44.93 46.12 45.26 43.07 W 47.41 W
2016 36.68 37.81 35.40 36.92 35.98 35.68 33.13 W 37.96 W
2017January 46.14 47.14 44.74 44.83 46.23 46.55 43.91 W 49.00 WFebruary 48.06 49.79 46.75 45.88 47.94 47.42 45.01 W 49.73 WMarch 44.44 45.09 43.36 43.79 44.49 45.24 43.95 W 46.52 WApril 45.54 46.62 44.17 43.34 46.07 45.89 43.63 W 48.10 WMay 43.62 44.04 42.48 42.76 44.07 43.65 41.59 W 45.65 WJune 40.56 40.77 38.94 40.44 40.90 40.15 37.40 W 42.30 WJuly 41.64 41.92 40.40 40.23 42.63 42.48 40.56 W 44.04 WAugust 43.34 43.55 42.49 42.15 44.02 44.46 41.15 W 46.94 WSeptember 45.27 45.40 44.61 43.69 46.14 47.61 45.15 W 50.10 WOctober 46.88 46.88 46.83 45.15 47.76 50.42 47.93 W 53.08 WNovember 51.90 52.07 52.32 49.36 52.82 56.53 54.07 - 59.20 WDecember 52.86 53.08 53.29 50.11 53.83 58.03 54.88 W 60.87 W
2017 45.92 46.41 44.79 44.24 46.63 47.44 45.21 W 49.54 W
2018January 58.46 58.71 58.60 56.49 59.06 63.33 60.38 W 66.66 WFebruary 57.20 57.57 57.02 55.27 57.84 61.16 58.38 W 63.89 W
W = Withheld to avoid disclosure of individual company data.R = Revised data.Notes: - In November 2017, a new crude stream was added and a selected crude stream was deleted for North Dakota. In January 2004, new crude streams were added and selected crude streams were discon nued for California, Gulf Coast, Oklahoma, and Texas. - The actual domes c average price represents the average price at the lease (or wellhead) at which domes c crude oil is purchased. - Values shown for the current month are preliminary. Values shown for the previous month may be revised. Data through 2016 are fi nal.Sources: U.S. Energy Informa on Administra on Form EIA-182, "Domes c Crude Oil First Purchase Report."
U.S. Energy Information Administration�|�Petroleum Marketing Monthly32
May 2018

Table 19. Domes c crude oil fi rst purchase prices for selected crude streamsdollars per barrel
Year monthAlaska North
SlopeCalifornia Kern
RiverCalifornia
Midway-SunsetHeavy Louisiana
SweetLouisiana Light
Sweet Mars BlendWest Texas
IntermediateWest Texas
SourWyoming
Sweet
1997 14.84 15.02 14.88 - - - 19.27 17.77 -1998 8.47 8.59 8.48 - - - 12.89 11.50 -1999 12.46 14.02 12.22 - - - 17.78 16.66 -2000 23.62 23.88 23.56 - - - 29.16 27.66 -2001 18.18 19.03 19.50 - - - 24.62 22.10 -2002 19.37 19.80 22.81 - - - 24.33 23.23 -2003 23.78 25.24 26.67 - - - 29.60 28.18 30.112004 33.03 33.42 33.74 37.78 40.24 34.53 39.55 37.29 39.522005 47.05 44.67 45.93 51.61 51.95 46.13 53.90 50.72 53.942006 56.86 55.05 54.59 63.41 64.04 57.35 63.16 59.03 60.522007 63.69 62.14 61.62 70.00 72.93 63.37 69.59 65.56 64.792008 90.10 87.27 86.92 103.96 104.51 93.40 97.39 95.31 89.302009 54.41 53.94 53.00 58.61 61.26 57.21 57.27 56.63 51.682010 72.33 72.80 72.26 78.16 79.28 75.43 76.63 75.03 70.432011 98.79 103.14 100.96 106.74 108.48 105.30 92.18 90.77 87.422012 98.70 103.41 103.05 106.77 107.53 105.03 91.36 87.94 84.812013 95.79 101.33 101.02 105.73 106.32 100.80 95.26 92.51 90.102014 86.41 90.38 89.34 95.53 94.37 92.50 85.90 85.66 82.192015 41.11 44.71 43.81 47.83 47.91 46.27 44.58 45.78 41.77
2016January 21.65 26.39 24.98 30.14 29.26 27.73 27.29 28.66 25.36February 20.89 24.58 23.07 28.27 27.36 23.93 26.52 27.48 25.09March 28.12 31.85 31.35 33.12 34.04 28.54 32.75 33.67 32.31April 32.02 34.66 34.11 37.79 37.78 32.97 36.19 36.63 35.94May 37.81 40.15 39.20 42.27 43.19 37.12 42.18 42.34 41.89June 37.90 40.44 39.12 46.40 46.25 41.60 44.98 45.30 44.57July 33.32 37.10 37.22 43.12 42.93 40.20 41.24 41.68 40.99August 34.27 39.46 38.61 42.71 42.23 39.14 41.16 41.53 40.83September 34.47 39.45 38.53 42.60 42.14 38.70 41.36 40.88 41.21October 39.17 44.21 43.50 46.92 46.92 41.84 45.95 45.08 46.09November 36.40 39.48 39.23 44.35 43.22 41.27 42.38 42.20 42.19December 43.07 46.46 45.74 48.18 48.70 43.41 48.63 48.66 47.27
2016 33.13 36.83 36.12 40.37 40.56 36.75 39.20 39.44 37.86
2017January 43.91 47.73 47.17 50.28 49.41 45.84 49.42 48.73 47.82February 45.01 48.71 48.06 51.11 50.41 47.07 50.62 49.25 49.94March 43.95 45.60 45.23 48.88 47.06 45.86 46.83 45.96 45.96April 43.63 46.90 46.78 49.94 48.50 45.80 47.50 47.23 47.56May 41.59 44.62 44.30 48.49 46.43 45.00 44.93 44.87 45.02June 37.40 41.43 41.01 45.29 43.26 42.38 42.08 42.25 41.83July 40.56 43.10 42.63 46.18 44.62 42.21 43.35 43.67 43.66August 41.15 46.03 45.63 47.90 46.41 43.13 44.94 45.16 44.72September 45.15 49.17 48.66 49.63 48.41 46.32 47.18 47.29 46.79October 47.93 52.02 51.69 52.16 51.67 48.72 48.56 48.10 48.57November 54.07 W 57.91 58.58 58.13 54.02 54.75 53.89 53.58December 54.88 W 59.24 61.19 59.89 56.49 56.64 55.83 54.88
2017 45.21 48.33 48.04 50.27 49.52 46.89 48.50 48.26 47.80
2018January 60.38 W 65.50 65.56 64.79 60.92 62.31 61.81 60.77February 58.38 W 62.39 64.20 62.96 61.01 61.65 60.57 59.97
- = No data reported.R = Revised data.Notes: - In November 2017, a new crude stream was added and a selected crude stream was deleted for North Dakota. In January 2004, new crude streams were added and selected crude streams were discon nued for California, Gulf Coast, Oklahoma, and Texas. - Values shown for the current month are preliminary. Values shown for the previous month may be revised. Data through 2016 are fi nal.Sources: U.S. Energy Informa on Administra on, Form EIA-182, "Domes c Crude Oil First Purchase Report."
U.S. Energy Information Administration�|�Petroleum Marketing Monthly 33
May 2018

Table 20. Domes c crude oil fi rst purchase prices by API gravitydollars per barrel
Year month 20.0 or less 20.1 to 25.0 25.1 to 30.0 30.1 to 35.0 35.1 to 40.0 40.1 or greater
1997 15.44 16.27 14.87 18.38 18.62 19.261998 9.22 9.62 8.50 12.03 12.17 12.801999 14.00 15.30 12.50 16.92 17.18 17.642000 24.42 25.64 23.64 28.10 28.36 29.092001 19.53 19.59 18.18 23.31 23.99 24.432002 21.08 20.80 19.39 23.62 23.94 24.262003 25.82 25.56 23.80 28.77 29.21 29.662004 33.38 35.02 33.21 37.24 39.33 39.972005 45.01 46.33 47.09 50.81 53.14 54.062006 54.96 57.89 56.18 60.78 61.83 61.862007 62.00 64.94 62.83 67.14 69.29 69.172008 87.10 91.01 89.55 98.41 96.69 94.952009 54.05 55.66 54.30 57.66 56.93 56.662010 72.40 75.04 71.78 76.22 76.03 74.482011 101.30 103.07 97.12 99.65 94.54 91.872012 102.79 101.56 96.64 98.48 93.12 91.012013 99.40 100.70 94.13 99.11 96.24 94.762014 87.83 91.05 85.48 90.95 86.56 86.122015 43.88 45.71 40.73 46.82 44.67 43.65
2016January 26.13 27.33 21.54 28.96 27.30 26.42February 24.37 25.95 20.75 26.67 26.41 24.83March 31.93 33.32 27.70 31.90 32.98 31.98April 34.72 35.99 31.68 35.92 36.51 35.84May 40.00 41.97 37.41 40.94 42.41 41.45June 40.44 43.04 37.93 44.51 45.16 44.47July 37.34 39.42 33.47 41.82 41.55 40.99August 39.18 40.46 34.17 41.22 41.40 40.46September 39.39 40.76 34.40 40.88 41.55 40.70October 44.28 45.53 39.13 44.77 46.22 45.81November 39.72 41.31 36.30 42.59 42.57 41.49December 46.54 47.95 42.98 46.67 48.69 47.52
2016 36.87 38.52 32.94 38.95 39.33 38.25
2017January 48.35 49.32 43.77 48.25 49.47 48.12February 48.82 49.78 44.88 49.22 50.68 49.64March 45.70 46.37 43.79 46.92 46.93 46.04April 47.17 48.43 43.53 47.66 47.78 47.32May 44.77 46.00 41.55 46.07 45.26 45.31June 41.46 43.25 37.41 43.36 42.31 42.10July 43.22 44.58 40.48 43.96 43.61 43.62August 46.18 47.20 41.12 45.26 45.18 45.44September 49.30 50.57 45.06 47.62 47.39 47.29October 52.39 53.05 47.78 49.32 48.92 50.26November 58.59 58.91 53.91 55.01 54.99 56.23December 60.04 60.77 54.63 57.26 56.81 57.61
2017 48.73 49.17 45.08 48.40 48.63 48.44
2018January 66.17 66.46 60.05 62.38 62.46 63.07February 62.89 63.48 57.95 61.52 61.69 61.30
R = Revised data.Notes: - In November 2017, a new crude stream was added and a selected crude stream was deleted for North Dakota. In January 2004, new crude streams were added and selected crude streams were discon nued for California, Gulf Coast, Oklahoma, and Texas. - Values shown for the current month are preliminary. Values shown for the previous month may be revised. Data through 2016 are fi nal.Sources: U.S. Energy Informa on Administra on, Form EIA-182, "Domes c Crude Oil First Purchase Report."
U.S. Energy Information Administration�|�Petroleum Marketing Monthly34
May 2018
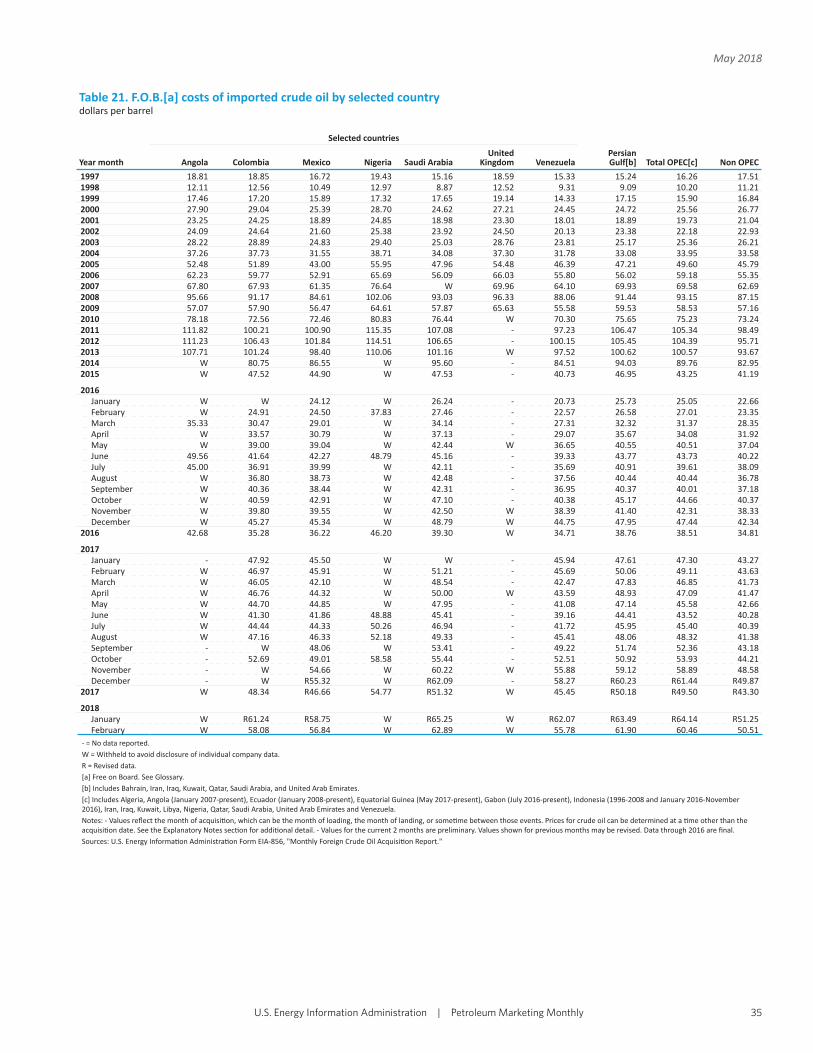
Table 21. F.O.B.[a] costs of imported crude oil by selected countrydollars per barrel
Year month
Selected countries
Persian Gulf[b] Total OPEC[c] Non OPECAngola Colombia Mexico Nigeria Saudi Arabia
United Kingdom Venezuela
1997 18.81 18.85 16.72 19.43 15.16 18.59 15.33 15.24 16.26 17.511998 12.11 12.56 10.49 12.97 8.87 12.52 9.31 9.09 10.20 11.211999 17.46 17.20 15.89 17.32 17.65 19.14 14.33 17.15 15.90 16.842000 27.90 29.04 25.39 28.70 24.62 27.21 24.45 24.72 25.56 26.772001 23.25 24.25 18.89 24.85 18.98 23.30 18.01 18.89 19.73 21.042002 24.09 24.64 21.60 25.38 23.92 24.50 20.13 23.38 22.18 22.932003 28.22 28.89 24.83 29.40 25.03 28.76 23.81 25.17 25.36 26.212004 37.26 37.73 31.55 38.71 34.08 37.30 31.78 33.08 33.95 33.582005 52.48 51.89 43.00 55.95 47.96 54.48 46.39 47.21 49.60 45.792006 62.23 59.77 52.91 65.69 56.09 66.03 55.80 56.02 59.18 55.352007 67.80 67.93 61.35 76.64 W 69.96 64.10 69.93 69.58 62.692008 95.66 91.17 84.61 102.06 93.03 96.33 88.06 91.44 93.15 87.152009 57.07 57.90 56.47 64.61 57.87 65.63 55.58 59.53 58.53 57.162010 78.18 72.56 72.46 80.83 76.44 W 70.30 75.65 75.23 73.242011 111.82 100.21 100.90 115.35 107.08 - 97.23 106.47 105.34 98.492012 111.23 106.43 101.84 114.51 106.65 - 100.15 105.45 104.39 95.712013 107.71 101.24 98.40 110.06 101.16 W 97.52 100.62 100.57 93.672014 W 80.75 86.55 W 95.60 - 84.51 94.03 89.76 82.952015 W 47.52 44.90 W 47.53 - 40.73 46.95 43.25 41.19
2016January W W 24.12 W 26.24 - 20.73 25.73 25.05 22.66February W 24.91 24.50 37.83 27.46 - 22.57 26.58 27.01 23.35March 35.33 30.47 29.01 W 34.14 - 27.31 32.32 31.37 28.35April W 33.57 30.79 W 37.13 - 29.07 35.67 34.08 31.92May W 39.00 39.04 W 42.44 W 36.65 40.55 40.51 37.04June 49.56 41.64 42.27 48.79 45.16 - 39.33 43.77 43.73 40.22July 45.00 36.91 39.99 W 42.11 - 35.69 40.91 39.61 38.09August W 36.80 38.73 W 42.48 - 37.56 40.44 40.44 36.78September W 40.36 38.44 W 42.31 - 36.95 40.37 40.01 37.18October W 40.59 42.91 W 47.10 - 40.38 45.17 44.66 40.37November W 39.80 39.55 W 42.50 W 38.39 41.40 42.31 38.33December W 45.27 45.34 W 48.79 W 44.75 47.95 47.44 42.34
2016 42.68 35.28 36.22 46.20 39.30 W 34.71 38.76 38.51 34.81
2017January - 47.92 45.50 W W - 45.94 47.61 47.30 43.27February W 46.97 45.91 W 51.21 - 45.69 50.06 49.11 43.63March W 46.05 42.10 W 48.54 - 42.47 47.83 46.85 41.73April W 46.76 44.32 W 50.00 W 43.59 48.93 47.09 41.47May W 44.70 44.85 W 47.95 - 41.08 47.14 45.58 42.66June W 41.30 41.86 48.88 45.41 - 39.16 44.41 43.52 40.28July W 44.44 44.33 50.26 46.94 - 41.72 45.95 45.40 40.39August W 47.16 46.33 52.18 49.33 - 45.41 48.06 48.32 41.38September - W 48.06 W 53.41 - 49.22 51.74 52.36 43.18October - 52.69 49.01 58.58 55.44 - 52.51 50.92 53.93 44.21November - W 54.66 W 60.22 W 55.88 59.12 58.89 48.58December - W R55.32 W R62.09 - 58.27 R60.23 R61.44 R49.87
2017 W 48.34 R46.66 54.77 R51.32 W 45.45 R50.18 R49.50 R43.30
2018January W R61.24 R58.75 W R65.25 W R62.07 R63.49 R64.14 R51.25February W 58.08 56.84 W 62.89 W 55.78 61.90 60.46 50.51
- = No data reported.W = Withheld to avoid disclosure of individual company data.R = Revised data.[a] Free on Board. See Glossary.[b] Includes Bahrain, Iran, Iraq, Kuwait, Qatar, Saudi Arabia, and United Arab Emirates.[c] Includes Algeria, Angola (January 2007-present), Ecuador (January 2008-present), Equatorial Guinea (May 2017-present), Gabon (July 2016-present), Indonesia (1996-2008 and January 2016-November 2016), Iran, Iraq, Kuwait, Libya, Nigeria, Qatar, Saudi Arabia, United Arab Emirates and Venezuela.Notes: - Values refl ect the month of acquisi on, which can be the month of loading, the month of landing, or some me between those events. Prices for crude oil can be determined at a me other than the acquisi on date. See the Explanatory Notes sec on for addi onal detail. - Values for the current 2 months are preliminary. Values shown for previous months may be revised. Data through 2016 are fi nal.Sources: U.S. Energy Informa on Administra on Form EIA-856, "Monthly Foreign Crude Oil Acquisi on Report."
U.S. Energy Information Administration�|�Petroleum Marketing Monthly 35
May 2018
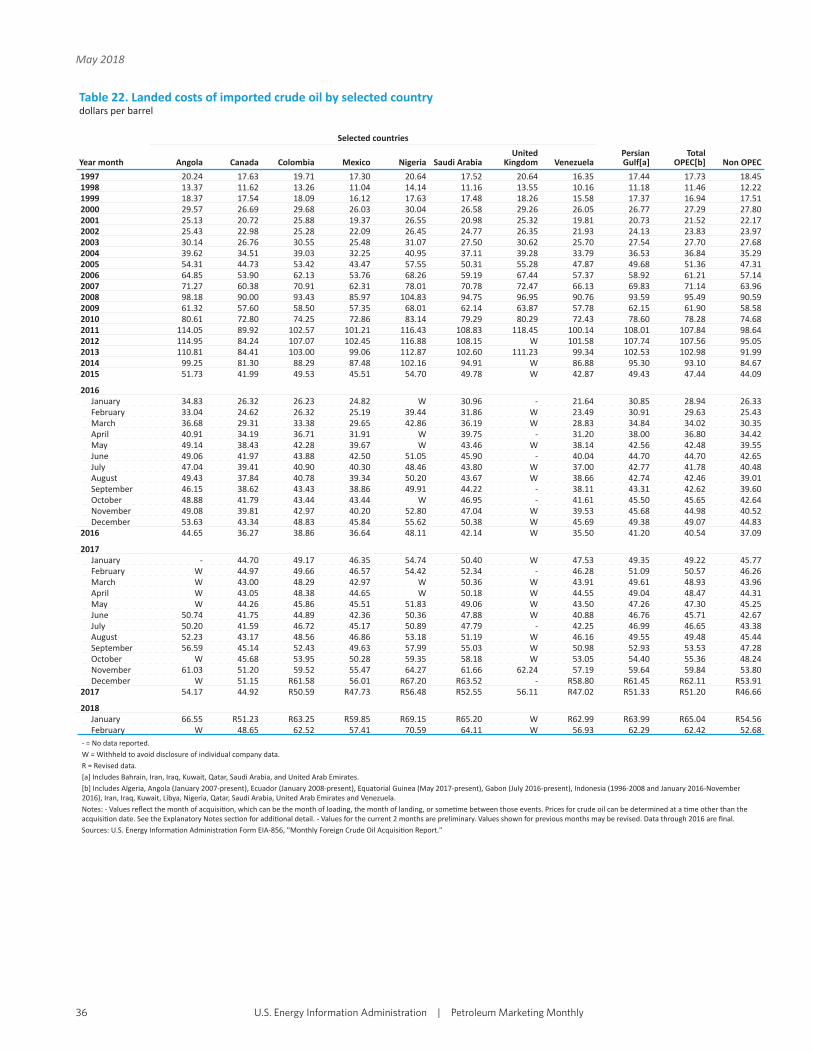
Table 22. Landed costs of imported crude oil by selected countrydollars per barrel
Year month
Selected countries
Persian Gulf[a]
Total OPEC[b] Non OPECAngola Canada Colombia Mexico Nigeria Saudi Arabia
United Kingdom Venezuela
1997 20.24 17.63 19.71 17.30 20.64 17.52 20.64 16.35 17.44 17.73 18.451998 13.37 11.62 13.26 11.04 14.14 11.16 13.55 10.16 11.18 11.46 12.221999 18.37 17.54 18.09 16.12 17.63 17.48 18.26 15.58 17.37 16.94 17.512000 29.57 26.69 29.68 26.03 30.04 26.58 29.26 26.05 26.77 27.29 27.802001 25.13 20.72 25.88 19.37 26.55 20.98 25.32 19.81 20.73 21.52 22.172002 25.43 22.98 25.28 22.09 26.45 24.77 26.35 21.93 24.13 23.83 23.972003 30.14 26.76 30.55 25.48 31.07 27.50 30.62 25.70 27.54 27.70 27.682004 39.62 34.51 39.03 32.25 40.95 37.11 39.28 33.79 36.53 36.84 35.292005 54.31 44.73 53.42 43.47 57.55 50.31 55.28 47.87 49.68 51.36 47.312006 64.85 53.90 62.13 53.76 68.26 59.19 67.44 57.37 58.92 61.21 57.142007 71.27 60.38 70.91 62.31 78.01 70.78 72.47 66.13 69.83 71.14 63.962008 98.18 90.00 93.43 85.97 104.83 94.75 96.95 90.76 93.59 95.49 90.592009 61.32 57.60 58.50 57.35 68.01 62.14 63.87 57.78 62.15 61.90 58.582010 80.61 72.80 74.25 72.86 83.14 79.29 80.29 72.43 78.60 78.28 74.682011 114.05 89.92 102.57 101.21 116.43 108.83 118.45 100.14 108.01 107.84 98.642012 114.95 84.24 107.07 102.45 116.88 108.15 W 101.58 107.74 107.56 95.052013 110.81 84.41 103.00 99.06 112.87 102.60 111.23 99.34 102.53 102.98 91.992014 99.25 81.30 88.29 87.48 102.16 94.91 W 86.88 95.30 93.10 84.672015 51.73 41.99 49.53 45.51 54.70 49.78 W 42.87 49.43 47.44 44.09
2016January 34.83 26.32 26.23 24.82 W 30.96 - 21.64 30.85 28.94 26.33February 33.04 24.62 26.32 25.19 39.44 31.86 W 23.49 30.91 29.63 25.43March 36.68 29.31 33.38 29.65 42.86 36.19 W 28.83 34.84 34.02 30.35April 40.91 34.19 36.71 31.91 W 39.75 - 31.20 38.00 36.80 34.42May 49.14 38.43 42.28 39.67 W 43.46 W 38.14 42.56 42.48 39.55June 49.06 41.97 43.88 42.50 51.05 45.90 - 40.04 44.70 44.70 42.65July 47.04 39.41 40.90 40.30 48.46 43.80 W 37.00 42.77 41.78 40.48August 49.43 37.84 40.78 39.34 50.20 43.67 W 38.66 42.74 42.46 39.01September 46.15 38.62 43.43 38.86 49.91 44.22 - 38.11 43.31 42.62 39.60October 48.88 41.79 43.44 43.44 W 46.95 - 41.61 45.50 45.65 42.64November 49.08 39.81 42.97 40.20 52.80 47.04 W 39.53 45.68 44.98 40.52December 53.63 43.34 48.83 45.84 55.62 50.38 W 45.69 49.38 49.07 44.83
2016 44.65 36.27 38.86 36.64 48.11 42.14 W 35.50 41.20 40.54 37.09
2017January - 44.70 49.17 46.35 54.74 50.40 W 47.53 49.35 49.22 45.77February W 44.97 49.66 46.57 54.42 52.34 - 46.28 51.09 50.57 46.26March W 43.00 48.29 42.97 W 50.36 W 43.91 49.61 48.93 43.96April W 43.05 48.38 44.65 W 50.18 W 44.55 49.04 48.47 44.31May W 44.26 45.86 45.51 51.83 49.06 W 43.50 47.26 47.30 45.25June 50.74 41.75 44.89 42.36 50.36 47.88 W 40.88 46.76 45.71 42.67July 50.20 41.59 46.72 45.17 50.89 47.79 - 42.25 46.99 46.65 43.38August 52.23 43.17 48.56 46.86 53.18 51.19 W 46.16 49.55 49.48 45.44September 56.59 45.14 52.43 49.63 57.99 55.03 W 50.98 52.93 53.53 47.28October W 45.68 53.95 50.28 59.35 58.18 W 53.05 54.40 55.36 48.24November 61.03 51.20 59.52 55.47 64.27 61.66 62.24 57.19 59.64 59.84 53.80December W 51.15 R61.58 56.01 R67.20 R63.52 - R58.80 R61.45 R62.11 R53.91
2017 54.17 44.92 R50.59 R47.73 R56.48 R52.55 56.11 R47.02 R51.33 R51.20 R46.66
2018January 66.55 R51.23 R63.25 R59.85 R69.15 R65.20 W R62.99 R63.99 R65.04 R54.56February W 48.65 62.52 57.41 70.59 64.11 W 56.93 62.29 62.42 52.68
- = No data reported.W = Withheld to avoid disclosure of individual company data.R = Revised data.[a] Includes Bahrain, Iran, Iraq, Kuwait, Qatar, Saudi Arabia, and United Arab Emirates.[b] Includes Algeria, Angola (January 2007-present), Ecuador (January 2008-present), Equatorial Guinea (May 2017-present), Gabon (July 2016-present), Indonesia (1996-2008 and January 2016-November 2016), Iran, Iraq, Kuwait, Libya, Nigeria, Qatar, Saudi Arabia, United Arab Emirates and Venezuela.Notes: - Values refl ect the month of acquisi on, which can be the month of loading, the month of landing, or some me between those events. Prices for crude oil can be determined at a me other than the acquisi on date. See the Explanatory Notes sec on for addi onal detail. - Values for the current 2 months are preliminary. Values shown for previous months may be revised. Data through 2016 are fi nal.Sources: U.S. Energy Informa on Administra on Form EIA-856, "Monthly Foreign Crude Oil Acquisi on Report."
U.S. Energy Information Administration�|�Petroleum Marketing Monthly36
May 2018
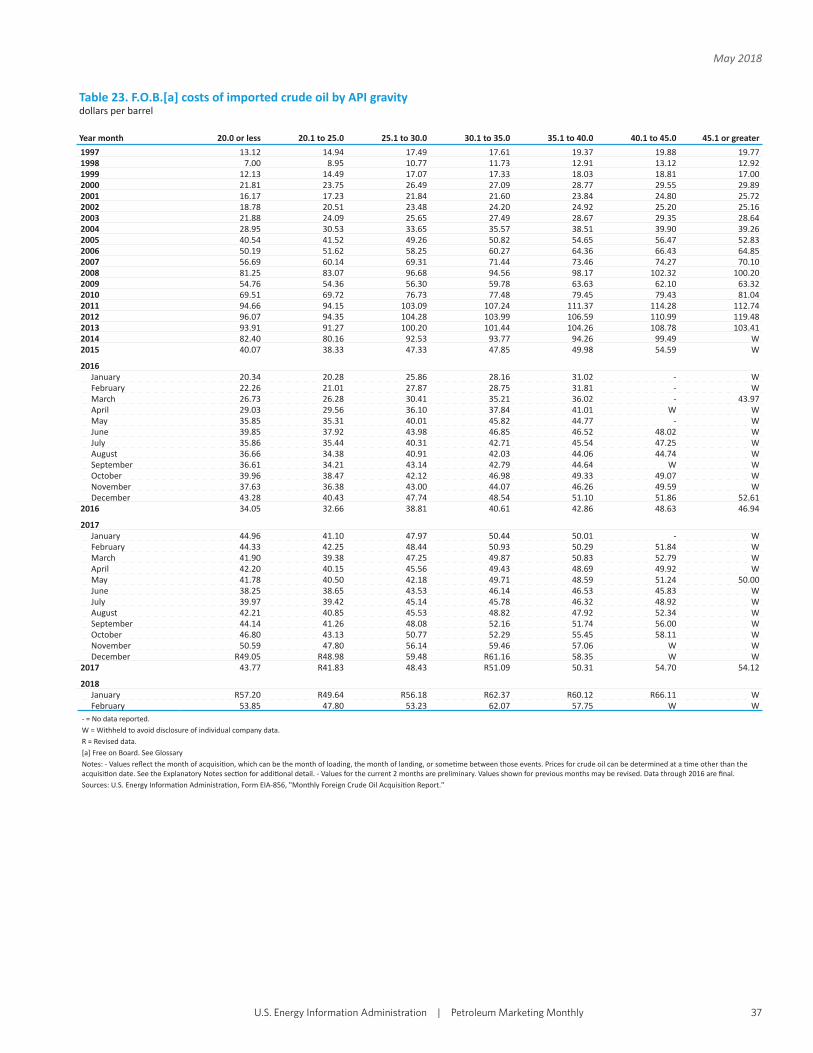
Table 23. F.O.B.[a] costs of imported crude oil by API gravitydollars per barrel
Year month 20.0 or less 20.1 to 25.0 25.1 to 30.0 30.1 to 35.0 35.1 to 40.0 40.1 to 45.0 45.1 or greater
1997 13.12 14.94 17.49 17.61 19.37 19.88 19.771998 7.00 8.95 10.77 11.73 12.91 13.12 12.921999 12.13 14.49 17.07 17.33 18.03 18.81 17.002000 21.81 23.75 26.49 27.09 28.77 29.55 29.892001 16.17 17.23 21.84 21.60 23.84 24.80 25.722002 18.78 20.51 23.48 24.20 24.92 25.20 25.162003 21.88 24.09 25.65 27.49 28.67 29.35 28.642004 28.95 30.53 33.65 35.57 38.51 39.90 39.262005 40.54 41.52 49.26 50.82 54.65 56.47 52.832006 50.19 51.62 58.25 60.27 64.36 66.43 64.852007 56.69 60.14 69.31 71.44 73.46 74.27 70.102008 81.25 83.07 96.68 94.56 98.17 102.32 100.202009 54.76 54.36 56.30 59.78 63.63 62.10 63.322010 69.51 69.72 76.73 77.48 79.45 79.43 81.042011 94.66 94.15 103.09 107.24 111.37 114.28 112.742012 96.07 94.35 104.28 103.99 106.59 110.99 119.482013 93.91 91.27 100.20 101.44 104.26 108.78 103.412014 82.40 80.16 92.53 93.77 94.26 99.49 W2015 40.07 38.33 47.33 47.85 49.98 54.59 W
2016January 20.34 20.28 25.86 28.16 31.02 - WFebruary 22.26 21.01 27.87 28.75 31.81 - WMarch 26.73 26.28 30.41 35.21 36.02 - 43.97April 29.03 29.56 36.10 37.84 41.01 W WMay 35.85 35.31 40.01 45.82 44.77 - WJune 39.85 37.92 43.98 46.85 46.52 48.02 WJuly 35.86 35.44 40.31 42.71 45.54 47.25 WAugust 36.66 34.38 40.91 42.03 44.06 44.74 WSeptember 36.61 34.21 43.14 42.79 44.64 W WOctober 39.96 38.47 42.12 46.98 49.33 49.07 WNovember 37.63 36.38 43.00 44.07 46.26 49.59 WDecember 43.28 40.43 47.74 48.54 51.10 51.86 52.61
2016 34.05 32.66 38.81 40.61 42.86 48.63 46.94
2017January 44.96 41.10 47.97 50.44 50.01 - WFebruary 44.33 42.25 48.44 50.93 50.29 51.84 WMarch 41.90 39.38 47.25 49.87 50.83 52.79 WApril 42.20 40.15 45.56 49.43 48.69 49.92 WMay 41.78 40.50 42.18 49.71 48.59 51.24 50.00June 38.25 38.65 43.53 46.14 46.53 45.83 WJuly 39.97 39.42 45.14 45.78 46.32 48.92 WAugust 42.21 40.85 45.53 48.82 47.92 52.34 WSeptember 44.14 41.26 48.08 52.16 51.74 56.00 WOctober 46.80 43.13 50.77 52.29 55.45 58.11 WNovember 50.59 47.80 56.14 59.46 57.06 W WDecember R49.05 R48.98 59.48 R61.16 58.35 W W
2017 43.77 R41.83 48.43 R51.09 50.31 54.70 54.12
2018January R57.20 R49.64 R56.18 R62.37 R60.12 R66.11 WFebruary 53.85 47.80 53.23 62.07 57.75 W W
- = No data reported.W = Withheld to avoid disclosure of individual company data.R = Revised data.[a] Free on Board. See GlossaryNotes: - Values refl ect the month of acquisi on, which can be the month of loading, the month of landing, or some me between those events. Prices for crude oil can be determined at a me other than the acquisi on date. See the Explanatory Notes sec on for addi onal detail. - Values for the current 2 months are preliminary. Values shown for previous months may be revised. Data through 2016 are fi nal.Sources: U.S. Energy Informa on Administra on, Form EIA-856, "Monthly Foreign Crude Oil Acquisi on Report."
U.S. Energy Information Administration�|�Petroleum Marketing Monthly 37
May 2018

Table 24. Landed costs of imported crude oil by API gravitydollars per barrel
Year month 20.0 or less 20.1 to 25.0 25.1 to 30.0 30.1 to 35.0 35.1 to 40.0 40.1 to 45.0 45.1 or greater
1997 14.42 15.79 18.57 18.42 20.34 21.09 20.851998 8.19 9.73 11.81 12.31 13.73 14.40 14.381999 13.40 15.30 17.33 17.81 18.18 19.22 18.482000 23.49 24.71 27.60 27.91 29.99 30.37 31.102001 17.66 18.14 23.29 22.21 24.86 26.59 26.492002 20.59 21.33 24.40 24.91 25.73 26.49 25.962003 23.87 25.15 27.78 28.78 29.95 30.73 30.902004 30.96 31.92 35.99 37.94 39.82 41.25 41.592005 42.20 42.24 49.94 52.18 54.95 58.38 56.432006 51.84 52.62 59.38 61.88 64.80 68.44 66.782007 59.01 60.64 68.95 72.03 73.17 75.68 73.572008 85.39 84.76 97.30 96.83 99.90 103.68 99.232009 56.38 55.68 61.28 62.43 64.80 64.82 63.902010 71.54 71.07 78.35 79.64 81.25 81.09 82.172011 96.89 93.32 106.06 108.76 110.93 115.40 113.242012 97.49 91.32 105.92 107.23 107.27 112.70 115.672013 95.87 88.35 101.63 102.97 104.39 110.66 105.882014 85.31 81.44 93.64 95.20 94.50 100.17 100.252015 43.20 41.14 49.58 50.16 50.78 54.54 51.70
2016January 22.58 23.84 28.81 32.31 33.96 W WFebruary 24.13 23.06 30.59 31.54 32.82 W WMarch 28.96 28.49 35.00 36.39 36.45 W 46.17April 31.16 32.03 38.03 39.61 41.84 42.79 WMay 38.32 37.95 44.04 44.45 45.26 47.93 WJune 40.90 40.39 44.61 47.16 48.13 50.67 WJuly 37.91 37.94 43.00 44.37 47.85 48.61 WAugust 38.22 36.47 43.35 44.02 45.83 46.60 WSeptember 37.99 36.77 44.73 44.69 46.71 46.95 WOctober 41.56 40.47 44.81 47.69 49.80 50.10 WNovember 39.80 37.88 46.14 46.52 48.22 50.71 52.19December 44.68 42.56 50.07 50.81 51.77 52.85 54.19
2016 35.85 34.78 41.73 42.14 44.49 48.15 48.93
2017January 46.52 43.28 49.62 51.68 51.39 W WFebruary 46.12 44.26 50.49 52.76 52.73 55.13 WMarch 44.21 41.81 48.25 51.15 51.67 53.80 WApril 44.29 42.59 48.59 50.09 50.76 51.84 WMay 43.89 43.00 46.77 50.28 51.31 53.66 51.87June 41.20 40.99 46.56 48.27 48.71 48.07 49.17July 41.84 42.10 47.40 47.86 48.15 49.96 50.85August 44.66 43.89 50.02 50.90 50.88 53.53 52.58September 47.14 45.72 51.94 54.60 52.54 56.15 WOctober 49.69 46.67 54.21 56.60 55.55 59.03 58.12November 54.62 51.87 59.98 61.24 58.86 64.22 65.83December R54.38 R51.80 R61.37 R62.87 R61.80 R64.66 W
2017 R46.47 R44.72 R51.34 R53.11 R52.49 R55.74 55.69
2018January R58.28 R52.82 R62.26 R64.28 R61.62 R68.53 R69.67February 54.05 50.18 61.85 63.37 64.10 65.18 W
- = No data reported.W = Withheld to avoid disclosure of individual company data.R = Revised data.Notes: - Values refl ect the month of acquisi on, which can be the month of loading, the month of landing, or some me between those events. Prices for crude oil can be determined at a me other than the acquisi on date. See the Explanatory Notes sec on for addi onal detail. - Values for the current 2 months are preliminary. Values shown for previous months may be revised. Data through 2016 are fi nal.Sources: U.S. Energy Informa on Administra on, Form EIA-856, "Monthly Foreign Crude Oil Acquisi on Report."
U.S. Energy Information Administration�|�Petroleum Marketing Monthly38
May 2018
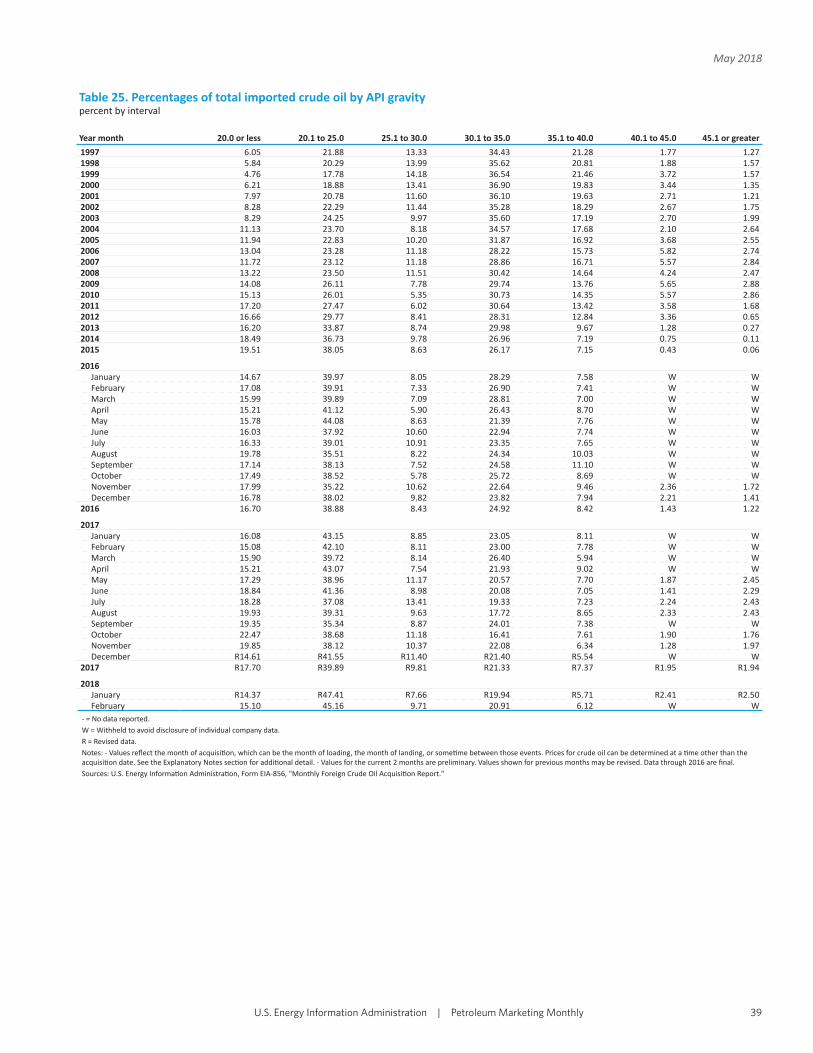
Table 25. Percentages of total imported crude oil by API gravitypercent by interval
Year month 20.0 or less 20.1 to 25.0 25.1 to 30.0 30.1 to 35.0 35.1 to 40.0 40.1 to 45.0 45.1 or greater
1997 6.05 21.88 13.33 34.43 21.28 1.77 1.271998 5.84 20.29 13.99 35.62 20.81 1.88 1.571999 4.76 17.78 14.18 36.54 21.46 3.72 1.572000 6.21 18.88 13.41 36.90 19.83 3.44 1.352001 7.97 20.78 11.60 36.10 19.63 2.71 1.212002 8.28 22.29 11.44 35.28 18.29 2.67 1.752003 8.29 24.25 9.97 35.60 17.19 2.70 1.992004 11.13 23.70 8.18 34.57 17.68 2.10 2.642005 11.94 22.83 10.20 31.87 16.92 3.68 2.552006 13.04 23.28 11.18 28.22 15.73 5.82 2.742007 11.72 23.12 11.18 28.86 16.71 5.57 2.842008 13.22 23.50 11.51 30.42 14.64 4.24 2.472009 14.08 26.11 7.78 29.74 13.76 5.65 2.882010 15.13 26.01 5.35 30.73 14.35 5.57 2.862011 17.20 27.47 6.02 30.64 13.42 3.58 1.682012 16.66 29.77 8.41 28.31 12.84 3.36 0.652013 16.20 33.87 8.74 29.98 9.67 1.28 0.272014 18.49 36.73 9.78 26.96 7.19 0.75 0.112015 19.51 38.05 8.63 26.17 7.15 0.43 0.06
2016January 14.67 39.97 8.05 28.29 7.58 W WFebruary 17.08 39.91 7.33 26.90 7.41 W WMarch 15.99 39.89 7.09 28.81 7.00 W WApril 15.21 41.12 5.90 26.43 8.70 W WMay 15.78 44.08 8.63 21.39 7.76 W WJune 16.03 37.92 10.60 22.94 7.74 W WJuly 16.33 39.01 10.91 23.35 7.65 W WAugust 19.78 35.51 8.22 24.34 10.03 W WSeptember 17.14 38.13 7.52 24.58 11.10 W WOctober 17.49 38.52 5.78 25.72 8.69 W WNovember 17.99 35.22 10.62 22.64 9.46 2.36 1.72December 16.78 38.02 9.82 23.82 7.94 2.21 1.41
2016 16.70 38.88 8.43 24.92 8.42 1.43 1.22
2017January 16.08 43.15 8.85 23.05 8.11 W WFebruary 15.08 42.10 8.11 23.00 7.78 W WMarch 15.90 39.72 8.14 26.40 5.94 W WApril 15.21 43.07 7.54 21.93 9.02 W WMay 17.29 38.96 11.17 20.57 7.70 1.87 2.45June 18.84 41.36 8.98 20.08 7.05 1.41 2.29July 18.28 37.08 13.41 19.33 7.23 2.24 2.43August 19.93 39.31 9.63 17.72 8.65 2.33 2.43September 19.35 35.34 8.87 24.01 7.38 W WOctober 22.47 38.68 11.18 16.41 7.61 1.90 1.76November 19.85 38.12 10.37 22.08 6.34 1.28 1.97December R14.61 R41.55 R11.40 R21.40 R5.54 W W
2017 R17.70 R39.89 R9.81 R21.33 R7.37 R1.95 R1.94
2018January R14.37 R47.41 R7.66 R19.94 R5.71 R2.41 R2.50February 15.10 45.16 9.71 20.91 6.12 W W
- = No data reported.W = Withheld to avoid disclosure of individual company data.R = Revised data.Notes: - Values refl ect the month of acquisi on, which can be the month of loading, the month of landing, or some me between those events. Prices for crude oil can be determined at a me other than the acquisi on date. See the Explanatory Notes sec on for addi onal detail. - Values for the current 2 months are preliminary. Values shown for previous months may be revised. Data through 2016 are fi nal.Sources: U.S. Energy Informa on Administra on, Form EIA-856, "Monthly Foreign Crude Oil Acquisi on Report."
U.S. Energy Information Administration�|�Petroleum Marketing Monthly 39
May 2018

Table 26. F.O.B.[a] costs of imported crude oil for selected crude streamsdollars per barrel
Year quarter month Canadian Lloydminster Iraqi Basrah Light Mexican Mayan Nigerian Qua Iboe Venezuelan Merey
2005 35.13 - 40.69 - -2006 44.55 - 51.29 - -2007 48.54 - 59.96 - -2008 79.33 - 82.99 - -2009 50.11 62.98 55.07 65.60 59.892010 64.41 74.36 70.36 82.66 70.262011 78.41 104.51 98.27 115.82 98.732012 77.01 103.17 99.81 115.85 102.042013 75.61 99.28 96.87 W 99.262014 75.42 92.96 85.83 W 89.862015 W 47.59 43.49 W 43.82
2016January - 24.24 24.21 W WFebruary - W 24.84 W WMarch - W 29.22 - W
1st quarter average - 26.69 26.05 W WApril - W 30.95 W WMay - W 39.08 W 38.57June - W 42.43 - 42.02
2nd quarter average - W 37.45 W 38.53July - W 40.25 - 40.28August - W 38.76 - 39.02September - 39.76 38.61 - 39.06
3rd quarter average - 39.69 39.20 - 39.36October - 44.37 43.20 W 42.84November - W 39.73 W 41.14December - W 45.55 W 45.11
4th quarter average - 44.01 42.52 W 43.192016 - 36.73 36.39 W 37.72
2017January - 46.71 45.74 W 45.80February W W 45.88 W 45.95March - W 42.30 W W
1st quarter average W 47.16 44.76 W 44.72April - W 44.54 W WMay - W 44.98 W WJune - W 42.07 W W
2nd quarter average - 44.20 43.74 W 44.88July - W 44.33 W WAugust - W 46.40 - WSeptember - W 48.11 W -
3rd quarter average - W 45.93 W WOctober - W 49.01 - WNovember - W 54.73 - WDecember - W R55.32 W -
4th quarter average - 55.65 R53.28 W 52.712017 W 49.09 R46.82 W 45.62
2018January - W R59.05 - WFebruary - W 56.86 - -
- = No data reported.W = Withheld to avoid disclosure of individual company data.R = Revised data.[a] Free on Board. See GlossaryNotes: - Eff ec ve January 2009, selected crude streams were discon nued and new crude steams were added for publica on. - Values refl ect the month of acquisi on, which can be the month of loading, the month of landing, or some me between those events. Prices for crude oil can be determined at a me other than the acquisi on date. See the Explanatory Notes sec on for addi onal detail. - Values for the current 2 months are preliminary. Values shown for previous months may be revised. Data through 2016 are fi nal.Sources: U.S. Energy Informa on Administra on, Form EIA-856, "Monthly Foreign Crude Oil Acquisi on Report."
U.S. Energy Information Administration�|�Petroleum Marketing Monthly40
May 2018
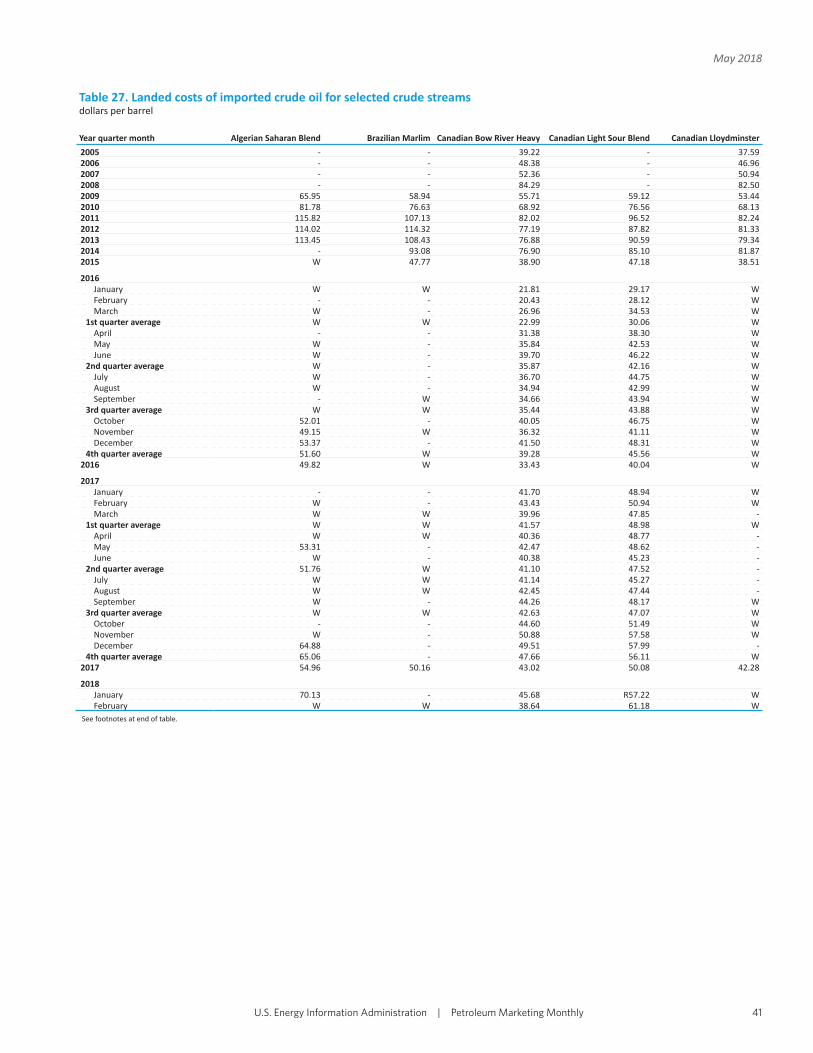
Table 27. Landed costs of imported crude oil for selected crude streamsdollars per barrel
Year quarter month Algerian Saharan Blend Brazilian Marlim Canadian Bow River Heavy Canadian Light Sour Blend Canadian Lloydminster
2005 - - 39.22 - 37.592006 - - 48.38 - 46.962007 - - 52.36 - 50.942008 - - 84.29 - 82.502009 65.95 58.94 55.71 59.12 53.442010 81.78 76.63 68.92 76.56 68.132011 115.82 107.13 82.02 96.52 82.242012 114.02 114.32 77.19 87.82 81.332013 113.45 108.43 76.88 90.59 79.342014 - 93.08 76.90 85.10 81.872015 W 47.77 38.90 47.18 38.51
2016January W W 21.81 29.17 WFebruary - - 20.43 28.12 WMarch W - 26.96 34.53 W
1st quarter average W W 22.99 30.06 WApril - - 31.38 38.30 WMay W - 35.84 42.53 WJune W - 39.70 46.22 W
2nd quarter average W - 35.87 42.16 WJuly W - 36.70 44.75 WAugust W - 34.94 42.99 WSeptember - W 34.66 43.94 W
3rd quarter average W W 35.44 43.88 WOctober 52.01 - 40.05 46.75 WNovember 49.15 W 36.32 41.11 WDecember 53.37 - 41.50 48.31 W
4th quarter average 51.60 W 39.28 45.56 W2016 49.82 W 33.43 40.04 W
2017January - - 41.70 48.94 WFebruary W - 43.43 50.94 WMarch W W 39.96 47.85 -
1st quarter average W W 41.57 48.98 WApril W W 40.36 48.77 -May 53.31 - 42.47 48.62 -June W - 40.38 45.23 -
2nd quarter average 51.76 W 41.10 47.52 -July W W 41.14 45.27 -August W W 42.45 47.44 -September W - 44.26 48.17 W
3rd quarter average W W 42.63 47.07 WOctober - - 44.60 51.49 WNovember W - 50.88 57.58 WDecember 64.88 - 49.51 57.99 -
4th quarter average 65.06 - 47.66 56.11 W2017 54.96 50.16 43.02 50.08 42.28
2018January 70.13 - 45.68 R57.22 WFebruary W W 38.64 61.18 W
See footnotes at end of table.
U.S. Energy Information Administration�|�Petroleum Marketing Monthly 41
May 2018
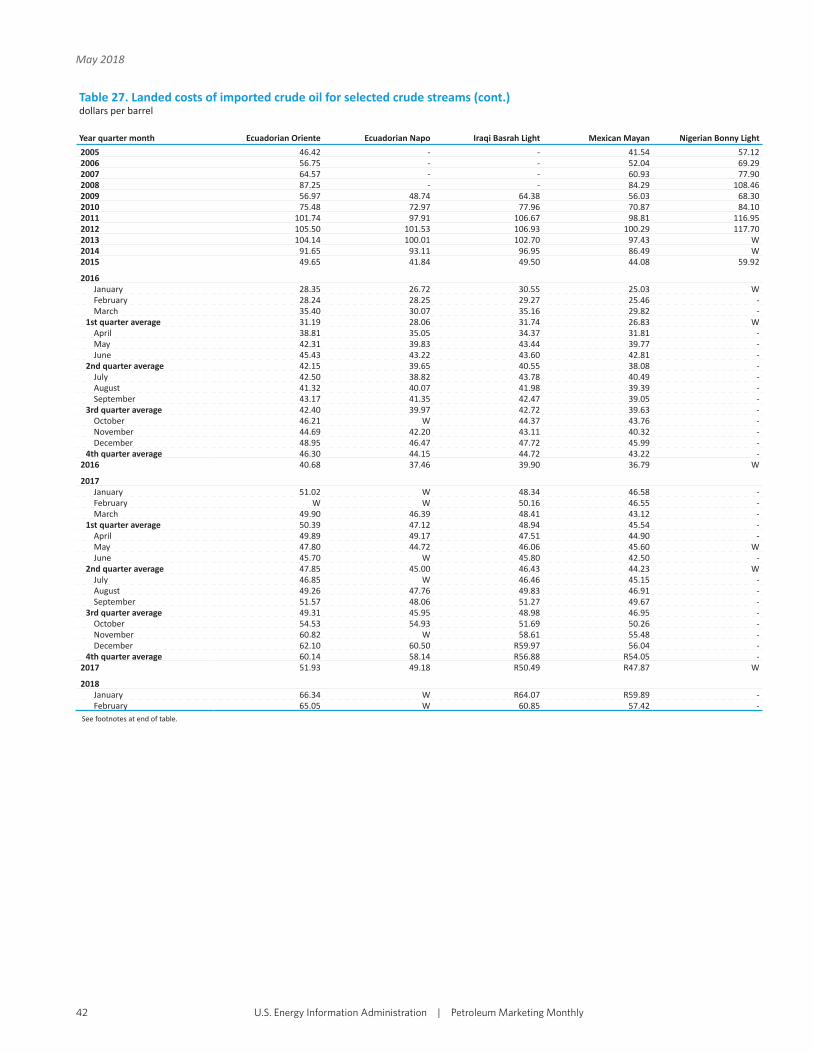
Table 27. Landed costs of imported crude oil for selected crude streams (cont.)dollars per barrel
Year quarter month Ecuadorian Oriente Ecuadorian Napo Iraqi Basrah Light Mexican Mayan Nigerian Bonny Light
2005 46.42 - - 41.54 57.122006 56.75 - - 52.04 69.292007 64.57 - - 60.93 77.902008 87.25 - - 84.29 108.462009 56.97 48.74 64.38 56.03 68.302010 75.48 72.97 77.96 70.87 84.102011 101.74 97.91 106.67 98.81 116.952012 105.50 101.53 106.93 100.29 117.702013 104.14 100.01 102.70 97.43 W2014 91.65 93.11 96.95 86.49 W2015 49.65 41.84 49.50 44.08 59.92
2016January 28.35 26.72 30.55 25.03 WFebruary 28.24 28.25 29.27 25.46 -March 35.40 30.07 35.16 29.82 -
1st quarter average 31.19 28.06 31.74 26.83 WApril 38.81 35.05 34.37 31.81 -May 42.31 39.83 43.44 39.77 -June 45.43 43.22 43.60 42.81 -
2nd quarter average 42.15 39.65 40.55 38.08 -July 42.50 38.82 43.78 40.49 -August 41.32 40.07 41.98 39.39 -September 43.17 41.35 42.47 39.05 -
3rd quarter average 42.40 39.97 42.72 39.63 -October 46.21 W 44.37 43.76 -November 44.69 42.20 43.11 40.32 -December 48.95 46.47 47.72 45.99 -
4th quarter average 46.30 44.15 44.72 43.22 -2016 40.68 37.46 39.90 36.79 W
2017January 51.02 W 48.34 46.58 -February W W 50.16 46.55 -March 49.90 46.39 48.41 43.12 -
1st quarter average 50.39 47.12 48.94 45.54 -April 49.89 49.17 47.51 44.90 -May 47.80 44.72 46.06 45.60 WJune 45.70 W 45.80 42.50 -
2nd quarter average 47.85 45.00 46.43 44.23 WJuly 46.85 W 46.46 45.15 -August 49.26 47.76 49.83 46.91 -September 51.57 48.06 51.27 49.67 -
3rd quarter average 49.31 45.95 48.98 46.95 -October 54.53 54.93 51.69 50.26 -November 60.82 W 58.61 55.48 -December 62.10 60.50 R59.97 56.04 -
4th quarter average 60.14 58.14 R56.88 R54.05 -2017 51.93 49.18 R50.49 R47.87 W
2018January 66.34 W R64.07 R59.89 -February 65.05 W 60.85 57.42 -
See footnotes at end of table.
U.S. Energy Information Administration�|�Petroleum Marketing Monthly42
May 2018
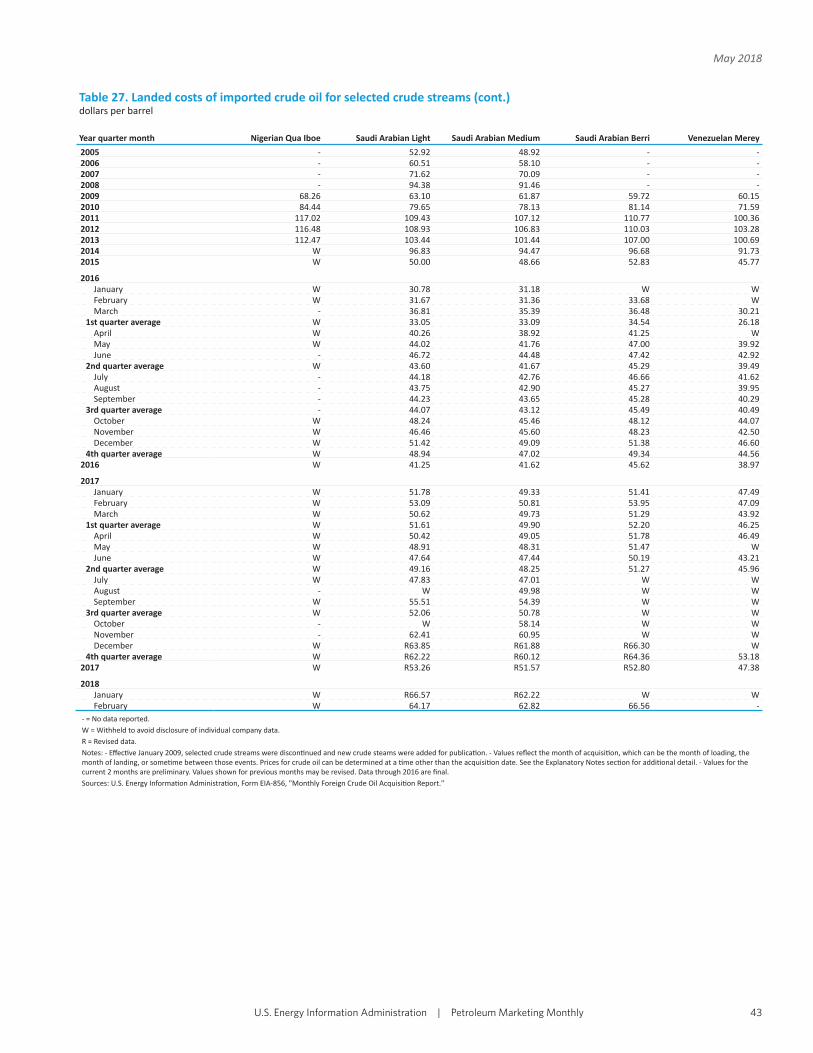
Table 27. Landed costs of imported crude oil for selected crude streams (cont.)dollars per barrel
Year quarter month Nigerian Qua Iboe Saudi Arabian Light Saudi Arabian Medium Saudi Arabian Berri Venezuelan Merey
2005 - 52.92 48.92 - -2006 - 60.51 58.10 - -2007 - 71.62 70.09 - -2008 - 94.38 91.46 - -2009 68.26 63.10 61.87 59.72 60.152010 84.44 79.65 78.13 81.14 71.592011 117.02 109.43 107.12 110.77 100.362012 116.48 108.93 106.83 110.03 103.282013 112.47 103.44 101.44 107.00 100.692014 W 96.83 94.47 96.68 91.732015 W 50.00 48.66 52.83 45.77
2016January W 30.78 31.18 W WFebruary W 31.67 31.36 33.68 WMarch - 36.81 35.39 36.48 30.21
1st quarter average W 33.05 33.09 34.54 26.18April W 40.26 38.92 41.25 WMay W 44.02 41.76 47.00 39.92June - 46.72 44.48 47.42 42.92
2nd quarter average W 43.60 41.67 45.29 39.49July - 44.18 42.76 46.66 41.62August - 43.75 42.90 45.27 39.95September - 44.23 43.65 45.28 40.29
3rd quarter average - 44.07 43.12 45.49 40.49October W 48.24 45.46 48.12 44.07November W 46.46 45.60 48.23 42.50December W 51.42 49.09 51.38 46.60
4th quarter average W 48.94 47.02 49.34 44.562016 W 41.25 41.62 45.62 38.97
2017January W 51.78 49.33 51.41 47.49February W 53.09 50.81 53.95 47.09March W 50.62 49.73 51.29 43.92
1st quarter average W 51.61 49.90 52.20 46.25April W 50.42 49.05 51.78 46.49May W 48.91 48.31 51.47 WJune W 47.64 47.44 50.19 43.21
2nd quarter average W 49.16 48.25 51.27 45.96July W 47.83 47.01 W WAugust - W 49.98 W WSeptember W 55.51 54.39 W W
3rd quarter average W 52.06 50.78 W WOctober - W 58.14 W WNovember - 62.41 60.95 W WDecember W R63.85 R61.88 R66.30 W
4th quarter average W R62.22 R60.12 R64.36 53.182017 W R53.26 R51.57 R52.80 47.38
2018January W R66.57 R62.22 W WFebruary W 64.17 62.82 66.56 -
- = No data reported.W = Withheld to avoid disclosure of individual company data.R = Revised data.Notes: - Eff ec ve January 2009, selected crude streams were discon nued and new crude steams were added for publica on. - Values refl ect the month of acquisi on, which can be the month of loading, the month of landing, or some me between those events. Prices for crude oil can be determined at a me other than the acquisi on date. See the Explanatory Notes sec on for addi onal detail. - Values for the current 2 months are preliminary. Values shown for previous months may be revised. Data through 2016 are fi nal.Sources: U.S. Energy Informa on Administra on, Form EIA-856, "Monthly Foreign Crude Oil Acquisi on Report."
U.S. Energy Information Administration�|�Petroleum Marketing Monthly 43
May 2018

Prices of Petroleum Products
U.S. Energy Information Administration�|�Petroleum Marketing Monthly
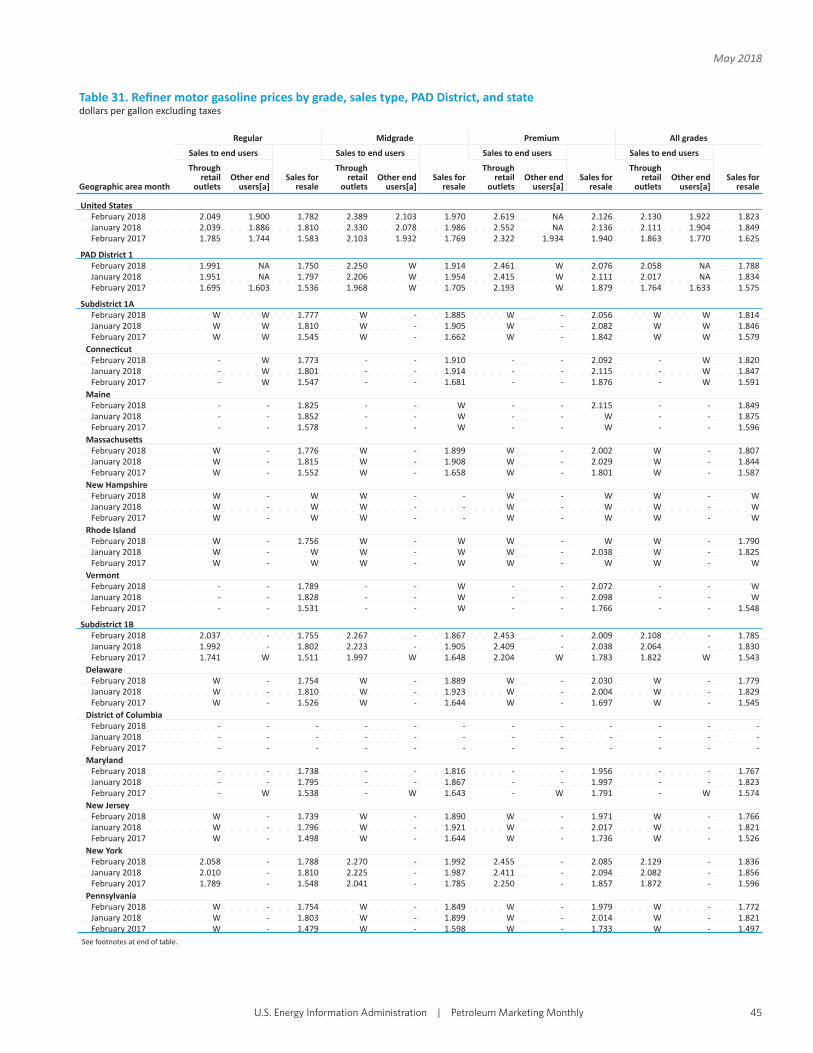
Table 31. Refi ner motor gasoline prices by grade, sales type, PAD District, and statedollars per gallon excluding taxes
Geographic area month
Regular Midgrade Premium All grades
Sales to end users
Sales for resale
Sales to end users
Sales for resale
Sales to end users
Sales for resale
Sales to end users
Sales for resale
Through retail
outletsOther end
users[a]
Through retail
outletsOther end
users[a]
Through retail
outletsOther end
users[a]
Through retail
outletsOther end
users[a]
United StatesFebruary 2018 2.049 1.900 1.782 2.389 2.103 1.970 2.619 NA 2.126 2.130 1.922 1.823January 2018 2.039 1.886 1.810 2.330 2.078 1.986 2.552 NA 2.136 2.111 1.904 1.849February 2017 1.785 1.744 1.583 2.103 1.932 1.769 2.322 1.934 1.940 1.863 1.770 1.625
PAD District 1February 2018 1.991 NA 1.750 2.250 W 1.914 2.461 W 2.076 2.058 NA 1.788January 2018 1.951 NA 1.797 2.206 W 1.954 2.415 W 2.111 2.017 NA 1.834February 2017 1.695 1.603 1.536 1.968 W 1.705 2.193 W 1.879 1.764 1.633 1.575
Subdistrict 1AFebruary 2018 W W 1.777 W - 1.885 W - 2.056 W W 1.814January 2018 W W 1.810 W - 1.905 W - 2.082 W W 1.846February 2017 W W 1.545 W - 1.662 W - 1.842 W W 1.579
Connec cutFebruary 2018 - W 1.773 - - 1.910 - - 2.092 - W 1.820January 2018 - W 1.801 - - 1.914 - - 2.115 - W 1.847February 2017 - W 1.547 - - 1.681 - - 1.876 - W 1.591
MaineFebruary 2018 - - 1.825 - - W - - 2.115 - - 1.849January 2018 - - 1.852 - - W - - W - - 1.875February 2017 - - 1.578 - - W - - W - - 1.596
Massachuse sFebruary 2018 W - 1.776 W - 1.899 W - 2.002 W - 1.807January 2018 W - 1.815 W - 1.908 W - 2.029 W - 1.844February 2017 W - 1.552 W - 1.658 W - 1.801 W - 1.587
New HampshireFebruary 2018 W - W W - - W - W W - WJanuary 2018 W - W W - - W - W W - WFebruary 2017 W - W W - - W - W W - W
Rhode IslandFebruary 2018 W - 1.756 W - W W - W W - 1.790January 2018 W - W W - W W - 2.038 W - 1.825February 2017 W - W W - W W - W W - W
VermontFebruary 2018 - - 1.789 - - W - - 2.072 - - WJanuary 2018 - - 1.828 - - W - - 2.098 - - WFebruary 2017 - - 1.531 - - W - - 1.766 - - 1.548
Subdistrict 1BFebruary 2018 2.037 - 1.755 2.267 - 1.867 2.453 - 2.009 2.108 - 1.785January 2018 1.992 - 1.802 2.223 - 1.905 2.409 - 2.038 2.064 - 1.830February 2017 1.741 W 1.511 1.997 W 1.648 2.204 W 1.783 1.822 W 1.543
DelawareFebruary 2018 W - 1.754 W - 1.889 W - 2.030 W - 1.779January 2018 W - 1.810 W - 1.923 W - 2.004 W - 1.829February 2017 W - 1.526 W - 1.644 W - 1.697 W - 1.545
District of ColumbiaFebruary 2018 - - - - - - - - - - - -January 2018 - - - - - - - - - - - -February 2017 - - - - - - - - - - - -
MarylandFebruary 2018 - - 1.738 - - 1.816 - - 1.956 - - 1.767January 2018 - - 1.795 - - 1.867 - - 1.997 - - 1.823February 2017 - W 1.538 - W 1.643 - W 1.791 - W 1.574
New JerseyFebruary 2018 W - 1.739 W - 1.890 W - 1.971 W - 1.766January 2018 W - 1.796 W - 1.921 W - 2.017 W - 1.821February 2017 W - 1.498 W - 1.644 W - 1.736 W - 1.526
New YorkFebruary 2018 2.058 - 1.788 2.270 - 1.992 2.455 - 2.085 2.129 - 1.836January 2018 2.010 - 1.810 2.225 - 1.987 2.411 - 2.094 2.082 - 1.856February 2017 1.789 - 1.548 2.041 - 1.785 2.250 - 1.857 1.872 - 1.596
PennsylvaniaFebruary 2018 W - 1.754 W - 1.849 W - 1.979 W - 1.772January 2018 W - 1.803 W - 1.899 W - 2.014 W - 1.821February 2017 W - 1.479 W - 1.598 W - 1.733 W - 1.497
See footnotes at end of table.
U.S. Energy Information Administration�|�Petroleum Marketing Monthly 45
May 2018

Table 31. Refi ner motor gasoline prices by grade, sales type, PAD District, and state (cont.)dollars per gallon excluding taxes
Geographic area month
Regular Midgrade Premium All grades
Sales to end users
Sales for resale
Sales to end users
Sales for resale
Sales to end users
Sales for resale
Sales to end users
Sales for resale
Through retail
outletsOther end
users[a]
Through retail
outletsOther end
users[a]
Through retail
outletsOther end
users[a]
Through retail
outletsOther end
users[a]
Subdistrict 1CFebruary 2018 W NA 1.744 W W 1.928 W W 2.123 W W 1.787January 2018 W W 1.793 W W 1.972 W W 2.166 W W 1.835February 2017 W 1.612 1.548 W NA 1.726 W W 1.942 W 1.640 1.593
FloridaFebruary 2018 W W 1.781 W - 2.003 W - 2.166 W W 1.832January 2018 W W 1.825 W - 2.038 W W 2.207 W W 1.873February 2017 W W 1.605 W - 1.826 W W 2.003 W W 1.656
GeorgiaFebruary 2018 W W 1.726 W - 1.891 W - 2.136 W W 1.772January 2018 W W 1.768 W - 1.937 W - 2.183 W W 1.814February 2017 W W 1.521 W - 1.674 W - 1.938 W W 1.566
North CarolinaFebruary 2018 W - 1.720 W - 1.926 W - 2.106 W - 1.761January 2018 W - 1.771 W - 1.973 W - 2.152 W - 1.811February 2017 W - 1.517 W - 1.711 W - 1.912 W - 1.557
South CarolinaFebruary 2018 W W 1.716 W W 1.944 W W 2.104 W W 1.752January 2018 W W 1.774 W W 1.996 W W 2.154 W W 1.810February 2017 W - 1.516 W NA 1.712 W - 1.903 W NA 1.551
VirginiaFebruary 2018 - - 1.739 - - 1.850 - - 2.034 - - 1.774January 2018 - - 1.796 - - 1.905 - - 2.076 - - 1.829February 2017 W - 1.534 W - 1.673 W - 1.856 W - 1.575
West VirginiaFebruary 2018 W - 1.703 W - 1.876 W - 2.173 W - 1.718January 2018 W - 1.782 W - 1.937 W - 2.160 W - 1.802February 2017 W - 1.460 W - 1.647 W - 1.907 W - 1.481
PAD District 2February 2018 W 1.889 1.699 2.161 W 1.859 W 2.093 2.053 W 1.906 1.729January 2018 W 1.878 1.766 2.228 W 1.910 W 2.147 2.122 W 1.894 1.796February 2017 W 1.735 1.510 1.934 W 1.653 W W 1.866 W 1.763 1.538
IllinoisFebruary 2018 W 1.879 1.678 W - 1.838 W - 2.051 W 1.879 1.714January 2018 W 1.934 1.772 W - 1.927 W - 2.149 W 1.934 1.809February 2017 W W 1.530 W - 1.693 W - 1.967 W W 1.572
IndianaFebruary 2018 W W 1.646 W - 1.838 W - 2.056 W W 1.672January 2018 W W 1.737 W - 1.937 W - 2.152 W W 1.765February 2017 W W 1.478 W - 1.701 W - 1.900 W W 1.505
IowaFebruary 2018 - W 1.774 - - 1.877 - - 2.084 - W 1.804January 2018 - W 1.801 - - 1.903 - - 2.114 - W 1.835February 2017 - W 1.574 - - 1.664 - - 1.783 - W 1.598
KansasFebruary 2018 W W 1.745 W W 1.859 - - 1.953 W W 1.760January 2018 W W 1.754 W W 1.866 - - 1.933 W W 1.767February 2017 W W 1.543 W W 1.636 - - 1.714 W W 1.557
KentuckyFebruary 2018 W W 1.732 W - 1.914 W W 2.144 W W 1.755January 2018 W W 1.799 W - 1.972 W W 2.200 W W 1.821February 2017 W W 1.553 W - 1.720 W W 1.996 W W 1.580
MichiganFebruary 2018 W W 1.642 W - 1.871 W W 2.139 W W 1.669January 2018 W W 1.754 W - 1.977 W W 2.257 W W 1.782February 2017 W W 1.461 W - 1.691 W W 1.951 W W 1.488
MinnesotaFebruary 2018 W W 1.764 W W 1.830 W W 1.975 W W 1.784January 2018 W W 1.807 W W 1.866 W W 2.041 W W 1.829February 2017 W W 1.520 W W 1.570 W - 1.680 W W 1.532
MissouriFebruary 2018 - W 1.762 - - 1.887 - - 2.084 - W 1.784January 2018 - W 1.788 - - 1.919 - - 2.133 - W 1.811February 2017 - W 1.566 - - 1.690 - W 1.843 - W 1.585
See footnotes at end of table.
U.S. Energy Information Administration�|�Petroleum Marketing Monthly46
May 2018
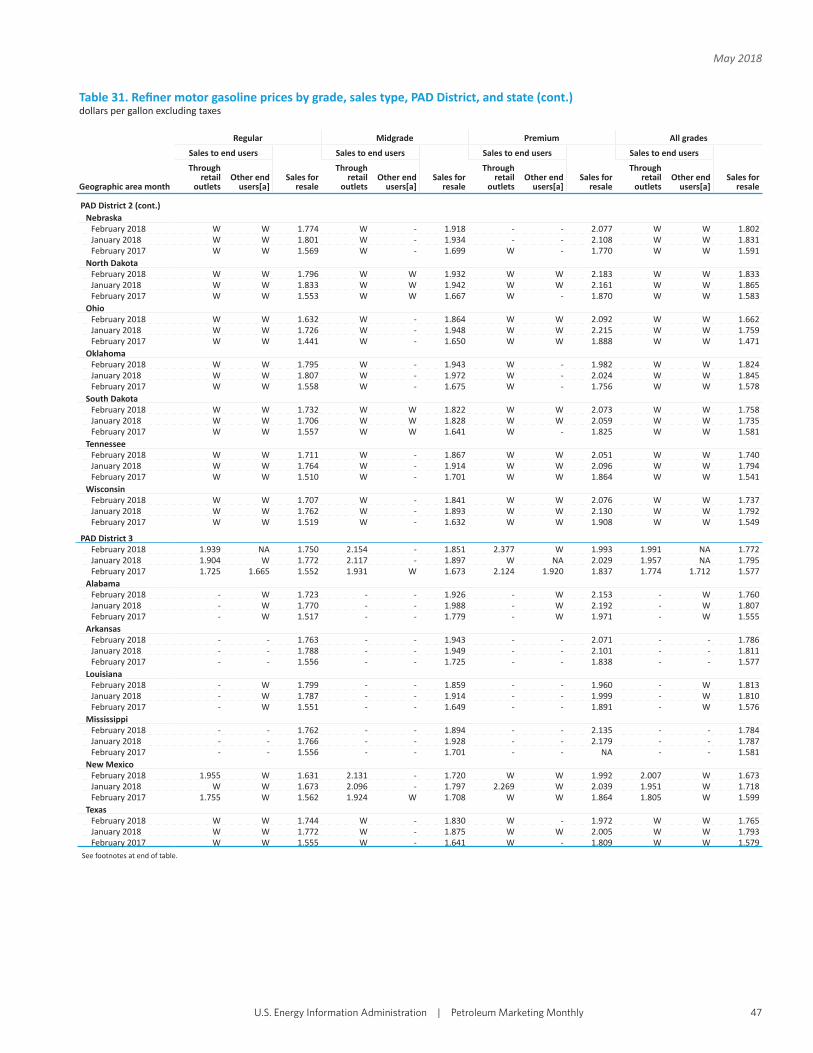
Table 31. Refi ner motor gasoline prices by grade, sales type, PAD District, and state (cont.)dollars per gallon excluding taxes
Geographic area month
Regular Midgrade Premium All grades
Sales to end users
Sales for resale
Sales to end users
Sales for resale
Sales to end users
Sales for resale
Sales to end users
Sales for resale
Through retail
outletsOther end
users[a]
Through retail
outletsOther end
users[a]
Through retail
outletsOther end
users[a]
Through retail
outletsOther end
users[a]
PAD District 2 (cont.)Nebraska
February 2018 W W 1.774 W - 1.918 - - 2.077 W W 1.802January 2018 W W 1.801 W - 1.934 - - 2.108 W W 1.831February 2017 W W 1.569 W - 1.699 W - 1.770 W W 1.591
North DakotaFebruary 2018 W W 1.796 W W 1.932 W W 2.183 W W 1.833January 2018 W W 1.833 W W 1.942 W W 2.161 W W 1.865February 2017 W W 1.553 W W 1.667 W - 1.870 W W 1.583
OhioFebruary 2018 W W 1.632 W - 1.864 W W 2.092 W W 1.662January 2018 W W 1.726 W - 1.948 W W 2.215 W W 1.759February 2017 W W 1.441 W - 1.650 W W 1.888 W W 1.471
OklahomaFebruary 2018 W W 1.795 W - 1.943 W - 1.982 W W 1.824January 2018 W W 1.807 W - 1.972 W - 2.024 W W 1.845February 2017 W W 1.558 W - 1.675 W - 1.756 W W 1.578
South DakotaFebruary 2018 W W 1.732 W W 1.822 W W 2.073 W W 1.758January 2018 W W 1.706 W W 1.828 W W 2.059 W W 1.735February 2017 W W 1.557 W W 1.641 W - 1.825 W W 1.581
TennesseeFebruary 2018 W W 1.711 W - 1.867 W W 2.051 W W 1.740January 2018 W W 1.764 W - 1.914 W W 2.096 W W 1.794February 2017 W W 1.510 W - 1.701 W W 1.864 W W 1.541
WisconsinFebruary 2018 W W 1.707 W - 1.841 W W 2.076 W W 1.737January 2018 W W 1.762 W - 1.893 W W 2.130 W W 1.792February 2017 W W 1.519 W - 1.632 W W 1.908 W W 1.549
PAD District 3February 2018 1.939 NA 1.750 2.154 - 1.851 2.377 W 1.993 1.991 NA 1.772January 2018 1.904 W 1.772 2.117 - 1.897 W NA 2.029 1.957 NA 1.795February 2017 1.725 1.665 1.552 1.931 W 1.673 2.124 1.920 1.837 1.774 1.712 1.577
AlabamaFebruary 2018 - W 1.723 - - 1.926 - W 2.153 - W 1.760January 2018 - W 1.770 - - 1.988 - W 2.192 - W 1.807February 2017 - W 1.517 - - 1.779 - W 1.971 - W 1.555
ArkansasFebruary 2018 - - 1.763 - - 1.943 - - 2.071 - - 1.786January 2018 - - 1.788 - - 1.949 - - 2.101 - - 1.811February 2017 - - 1.556 - - 1.725 - - 1.838 - - 1.577
LouisianaFebruary 2018 - W 1.799 - - 1.859 - - 1.960 - W 1.813January 2018 - W 1.787 - - 1.914 - - 1.999 - W 1.810February 2017 - W 1.551 - - 1.649 - - 1.891 - W 1.576
MississippiFebruary 2018 - - 1.762 - - 1.894 - - 2.135 - - 1.784January 2018 - - 1.766 - - 1.928 - - 2.179 - - 1.787February 2017 - - 1.556 - - 1.701 - - NA - - 1.581
New MexicoFebruary 2018 1.955 W 1.631 2.131 - 1.720 W W 1.992 2.007 W 1.673January 2018 W W 1.673 2.096 - 1.797 2.269 W 2.039 1.951 W 1.718February 2017 1.755 W 1.562 1.924 W 1.708 W W 1.864 1.805 W 1.599
TexasFebruary 2018 W W 1.744 W - 1.830 W - 1.972 W W 1.765January 2018 W W 1.772 W - 1.875 W W 2.005 W W 1.793February 2017 W W 1.555 W - 1.641 W - 1.809 W W 1.579
See footnotes at end of table.
U.S. Energy Information Administration�|�Petroleum Marketing Monthly 47
May 2018
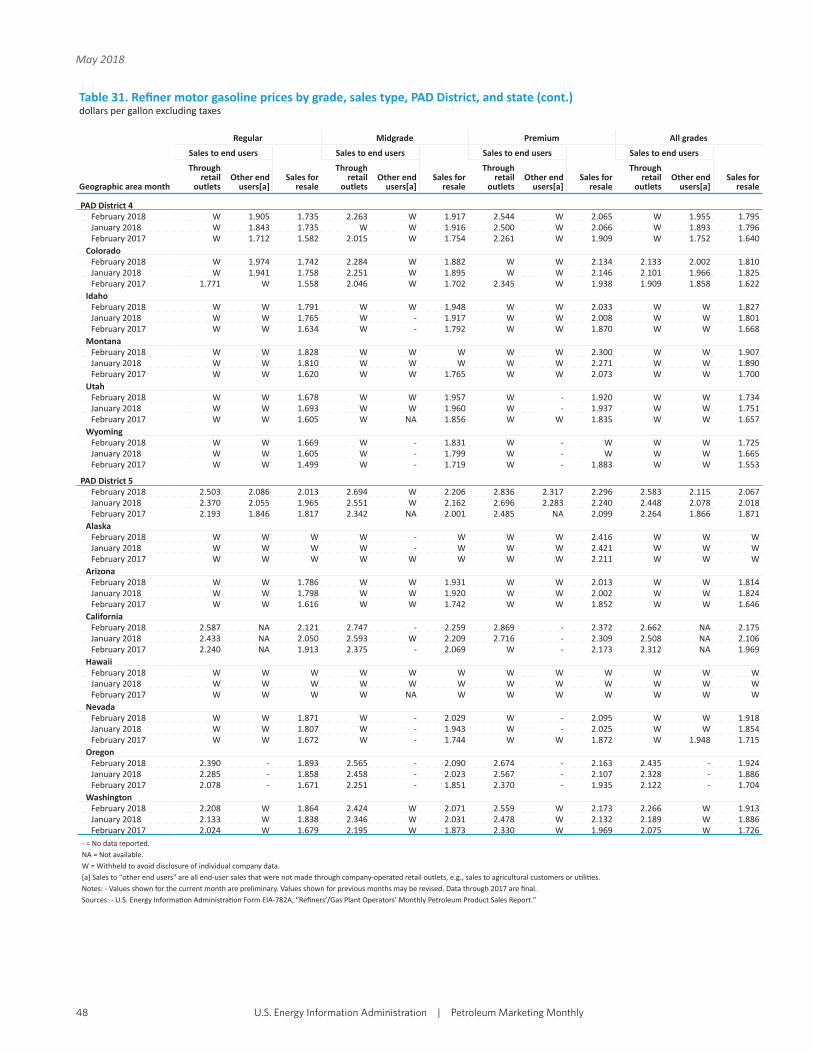
Table 31. Refi ner motor gasoline prices by grade, sales type, PAD District, and state (cont.)dollars per gallon excluding taxes
Geographic area month
Regular Midgrade Premium All grades
Sales to end users
Sales for resale
Sales to end users
Sales for resale
Sales to end users
Sales for resale
Sales to end users
Sales for resale
Through retail
outletsOther end
users[a]
Through retail
outletsOther end
users[a]
Through retail
outletsOther end
users[a]
Through retail
outletsOther end
users[a]
PAD District 4February 2018 W 1.905 1.735 2.263 W 1.917 2.544 W 2.065 W 1.955 1.795January 2018 W 1.843 1.735 W W 1.916 2.500 W 2.066 W 1.893 1.796February 2017 W 1.712 1.582 2.015 W 1.754 2.261 W 1.909 W 1.752 1.640
ColoradoFebruary 2018 W 1.974 1.742 2.284 W 1.882 W W 2.134 2.133 2.002 1.810January 2018 W 1.941 1.758 2.251 W 1.895 W W 2.146 2.101 1.966 1.825February 2017 1.771 W 1.558 2.046 W 1.702 2.345 W 1.938 1.909 1.858 1.622
IdahoFebruary 2018 W W 1.791 W W 1.948 W W 2.033 W W 1.827January 2018 W W 1.765 W - 1.917 W W 2.008 W W 1.801February 2017 W W 1.634 W - 1.792 W W 1.870 W W 1.668
MontanaFebruary 2018 W W 1.828 W W W W W 2.300 W W 1.907January 2018 W W 1.810 W W W W W 2.271 W W 1.890February 2017 W W 1.620 W W 1.765 W W 2.073 W W 1.700
UtahFebruary 2018 W W 1.678 W W 1.957 W - 1.920 W W 1.734January 2018 W W 1.693 W W 1.960 W - 1.937 W W 1.751February 2017 W W 1.605 W NA 1.856 W W 1.835 W W 1.657
WyomingFebruary 2018 W W 1.669 W - 1.831 W - W W W 1.725January 2018 W W 1.605 W - 1.799 W - W W W 1.665February 2017 W W 1.499 W - 1.719 W - 1.883 W W 1.553
PAD District 5February 2018 2.503 2.086 2.013 2.694 W 2.206 2.836 2.317 2.296 2.583 2.115 2.067January 2018 2.370 2.055 1.965 2.551 W 2.162 2.696 2.283 2.240 2.448 2.078 2.018February 2017 2.193 1.846 1.817 2.342 NA 2.001 2.485 NA 2.099 2.264 1.866 1.871
AlaskaFebruary 2018 W W W W - W W W 2.416 W W WJanuary 2018 W W W W - W W W 2.421 W W WFebruary 2017 W W W W W W W W 2.211 W W W
ArizonaFebruary 2018 W W 1.786 W W 1.931 W W 2.013 W W 1.814January 2018 W W 1.798 W W 1.920 W W 2.002 W W 1.824February 2017 W W 1.616 W W 1.742 W W 1.852 W W 1.646
CaliforniaFebruary 2018 2.587 NA 2.121 2.747 - 2.259 2.869 - 2.372 2.662 NA 2.175January 2018 2.433 NA 2.050 2.593 W 2.209 2.716 - 2.309 2.508 NA 2.106February 2017 2.240 NA 1.913 2.375 - 2.069 W - 2.173 2.312 NA 1.969
HawaiiFebruary 2018 W W W W W W W W W W W WJanuary 2018 W W W W W W W W W W W WFebruary 2017 W W W W NA W W W W W W W
NevadaFebruary 2018 W W 1.871 W - 2.029 W - 2.095 W W 1.918January 2018 W W 1.807 W - 1.943 W - 2.025 W W 1.854February 2017 W W 1.672 W - 1.744 W W 1.872 W 1.948 1.715
OregonFebruary 2018 2.390 - 1.893 2.565 - 2.090 2.674 - 2.163 2.435 - 1.924January 2018 2.285 - 1.858 2.458 - 2.023 2.567 - 2.107 2.328 - 1.886February 2017 2.078 - 1.671 2.251 - 1.851 2.370 - 1.935 2.122 - 1.704
WashingtonFebruary 2018 2.208 W 1.864 2.424 W 2.071 2.559 W 2.173 2.266 W 1.913January 2018 2.133 W 1.838 2.346 W 2.031 2.478 W 2.132 2.189 W 1.886February 2017 2.024 W 1.679 2.195 W 1.873 2.330 W 1.969 2.075 W 1.726
- = No data reported.NA = Not available.W = Withheld to avoid disclosure of individual company data.[a] Sales to "other end users" are all end-user sales that were not made through company-operated retail outlets, e.g., sales to agricultural customers or u li es.Notes: - Values shown for the current month are preliminary. Values shown for previous months may be revised. Data through 2017 are fi nal.Sources: - U.S. Energy Informa on Administra on Form EIA-782A, "Refi ners’/Gas Plant Operators’ Monthly Petroleum Product Sales Report."
U.S. Energy Information Administration�|�Petroleum Marketing Monthly48
May 2018
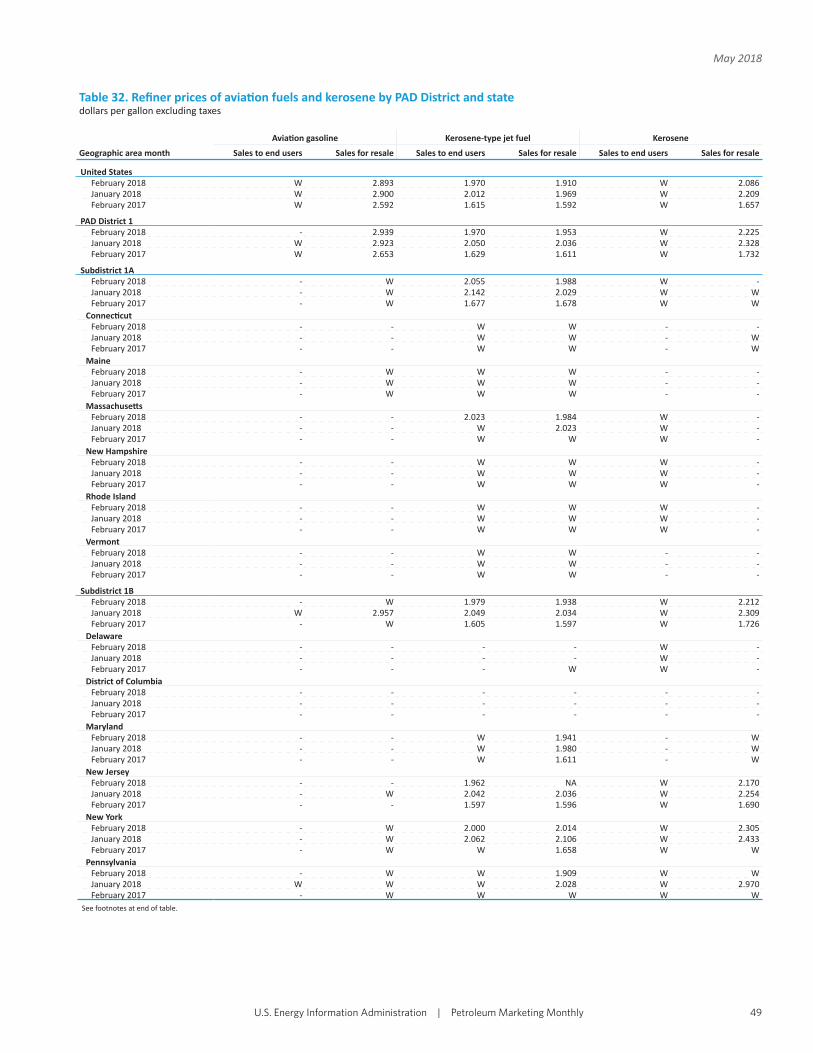
Table 32. Refi ner prices of avia on fuels and kerosene by PAD District and statedollars per gallon excluding taxes
Geographic area month
Avia on gasoline Kerosene-type jet fuel Kerosene
Sales to end users Sales for resale Sales to end users Sales for resale Sales to end users Sales for resale
United StatesFebruary 2018 W 2.893 1.970 1.910 W 2.086January 2018 W 2.900 2.012 1.969 W 2.209February 2017 W 2.592 1.615 1.592 W 1.657
PAD District 1February 2018 - 2.939 1.970 1.953 W 2.225January 2018 W 2.923 2.050 2.036 W 2.328February 2017 W 2.653 1.629 1.611 W 1.732
Subdistrict 1AFebruary 2018 - W 2.055 1.988 W -January 2018 - W 2.142 2.029 W WFebruary 2017 - W 1.677 1.678 W W
Connec cutFebruary 2018 - - W W - -January 2018 - - W W - WFebruary 2017 - - W W - W
MaineFebruary 2018 - W W W - -January 2018 - W W W - -February 2017 - W W W - -
Massachuse sFebruary 2018 - - 2.023 1.984 W -January 2018 - - W 2.023 W -February 2017 - - W W W -
New HampshireFebruary 2018 - - W W W -January 2018 - - W W W -February 2017 - - W W W -
Rhode IslandFebruary 2018 - - W W W -January 2018 - - W W W -February 2017 - - W W W -
VermontFebruary 2018 - - W W - -January 2018 - - W W - -February 2017 - - W W - -
Subdistrict 1BFebruary 2018 - W 1.979 1.938 W 2.212January 2018 W 2.957 2.049 2.034 W 2.309February 2017 - W 1.605 1.597 W 1.726
DelawareFebruary 2018 - - - - W -January 2018 - - - - W -February 2017 - - - W W -
District of ColumbiaFebruary 2018 - - - - - -January 2018 - - - - - -February 2017 - - - - - -
MarylandFebruary 2018 - - W 1.941 - WJanuary 2018 - - W 1.980 - WFebruary 2017 - - W 1.611 - W
New JerseyFebruary 2018 - - 1.962 NA W 2.170January 2018 - W 2.042 2.036 W 2.254February 2017 - - 1.597 1.596 W 1.690
New YorkFebruary 2018 - W 2.000 2.014 W 2.305January 2018 - W 2.062 2.106 W 2.433February 2017 - W W 1.658 W W
PennsylvaniaFebruary 2018 - W W 1.909 W WJanuary 2018 W W W 2.028 W 2.970February 2017 - W W W W W
See footnotes at end of table.
U.S. Energy Information Administration�|�Petroleum Marketing Monthly 49
May 2018
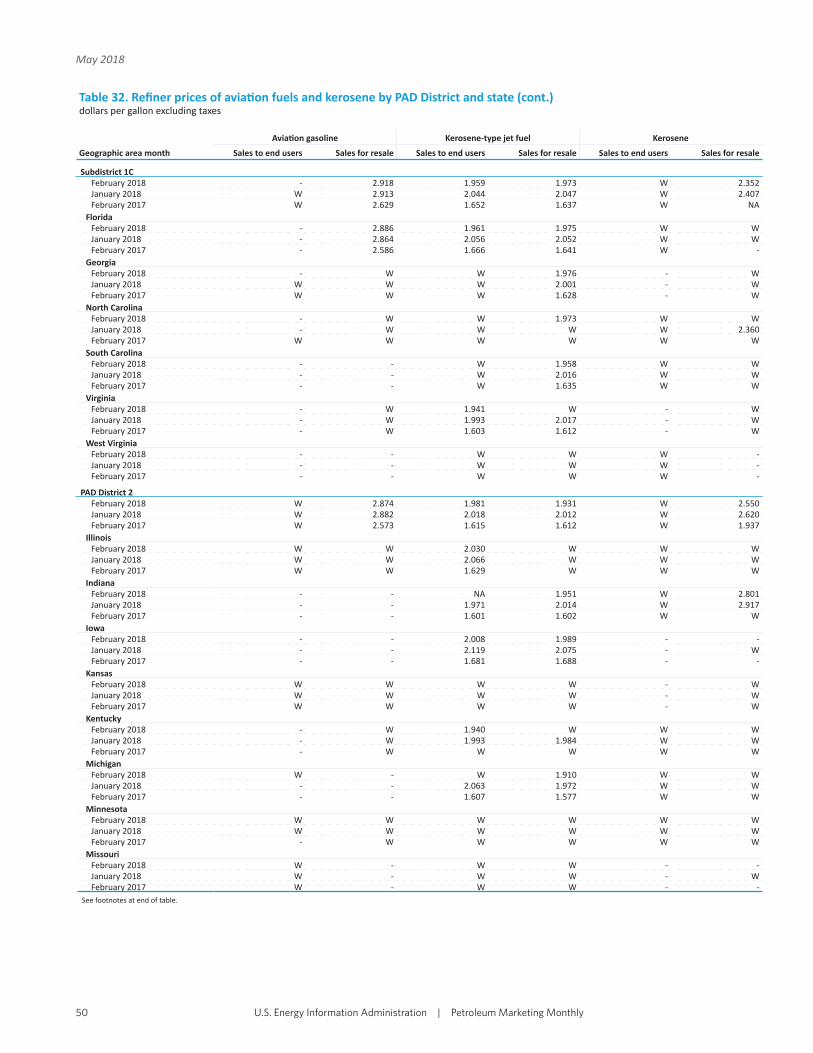
Table 32. Refi ner prices of avia on fuels and kerosene by PAD District and state (cont.)dollars per gallon excluding taxes
Geographic area month
Avia on gasoline Kerosene-type jet fuel Kerosene
Sales to end users Sales for resale Sales to end users Sales for resale Sales to end users Sales for resale
Subdistrict 1CFebruary 2018 - 2.918 1.959 1.973 W 2.352January 2018 W 2.913 2.044 2.047 W 2.407February 2017 W 2.629 1.652 1.637 W NA
FloridaFebruary 2018 - 2.886 1.961 1.975 W WJanuary 2018 - 2.864 2.056 2.052 W WFebruary 2017 - 2.586 1.666 1.641 W -
GeorgiaFebruary 2018 - W W 1.976 - WJanuary 2018 W W W 2.001 - WFebruary 2017 W W W 1.628 - W
North CarolinaFebruary 2018 - W W 1.973 W WJanuary 2018 - W W W W 2.360February 2017 W W W W W W
South CarolinaFebruary 2018 - - W 1.958 W WJanuary 2018 - - W 2.016 W WFebruary 2017 - - W 1.635 W W
VirginiaFebruary 2018 - W 1.941 W - WJanuary 2018 - W 1.993 2.017 - WFebruary 2017 - W 1.603 1.612 - W
West VirginiaFebruary 2018 - - W W W -January 2018 - - W W W -February 2017 - - W W W -
PAD District 2February 2018 W 2.874 1.981 1.931 W 2.550January 2018 W 2.882 2.018 2.012 W 2.620February 2017 W 2.573 1.615 1.612 W 1.937
IllinoisFebruary 2018 W W 2.030 W W WJanuary 2018 W W 2.066 W W WFebruary 2017 W W 1.629 W W W
IndianaFebruary 2018 - - NA 1.951 W 2.801January 2018 - - 1.971 2.014 W 2.917February 2017 - - 1.601 1.602 W W
IowaFebruary 2018 - - 2.008 1.989 - -January 2018 - - 2.119 2.075 - WFebruary 2017 - - 1.681 1.688 - -
KansasFebruary 2018 W W W W - WJanuary 2018 W W W W - WFebruary 2017 W W W W - W
KentuckyFebruary 2018 - W 1.940 W W WJanuary 2018 - W 1.993 1.984 W WFebruary 2017 - W W W W W
MichiganFebruary 2018 W - W 1.910 W WJanuary 2018 - - 2.063 1.972 W WFebruary 2017 - - 1.607 1.577 W W
MinnesotaFebruary 2018 W W W W W WJanuary 2018 W W W W W WFebruary 2017 - W W W W W
MissouriFebruary 2018 W - W W - -January 2018 W - W W - WFebruary 2017 W - W W - -
See footnotes at end of table.
U.S. Energy Information Administration�|�Petroleum Marketing Monthly50
May 2018
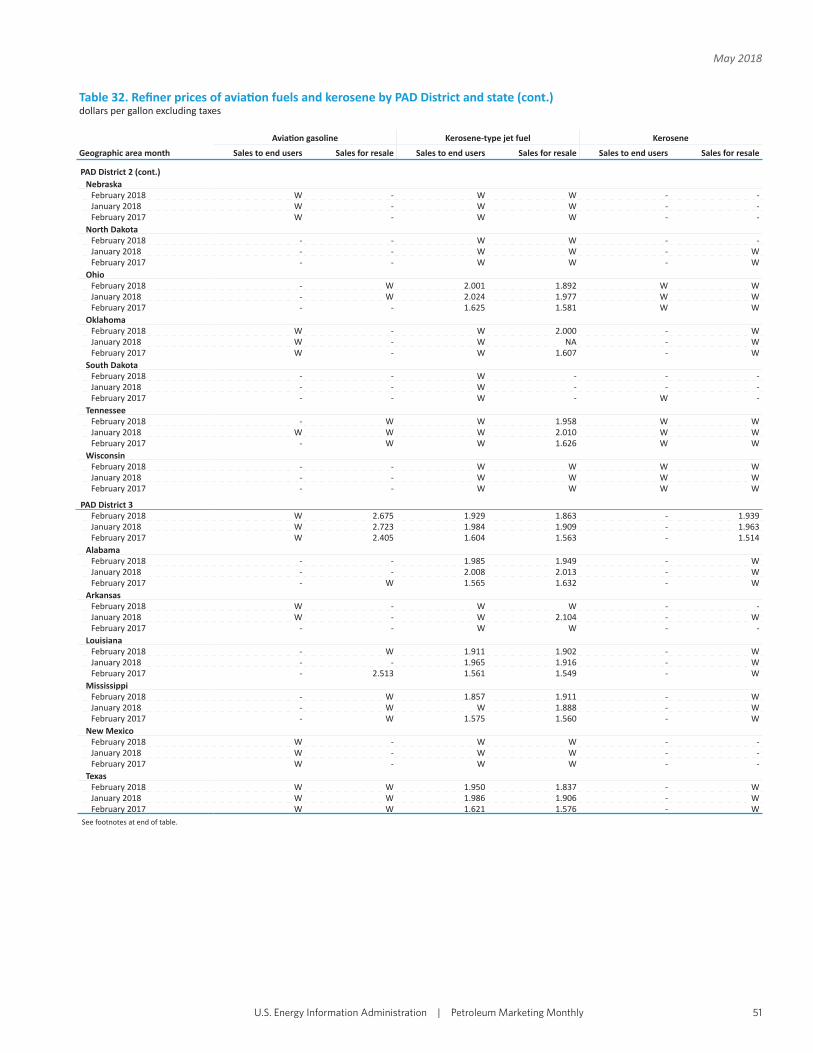
Table 32. Refi ner prices of avia on fuels and kerosene by PAD District and state (cont.)dollars per gallon excluding taxes
Geographic area month
Avia on gasoline Kerosene-type jet fuel Kerosene
Sales to end users Sales for resale Sales to end users Sales for resale Sales to end users Sales for resale
PAD District 2 (cont.)Nebraska
February 2018 W - W W - -January 2018 W - W W - -February 2017 W - W W - -
North DakotaFebruary 2018 - - W W - -January 2018 - - W W - WFebruary 2017 - - W W - W
OhioFebruary 2018 - W 2.001 1.892 W WJanuary 2018 - W 2.024 1.977 W WFebruary 2017 - - 1.625 1.581 W W
OklahomaFebruary 2018 W - W 2.000 - WJanuary 2018 W - W NA - WFebruary 2017 W - W 1.607 - W
South DakotaFebruary 2018 - - W - - -January 2018 - - W - - -February 2017 - - W - W -
TennesseeFebruary 2018 - W W 1.958 W WJanuary 2018 W W W 2.010 W WFebruary 2017 - W W 1.626 W W
WisconsinFebruary 2018 - - W W W WJanuary 2018 - - W W W WFebruary 2017 - - W W W W
PAD District 3February 2018 W 2.675 1.929 1.863 - 1.939January 2018 W 2.723 1.984 1.909 - 1.963February 2017 W 2.405 1.604 1.563 - 1.514
AlabamaFebruary 2018 - - 1.985 1.949 - WJanuary 2018 - - 2.008 2.013 - WFebruary 2017 - W 1.565 1.632 - W
ArkansasFebruary 2018 W - W W - -January 2018 W - W 2.104 - WFebruary 2017 - - W W - -
LouisianaFebruary 2018 - W 1.911 1.902 - WJanuary 2018 - - 1.965 1.916 - WFebruary 2017 - 2.513 1.561 1.549 - W
MississippiFebruary 2018 - W 1.857 1.911 - WJanuary 2018 - W W 1.888 - WFebruary 2017 - W 1.575 1.560 - W
New MexicoFebruary 2018 W - W W - -January 2018 W - W W - -February 2017 W - W W - -
TexasFebruary 2018 W W 1.950 1.837 - WJanuary 2018 W W 1.986 1.906 - WFebruary 2017 W W 1.621 1.576 - W
See footnotes at end of table.
U.S. Energy Information Administration�|�Petroleum Marketing Monthly 51
May 2018
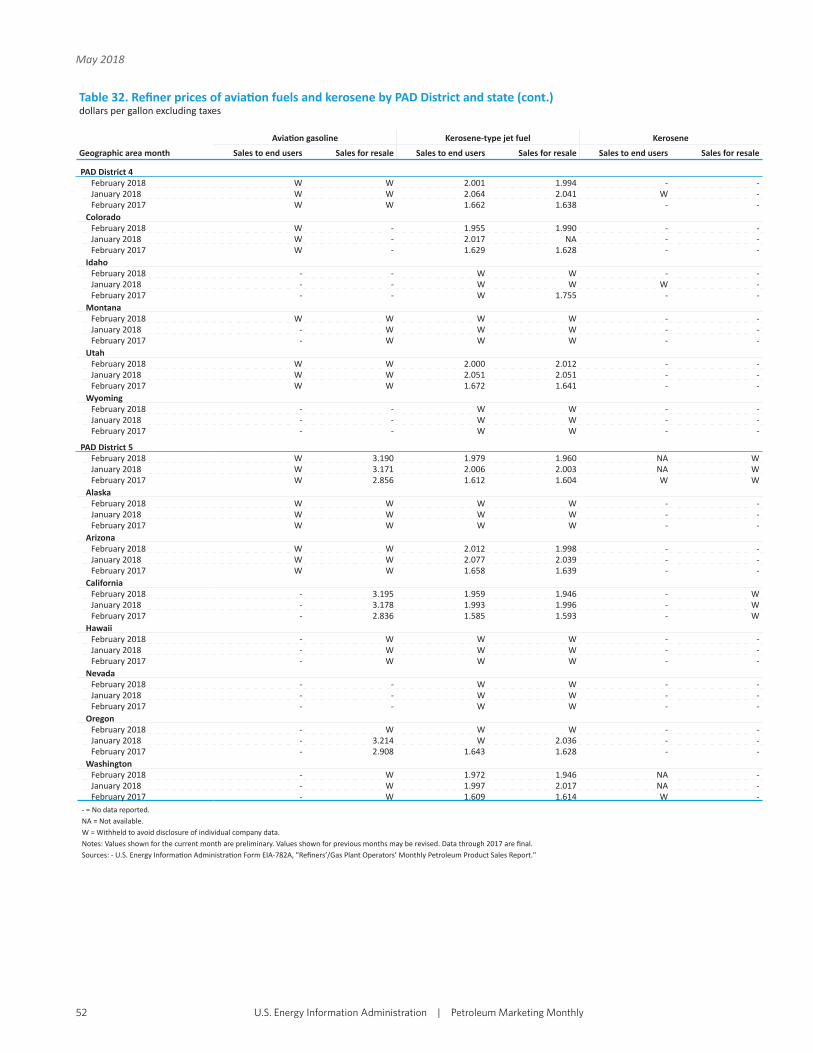
Table 32. Refi ner prices of avia on fuels and kerosene by PAD District and state (cont.)dollars per gallon excluding taxes
Geographic area month
Avia on gasoline Kerosene-type jet fuel Kerosene
Sales to end users Sales for resale Sales to end users Sales for resale Sales to end users Sales for resale
PAD District 4February 2018 W W 2.001 1.994 - -January 2018 W W 2.064 2.041 W -February 2017 W W 1.662 1.638 - -
ColoradoFebruary 2018 W - 1.955 1.990 - -January 2018 W - 2.017 NA - -February 2017 W - 1.629 1.628 - -
IdahoFebruary 2018 - - W W - -January 2018 - - W W W -February 2017 - - W 1.755 - -
MontanaFebruary 2018 W W W W - -January 2018 - W W W - -February 2017 - W W W - -
UtahFebruary 2018 W W 2.000 2.012 - -January 2018 W W 2.051 2.051 - -February 2017 W W 1.672 1.641 - -
WyomingFebruary 2018 - - W W - -January 2018 - - W W - -February 2017 - - W W - -
PAD District 5February 2018 W 3.190 1.979 1.960 NA WJanuary 2018 W 3.171 2.006 2.003 NA WFebruary 2017 W 2.856 1.612 1.604 W W
AlaskaFebruary 2018 W W W W - -January 2018 W W W W - -February 2017 W W W W - -
ArizonaFebruary 2018 W W 2.012 1.998 - -January 2018 W W 2.077 2.039 - -February 2017 W W 1.658 1.639 - -
CaliforniaFebruary 2018 - 3.195 1.959 1.946 - WJanuary 2018 - 3.178 1.993 1.996 - WFebruary 2017 - 2.836 1.585 1.593 - W
HawaiiFebruary 2018 - W W W - -January 2018 - W W W - -February 2017 - W W W - -
NevadaFebruary 2018 - - W W - -January 2018 - - W W - -February 2017 - - W W - -
OregonFebruary 2018 - W W W - -January 2018 - 3.214 W 2.036 - -February 2017 - 2.908 1.643 1.628 - -
WashingtonFebruary 2018 - W 1.972 1.946 NA -January 2018 - W 1.997 2.017 NA -February 2017 - W 1.609 1.614 W -
- = No data reported.NA = Not available.W = Withheld to avoid disclosure of individual company data.Notes: Values shown for the current month are preliminary. Values shown for previous months may be revised. Data through 2017 are fi nal.Sources: - U.S. Energy Informa on Administra on Form EIA-782A, "Refi ners’/Gas Plant Operators’ Monthly Petroleum Product Sales Report."
U.S. Energy Information Administration�|�Petroleum Marketing Monthly52
May 2018
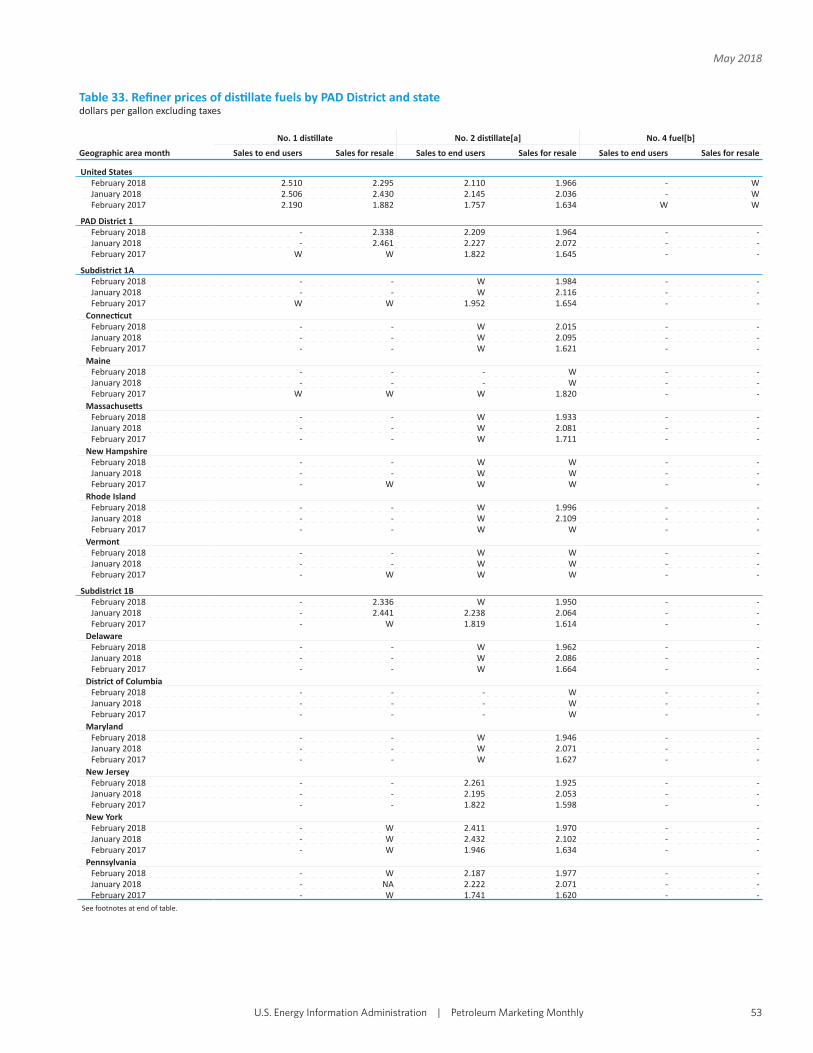
Table 33. Refi ner prices of dis llate fuels by PAD District and statedollars per gallon excluding taxes
Geographic area month
No. 1 dis llate No. 2 dis llate[a] No. 4 fuel[b]
Sales to end users Sales for resale Sales to end users Sales for resale Sales to end users Sales for resale
United StatesFebruary 2018 2.510 2.295 2.110 1.966 - WJanuary 2018 2.506 2.430 2.145 2.036 - WFebruary 2017 2.190 1.882 1.757 1.634 W W
PAD District 1February 2018 - 2.338 2.209 1.964 - -January 2018 - 2.461 2.227 2.072 - -February 2017 W W 1.822 1.645 - -
Subdistrict 1AFebruary 2018 - - W 1.984 - -January 2018 - - W 2.116 - -February 2017 W W 1.952 1.654 - -
Connec cutFebruary 2018 - - W 2.015 - -January 2018 - - W 2.095 - -February 2017 - - W 1.621 - -
MaineFebruary 2018 - - - W - -January 2018 - - - W - -February 2017 W W W 1.820 - -
Massachuse sFebruary 2018 - - W 1.933 - -January 2018 - - W 2.081 - -February 2017 - - W 1.711 - -
New HampshireFebruary 2018 - - W W - -January 2018 - - W W - -February 2017 - W W W - -
Rhode IslandFebruary 2018 - - W 1.996 - -January 2018 - - W 2.109 - -February 2017 - - W W - -
VermontFebruary 2018 - - W W - -January 2018 - - W W - -February 2017 - W W W - -
Subdistrict 1BFebruary 2018 - 2.336 W 1.950 - -January 2018 - 2.441 2.238 2.064 - -February 2017 - W 1.819 1.614 - -
DelawareFebruary 2018 - - W 1.962 - -January 2018 - - W 2.086 - -February 2017 - - W 1.664 - -
District of ColumbiaFebruary 2018 - - - W - -January 2018 - - - W - -February 2017 - - - W - -
MarylandFebruary 2018 - - W 1.946 - -January 2018 - - W 2.071 - -February 2017 - - W 1.627 - -
New JerseyFebruary 2018 - - 2.261 1.925 - -January 2018 - - 2.195 2.053 - -February 2017 - - 1.822 1.598 - -
New YorkFebruary 2018 - W 2.411 1.970 - -January 2018 - W 2.432 2.102 - -February 2017 - W 1.946 1.634 - -
PennsylvaniaFebruary 2018 - W 2.187 1.977 - -January 2018 - NA 2.222 2.071 - -February 2017 - W 1.741 1.620 - -
See footnotes at end of table.
U.S. Energy Information Administration�|�Petroleum Marketing Monthly 53
May 2018

Table 33. Refi ner prices of dis llate fuels by PAD District and state (cont.)dollars per gallon excluding taxes
Geographic area month
No. 1 dis llate No. 2 dis llate[a] No. 4 fuel[b]
Sales to end users Sales for resale Sales to end users Sales for resale Sales to end users Sales for resale
Subdistrict 1CFebruary 2018 - W 2.178 1.983 - -January 2018 - W W 2.077 - -February 2017 - W 1.819 1.680 - -
FloridaFebruary 2018 - - 2.161 2.005 - -January 2018 - - 2.225 2.094 - -February 2017 - - 1.806 1.716 - -
GeorgiaFebruary 2018 - W 1.985 1.967 - -January 2018 - W 2.068 2.054 - -February 2017 - W 1.681 1.668 - -
North CarolinaFebruary 2018 - - 2.255 1.969 - -January 2018 - - 2.220 2.063 - -February 2017 - - 1.826 1.657 - -
South CarolinaFebruary 2018 - - W 1.973 - -January 2018 - - W 2.079 - -February 2017 - - W 1.667 - -
VirginiaFebruary 2018 - - 1.964 1.968 - -January 2018 - - 2.069 2.074 - -February 2017 - - 1.765 1.662 - -
West VirginiaFebruary 2018 - - W 1.996 - -January 2018 - - W 2.119 - -February 2017 - - W 1.651 - -
PAD District 2February 2018 2.506 2.301 2.099 1.969 - WJanuary 2018 2.496 2.458 2.155 2.072 - WFebruary 2017 2.276 1.840 1.712 1.601 - W
IllinoisFebruary 2018 W W W 1.944 - -January 2018 - 2.659 W 2.064 - -February 2017 W W W 1.557 - -
IndianaFebruary 2018 - W W 1.956 - -January 2018 - W W 2.074 - -February 2017 - W W 1.575 - -
IowaFebruary 2018 W 2.297 2.047 1.995 - -January 2018 W 2.421 2.113 2.083 - -February 2017 - 1.750 1.703 1.643 - -
KansasFebruary 2018 - 2.222 1.954 1.976 - -January 2018 W 2.362 W 2.052 - -February 2017 - 1.782 1.595 1.612 - -
KentuckyFebruary 2018 W W W 1.982 - WJanuary 2018 - W W 2.093 - WFebruary 2017 - W W 1.655 - W
MichiganFebruary 2018 W 2.778 W 1.964 - -January 2018 W W W 2.096 - -February 2017 W W W 1.566 - -
MinnesotaFebruary 2018 W 2.298 2.118 1.997 - -January 2018 2.650 2.386 2.136 2.089 - -February 2017 2.342 1.752 1.706 1.611 - -
MissouriFebruary 2018 W 2.299 NA 1.994 - -January 2018 - 2.419 W 2.068 - -February 2017 - 1.810 W 1.629 - -
See footnotes at end of table.
U.S. Energy Information Administration�|�Petroleum Marketing Monthly54
May 2018
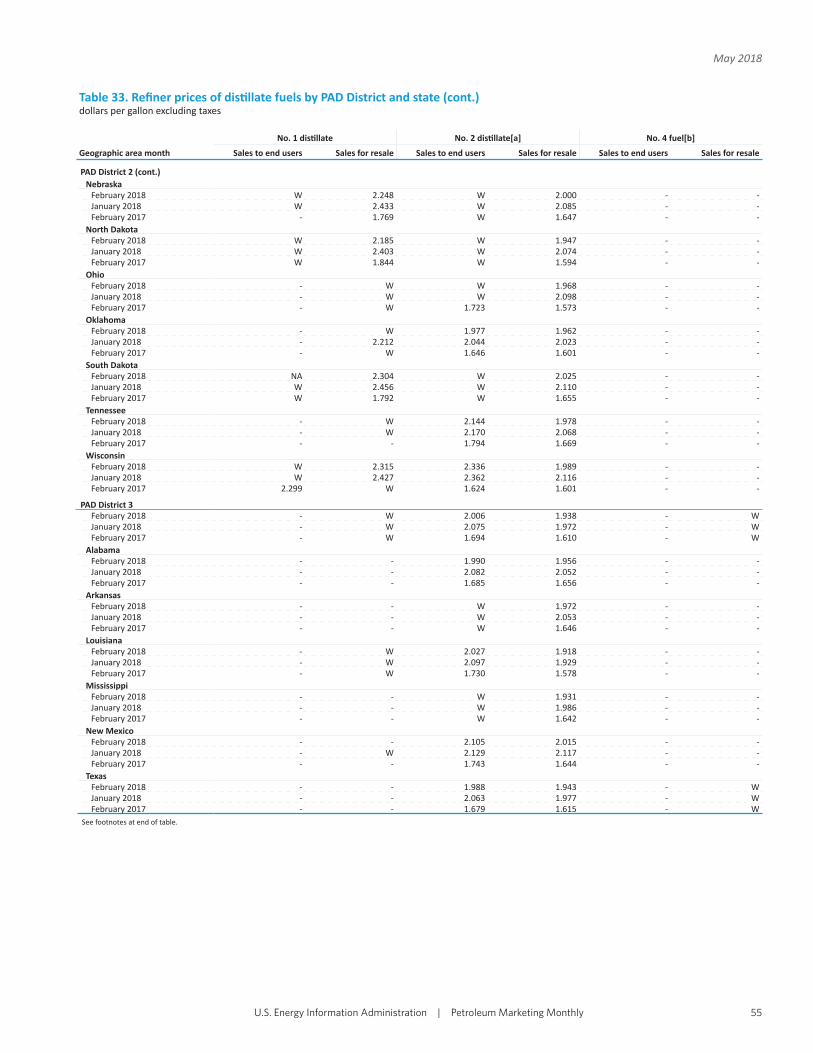
Table 33. Refi ner prices of dis llate fuels by PAD District and state (cont.)dollars per gallon excluding taxes
Geographic area month
No. 1 dis llate No. 2 dis llate[a] No. 4 fuel[b]
Sales to end users Sales for resale Sales to end users Sales for resale Sales to end users Sales for resale
PAD District 2 (cont.)Nebraska
February 2018 W 2.248 W 2.000 - -January 2018 W 2.433 W 2.085 - -February 2017 - 1.769 W 1.647 - -
North DakotaFebruary 2018 W 2.185 W 1.947 - -January 2018 W 2.403 W 2.074 - -February 2017 W 1.844 W 1.594 - -
OhioFebruary 2018 - W W 1.968 - -January 2018 - W W 2.098 - -February 2017 - W 1.723 1.573 - -
OklahomaFebruary 2018 - W 1.977 1.962 - -January 2018 - 2.212 2.044 2.023 - -February 2017 - W 1.646 1.601 - -
South DakotaFebruary 2018 NA 2.304 W 2.025 - -January 2018 W 2.456 W 2.110 - -February 2017 W 1.792 W 1.655 - -
TennesseeFebruary 2018 - W 2.144 1.978 - -January 2018 - W 2.170 2.068 - -February 2017 - - 1.794 1.669 - -
WisconsinFebruary 2018 W 2.315 2.336 1.989 - -January 2018 W 2.427 2.362 2.116 - -February 2017 2.299 W 1.624 1.601 - -
PAD District 3February 2018 - W 2.006 1.938 - WJanuary 2018 - W 2.075 1.972 - WFebruary 2017 - W 1.694 1.610 - W
AlabamaFebruary 2018 - - 1.990 1.956 - -January 2018 - - 2.082 2.052 - -February 2017 - - 1.685 1.656 - -
ArkansasFebruary 2018 - - W 1.972 - -January 2018 - - W 2.053 - -February 2017 - - W 1.646 - -
LouisianaFebruary 2018 - W 2.027 1.918 - -January 2018 - W 2.097 1.929 - -February 2017 - W 1.730 1.578 - -
MississippiFebruary 2018 - - W 1.931 - -January 2018 - - W 1.986 - -February 2017 - - W 1.642 - -
New MexicoFebruary 2018 - - 2.105 2.015 - -January 2018 - W 2.129 2.117 - -February 2017 - - 1.743 1.644 - -
TexasFebruary 2018 - - 1.988 1.943 - WJanuary 2018 - - 2.063 1.977 - WFebruary 2017 - - 1.679 1.615 - W
See footnotes at end of table.
U.S. Energy Information Administration�|�Petroleum Marketing Monthly 55
May 2018

Table 33. Refi ner prices of dis llate fuels by PAD District and state (cont.)dollars per gallon excluding taxes
Geographic area month
No. 1 dis llate No. 2 dis llate[a] No. 4 fuel[b]
Sales to end users Sales for resale Sales to end users Sales for resale Sales to end users Sales for resale
PAD District 4February 2018 2.575 2.294 2.042 2.004 - -January 2018 2.597 2.345 2.076 2.015 - -February 2017 2.236 1.967 1.719 1.679 W -
ColoradoFebruary 2018 - 2.285 2.060 1.995 - -January 2018 - 2.323 2.090 2.033 - -February 2017 - 1.871 1.679 1.637 - -
IdahoFebruary 2018 W 2.413 2.248 1.988 - -January 2018 W 2.431 2.244 1.990 - -February 2017 W 2.072 W 1.742 - -
MontanaFebruary 2018 W 2.215 2.099 2.015 - -January 2018 W 2.319 W 2.076 - -February 2017 W 1.935 W 1.695 - -
UtahFebruary 2018 W W 2.009 2.011 - -January 2018 W 2.447 1.979 1.970 - -February 2017 W 2.205 1.742 1.741 W -
WyomingFebruary 2018 W 2.330 2.008 2.009 - -January 2018 W 2.354 2.074 2.033 - -February 2017 W 1.958 1.664 1.618 - -
PAD District 5February 2018 W 2.255 2.206 2.034 - -January 2018 W 2.302 2.180 2.087 - -February 2017 W 1.915 1.880 1.745 - -
AlaskaFebruary 2018 W W W W - -January 2018 W W W W - -February 2017 W W W W - -
ArizonaFebruary 2018 - - 2.241 2.002 - -January 2018 - - 2.124 2.041 - -February 2017 - - 1.837 1.739 - -
CaliforniaFebruary 2018 - - 2.174 2.066 - -January 2018 - - 2.205 2.115 - -February 2017 - - 1.838 1.764 - -
HawaiiFebruary 2018 - - W W - -January 2018 - - W W - -February 2017 - - W W - -
NevadaFebruary 2018 W - W 1.994 - -January 2018 W - W 2.055 - -February 2017 - - 1.794 1.737 - -
OregonFebruary 2018 - NA 2.283 1.999 - -January 2018 - NA 2.293 2.095 - -February 2017 - W 1.872 1.706 - -
WashingtonFebruary 2018 W W 2.112 1.961 - -January 2018 W W 2.125 2.010 - -February 2017 W W 1.820 1.697 - -
- = No data reported.NA = Not available.W = Withheld to avoid disclosure of individual company data.[a] Includes sales of No. 2 fuel oil and diesel fuels.[b] Includes No. 4 fuel oil and No. 4 diesel fuel.Notes: Values shown for the current month are preliminary. Values shown for previous months may be revised. Data through 2017 are fi nal.Sources: - U.S. Energy Informa on Administra on Form EIA-782A, "Refi ners’/Gas Plant Operators, Monthly Petroleum Product Sales Report."
U.S. Energy Information Administration�|�Petroleum Marketing Monthly56
May 2018

Volume of Petroleum Products
U.S. Energy Information Administration�|�Petroleum Marketing Monthly

Table 39. Refi ner motor gasoline volumes by grade, sales type, PAD District, and statethousand gallons per day
Geographic area month
Regular Midgrade
Sales to end users Sales for resale Sales to end users Sales for resale
Through retail outlets Total[a] DTW Rack Bulk
Through retail outlets Total[a] DTW Rack Bulk
United StatesFebruary 2018 19,203.0 19,461.3 16,845.6 224,348.7 18,918.3 1,591.6 1,607.0 247.0 1,779.3 -January 2018 18,484.5 18,729.3 15,931.1 215,932.3 16,446.2 1,527.2 1,539.6 237.1 1,742.1 -February 2017 19,443.8 19,656.6 16,999.9 221,485.3 16,195.7 1,640.6 1,653.2 284.5 2,045.3 -
PAD District 1February 2018 6,205.3 6,250.1 W W 3,804.9 543.9 546.9 W W -January 2018 5,950.5 5,988.6 W W 3,617.5 521.9 524.7 W W -February 2017 6,536.0 6,549.3 W W 2,622.7 549.4 554.9 W W -
Subdistrict 1AFebruary 2018 W W W W W W W - 26.5 -January 2018 W W W W W W W - 29.1 -February 2017 W W W W W W W - 30.0 -
Connec cutFebruary 2018 - W - W W - - - 11.1 -January 2018 - W - W W - - - 12.5 -February 2017 - W W W W - - - 15.3 -
MaineFebruary 2018 - - W 586.6 - - - - W -January 2018 - - W W - - - - W -February 2017 - - - 557.2 - - - - W -
Massachuse sFebruary 2018 W W - 958.9 - W W - 4.4 -January 2018 W W - 981.3 - W W - 4.2 -February 2017 W W W W - W W - 4.3 -
New HampshireFebruary 2018 W W W W - W W - - -January 2018 W W W W - W W - - -February 2017 W W W W - W W - - -
Rhode IslandFebruary 2018 W W - 915.0 - W W - W -January 2018 W W - W - W W - W -February 2017 W W W 696.2 W W W - W -
VermontFebruary 2018 - - W W - - - - W -January 2018 - - W W - - - - W -February 2017 - - W W - - - - W -
Subdistrict 1BFebruary 2018 3,073.5 3,073.5 W 20,970.1 W 322.4 322.4 W W -January 2018 3,020.5 3,020.5 W 20,452.5 W 316.8 316.8 W W -February 2017 3,016.3 3,018.1 W 20,417.5 W 315.9 316.0 W W -
DelawareFebruary 2018 W W - 939.6 - W W - 7.4 -January 2018 W W - 906.1 - W W - 7.6 -February 2017 W W - 954.7 - W W - 8.3 -
District of ColumbiaFebruary 2018 - - - - - - - - - -January 2018 - - - - - - - - - -February 2017 - - - - - - - - - -
MarylandFebruary 2018 - - - 3,939.5 - - - - 45.6 -January 2018 - - - 3,805.0 - - - - 45.2 -February 2017 - W W W W - W - 59.3 -
New JerseyFebruary 2018 W W W 6,576.5 W W W W W -January 2018 W W W 6,105.1 W W W W W -February 2017 W W W 6,386.8 W W W W W -
New YorkFebruary 2018 1,869.7 1,869.7 W W W 206.2 206.2 W W -January 2018 1,844.8 1,844.8 W W W 203.6 203.6 W W -February 2017 1,830.4 1,830.4 W 4,700.8 W 198.2 198.2 W W -
PennsylvaniaFebruary 2018 W W - W W W W - 19.5 -January 2018 W W - W W W W - 22.0 -February 2017 W W - W W W W - 26.9 -
See footnotes at end of table.
U.S. Energy Information Administration�|�Petroleum Marketing Monthly58
May 2018

Table 39. Refi ner motor gasoline volumes by grade, sales type, PAD District, and state (cont.)thousand gallons per day
Geographic area month
Premium All grades
Sales to end users Sales for resale Sales to end users Sales for resale
Through retail outlets Total[a] DTW Rack Bulk
Through retail outlets Total[a] DTW Rack Bulk
United StatesFebruary 2018 2,305.8 2,329.4 4,683.9 27,257.0 1,967.4 23,100.5 23,397.7 21,776.4 253,385.0 20,885.6January 2018 2,253.1 2,274.9 4,491.8 26,320.8 2,001.5 22,264.8 22,543.8 20,660.1 243,995.2 18,447.8February 2017 2,428.5 2,449.2 4,709.8 26,697.4 1,300.2 23,512.8 23,759.0 21,994.1 250,227.9 17,495.9
PAD District 1February 2018 767.6 774.0 W 8,593.4 W 7,516.9 7,571.0 W 75,048.6 WJanuary 2018 746.0 751.8 W 8,242.3 W 7,218.5 7,265.1 W 72,331.4 WFebruary 2017 793.6 793.8 W 8,356.2 W 7,879.0 7,897.9 W 74,426.7 W
Subdistrict 1AFebruary 2018 W W W W W W W W 5,059.4 WJanuary 2018 W W W 657.6 W W W W W WFebruary 2017 W W W W - W W W W W
Connec cutFebruary 2018 - - - W W - W - W WJanuary 2018 - - - W W - W - W WFebruary 2017 - - W W - - W W 2,302.5 W
MaineFebruary 2018 - - W W - - - W W -January 2018 - - W 46.8 - - - W W -February 2017 - - W 35.5 - - - W W -
Massachuse sFebruary 2018 W W - 151.3 - W W - 1,114.6 -January 2018 W W - 154.2 - W W - 1,139.7 -February 2017 W W W W - W W W W -
New HampshireFebruary 2018 W W W W - W W W W -January 2018 W W W W - W W W W -February 2017 W W W W - W W W W -
Rhode IslandFebruary 2018 W W - W - W W - 1,062.1 -January 2018 W W - W - W W - 1,022.8 -February 2017 W W W W - W W W 817.9 W
VermontFebruary 2018 - - W W - - - W W -January 2018 - - W W - - - W 82.1 -February 2017 - - W W - - - W W -
Subdistrict 1BFebruary 2018 487.1 487.1 W W W 3,883.0 3,883.0 W 23,857.8 WJanuary 2018 483.3 483.3 W W W 3,820.6 3,820.6 W 23,330.9 WFebruary 2017 490.0 490.1 W W W 3,822.2 3,824.2 W 23,217.4 W
DelawareFebruary 2018 W W - 91.4 - W W - 1,038.4 -January 2018 W W - 90.8 - W W - 1,004.5 -February 2017 W W - 110.8 - W W - 1,073.8 -
District of ColumbiaFebruary 2018 - - - - - - - - - -January 2018 - - - - - - - - - -February 2017 - - - - - - - - - -
MarylandFebruary 2018 - - - 586.0 - - - - 4,571.0 -January 2018 - - - 613.3 - - - - 4,463.5 -February 2017 - W - W W - W W 3,809.8 W
New JerseyFebruary 2018 W W W W W W W W 7,504.3 WJanuary 2018 W W W W - W W W 6,993.5 WFebruary 2017 W W W 874.9 W W W W W 381.9
New YorkFebruary 2018 314.5 314.5 W 774.3 W 2,390.4 2,390.4 W W WJanuary 2018 312.9 312.9 W 775.7 W 2,361.4 2,361.4 W W WFebruary 2017 312.6 312.6 W W W 2,341.2 2,341.2 W 5,407.4 W
PennsylvaniaFebruary 2018 W W - W W W W - W WJanuary 2018 W W - W W W W - W WFebruary 2017 W W - W W W W - W W
See footnotes at end of table.
U.S. Energy Information Administration�|�Petroleum Marketing Monthly 59
May 2018
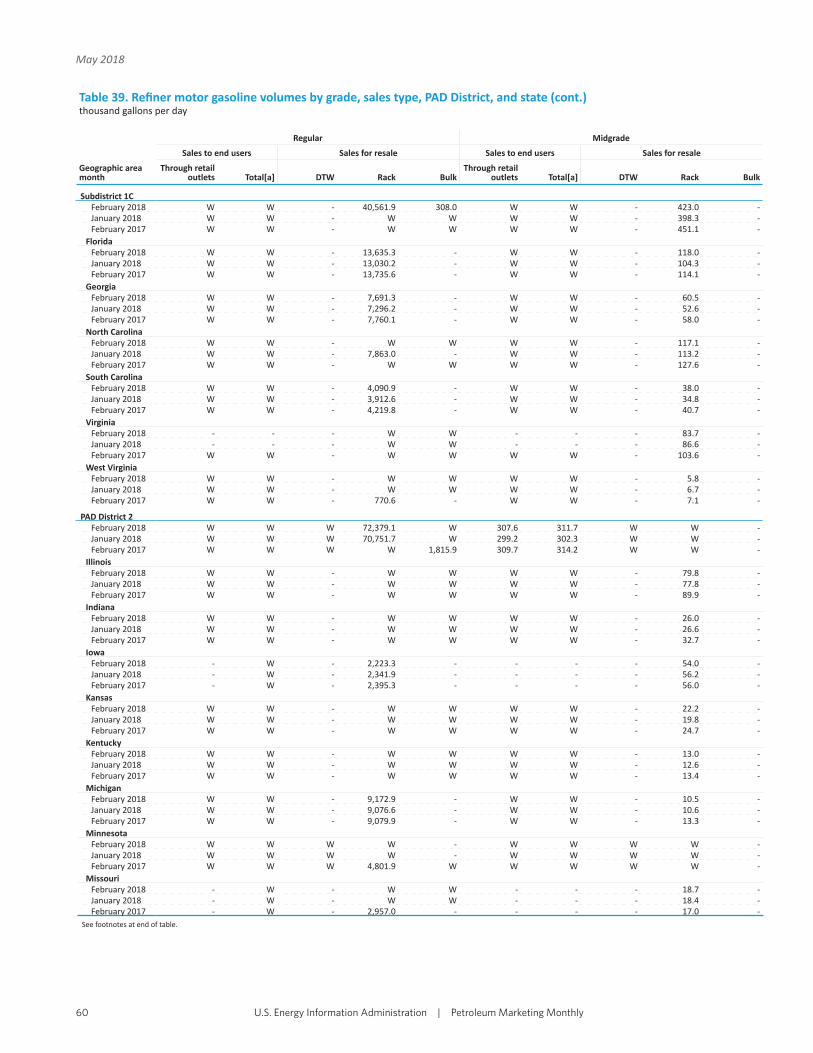
Table 39. Refi ner motor gasoline volumes by grade, sales type, PAD District, and state (cont.)thousand gallons per day
Geographic area month
Regular Midgrade
Sales to end users Sales for resale Sales to end users Sales for resale
Through retail outlets Total[a] DTW Rack Bulk
Through retail outlets Total[a] DTW Rack Bulk
Subdistrict 1CFebruary 2018 W W - 40,561.9 308.0 W W - 423.0 -January 2018 W W - W W W W - 398.3 -February 2017 W W - W W W W - 451.1 -
FloridaFebruary 2018 W W - 13,635.3 - W W - 118.0 -January 2018 W W - 13,030.2 - W W - 104.3 -February 2017 W W - 13,735.6 - W W - 114.1 -
GeorgiaFebruary 2018 W W - 7,691.3 - W W - 60.5 -January 2018 W W - 7,296.2 - W W - 52.6 -February 2017 W W - 7,760.1 - W W - 58.0 -
North CarolinaFebruary 2018 W W - W W W W - 117.1 -January 2018 W W - 7,863.0 - W W - 113.2 -February 2017 W W - W W W W - 127.6 -
South CarolinaFebruary 2018 W W - 4,090.9 - W W - 38.0 -January 2018 W W - 3,912.6 - W W - 34.8 -February 2017 W W - 4,219.8 - W W - 40.7 -
VirginiaFebruary 2018 - - - W W - - - 83.7 -January 2018 - - - W W - - - 86.6 -February 2017 W W - W W W W - 103.6 -
West VirginiaFebruary 2018 W W - W W W W - 5.8 -January 2018 W W - W W W W - 6.7 -February 2017 W W - 770.6 - W W - 7.1 -
PAD District 2February 2018 W W W 72,379.1 W 307.6 311.7 W W -January 2018 W W W 70,751.7 W 299.2 302.3 W W -February 2017 W W W W 1,815.9 309.7 314.2 W W -
IllinoisFebruary 2018 W W - W W W W - 79.8 -January 2018 W W - W W W W - 77.8 -February 2017 W W - W W W W - 89.9 -
IndianaFebruary 2018 W W - W W W W - 26.0 -January 2018 W W - W W W W - 26.6 -February 2017 W W - W W W W - 32.7 -
IowaFebruary 2018 - W - 2,223.3 - - - - 54.0 -January 2018 - W - 2,341.9 - - - - 56.2 -February 2017 - W - 2,395.3 - - - - 56.0 -
KansasFebruary 2018 W W - W W W W - 22.2 -January 2018 W W - W W W W - 19.8 -February 2017 W W - W W W W - 24.7 -
KentuckyFebruary 2018 W W - W W W W - 13.0 -January 2018 W W - W W W W - 12.6 -February 2017 W W - W W W W - 13.4 -
MichiganFebruary 2018 W W - 9,172.9 - W W - 10.5 -January 2018 W W - 9,076.6 - W W - 10.6 -February 2017 W W - 9,079.9 - W W - 13.3 -
MinnesotaFebruary 2018 W W W W - W W W W -January 2018 W W W W - W W W W -February 2017 W W W 4,801.9 W W W W W -
MissouriFebruary 2018 - W - W W - - - 18.7 -January 2018 - W - W W - - - 18.4 -February 2017 - W - 2,957.0 - - - - 17.0 -
See footnotes at end of table.
U.S. Energy Information Administration�|�Petroleum Marketing Monthly60
May 2018

Table 39. Refi ner motor gasoline volumes by grade, sales type, PAD District, and state (cont.)thousand gallons per day
Geographic area month
Premium All grades
Sales to end users Sales for resale Sales to end users Sales for resale
Through retail outlets Total[a] DTW Rack Bulk
Through retail outlets Total[a] DTW Rack Bulk
Subdistrict 1CFebruary 2018 W W - 5,146.6 - W W - 46,131.5 308.0January 2018 W W - W W W W - W WFebruary 2017 W W - 5,076.2 - W W - W W
FloridaFebruary 2018 W W - 1,984.1 - W W - 15,737.4 -January 2018 W W - 1,837.2 - W W - 14,971.8 -February 2017 W W - 1,945.6 - W W - 15,795.4 -
GeorgiaFebruary 2018 W W - 956.2 - W W - 8,708.0 -January 2018 W W - 890.5 - W W - 8,239.3 -February 2017 W W - 928.8 - W W - 8,746.9 -
North CarolinaFebruary 2018 W W - 954.0 - W W - W WJanuary 2018 W W - 875.2 - W W - 8,851.4 -February 2017 W W - 906.9 - W W - W W
South CarolinaFebruary 2018 W W - 397.3 - W W - 4,526.2 -January 2018 W W - 382.8 - W W - 4,330.1 -February 2017 W W - 407.6 - W W - 4,668.1 -
VirginiaFebruary 2018 - - - 829.8 - - - - W WJanuary 2018 - - - 804.4 - - - - W WFebruary 2017 W W - 852.4 - W W - W W
West VirginiaFebruary 2018 W W - 25.3 - W W - W WJanuary 2018 W W - W W W W - W WFebruary 2017 W W - 34.9 - W W - 812.6 -
PAD District 2February 2018 W 407.4 W W 638.4 W W W 78,672.4 WJanuary 2018 W W W W 642.3 W W W 77,039.7 WFebruary 2017 W 430.5 W 5,851.1 W W W W 79,410.3 W
IllinoisFebruary 2018 W W - W W W W - W WJanuary 2018 W W - W W W W - W WFebruary 2017 W W - 1,128.0 - W W - W W
IndianaFebruary 2018 W W - 367.9 - W W - W WJanuary 2018 W W - W W W W - W WFebruary 2017 W W - 380.3 - W W - W W
IowaFebruary 2018 - - - 230.1 - - W - 2,507.4 -January 2018 - - - 273.0 - - W - 2,671.1 -February 2017 - - - 283.3 - - W - 2,734.6 -
KansasFebruary 2018 - - - W W W W - W WJanuary 2018 - - - W W W W - W WFebruary 2017 - - - W W W W - 4,092.8 109.5
KentuckyFebruary 2018 W W - 196.9 - W W - W WJanuary 2018 W W - 187.5 - W W - W WFebruary 2017 W W - 208.8 - W W - W W
MichiganFebruary 2018 W W - W W W W - W WJanuary 2018 W W - W W W W - W WFebruary 2017 W W - W W W W - W W
MinnesotaFebruary 2018 W W W W W W W W 4,961.7 WJanuary 2018 W W W W W W W W 4,730.1 WFebruary 2017 W W W W W W W W 5,245.9 W
MissouriFebruary 2018 - - - W W - W - W WJanuary 2018 - - - W W - W - W WFebruary 2017 - W - 210.2 - - W - 3,184.1 -
See footnotes at end of table.
U.S. Energy Information Administration�|�Petroleum Marketing Monthly 61
May 2018
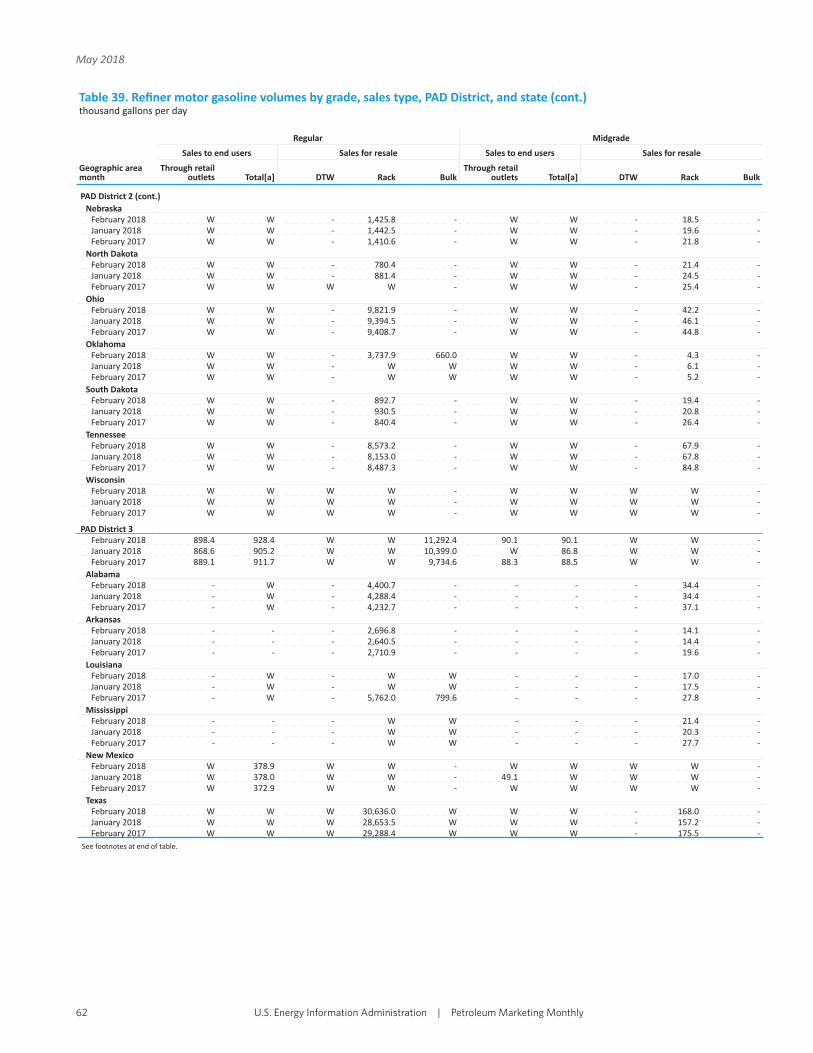
Table 39. Refi ner motor gasoline volumes by grade, sales type, PAD District, and state (cont.)thousand gallons per day
Geographic area month
Regular Midgrade
Sales to end users Sales for resale Sales to end users Sales for resale
Through retail outlets Total[a] DTW Rack Bulk
Through retail outlets Total[a] DTW Rack Bulk
PAD District 2 (cont.)Nebraska
February 2018 W W - 1,425.8 - W W - 18.5 -January 2018 W W - 1,442.5 - W W - 19.6 -February 2017 W W - 1,410.6 - W W - 21.8 -
North DakotaFebruary 2018 W W - 780.4 - W W - 21.4 -January 2018 W W - 881.4 - W W - 24.5 -February 2017 W W W W - W W - 25.4 -
OhioFebruary 2018 W W - 9,821.9 - W W - 42.2 -January 2018 W W - 9,394.5 - W W - 46.1 -February 2017 W W - 9,408.7 - W W - 44.8 -
OklahomaFebruary 2018 W W - 3,737.9 660.0 W W - 4.3 -January 2018 W W - W W W W - 6.1 -February 2017 W W - W W W W - 5.2 -
South DakotaFebruary 2018 W W - 892.7 - W W - 19.4 -January 2018 W W - 930.5 - W W - 20.8 -February 2017 W W - 840.4 - W W - 26.4 -
TennesseeFebruary 2018 W W - 8,573.2 - W W - 67.9 -January 2018 W W - 8,153.0 - W W - 67.8 -February 2017 W W - 8,487.3 - W W - 84.8 -
WisconsinFebruary 2018 W W W W - W W W W -January 2018 W W W W - W W W W -February 2017 W W W W - W W W W -
PAD District 3February 2018 898.4 928.4 W W 11,292.4 90.1 90.1 W W -January 2018 868.6 905.2 W W 10,399.0 W 86.8 W W -February 2017 889.1 911.7 W W 9,734.6 88.3 88.5 W W -
AlabamaFebruary 2018 - W - 4,400.7 - - - - 34.4 -January 2018 - W - 4,288.4 - - - - 34.4 -February 2017 - W - 4,232.7 - - - - 37.1 -
ArkansasFebruary 2018 - - - 2,696.8 - - - - 14.1 -January 2018 - - - 2,640.5 - - - - 14.4 -February 2017 - - - 2,710.9 - - - - 19.6 -
LouisianaFebruary 2018 - W - W W - - - 17.0 -January 2018 - W - W W - - - 17.5 -February 2017 - W - 5,762.0 799.6 - - - 27.8 -
MississippiFebruary 2018 - - - W W - - - 21.4 -January 2018 - - - W W - - - 20.3 -February 2017 - - - W W - - - 27.7 -
New MexicoFebruary 2018 W 378.9 W W - W W W W -January 2018 W 378.0 W W - 49.1 W W W -February 2017 W 372.9 W W - W W W W -
TexasFebruary 2018 W W W 30,636.0 W W W - 168.0 -January 2018 W W W 28,653.5 W W W - 157.2 -February 2017 W W W 29,288.4 W W W - 175.5 -
See footnotes at end of table.
U.S. Energy Information Administration�|�Petroleum Marketing Monthly62
May 2018

Table 39. Refi ner motor gasoline volumes by grade, sales type, PAD District, and state (cont.)thousand gallons per day
Geographic area month
Premium All grades
Sales to end users Sales for resale Sales to end users Sales for resale
Through retail outlets Total[a] DTW Rack Bulk
Through retail outlets Total[a] DTW Rack Bulk
PAD District 2 (cont.)Nebraska
February 2018 - - - 142.3 - W W - 1,586.6 -January 2018 - - - 150.0 - W W - 1,612.2 -February 2017 W W - 165.0 - W W - 1,597.4 -
North DakotaFebruary 2018 W W - 76.5 - W W - 878.2 -January 2018 W W - 86.6 - W W - 992.5 -February 2017 W W W W - W W W W -
OhioFebruary 2018 W W - W W W W - W WJanuary 2018 W W - W W W W - W WFebruary 2017 W W - W W W W - W W
OklahomaFebruary 2018 W W - 372.6 447.0 W W - 4,114.8 1,107.0January 2018 W W - W W W W - 4,085.8 485.0February 2017 W W - W W W W - 4,372.5 1,204.5
South DakotaFebruary 2018 W W - 69.1 - W W - 981.2 -January 2018 W W - 79.2 - W W - 1,030.5 -February 2017 W W - 77.0 - W W - 943.8 -
TennesseeFebruary 2018 W W - 788.4 - W W - 9,429.5 -January 2018 W W - 774.2 - W W - 8,995.0 -February 2017 W W - 780.5 - W W - 9,352.6 -
WisconsinFebruary 2018 W W W 447.3 W W W W 5,752.3 WJanuary 2018 W W W 427.4 W W W W 5,738.9 WFebruary 2017 W W W W - W W W W -
PAD District 3February 2018 83.4 88.9 W 4,922.0 W 1,071.9 1,107.4 W 52,804.6 WJanuary 2018 W 88.0 W 4,695.8 W 1,036.5 1,079.9 W 49,715.9 WFebruary 2017 85.7 90.4 W 4,963.5 W 1,063.1 1,090.6 W 51,697.5 W
AlabamaFebruary 2018 - W - 396.5 - - W - 4,831.6 -January 2018 - W - 388.0 - - W - 4,710.7 -February 2017 - W - 364.0 - - W - 4,633.8 -
ArkansasFebruary 2018 - - - 204.0 - - - - 2,914.9 -January 2018 - - - 201.9 - - - - 2,856.8 -February 2017 - - - 209.3 - - - - 2,939.8 -
LouisianaFebruary 2018 - - - W W - W - 6,131.5 4,527.7January 2018 - - - W W - W - 5,629.9 2,505.5February 2017 - - - 529.7 - - W - 6,319.5 799.6
MississippiFebruary 2018 - - - 206.5 - - - - W WJanuary 2018 - - - 194.5 - - - - W WFebruary 2017 - - - W W - - - W W
New MexicoFebruary 2018 W W W W - W 473.3 W W -January 2018 40.4 W W W - W 468.9 W W -February 2017 W W W W - W 466.0 W W -
TexasFebruary 2018 W W W 3,432.4 W W W W 34,236.4 WJanuary 2018 W W W 3,253.0 W W W W 32,063.6 WFebruary 2017 W W W 3,435.4 W W W W 32,899.4 W
See footnotes at end of table.
U.S. Energy Information Administration�|�Petroleum Marketing Monthly 63
May 2018
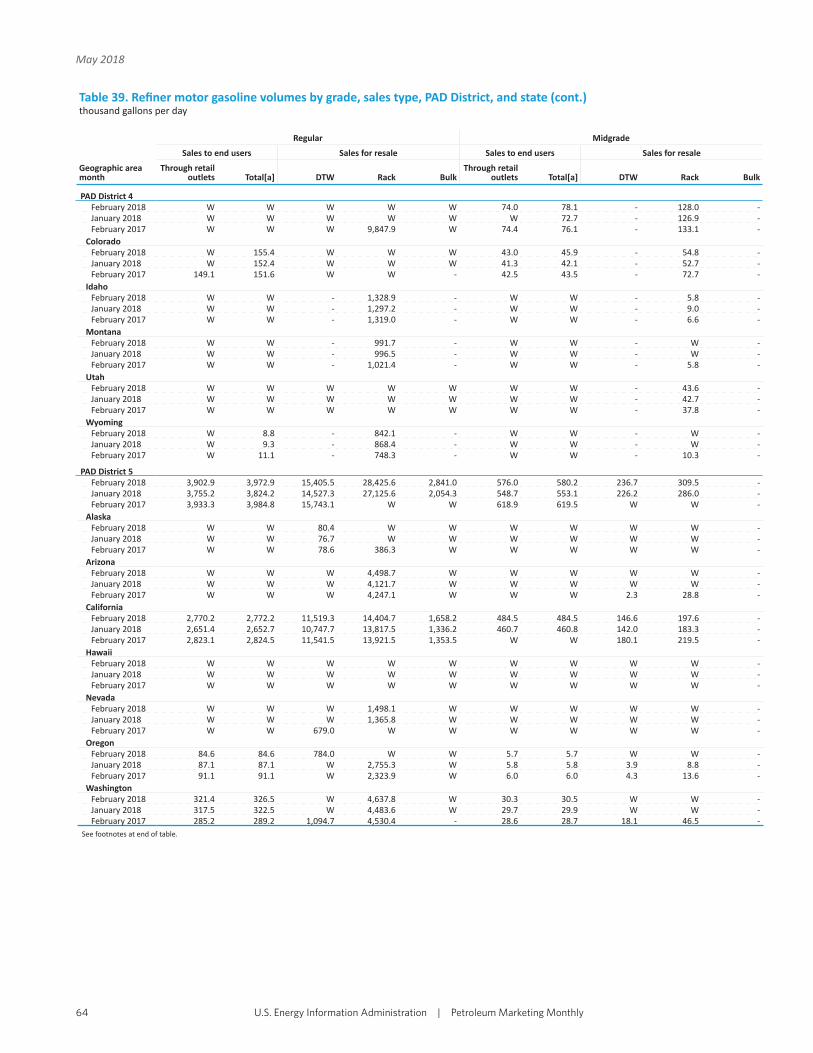
Table 39. Refi ner motor gasoline volumes by grade, sales type, PAD District, and state (cont.)thousand gallons per day
Geographic area month
Regular Midgrade
Sales to end users Sales for resale Sales to end users Sales for resale
Through retail outlets Total[a] DTW Rack Bulk
Through retail outlets Total[a] DTW Rack Bulk
PAD District 4February 2018 W W W W W 74.0 78.1 - 128.0 -January 2018 W W W W W W 72.7 - 126.9 -February 2017 W W W 9,847.9 W 74.4 76.1 - 133.1 -
ColoradoFebruary 2018 W 155.4 W W W 43.0 45.9 - 54.8 -January 2018 W 152.4 W W W 41.3 42.1 - 52.7 -February 2017 149.1 151.6 W W - 42.5 43.5 - 72.7 -
IdahoFebruary 2018 W W - 1,328.9 - W W - 5.8 -January 2018 W W - 1,297.2 - W W - 9.0 -February 2017 W W - 1,319.0 - W W - 6.6 -
MontanaFebruary 2018 W W - 991.7 - W W - W -January 2018 W W - 996.5 - W W - W -February 2017 W W - 1,021.4 - W W - 5.8 -
UtahFebruary 2018 W W W W W W W - 43.6 -January 2018 W W W W W W W - 42.7 -February 2017 W W W W W W W - 37.8 -
WyomingFebruary 2018 W 8.8 - 842.1 - W W - W -January 2018 W 9.3 - 868.4 - W W - W -February 2017 W 11.1 - 748.3 - W W - 10.3 -
PAD District 5February 2018 3,902.9 3,972.9 15,405.5 28,425.6 2,841.0 576.0 580.2 236.7 309.5 -January 2018 3,755.2 3,824.2 14,527.3 27,125.6 2,054.3 548.7 553.1 226.2 286.0 -February 2017 3,933.3 3,984.8 15,743.1 W W 618.9 619.5 W W -
AlaskaFebruary 2018 W W 80.4 W W W W W W -January 2018 W W 76.7 W W W W W W -February 2017 W W 78.6 386.3 W W W W W -
ArizonaFebruary 2018 W W W 4,498.7 W W W W W -January 2018 W W W 4,121.7 W W W W W -February 2017 W W W 4,247.1 W W W 2.3 28.8 -
CaliforniaFebruary 2018 2,770.2 2,772.2 11,519.3 14,404.7 1,658.2 484.5 484.5 146.6 197.6 -January 2018 2,651.4 2,652.7 10,747.7 13,817.5 1,336.2 460.7 460.8 142.0 183.3 -February 2017 2,823.1 2,824.5 11,541.5 13,921.5 1,353.5 W W 180.1 219.5 -
HawaiiFebruary 2018 W W W W W W W W W -January 2018 W W W W W W W W W -February 2017 W W W W W W W W W -
NevadaFebruary 2018 W W W 1,498.1 W W W W W -January 2018 W W W 1,365.8 W W W W W -February 2017 W W 679.0 W W W W W W -
OregonFebruary 2018 84.6 84.6 784.0 W W 5.7 5.7 W W -January 2018 87.1 87.1 W 2,755.3 W 5.8 5.8 3.9 8.8 -February 2017 91.1 91.1 W 2,323.9 W 6.0 6.0 4.3 13.6 -
WashingtonFebruary 2018 321.4 326.5 W 4,637.8 W 30.3 30.5 W W -January 2018 317.5 322.5 W 4,483.6 W 29.7 29.9 W W -February 2017 285.2 289.2 1,094.7 4,530.4 - 28.6 28.7 18.1 46.5 -
See footnotes at end of table.
U.S. Energy Information Administration�|�Petroleum Marketing Monthly64
May 2018
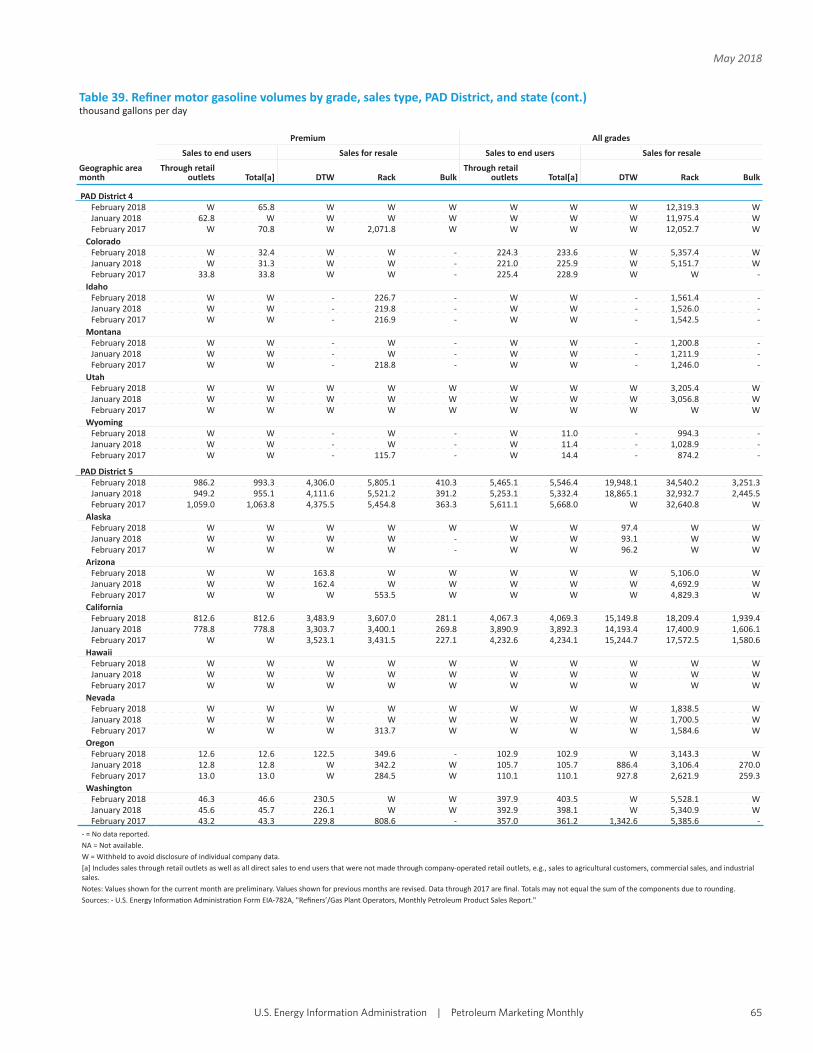
Table 39. Refi ner motor gasoline volumes by grade, sales type, PAD District, and state (cont.)thousand gallons per day
Geographic area month
Premium All grades
Sales to end users Sales for resale Sales to end users Sales for resale
Through retail outlets Total[a] DTW Rack Bulk
Through retail outlets Total[a] DTW Rack Bulk
PAD District 4February 2018 W 65.8 W W W W W W 12,319.3 WJanuary 2018 62.8 W W W W W W W 11,975.4 WFebruary 2017 W 70.8 W 2,071.8 W W W W 12,052.7 W
ColoradoFebruary 2018 W 32.4 W W - 224.3 233.6 W 5,357.4 WJanuary 2018 W 31.3 W W - 221.0 225.9 W 5,151.7 WFebruary 2017 33.8 33.8 W W - 225.4 228.9 W W -
IdahoFebruary 2018 W W - 226.7 - W W - 1,561.4 -January 2018 W W - 219.8 - W W - 1,526.0 -February 2017 W W - 216.9 - W W - 1,542.5 -
MontanaFebruary 2018 W W - W - W W - 1,200.8 -January 2018 W W - W - W W - 1,211.9 -February 2017 W W - 218.8 - W W - 1,246.0 -
UtahFebruary 2018 W W W W W W W W 3,205.4 WJanuary 2018 W W W W W W W W 3,056.8 WFebruary 2017 W W W W W W W W W W
WyomingFebruary 2018 W W - W - W 11.0 - 994.3 -January 2018 W W - W - W 11.4 - 1,028.9 -February 2017 W W - 115.7 - W 14.4 - 874.2 -
PAD District 5February 2018 986.2 993.3 4,306.0 5,805.1 410.3 5,465.1 5,546.4 19,948.1 34,540.2 3,251.3January 2018 949.2 955.1 4,111.6 5,521.2 391.2 5,253.1 5,332.4 18,865.1 32,932.7 2,445.5February 2017 1,059.0 1,063.8 4,375.5 5,454.8 363.3 5,611.1 5,668.0 W 32,640.8 W
AlaskaFebruary 2018 W W W W W W W 97.4 W WJanuary 2018 W W W W - W W 93.1 W WFebruary 2017 W W W W - W W 96.2 W W
ArizonaFebruary 2018 W W 163.8 W W W W W 5,106.0 WJanuary 2018 W W 162.4 W W W W W 4,692.9 WFebruary 2017 W W W 553.5 W W W W 4,829.3 W
CaliforniaFebruary 2018 812.6 812.6 3,483.9 3,607.0 281.1 4,067.3 4,069.3 15,149.8 18,209.4 1,939.4January 2018 778.8 778.8 3,303.7 3,400.1 269.8 3,890.9 3,892.3 14,193.4 17,400.9 1,606.1February 2017 W W 3,523.1 3,431.5 227.1 4,232.6 4,234.1 15,244.7 17,572.5 1,580.6
HawaiiFebruary 2018 W W W W W W W W W WJanuary 2018 W W W W W W W W W WFebruary 2017 W W W W W W W W W W
NevadaFebruary 2018 W W W W W W W W 1,838.5 WJanuary 2018 W W W W W W W W 1,700.5 WFebruary 2017 W W W 313.7 W W W W 1,584.6 W
OregonFebruary 2018 12.6 12.6 122.5 349.6 - 102.9 102.9 W 3,143.3 WJanuary 2018 12.8 12.8 W 342.2 W 105.7 105.7 886.4 3,106.4 270.0February 2017 13.0 13.0 W 284.5 W 110.1 110.1 927.8 2,621.9 259.3
WashingtonFebruary 2018 46.3 46.6 230.5 W W 397.9 403.5 W 5,528.1 WJanuary 2018 45.6 45.7 226.1 W W 392.9 398.1 W 5,340.9 WFebruary 2017 43.2 43.3 229.8 808.6 - 357.0 361.2 1,342.6 5,385.6 -
- = No data reported.NA = Not available.W = Withheld to avoid disclosure of individual company data.[a] Includes sales through retail outlets as well as all direct sales to end users that were not made through company-operated retail outlets, e.g., sales to agricultural customers, commercial sales, and industrial sales.Notes: Values shown for the current month are preliminary. Values shown for previous months are revised. Data through 2017 are fi nal. Totals may not equal the sum of the components due to rounding.Sources: - U.S. Energy Informa on Administra on Form EIA-782A, "Refi ners’/Gas Plant Operators, Monthly Petroleum Product Sales Report."
U.S. Energy Information Administration�|�Petroleum Marketing Monthly 65
May 2018
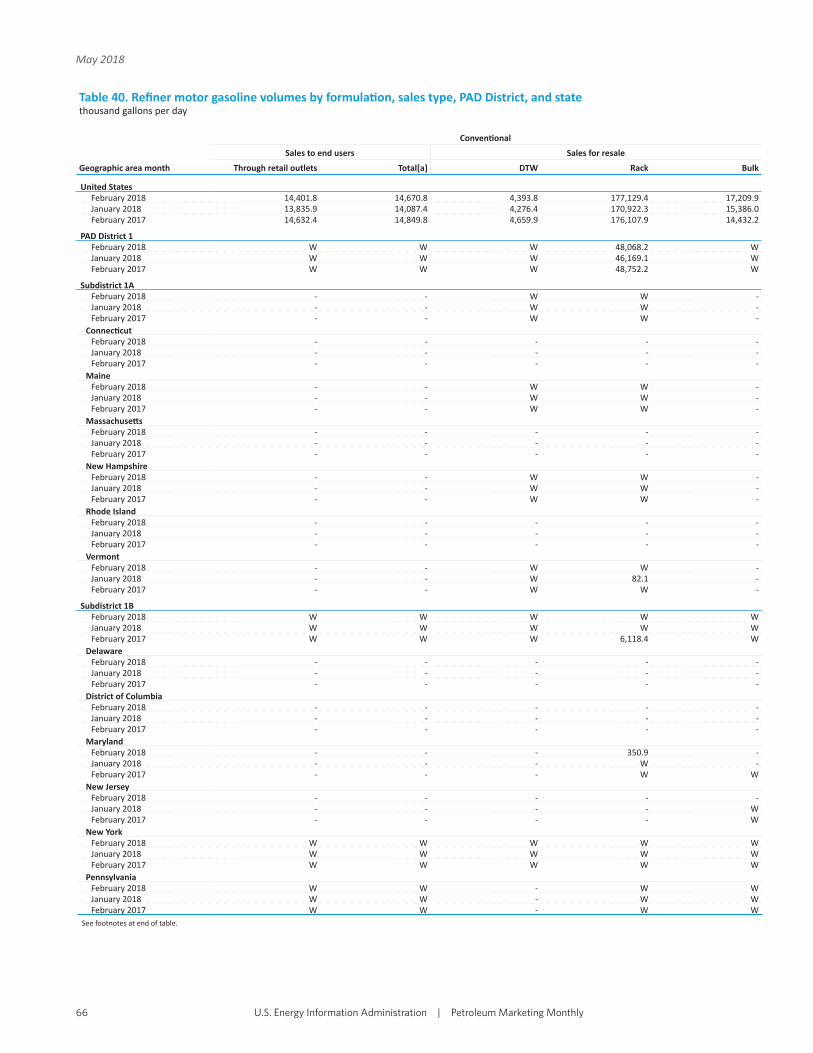
Table 40. Refi ner motor gasoline volumes by formula on, sales type, PAD District, and statethousand gallons per day
Geographic area month
Conven onal
Sales to end users Sales for resale
Through retail outlets Total[a] DTW Rack Bulk
United StatesFebruary 2018 14,401.8 14,670.8 4,393.8 177,129.4 17,209.9January 2018 13,835.9 14,087.4 4,276.4 170,922.3 15,386.0February 2017 14,632.4 14,849.8 4,659.9 176,107.9 14,432.2
PAD District 1February 2018 W W W 48,068.2 WJanuary 2018 W W W 46,169.1 WFebruary 2017 W W W 48,752.2 W
Subdistrict 1AFebruary 2018 - - W W -January 2018 - - W W -February 2017 - - W W -
Connec cutFebruary 2018 - - - - -January 2018 - - - - -February 2017 - - - - -
MaineFebruary 2018 - - W W -January 2018 - - W W -February 2017 - - W W -
Massachuse sFebruary 2018 - - - - -January 2018 - - - - -February 2017 - - - - -
New HampshireFebruary 2018 - - W W -January 2018 - - W W -February 2017 - - W W -
Rhode IslandFebruary 2018 - - - - -January 2018 - - - - -February 2017 - - - - -
VermontFebruary 2018 - - W W -January 2018 - - W 82.1 -February 2017 - - W W -
Subdistrict 1BFebruary 2018 W W W W WJanuary 2018 W W W W WFebruary 2017 W W W 6,118.4 W
DelawareFebruary 2018 - - - - -January 2018 - - - - -February 2017 - - - - -
District of ColumbiaFebruary 2018 - - - - -January 2018 - - - - -February 2017 - - - - -
MarylandFebruary 2018 - - - 350.9 -January 2018 - - - W -February 2017 - - - W W
New JerseyFebruary 2018 - - - - -January 2018 - - - - WFebruary 2017 - - - - W
New YorkFebruary 2018 W W W W WJanuary 2018 W W W W WFebruary 2017 W W W W W
PennsylvaniaFebruary 2018 W W - W WJanuary 2018 W W - W WFebruary 2017 W W - W W
See footnotes at end of table.
U.S. Energy Information Administration�|�Petroleum Marketing Monthly66
May 2018

Table 40. Refi ner motor gasoline volumes by formula on, sales type, PAD District, and state (cont.)thousand gallons per day
Geographic area month
Reformulated
Sales to end users Sales for resale
Through retail outlets Total[a] DTW Rack Bulk
United StatesFebruary 2018 8,698.7 8,726.9 17,382.6 76,255.7 3,675.8January 2018 8,428.8 8,456.4 16,383.7 73,072.9 3,061.8February 2017 8,880.4 8,909.2 17,334.2 74,120.1 3,063.8
PAD District 1February 2018 W W W 26,980.4 WJanuary 2018 W W W 26,162.4 WFebruary 2017 W W W 25,674.5 W
Subdistrict 1AFebruary 2018 W W - W WJanuary 2018 W W - W WFebruary 2017 W W W 4,344.4 W
Connec cutFebruary 2018 - W - W WJanuary 2018 - W - W WFebruary 2017 - W W 2,302.5 W
MaineFebruary 2018 - - - W -January 2018 - - - W -February 2017 - - - W -
Massachuse sFebruary 2018 W W - 1,114.6 -January 2018 W W - 1,139.7 -February 2017 W W W W -
New HampshireFebruary 2018 W W - W -January 2018 W W - W -February 2017 W W - - -
Rhode IslandFebruary 2018 W W - 1,062.1 -January 2018 W W - 1,022.8 -February 2017 W W W W W
VermontFebruary 2018 - - - - -January 2018 - - - - -February 2017 - - - - -
Subdistrict 1BFebruary 2018 W W W W WJanuary 2018 W W W W WFebruary 2017 W W W 17,099.0 W
DelawareFebruary 2018 W W - 1,038.4 -January 2018 W W - 1,004.5 -February 2017 W W - 1,073.8 -
District of ColumbiaFebruary 2018 - - - - -January 2018 - - - - -February 2017 - - - - -
MarylandFebruary 2018 - - - 4,220.1 -January 2018 - - - W -February 2017 - W W W -
New JerseyFebruary 2018 W W W 7,504.3 WJanuary 2018 W W W 6,993.5 WFebruary 2017 W W W W W
New YorkFebruary 2018 W W W W -January 2018 W W W W -February 2017 W W W W -
PennsylvaniaFebruary 2018 W W - W WJanuary 2018 W W - W WFebruary 2017 W W - W W
See footnotes at end of table.
U.S. Energy Information Administration�|�Petroleum Marketing Monthly 67
May 2018
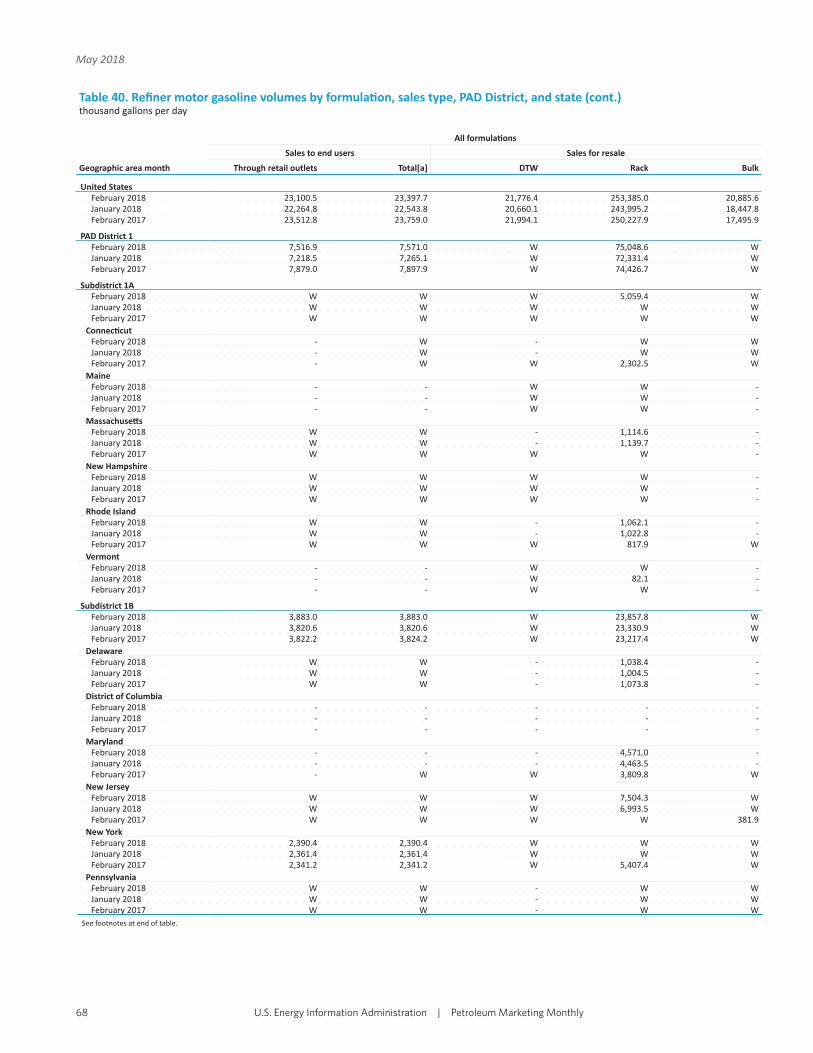
Table 40. Refi ner motor gasoline volumes by formula on, sales type, PAD District, and state (cont.)thousand gallons per day
Geographic area month
All formula ons
Sales to end users Sales for resale
Through retail outlets Total[a] DTW Rack Bulk
United StatesFebruary 2018 23,100.5 23,397.7 21,776.4 253,385.0 20,885.6January 2018 22,264.8 22,543.8 20,660.1 243,995.2 18,447.8February 2017 23,512.8 23,759.0 21,994.1 250,227.9 17,495.9
PAD District 1February 2018 7,516.9 7,571.0 W 75,048.6 WJanuary 2018 7,218.5 7,265.1 W 72,331.4 WFebruary 2017 7,879.0 7,897.9 W 74,426.7 W
Subdistrict 1AFebruary 2018 W W W 5,059.4 WJanuary 2018 W W W W WFebruary 2017 W W W W W
Connec cutFebruary 2018 - W - W WJanuary 2018 - W - W WFebruary 2017 - W W 2,302.5 W
MaineFebruary 2018 - - W W -January 2018 - - W W -February 2017 - - W W -
Massachuse sFebruary 2018 W W - 1,114.6 -January 2018 W W - 1,139.7 -February 2017 W W W W -
New HampshireFebruary 2018 W W W W -January 2018 W W W W -February 2017 W W W W -
Rhode IslandFebruary 2018 W W - 1,062.1 -January 2018 W W - 1,022.8 -February 2017 W W W 817.9 W
VermontFebruary 2018 - - W W -January 2018 - - W 82.1 -February 2017 - - W W -
Subdistrict 1BFebruary 2018 3,883.0 3,883.0 W 23,857.8 WJanuary 2018 3,820.6 3,820.6 W 23,330.9 WFebruary 2017 3,822.2 3,824.2 W 23,217.4 W
DelawareFebruary 2018 W W - 1,038.4 -January 2018 W W - 1,004.5 -February 2017 W W - 1,073.8 -
District of ColumbiaFebruary 2018 - - - - -January 2018 - - - - -February 2017 - - - - -
MarylandFebruary 2018 - - - 4,571.0 -January 2018 - - - 4,463.5 -February 2017 - W W 3,809.8 W
New JerseyFebruary 2018 W W W 7,504.3 WJanuary 2018 W W W 6,993.5 WFebruary 2017 W W W W 381.9
New YorkFebruary 2018 2,390.4 2,390.4 W W WJanuary 2018 2,361.4 2,361.4 W W WFebruary 2017 2,341.2 2,341.2 W 5,407.4 W
PennsylvaniaFebruary 2018 W W - W WJanuary 2018 W W - W WFebruary 2017 W W - W W
See footnotes at end of table.
U.S. Energy Information Administration�|�Petroleum Marketing Monthly68
May 2018

Table 40. Refi ner motor gasoline volumes by formula on, sales type, PAD District, and state (cont.)thousand gallons per day
Geographic area month
Conven onal
Sales to end users Sales for resale
Through retail outlets Total[a] DTW Rack Bulk
Subdistrict 1CFebruary 2018 W W - 41,866.9 308.0January 2018 W W - W WFebruary 2017 W W - W W
FloridaFebruary 2018 W W - 15,737.4 -January 2018 W W - 14,971.8 -February 2017 W W - 15,795.4 -
GeorgiaFebruary 2018 W W - 8,708.0 -January 2018 W W - 8,239.3 -February 2017 W W - 8,746.9 -
North CarolinaFebruary 2018 W W - W WJanuary 2018 W W - 8,851.4 -February 2017 W W - W W
South CarolinaFebruary 2018 W W - 4,526.2 -January 2018 W W - 4,330.1 -February 2017 W W - 4,668.1 -
VirginiaFebruary 2018 - - - W WJanuary 2018 - - - W WFebruary 2017 W W - W W
West VirginiaFebruary 2018 W W - W WJanuary 2018 W W - W WFebruary 2017 W W - 812.6 -
PAD District 2February 2018 W 7,114.6 W W 1,521.5January 2018 W 6,874.5 W W WFebruary 2017 6,891.9 6,991.8 W W W
IllinoisFebruary 2018 W W - W WJanuary 2018 W W - W WFebruary 2017 W W - W W
IndianaFebruary 2018 W W - W WJanuary 2018 W W - W WFebruary 2017 W W - W W
IowaFebruary 2018 - W - 2,507.4 -January 2018 - W - 2,671.1 -February 2017 - W - 2,734.6 -
KansasFebruary 2018 W W - W WJanuary 2018 W W - W WFebruary 2017 W W - 4,092.8 109.5
KentuckyFebruary 2018 W W - W WJanuary 2018 W W - W WFebruary 2017 W W - W W
MichiganFebruary 2018 W W - W WJanuary 2018 W W - W WFebruary 2017 W W - W W
MinnesotaFebruary 2018 W W W 4,961.7 WJanuary 2018 W W W 4,730.1 WFebruary 2017 W W W 5,245.9 W
MissouriFebruary 2018 - W - 2,440.4 -January 2018 - W - 2,545.3 -February 2017 - W - W -
See footnotes at end of table.
U.S. Energy Information Administration�|�Petroleum Marketing Monthly 69
May 2018
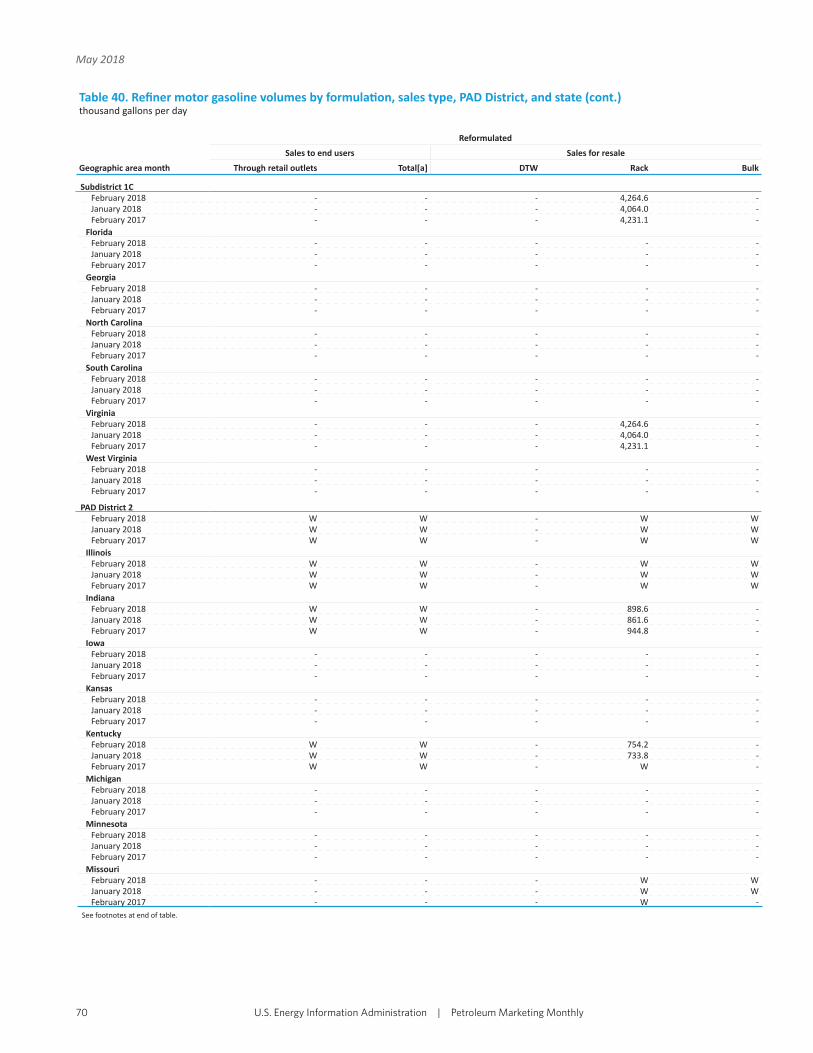
Table 40. Refi ner motor gasoline volumes by formula on, sales type, PAD District, and state (cont.)thousand gallons per day
Geographic area month
Reformulated
Sales to end users Sales for resale
Through retail outlets Total[a] DTW Rack Bulk
Subdistrict 1CFebruary 2018 - - - 4,264.6 -January 2018 - - - 4,064.0 -February 2017 - - - 4,231.1 -
FloridaFebruary 2018 - - - - -January 2018 - - - - -February 2017 - - - - -
GeorgiaFebruary 2018 - - - - -January 2018 - - - - -February 2017 - - - - -
North CarolinaFebruary 2018 - - - - -January 2018 - - - - -February 2017 - - - - -
South CarolinaFebruary 2018 - - - - -January 2018 - - - - -February 2017 - - - - -
VirginiaFebruary 2018 - - - 4,264.6 -January 2018 - - - 4,064.0 -February 2017 - - - 4,231.1 -
West VirginiaFebruary 2018 - - - - -January 2018 - - - - -February 2017 - - - - -
PAD District 2February 2018 W W - W WJanuary 2018 W W - W WFebruary 2017 W W - W W
IllinoisFebruary 2018 W W - W WJanuary 2018 W W - W WFebruary 2017 W W - W W
IndianaFebruary 2018 W W - 898.6 -January 2018 W W - 861.6 -February 2017 W W - 944.8 -
IowaFebruary 2018 - - - - -January 2018 - - - - -February 2017 - - - - -
KansasFebruary 2018 - - - - -January 2018 - - - - -February 2017 - - - - -
KentuckyFebruary 2018 W W - 754.2 -January 2018 W W - 733.8 -February 2017 W W - W -
MichiganFebruary 2018 - - - - -January 2018 - - - - -February 2017 - - - - -
MinnesotaFebruary 2018 - - - - -January 2018 - - - - -February 2017 - - - - -
MissouriFebruary 2018 - - - W WJanuary 2018 - - - W WFebruary 2017 - - - W -
See footnotes at end of table.
U.S. Energy Information Administration�|�Petroleum Marketing Monthly70
May 2018

Table 40. Refi ner motor gasoline volumes by formula on, sales type, PAD District, and state (cont.)thousand gallons per day
Geographic area month
All formula ons
Sales to end users Sales for resale
Through retail outlets Total[a] DTW Rack Bulk
Subdistrict 1CFebruary 2018 W W - 46,131.5 308.0January 2018 W W - W WFebruary 2017 W W - W W
FloridaFebruary 2018 W W - 15,737.4 -January 2018 W W - 14,971.8 -February 2017 W W - 15,795.4 -
GeorgiaFebruary 2018 W W - 8,708.0 -January 2018 W W - 8,239.3 -February 2017 W W - 8,746.9 -
North CarolinaFebruary 2018 W W - W WJanuary 2018 W W - 8,851.4 -February 2017 W W - W W
South CarolinaFebruary 2018 W W - 4,526.2 -January 2018 W W - 4,330.1 -February 2017 W W - 4,668.1 -
VirginiaFebruary 2018 - - - W WJanuary 2018 - - - W WFebruary 2017 W W - W W
West VirginiaFebruary 2018 W W - W WJanuary 2018 W W - W WFebruary 2017 W W - 812.6 -
PAD District 2February 2018 W W W 78,672.4 WJanuary 2018 W W W 77,039.7 WFebruary 2017 W W W 79,410.3 W
IllinoisFebruary 2018 W W - W WJanuary 2018 W W - W WFebruary 2017 W W - W W
IndianaFebruary 2018 W W - W WJanuary 2018 W W - W WFebruary 2017 W W - W W
IowaFebruary 2018 - W - 2,507.4 -January 2018 - W - 2,671.1 -February 2017 - W - 2,734.6 -
KansasFebruary 2018 W W - W WJanuary 2018 W W - W WFebruary 2017 W W - 4,092.8 109.5
KentuckyFebruary 2018 W W - W WJanuary 2018 W W - W WFebruary 2017 W W - W W
MichiganFebruary 2018 W W - W WJanuary 2018 W W - W WFebruary 2017 W W - W W
MinnesotaFebruary 2018 W W W 4,961.7 WJanuary 2018 W W W 4,730.1 WFebruary 2017 W W W 5,245.9 W
MissouriFebruary 2018 - W - W WJanuary 2018 - W - W WFebruary 2017 - W - 3,184.1 -
See footnotes at end of table.
U.S. Energy Information Administration�|�Petroleum Marketing Monthly 71
May 2018
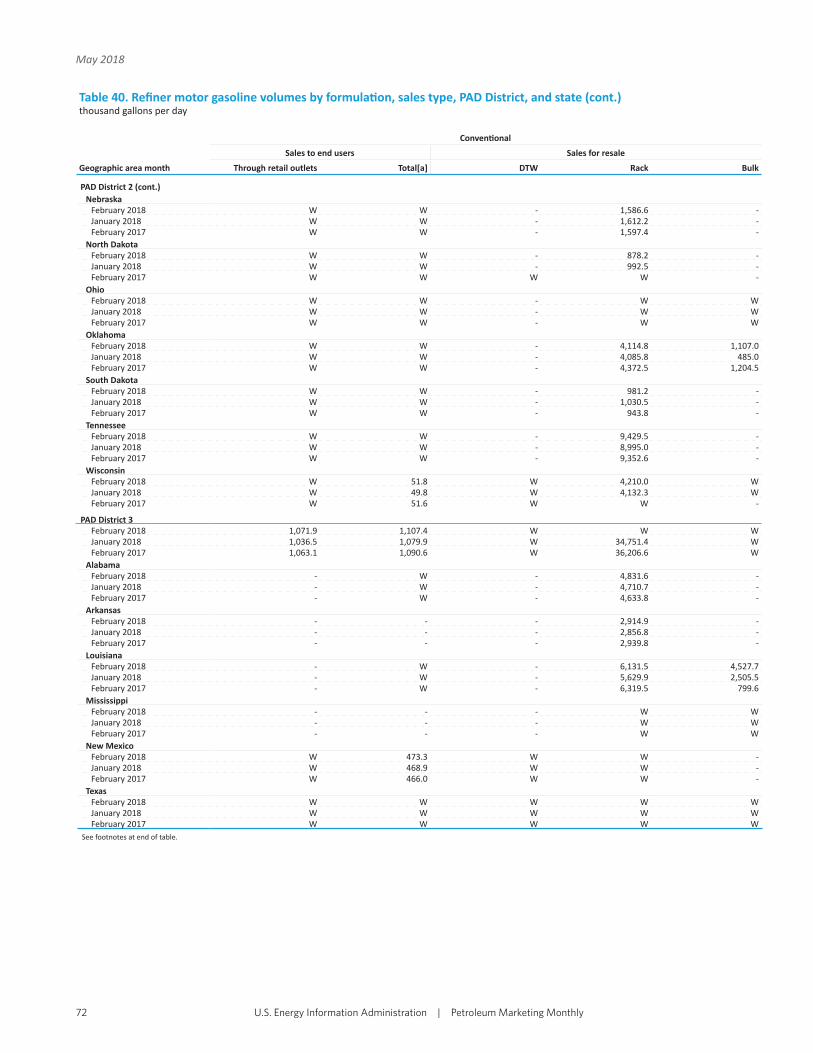
Table 40. Refi ner motor gasoline volumes by formula on, sales type, PAD District, and state (cont.)thousand gallons per day
Geographic area month
Conven onal
Sales to end users Sales for resale
Through retail outlets Total[a] DTW Rack Bulk
PAD District 2 (cont.)Nebraska
February 2018 W W - 1,586.6 -January 2018 W W - 1,612.2 -February 2017 W W - 1,597.4 -
North DakotaFebruary 2018 W W - 878.2 -January 2018 W W - 992.5 -February 2017 W W W W -
OhioFebruary 2018 W W - W WJanuary 2018 W W - W WFebruary 2017 W W - W W
OklahomaFebruary 2018 W W - 4,114.8 1,107.0January 2018 W W - 4,085.8 485.0February 2017 W W - 4,372.5 1,204.5
South DakotaFebruary 2018 W W - 981.2 -January 2018 W W - 1,030.5 -February 2017 W W - 943.8 -
TennesseeFebruary 2018 W W - 9,429.5 -January 2018 W W - 8,995.0 -February 2017 W W - 9,352.6 -
WisconsinFebruary 2018 W 51.8 W 4,210.0 WJanuary 2018 W 49.8 W 4,132.3 WFebruary 2017 W 51.6 W W -
PAD District 3February 2018 1,071.9 1,107.4 W W WJanuary 2018 1,036.5 1,079.9 W 34,751.4 WFebruary 2017 1,063.1 1,090.6 W 36,206.6 W
AlabamaFebruary 2018 - W - 4,831.6 -January 2018 - W - 4,710.7 -February 2017 - W - 4,633.8 -
ArkansasFebruary 2018 - - - 2,914.9 -January 2018 - - - 2,856.8 -February 2017 - - - 2,939.8 -
LouisianaFebruary 2018 - W - 6,131.5 4,527.7January 2018 - W - 5,629.9 2,505.5February 2017 - W - 6,319.5 799.6
MississippiFebruary 2018 - - - W WJanuary 2018 - - - W WFebruary 2017 - - - W W
New MexicoFebruary 2018 W 473.3 W W -January 2018 W 468.9 W W -February 2017 W 466.0 W W -
TexasFebruary 2018 W W W W WJanuary 2018 W W W W WFebruary 2017 W W W W W
See footnotes at end of table.
U.S. Energy Information Administration�|�Petroleum Marketing Monthly72
May 2018
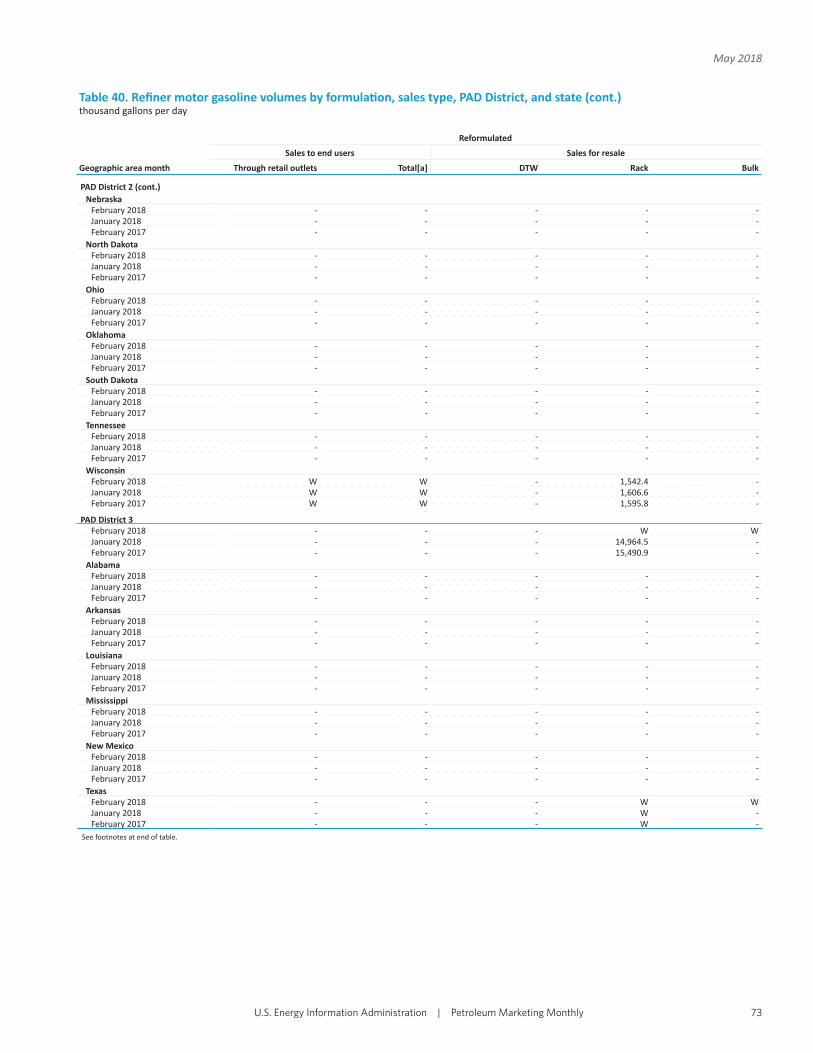
Table 40. Refi ner motor gasoline volumes by formula on, sales type, PAD District, and state (cont.)thousand gallons per day
Geographic area month
Reformulated
Sales to end users Sales for resale
Through retail outlets Total[a] DTW Rack Bulk
PAD District 2 (cont.)Nebraska
February 2018 - - - - -January 2018 - - - - -February 2017 - - - - -
North DakotaFebruary 2018 - - - - -January 2018 - - - - -February 2017 - - - - -
OhioFebruary 2018 - - - - -January 2018 - - - - -February 2017 - - - - -
OklahomaFebruary 2018 - - - - -January 2018 - - - - -February 2017 - - - - -
South DakotaFebruary 2018 - - - - -January 2018 - - - - -February 2017 - - - - -
TennesseeFebruary 2018 - - - - -January 2018 - - - - -February 2017 - - - - -
WisconsinFebruary 2018 W W - 1,542.4 -January 2018 W W - 1,606.6 -February 2017 W W - 1,595.8 -
PAD District 3February 2018 - - - W WJanuary 2018 - - - 14,964.5 -February 2017 - - - 15,490.9 -
AlabamaFebruary 2018 - - - - -January 2018 - - - - -February 2017 - - - - -
ArkansasFebruary 2018 - - - - -January 2018 - - - - -February 2017 - - - - -
LouisianaFebruary 2018 - - - - -January 2018 - - - - -February 2017 - - - - -
MississippiFebruary 2018 - - - - -January 2018 - - - - -February 2017 - - - - -
New MexicoFebruary 2018 - - - - -January 2018 - - - - -February 2017 - - - - -
TexasFebruary 2018 - - - W WJanuary 2018 - - - W -February 2017 - - - W -
See footnotes at end of table.
U.S. Energy Information Administration�|�Petroleum Marketing Monthly 73
May 2018
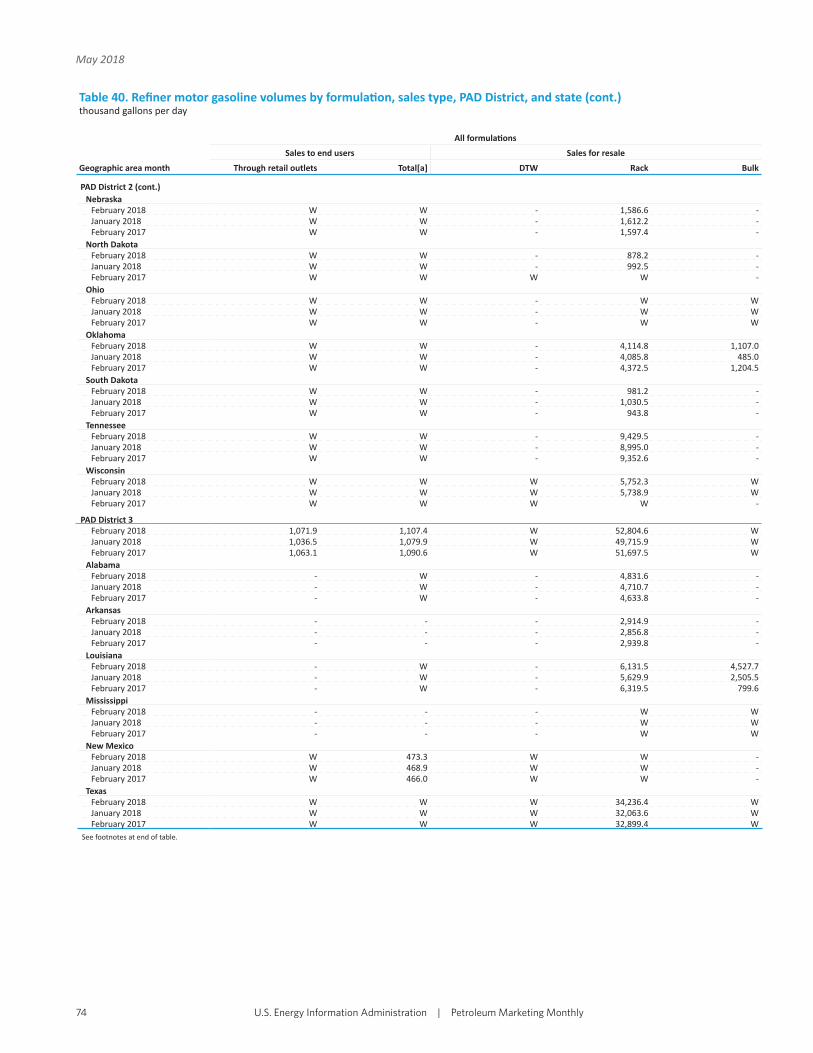
Table 40. Refi ner motor gasoline volumes by formula on, sales type, PAD District, and state (cont.)thousand gallons per day
Geographic area month
All formula ons
Sales to end users Sales for resale
Through retail outlets Total[a] DTW Rack Bulk
PAD District 2 (cont.)Nebraska
February 2018 W W - 1,586.6 -January 2018 W W - 1,612.2 -February 2017 W W - 1,597.4 -
North DakotaFebruary 2018 W W - 878.2 -January 2018 W W - 992.5 -February 2017 W W W W -
OhioFebruary 2018 W W - W WJanuary 2018 W W - W WFebruary 2017 W W - W W
OklahomaFebruary 2018 W W - 4,114.8 1,107.0January 2018 W W - 4,085.8 485.0February 2017 W W - 4,372.5 1,204.5
South DakotaFebruary 2018 W W - 981.2 -January 2018 W W - 1,030.5 -February 2017 W W - 943.8 -
TennesseeFebruary 2018 W W - 9,429.5 -January 2018 W W - 8,995.0 -February 2017 W W - 9,352.6 -
WisconsinFebruary 2018 W W W 5,752.3 WJanuary 2018 W W W 5,738.9 WFebruary 2017 W W W W -
PAD District 3February 2018 1,071.9 1,107.4 W 52,804.6 WJanuary 2018 1,036.5 1,079.9 W 49,715.9 WFebruary 2017 1,063.1 1,090.6 W 51,697.5 W
AlabamaFebruary 2018 - W - 4,831.6 -January 2018 - W - 4,710.7 -February 2017 - W - 4,633.8 -
ArkansasFebruary 2018 - - - 2,914.9 -January 2018 - - - 2,856.8 -February 2017 - - - 2,939.8 -
LouisianaFebruary 2018 - W - 6,131.5 4,527.7January 2018 - W - 5,629.9 2,505.5February 2017 - W - 6,319.5 799.6
MississippiFebruary 2018 - - - W WJanuary 2018 - - - W WFebruary 2017 - - - W W
New MexicoFebruary 2018 W 473.3 W W -January 2018 W 468.9 W W -February 2017 W 466.0 W W -
TexasFebruary 2018 W W W 34,236.4 WJanuary 2018 W W W 32,063.6 WFebruary 2017 W W W 32,899.4 W
See footnotes at end of table.
U.S. Energy Information Administration�|�Petroleum Marketing Monthly74
May 2018
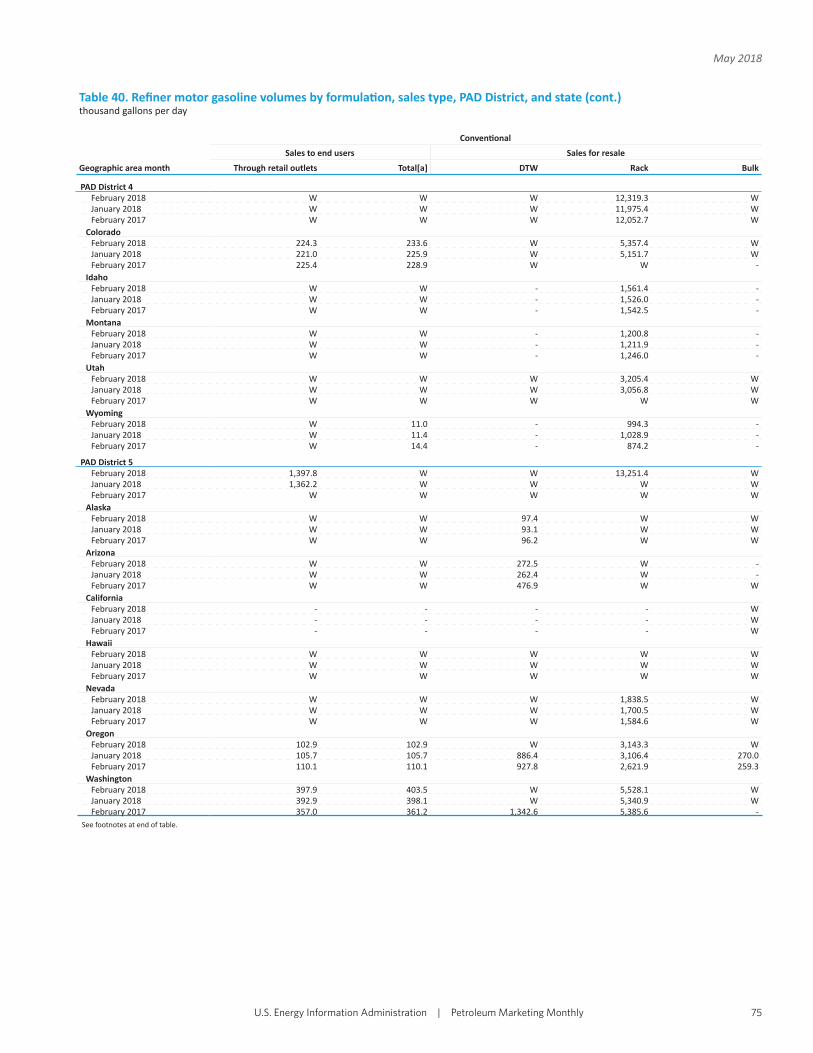
Table 40. Refi ner motor gasoline volumes by formula on, sales type, PAD District, and state (cont.)thousand gallons per day
Geographic area month
Conven onal
Sales to end users Sales for resale
Through retail outlets Total[a] DTW Rack Bulk
PAD District 4February 2018 W W W 12,319.3 WJanuary 2018 W W W 11,975.4 WFebruary 2017 W W W 12,052.7 W
ColoradoFebruary 2018 224.3 233.6 W 5,357.4 WJanuary 2018 221.0 225.9 W 5,151.7 WFebruary 2017 225.4 228.9 W W -
IdahoFebruary 2018 W W - 1,561.4 -January 2018 W W - 1,526.0 -February 2017 W W - 1,542.5 -
MontanaFebruary 2018 W W - 1,200.8 -January 2018 W W - 1,211.9 -February 2017 W W - 1,246.0 -
UtahFebruary 2018 W W W 3,205.4 WJanuary 2018 W W W 3,056.8 WFebruary 2017 W W W W W
WyomingFebruary 2018 W 11.0 - 994.3 -January 2018 W 11.4 - 1,028.9 -February 2017 W 14.4 - 874.2 -
PAD District 5February 2018 1,397.8 W W 13,251.4 WJanuary 2018 1,362.2 W W W WFebruary 2017 W W W W W
AlaskaFebruary 2018 W W 97.4 W WJanuary 2018 W W 93.1 W WFebruary 2017 W W 96.2 W W
ArizonaFebruary 2018 W W 272.5 W -January 2018 W W 262.4 W -February 2017 W W 476.9 W W
CaliforniaFebruary 2018 - - - - WJanuary 2018 - - - - WFebruary 2017 - - - - W
HawaiiFebruary 2018 W W W W WJanuary 2018 W W W W WFebruary 2017 W W W W W
NevadaFebruary 2018 W W W 1,838.5 WJanuary 2018 W W W 1,700.5 WFebruary 2017 W W W 1,584.6 W
OregonFebruary 2018 102.9 102.9 W 3,143.3 WJanuary 2018 105.7 105.7 886.4 3,106.4 270.0February 2017 110.1 110.1 927.8 2,621.9 259.3
WashingtonFebruary 2018 397.9 403.5 W 5,528.1 WJanuary 2018 392.9 398.1 W 5,340.9 WFebruary 2017 357.0 361.2 1,342.6 5,385.6 -
See footnotes at end of table.
U.S. Energy Information Administration�|�Petroleum Marketing Monthly 75
May 2018

Table 40. Refi ner motor gasoline volumes by formula on, sales type, PAD District, and state (cont.)thousand gallons per day
Geographic area month
Reformulated
Sales to end users Sales for resale
Through retail outlets Total[a] DTW Rack Bulk
PAD District 4February 2018 - - - - -January 2018 - - - - -February 2017 - - - - -
ColoradoFebruary 2018 - - - - -January 2018 - - - - -February 2017 - - - - -
IdahoFebruary 2018 - - - - -January 2018 - - - - -February 2017 - - - - -
MontanaFebruary 2018 - - - - -January 2018 - - - - -February 2017 - - - - -
UtahFebruary 2018 - - - - -January 2018 - - - - -February 2017 - - - - -
WyomingFebruary 2018 - - - - -January 2018 - - - - -February 2017 - - - - -
PAD District 5February 2018 4,067.3 W W 21,288.8 WJanuary 2018 3,890.9 W W W WFebruary 2017 W W W W W
AlaskaFebruary 2018 - - - - -January 2018 - - - - -February 2017 - - - - -
ArizonaFebruary 2018 - W W W WJanuary 2018 - W W W WFebruary 2017 - W W W W
CaliforniaFebruary 2018 4,067.3 4,069.3 15,149.8 W WJanuary 2018 3,890.9 3,892.3 14,193.4 17,400.9 WFebruary 2017 W 4,234.1 15,244.7 17,572.5 W
HawaiiFebruary 2018 - - - - -January 2018 - - - - -February 2017 - - - - -
NevadaFebruary 2018 - - - - -January 2018 - - - - -February 2017 - - - - -
OregonFebruary 2018 - - - - -January 2018 - - - - -February 2017 - - - - -
WashingtonFebruary 2018 - - - - -January 2018 - - - - -February 2017 - - - - -
See footnotes at end of table.
U.S. Energy Information Administration�|�Petroleum Marketing Monthly76
May 2018

Table 40. Refi ner motor gasoline volumes by formula on, sales type, PAD District, and state (cont.)thousand gallons per day
Geographic area month
All formula ons
Sales to end users Sales for resale
Through retail outlets Total[a] DTW Rack Bulk
PAD District 4February 2018 W W W 12,319.3 WJanuary 2018 W W W 11,975.4 WFebruary 2017 W W W 12,052.7 W
ColoradoFebruary 2018 224.3 233.6 W 5,357.4 WJanuary 2018 221.0 225.9 W 5,151.7 WFebruary 2017 225.4 228.9 W W -
IdahoFebruary 2018 W W - 1,561.4 -January 2018 W W - 1,526.0 -February 2017 W W - 1,542.5 -
MontanaFebruary 2018 W W - 1,200.8 -January 2018 W W - 1,211.9 -February 2017 W W - 1,246.0 -
UtahFebruary 2018 W W W 3,205.4 WJanuary 2018 W W W 3,056.8 WFebruary 2017 W W W W W
WyomingFebruary 2018 W 11.0 - 994.3 -January 2018 W 11.4 - 1,028.9 -February 2017 W 14.4 - 874.2 -
PAD District 5February 2018 5,465.1 5,546.4 19,948.1 34,540.2 3,251.3January 2018 5,253.1 5,332.4 18,865.1 32,932.7 2,445.5February 2017 5,611.1 5,668.0 W 32,640.8 W
AlaskaFebruary 2018 W W 97.4 W WJanuary 2018 W W 93.1 W WFebruary 2017 W W 96.2 W W
ArizonaFebruary 2018 W W W 5,106.0 WJanuary 2018 W W W 4,692.9 WFebruary 2017 W W W 4,829.3 W
CaliforniaFebruary 2018 4,067.3 4,069.3 15,149.8 18,209.4 1,939.4January 2018 3,890.9 3,892.3 14,193.4 17,400.9 1,606.1February 2017 4,232.6 4,234.1 15,244.7 17,572.5 1,580.6
HawaiiFebruary 2018 W W W W WJanuary 2018 W W W W WFebruary 2017 W W W W W
NevadaFebruary 2018 W W W 1,838.5 WJanuary 2018 W W W 1,700.5 WFebruary 2017 W W W 1,584.6 W
OregonFebruary 2018 102.9 102.9 W 3,143.3 WJanuary 2018 105.7 105.7 886.4 3,106.4 270.0February 2017 110.1 110.1 927.8 2,621.9 259.3
WashingtonFebruary 2018 397.9 403.5 W 5,528.1 WJanuary 2018 392.9 398.1 W 5,340.9 WFebruary 2017 357.0 361.2 1,342.6 5,385.6 -
- = No data reported.NA = Not available.W = Withheld to avoid disclosure of individual company data.[a] Includes sales through retail outlets as well as all direct sales to end users that were not made through company-operated retail outlets, e.g., sales to agricultural customers, commercial sales, and industrial sales.Notes: - Beginning January 2007, oxygenated gasoline is included in conven onal gasoline. - Values shown for the current month are preliminary. Values shown for previous months are revised. Data through 2017 are fi nal. Totals may not equal the sum of the components due to rounding.Sources: - U.S. Energy Informa on Administra on Form EIA-782A, "Refi ners'/Gas Plant Operators, Monthly Petroleum Product Sales Report."
U.S. Energy Information Administration�|�Petroleum Marketing Monthly 77
May 2018
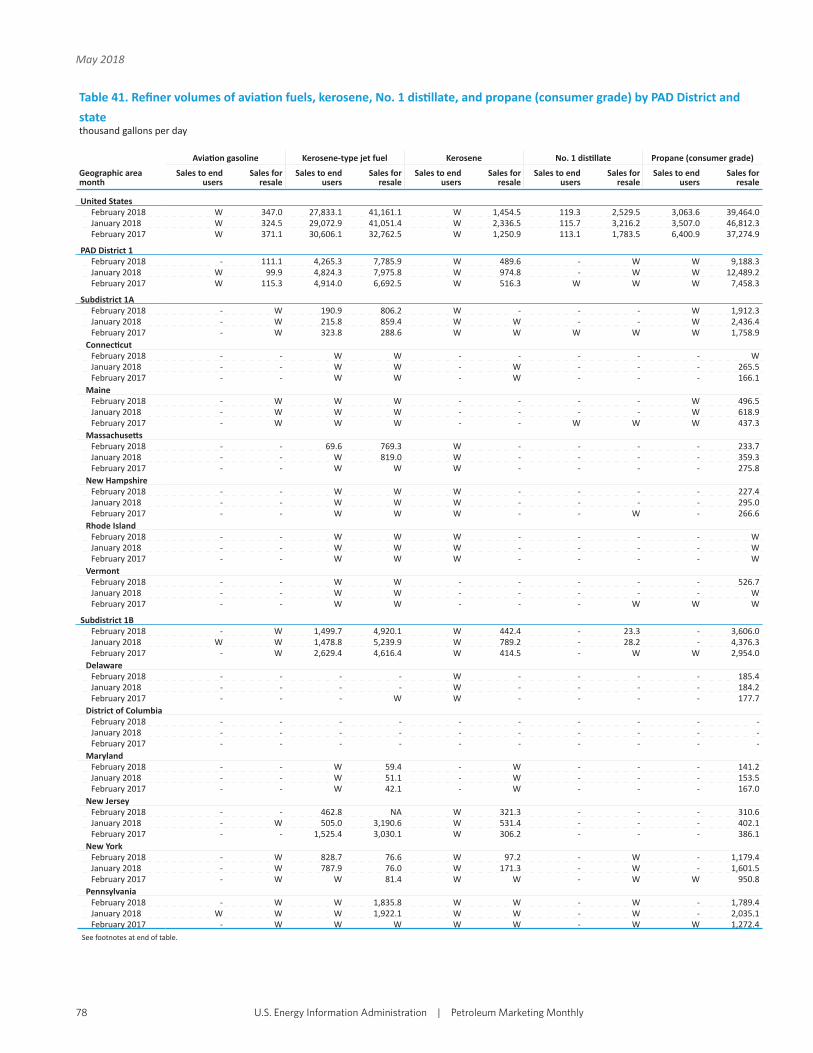
Table 41. Refi ner volumes of avia on fuels, kerosene, No. 1 dis llate, and propane (consumer grade) by PAD District and statethousand gallons per day
Geographic area month
Avia on gasoline Kerosene-type jet fuel Kerosene No. 1 dis llate Propane (consumer grade)
Sales to end users
Sales for resale
Sales to end users
Sales for resale
Sales to end users
Sales for resale
Sales to end users
Sales for resale
Sales to end users
Sales for resale
United StatesFebruary 2018 W 347.0 27,833.1 41,161.1 W 1,454.5 119.3 2,529.5 3,063.6 39,464.0January 2018 W 324.5 29,072.9 41,051.4 W 2,336.5 115.7 3,216.2 3,507.0 46,812.3February 2017 W 371.1 30,606.1 32,762.5 W 1,250.9 113.1 1,783.5 6,400.9 37,274.9
PAD District 1February 2018 - 111.1 4,265.3 7,785.9 W 489.6 - W W 9,188.3January 2018 W 99.9 4,824.3 7,975.8 W 974.8 - W W 12,489.2February 2017 W 115.3 4,914.0 6,692.5 W 516.3 W W W 7,458.3
Subdistrict 1AFebruary 2018 - W 190.9 806.2 W - - - W 1,912.3January 2018 - W 215.8 859.4 W W - - W 2,436.4February 2017 - W 323.8 288.6 W W W W W 1,758.9
Connec cutFebruary 2018 - - W W - - - - - WJanuary 2018 - - W W - W - - - 265.5February 2017 - - W W - W - - - 166.1
MaineFebruary 2018 - W W W - - - - W 496.5January 2018 - W W W - - - - W 618.9February 2017 - W W W - - W W W 437.3
Massachuse sFebruary 2018 - - 69.6 769.3 W - - - - 233.7January 2018 - - W 819.0 W - - - - 359.3February 2017 - - W W W - - - - 275.8
New HampshireFebruary 2018 - - W W W - - - - 227.4January 2018 - - W W W - - - - 295.0February 2017 - - W W W - - W - 266.6
Rhode IslandFebruary 2018 - - W W W - - - - WJanuary 2018 - - W W W - - - - WFebruary 2017 - - W W W - - - - W
VermontFebruary 2018 - - W W - - - - - 526.7January 2018 - - W W - - - - - WFebruary 2017 - - W W - - - W W W
Subdistrict 1BFebruary 2018 - W 1,499.7 4,920.1 W 442.4 - 23.3 - 3,606.0January 2018 W W 1,478.8 5,239.9 W 789.2 - 28.2 - 4,376.3February 2017 - W 2,629.4 4,616.4 W 414.5 - W W 2,954.0
DelawareFebruary 2018 - - - - W - - - - 185.4January 2018 - - - - W - - - - 184.2February 2017 - - - W W - - - - 177.7
District of ColumbiaFebruary 2018 - - - - - - - - - -January 2018 - - - - - - - - - -February 2017 - - - - - - - - - -
MarylandFebruary 2018 - - W 59.4 - W - - - 141.2January 2018 - - W 51.1 - W - - - 153.5February 2017 - - W 42.1 - W - - - 167.0
New JerseyFebruary 2018 - - 462.8 NA W 321.3 - - - 310.6January 2018 - W 505.0 3,190.6 W 531.4 - - - 402.1February 2017 - - 1,525.4 3,030.1 W 306.2 - - - 386.1
New YorkFebruary 2018 - W 828.7 76.6 W 97.2 - W - 1,179.4January 2018 - W 787.9 76.0 W 171.3 - W - 1,601.5February 2017 - W W 81.4 W W - W W 950.8
PennsylvaniaFebruary 2018 - W W 1,835.8 W W - W - 1,789.4January 2018 W W W 1,922.1 W W - W - 2,035.1February 2017 - W W W W W - W W 1,272.4
See footnotes at end of table.
U.S. Energy Information Administration�|�Petroleum Marketing Monthly78
May 2018
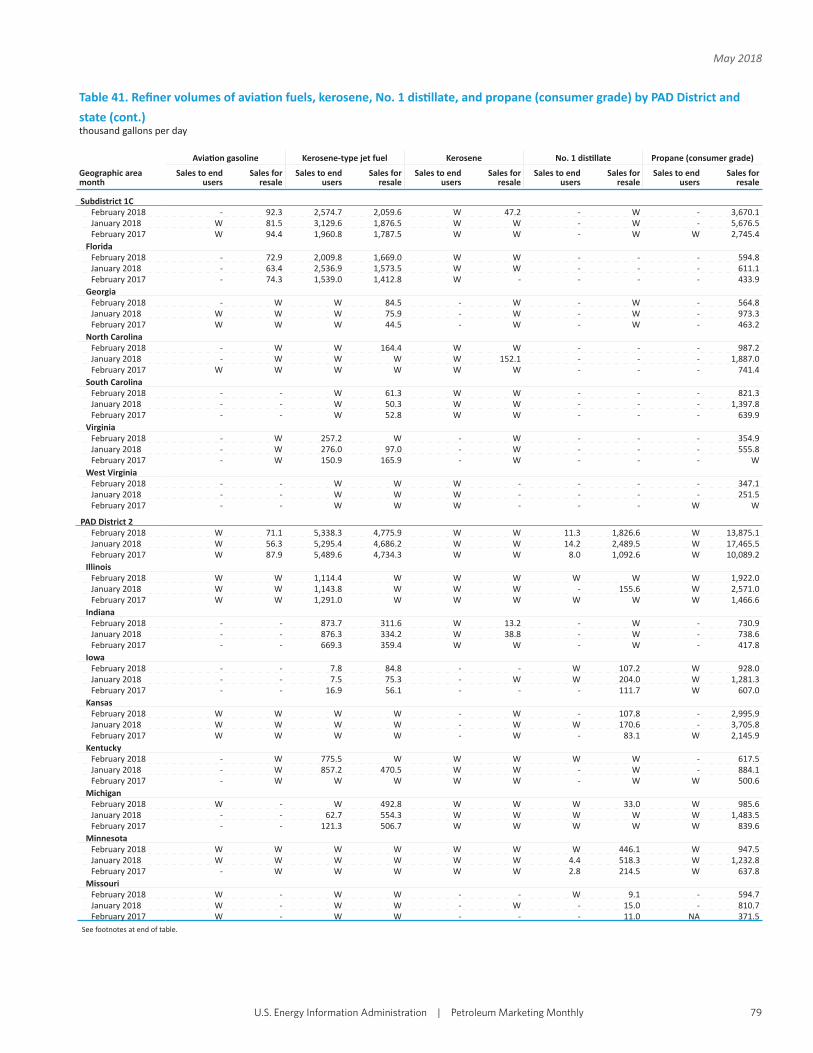
Table 41. Refi ner volumes of avia on fuels, kerosene, No. 1 dis llate, and propane (consumer grade) by PAD District and state (cont.)thousand gallons per day
Geographic area month
Avia on gasoline Kerosene-type jet fuel Kerosene No. 1 dis llate Propane (consumer grade)
Sales to end users
Sales for resale
Sales to end users
Sales for resale
Sales to end users
Sales for resale
Sales to end users
Sales for resale
Sales to end users
Sales for resale
Subdistrict 1CFebruary 2018 - 92.3 2,574.7 2,059.6 W 47.2 - W - 3,670.1January 2018 W 81.5 3,129.6 1,876.5 W W - W - 5,676.5February 2017 W 94.4 1,960.8 1,787.5 W W - W W 2,745.4
FloridaFebruary 2018 - 72.9 2,009.8 1,669.0 W W - - - 594.8January 2018 - 63.4 2,536.9 1,573.5 W W - - - 611.1February 2017 - 74.3 1,539.0 1,412.8 W - - - - 433.9
GeorgiaFebruary 2018 - W W 84.5 - W - W - 564.8January 2018 W W W 75.9 - W - W - 973.3February 2017 W W W 44.5 - W - W - 463.2
North CarolinaFebruary 2018 - W W 164.4 W W - - - 987.2January 2018 - W W W W 152.1 - - - 1,887.0February 2017 W W W W W W - - - 741.4
South CarolinaFebruary 2018 - - W 61.3 W W - - - 821.3January 2018 - - W 50.3 W W - - - 1,397.8February 2017 - - W 52.8 W W - - - 639.9
VirginiaFebruary 2018 - W 257.2 W - W - - - 354.9January 2018 - W 276.0 97.0 - W - - - 555.8February 2017 - W 150.9 165.9 - W - - - W
West VirginiaFebruary 2018 - - W W W - - - - 347.1January 2018 - - W W W - - - - 251.5February 2017 - - W W W - - - W W
PAD District 2February 2018 W 71.1 5,338.3 4,775.9 W W 11.3 1,826.6 W 13,875.1January 2018 W 56.3 5,295.4 4,686.2 W W 14.2 2,489.5 W 17,465.5February 2017 W 87.9 5,489.6 4,734.3 W W 8.0 1,092.6 W 10,089.2
IllinoisFebruary 2018 W W 1,114.4 W W W W W W 1,922.0January 2018 W W 1,143.8 W W W - 155.6 W 2,571.0February 2017 W W 1,291.0 W W W W W W 1,466.6
IndianaFebruary 2018 - - 873.7 311.6 W 13.2 - W - 730.9January 2018 - - 876.3 334.2 W 38.8 - W - 738.6February 2017 - - 669.3 359.4 W W - W - 417.8
IowaFebruary 2018 - - 7.8 84.8 - - W 107.2 W 928.0January 2018 - - 7.5 75.3 - W W 204.0 W 1,281.3February 2017 - - 16.9 56.1 - - - 111.7 W 607.0
KansasFebruary 2018 W W W W - W - 107.8 - 2,995.9January 2018 W W W W - W W 170.6 - 3,705.8February 2017 W W W W - W - 83.1 W 2,145.9
KentuckyFebruary 2018 - W 775.5 W W W W W - 617.5January 2018 - W 857.2 470.5 W W - W - 884.1February 2017 - W W W W W - W W 500.6
MichiganFebruary 2018 W - W 492.8 W W W 33.0 W 985.6January 2018 - - 62.7 554.3 W W W W W 1,483.5February 2017 - - 121.3 506.7 W W W W W 839.6
MinnesotaFebruary 2018 W W W W W W W 446.1 W 947.5January 2018 W W W W W W 4.4 518.3 W 1,232.8February 2017 - W W W W W 2.8 214.5 W 637.8
MissouriFebruary 2018 W - W W - - W 9.1 - 594.7January 2018 W - W W - W - 15.0 - 810.7February 2017 W - W W - - - 11.0 NA 371.5
See footnotes at end of table.
U.S. Energy Information Administration�|�Petroleum Marketing Monthly 79
May 2018

Table 41. Refi ner volumes of avia on fuels, kerosene, No. 1 dis llate, and propane (consumer grade) by PAD District and state (cont.)thousand gallons per day
Geographic area month
Avia on gasoline Kerosene-type jet fuel Kerosene No. 1 dis llate Propane (consumer grade)
Sales to end users
Sales for resale
Sales to end users
Sales for resale
Sales to end users
Sales for resale
Sales to end users
Sales for resale
Sales to end users
Sales for resale
PAD District 2 (cont.)Nebraska
February 2018 W - W W - - W 84.4 - 417.6January 2018 W - W W - - W 134.5 - 503.4February 2017 W - W W - - - 77.0 W 266.6
North DakotaFebruary 2018 - - W W - - W 531.9 W 656.4January 2018 - - W W - W W 525.2 W 677.0February 2017 - - W W - W W 358.1 W 430.4
OhioFebruary 2018 - W 441.0 459.2 W W - W - 892.1January 2018 - W 446.3 409.4 W W - W - 1,041.0February 2017 - - 476.5 604.1 W W - W W 931.3
OklahomaFebruary 2018 W - W 260.7 - W - W W 407.8January 2018 W - W NA - W - 109.1 W 460.5February 2017 W - W 491.0 - W - W W 199.9
South DakotaFebruary 2018 - - W - - - NA 90.7 W WJanuary 2018 - - W - - - W 103.3 W 331.4February 2017 - - W - W - W 73.3 W 189.4
TennesseeFebruary 2018 - W W 139.7 W W - W - WJanuary 2018 W W W 128.9 W W - W - 300.3February 2017 - W W 124.9 W W - - - 181.4
WisconsinFebruary 2018 - - W W W W W 231.8 W 1,278.6January 2018 - - W W W W W 324.5 W 1,444.2February 2017 - - W W W W 0.5 W W 903.4
PAD District 3February 2018 W 103.4 5,083.4 19,876.8 - 838.8 - W 2,656.1 13,075.8January 2018 W 106.2 6,141.5 18,704.8 - 1,025.5 - W 3,085.1 13,232.5February 2017 W 112.7 7,198.5 12,525.3 - 576.9 - W 6,060.2 16,329.4
AlabamaFebruary 2018 - - 159.7 74.4 - W - - - 361.4January 2018 - - 352.1 68.9 - W - - - 684.7February 2017 - W 232.6 58.7 - W - - - 241.7
ArkansasFebruary 2018 W - W W - - - - - 60.0January 2018 W - W W - W - - - 80.3February 2017 - - W W - - - - - W
LouisianaFebruary 2018 - W 746.9 4,902.4 - W - W W 234.9January 2018 - - 921.2 6,566.6 - W - W 742.0 196.6February 2017 - 6.0 1,388.6 5,196.3 - W - W W 124.3
MississippiFebruary 2018 - W 963.7 2,254.6 - W - - - 409.7January 2018 - W W 1,792.5 - W - - - 762.4February 2017 - W 691.4 2,065.4 - W - - - 233.3
New MexicoFebruary 2018 W - W W - - - - - 103.2January 2018 W - W W - - - W - 111.8February 2017 W - W W - - - - W W
TexasFebruary 2018 W W 3,150.8 12,521.5 - W - - W 11,906.6January 2018 W W 3,901.6 10,183.6 - W - - 2,343.1 11,396.7February 2017 W W 4,818.5 5,112.8 - W - - 5,349.1 15,635.6
See footnotes at end of table.
U.S. Energy Information Administration�|�Petroleum Marketing Monthly80
May 2018

Table 41. Refi ner volumes of avia on fuels, kerosene, No. 1 dis llate, and propane (consumer grade) by PAD District and state (cont.)thousand gallons per day
Geographic area month
Avia on gasoline Kerosene-type jet fuel Kerosene No. 1 dis llate Propane (consumer grade)
Sales to end users
Sales for resale
Sales to end users
Sales for resale
Sales to end users
Sales for resale
Sales to end users
Sales for resale
Sales to end users
Sales for resale
PAD District 4February 2018 W W 934.3 1,368.3 - - W 389.9 W 1,114.8January 2018 W W 950.0 1,088.9 W - W 412.9 W 1,259.5February 2017 W W 803.0 863.6 - - 7.4 281.7 W 1,094.9
ColoradoFebruary 2018 W - 319.9 962.2 - - - 136.9 W 360.6January 2018 W - 296.1 NA - - - 150.3 W 401.8February 2017 W - 364.6 535.5 - - - 83.6 W 365.0
IdahoFebruary 2018 - - W W - - W W W 58.6January 2018 - - W W W - W 17.3 W 65.9February 2017 - - W 23.6 - - W 20.4 W 45.6
MontanaFebruary 2018 W W W W - - W 113.2 W 180.6January 2018 - W W W - - W 110.7 W 225.8February 2017 - W W W - - W 69.6 W 196.9
UtahFebruary 2018 W W 405.7 312.1 - - W W - 167.5January 2018 W W 432.3 274.7 - - W 39.0 - 156.6February 2017 W W 294.8 233.5 - - W 36.0 - 130.3
WyomingFebruary 2018 - - W W - - W 100.3 - 347.6January 2018 - - W W - - W 95.7 - 409.3February 2017 - - W W - - W 72.1 W 357.1
PAD District 5February 2018 W W 12,211.9 7,354.2 NA W W 289.4 W 2,210.0January 2018 W W 11,861.7 8,595.7 NA W W 282.9 W 2,365.7February 2017 W W 12,200.9 7,946.9 W W W 364.3 W 2,303.0
AlaskaFebruary 2018 W W W W - - W W W WJanuary 2018 W W W W - - W W W WFebruary 2017 W W W W - - W W W W
ArizonaFebruary 2018 W W 167.9 234.2 - - - - - 243.0January 2018 W W 136.3 248.2 - - - - - 215.8February 2017 W W 199.3 235.0 - - - - - 272.0
CaliforniaFebruary 2018 - 24.1 7,359.5 5,667.2 - W - - - 1,270.9January 2018 - 28.9 7,032.1 6,800.9 - W - - - 1,380.7February 2017 - 26.0 6,877.8 6,715.3 - W - - W 1,214.5
HawaiiFebruary 2018 - W W W - - - - - WJanuary 2018 - W W W - - - - - WFebruary 2017 - W W W - - - - - W
NevadaFebruary 2018 - - W W - - W - - WJanuary 2018 - - W W - - W - - 102.3February 2017 - - W W - - - - - 83.6
OregonFebruary 2018 - W W W - - - NA W WJanuary 2018 - 7.6 W 55.6 - - - NA W WFebruary 2017 - 7.2 309.6 37.0 - - - W W 75.7
WashingtonFebruary 2018 - W 1,915.3 184.4 NA - W W W 525.8January 2018 - W 1,705.9 268.7 NA - W W W 542.8February 2017 - W 2,157.6 141.9 W - W W W 611.5
- = No data reported.NA = Not available.W = Withheld to avoid disclosure of individual company data.Notes: - Values shown for the current month are preliminary. Values shown for previous months are revised. Data through 2017 are fi nal. Totals may not equal the sum of the components due to rounding.Sources: - U.S. Energy Informa on Administra on Form EIA-782A, "Refi ners’/Gas Plant Operators, Monthly Petroleum Product Sales Report."
U.S. Energy Information Administration�|�Petroleum Marketing Monthly 81
May 2018
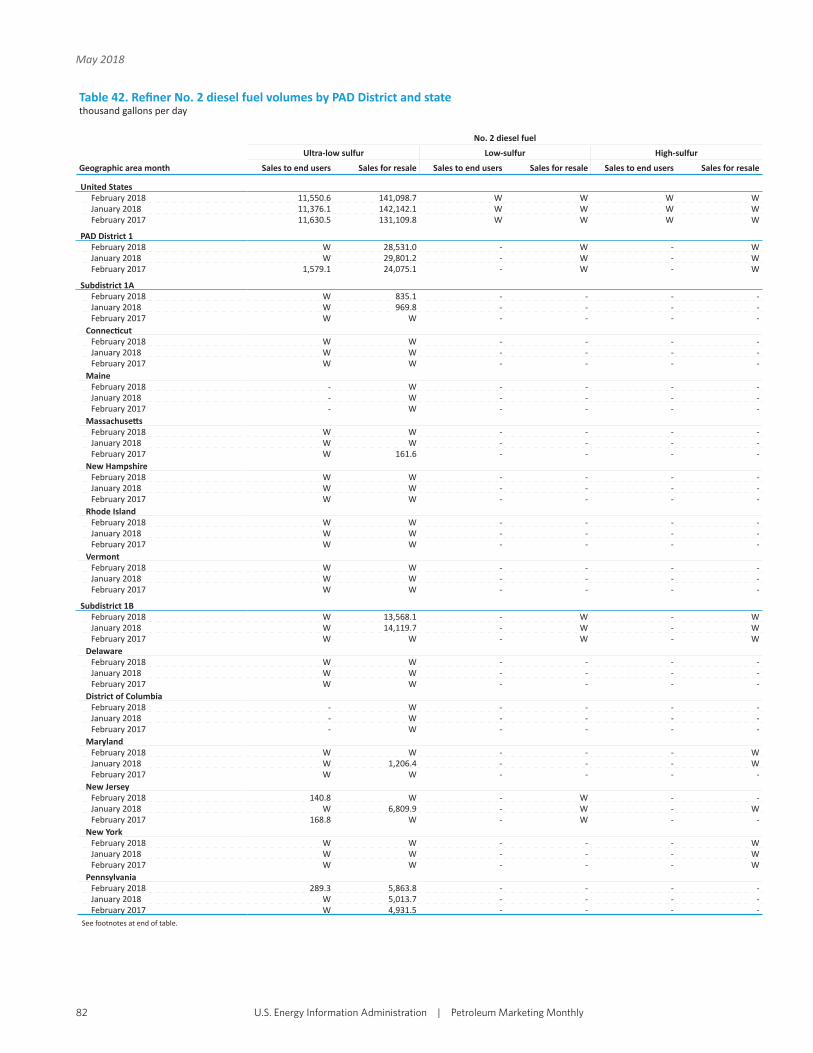
Table 42. Refi ner No. 2 diesel fuel volumes by PAD District and statethousand gallons per day
Geographic area month
No. 2 diesel fuel
Ultra-low sulfur Low-sulfur High-sulfur
Sales to end users Sales for resale Sales to end users Sales for resale Sales to end users Sales for resale
United StatesFebruary 2018 11,550.6 141,098.7 W W W WJanuary 2018 11,376.1 142,142.1 W W W WFebruary 2017 11,630.5 131,109.8 W W W W
PAD District 1February 2018 W 28,531.0 - W - WJanuary 2018 W 29,801.2 - W - WFebruary 2017 1,579.1 24,075.1 - W - W
Subdistrict 1AFebruary 2018 W 835.1 - - - -January 2018 W 969.8 - - - -February 2017 W W - - - -
Connec cutFebruary 2018 W W - - - -January 2018 W W - - - -February 2017 W W - - - -
MaineFebruary 2018 - W - - - -January 2018 - W - - - -February 2017 - W - - - -
Massachuse sFebruary 2018 W W - - - -January 2018 W W - - - -February 2017 W 161.6 - - - -
New HampshireFebruary 2018 W W - - - -January 2018 W W - - - -February 2017 W W - - - -
Rhode IslandFebruary 2018 W W - - - -January 2018 W W - - - -February 2017 W W - - - -
VermontFebruary 2018 W W - - - -January 2018 W W - - - -February 2017 W W - - - -
Subdistrict 1BFebruary 2018 W 13,568.1 - W - WJanuary 2018 W 14,119.7 - W - WFebruary 2017 W W - W - W
DelawareFebruary 2018 W W - - - -January 2018 W W - - - -February 2017 W W - - - -
District of ColumbiaFebruary 2018 - W - - - -January 2018 - W - - - -February 2017 - W - - - -
MarylandFebruary 2018 W W - - - WJanuary 2018 W 1,206.4 - - - WFebruary 2017 W W - - - -
New JerseyFebruary 2018 140.8 W - W - -January 2018 W 6,809.9 - W - WFebruary 2017 168.8 W - W - -
New YorkFebruary 2018 W W - - - WJanuary 2018 W W - - - WFebruary 2017 W W - - - W
PennsylvaniaFebruary 2018 289.3 5,863.8 - - - -January 2018 W 5,013.7 - - - -February 2017 W 4,931.5 - - - -
See footnotes at end of table.
U.S. Energy Information Administration�|�Petroleum Marketing Monthly82
May 2018

Table 42. Refi ner No. 2 diesel fuel volumes by PAD District and state (cont.)thousand gallons per day
Geographic area month
No. 2 diesel fuel
Ultra-low sulfur Low-sulfur High-sulfur
Sales to end users Sales for resale Sales to end users Sales for resale Sales to end users Sales for resale
Subdistrict 1CFebruary 2018 W 14,127.8 - - - -January 2018 W 14,711.7 - - - -February 2017 962.1 W - - - -
FloridaFebruary 2018 W W - - - -January 2018 W 4,548.1 - - - -February 2017 400.9 4,545.1 - - - -
GeorgiaFebruary 2018 86.0 2,449.1 - - - -January 2018 78.5 2,615.1 - - - -February 2017 63.6 2,343.5 - - - -
North CarolinaFebruary 2018 272.2 W - - - -January 2018 258.4 W - - - -February 2017 306.8 W - - - -
South CarolinaFebruary 2018 W W - - - -January 2018 W 1,389.4 - - - -February 2017 W 1,199.0 - - - -
VirginiaFebruary 2018 6.7 W - - - -January 2018 6.6 W - - - -February 2017 15.8 2,311.7 - - - -
West VirginiaFebruary 2018 W W - - - -January 2018 W W - - - -February 2017 W W - - - -
PAD District 2February 2018 W W - - - -January 2018 W W - - - -February 2017 W W - - - -
IllinoisFebruary 2018 W 6,700.4 - - - -January 2018 W 6,454.4 - - - -February 2017 W 5,821.6 - - - -
IndianaFebruary 2018 W 3,790.5 - - - -January 2018 W 3,404.0 - - - -February 2017 W 3,484.4 - - - -
IowaFebruary 2018 29.6 1,756.8 - - - -January 2018 27.0 1,709.4 - - - -February 2017 15.5 1,817.8 - - - -
KansasFebruary 2018 529.8 2,649.7 - - - -January 2018 W 2,405.4 - - - -February 2017 575.6 3,122.0 - - - -
KentuckyFebruary 2018 W 1,844.2 - - - -January 2018 W 1,865.6 - - - -February 2017 W 1,861.5 - - - -
MichiganFebruary 2018 W W - - - -January 2018 W W - - - -February 2017 W W - - - -
MinnesotaFebruary 2018 W W - - - -January 2018 W W - - - -February 2017 W 2,109.7 - - - -
MissouriFebruary 2018 1.9 1,463.3 - - - -January 2018 W 1,498.4 - - - -February 2017 W 1,374.9 - - - -
See footnotes at end of table.
U.S. Energy Information Administration�|�Petroleum Marketing Monthly 83
May 2018

Table 42. Refi ner No. 2 diesel fuel volumes by PAD District and state (cont.)thousand gallons per day
Geographic area month
No. 2 diesel fuel
Ultra-low sulfur Low-sulfur High-sulfur
Sales to end users Sales for resale Sales to end users Sales for resale Sales to end users Sales for resale
PAD District 2 (cont.)Nebraska
February 2018 W 1,260.8 - - - -January 2018 W 1,063.2 - - - -February 2017 W 1,187.8 - - - -
North DakotaFebruary 2018 W 1,166.4 - - - -January 2018 W 910.6 - - - -February 2017 W 1,080.4 - - - -
OhioFebruary 2018 W 4,987.7 - - - -January 2018 W 4,886.8 - - - -February 2017 810.6 4,727.5 - - - -
OklahomaFebruary 2018 444.1 5,906.8 - - - -January 2018 371.7 5,840.2 - - - -February 2017 159.9 4,689.6 - - - -
South DakotaFebruary 2018 W 464.2 - - - -January 2018 W 372.7 - - - -February 2017 W 427.9 - - - -
TennesseeFebruary 2018 289.4 2,891.8 - - - -January 2018 301.8 2,872.8 - - - -February 2017 279.4 2,943.2 - - - -
WisconsinFebruary 2018 W W - - - -January 2018 W W - - - -February 2017 W 1,896.7 - - - -
PAD District 3February 2018 W 47,477.4 W W - WJanuary 2018 W 48,830.7 W W - WFebruary 2017 W 45,440.2 W W - 761.0
AlabamaFebruary 2018 161.3 1,430.6 - - - -January 2018 162.5 1,478.1 - - - -February 2017 147.8 1,518.1 - - - -
ArkansasFebruary 2018 W 1,390.0 - - - -January 2018 W 1,527.2 - - - -February 2017 W 1,551.0 - - - -
LouisianaFebruary 2018 163.5 W - W - 438.1January 2018 166.8 10,120.8 - W - WFebruary 2017 153.4 W - W - W
MississippiFebruary 2018 33.1 W - - - -January 2018 48.7 2,223.5 - W - -February 2017 81.3 W - - - -
New MexicoFebruary 2018 336.0 1,282.6 - - - -January 2018 349.4 1,026.9 - - - -February 2017 308.7 1,203.5 - - - -
TexasFebruary 2018 1,763.7 30,709.0 W W - WJanuary 2018 1,672.5 32,454.3 W W - WFebruary 2017 1,802.8 30,754.8 W W - W
See footnotes at end of table.
U.S. Energy Information Administration�|�Petroleum Marketing Monthly84
May 2018
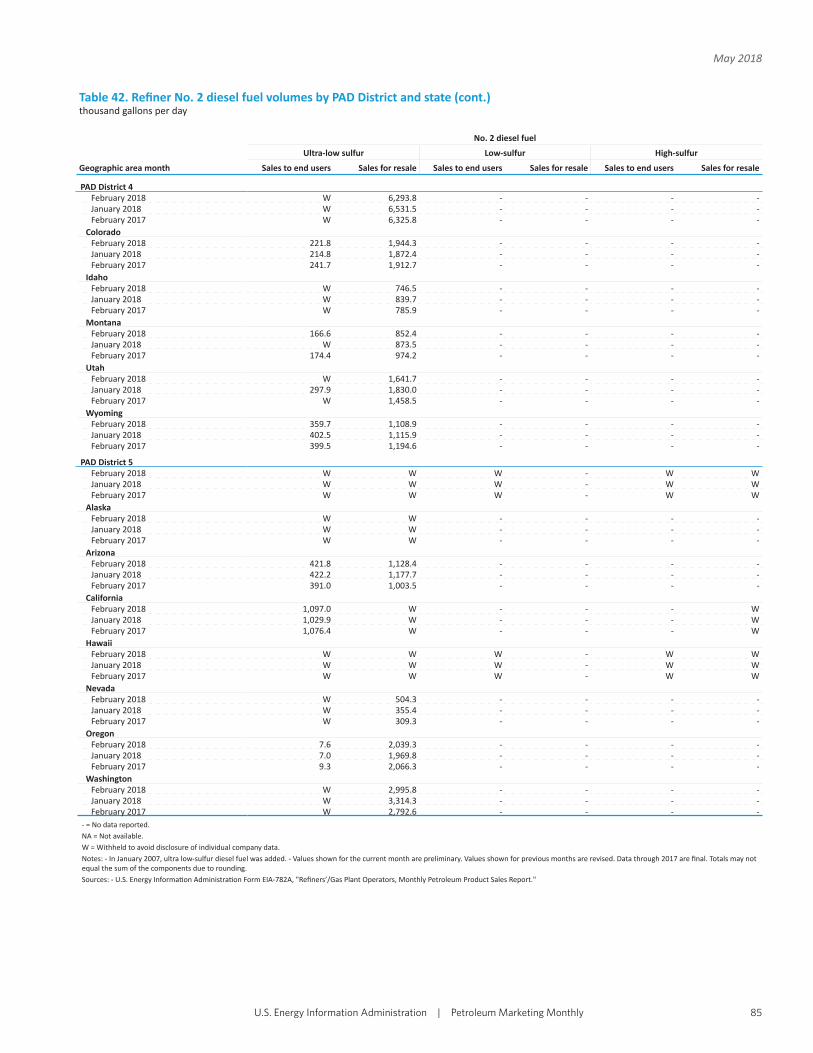
Table 42. Refi ner No. 2 diesel fuel volumes by PAD District and state (cont.)thousand gallons per day
Geographic area month
No. 2 diesel fuel
Ultra-low sulfur Low-sulfur High-sulfur
Sales to end users Sales for resale Sales to end users Sales for resale Sales to end users Sales for resale
PAD District 4February 2018 W 6,293.8 - - - -January 2018 W 6,531.5 - - - -February 2017 W 6,325.8 - - - -
ColoradoFebruary 2018 221.8 1,944.3 - - - -January 2018 214.8 1,872.4 - - - -February 2017 241.7 1,912.7 - - - -
IdahoFebruary 2018 W 746.5 - - - -January 2018 W 839.7 - - - -February 2017 W 785.9 - - - -
MontanaFebruary 2018 166.6 852.4 - - - -January 2018 W 873.5 - - - -February 2017 174.4 974.2 - - - -
UtahFebruary 2018 W 1,641.7 - - - -January 2018 297.9 1,830.0 - - - -February 2017 W 1,458.5 - - - -
WyomingFebruary 2018 359.7 1,108.9 - - - -January 2018 402.5 1,115.9 - - - -February 2017 399.5 1,194.6 - - - -
PAD District 5February 2018 W W W - W WJanuary 2018 W W W - W WFebruary 2017 W W W - W W
AlaskaFebruary 2018 W W - - - -January 2018 W W - - - -February 2017 W W - - - -
ArizonaFebruary 2018 421.8 1,128.4 - - - -January 2018 422.2 1,177.7 - - - -February 2017 391.0 1,003.5 - - - -
CaliforniaFebruary 2018 1,097.0 W - - - WJanuary 2018 1,029.9 W - - - WFebruary 2017 1,076.4 W - - - W
HawaiiFebruary 2018 W W W - W WJanuary 2018 W W W - W WFebruary 2017 W W W - W W
NevadaFebruary 2018 W 504.3 - - - -January 2018 W 355.4 - - - -February 2017 W 309.3 - - - -
OregonFebruary 2018 7.6 2,039.3 - - - -January 2018 7.0 1,969.8 - - - -February 2017 9.3 2,066.3 - - - -
WashingtonFebruary 2018 W 2,995.8 - - - -January 2018 W 3,314.3 - - - -February 2017 W 2,792.6 - - - -
- = No data reported.NA = Not available.W = Withheld to avoid disclosure of individual company data.Notes: - In January 2007, ultra low-sulfur diesel fuel was added. - Values shown for the current month are preliminary. Values shown for previous months are revised. Data through 2017 are fi nal. Totals may not equal the sum of the components due to rounding.Sources: - U.S. Energy Informa on Administra on Form EIA-782A, "Refi ners’/Gas Plant Operators, Monthly Petroleum Product Sales Report."
U.S. Energy Information Administration�|�Petroleum Marketing Monthly 85
May 2018

Table 43. Refi ner No. 2 dis llate and fuel oil volumes by PAD District and statethousand gallons per day
Geographic area month
No. 2 fuel oil No. 2 dis llate
Sales to end users Sales for resale Sales to end users Sales for resale
United StatesFebruary 2018 123.5 11,980.0 11,969.6 156,518.1January 2018 266.3 17,541.2 11,950.5 163,388.6February 2017 107.1 11,304.0 12,081.9 145,643.1
PAD District 1February 2018 W 8,061.5 1,464.8 36,717.8January 2018 W 12,171.7 1,607.6 42,452.9February 2017 11.0 7,433.0 1,590.1 31,616.1
Subdistrict 1AFebruary 2018 - 955.1 W 1,790.1January 2018 - 1,361.2 W 2,331.0February 2017 W W 34.2 1,987.2
Connec cutFebruary 2018 - W W 322.6January 2018 - W W 280.8February 2017 - W W 597.6
MaineFebruary 2018 - W - WJanuary 2018 - W - WFebruary 2017 W W W 127.5
Massachuse sFebruary 2018 - W W 599.2January 2018 - W W 860.5February 2017 - - W 161.6
New HampshireFebruary 2018 - W W WJanuary 2018 - W W WFebruary 2017 - W W W
Rhode IslandFebruary 2018 - W W 256.7January 2018 - W W 461.7February 2017 - W W W
VermontFebruary 2018 - W W WJanuary 2018 - W W WFebruary 2017 - W W W
Subdistrict 1BFebruary 2018 W 6,653.6 W 20,347.0January 2018 W 10,613.3 796.5 25,213.1February 2017 W 6,061.9 593.9 15,944.8
DelawareFebruary 2018 - W W WJanuary 2018 - W W WFebruary 2017 - W W W
District of ColumbiaFebruary 2018 - - - WJanuary 2018 - - - WFebruary 2017 - - - W
MarylandFebruary 2018 W W W 1,579.7January 2018 W W W 1,611.1February 2017 W W W 1,294.8
New JerseyFebruary 2018 - 3,861.5 140.8 9,301.1January 2018 W 6,332.9 244.3 13,583.5February 2017 - 3,111.6 168.8 6,163.7
New YorkFebruary 2018 W 1,277.7 155.6 2,373.1January 2018 W 1,677.7 160.1 2,567.7February 2017 W 1,263.3 162.1 2,069.6
PennsylvaniaFebruary 2018 - 889.7 289.3 6,753.5January 2018 W 2,009.7 291.0 7,023.4February 2017 W 1,319.3 258.7 6,250.8
See footnotes at end of table.
U.S. Energy Information Administration�|�Petroleum Marketing Monthly86
May 2018
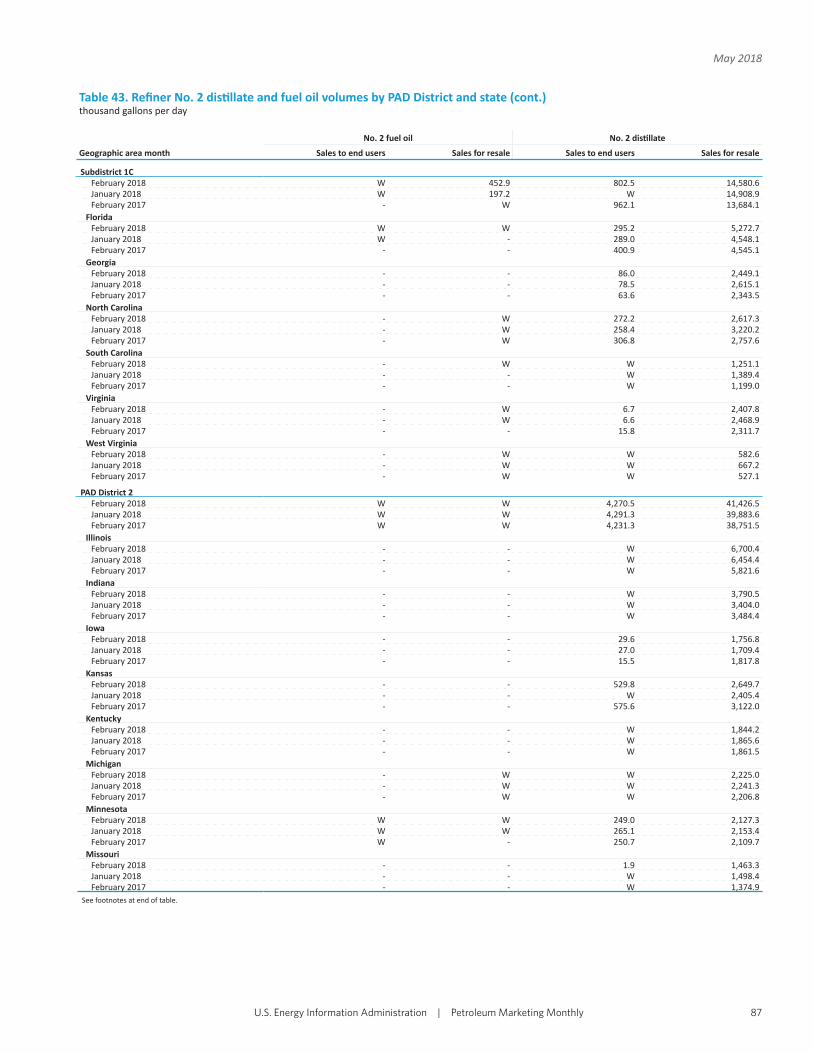
Table 43. Refi ner No. 2 dis llate and fuel oil volumes by PAD District and state (cont.)thousand gallons per day
Geographic area month
No. 2 fuel oil No. 2 dis llate
Sales to end users Sales for resale Sales to end users Sales for resale
Subdistrict 1CFebruary 2018 W 452.9 802.5 14,580.6January 2018 W 197.2 W 14,908.9February 2017 - W 962.1 13,684.1
FloridaFebruary 2018 W W 295.2 5,272.7January 2018 W - 289.0 4,548.1February 2017 - - 400.9 4,545.1
GeorgiaFebruary 2018 - - 86.0 2,449.1January 2018 - - 78.5 2,615.1February 2017 - - 63.6 2,343.5
North CarolinaFebruary 2018 - W 272.2 2,617.3January 2018 - W 258.4 3,220.2February 2017 - W 306.8 2,757.6
South CarolinaFebruary 2018 - W W 1,251.1January 2018 - - W 1,389.4February 2017 - - W 1,199.0
VirginiaFebruary 2018 - W 6.7 2,407.8January 2018 - W 6.6 2,468.9February 2017 - - 15.8 2,311.7
West VirginiaFebruary 2018 - W W 582.6January 2018 - W W 667.2February 2017 - W W 527.1
PAD District 2February 2018 W W 4,270.5 41,426.5January 2018 W W 4,291.3 39,883.6February 2017 W W 4,231.3 38,751.5
IllinoisFebruary 2018 - - W 6,700.4January 2018 - - W 6,454.4February 2017 - - W 5,821.6
IndianaFebruary 2018 - - W 3,790.5January 2018 - - W 3,404.0February 2017 - - W 3,484.4
IowaFebruary 2018 - - 29.6 1,756.8January 2018 - - 27.0 1,709.4February 2017 - - 15.5 1,817.8
KansasFebruary 2018 - - 529.8 2,649.7January 2018 - - W 2,405.4February 2017 - - 575.6 3,122.0
KentuckyFebruary 2018 - - W 1,844.2January 2018 - - W 1,865.6February 2017 - - W 1,861.5
MichiganFebruary 2018 - W W 2,225.0January 2018 - W W 2,241.3February 2017 - W W 2,206.8
MinnesotaFebruary 2018 W W 249.0 2,127.3January 2018 W W 265.1 2,153.4February 2017 W - 250.7 2,109.7
MissouriFebruary 2018 - - 1.9 1,463.3January 2018 - - W 1,498.4February 2017 - - W 1,374.9
See footnotes at end of table.
U.S. Energy Information Administration�|�Petroleum Marketing Monthly 87
May 2018
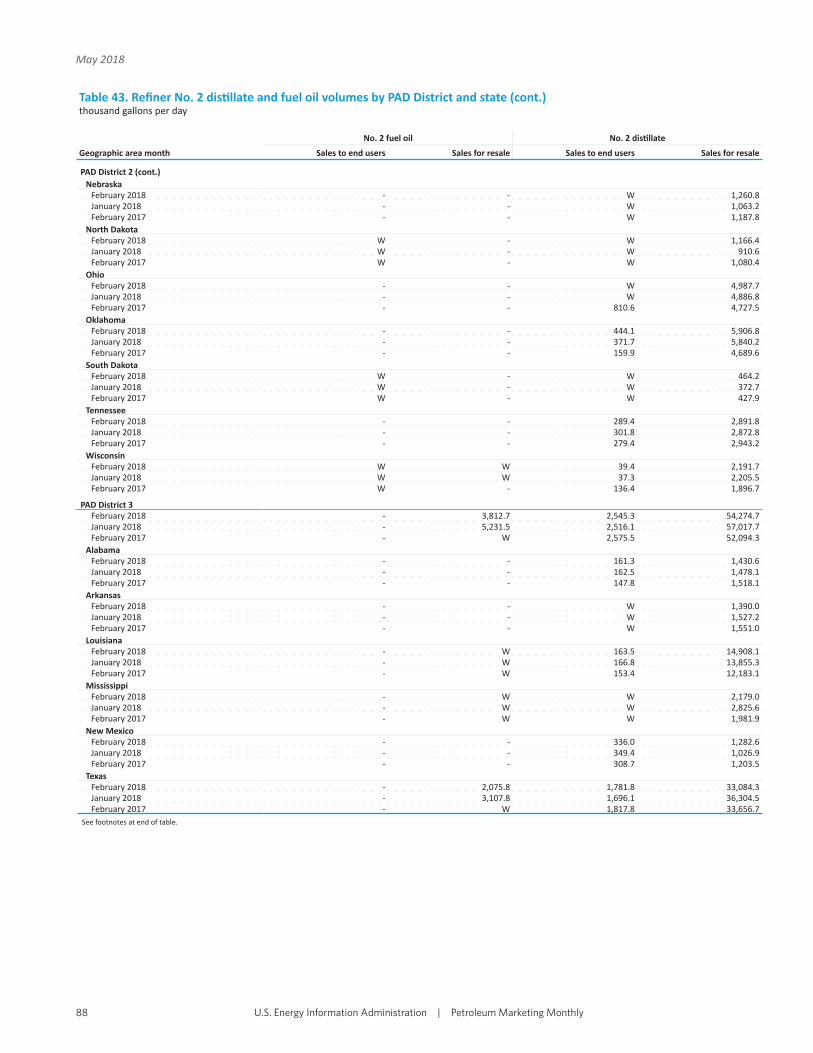
Table 43. Refi ner No. 2 dis llate and fuel oil volumes by PAD District and state (cont.)thousand gallons per day
Geographic area month
No. 2 fuel oil No. 2 dis llate
Sales to end users Sales for resale Sales to end users Sales for resale
PAD District 2 (cont.)Nebraska
February 2018 - - W 1,260.8January 2018 - - W 1,063.2February 2017 - - W 1,187.8
North DakotaFebruary 2018 W - W 1,166.4January 2018 W - W 910.6February 2017 W - W 1,080.4
OhioFebruary 2018 - - W 4,987.7January 2018 - - W 4,886.8February 2017 - - 810.6 4,727.5
OklahomaFebruary 2018 - - 444.1 5,906.8January 2018 - - 371.7 5,840.2February 2017 - - 159.9 4,689.6
South DakotaFebruary 2018 W - W 464.2January 2018 W - W 372.7February 2017 W - W 427.9
TennesseeFebruary 2018 - - 289.4 2,891.8January 2018 - - 301.8 2,872.8February 2017 - - 279.4 2,943.2
WisconsinFebruary 2018 W W 39.4 2,191.7January 2018 W W 37.3 2,205.5February 2017 W - 136.4 1,896.7
PAD District 3February 2018 - 3,812.7 2,545.3 54,274.7January 2018 - 5,231.5 2,516.1 57,017.7February 2017 - W 2,575.5 52,094.3
AlabamaFebruary 2018 - - 161.3 1,430.6January 2018 - - 162.5 1,478.1February 2017 - - 147.8 1,518.1
ArkansasFebruary 2018 - - W 1,390.0January 2018 - - W 1,527.2February 2017 - - W 1,551.0
LouisianaFebruary 2018 - W 163.5 14,908.1January 2018 - W 166.8 13,855.3February 2017 - W 153.4 12,183.1
MississippiFebruary 2018 - W W 2,179.0January 2018 - W W 2,825.6February 2017 - W W 1,981.9
New MexicoFebruary 2018 - - 336.0 1,282.6January 2018 - - 349.4 1,026.9February 2017 - - 308.7 1,203.5
TexasFebruary 2018 - 2,075.8 1,781.8 33,084.3January 2018 - 3,107.8 1,696.1 36,304.5February 2017 - W 1,817.8 33,656.7
See footnotes at end of table.
U.S. Energy Information Administration�|�Petroleum Marketing Monthly88
May 2018
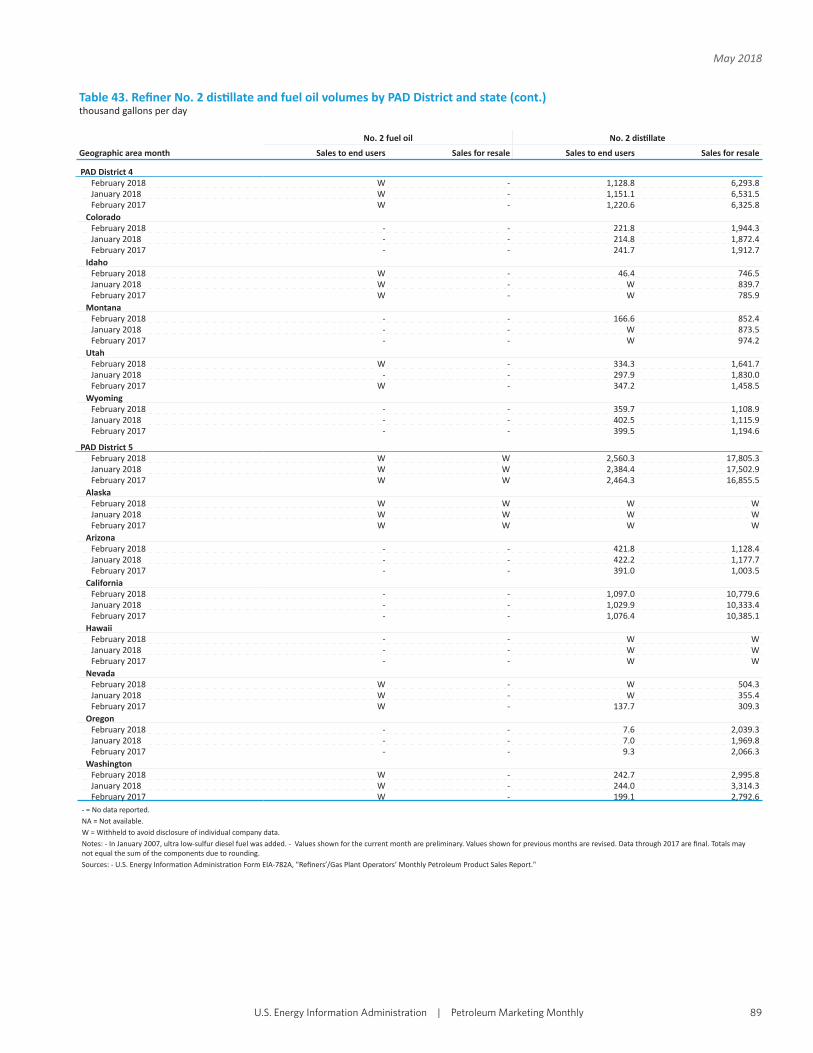
Table 43. Refi ner No. 2 dis llate and fuel oil volumes by PAD District and state (cont.)thousand gallons per day
Geographic area month
No. 2 fuel oil No. 2 dis llate
Sales to end users Sales for resale Sales to end users Sales for resale
PAD District 4February 2018 W - 1,128.8 6,293.8January 2018 W - 1,151.1 6,531.5February 2017 W - 1,220.6 6,325.8
ColoradoFebruary 2018 - - 221.8 1,944.3January 2018 - - 214.8 1,872.4February 2017 - - 241.7 1,912.7
IdahoFebruary 2018 W - 46.4 746.5January 2018 W - W 839.7February 2017 W - W 785.9
MontanaFebruary 2018 - - 166.6 852.4January 2018 - - W 873.5February 2017 - - W 974.2
UtahFebruary 2018 W - 334.3 1,641.7January 2018 - - 297.9 1,830.0February 2017 W - 347.2 1,458.5
WyomingFebruary 2018 - - 359.7 1,108.9January 2018 - - 402.5 1,115.9February 2017 - - 399.5 1,194.6
PAD District 5February 2018 W W 2,560.3 17,805.3January 2018 W W 2,384.4 17,502.9February 2017 W W 2,464.3 16,855.5
AlaskaFebruary 2018 W W W WJanuary 2018 W W W WFebruary 2017 W W W W
ArizonaFebruary 2018 - - 421.8 1,128.4January 2018 - - 422.2 1,177.7February 2017 - - 391.0 1,003.5
CaliforniaFebruary 2018 - - 1,097.0 10,779.6January 2018 - - 1,029.9 10,333.4February 2017 - - 1,076.4 10,385.1
HawaiiFebruary 2018 - - W WJanuary 2018 - - W WFebruary 2017 - - W W
NevadaFebruary 2018 W - W 504.3January 2018 W - W 355.4February 2017 W - 137.7 309.3
OregonFebruary 2018 - - 7.6 2,039.3January 2018 - - 7.0 1,969.8February 2017 - - 9.3 2,066.3
WashingtonFebruary 2018 W - 242.7 2,995.8January 2018 W - 244.0 3,314.3February 2017 W - 199.1 2,792.6
- = No data reported.NA = Not available.W = Withheld to avoid disclosure of individual company data.Notes: - In January 2007, ultra low-sulfur diesel fuel was added. - Values shown for the current month are preliminary. Values shown for previous months are revised. Data through 2017 are fi nal. Totals may not equal the sum of the components due to rounding.Sources: - U.S. Energy Informa on Administra on Form EIA-782A, "Refi ners’/Gas Plant Operators’ Monthly Petroleum Product Sales Report."
U.S. Energy Information Administration�|�Petroleum Marketing Monthly 89
May 2018

Table 44. Refi ner residual fuel oil and no. 4 fuel volumes by PAD Districtthousand gallons per day
Geographic area month
Residual fuel oil No. 4 fuel[a]
Sulfur less than or equal to 1% Sulfur greater than 1% Total
Sales to end users Sales for resale
Sales to end users Sales for resale
Sales to end users Sales for resale
Sales to end users Sales for resale
United StatesFebruary 2018 W 434.9 W 7,093.1 3,579.3 7,527.9 - WJanuary 2018 W 442.8 W 8,490.2 3,654.0 8,933.0 - WFebruary 2017 W 611.1 W 5,590.6 4,419.4 6,201.8 W W
PAD District 1February 2018 W W W W W 2,685.4 - -January 2018 W W W W W 2,370.9 - -February 2017 W W W W W 2,062.9 - -
Subdistrict 1AFebruary 2018 - - - - - - - -January 2018 - - - - - - - -February 2017 - - - - - - - -
Subdistrict 1BFebruary 2018 W W W W W W - -January 2018 W W W W W W - -February 2017 W W W W W W - -
Subdistrict 1CFebruary 2018 - - W W W W - -January 2018 - - W W W W - -February 2017 - - W W W W - -
PAD District 2February 2018 - - - W - W - WJanuary 2018 - - - W - W - WFebruary 2017 - - - W - W - W
PAD District 3February 2018 - W W W W 3,836.0 - WJanuary 2018 - W W W W 5,035.4 - WFebruary 2017 - W W W W 3,275.4 - W
PAD District 4February 2018 - - - W - W - -January 2018 - - - W - W - -February 2017 - - - W - W W -
PAD District 5February 2018 W W W W 2,600.7 W - -January 2018 W W W W 2,425.3 1,360.2 - -February 2017 W W W W 3,122.5 724.2 - -
- = No data reported.NA = Not available.W = Withheld to avoid disclosure of individual company data.Notes: Values shown for the current month are preliminary. Values shown for previous months may be revised. Data through 2017 are fi nal.Sources: - U.S. Energy Informa on Administra on Form EIA-782A, "Refi ners’/Gas Plant Operators’ Monthly Petroleum Product Sales Report."
U.S. Energy Information Administration�|�Petroleum Marketing Monthly90
May 2018
Prime Supplier Sales Volumes of Petroleum Products for
Local Consumption
U.S. Energy Information Administration�|�Petroleum Marketing Monthly
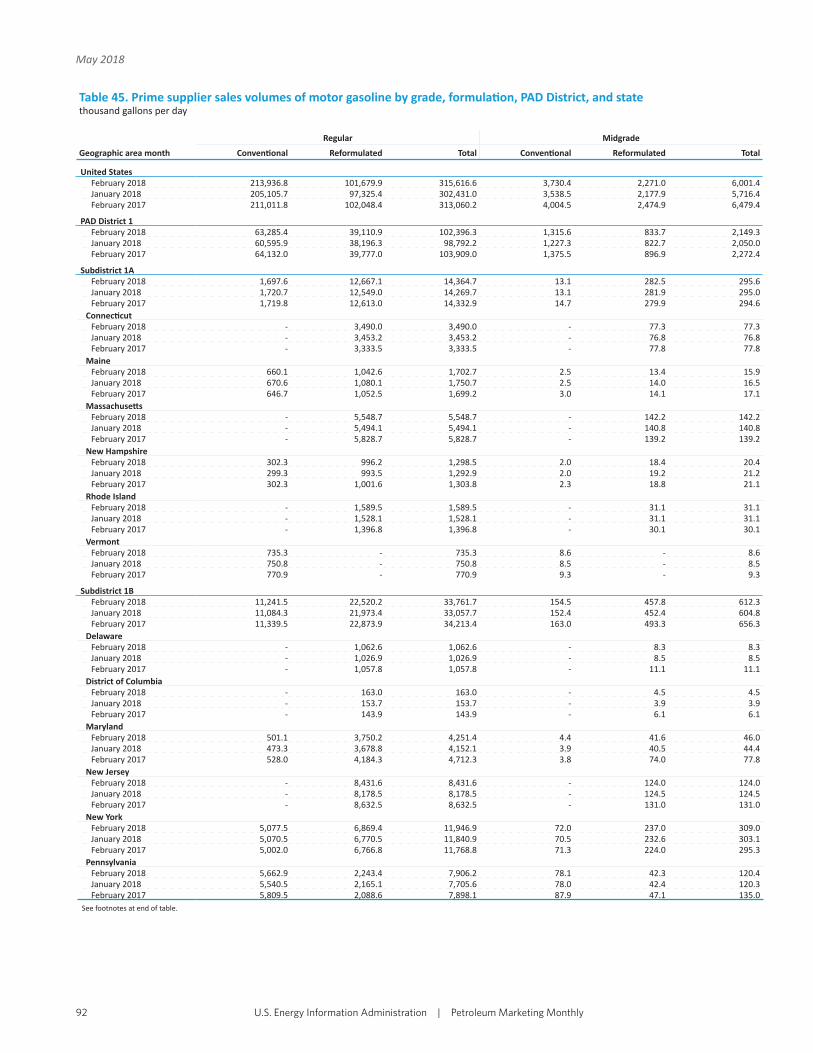
Table 45. Prime supplier sales volumes of motor gasoline by grade, formula on, PAD District, and statethousand gallons per day
Geographic area month
Regular Midgrade
Conven onal Reformulated Total Conven onal Reformulated Total
United StatesFebruary 2018 213,936.8 101,679.9 315,616.6 3,730.4 2,271.0 6,001.4January 2018 205,105.7 97,325.4 302,431.0 3,538.5 2,177.9 5,716.4February 2017 211,011.8 102,048.4 313,060.2 4,004.5 2,474.9 6,479.4
PAD District 1February 2018 63,285.4 39,110.9 102,396.3 1,315.6 833.7 2,149.3January 2018 60,595.9 38,196.3 98,792.2 1,227.3 822.7 2,050.0February 2017 64,132.0 39,777.0 103,909.0 1,375.5 896.9 2,272.4
Subdistrict 1AFebruary 2018 1,697.6 12,667.1 14,364.7 13.1 282.5 295.6January 2018 1,720.7 12,549.0 14,269.7 13.1 281.9 295.0February 2017 1,719.8 12,613.0 14,332.9 14.7 279.9 294.6
Connec cutFebruary 2018 - 3,490.0 3,490.0 - 77.3 77.3January 2018 - 3,453.2 3,453.2 - 76.8 76.8February 2017 - 3,333.5 3,333.5 - 77.8 77.8
MaineFebruary 2018 660.1 1,042.6 1,702.7 2.5 13.4 15.9January 2018 670.6 1,080.1 1,750.7 2.5 14.0 16.5February 2017 646.7 1,052.5 1,699.2 3.0 14.1 17.1
Massachuse sFebruary 2018 - 5,548.7 5,548.7 - 142.2 142.2January 2018 - 5,494.1 5,494.1 - 140.8 140.8February 2017 - 5,828.7 5,828.7 - 139.2 139.2
New HampshireFebruary 2018 302.3 996.2 1,298.5 2.0 18.4 20.4January 2018 299.3 993.5 1,292.9 2.0 19.2 21.2February 2017 302.3 1,001.6 1,303.8 2.3 18.8 21.1
Rhode IslandFebruary 2018 - 1,589.5 1,589.5 - 31.1 31.1January 2018 - 1,528.1 1,528.1 - 31.1 31.1February 2017 - 1,396.8 1,396.8 - 30.1 30.1
VermontFebruary 2018 735.3 - 735.3 8.6 - 8.6January 2018 750.8 - 750.8 8.5 - 8.5February 2017 770.9 - 770.9 9.3 - 9.3
Subdistrict 1BFebruary 2018 11,241.5 22,520.2 33,761.7 154.5 457.8 612.3January 2018 11,084.3 21,973.4 33,057.7 152.4 452.4 604.8February 2017 11,339.5 22,873.9 34,213.4 163.0 493.3 656.3
DelawareFebruary 2018 - 1,062.6 1,062.6 - 8.3 8.3January 2018 - 1,026.9 1,026.9 - 8.5 8.5February 2017 - 1,057.8 1,057.8 - 11.1 11.1
District of ColumbiaFebruary 2018 - 163.0 163.0 - 4.5 4.5January 2018 - 153.7 153.7 - 3.9 3.9February 2017 - 143.9 143.9 - 6.1 6.1
MarylandFebruary 2018 501.1 3,750.2 4,251.4 4.4 41.6 46.0January 2018 473.3 3,678.8 4,152.1 3.9 40.5 44.4February 2017 528.0 4,184.3 4,712.3 3.8 74.0 77.8
New JerseyFebruary 2018 - 8,431.6 8,431.6 - 124.0 124.0January 2018 - 8,178.5 8,178.5 - 124.5 124.5February 2017 - 8,632.5 8,632.5 - 131.0 131.0
New YorkFebruary 2018 5,077.5 6,869.4 11,946.9 72.0 237.0 309.0January 2018 5,070.5 6,770.5 11,840.9 70.5 232.6 303.1February 2017 5,002.0 6,766.8 11,768.8 71.3 224.0 295.3
PennsylvaniaFebruary 2018 5,662.9 2,243.4 7,906.2 78.1 42.3 120.4January 2018 5,540.5 2,165.1 7,705.6 78.0 42.4 120.3February 2017 5,809.5 2,088.6 7,898.1 87.9 47.1 135.0
See footnotes at end of table.
U.S. Energy Information Administration�|�Petroleum Marketing Monthly92
May 2018

Table 45. Prime supplier sales volumes of motor gasoline by grade, formula on, PAD District, and state (cont.)thousand gallons per day
Geographic area month
Premium All grades
Conven onal Reformulated Total Conven onal Reformulated Total
United StatesFebruary 2018 21,244.5 18,478.4 39,722.9 238,911.6 122,429.2 361,340.9January 2018 20,489.7 17,725.4 38,215.1 229,133.9 117,228.6 346,362.5February 2017 20,965.3 18,881.4 39,846.6 235,981.6 123,404.7 359,386.3
PAD District 1February 2018 6,862.1 6,097.2 12,959.3 71,463.2 46,041.8 117,504.9January 2018 6,503.8 5,999.7 12,503.5 68,327.0 45,018.8 113,345.7February 2017 6,996.3 6,338.0 13,334.2 72,503.7 47,011.9 119,515.6
Subdistrict 1AFebruary 2018 136.6 1,624.4 1,761.1 1,847.4 14,574.0 16,421.4January 2018 134.3 1,651.0 1,785.3 1,868.1 14,481.9 16,350.0February 2017 145.6 1,646.0 1,791.6 1,880.1 14,539.0 16,419.1
Connec cutFebruary 2018 - 508.3 508.3 - 4,075.6 4,075.6January 2018 - 506.5 506.5 - 4,036.5 4,036.5February 2017 - 504.1 504.1 - 3,915.4 3,915.4
MaineFebruary 2018 47.4 74.8 122.1 709.9 1,130.9 1,840.8January 2018 42.3 80.8 123.1 715.4 1,175.0 1,890.4February 2017 59.9 60.2 120.0 709.6 1,126.8 1,836.4
Massachuse sFebruary 2018 - 742.3 742.3 - 6,433.2 6,433.2January 2018 - 759.7 759.7 - 6,394.6 6,394.6February 2017 - 800.8 800.8 - 6,768.7 6,768.7
New HampshireFebruary 2018 27.0 93.1 120.1 331.3 1,107.7 1,439.0January 2018 25.6 95.4 121.0 326.9 1,108.1 1,435.1February 2017 23.5 96.8 120.3 328.1 1,117.1 1,445.2
Rhode IslandFebruary 2018 - 206.0 206.0 - 1,826.6 1,826.6January 2018 - 208.5 208.5 - 1,767.7 1,767.7February 2017 - 184.2 184.2 - 1,611.1 1,611.1
VermontFebruary 2018 62.3 - 62.3 806.3 - 806.3January 2018 66.4 - 66.4 825.7 - 825.7February 2017 62.2 - 62.2 842.4 - 842.4
Subdistrict 1BFebruary 2018 917.9 3,797.5 4,715.3 12,313.8 26,775.4 39,089.3January 2018 911.8 3,709.0 4,620.8 12,148.5 26,134.8 38,283.3February 2017 934.3 3,887.9 4,822.2 12,436.8 27,255.1 39,691.9
DelawareFebruary 2018 - 106.1 106.1 - 1,177.0 1,177.0January 2018 - 105.3 105.3 - 1,140.7 1,140.7February 2017 - 123.1 123.1 - 1,192.1 1,192.1
District of ColumbiaFebruary 2018 - 32.7 32.7 - 200.2 200.2January 2018 - 31.0 31.0 - 188.6 188.6February 2017 - 33.2 33.2 - 183.1 183.1
MarylandFebruary 2018 39.8 635.9 675.6 545.3 4,427.7 4,973.0January 2018 38.2 594.3 632.5 515.4 4,313.6 4,829.0February 2017 34.6 737.7 772.3 566.4 4,996.0 5,562.5
New JerseyFebruary 2018 - 1,200.8 1,200.8 - 9,756.5 9,756.5January 2018 - 1,178.4 1,178.4 - 9,481.5 9,481.5February 2017 - 1,222.5 1,222.5 - 9,986.1 9,986.1
New YorkFebruary 2018 419.6 1,520.3 1,939.9 5,569.1 8,626.7 14,195.9January 2018 432.2 1,503.9 1,936.1 5,573.1 8,506.9 14,080.1February 2017 431.1 1,469.0 1,900.1 5,504.4 8,459.8 13,964.2
PennsylvaniaFebruary 2018 NA 301.6 760.1 6,199.4 2,587.3 8,786.7January 2018 441.5 296.1 737.5 6,060.0 2,503.5 8,563.5February 2017 468.6 302.4 770.9 6,366.0 2,438.0 8,804.0
See footnotes at end of table.
U.S. Energy Information Administration�|�Petroleum Marketing Monthly 93
May 2018
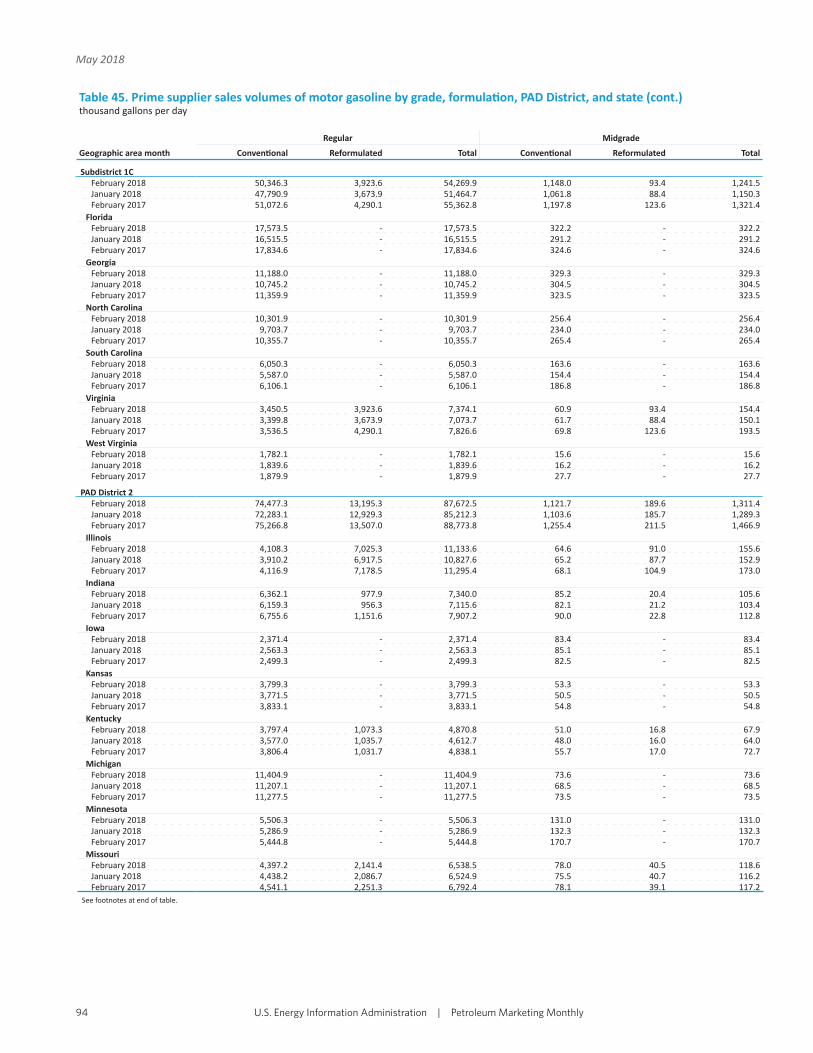
Table 45. Prime supplier sales volumes of motor gasoline by grade, formula on, PAD District, and state (cont.)thousand gallons per day
Geographic area month
Regular Midgrade
Conven onal Reformulated Total Conven onal Reformulated Total
Subdistrict 1CFebruary 2018 50,346.3 3,923.6 54,269.9 1,148.0 93.4 1,241.5January 2018 47,790.9 3,673.9 51,464.7 1,061.8 88.4 1,150.3February 2017 51,072.6 4,290.1 55,362.8 1,197.8 123.6 1,321.4
FloridaFebruary 2018 17,573.5 - 17,573.5 322.2 - 322.2January 2018 16,515.5 - 16,515.5 291.2 - 291.2February 2017 17,834.6 - 17,834.6 324.6 - 324.6
GeorgiaFebruary 2018 11,188.0 - 11,188.0 329.3 - 329.3January 2018 10,745.2 - 10,745.2 304.5 - 304.5February 2017 11,359.9 - 11,359.9 323.5 - 323.5
North CarolinaFebruary 2018 10,301.9 - 10,301.9 256.4 - 256.4January 2018 9,703.7 - 9,703.7 234.0 - 234.0February 2017 10,355.7 - 10,355.7 265.4 - 265.4
South CarolinaFebruary 2018 6,050.3 - 6,050.3 163.6 - 163.6January 2018 5,587.0 - 5,587.0 154.4 - 154.4February 2017 6,106.1 - 6,106.1 186.8 - 186.8
VirginiaFebruary 2018 3,450.5 3,923.6 7,374.1 60.9 93.4 154.4January 2018 3,399.8 3,673.9 7,073.7 61.7 88.4 150.1February 2017 3,536.5 4,290.1 7,826.6 69.8 123.6 193.5
West VirginiaFebruary 2018 1,782.1 - 1,782.1 15.6 - 15.6January 2018 1,839.6 - 1,839.6 16.2 - 16.2February 2017 1,879.9 - 1,879.9 27.7 - 27.7
PAD District 2February 2018 74,477.3 13,195.3 87,672.5 1,121.7 189.6 1,311.4January 2018 72,283.1 12,929.3 85,212.3 1,103.6 185.7 1,289.3February 2017 75,266.8 13,507.0 88,773.8 1,255.4 211.5 1,466.9
IllinoisFebruary 2018 4,108.3 7,025.3 11,133.6 64.6 91.0 155.6January 2018 3,910.2 6,917.5 10,827.6 65.2 87.7 152.9February 2017 4,116.9 7,178.5 11,295.4 68.1 104.9 173.0
IndianaFebruary 2018 6,362.1 977.9 7,340.0 85.2 20.4 105.6January 2018 6,159.3 956.3 7,115.6 82.1 21.2 103.4February 2017 6,755.6 1,151.6 7,907.2 90.0 22.8 112.8
IowaFebruary 2018 2,371.4 - 2,371.4 83.4 - 83.4January 2018 2,563.3 - 2,563.3 85.1 - 85.1February 2017 2,499.3 - 2,499.3 82.5 - 82.5
KansasFebruary 2018 3,799.3 - 3,799.3 53.3 - 53.3January 2018 3,771.5 - 3,771.5 50.5 - 50.5February 2017 3,833.1 - 3,833.1 54.8 - 54.8
KentuckyFebruary 2018 3,797.4 1,073.3 4,870.8 51.0 16.8 67.9January 2018 3,577.0 1,035.7 4,612.7 48.0 16.0 64.0February 2017 3,806.4 1,031.7 4,838.1 55.7 17.0 72.7
MichiganFebruary 2018 11,404.9 - 11,404.9 73.6 - 73.6January 2018 11,207.1 - 11,207.1 68.5 - 68.5February 2017 11,277.5 - 11,277.5 73.5 - 73.5
MinnesotaFebruary 2018 5,506.3 - 5,506.3 131.0 - 131.0January 2018 5,286.9 - 5,286.9 132.3 - 132.3February 2017 5,444.8 - 5,444.8 170.7 - 170.7
MissouriFebruary 2018 4,397.2 2,141.4 6,538.5 78.0 40.5 118.6January 2018 4,438.2 2,086.7 6,524.9 75.5 40.7 116.2February 2017 4,541.1 2,251.3 6,792.4 78.1 39.1 117.2
See footnotes at end of table.
U.S. Energy Information Administration�|�Petroleum Marketing Monthly94
May 2018

Table 45. Prime supplier sales volumes of motor gasoline by grade, formula on, PAD District, and state (cont.)thousand gallons per day
Geographic area month
Premium All grades
Conven onal Reformulated Total Conven onal Reformulated Total
Subdistrict 1CFebruary 2018 5,807.6 675.3 6,482.9 57,301.9 4,692.4 61,994.3January 2018 5,457.7 639.8 6,097.5 54,310.4 4,402.1 58,712.5February 2017 5,916.3 804.1 6,720.4 58,186.8 5,217.9 63,404.6
FloridaFebruary 2018 2,369.6 - 2,369.6 20,265.3 - 20,265.3January 2018 2,200.9 - 2,200.9 19,007.5 - 19,007.5February 2017 2,431.8 - 2,431.8 20,591.0 - 20,591.0
GeorgiaFebruary 2018 1,395.0 - 1,395.0 12,912.3 - 12,912.3January 2018 1,299.8 - 1,299.8 12,349.5 - 12,349.5February 2017 1,410.6 - 1,410.6 13,094.0 - 13,094.0
North CarolinaFebruary 2018 1,131.2 - 1,131.2 11,689.5 - 11,689.5January 2018 1,058.5 - 1,058.5 10,996.2 - 10,996.2February 2017 1,125.8 - 1,125.8 11,746.9 - 11,746.9
South CarolinaFebruary 2018 576.2 - 576.2 6,790.1 - 6,790.1January 2018 535.2 - 535.2 6,276.6 - 6,276.6February 2017 584.4 - 584.4 6,877.3 - 6,877.3
VirginiaFebruary 2018 259.7 675.3 935.0 3,771.1 4,692.4 8,463.4January 2018 264.5 639.8 904.2 3,726.0 4,402.1 8,128.0February 2017 277.6 804.1 1,081.7 3,884.0 5,217.9 9,101.8
West VirginiaFebruary 2018 75.9 - 75.9 1,873.6 - 1,873.6January 2018 98.9 - 98.9 1,954.6 - 1,954.6February 2017 86.0 - 86.0 1,993.5 - 1,993.5
PAD District 2February 2018 5,435.8 1,446.9 6,882.7 81,034.8 14,831.8 95,866.6January 2018 5,357.1 1,420.4 6,777.5 78,743.8 14,535.4 93,279.2February 2017 5,398.0 1,479.2 6,877.3 81,920.2 15,197.7 97,117.9
IllinoisFebruary 2018 175.6 906.6 1,082.2 4,348.5 8,022.9 12,371.4January 2018 177.5 899.6 1,077.2 4,152.9 7,904.8 12,057.7February 2017 186.4 936.9 1,123.3 4,371.4 8,220.3 12,591.7
IndianaFebruary 2018 374.0 96.0 470.0 6,821.3 1,094.3 7,915.6January 2018 362.8 95.7 458.5 6,604.2 1,073.2 7,677.4February 2017 388.0 108.0 496.0 7,233.6 1,282.4 8,516.0
IowaFebruary 2018 271.9 - 271.9 2,726.7 - 2,726.7January 2018 293.9 - 293.9 2,942.3 - 2,942.3February 2017 273.0 - 273.0 2,854.8 - 2,854.8
KansasFebruary 2018 291.6 - 291.6 4,144.2 - 4,144.2January 2018 281.4 - 281.4 4,103.3 - 4,103.3February 2017 298.1 - 298.1 4,185.9 - 4,185.9
KentuckyFebruary 2018 191.2 90.5 281.8 4,039.7 1,180.7 5,220.4January 2018 183.5 87.3 270.8 3,808.5 1,138.9 4,947.5February 2017 216.8 87.1 303.9 4,078.9 1,135.8 5,214.7
MichiganFebruary 2018 633.1 - 633.1 12,111.7 - 12,111.7January 2018 635.9 - 635.9 11,911.5 - 11,911.5February 2017 628.3 - 628.3 11,979.3 - 11,979.3
MinnesotaFebruary 2018 504.5 - 504.5 6,141.8 - 6,141.8January 2018 468.5 - 468.5 5,887.7 - 5,887.7February 2017 413.8 - 413.8 6,029.3 - 6,029.3
MissouriFebruary 2018 300.8 188.7 489.5 4,776.0 2,370.6 7,146.6January 2018 301.5 179.5 481.1 4,815.3 2,306.9 7,122.3February 2017 307.7 199.9 507.5 4,926.9 2,490.3 7,417.2
See footnotes at end of table.
U.S. Energy Information Administration�|�Petroleum Marketing Monthly 95
May 2018
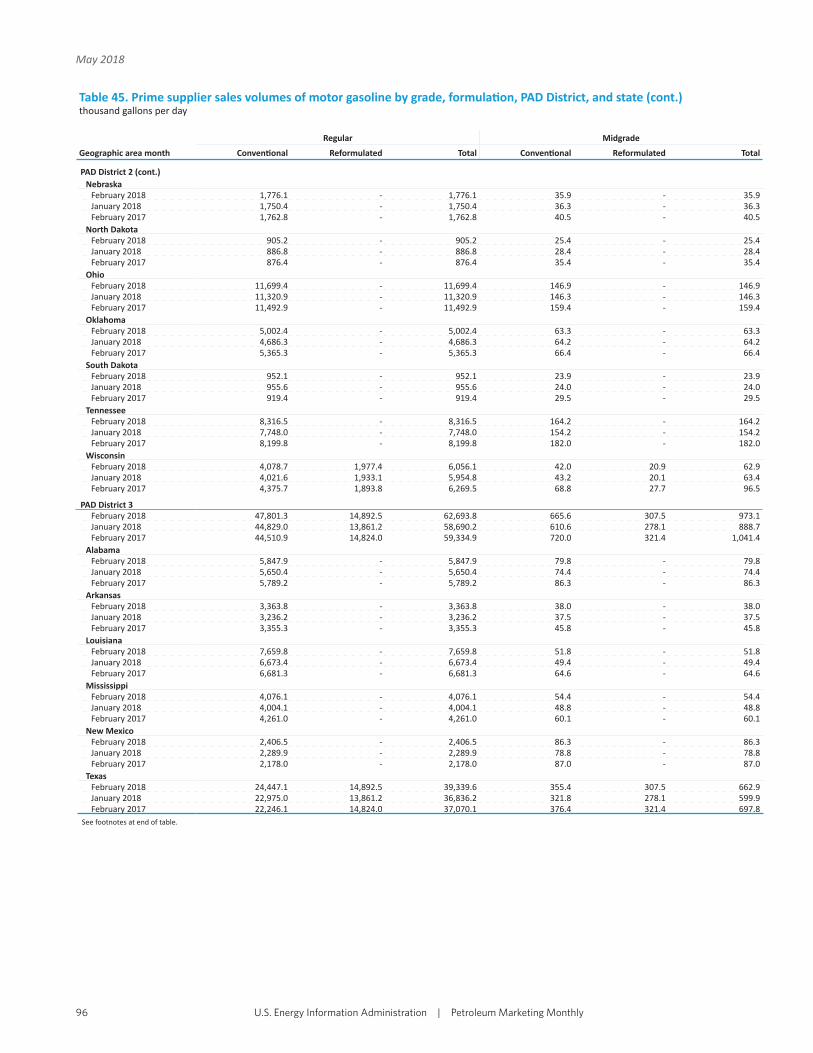
Table 45. Prime supplier sales volumes of motor gasoline by grade, formula on, PAD District, and state (cont.)thousand gallons per day
Geographic area month
Regular Midgrade
Conven onal Reformulated Total Conven onal Reformulated Total
PAD District 2 (cont.)Nebraska
February 2018 1,776.1 - 1,776.1 35.9 - 35.9January 2018 1,750.4 - 1,750.4 36.3 - 36.3February 2017 1,762.8 - 1,762.8 40.5 - 40.5
North DakotaFebruary 2018 905.2 - 905.2 25.4 - 25.4January 2018 886.8 - 886.8 28.4 - 28.4February 2017 876.4 - 876.4 35.4 - 35.4
OhioFebruary 2018 11,699.4 - 11,699.4 146.9 - 146.9January 2018 11,320.9 - 11,320.9 146.3 - 146.3February 2017 11,492.9 - 11,492.9 159.4 - 159.4
OklahomaFebruary 2018 5,002.4 - 5,002.4 63.3 - 63.3January 2018 4,686.3 - 4,686.3 64.2 - 64.2February 2017 5,365.3 - 5,365.3 66.4 - 66.4
South DakotaFebruary 2018 952.1 - 952.1 23.9 - 23.9January 2018 955.6 - 955.6 24.0 - 24.0February 2017 919.4 - 919.4 29.5 - 29.5
TennesseeFebruary 2018 8,316.5 - 8,316.5 164.2 - 164.2January 2018 7,748.0 - 7,748.0 154.2 - 154.2February 2017 8,199.8 - 8,199.8 182.0 - 182.0
WisconsinFebruary 2018 4,078.7 1,977.4 6,056.1 42.0 20.9 62.9January 2018 4,021.6 1,933.1 5,954.8 43.2 20.1 63.4February 2017 4,375.7 1,893.8 6,269.5 68.8 27.7 96.5
PAD District 3February 2018 47,801.3 14,892.5 62,693.8 665.6 307.5 973.1January 2018 44,829.0 13,861.2 58,690.2 610.6 278.1 888.7February 2017 44,510.9 14,824.0 59,334.9 720.0 321.4 1,041.4
AlabamaFebruary 2018 5,847.9 - 5,847.9 79.8 - 79.8January 2018 5,650.4 - 5,650.4 74.4 - 74.4February 2017 5,789.2 - 5,789.2 86.3 - 86.3
ArkansasFebruary 2018 3,363.8 - 3,363.8 38.0 - 38.0January 2018 3,236.2 - 3,236.2 37.5 - 37.5February 2017 3,355.3 - 3,355.3 45.8 - 45.8
LouisianaFebruary 2018 7,659.8 - 7,659.8 51.8 - 51.8January 2018 6,673.4 - 6,673.4 49.4 - 49.4February 2017 6,681.3 - 6,681.3 64.6 - 64.6
MississippiFebruary 2018 4,076.1 - 4,076.1 54.4 - 54.4January 2018 4,004.1 - 4,004.1 48.8 - 48.8February 2017 4,261.0 - 4,261.0 60.1 - 60.1
New MexicoFebruary 2018 2,406.5 - 2,406.5 86.3 - 86.3January 2018 2,289.9 - 2,289.9 78.8 - 78.8February 2017 2,178.0 - 2,178.0 87.0 - 87.0
TexasFebruary 2018 24,447.1 14,892.5 39,339.6 355.4 307.5 662.9January 2018 22,975.0 13,861.2 36,836.2 321.8 278.1 599.9February 2017 22,246.1 14,824.0 37,070.1 376.4 321.4 697.8
See footnotes at end of table.
U.S. Energy Information Administration�|�Petroleum Marketing Monthly96
May 2018
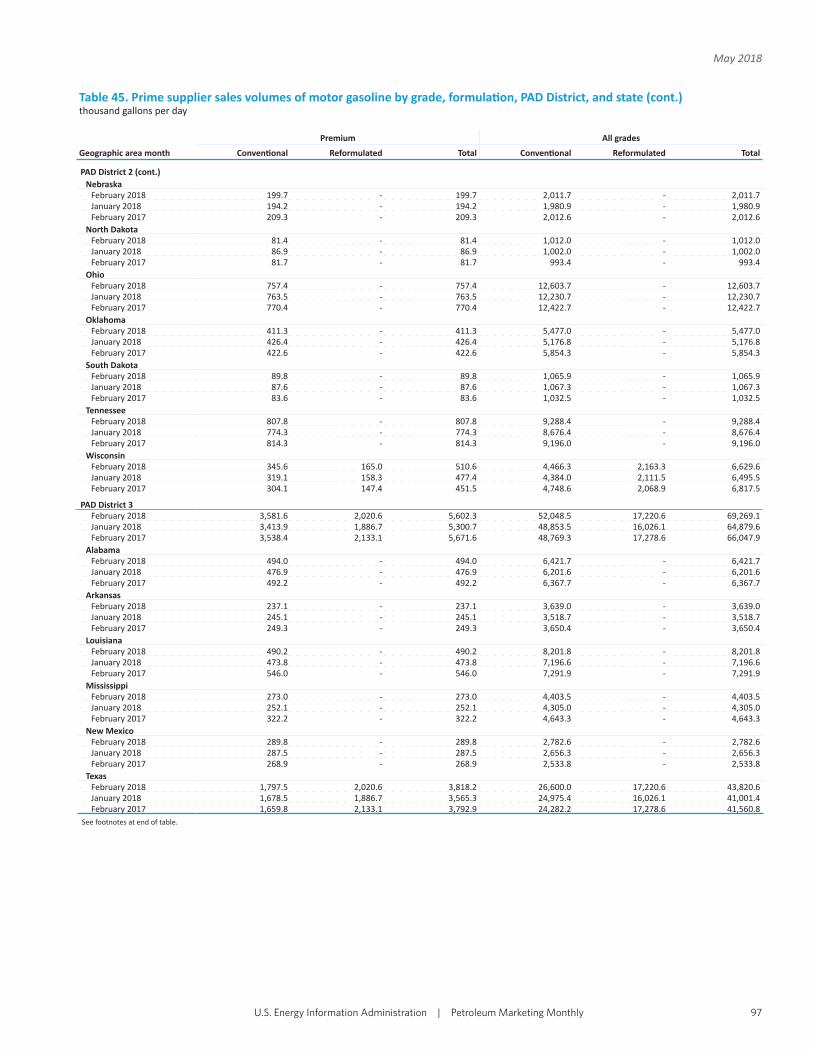
Table 45. Prime supplier sales volumes of motor gasoline by grade, formula on, PAD District, and state (cont.)thousand gallons per day
Geographic area month
Premium All grades
Conven onal Reformulated Total Conven onal Reformulated Total
PAD District 2 (cont.)Nebraska
February 2018 199.7 - 199.7 2,011.7 - 2,011.7January 2018 194.2 - 194.2 1,980.9 - 1,980.9February 2017 209.3 - 209.3 2,012.6 - 2,012.6
North DakotaFebruary 2018 81.4 - 81.4 1,012.0 - 1,012.0January 2018 86.9 - 86.9 1,002.0 - 1,002.0February 2017 81.7 - 81.7 993.4 - 993.4
OhioFebruary 2018 757.4 - 757.4 12,603.7 - 12,603.7January 2018 763.5 - 763.5 12,230.7 - 12,230.7February 2017 770.4 - 770.4 12,422.7 - 12,422.7
OklahomaFebruary 2018 411.3 - 411.3 5,477.0 - 5,477.0January 2018 426.4 - 426.4 5,176.8 - 5,176.8February 2017 422.6 - 422.6 5,854.3 - 5,854.3
South DakotaFebruary 2018 89.8 - 89.8 1,065.9 - 1,065.9January 2018 87.6 - 87.6 1,067.3 - 1,067.3February 2017 83.6 - 83.6 1,032.5 - 1,032.5
TennesseeFebruary 2018 807.8 - 807.8 9,288.4 - 9,288.4January 2018 774.3 - 774.3 8,676.4 - 8,676.4February 2017 814.3 - 814.3 9,196.0 - 9,196.0
WisconsinFebruary 2018 345.6 165.0 510.6 4,466.3 2,163.3 6,629.6January 2018 319.1 158.3 477.4 4,384.0 2,111.5 6,495.5February 2017 304.1 147.4 451.5 4,748.6 2,068.9 6,817.5
PAD District 3February 2018 3,581.6 2,020.6 5,602.3 52,048.5 17,220.6 69,269.1January 2018 3,413.9 1,886.7 5,300.7 48,853.5 16,026.1 64,879.6February 2017 3,538.4 2,133.1 5,671.6 48,769.3 17,278.6 66,047.9
AlabamaFebruary 2018 494.0 - 494.0 6,421.7 - 6,421.7January 2018 476.9 - 476.9 6,201.6 - 6,201.6February 2017 492.2 - 492.2 6,367.7 - 6,367.7
ArkansasFebruary 2018 237.1 - 237.1 3,639.0 - 3,639.0January 2018 245.1 - 245.1 3,518.7 - 3,518.7February 2017 249.3 - 249.3 3,650.4 - 3,650.4
LouisianaFebruary 2018 490.2 - 490.2 8,201.8 - 8,201.8January 2018 473.8 - 473.8 7,196.6 - 7,196.6February 2017 546.0 - 546.0 7,291.9 - 7,291.9
MississippiFebruary 2018 273.0 - 273.0 4,403.5 - 4,403.5January 2018 252.1 - 252.1 4,305.0 - 4,305.0February 2017 322.2 - 322.2 4,643.3 - 4,643.3
New MexicoFebruary 2018 289.8 - 289.8 2,782.6 - 2,782.6January 2018 287.5 - 287.5 2,656.3 - 2,656.3February 2017 268.9 - 268.9 2,533.8 - 2,533.8
TexasFebruary 2018 1,797.5 2,020.6 3,818.2 26,600.0 17,220.6 43,820.6January 2018 1,678.5 1,886.7 3,565.3 24,975.4 16,026.1 41,001.4February 2017 1,659.8 2,133.1 3,792.9 24,282.2 17,278.6 41,560.8
See footnotes at end of table.
U.S. Energy Information Administration�|�Petroleum Marketing Monthly 97
May 2018
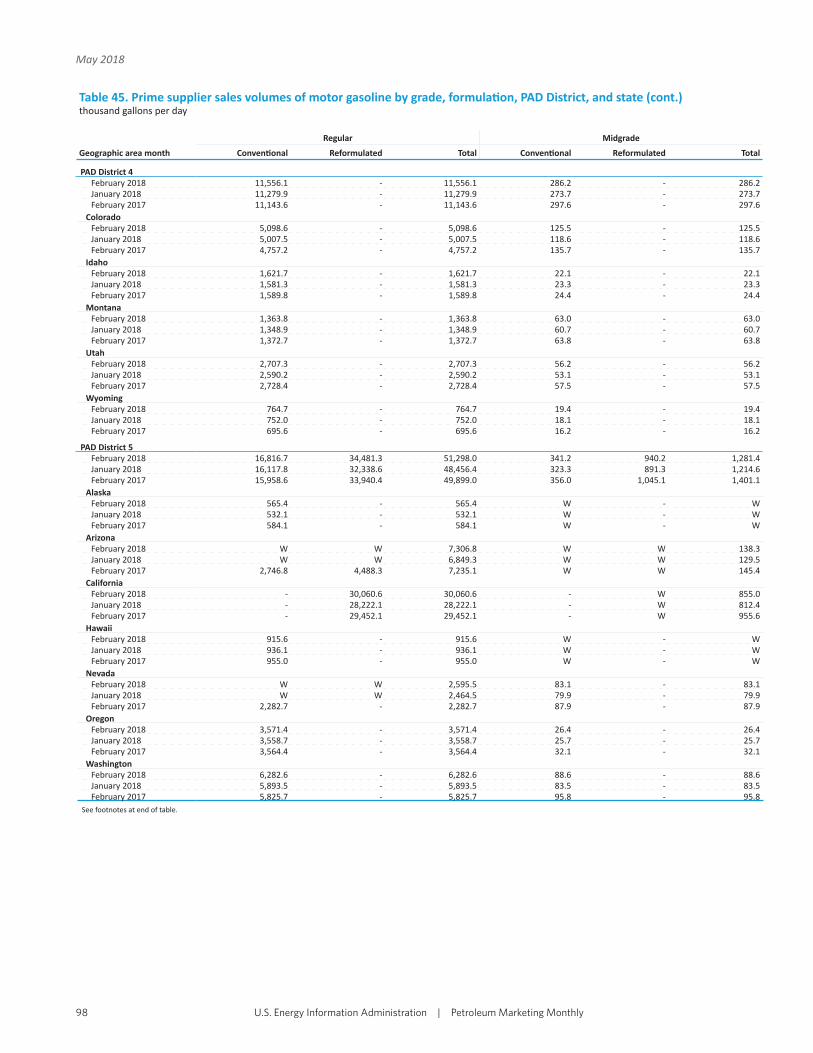
Table 45. Prime supplier sales volumes of motor gasoline by grade, formula on, PAD District, and state (cont.)thousand gallons per day
Geographic area month
Regular Midgrade
Conven onal Reformulated Total Conven onal Reformulated Total
PAD District 4February 2018 11,556.1 - 11,556.1 286.2 - 286.2January 2018 11,279.9 - 11,279.9 273.7 - 273.7February 2017 11,143.6 - 11,143.6 297.6 - 297.6
ColoradoFebruary 2018 5,098.6 - 5,098.6 125.5 - 125.5January 2018 5,007.5 - 5,007.5 118.6 - 118.6February 2017 4,757.2 - 4,757.2 135.7 - 135.7
IdahoFebruary 2018 1,621.7 - 1,621.7 22.1 - 22.1January 2018 1,581.3 - 1,581.3 23.3 - 23.3February 2017 1,589.8 - 1,589.8 24.4 - 24.4
MontanaFebruary 2018 1,363.8 - 1,363.8 63.0 - 63.0January 2018 1,348.9 - 1,348.9 60.7 - 60.7February 2017 1,372.7 - 1,372.7 63.8 - 63.8
UtahFebruary 2018 2,707.3 - 2,707.3 56.2 - 56.2January 2018 2,590.2 - 2,590.2 53.1 - 53.1February 2017 2,728.4 - 2,728.4 57.5 - 57.5
WyomingFebruary 2018 764.7 - 764.7 19.4 - 19.4January 2018 752.0 - 752.0 18.1 - 18.1February 2017 695.6 - 695.6 16.2 - 16.2
PAD District 5February 2018 16,816.7 34,481.3 51,298.0 341.2 940.2 1,281.4January 2018 16,117.8 32,338.6 48,456.4 323.3 891.3 1,214.6February 2017 15,958.6 33,940.4 49,899.0 356.0 1,045.1 1,401.1
AlaskaFebruary 2018 565.4 - 565.4 W - WJanuary 2018 532.1 - 532.1 W - WFebruary 2017 584.1 - 584.1 W - W
ArizonaFebruary 2018 W W 7,306.8 W W 138.3January 2018 W W 6,849.3 W W 129.5February 2017 2,746.8 4,488.3 7,235.1 W W 145.4
CaliforniaFebruary 2018 - 30,060.6 30,060.6 - W 855.0January 2018 - 28,222.1 28,222.1 - W 812.4February 2017 - 29,452.1 29,452.1 - W 955.6
HawaiiFebruary 2018 915.6 - 915.6 W - WJanuary 2018 936.1 - 936.1 W - WFebruary 2017 955.0 - 955.0 W - W
NevadaFebruary 2018 W W 2,595.5 83.1 - 83.1January 2018 W W 2,464.5 79.9 - 79.9February 2017 2,282.7 - 2,282.7 87.9 - 87.9
OregonFebruary 2018 3,571.4 - 3,571.4 26.4 - 26.4January 2018 3,558.7 - 3,558.7 25.7 - 25.7February 2017 3,564.4 - 3,564.4 32.1 - 32.1
WashingtonFebruary 2018 6,282.6 - 6,282.6 88.6 - 88.6January 2018 5,893.5 - 5,893.5 83.5 - 83.5February 2017 5,825.7 - 5,825.7 95.8 - 95.8
See footnotes at end of table.
U.S. Energy Information Administration�|�Petroleum Marketing Monthly98
May 2018

Table 45. Prime supplier sales volumes of motor gasoline by grade, formula on, PAD District, and state (cont.)thousand gallons per day
Geographic area month
Premium All grades
Conven onal Reformulated Total Conven onal Reformulated Total
PAD District 4February 2018 2,443.5 - 2,443.5 14,285.8 - 14,285.8January 2018 2,389.7 - 2,389.7 13,943.3 - 13,943.3February 2017 2,280.8 - 2,280.8 13,722.0 - 13,722.0
ColoradoFebruary 2018 1,053.1 - 1,053.1 6,277.2 - 6,277.2January 2018 1,021.5 - 1,021.5 6,147.6 - 6,147.6February 2017 942.1 - 942.1 5,835.0 - 5,835.0
IdahoFebruary 2018 258.7 - 258.7 1,902.5 - 1,902.5January 2018 251.2 - 251.2 1,855.8 - 1,855.8February 2017 243.1 - 243.1 1,857.3 - 1,857.3
MontanaFebruary 2018 246.0 - 246.0 1,672.8 - 1,672.8January 2018 249.6 - 249.6 1,659.3 - 1,659.3February 2017 260.6 - 260.6 1,697.1 - 1,697.1
UtahFebruary 2018 741.6 - 741.6 3,505.1 - 3,505.1January 2018 714.3 - 714.3 3,357.6 - 3,357.6February 2017 699.6 - 699.6 3,485.5 - 3,485.5
WyomingFebruary 2018 144.1 - 144.1 928.2 - 928.2January 2018 153.0 - 153.0 923.1 - 923.1February 2017 135.4 - 135.4 847.1 - 847.1
PAD District 5February 2018 2,921.5 8,913.6 11,835.1 20,079.4 44,335.0 64,414.5January 2018 2,825.2 8,418.5 11,243.6 19,266.3 41,648.4 60,914.7February 2017 2,751.7 8,931.0 11,682.8 19,066.4 43,916.5 62,982.9
AlaskaFebruary 2018 W - W 646.3 - 646.3January 2018 W - W 605.0 - 605.0February 2017 W - W 664.0 - 664.0
ArizonaFebruary 2018 W W 984.6 W W 8,429.7January 2018 W W 931.1 W W 7,909.9February 2017 W W 977.9 W W 8,358.3
CaliforniaFebruary 2018 - W 8,296.3 - 39,211.8 39,211.8January 2018 - W 7,838.7 - 36,873.2 36,873.2February 2017 - W 8,271.9 - 38,679.6 38,679.6
HawaiiFebruary 2018 W - W 1,248.1 - 1,248.1January 2018 W - W 1,244.7 - 1,244.7February 2017 W - W 1,263.5 - 1,263.5
NevadaFebruary 2018 627.5 - 627.5 W W 3,306.1January 2018 W W 609.7 W W 3,154.2February 2017 W W 581.0 W W 2,951.6
OregonFebruary 2018 446.8 - 446.8 4,044.5 - 4,044.5January 2018 450.3 - 450.3 4,034.7 - 4,034.7February 2017 464.5 - 464.5 4,060.9 - 4,060.9
WashingtonFebruary 2018 1,156.7 - 1,156.7 7,528.0 - 7,528.0January 2018 1,116.0 - 1,116.0 7,093.0 - 7,093.0February 2017 1,083.5 - 1,083.5 7,004.9 - 7,004.9
- = No data reported.W = Withheld to avoid disclosure of individual company data.Notes: - Beginning January 2007, oxygenated gasoline is included in conven onal gasoline. - Values shown for the current month are preliminary. Values shown for previous months are revised. Data through 2017 are fi nal. Totals may not equal the sum of the components due to rounding.Sources: - U.S. Energy Informa on Administra on, Form EIA-782C, "Monthly Report of Prime Supplier Sales of Petroleum Products Sold for Local Consump on."
U.S. Energy Information Administration�|�Petroleum Marketing Monthly 99
May 2018

Table 46. Prime supplier sales volumes of avia on fuels, no. 4 fuel oil, propane, and residual fuel oil by PAD District and statethousand gallons per day
Geographic area month Avia on gasolineKerosene-type jet
fuel No. 4 fuel oil[a]Propane (consumer
grade)
Residual fuel oil
Total residual fuel oil
Sulfur less than or equal to 1%
Sulfur greater than 1%
United StatesFebruary 2018 331.5 62,971.4 W 45,016.1 1,833.1 11,706.7 13,539.8January 2018 335.5 63,314.3 W 57,281.0 1,706.3 12,874.7 14,581.0February 2017 339.4 57,074.0 W 38,271.0 1,541.8 9,919.2 11,461.0
PAD District 1February 2018 116.0 14,812.1 W 12,307.3 564.7 4,828.5 5,393.2January 2018 95.8 15,525.2 W 17,342.5 817.4 4,441.3 5,258.6February 2017 120.3 14,569.8 W 10,033.3 647.8 3,831.7 4,479.5
Subdistrict 1AFebruary 2018 8.2 1,320.8 W 3,091.7 W W 159.1January 2018 8.7 1,275.2 W 3,912.7 W W WFebruary 2017 11.3 1,251.9 W 2,765.7 W W 141.6
Connec cutFebruary 2018 1.9 153.9 - 298.5 - - -January 2018 1.4 179.3 W 382.5 W - WFebruary 2017 1.5 150.5 - 269.3 W - W
MaineFebruary 2018 W 69.7 W 768.6 W W 27.6January 2018 W 53.4 W 947.6 W W 97.5February 2017 W 81.1 W 661.9 W W 17.4
Massachuse sFebruary 2018 3.4 922.9 W 627.3 W W 101.5January 2018 4.7 892.9 W 799.4 W W WFebruary 2017 5.0 895.4 W 615.7 W - W
New HampshireFebruary 2018 2.0 58.4 W 775.9 W W WJanuary 2018 W 38.8 W 990.6 W W WFebruary 2017 1.4 47.0 W 683.0 W W W
Rhode IslandFebruary 2018 W 90.2 - 66.2 W - WJanuary 2018 W 90.3 W 86.9 W - WFebruary 2017 W 58.3 W 96.6 W - W
VermontFebruary 2018 W 25.7 W 555.2 W W WJanuary 2018 - 20.5 W 705.8 W W WFebruary 2017 W 19.5 W 439.1 W W W
Subdistrict 1BFebruary 2018 17.4 8,561.7 W 4,785.7 430.9 3,065.1 3,496.0January 2018 13.1 8,705.4 W 6,393.1 W W 3,294.6February 2017 18.8 8,373.9 W 3,930.4 W W 2,828.9
DelawareFebruary 2018 W W - W W - WJanuary 2018 W 10.2 - W W - WFebruary 2017 W W - W W - W
District of ColumbiaFebruary 2018 - W - W - - -January 2018 - - - W - - -February 2017 - W - W - - -
MarylandFebruary 2018 3.5 217.3 - 591.7 - W WJanuary 2018 2.7 189.1 - 686.7 - W WFebruary 2017 W 125.9 - 496.7 - - -
New JerseyFebruary 2018 W 2,845.7 W 349.9 W W 2,111.9January 2018 W 3,006.4 W 434.7 W W WFebruary 2017 3.8 2,991.4 - 312.0 W W 1,602.2
New YorkFebruary 2018 4.6 3,357.9 W 1,727.5 133.9 967.7 1,101.6January 2018 4.7 3,275.2 W 2,456.1 136.7 1,698.4 1,835.2February 2017 5.6 3,317.3 W 1,414.8 W W 982.8
PennsylvaniaFebruary 2018 5.7 2,129.9 - 1,845.6 W W WJanuary 2018 3.1 2,224.5 - 2,406.9 W W WFebruary 2017 5.9 1,929.9 - 1,475.0 W W W
See footnotes at end of table.
U.S. Energy Information Administration�|�Petroleum Marketing Monthly100
May 2018
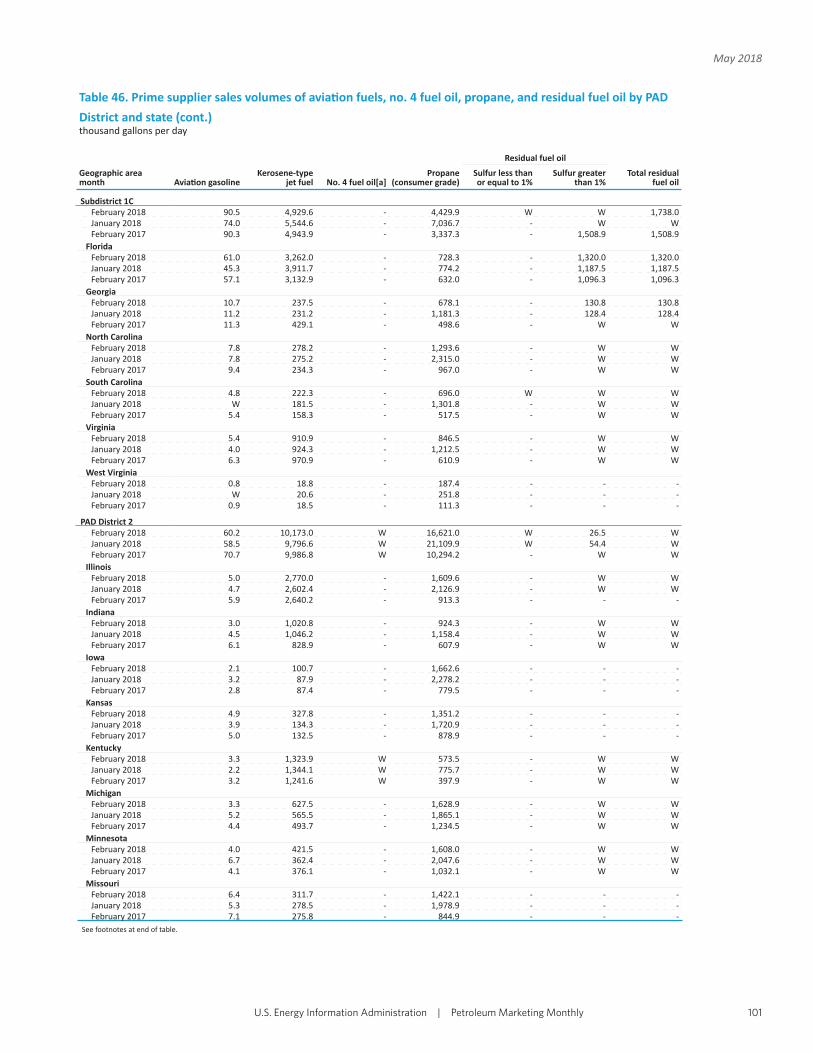
Table 46. Prime supplier sales volumes of avia on fuels, no. 4 fuel oil, propane, and residual fuel oil by PAD District and state (cont.)thousand gallons per day
Geographic area month Avia on gasoline
Kerosene-type jet fuel No. 4 fuel oil[a]
Propane (consumer grade)
Residual fuel oil
Total residual fuel oil
Sulfur less than or equal to 1%
Sulfur greater than 1%
Subdistrict 1CFebruary 2018 90.5 4,929.6 - 4,429.9 W W 1,738.0January 2018 74.0 5,544.6 - 7,036.7 - W WFebruary 2017 90.3 4,943.9 - 3,337.3 - 1,508.9 1,508.9
FloridaFebruary 2018 61.0 3,262.0 - 728.3 - 1,320.0 1,320.0January 2018 45.3 3,911.7 - 774.2 - 1,187.5 1,187.5February 2017 57.1 3,132.9 - 632.0 - 1,096.3 1,096.3
GeorgiaFebruary 2018 10.7 237.5 - 678.1 - 130.8 130.8January 2018 11.2 231.2 - 1,181.3 - 128.4 128.4February 2017 11.3 429.1 - 498.6 - W W
North CarolinaFebruary 2018 7.8 278.2 - 1,293.6 - W WJanuary 2018 7.8 275.2 - 2,315.0 - W WFebruary 2017 9.4 234.3 - 967.0 - W W
South CarolinaFebruary 2018 4.8 222.3 - 696.0 W W WJanuary 2018 W 181.5 - 1,301.8 - W WFebruary 2017 5.4 158.3 - 517.5 - W W
VirginiaFebruary 2018 5.4 910.9 - 846.5 - W WJanuary 2018 4.0 924.3 - 1,212.5 - W WFebruary 2017 6.3 970.9 - 610.9 - W W
West VirginiaFebruary 2018 0.8 18.8 - 187.4 - - -January 2018 W 20.6 - 251.8 - - -February 2017 0.9 18.5 - 111.3 - - -
PAD District 2February 2018 60.2 10,173.0 W 16,621.0 W 26.5 WJanuary 2018 58.5 9,796.6 W 21,109.9 W 54.4 WFebruary 2017 70.7 9,986.8 W 10,294.2 - W W
IllinoisFebruary 2018 5.0 2,770.0 - 1,609.6 - W WJanuary 2018 4.7 2,602.4 - 2,126.9 - W WFebruary 2017 5.9 2,640.2 - 913.3 - - -
IndianaFebruary 2018 3.0 1,020.8 - 924.3 - W WJanuary 2018 4.5 1,046.2 - 1,158.4 - W WFebruary 2017 6.1 828.9 - 607.9 - W W
IowaFebruary 2018 2.1 100.7 - 1,662.6 - - -January 2018 3.2 87.9 - 2,278.2 - - -February 2017 2.8 87.4 - 779.5 - - -
KansasFebruary 2018 4.9 327.8 - 1,351.2 - - -January 2018 3.9 134.3 - 1,720.9 - - -February 2017 5.0 132.5 - 878.9 - - -
KentuckyFebruary 2018 3.3 1,323.9 W 573.5 - W WJanuary 2018 2.2 1,344.1 W 775.7 - W WFebruary 2017 3.2 1,241.6 W 397.9 - W W
MichiganFebruary 2018 3.3 627.5 - 1,628.9 - W WJanuary 2018 5.2 565.5 - 1,865.1 - W WFebruary 2017 4.4 493.7 - 1,234.5 - W W
MinnesotaFebruary 2018 4.0 421.5 - 1,608.0 - W WJanuary 2018 6.7 362.4 - 2,047.6 - W WFebruary 2017 4.1 376.1 - 1,032.1 - W W
MissouriFebruary 2018 6.4 311.7 - 1,422.1 - - -January 2018 5.3 278.5 - 1,978.9 - - -February 2017 7.1 275.8 - 844.9 - - -
See footnotes at end of table.
U.S. Energy Information Administration�|�Petroleum Marketing Monthly 101
May 2018

Table 46. Prime supplier sales volumes of avia on fuels, no. 4 fuel oil, propane, and residual fuel oil by PAD District and state (cont.)thousand gallons per day
Geographic area month Avia on gasolineKerosene-type jet
fuel No. 4 fuel oil[a]Propane (consumer
grade)
Residual fuel oil
Total residual fuel oil
Sulfur less than or equal to 1%
Sulfur greater than 1%
PAD District 2 (cont.)Nebraska
February 2018 2.4 170.4 - 527.3 - W WJanuary 2018 1.5 132.5 - 655.2 - W WFebruary 2017 3.8 125.5 - 249.3 - - -
North DakotaFebruary 2018 3.4 59.6 - 831.2 - - -January 2018 2.5 68.7 - 876.4 - - -February 2017 3.5 102.5 - 497.1 - - -
OhioFebruary 2018 5.6 972.6 - 1,218.8 W - WJanuary 2018 3.5 917.9 - 1,810.0 W - WFebruary 2017 6.7 1,116.1 - 874.3 - - -
OklahomaFebruary 2018 4.7 530.6 - 413.3 - - -January 2018 4.8 821.0 - 470.0 - - -February 2017 4.8 1,070.6 - 207.8 - - -
South DakotaFebruary 2018 2.1 43.4 - 486.6 - W WJanuary 2018 1.5 41.1 - 530.7 - W WFebruary 2017 1.4 48.9 - 203.9 - W W
TennesseeFebruary 2018 7.0 1,314.7 - 483.1 - W WJanuary 2018 6.0 1,233.5 - 642.1 - W WFebruary 2017 7.1 1,285.8 - 318.9 - W W
WisconsinFebruary 2018 3.1 177.9 - 1,880.5 - W WJanuary 2018 2.9 160.5 - 2,173.6 - W WFebruary 2017 5.0 161.3 - 1,253.8 - W W
PAD District 3February 2018 57.3 17,237.5 - 11,584.5 344.1 3,294.0 3,638.1January 2018 86.3 16,413.0 - 14,076.4 W W 4,865.5February 2017 63.6 12,426.9 - 13,207.2 W W 2,860.7
AlabamaFebruary 2018 6.0 261.2 - 446.6 - W WJanuary 2018 5.3 444.5 - 787.5 W 137.5 WFebruary 2017 5.6 305.9 - 267.0 - 79.9 79.9
ArkansasFebruary 2018 2.2 141.8 - 281.5 - - -January 2018 W 100.6 - 445.8 - - -February 2017 3.6 132.3 - 214.7 W - W
LouisianaFebruary 2018 3.8 3,605.3 - 898.5 - 685.3 685.3January 2018 5.2 3,844.1 - 958.1 - 938.8 938.8February 2017 7.0 2,917.9 - 852.6 W W 752.1
MississippiFebruary 2018 1.9 1,783.4 - 346.4 - W WJanuary 2018 W 1,675.8 - 727.8 - W WFebruary 2017 4.3 1,579.1 - 223.5 - W W
New MexicoFebruary 2018 4.4 128.8 - 243.1 - - -January 2018 4.5 122.0 - 253.3 - - -February 2017 3.4 113.8 - 210.4 - - -
TexasFebruary 2018 38.9 11,317.0 - 9,368.5 W W 2,849.1January 2018 36.7 10,226.0 - 10,903.8 W W 3,675.3February 2017 39.8 7,378.0 - 11,439.0 W W 1,974.6
See footnotes at end of table.
U.S. Energy Information Administration�|�Petroleum Marketing Monthly102
May 2018
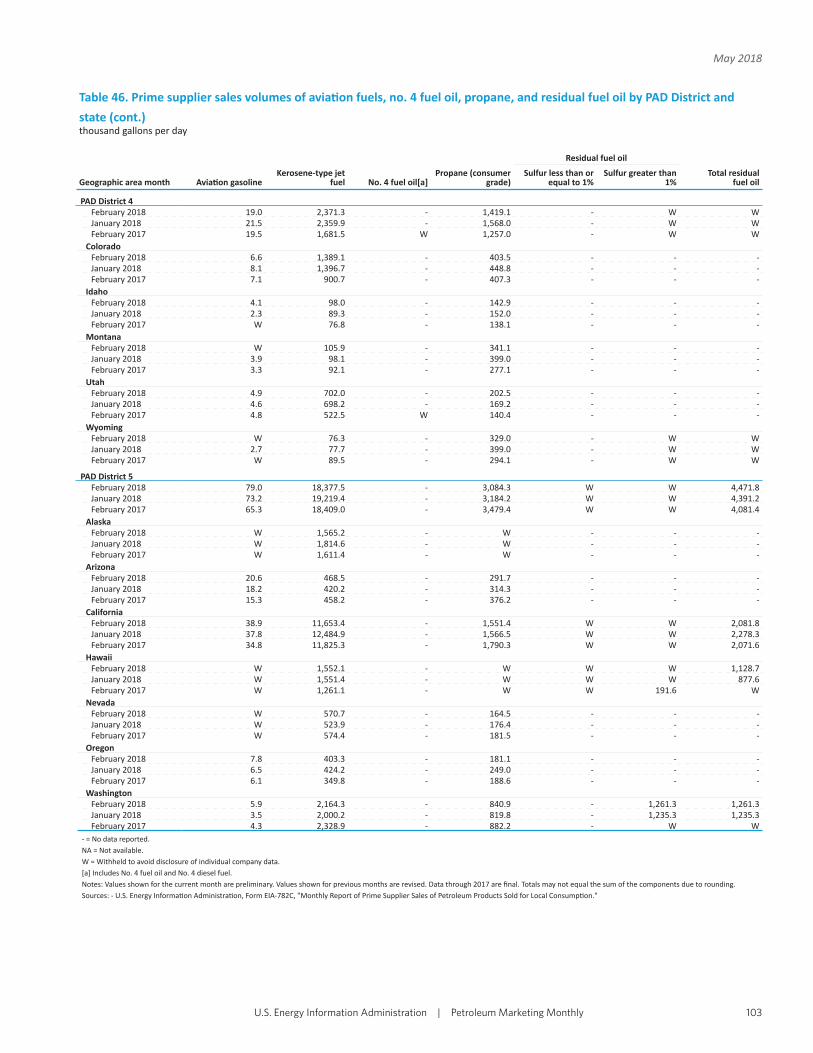
Table 46. Prime supplier sales volumes of avia on fuels, no. 4 fuel oil, propane, and residual fuel oil by PAD District and state (cont.)thousand gallons per day
Geographic area month Avia on gasolineKerosene-type jet
fuel No. 4 fuel oil[a]Propane (consumer
grade)
Residual fuel oil
Total residual fuel oil
Sulfur less than or equal to 1%
Sulfur greater than 1%
PAD District 4February 2018 19.0 2,371.3 - 1,419.1 - W WJanuary 2018 21.5 2,359.9 - 1,568.0 - W WFebruary 2017 19.5 1,681.5 W 1,257.0 - W W
ColoradoFebruary 2018 6.6 1,389.1 - 403.5 - - -January 2018 8.1 1,396.7 - 448.8 - - -February 2017 7.1 900.7 - 407.3 - - -
IdahoFebruary 2018 4.1 98.0 - 142.9 - - -January 2018 2.3 89.3 - 152.0 - - -February 2017 W 76.8 - 138.1 - - -
MontanaFebruary 2018 W 105.9 - 341.1 - - -January 2018 3.9 98.1 - 399.0 - - -February 2017 3.3 92.1 - 277.1 - - -
UtahFebruary 2018 4.9 702.0 - 202.5 - - -January 2018 4.6 698.2 - 169.2 - - -February 2017 4.8 522.5 W 140.4 - - -
WyomingFebruary 2018 W 76.3 - 329.0 - W WJanuary 2018 2.7 77.7 - 399.0 - W WFebruary 2017 W 89.5 - 294.1 - W W
PAD District 5February 2018 79.0 18,377.5 - 3,084.3 W W 4,471.8January 2018 73.2 19,219.4 - 3,184.2 W W 4,391.2February 2017 65.3 18,409.0 - 3,479.4 W W 4,081.4
AlaskaFebruary 2018 W 1,565.2 - W - - -January 2018 W 1,814.6 - W - - -February 2017 W 1,611.4 - W - - -
ArizonaFebruary 2018 20.6 468.5 - 291.7 - - -January 2018 18.2 420.2 - 314.3 - - -February 2017 15.3 458.2 - 376.2 - - -
CaliforniaFebruary 2018 38.9 11,653.4 - 1,551.4 W W 2,081.8January 2018 37.8 12,484.9 - 1,566.5 W W 2,278.3February 2017 34.8 11,825.3 - 1,790.3 W W 2,071.6
HawaiiFebruary 2018 W 1,552.1 - W W W 1,128.7January 2018 W 1,551.4 - W W W 877.6February 2017 W 1,261.1 - W W 191.6 W
NevadaFebruary 2018 W 570.7 - 164.5 - - -January 2018 W 523.9 - 176.4 - - -February 2017 W 574.4 - 181.5 - - -
OregonFebruary 2018 7.8 403.3 - 181.1 - - -January 2018 6.5 424.2 - 249.0 - - -February 2017 6.1 349.8 - 188.6 - - -
WashingtonFebruary 2018 5.9 2,164.3 - 840.9 - 1,261.3 1,261.3January 2018 3.5 2,000.2 - 819.8 - 1,235.3 1,235.3February 2017 4.3 2,328.9 - 882.2 - W W
- = No data reported.NA = Not available.W = Withheld to avoid disclosure of individual company data.[a] Includes No. 4 fuel oil and No. 4 diesel fuel.Notes: Values shown for the current month are preliminary. Values shown for previous months are revised. Data through 2017 are fi nal. Totals may not equal the sum of the components due to rounding.Sources: - U.S. Energy Informa on Administra on, Form EIA-782C, "Monthly Report of Prime Supplier Sales of Petroleum Products Sold for Local Consump on."
U.S. Energy Information Administration�|�Petroleum Marketing Monthly 103
May 2018
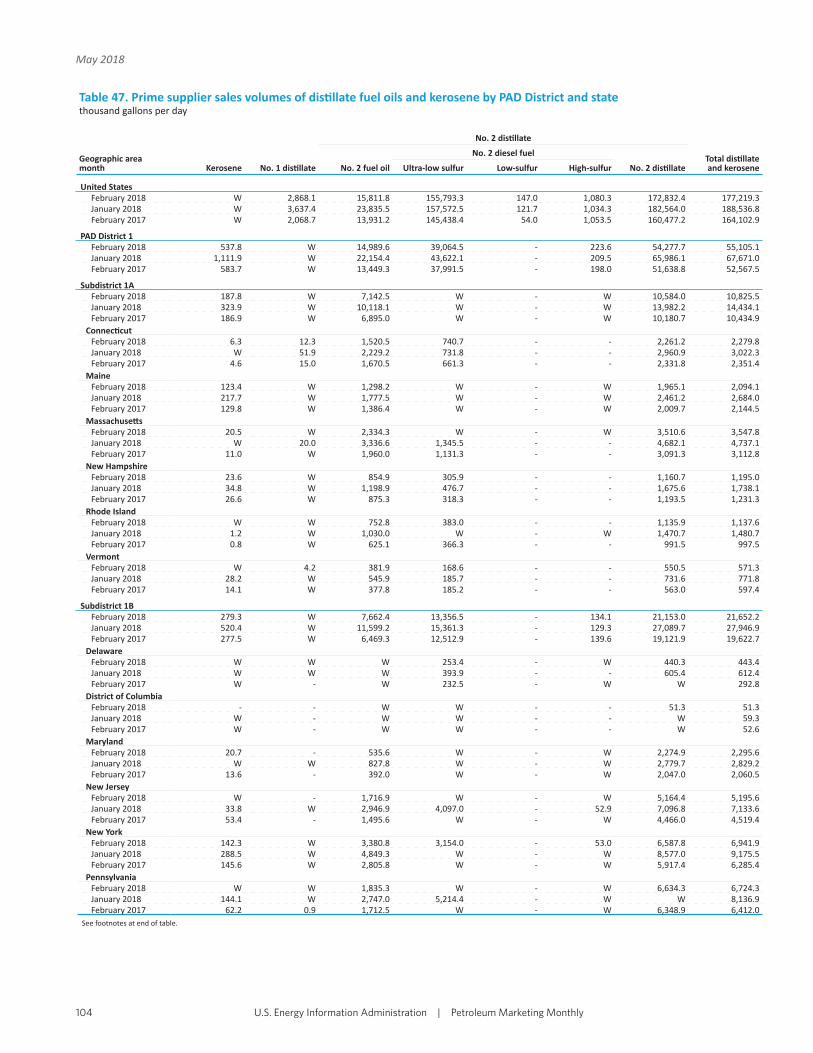
Table 47. Prime supplier sales volumes of dis llate fuel oils and kerosene by PAD District and statethousand gallons per day
Geographic area month Kerosene No. 1 dis llate
No. 2 dis llate
Total dis llate and keroseneNo. 2 fuel oil
No. 2 diesel fuel
No. 2 dis llateUltra-low sulfur Low-sulfur High-sulfur
United StatesFebruary 2018 W 2,868.1 15,811.8 155,793.3 147.0 1,080.3 172,832.4 177,219.3January 2018 W 3,637.4 23,835.5 157,572.5 121.7 1,034.3 182,564.0 188,536.8February 2017 W 2,068.7 13,931.2 145,438.4 54.0 1,053.5 160,477.2 164,102.9
PAD District 1February 2018 537.8 W 14,989.6 39,064.5 - 223.6 54,277.7 55,105.1January 2018 1,111.9 W 22,154.4 43,622.1 - 209.5 65,986.1 67,671.0February 2017 583.7 W 13,449.3 37,991.5 - 198.0 51,638.8 52,567.5
Subdistrict 1AFebruary 2018 187.8 W 7,142.5 W - W 10,584.0 10,825.5January 2018 323.9 W 10,118.1 W - W 13,982.2 14,434.1February 2017 186.9 W 6,895.0 W - W 10,180.7 10,434.9
Connec cutFebruary 2018 6.3 12.3 1,520.5 740.7 - - 2,261.2 2,279.8January 2018 W 51.9 2,229.2 731.8 - - 2,960.9 3,022.3February 2017 4.6 15.0 1,670.5 661.3 - - 2,331.8 2,351.4
MaineFebruary 2018 123.4 W 1,298.2 W - W 1,965.1 2,094.1January 2018 217.7 W 1,777.5 W - W 2,461.2 2,684.0February 2017 129.8 W 1,386.4 W - W 2,009.7 2,144.5
Massachuse sFebruary 2018 20.5 W 2,334.3 W - W 3,510.6 3,547.8January 2018 W 20.0 3,336.6 1,345.5 - - 4,682.1 4,737.1February 2017 11.0 W 1,960.0 1,131.3 - - 3,091.3 3,112.8
New HampshireFebruary 2018 23.6 W 854.9 305.9 - - 1,160.7 1,195.0January 2018 34.8 W 1,198.9 476.7 - - 1,675.6 1,738.1February 2017 26.6 W 875.3 318.3 - - 1,193.5 1,231.3
Rhode IslandFebruary 2018 W W 752.8 383.0 - - 1,135.9 1,137.6January 2018 1.2 W 1,030.0 W - W 1,470.7 1,480.7February 2017 0.8 W 625.1 366.3 - - 991.5 997.5
VermontFebruary 2018 W 4.2 381.9 168.6 - - 550.5 571.3January 2018 28.2 W 545.9 185.7 - - 731.6 771.8February 2017 14.1 W 377.8 185.2 - - 563.0 597.4
Subdistrict 1BFebruary 2018 279.3 W 7,662.4 13,356.5 - 134.1 21,153.0 21,652.2January 2018 520.4 W 11,599.2 15,361.3 - 129.3 27,089.7 27,946.9February 2017 277.5 W 6,469.3 12,512.9 - 139.6 19,121.9 19,622.7
DelawareFebruary 2018 W W W 253.4 - W 440.3 443.4January 2018 W W W 393.9 - - 605.4 612.4February 2017 W - W 232.5 - W W 292.8
District of ColumbiaFebruary 2018 - - W W - - 51.3 51.3January 2018 W - W W - - W 59.3February 2017 W - W W - - W 52.6
MarylandFebruary 2018 20.7 - 535.6 W - W 2,274.9 2,295.6January 2018 W W 827.8 W - W 2,779.7 2,829.2February 2017 13.6 - 392.0 W - W 2,047.0 2,060.5
New JerseyFebruary 2018 W - 1,716.9 W - W 5,164.4 5,195.6January 2018 33.8 W 2,946.9 4,097.0 - 52.9 7,096.8 7,133.6February 2017 53.4 - 1,495.6 W - W 4,466.0 4,519.4
New YorkFebruary 2018 142.3 W 3,380.8 3,154.0 - 53.0 6,587.8 6,941.9January 2018 288.5 W 4,849.3 W - W 8,577.0 9,175.5February 2017 145.6 W 2,805.8 W - W 5,917.4 6,285.4
PennsylvaniaFebruary 2018 W W 1,835.3 W - W 6,634.3 6,724.3January 2018 144.1 W 2,747.0 5,214.4 - W W 8,136.9February 2017 62.2 0.9 1,712.5 W - W 6,348.9 6,412.0
See footnotes at end of table.
U.S. Energy Information Administration�|�Petroleum Marketing Monthly104
May 2018
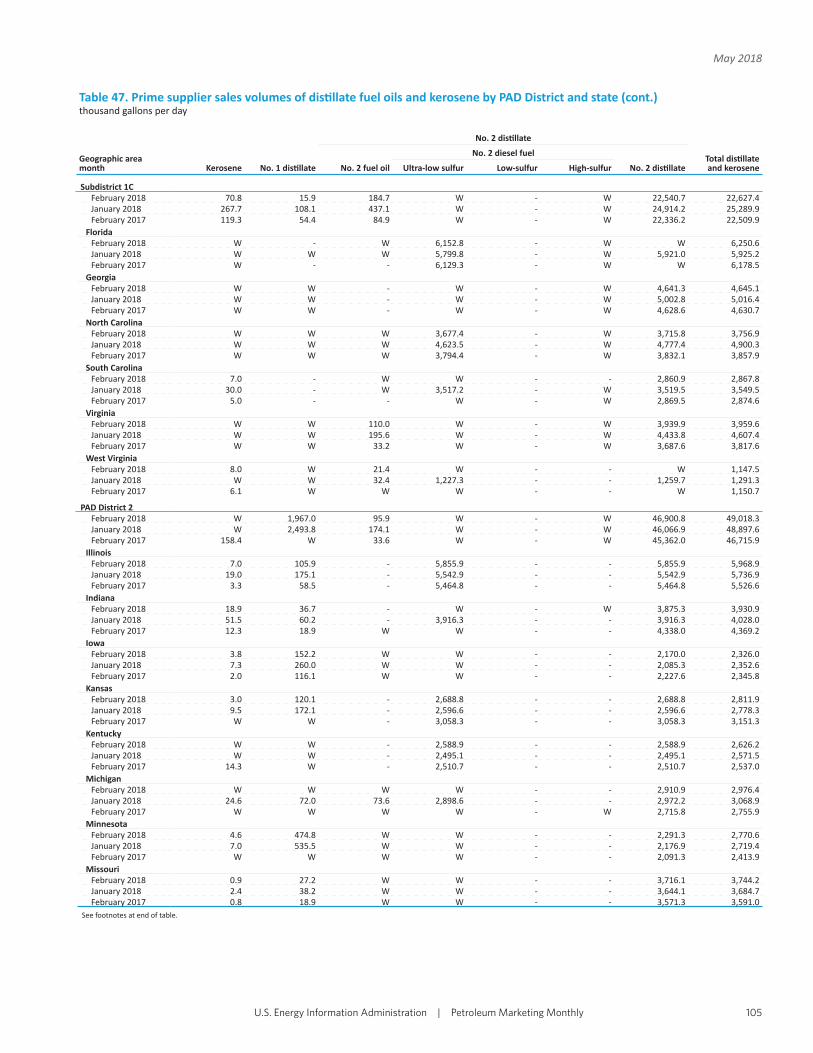
Table 47. Prime supplier sales volumes of dis llate fuel oils and kerosene by PAD District and state (cont.)thousand gallons per day
Geographic area month Kerosene No. 1 dis llate
No. 2 dis llate
Total dis llate and keroseneNo. 2 fuel oil
No. 2 diesel fuel
No. 2 dis llateUltra-low sulfur Low-sulfur High-sulfur
Subdistrict 1CFebruary 2018 70.8 15.9 184.7 W - W 22,540.7 22,627.4January 2018 267.7 108.1 437.1 W - W 24,914.2 25,289.9February 2017 119.3 54.4 84.9 W - W 22,336.2 22,509.9
FloridaFebruary 2018 W - W 6,152.8 - W W 6,250.6January 2018 W W W 5,799.8 - W 5,921.0 5,925.2February 2017 W - - 6,129.3 - W W 6,178.5
GeorgiaFebruary 2018 W W - W - W 4,641.3 4,645.1January 2018 W W - W - W 5,002.8 5,016.4February 2017 W W - W - W 4,628.6 4,630.7
North CarolinaFebruary 2018 W W W 3,677.4 - W 3,715.8 3,756.9January 2018 W W W 4,623.5 - W 4,777.4 4,900.3February 2017 W W W 3,794.4 - W 3,832.1 3,857.9
South CarolinaFebruary 2018 7.0 - W W - - 2,860.9 2,867.8January 2018 30.0 - W 3,517.2 - W 3,519.5 3,549.5February 2017 5.0 - - W - W 2,869.5 2,874.6
VirginiaFebruary 2018 W W 110.0 W - W 3,939.9 3,959.6January 2018 W W 195.6 W - W 4,433.8 4,607.4February 2017 W W 33.2 W - W 3,687.6 3,817.6
West VirginiaFebruary 2018 8.0 W 21.4 W - - W 1,147.5January 2018 W W 32.4 1,227.3 - - 1,259.7 1,291.3February 2017 6.1 W W W - - W 1,150.7
PAD District 2February 2018 W 1,967.0 95.9 W - W 46,900.8 49,018.3January 2018 W 2,493.8 174.1 W - W 46,066.9 48,897.6February 2017 158.4 W 33.6 W - W 45,362.0 46,715.9
IllinoisFebruary 2018 7.0 105.9 - 5,855.9 - - 5,855.9 5,968.9January 2018 19.0 175.1 - 5,542.9 - - 5,542.9 5,736.9February 2017 3.3 58.5 - 5,464.8 - - 5,464.8 5,526.6
IndianaFebruary 2018 18.9 36.7 - W - W 3,875.3 3,930.9January 2018 51.5 60.2 - 3,916.3 - - 3,916.3 4,028.0February 2017 12.3 18.9 W W - - 4,338.0 4,369.2
IowaFebruary 2018 3.8 152.2 W W - - 2,170.0 2,326.0January 2018 7.3 260.0 W W - - 2,085.3 2,352.6February 2017 2.0 116.1 W W - - 2,227.6 2,345.8
KansasFebruary 2018 3.0 120.1 - 2,688.8 - - 2,688.8 2,811.9January 2018 9.5 172.1 - 2,596.6 - - 2,596.6 2,778.3February 2017 W W - 3,058.3 - - 3,058.3 3,151.3
KentuckyFebruary 2018 W W - 2,588.9 - - 2,588.9 2,626.2January 2018 W W - 2,495.1 - - 2,495.1 2,571.5February 2017 14.3 W - 2,510.7 - - 2,510.7 2,537.0
MichiganFebruary 2018 W W W W - - 2,910.9 2,976.4January 2018 24.6 72.0 73.6 2,898.6 - - 2,972.2 3,068.9February 2017 W W W W - W 2,715.8 2,755.9
MinnesotaFebruary 2018 4.6 474.8 W W - - 2,291.3 2,770.6January 2018 7.0 535.5 W W - - 2,176.9 2,719.4February 2017 W W W W - - 2,091.3 2,413.9
MissouriFebruary 2018 0.9 27.2 W W - - 3,716.1 3,744.2January 2018 2.4 38.2 W W - - 3,644.1 3,684.7February 2017 0.8 18.9 W W - - 3,571.3 3,591.0
See footnotes at end of table.
U.S. Energy Information Administration�|�Petroleum Marketing Monthly 105
May 2018

Table 47. Prime supplier sales volumes of dis llate fuel oils and kerosene by PAD District and state (cont.)thousand gallons per day
Geographic area month Kerosene No. 1 dis llate
No. 2 dis llate
Total dis llate and keroseneNo. 2 fuel oil
No. 2 diesel fuel
No. 2 dis llateUltra-low sulfur Low-sulfur High-sulfur
PAD District 2 (cont.)Nebraska
February 2018 W W - 1,681.4 - - 1,681.4 1,793.5January 2018 W W - 1,508.1 - - 1,508.1 1,691.5February 2017 W W - 1,652.0 - - 1,652.0 1,735.7
North DakotaFebruary 2018 W W W W - - 1,611.6 2,156.2January 2018 W W W W - - 1,372.6 1,911.7February 2017 0.5 339.8 W W - - 1,395.1 1,735.4
OhioFebruary 2018 W W NA W - W 5,746.0 5,813.6January 2018 W W W W - W 5,688.8 5,825.9February 2017 W W W W - - 5,662.0 5,692.9
OklahomaFebruary 2018 W W W W - - 5,107.6 5,119.9January 2018 W W W W - - 5,466.8 5,476.8February 2017 W W W W - - 4,137.1 4,140.8
South DakotaFebruary 2018 W W W W - - 611.5 759.9January 2018 W W W W - - 551.7 717.6February 2017 W W W W - - 604.9 685.9
TennesseeFebruary 2018 W W - 3,344.9 - - 3,344.9 3,353.6January 2018 W W - 3,400.1 - - 3,400.1 3,441.0February 2017 6.2 - - 3,447.9 - - 3,447.9 3,454.1
WisconsinFebruary 2018 4.0 162.0 W W - - 2,700.6 2,866.5January 2018 7.7 235.7 W W - - 2,649.4 2,892.9February 2017 8.9 86.7 W W - - 2,485.0 2,580.6
PAD District 3February 2018 W W 621.9 41,989.4 W W 43,084.5 43,700.7January 2018 593.9 2.4 1,392.7 41,218.3 W W 42,951.2 43,547.5February 2017 576.1 1.6 345.1 35,165.6 W W 35,774.9 36,352.6
AlabamaFebruary 2018 W - - 2,616.4 W W W 2,730.2January 2018 W - - 2,650.1 W W W 2,752.3February 2017 W - - 2,735.8 - W W 2,754.0
ArkansasFebruary 2018 W W W W - - 2,065.9 2,066.3January 2018 W W W W - - 2,025.4 2,027.6February 2017 - - W W - - 2,177.3 2,177.3
LouisianaFebruary 2018 W W 337.5 6,282.9 - 79.5 6,699.9 7,286.8January 2018 W W 797.9 6,126.8 - 58.5 6,983.3 7,518.4February 2017 W W W 4,802.1 - W 4,931.8 5,494.1
MississippiFebruary 2018 W W W W - W W 1,929.2January 2018 W W W W - W 1,997.6 2,000.2February 2017 W W - W - W 2,252.6 2,253.1
New MexicoFebruary 2018 - W - W - - W 2,065.8January 2018 - W - W - - W 1,926.0February 2017 - W - W - - W 1,939.3
TexasFebruary 2018 W W 92.6 27,223.4 W W 27,617.1 27,622.4January 2018 W W 420.9 26,672.3 W W 27,315.8 27,323.0February 2017 W W W 21,270.8 W W 21,732.7 21,734.8
See footnotes at end of table.
U.S. Energy Information Administration�|�Petroleum Marketing Monthly106
May 2018
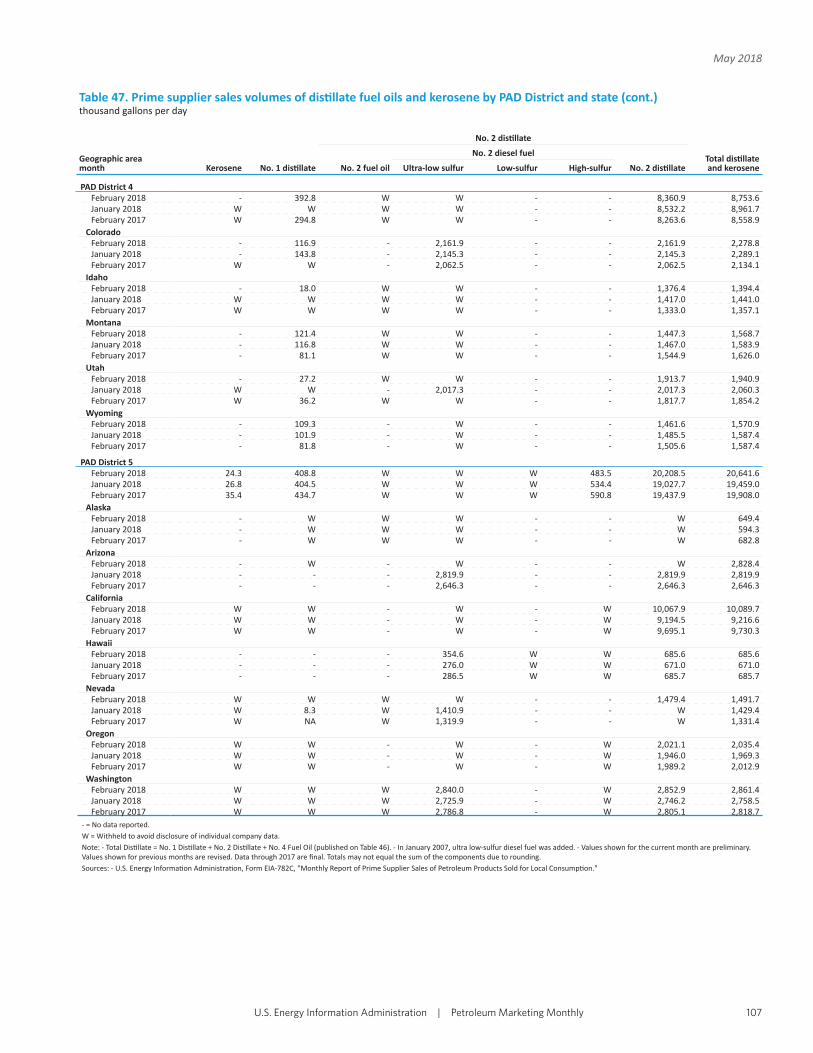
Table 47. Prime supplier sales volumes of dis llate fuel oils and kerosene by PAD District and state (cont.)thousand gallons per day
Geographic area month Kerosene No. 1 dis llate
No. 2 dis llate
Total dis llate and keroseneNo. 2 fuel oil
No. 2 diesel fuel
No. 2 dis llateUltra-low sulfur Low-sulfur High-sulfur
PAD District 4February 2018 - 392.8 W W - - 8,360.9 8,753.6January 2018 W W W W - - 8,532.2 8,961.7February 2017 W 294.8 W W - - 8,263.6 8,558.9
ColoradoFebruary 2018 - 116.9 - 2,161.9 - - 2,161.9 2,278.8January 2018 - 143.8 - 2,145.3 - - 2,145.3 2,289.1February 2017 W W - 2,062.5 - - 2,062.5 2,134.1
IdahoFebruary 2018 - 18.0 W W - - 1,376.4 1,394.4January 2018 W W W W - - 1,417.0 1,441.0February 2017 W W W W - - 1,333.0 1,357.1
MontanaFebruary 2018 - 121.4 W W - - 1,447.3 1,568.7January 2018 - 116.8 W W - - 1,467.0 1,583.9February 2017 - 81.1 W W - - 1,544.9 1,626.0
UtahFebruary 2018 - 27.2 W W - - 1,913.7 1,940.9January 2018 W W - 2,017.3 - - 2,017.3 2,060.3February 2017 W 36.2 W W - - 1,817.7 1,854.2
WyomingFebruary 2018 - 109.3 - W - - 1,461.6 1,570.9January 2018 - 101.9 - W - - 1,485.5 1,587.4February 2017 - 81.8 - W - - 1,505.6 1,587.4
PAD District 5February 2018 24.3 408.8 W W W 483.5 20,208.5 20,641.6January 2018 26.8 404.5 W W W 534.4 19,027.7 19,459.0February 2017 35.4 434.7 W W W 590.8 19,437.9 19,908.0
AlaskaFebruary 2018 - W W W - - W 649.4January 2018 - W W W - - W 594.3February 2017 - W W W - - W 682.8
ArizonaFebruary 2018 - W - W - - W 2,828.4January 2018 - - - 2,819.9 - - 2,819.9 2,819.9February 2017 - - - 2,646.3 - - 2,646.3 2,646.3
CaliforniaFebruary 2018 W W - W - W 10,067.9 10,089.7January 2018 W W - W - W 9,194.5 9,216.6February 2017 W W - W - W 9,695.1 9,730.3
HawaiiFebruary 2018 - - - 354.6 W W 685.6 685.6January 2018 - - - 276.0 W W 671.0 671.0February 2017 - - - 286.5 W W 685.7 685.7
NevadaFebruary 2018 W W W W - - 1,479.4 1,491.7January 2018 W 8.3 W 1,410.9 - - W 1,429.4February 2017 W NA W 1,319.9 - - W 1,331.4
OregonFebruary 2018 W W - W - W 2,021.1 2,035.4January 2018 W W - W - W 1,946.0 1,969.3February 2017 W W - W - W 1,989.2 2,012.9
WashingtonFebruary 2018 W W W 2,840.0 - W 2,852.9 2,861.4January 2018 W W W 2,725.9 - W 2,746.2 2,758.5February 2017 W W W 2,786.8 - W 2,805.1 2,818.7
- = No data reported.W = Withheld to avoid disclosure of individual company data.Note: - Total Dis llate = No. 1 Dis llate + No. 2 Dis llate + No. 4 Fuel Oil (published on Table 46). - In January 2007, ultra low-sulfur diesel fuel was added. - Values shown for the current month are preliminary. Values shown for previous months are revised. Data through 2017 are fi nal. Totals may not equal the sum of the components due to rounding.Sources: - U.S. Energy Informa on Administra on, Form EIA-782C, "Monthly Report of Prime Supplier Sales of Petroleum Products Sold for Local Consump on."
U.S. Energy Information Administration�|�Petroleum Marketing Monthly 107
May 2018