petroleum supply monthly - energy information administration · the petroleum supply monthly ......
TRANSCRIPT

Petroleum Supply Monthly with data for April 2018
June 2018
www.eia.gov
U.S. Department of Energy
Washington, DC 20585

Energy Information Administration/Petroleum Supply Monthly,ii April 2018
This report was prepared by the U.S. Energy Information Administration (EIA), the statistical and analytical agency within the U.S. Department of Energy. By law, EIA’s data, analyses, and forecasts are independent of approval by any other officer or employee of the United States Government. The views in this report therefore should not be construed as representing those of the Department of Energy or other Federal agencies.

Energy Information Administration/Petroleum Supply Monthly, iii April 2018
Preface
The Petroleum Supply Monthly (PSM) is the monthly component of a series of three publications produced by the Office of Petroleum and Biofuels Statistics of the U.S. Energy Information Administration (EIA). The other two components are the Weekly Petroleum Status Report (WPSR) and the Petroleum Supply Annual (PSA). Together these publications present comprehensive petroleum and biofuel supply data on a weekly, monthly and annual basis.
Data presented in the PSM describe the supply and disposition of petroleum products in the United States and major U.S. geographic regions. The data series describe production, imports and exports, inter-Petroleum Administration for Defense (PAD)District movements, and inventories by the primary suppliers of petroleum products in the United States (50 States and the District of Columbia). The reporting universe includes those petroleum sectors in primary supply. Included are: petroleum refiners, motor gasoline blenders, oxygenate producers, operators of natural gas processing plants and fractionators, inter-PAD District transporters, importers, and major inventory holders of crude oil, petroleum products, and biofuels. When aggregated, the data reported by these sectors approximately represent the consumption of petroleum products in the United States.
Scope of data
The PSM presents statistics for the most current month available as well as year-to-date. In most cases, the statistics are presented for several geographic areas - - the United States (50 States and the District of Columbia), five PAD Districts, and 12 Refining Districts. At the U.S. and PAD District levels, the total volume and the daily rate of activities are presented. The statistics are developed from monthly survey forms submitted by respondents to the EIA and from data provided from other sources including federal and state agencies.
Sections
• U.S. supply and disposition of crude oil, petroleum products, and biofuels• Regional supply and disposition of crude oil, petroleum products, and biofuels• Crude oil supply and disposition and production by state• Natural Gas Processing• Refinery Operations• Imports of residual fuel oil by state of entry• Imports by PADD• Imports by country of origin• Exports• Net imports• Stocks• Movements of crude oil, petroleum products, and biofuels

Energy Information Administration/Petroleum Supply Monthly,iv April 2018
ContentsPage
TablesU.S. supply and disposition of crude oil, petroleum products, and biofuels1. U.S. Supply, Disposition, and Ending Stocks of Crude Oil and Petroleum Products .........................................................................................72. U.S. Year-to-Date Supply, Disposition, and Ending Stocks of Crude Oil and Petroleum Products ................................................................83. U.S. Daily Average Supply and Disposition of Crude Oil and Petroleum Products ............................................................................................94. U.S. Year-to-Date Daily Average Supply and Disposition of Crude Oil and Petroleum Products ............................................................... 10Regional supply and disposition of crude oil petroleum products and biofuels5. PAD District 1 ............................................................................................................................................................................................................................116. Year-to-Date PAD District 1 .................................................................................................................................................................................................. 127. Daily Average PAD District 1 ............................................................................................................................................................................................... 138. Year-to-Date Daily Average PAD District 1 ..................................................................................................................................................................... 149. PAD District 2 ............................................................................................................................................................................................................................1510. Year-to-Date PAD District 2 .................................................................................................................................................................................................. 1611. Daily Average PAD District 2 ............................................................................................................................................................................................... 1712. Year-to-Date Daily Average PAD District 2 ..................................................................................................................................................................... 1813. PAD District 3 ............................................................................................................................................................................................................................1914. Year-to-Date PAD District 3 .................................................................................................................................................................................................. 2015. Daily Average PAD District 3 ............................................................................................................................................................................................... 2116. Year-to-Date Daily Average PAD District 3 ..................................................................................................................................................................... 2217. PAD District 4 ............................................................................................................................................................................................................................2318. Year-to-Date PAD District 4 .................................................................................................................................................................................................. 2419. Daily Average PAD District 4 ............................................................................................................................................................................................... 2520. Year-to-Date Daily Average PAD District 4 ..................................................................................................................................................................... 2621. PAD District 5 ............................................................................................................................................................................................................................2722. Year-to-Date PAD District 5 .................................................................................................................................................................................................. 2823. Daily Average PAD District 5 ............................................................................................................................................................................................... 2924. Year-to-Date Daily Average PAD District 5 ..................................................................................................................................................................... 30Crude oil supply and disposition and production by state25. Crude Oil Supply, Disposition, and Ending Stocks by PAD District....................................................................................................................... 3126. Production of Crude Oil by PAD District and State ..................................................................................................................................................... 32Natural Gas Processing27. Natural Gas Plant Net Production and Stocks of Petroleum Products by PAD and Refining Districts ..................................................... 33Refinery Operations28. Refinery and Blender Net Input of Crude Oil and Petroleum Products by PAD and Refining Districts ................................................... 3429. Refinery and Blender Net Production of Finished Petroleum Products by PAD and Refining Districts .................................................. 3630. Refinery Net Input of Crude Oil and Petroleum Products by PAD and Refining Districts ............................................................................. 3831. Refinery Net Production of Finished Petroleum Products by PAD and Refining Districts ............................................................................ 4032. Blender Net Inputs of Petroleum Products by PAD District ..................................................................................................................................... 4233. Blender Net Production of Petroleum Products by PAD District ........................................................................................................................... 4334. Refinery Stocks of Crude Oil and Petroleum Products by PAD and Refining Districts ................................................................................... 4435. Percent Yield of Petroleum Products by PAD and Refining Districts .................................................................................................................... 46Imports of residual fuel oil by state of entry36. Imports of Residual Fuel Oil by Sulfur Content ............................................................................................................................................................ 47Imports by PAD District37. Imports of Crude Oil and Petroleum Products ............................................................................................................................................................ 4838. Year-to-Date Imports of Crude Oil and Petroleum Products ................................................................................................................................... 49Imports by country of origin39. United States ............................................................................................................................................................................................................................5040. Year-to-Date United States ..................................................................................................................................................................................................5441. PAD District 1 ............................................................................................................................................................................................................................5842. PAD District 2 ............................................................................................................................................................................................................................6243. PAD District 3 ............................................................................................................................................................................................................................6644. PAD Districts 4 and 5 ..............................................................................................................................................................................................................7045. Year-to-Date PAD District 1 .................................................................................................................................................................................................. 7446. Year-to-Date PAD District 2 .................................................................................................................................................................................................. 7847. Year-to-Date PAD District 3 .................................................................................................................................................................................................. 82
Energy Information Administration/Petroleum Supply Monthly, v April 2018
48. Year-to-Date PAD Districts 4 and 5 ................................................................................................................................................................................... 86Exports of Crude Oil and Petroleum Products49. Exports of Crude Oil and Petroleum Products by PAD District .............................................................................................................................. 9050. Year-to-Date Exports of Crude Oil and Petroleum Products by PAD District..................................................................................................... 9151. Exports of Crude Oil and Petroleum Products by Destination ............................................................................................................................... 9252. Year-to-Date Exports of Crude Oil and Petroleum Products by Destination ..................................................................................................... 96Net Imports53. Net Imports of Crude Oil and Petroleum Products into the United States by Country ..............................................................................10054. Year-to-Date Net Imports of Crude Oil and Petroleum Products into the United States by Country.....................................................104Stocks55. Stocks of Crude Oil and Petroleum Products by PAD District ...............................................................................................................................10856. Refinery, Bulk Terminal, and Natural Gas Plant Stocks of Selected Petroleum Products by PAD District and State .........................111Movements of Crude Oil, Petroleum Products, and Biofuels57. Movements of Crude Oil and Petroleum Products by Pipeline, Tanker, Barge and Rail Between PAD Districts ................................11358. Movements of Crude Oil and Petroleum Products by Pipeline Between PAD Districts ..............................................................................11559. Movements of Crude Oil and Petroleum Products by Tanker and Barge Between PAD Districts ............................................................11760. Movements of Crude Oil and Selected Products by Rail Between PAD Districts ...........................................................................................11961. Movements of Crude Oil by Pipeline, Tanker, Barge, and Rail between PAD Districts .................................................................................12062. Net Movements of Crude Oil and Petroleum Products by Pipeline, Tanker, Barge, and Rail Between PAD Districts .......................121
AppendicesA. District Descriptions and Maps ......................................................................................................................................................................................................123B. Explanatory Notes ...............................................................................................................................................................................................................................124D. Northeast Reserves .............................................................................................................................................................................................................................136GlossaryDefinitions of Petroleum Products and Other Terms ..................................................................................................................................................................137

Energy Information Administration/Petroleum Supply Monthly,6 April 2018
Table 1. U.S. Supply, Disposition, and Ending Stocks of Crude Oil and Petroleum Products, April 2018(Thousand Barrels)
Commodity
Supply Disposition
EndingStocks
FieldProduction
RenewableFuels andOxygenatePlant Net
Production
Refineryand
BlenderNet
Production ImportsAdjust-ments1
StockChange2
Refineryand
BlenderNet
Inputs ExportsProductsSupplied3
Crude Oil4 ............................................................ 314,010 – – – – 247,330 4,420 10,119 502,972 52,668 0 1,099,023
Hydrocarbon Gas Liquids .................................. 127,795 -607 24,009 5,033 – – 6,092 14,895 50,345 84,898 145,374Natural Gas Liquids .......................................... 127,795 -607 15,367 4,566 – – 6,106 14,895 50,345 75,775 139,733
Ethane .......................................................... 51,576 – – 182 – – – -1,772 – – 9,560 43,970 48,488Propane ........................................................ 40,505 – – 9,210 3,933 – – 1,034 – – 28,179 24,435 34,836Normal Butane .............................................. 10,040 – – 6,366 349 – – 7,328 3,015 5,129 1,283 29,027Isobutane ...................................................... 11,500 – – -391 280 – – -23 7,101 648 3,663 8,487Natural Gasoline ........................................... 14,174 -607 – – 4 – – -461 4,779 6,828 2,425 18,895
Refinery Olefins ................................................ – – – – 8,642 467 – – -14 – – – – 9,123 5,641Ethylene ........................................................ – – – – – – – – 0 – – – – 0 0Propylene ..................................................... – – – – 8,573 302 – – 298 – – – – 8,577 4,144Butylene ........................................................ – – – – 71 165 – – -338 – – – – 574 1,470Isobutylene ................................................... – – – – -2 – – – 26 – – – – -28 27
Other Liquids ...................................................... – – 36,421 – – 41,944 1,890 -3,579 69,056 18,167 -3,388 341,812Hydrogen/Oxygenates/Renewables/Other Hydrocarbons ......................................... – – 36,425 – – 839 4,867 -113 36,190 6,055 0 30,413
Hydrogen ...................................................... – – – – – – – 6,825 – – 6,825 – 0 – –Oxygenates (excluding Fuel Ethanol) ........... – – 2,549 – – 79 -1,133 -476 – 1,971 0 1,235Renewable Fuels (including Fuel Ethanol) ... – – 33,876 – – 754 -853 364 29,330 4,084 0 29,147
Fuel Ethanol5 ............................................ – – 30,532 – – – 1,146 373 27,439 3,866 0 23,256Renewable Fuels Except Fuel Ethanol ..... – – 3,344 – – 754 -1,999 -9 1,891 217 0 5,891
Other Hydrocarbons ..................................... – – – – – – 6 28 -1 35 – 0 31Unfinished Oils ................................................. – – – – – – 17,280 – – -4,026 14,571 10,089 -3,354 94,298Motor Gasoline Blend.Comp. (MGBC)5 ........... – – -4 – – 23,825 -2,977 556 18,265 2,023 0 217,056
Reformulated ................................................ – – – – – 4,645 4,312 2,437 6,500 20 0 52,141Conventional ................................................. – – -4 – – 19,180 -7,289 -1,881 11,765 2,003 0 164,915
Aviation Gasoline Blend. Comp. ....................... – – – – – – – – – 4 30 – -34 45
Finished Petroleum Products ............................ – – 149 596,345 16,618 4,048 -10,280 – – 110,723 516,718 277,894Finished Motor Gasoline ................................... – – 149 298,919 982 1,831 -321 – – 26,593 275,608 22,808
Reformulated ................................................ – – – 97,422 – -3,174 -11 – – – 94,259 34Conventional ................................................. – – 149 201,497 982 5,004 -310 – – 26,593 181,349 22,774
Finished Aviation Gasoline ............................... – – – – 267 3 – – -108 – – – 378 896Kerosene-Type Jet Fuel ................................... – – – – 53,951 2,650 – – 540 – – 7,036 49,025 40,915Kerosene .......................................................... – – – – -7 – – – -232 – – 192 33 1,418Distillate Fuel Oil5 ............................................. – – – – 153,570 2,732 2,218 -9,800 – – 43,708 124,611 120,591
15 ppm sulfur and under ............................... – – – – 145,070 2,372 2,218 -7,616 – – 37,014 120,262 106,816Greater than 15 ppm to 500 ppm sulfur ........ – – – – 2,092 41 – – -258 – – 2,282 109 4,181Greater than 500 ppm sulfur ......................... – – – – 6,408 319 – – -1,926 – – 4,413 4,240 9,594
Residual Fuel Oil6 ............................................ – – – – 13,513 5,702 – – -2,693 – – 9,638 12,270 32,349Less than 0.31 percent sulfur ....................... – – – – 1,837 – – – 248 – – NA NA 2,5910.31 to 1.00 percent sulfur ............................ – – – – 1,648 419 – – -1,173 – – NA NA 5,128Greater than 1.00 percent sulfur ................... – – – – 10,028 5,283 – – -1,767 – – NA NA 24,621
Petrochemical Feedstocks ............................... – – – – 9,222 594 – – -281 – – – – 10,097 2,974Naphtha for Petro. Feed. Use ....................... – – – – 5,389 496 – – -286 – – – – 6,171 1,906Other Oils for Petro. Feed. Use .................... – – – – 3,833 98 – – 5 – – – – 3,926 1,068
Special Naphthas ............................................. – – – – 1,144 576 – – -27 – – – – 1,747 1,049Lubricants ......................................................... – – – – 5,300 1,535 – – -414 – – 4,268 2,982 11,428Waxes ............................................................... – – – – 143 169 – – 5 – – 109 198 797Petroleum Coke ................................................ – – – – 27,003 514 – – -9 – – 18,516 9,010 8,760
Marketable .................................................... – – – – 20,011 514 – – -9 – – 18,516 2,018 8,760Catalyst ......................................................... – – – – 6,992 – – – – – – – – – – 6,992 – –
Asphalt and Road Oil ........................................ – – – – 9,793 1,149 – – 3,059 – – 635 7,248 33,280Still Gas ............................................................ – – – – 20,679 – – – – – – – – – – 20,679 – –Miscellaneous Products .................................... – – – – 2,848 12 – – 1 – – 28 2,831 629
Total ..................................................................... 441,805 35,963 620,354 310,925 10,359 2,352 586,923 231,902 598,228 1,864,103
– – = Not Applicable.– = No Data Reported.
NA = Not Available.1 Includes an adjustment for crude oil, previously referred to as ’Unaccounted For Crude Oil.’ Also included is an adjustment for motor gasoline blending components, fuel ethanol, and distillate fuel oil. See
Appendix B, Note 2C for a detailed explanation of these adjustments.2 A negative number indicates a decrease in stocks and a positive number indicates an increase in stocks. Stock change for crude oil excludes lease stocks beginning with January 2005 (see explanatory notes).3 Product supplied is equal to field production, plus renewable fuels and oxygenate plant net production, plus refinery and blender net production, plus imports, plus net receipts, plus adjustments, minus stock
change, minus refinery and blender net inputs, minus exports.4 Includes value for the Strategic Petroleum Reserve. See Table 25 for the breakout of Commercial Crude Oil.5 Excludes stocks located in the “Northeast Heating Oil Reserve”, “Northeast Regional Refined Petroleum Product Reserve”, and “State of New York’s Strategic Fuels Reserve Program”. For details see Appendix
D.6 Total residual fuel oil ending stocks and stock change include stocks held at pipelines. Residual fuel oil ending stocks and stock change by sulfur content exclude pipeline stocks. Therefore, the sum of residual
fuel oil ending stocks and stock change by sulfur content may not equal total residual fuel oil ending stocks and stock change.Notes: Totals may not equal sum of components due to independent rounding. Domestic crude oil field production are estimates.Sources: Energy Information Administration (EIA) Forms EIA-22M "Monthly Biodiesel Production Survey", EIA-810, "Monthly Refinery Report," EIA-812, "Monthly Product Pipeline Report," EIA-813, "Monthly Crude OilReport," EIA-814, "Monthly Imports Report," EIA-815, "Monthly Bulk Terminal and Blender Report," EIA-816, "Monthly Natural Gas Liquids Report," and EIA-819, "Monthly Oxygenate Report." Domestic crude oil fieldproduction estimates based on Form EIA-914, "Monthly Crude Oil and Lease Condensate, and Natural Gas Production Report," and data from State conservation agencies, the U.S. Department of Interior, and theBureau of Ocean Energy Management. Export data from the U.S. Census Bureau and EIA estimates.

Energy Information Administration/Petroleum Supply Monthly, 7 April 2018
Table 1. U.S. Supply, Disposition, and Ending Stocks of Crude Oil and Petroleum Products, April 2018(Thousand Barrels)
Commodity
Supply Disposition
EndingStocks
FieldProduction
RenewableFuels andOxygenatePlant Net
Production
Refineryand
BlenderNet
Production ImportsAdjust-ments1
StockChange2
Refineryand
BlenderNet
Inputs ExportsProductsSupplied3
Crude Oil4 ............................................................ 314,010 – – – – 247,330 4,420 10,119 502,972 52,668 0 1,099,023
Hydrocarbon Gas Liquids .................................. 127,795 -607 24,009 5,033 – – 6,092 14,895 50,345 84,898 145,374Natural Gas Liquids .......................................... 127,795 -607 15,367 4,566 – – 6,106 14,895 50,345 75,775 139,733
Ethane .......................................................... 51,576 – – 182 – – – -1,772 – – 9,560 43,970 48,488Propane ........................................................ 40,505 – – 9,210 3,933 – – 1,034 – – 28,179 24,435 34,836Normal Butane .............................................. 10,040 – – 6,366 349 – – 7,328 3,015 5,129 1,283 29,027Isobutane ...................................................... 11,500 – – -391 280 – – -23 7,101 648 3,663 8,487Natural Gasoline ........................................... 14,174 -607 – – 4 – – -461 4,779 6,828 2,425 18,895
Refinery Olefins ................................................ – – – – 8,642 467 – – -14 – – – – 9,123 5,641Ethylene ........................................................ – – – – – – – – 0 – – – – 0 0Propylene ..................................................... – – – – 8,573 302 – – 298 – – – – 8,577 4,144Butylene ........................................................ – – – – 71 165 – – -338 – – – – 574 1,470Isobutylene ................................................... – – – – -2 – – – 26 – – – – -28 27
Other Liquids ...................................................... – – 36,421 – – 41,944 1,890 -3,579 69,056 18,167 -3,388 341,812Hydrogen/Oxygenates/Renewables/Other Hydrocarbons ......................................... – – 36,425 – – 839 4,867 -113 36,190 6,055 0 30,413
Hydrogen ...................................................... – – – – – – – 6,825 – – 6,825 – 0 – –Oxygenates (excluding Fuel Ethanol) ........... – – 2,549 – – 79 -1,133 -476 – 1,971 0 1,235Renewable Fuels (including Fuel Ethanol) ... – – 33,876 – – 754 -853 364 29,330 4,084 0 29,147
Fuel Ethanol5 ............................................ – – 30,532 – – – 1,146 373 27,439 3,866 0 23,256Renewable Fuels Except Fuel Ethanol ..... – – 3,344 – – 754 -1,999 -9 1,891 217 0 5,891
Other Hydrocarbons ..................................... – – – – – – 6 28 -1 35 – 0 31Unfinished Oils ................................................. – – – – – – 17,280 – – -4,026 14,571 10,089 -3,354 94,298Motor Gasoline Blend.Comp. (MGBC)5 ........... – – -4 – – 23,825 -2,977 556 18,265 2,023 0 217,056
Reformulated ................................................ – – – – – 4,645 4,312 2,437 6,500 20 0 52,141Conventional ................................................. – – -4 – – 19,180 -7,289 -1,881 11,765 2,003 0 164,915
Aviation Gasoline Blend. Comp. ....................... – – – – – – – – – 4 30 – -34 45
Finished Petroleum Products ............................ – – 149 596,345 16,618 4,048 -10,280 – – 110,723 516,718 277,894Finished Motor Gasoline ................................... – – 149 298,919 982 1,831 -321 – – 26,593 275,608 22,808
Reformulated ................................................ – – – 97,422 – -3,174 -11 – – – 94,259 34Conventional ................................................. – – 149 201,497 982 5,004 -310 – – 26,593 181,349 22,774
Finished Aviation Gasoline ............................... – – – – 267 3 – – -108 – – – 378 896Kerosene-Type Jet Fuel ................................... – – – – 53,951 2,650 – – 540 – – 7,036 49,025 40,915Kerosene .......................................................... – – – – -7 – – – -232 – – 192 33 1,418Distillate Fuel Oil5 ............................................. – – – – 153,570 2,732 2,218 -9,800 – – 43,708 124,611 120,591
15 ppm sulfur and under ............................... – – – – 145,070 2,372 2,218 -7,616 – – 37,014 120,262 106,816Greater than 15 ppm to 500 ppm sulfur ........ – – – – 2,092 41 – – -258 – – 2,282 109 4,181Greater than 500 ppm sulfur ......................... – – – – 6,408 319 – – -1,926 – – 4,413 4,240 9,594
Residual Fuel Oil6 ............................................ – – – – 13,513 5,702 – – -2,693 – – 9,638 12,270 32,349Less than 0.31 percent sulfur ....................... – – – – 1,837 – – – 248 – – NA NA 2,5910.31 to 1.00 percent sulfur ............................ – – – – 1,648 419 – – -1,173 – – NA NA 5,128Greater than 1.00 percent sulfur ................... – – – – 10,028 5,283 – – -1,767 – – NA NA 24,621
Petrochemical Feedstocks ............................... – – – – 9,222 594 – – -281 – – – – 10,097 2,974Naphtha for Petro. Feed. Use ....................... – – – – 5,389 496 – – -286 – – – – 6,171 1,906Other Oils for Petro. Feed. Use .................... – – – – 3,833 98 – – 5 – – – – 3,926 1,068
Special Naphthas ............................................. – – – – 1,144 576 – – -27 – – – – 1,747 1,049Lubricants ......................................................... – – – – 5,300 1,535 – – -414 – – 4,268 2,982 11,428Waxes ............................................................... – – – – 143 169 – – 5 – – 109 198 797Petroleum Coke ................................................ – – – – 27,003 514 – – -9 – – 18,516 9,010 8,760
Marketable .................................................... – – – – 20,011 514 – – -9 – – 18,516 2,018 8,760Catalyst ......................................................... – – – – 6,992 – – – – – – – – – – 6,992 – –
Asphalt and Road Oil ........................................ – – – – 9,793 1,149 – – 3,059 – – 635 7,248 33,280Still Gas ............................................................ – – – – 20,679 – – – – – – – – – – 20,679 – –Miscellaneous Products .................................... – – – – 2,848 12 – – 1 – – 28 2,831 629
Total ..................................................................... 441,805 35,963 620,354 310,925 10,359 2,352 586,923 231,902 598,228 1,864,103
– – = Not Applicable.– = No Data Reported.
NA = Not Available.1 Includes an adjustment for crude oil, previously referred to as ’Unaccounted For Crude Oil.’ Also included is an adjustment for motor gasoline blending components, fuel ethanol, and distillate fuel oil. See
Appendix B, Note 2C for a detailed explanation of these adjustments.2 A negative number indicates a decrease in stocks and a positive number indicates an increase in stocks. Stock change for crude oil excludes lease stocks beginning with January 2005 (see explanatory notes).3 Product supplied is equal to field production, plus renewable fuels and oxygenate plant net production, plus refinery and blender net production, plus imports, plus net receipts, plus adjustments, minus stock
change, minus refinery and blender net inputs, minus exports.4 Includes value for the Strategic Petroleum Reserve. See Table 25 for the breakout of Commercial Crude Oil.5 Excludes stocks located in the “Northeast Heating Oil Reserve”, “Northeast Regional Refined Petroleum Product Reserve”, and “State of New York’s Strategic Fuels Reserve Program”. For details see Appendix
D.6 Total residual fuel oil ending stocks and stock change include stocks held at pipelines. Residual fuel oil ending stocks and stock change by sulfur content exclude pipeline stocks. Therefore, the sum of residual
fuel oil ending stocks and stock change by sulfur content may not equal total residual fuel oil ending stocks and stock change.Notes: Totals may not equal sum of components due to independent rounding. Domestic crude oil field production are estimates.Sources: Energy Information Administration (EIA) Forms EIA-22M "Monthly Biodiesel Production Survey", EIA-810, "Monthly Refinery Report," EIA-812, "Monthly Product Pipeline Report," EIA-813, "Monthly Crude OilReport," EIA-814, "Monthly Imports Report," EIA-815, "Monthly Bulk Terminal and Blender Report," EIA-816, "Monthly Natural Gas Liquids Report," and EIA-819, "Monthly Oxygenate Report." Domestic crude oil fieldproduction estimates based on Form EIA-914, "Monthly Crude Oil and Lease Condensate, and Natural Gas Production Report," and data from State conservation agencies, the U.S. Department of Interior, and theBureau of Ocean Energy Management. Export data from the U.S. Census Bureau and EIA estimates.
Table 2. U.S. Year-to-Date Supply, Disposition, and Ending Stocks of Crude Oil and Petroleum Products, January-April 2018(Thousand Barrels)
Commodity
Supply Disposition
EndingStocks
FieldProduction
RenewableFuels andOxygenatePlant Net
Production
Refineryand
BlenderNet
Production ImportsAdjust-ments1
StockChange2
Refineryand
BlenderNet
Inputs ExportsProductsSupplied3
Crude Oil4 ............................................................ 1,235,465 – – – – 941,599 9,278 15,067 1,980,263 191,012 0 1,099,023
Hydrocarbon Gas Liquids .................................. 488,380 -2,449 67,259 26,292 – – -45,530 69,383 181,298 374,331 145,374Natural Gas Liquids .......................................... 488,380 -2,449 32,713 23,358 – – -45,091 69,383 181,298 336,412 139,733
Ethane .......................................................... 194,473 – – 715 – – – -7,131 – – 29,184 173,135 48,488Propane ........................................................ 156,754 – – 35,774 20,031 – – -27,511 – – 110,929 129,141 34,836Normal Butane .............................................. 39,010 – – -2,119 1,990 – – -9,294 24,583 17,205 6,387 29,027Isobutane ...................................................... 44,352 – – -1,657 1,319 – – 94 26,448 843 16,629 8,487Natural Gasoline ........................................... 53,791 -2,449 – – 18 – – -1,249 18,352 23,136 11,121 18,895
Refinery Olefins ................................................ – – – – 34,546 2,934 – – -439 – – – – 37,919 5,641Ethylene ........................................................ – – – – 12 – – – 0 – – – – 12 0Propylene ..................................................... – – – – 34,220 2,121 – – -698 – – – – 37,039 4,144Butylene ........................................................ – – – – 364 813 – – 262 – – – – 915 1,470Isobutylene ................................................... – – – – -50 – – – -3 – – – – -47 27
Other Liquids ...................................................... – – 146,729 – – 151,232 1,461 13,357 213,839 63,553 8,673 341,812Hydrogen/Oxygenates/Renewables/Other Hydrocarbons ......................................... – – 146,745 – – 3,894 15,066 341 140,303 25,061 0 30,413
Hydrogen ...................................................... – – – – – – – 25,950 – – 25,950 – 0 – –Oxygenates (excluding Fuel Ethanol) ........... – – 9,272 – – 1,152 -2,641 -211 – 7,994 0 1,235Renewable Fuels (including Fuel Ethanol) ... – – 137,473 – – 2,721 -8,345 568 114,213 17,067 0 29,147
Fuel Ethanol5 ............................................ – – 124,695 – – – -794 208 107,304 16,389 0 23,256Renewable Fuels Except Fuel Ethanol ..... – – 12,778 – – 2,721 -7,552 360 6,909 678 0 5,891
Other Hydrocarbons ..................................... – – – – – – 21 103 -16 140 – 0 31Unfinished Oils ................................................. – – – – – – 74,135 – – 8,038 25,082 32,280 8,735 94,298Motor Gasoline Blend.Comp. (MGBC)5 ........... – – -16 – – 73,203 -13,606 4,948 48,422 6,211 0 217,056
Reformulated ................................................ – – – – – 22,661 22,277 -1,314 46,195 57 0 52,141Conventional ................................................. – – -16 – – 50,542 -35,882 6,262 2,227 6,155 0 164,915
Aviation Gasoline Blend. Comp. ....................... – – – – – – – – – 30 32 – -62 45
Finished Petroleum Products ............................ – – 574 2,329,717 82,994 22,582 -13,743 – – 412,977 2,036,633 277,894Finished Motor Gasoline ................................... – – 574 1,180,016 3,660 14,399 -1,833 – – 114,168 1,086,314 22,808
Reformulated ................................................ – – – 383,670 – -20,302 -6 – – – 363,374 34Conventional ................................................. – – 574 796,346 3,660 34,702 -1,827 – – 114,168 722,941 22,774
Finished Aviation Gasoline ............................... – – – – 1,100 31 – – -145 – – – 1,276 896Kerosene-Type Jet Fuel ................................... – – – – 208,953 12,274 – – -303 – – 25,317 196,213 40,915Kerosene .......................................................... – – – – 895 508 – – -720 – – 796 1,327 1,418Distillate Fuel Oil5 ............................................. – – – – 586,787 24,555 8,183 -24,983 – – 143,526 500,982 120,591
15 ppm sulfur and under ............................... – – – – 546,344 19,821 8,183 -21,075 – – 119,308 476,114 106,816Greater than 15 ppm to 500 ppm sulfur ........ – – – – 10,369 759 – – -3,388 – – 12,718 1,798 4,181Greater than 500 ppm sulfur ......................... – – – – 30,074 3,975 – – -520 – – 11,500 23,069 9,594
Residual Fuel Oil6 ............................................ – – – – 53,396 24,886 – – 2,990 – – 37,661 37,631 32,349Less than 0.31 percent sulfur ....................... – – – – 6,920 1,735 – – 443 – – NA NA 2,5910.31 to 1.00 percent sulfur ............................ – – – – 7,184 2,183 – – -1,473 – – NA NA 5,128Greater than 1.00 percent sulfur ................... – – – – 39,292 20,968 – – 4,017 – – NA NA 24,621
Petrochemical Feedstocks ............................... – – – – 35,070 2,821 – – 73 – – – – 37,818 2,974Naphtha for Petro. Feed. Use ....................... – – – – 23,151 2,387 – – 57 – – – – 25,481 1,906Other Oils for Petro. Feed. Use .................... – – – – 11,919 434 – – 16 – – – – 12,337 1,068
Special Naphthas ............................................. – – – – 4,625 1,943 – – -143 – – – – 6,711 1,049Lubricants ......................................................... – – – – 22,070 5,625 – – -593 – – 14,950 13,338 11,428Waxes ............................................................... – – – – 486 601 – – -60 – – 440 707 797Petroleum Coke ................................................ – – – – 106,766 2,016 – – 241 – – 73,814 34,727 8,760
Marketable .................................................... – – – – 79,348 2,016 – – 241 – – 73,814 7,309 8,760Catalyst ......................................................... – – – – 27,418 – – – – – – – – – – 27,418 – –
Asphalt and Road Oil ........................................ – – – – 36,812 4,015 – – 11,774 – – 2,148 26,905 33,280Still Gas ............................................................ – – – – 81,701 – – – – – – – – – – 81,701 – –Miscellaneous Products .................................... – – – – 11,040 59 – – -41 – – 159 10,981 629
Total ..................................................................... 1,723,845 144,854 2,396,976 1,202,117 33,321 -30,849 2,263,485 848,840 2,419,637 1,864,103
– – = Not Applicable.– = No Data Reported.
NA = Not Available.1 Includes an adjustment for crude oil, previously referred to as ’Unaccounted For Crude Oil.’ Also included is an adjustment for motor gasoline blending components, fuel ethanol, and distillate fuel oil. See
Appendix B, Note 2C for a detailed explanation of these adjustments.2 A negative number indicates a decrease in stocks and a positive number indicates an increase in stocks. Stock change for crude oil excludes lease stocks beginning with January 2005 (see explanatory notes).3 Product supplied is equal to field production, plus renewable fuels and oxygenate plant net production, plus refinery and blender net production, plus imports, plus net receipts, plus adjustments, minus stock
change, minus refinery and blender net inputs, minus exports.4 Includes value for the Strategic Petroleum Reserve. See Table 25 for the breakout of Commercial Crude Oil.5 Excludes stocks located in the “Northeast Heating Oil Reserve”, “Northeast Regional Refined Petroleum Product Reserve”, and “State of New York’s Strategic Fuels Reserve Program”. For details see Appendix
D.6 Total residual fuel oil ending stocks and stock change include stocks held at pipelines. Residual fuel oil ending stocks and stock change by sulfur content exclude pipeline stocks. Therefore, the sum of residual
fuel oil ending stocks and stock change by sulfur content may not equal total residual fuel oil ending stocks and stock change.Notes: Totals may not equal sum of components due to independent rounding. Domestic crude oil field production are estimates.Sources: Energy Information Administration (EIA) Forms EIA-22M "Monthly Biodiesel Production Survey", EIA-810, "Monthly Refinery Report," EIA-812, "Monthly Product Pipeline Report," EIA-813, "Monthly Crude OilReport," EIA-814, "Monthly Imports Report," EIA-815, "Monthly Bulk Terminal and Blender Report," EIA-816, "Monthly Natural Gas Liquids Report," and EIA-819, "Monthly Oxygenate Report." Domestic crude oil fieldproduction estimates based on Form EIA-914, "Monthly Crude Oil and Lease Condensate, and Natural Gas Production Report," and data from State conservation agencies, the U.S. Department of Interior, and theBureau of Ocean Energy Management. Export data from the U.S. Census Bureau and EIA estimates.

Energy Information Administration/Petroleum Supply Monthly,8 April 2018
Table 3. U.S. Daily Average Supply and Disposition of Crude Oil and Petroleum Products, April 2018(Thousand Barrels per Day)
Commodity
Supply Disposition
FieldProduction
RenewableFuels andOxygenatePlant Net
Production
Refineryand
Blender NetProduction Imports
Adjust-ments1
StockChange2
Refineryand
BlenderNet
Inputs ExportsProductsSupplied3
Crude Oil4 ............................................................ 10,467 – – – – 8,244 147 337 16,766 1,756 0
Hydrocarbon Gas Liquids .................................. 4,260 -20 800 168 – – 203 497 1,678 2,830Natural Gas Liquids .......................................... 4,260 -20 512 152 – – 204 497 1,678 2,526
Ethane .......................................................... 1,719 – – 6 – – – -59 – – 319 1,466Propane ........................................................ 1,350 – – 307 131 – – 34 – – 939 814Normal Butane .............................................. 335 – – 212 12 – – 244 101 171 43Isobutane ...................................................... 383 – – -13 9 – – -1 237 22 122Natural Gasoline ........................................... 472 -20 – – 0 – – -15 159 228 81
Refinery Olefins ................................................ – – – – 288 16 – – 0 – – – – 304Ethylene ........................................................ – – – – – – – – 0 – – – – 0Propylene ..................................................... – – – – 286 10 – – 10 – – – – 286Butylene ........................................................ – – – – 2 6 – – -11 – – – – 19Isobutylene ................................................... – – – – 0 – – – 1 – – – – -1
Other Liquids ...................................................... – – 1,214 – – 1,398 63 -119 2,302 606 -113Hydrogen/Oxygenates/Renewables/Other Hydrocarbons ......................................... – – 1,214 – – 28 162 -4 1,206 202 0
Hydrogen ...................................................... – – – – – – – 228 – – 228 – 0Oxygenates (excluding Fuel Ethanol) ........... – – 85 – – 3 -38 -16 – 66 0Renewable Fuels (including Fuel Ethanol) ... – – 1,129 – – 25 -28 12 978 136 0
Fuel Ethanol5 ............................................ – – 1,018 – – – 38 12 915 129 0Renewable Fuels Except Fuel Ethanol ..... – – 111 – – 25 -67 0 63 7 0
Other Hydrocarbons ..................................... – – – – – – 0 1 0 1 – 0Unfinished Oils ................................................. – – – – – – 576 – – -134 486 336 -112Motor Gasoline Blend.Comp. (MGBC)5 ........... – – 0 – – 794 -99 19 609 67 0
Reformulated ................................................ – – – – – 155 144 81 217 1 0Conventional ................................................. – – 0 – – 639 -243 -63 392 67 0
Aviation Gasoline Blend. Comp. ....................... – – – – – – – – – 0 1 – -1
Finished Petroleum Products ............................ – – 5 19,878 554 135 -343 – – 3,691 17,224Finished Motor Gasoline ................................... – – 5 9,964 33 61 -11 – – 886 9,187
Reformulated ................................................ – – – 3,247 – -106 0 – – – 3,142Conventional ................................................. – – 5 6,717 33 167 -10 – – 886 6,045
Finished Aviation Gasoline ............................... – – – – 9 0 – – -4 – – – 13Kerosene-Type Jet Fuel ................................... – – – – 1,798 88 – – 18 – – 235 1,634Kerosene .......................................................... – – – – 0 – – – -8 – – 6 1Distillate Fuel Oil5 ............................................. – – – – 5,119 91 74 -327 – – 1,457 4,154
15 ppm sulfur and under ............................... – – – – 4,836 79 74 -254 – – 1,234 4,009Greater than 15 ppm to 500 ppm sulfur ........ – – – – 70 1 – – -9 – – 76 4Greater than 500 ppm sulfur ......................... – – – – 214 11 – – -64 – – 147 141
Residual Fuel Oil6 ............................................ – – – – 450 190 – – -90 – – 321 409Less than 0.31 percent sulfur ....................... – – – – 61 – – – 8 – – NA NA0.31 to 1.00 percent sulfur ............................ – – – – 55 14 – – -39 – – NA NAGreater than 1.00 percent sulfur ................... – – – – 334 176 – – -59 – – NA NA
Petrochemical Feedstocks ............................... – – – – 307 20 – – -9 – – – – 337Naphtha for Petro. Feed. Use ....................... – – – – 180 17 – – -10 – – – – 206Other Oils for Petro. Feed. Use .................... – – – – 128 3 – – 0 – – – – 131
Special Naphthas ............................................. – – – – 38 19 – – -1 – – – – 58Lubricants ......................................................... – – – – 177 51 – – -14 – – 142 99Waxes ............................................................... – – – – 5 6 – – 0 – – 4 7Petroleum Coke ................................................ – – – – 900 17 – – 0 – – 617 300
Marketable .................................................... – – – – 667 17 – – 0 – – 617 67Catalyst ......................................................... – – – – 233 – – – – – – – – – – 233
Asphalt and Road Oil ........................................ – – – – 326 38 – – 102 – – 21 242Still Gas ............................................................ – – – – 689 – – – – – – – – – – 689Miscellaneous Products .................................... – – – – 95 0 – – 0 – – 1 94
Total ..................................................................... 14,727 1,199 20,678 10,364 345 78 19,564 7,730 19,941
– – = Not Applicable.– = No Data Reported.
NA = Not Available.1 Includes an adjustment for crude oil, previously referred to as ’Unaccounted For Crude Oil.’ Also included is an adjustment for motor gasoline blending components, fuel ethanol, and distillate fuel oil. See
Appendix B, Note 2C for a detailed explanation of these adjustments.2 A negative number indicates a decrease in stocks and a positive number indicates an increase in stocks. Stock change for crude oil excludes lease stocks beginning with January 2005 (see explanatory notes).3 Product supplied is equal to field production, plus renewable fuels and oxygenate plant net production, plus refinery and blender net production, plus imports, plus net receipts, plus adjustments, minus stock
change, minus refinery and blender net inputs, minus exports.4 Includes value for the Strategic Petroleum Reserve. See Table 25 for the breakout of Commercial Crude Oil.5 Excludes stocks located in the “Northeast Heating Oil Reserve”, “Northeast Regional Refined Petroleum Product Reserve”, and “State of New York’s Strategic Fuels Reserve Program”. For details see Appendix
D.6 Total residual fuel oil ending stocks and stock change include stocks held at pipelines. Residual fuel oil ending stocks and stock change by sulfur content exclude pipeline stocks. Therefore, the sum of residual
fuel oil ending stocks and stock change by sulfur content may not equal total residual fuel oil ending stocks and stock change.Notes: Totals may not equal sum of components due to independent rounding. Domestic crude oil field production are estimates.Sources: Energy Information Administration (EIA) Forms EIA-22M "Monthly Biodiesel Production Survey", EIA-810, "Monthly Refinery Report," EIA-812, "Monthly Product Pipeline Report," EIA-813, "Monthly Crude OilReport," EIA-814, "Monthly Imports Report," EIA-815, "Monthly Bulk Terminal and Blender Report," EIA-816, "Monthly Natural Gas Liquids Report," and EIA-819, "Monthly Oxygenate Report." Domestic crude oil fieldproduction estimates based on Form EIA-914, "Monthly Crude Oil and Lease Condensate, and Natural Gas Production Report," and data from State conservation agencies, the U.S. Department of Interior, and theBureau of Ocean Energy Management. Export data from the U.S. Census Bureau and EIA estimates.

Energy Information Administration/Petroleum Supply Monthly, 9 April 2018
Table 3. U.S. Daily Average Supply and Disposition of Crude Oil and Petroleum Products, April 2018(Thousand Barrels per Day)
Commodity
Supply Disposition
FieldProduction
RenewableFuels andOxygenatePlant Net
Production
Refineryand
Blender NetProduction Imports
Adjust-ments1
StockChange2
Refineryand
BlenderNet
Inputs ExportsProductsSupplied3
Crude Oil4 ............................................................ 10,467 – – – – 8,244 147 337 16,766 1,756 0
Hydrocarbon Gas Liquids .................................. 4,260 -20 800 168 – – 203 497 1,678 2,830Natural Gas Liquids .......................................... 4,260 -20 512 152 – – 204 497 1,678 2,526
Ethane .......................................................... 1,719 – – 6 – – – -59 – – 319 1,466Propane ........................................................ 1,350 – – 307 131 – – 34 – – 939 814Normal Butane .............................................. 335 – – 212 12 – – 244 101 171 43Isobutane ...................................................... 383 – – -13 9 – – -1 237 22 122Natural Gasoline ........................................... 472 -20 – – 0 – – -15 159 228 81
Refinery Olefins ................................................ – – – – 288 16 – – 0 – – – – 304Ethylene ........................................................ – – – – – – – – 0 – – – – 0Propylene ..................................................... – – – – 286 10 – – 10 – – – – 286Butylene ........................................................ – – – – 2 6 – – -11 – – – – 19Isobutylene ................................................... – – – – 0 – – – 1 – – – – -1
Other Liquids ...................................................... – – 1,214 – – 1,398 63 -119 2,302 606 -113Hydrogen/Oxygenates/Renewables/Other Hydrocarbons ......................................... – – 1,214 – – 28 162 -4 1,206 202 0
Hydrogen ...................................................... – – – – – – – 228 – – 228 – 0Oxygenates (excluding Fuel Ethanol) ........... – – 85 – – 3 -38 -16 – 66 0Renewable Fuels (including Fuel Ethanol) ... – – 1,129 – – 25 -28 12 978 136 0
Fuel Ethanol5 ............................................ – – 1,018 – – – 38 12 915 129 0Renewable Fuels Except Fuel Ethanol ..... – – 111 – – 25 -67 0 63 7 0
Other Hydrocarbons ..................................... – – – – – – 0 1 0 1 – 0Unfinished Oils ................................................. – – – – – – 576 – – -134 486 336 -112Motor Gasoline Blend.Comp. (MGBC)5 ........... – – 0 – – 794 -99 19 609 67 0
Reformulated ................................................ – – – – – 155 144 81 217 1 0Conventional ................................................. – – 0 – – 639 -243 -63 392 67 0
Aviation Gasoline Blend. Comp. ....................... – – – – – – – – – 0 1 – -1
Finished Petroleum Products ............................ – – 5 19,878 554 135 -343 – – 3,691 17,224Finished Motor Gasoline ................................... – – 5 9,964 33 61 -11 – – 886 9,187
Reformulated ................................................ – – – 3,247 – -106 0 – – – 3,142Conventional ................................................. – – 5 6,717 33 167 -10 – – 886 6,045
Finished Aviation Gasoline ............................... – – – – 9 0 – – -4 – – – 13Kerosene-Type Jet Fuel ................................... – – – – 1,798 88 – – 18 – – 235 1,634Kerosene .......................................................... – – – – 0 – – – -8 – – 6 1Distillate Fuel Oil5 ............................................. – – – – 5,119 91 74 -327 – – 1,457 4,154
15 ppm sulfur and under ............................... – – – – 4,836 79 74 -254 – – 1,234 4,009Greater than 15 ppm to 500 ppm sulfur ........ – – – – 70 1 – – -9 – – 76 4Greater than 500 ppm sulfur ......................... – – – – 214 11 – – -64 – – 147 141
Residual Fuel Oil6 ............................................ – – – – 450 190 – – -90 – – 321 409Less than 0.31 percent sulfur ....................... – – – – 61 – – – 8 – – NA NA0.31 to 1.00 percent sulfur ............................ – – – – 55 14 – – -39 – – NA NAGreater than 1.00 percent sulfur ................... – – – – 334 176 – – -59 – – NA NA
Petrochemical Feedstocks ............................... – – – – 307 20 – – -9 – – – – 337Naphtha for Petro. Feed. Use ....................... – – – – 180 17 – – -10 – – – – 206Other Oils for Petro. Feed. Use .................... – – – – 128 3 – – 0 – – – – 131
Special Naphthas ............................................. – – – – 38 19 – – -1 – – – – 58Lubricants ......................................................... – – – – 177 51 – – -14 – – 142 99Waxes ............................................................... – – – – 5 6 – – 0 – – 4 7Petroleum Coke ................................................ – – – – 900 17 – – 0 – – 617 300
Marketable .................................................... – – – – 667 17 – – 0 – – 617 67Catalyst ......................................................... – – – – 233 – – – – – – – – – – 233
Asphalt and Road Oil ........................................ – – – – 326 38 – – 102 – – 21 242Still Gas ............................................................ – – – – 689 – – – – – – – – – – 689Miscellaneous Products .................................... – – – – 95 0 – – 0 – – 1 94
Total ..................................................................... 14,727 1,199 20,678 10,364 345 78 19,564 7,730 19,941
– – = Not Applicable.– = No Data Reported.
NA = Not Available.1 Includes an adjustment for crude oil, previously referred to as ’Unaccounted For Crude Oil.’ Also included is an adjustment for motor gasoline blending components, fuel ethanol, and distillate fuel oil. See
Appendix B, Note 2C for a detailed explanation of these adjustments.2 A negative number indicates a decrease in stocks and a positive number indicates an increase in stocks. Stock change for crude oil excludes lease stocks beginning with January 2005 (see explanatory notes).3 Product supplied is equal to field production, plus renewable fuels and oxygenate plant net production, plus refinery and blender net production, plus imports, plus net receipts, plus adjustments, minus stock
change, minus refinery and blender net inputs, minus exports.4 Includes value for the Strategic Petroleum Reserve. See Table 25 for the breakout of Commercial Crude Oil.5 Excludes stocks located in the “Northeast Heating Oil Reserve”, “Northeast Regional Refined Petroleum Product Reserve”, and “State of New York’s Strategic Fuels Reserve Program”. For details see Appendix
D.6 Total residual fuel oil ending stocks and stock change include stocks held at pipelines. Residual fuel oil ending stocks and stock change by sulfur content exclude pipeline stocks. Therefore, the sum of residual
fuel oil ending stocks and stock change by sulfur content may not equal total residual fuel oil ending stocks and stock change.Notes: Totals may not equal sum of components due to independent rounding. Domestic crude oil field production are estimates.Sources: Energy Information Administration (EIA) Forms EIA-22M "Monthly Biodiesel Production Survey", EIA-810, "Monthly Refinery Report," EIA-812, "Monthly Product Pipeline Report," EIA-813, "Monthly Crude OilReport," EIA-814, "Monthly Imports Report," EIA-815, "Monthly Bulk Terminal and Blender Report," EIA-816, "Monthly Natural Gas Liquids Report," and EIA-819, "Monthly Oxygenate Report." Domestic crude oil fieldproduction estimates based on Form EIA-914, "Monthly Crude Oil and Lease Condensate, and Natural Gas Production Report," and data from State conservation agencies, the U.S. Department of Interior, and theBureau of Ocean Energy Management. Export data from the U.S. Census Bureau and EIA estimates.
Table 4. U.S. Year-to-Date Daily Average Supply and Disposition of Crude Oil and Petroleum Products, January-April 2018(Thousand Barrels per Day)
Commodity
Supply Disposition
FieldProduction
RenewableFuels andOxygenatePlant Net
Production
Refineryand
Blender NetProduction Imports
Adjust-ments1
StockChange2
Refineryand
BlenderNet
Inputs ExportsProductsSupplied3
Crude Oil4 ............................................................ 10,296 – – – – 7,847 77 126 16,502 1,592 0
Hydrocarbon Gas Liquids .................................. 4,070 -20 560 219 – – -379 578 1,511 3,119Natural Gas Liquids .......................................... 4,070 -20 273 195 – – -376 578 1,511 2,803
Ethane .......................................................... 1,621 – – – – – – -59 – – 243 1,443Propane ........................................................ 1,306 – – 298 167 – – -229 – – 924 1,076Normal Butane .............................................. 325 – – -18 17 – – -77 205 143 53Isobutane ...................................................... 370 – – -145 11 – – 1 220 7 139Natural Gasoline ........................................... 448 -20 – – 0 – – -10 153 193 93
Refinery Olefins ................................................ – – – – 288 24 – – -4 – – – – 316Ethylene ........................................................ – – – – 0 – – – 0 – – – – 0Propylene ..................................................... – – – – 285 18 – – -6 – – – – 309Butylene ........................................................ – – – – 3 7 – – 2 – – – – 8Isobutylene ................................................... – – – – 56 – – – 0 – – – – 0
Other Liquids ...................................................... – – 1,223 – – 1,260 12 111 1,782 530 72Hydrogen/Oxygenates/Renewables/Other Hydrocarbons ......................................... – – 1,223 – – 32 126 3 1,169 209 0
Hydrogen ...................................................... – – – – – – – 216 – – 216 – 0Oxygenates (excluding Fuel Ethanol) ........... – – 77 – – 10 -22 -2 – 67 0Renewable Fuels (including Fuel Ethanol) ... – – 1,146 – – 23 -70 5 952 142 0
Fuel Ethanol5 ............................................ – – 1,039 – – – -7 2 894 137 0Renewable Fuels Except Fuel Ethanol ..... – – 106 – – 23 -63 3 58 6 0
Other Hydrocarbons ..................................... – – – – – – 0 1 0 1 – 0Unfinished Oils ................................................. – – – – – – 618 – – 67 209 269 73Motor Gasoline Blend.Comp. (MGBC)5 ........... – – 0 – – 610 -113 41 404 52 0
Reformulated ................................................ – – – – – 189 186 -11 385 0 0Conventional ................................................. – – 0 – – 421 -299 52 19 51 0
Aviation Gasoline Blend. Comp. ....................... – – – – – – – – – 0 0 – -1
Finished Petroleum Products ............................ – – 5 19,414 692 188 -115 – – 3,441 16,972Finished Motor Gasoline ................................... – – 5 9,833 31 – -15 – – 951 9,053
Reformulated ................................................ – – – 3,197 – -169 0 – – – 3,028Conventional ................................................. – – 5 6,636 31 289 -15 – – 951 6,025
Finished Aviation Gasoline ............................... – – – – 9 0 – – -1 – – – 11Kerosene-Type Jet Fuel ................................... – – – – 1,741 102 – – -3 – – 211 1,635Kerosene .......................................................... – – – – 7 4 – – -6 – – 7 11Distillate Fuel Oil5 ............................................. – – – – 4,890 205 68 -208 – – 1,196 4,175
15 ppm sulfur and under ............................... – – – – 4,553 165 68 -176 – – 994 3,968Greater than 15 ppm to 500 ppm sulfur ........ – – – – 86 6 – – -28 – – 106 15Greater than 500 ppm sulfur ......................... – – – – 251 33 – – -4 – – 96 192
Residual Fuel Oil6 ............................................ – – – – 445 207 – – 25 – – 314 314Less than 0.31 percent sulfur ....................... – – – – 58 14 – – 4 – – NA NA0.31 to 1.00 percent sulfur ............................ – – – – 60 18 – – -12 – – NA NAGreater than 1.00 percent sulfur ................... – – – – 327 175 – – 33 – – NA NA
Petrochemical Feedstocks ............................... – – – – 292 24 – – 1 – – – – 315Naphtha for Petro. Feed. Use ....................... – – – – 193 20 – – 0 – – – – 212Other Oils for Petro. Feed. Use .................... – – – – 99 4 – – 0 – – – – 103
Special Naphthas ............................................. – – – – 39 16 – – -1 – – – – 56Lubricants ......................................................... – – – – 184 47 – – -5 – – 125 111Waxes ............................................................... – – – – 4 5 – – -1 – – 4 6Petroleum Coke ................................................ – – – – 890 17 – – 2 – – 615 289
Marketable .................................................... – – – – 661 17 – – 2 – – 615 61Catalyst ......................................................... – – – – 228 – – – – – – – – – – 228
Asphalt and Road Oil ........................................ – – – – 307 33 – – 98 – – 18 224Still Gas ............................................................ – – – – 681 – – – – – – – – – – 681Miscellaneous Products .................................... – – – – 92 0 – – 0 – – 1 92
Total ..................................................................... 14,365 1,207 19,975 10,018 278 -257 18,862 7,074 20,164
– – = Not Applicable.– = No Data Reported.
NA = Not Available.1 Includes an adjustment for crude oil, previously referred to as ’Unaccounted For Crude Oil.’ Also included is an adjustment for motor gasoline blending components, fuel ethanol, and distillate fuel oil. See
Appendix B, Note 2C for a detailed explanation of these adjustments.2 A negative number indicates a decrease in stocks and a positive number indicates an increase in stocks. Stock change for crude oil excludes lease stocks beginning with January 2005 (see explanatory notes).3 Product supplied is equal to field production, plus renewable fuels and oxygenate plant net production, plus refinery and blender net production, plus imports, plus net receipts, plus adjustments, minus stock
change, minus refinery and blender net inputs, minus exports.4 Includes value for the Strategic Petroleum Reserve. See Table 25 for the breakout of Commercial Crude Oil.5 Excludes stocks located in the “Northeast Heating Oil Reserve”, “Northeast Regional Refined Petroleum Product Reserve”, and “State of New York’s Strategic Fuels Reserve Program”. For details see Appendix
D.6 Total residual fuel oil ending stocks and stock change include stocks held at pipelines. Residual fuel oil ending stocks and stock change by sulfur content exclude pipeline stocks. Therefore, the sum of residual
fuel oil ending stocks and stock change by sulfur content may not equal total residual fuel oil ending stocks and stock change.Notes: Totals may not equal sum of components due to independent rounding. Domestic crude oil field production are estimates.Sources: Energy Information Administration (EIA) Forms EIA-22M "Monthly Biodiesel Production Survey", EIA-810, "Monthly Refinery Report," EIA-812, "Monthly Product Pipeline Report," EIA-813, "Monthly Crude OilReport," EIA-814, "Monthly Imports Report," EIA-815, "Monthly Bulk Terminal and Blender Report," EIA-816, "Monthly Natural Gas Liquids Report," and EIA-819, "Monthly Oxygenate Report." Domestic crude oil fieldproduction estimates based on Form EIA-914, "Monthly Crude Oil and Lease Condensate, and Natural Gas Production Report," and data from State conservation agencies, the U.S. Department of Interior, and theBureau of Ocean Energy Management. Export data from the U.S. Census Bureau and EIA estimates.

Energy Information Administration/Petroleum Supply Monthly,10 April 2018
Table 5. PAD District 1 - Supply, Disposition, and Ending Stocks of Crude Oil and Petroleum Products, April 2018(Thousand Barrels)
Commodity
Supply Disposition
EndingStocks
FieldProduction
RenewableFuels andOxygenatePlant Net
Production
Refineryand
BlenderNet
Production
Imports(PADD ofEntry)1
NetReceipts2
Adjust-ments3
StockChange4
Refineryand
BlenderNet
Inputs ExportsProductsSupplied5
Crude Oil ............................................................. 1,582 – – – – 26,688 7,820 1,339 3,361 33,308 760 0 15,128
Hydrocarbon Gas Liquids .................................. 13,416 -11 1,472 1,261 -3,107 – – 306 1,034 1,442 10,249 4,509Natural Gas Liquids .......................................... 13,416 -11 1,100 1,206 -3,354 – – 281 1,034 1,442 9,600 4,354
Ethane .......................................................... 5,436 – – – – – – – -31 – – 0 5 367Propane ........................................................ 4,635 – – 735 1,122 2,576 – – 165 – – 1,188 7,715 2,699Normal Butane .............................................. 1,377 – – 380 18 -77 – – 261 535 185 717 960Isobutane ...................................................... 690 – – -15 66 -161 – – -60 425 1 214 143Natural Gasoline ........................................... 1,278 -11 – – – -230 – – -54 74 68 949 185
Refinery Olefins ................................................ – – – – 372 55 – – – 25 – – – – 649 155Ethylene ........................................................ – – – – – – – – – – – – – – – –Propylene ..................................................... – – – – 399 55 – – – 58 – – – – 643 88Butylene ........................................................ – – – – -48 – – – – -60 – – – – 12 40Isobutylene ................................................... – – – – 21 – – – – 27 – – – – -6 27
Other Liquids ...................................................... – – 930 – – 21,660 57,470 7,423 6,546 80,964 179 -206 76,323Hydrogen/Oxygenates/Renewables/ Other Hydrocarbons ....................................... – – 933 – – 170 11,619 -1,912 346 10,419 44 0 9,227
Hydrogen ...................................................... – – – – – – – – 113 – – 113 – 0 – –Oxygenates (excluding Fuel Ethanol) ........... – – – – – – – 1 – – 1 0 –Renewable Fuels (including Fuel Ethanol) ... – – 933 – – 170 11,619 -2,026 346 10,306 44 0 9,227
Fuel Ethanol ............................................. – – 711 – – – 11,384 -1,566 495 10,000 34 0 7,499Renewable Fuels Except Fuel Ethanol ..... – – 222 – – 170 236 -460 -149 306 10 0 1,728
Other Hydrocarbons ..................................... – – – – – – – – – – – – – –Unfinished Oils ................................................. – – – – – – 1,513 -27 – – 185 1,478 29 -206 6,375Motor Gasoline Blend.Comp. (MGBC) ............. – – -3 – – 19,977 45,878 9,336 6,015 69,067 106 0 60,721
Reformulated ................................................ – – – – – 4,326 6,875 4,095 3,077 12,212 7 0 21,799Conventional ................................................. – – -3 – – 15,651 39,003 5,240 2,938 56,855 98 0 38,922
Aviation Gasoline Blend. Comp. ....................... – – – – – – – – – – – – – – –
Finished Petroleum Products ............................ – – – 115,381 8,138 47,844 -7,309 -7,570 – – 6,452 165,171 64,036Finished Motor Gasoline ................................... – – – 96,729 729 7,958 -7,770 161 – – 27 97,458 3,827
Reformulated ................................................ – – – 38,737 – – -3,921 -12 – – – 34,828 17Conventional ................................................. – – – 57,992 729 7,958 -3,848 173 – – 27 62,630 3,810
Finished Aviation Gasoline ............................... – – – – – 1 103 – – 5 – – – 99 201Kerosene-Type Jet Fuel ................................... – – – – 3,107 1,202 15,372 – – 343 – – 766 18,572 9,208Kerosene .......................................................... – – – – 24 – – – – -175 – – 0 199 1,193Distillate Fuel Oil6 ............................................. – – – – 10,766 2,178 22,472 460 -7,772 – – 3,679 39,969 33,032
15 ppm sulfur and under ............................... – – – – 10,293 1,900 19,710 460 -6,273 – – 2,700 35,937 27,479Greater than 15 ppm to 500 ppm sulfur ........ – – – – 100 41 – – – -423 – – 300 264 2,114Greater than 500 ppm sulfur ......................... – – – – 373 237 2,762 – – -1,076 – – 680 3,768 3,439
Residual Fuel Oil7 ............................................ – – – – 1,094 2,946 – – – -1,076 – – 537 4,579 6,808Less than 0.31 percent sulfur ....................... – – – – 345 – – – – 104 – – NA NA 1,0220.31 to 1.00 percent sulfur ............................ – – – – 297 – – – – -432 – – NA NA 1,245Greater than 1.00 percent sulfur ................... – – – – 452 2,946 – – – -748 – – NA NA 4,541
Petrochemical Feedstocks ............................... – – – – 102 – 36 – – 2 – – – – 136 91Naphtha for Petro. Feed. Use ....................... – – – – 102 – 36 – – 2 – – – – 136 91Other Oils for Petro. Feed. Use .................... – – – – – – – – – – – – – – – –
Special Naphthas ............................................. – – – – 12 – – – – -2 – – – – 14 39Lubricants ......................................................... – – – – 390 225 563 – – 82 – – 176 920 1,047Waxes ............................................................... – – – – 14 95 – – – -50 – – 62 97 497Petroleum Coke ................................................ – – – – 1,057 1 242 – – – – – 1,135 165 –
Marketable .................................................... – – – – 380 1 242 – – – – – 1,135 -512 –Catalyst ......................................................... – – – – 677 – – – – – – – – – – – – 677 – –
Asphalt and Road Oil ........................................ – – – – 658 761 1,097 – – 904 – – 53 1,559 8,058Still Gas ............................................................ – – – – 1,339 – – – – – – – – – – – – 1,339 – –Miscellaneous Products .................................... – – – – 89 – – – – 8 – – 15 66 35
Total ..................................................................... 14,998 919 116,853 57,747 110,027 1,453 2,643 115,306 8,832 175,214 159,996
– – = Not Applicable.– = No Data Reported.
NA = Not Available.1 Represents the PAD District in which the material entered the United States and not necessarily where the crude oil or product is processed and/or consumed.2 A negative number indicates a decrease in stocks and a positive number indicates an increase in stocks. Stock change for crude oil excludes lease stocks beginning with January 2005 (see explanatory notes).3 Includes an adjustment for crude oil, previously referred to as ’Unaccounted For Crude Oil.’ Also included is an adjustment for motor gasoline blending components, fuel ethanol, and distillate fuel oil. See
Appendix B, Note 2C for a detailed explanation of these adjustments.4 A negative number indicates a decrease in stocks and a positive number indicates an increase in stocks. Stock change for crude oil excludes lease stocks beginning with January 2005 (see explanatory notes).5 Product supplied is equal to field production, plus renewable fuels and oxygenate plant net production, plus refinery and blender net production, plus imports, plus net receipts, plus adjustments, minus stock
change, minus refinery and blender net inputs, minus exports.6 Excludes stocks located in the “Northeast Heating Oil Reserve”, “Northeast Regional Refined Petroleum Product Reserve”, and “State of New York’s Strategic Fuels Reserve Program”. For details see Appendix
D.7 Total residual fuel oil ending stocks and stock change include stocks held at pipelines. Residual fuel oil ending stocks and stock change by sulfur content exclude pipeline stocks. Therefore, the sum of residual
fuel oil ending stocks and stock change by sulfur content may not equal total residual fuel oil ending stocks and stock change.Notes: Totals may not equal sum of components due to independent rounding. Domestic crude oil field production are estimates.Sources: Energy Information Administration (EIA) Forms EIA-22M "Monthly Biodiesel Production Survey", Forms EIA-810, "Monthly Refinery Report," EIA-812, "Monthly Product Pipeline Report," EIA-813, "MonthlyCrude Oil Report," EIA-814, "Monthly Imports Report," EIA-815, "Monthly Bulk Terminal and Blender Report," EIA-816, "Monthly Natural Gas Liquids Report," EIA-817, "Monthly Tanker and Barge Movements Report,"and EIA-819, "Monthly Oxygenate Report." Domestic crude oil field production estimates based on Form EIA-914, "Monthly Crude Oil and Lease Condensate, and Natural Gas Production Report," and data from Stateconservation agencies, U.S. Department of Interior, and the Bureau of Ocean Energy Management. Export data from the U.S. Census Bureau and EIA estimates. Rail net receipts estimates based on EIA analysis ofdata from the Surface Transportation Board and other information.

Energy Information Administration/Petroleum Supply Monthly, 11 April 2018
Table 5. PAD District 1 - Supply, Disposition, and Ending Stocks of Crude Oil and Petroleum Products, April 2018(Thousand Barrels)
Commodity
Supply Disposition
EndingStocks
FieldProduction
RenewableFuels andOxygenatePlant Net
Production
Refineryand
BlenderNet
Production
Imports(PADD ofEntry)1
NetReceipts2
Adjust-ments3
StockChange4
Refineryand
BlenderNet
Inputs ExportsProductsSupplied5
Crude Oil ............................................................. 1,582 – – – – 26,688 7,820 1,339 3,361 33,308 760 0 15,128
Hydrocarbon Gas Liquids .................................. 13,416 -11 1,472 1,261 -3,107 – – 306 1,034 1,442 10,249 4,509Natural Gas Liquids .......................................... 13,416 -11 1,100 1,206 -3,354 – – 281 1,034 1,442 9,600 4,354
Ethane .......................................................... 5,436 – – – – – – – -31 – – 0 5 367Propane ........................................................ 4,635 – – 735 1,122 2,576 – – 165 – – 1,188 7,715 2,699Normal Butane .............................................. 1,377 – – 380 18 -77 – – 261 535 185 717 960Isobutane ...................................................... 690 – – -15 66 -161 – – -60 425 1 214 143Natural Gasoline ........................................... 1,278 -11 – – – -230 – – -54 74 68 949 185
Refinery Olefins ................................................ – – – – 372 55 – – – 25 – – – – 649 155Ethylene ........................................................ – – – – – – – – – – – – – – – –Propylene ..................................................... – – – – 399 55 – – – 58 – – – – 643 88Butylene ........................................................ – – – – -48 – – – – -60 – – – – 12 40Isobutylene ................................................... – – – – 21 – – – – 27 – – – – -6 27
Other Liquids ...................................................... – – 930 – – 21,660 57,470 7,423 6,546 80,964 179 -206 76,323Hydrogen/Oxygenates/Renewables/ Other Hydrocarbons ....................................... – – 933 – – 170 11,619 -1,912 346 10,419 44 0 9,227
Hydrogen ...................................................... – – – – – – – – 113 – – 113 – 0 – –Oxygenates (excluding Fuel Ethanol) ........... – – – – – – – 1 – – 1 0 –Renewable Fuels (including Fuel Ethanol) ... – – 933 – – 170 11,619 -2,026 346 10,306 44 0 9,227
Fuel Ethanol ............................................. – – 711 – – – 11,384 -1,566 495 10,000 34 0 7,499Renewable Fuels Except Fuel Ethanol ..... – – 222 – – 170 236 -460 -149 306 10 0 1,728
Other Hydrocarbons ..................................... – – – – – – – – – – – – – –Unfinished Oils ................................................. – – – – – – 1,513 -27 – – 185 1,478 29 -206 6,375Motor Gasoline Blend.Comp. (MGBC) ............. – – -3 – – 19,977 45,878 9,336 6,015 69,067 106 0 60,721
Reformulated ................................................ – – – – – 4,326 6,875 4,095 3,077 12,212 7 0 21,799Conventional ................................................. – – -3 – – 15,651 39,003 5,240 2,938 56,855 98 0 38,922
Aviation Gasoline Blend. Comp. ....................... – – – – – – – – – – – – – – –
Finished Petroleum Products ............................ – – – 115,381 8,138 47,844 -7,309 -7,570 – – 6,452 165,171 64,036Finished Motor Gasoline ................................... – – – 96,729 729 7,958 -7,770 161 – – 27 97,458 3,827
Reformulated ................................................ – – – 38,737 – – -3,921 -12 – – – 34,828 17Conventional ................................................. – – – 57,992 729 7,958 -3,848 173 – – 27 62,630 3,810
Finished Aviation Gasoline ............................... – – – – – 1 103 – – 5 – – – 99 201Kerosene-Type Jet Fuel ................................... – – – – 3,107 1,202 15,372 – – 343 – – 766 18,572 9,208Kerosene .......................................................... – – – – 24 – – – – -175 – – 0 199 1,193Distillate Fuel Oil6 ............................................. – – – – 10,766 2,178 22,472 460 -7,772 – – 3,679 39,969 33,032
15 ppm sulfur and under ............................... – – – – 10,293 1,900 19,710 460 -6,273 – – 2,700 35,937 27,479Greater than 15 ppm to 500 ppm sulfur ........ – – – – 100 41 – – – -423 – – 300 264 2,114Greater than 500 ppm sulfur ......................... – – – – 373 237 2,762 – – -1,076 – – 680 3,768 3,439
Residual Fuel Oil7 ............................................ – – – – 1,094 2,946 – – – -1,076 – – 537 4,579 6,808Less than 0.31 percent sulfur ....................... – – – – 345 – – – – 104 – – NA NA 1,0220.31 to 1.00 percent sulfur ............................ – – – – 297 – – – – -432 – – NA NA 1,245Greater than 1.00 percent sulfur ................... – – – – 452 2,946 – – – -748 – – NA NA 4,541
Petrochemical Feedstocks ............................... – – – – 102 – 36 – – 2 – – – – 136 91Naphtha for Petro. Feed. Use ....................... – – – – 102 – 36 – – 2 – – – – 136 91Other Oils for Petro. Feed. Use .................... – – – – – – – – – – – – – – – –
Special Naphthas ............................................. – – – – 12 – – – – -2 – – – – 14 39Lubricants ......................................................... – – – – 390 225 563 – – 82 – – 176 920 1,047Waxes ............................................................... – – – – 14 95 – – – -50 – – 62 97 497Petroleum Coke ................................................ – – – – 1,057 1 242 – – – – – 1,135 165 –
Marketable .................................................... – – – – 380 1 242 – – – – – 1,135 -512 –Catalyst ......................................................... – – – – 677 – – – – – – – – – – – – 677 – –
Asphalt and Road Oil ........................................ – – – – 658 761 1,097 – – 904 – – 53 1,559 8,058Still Gas ............................................................ – – – – 1,339 – – – – – – – – – – – – 1,339 – –Miscellaneous Products .................................... – – – – 89 – – – – 8 – – 15 66 35
Total ..................................................................... 14,998 919 116,853 57,747 110,027 1,453 2,643 115,306 8,832 175,214 159,996
– – = Not Applicable.– = No Data Reported.
NA = Not Available.1 Represents the PAD District in which the material entered the United States and not necessarily where the crude oil or product is processed and/or consumed.2 A negative number indicates a decrease in stocks and a positive number indicates an increase in stocks. Stock change for crude oil excludes lease stocks beginning with January 2005 (see explanatory notes).3 Includes an adjustment for crude oil, previously referred to as ’Unaccounted For Crude Oil.’ Also included is an adjustment for motor gasoline blending components, fuel ethanol, and distillate fuel oil. See
Appendix B, Note 2C for a detailed explanation of these adjustments.4 A negative number indicates a decrease in stocks and a positive number indicates an increase in stocks. Stock change for crude oil excludes lease stocks beginning with January 2005 (see explanatory notes).5 Product supplied is equal to field production, plus renewable fuels and oxygenate plant net production, plus refinery and blender net production, plus imports, plus net receipts, plus adjustments, minus stock
change, minus refinery and blender net inputs, minus exports.6 Excludes stocks located in the “Northeast Heating Oil Reserve”, “Northeast Regional Refined Petroleum Product Reserve”, and “State of New York’s Strategic Fuels Reserve Program”. For details see Appendix
D.7 Total residual fuel oil ending stocks and stock change include stocks held at pipelines. Residual fuel oil ending stocks and stock change by sulfur content exclude pipeline stocks. Therefore, the sum of residual
fuel oil ending stocks and stock change by sulfur content may not equal total residual fuel oil ending stocks and stock change.Notes: Totals may not equal sum of components due to independent rounding. Domestic crude oil field production are estimates.Sources: Energy Information Administration (EIA) Forms EIA-22M "Monthly Biodiesel Production Survey", Forms EIA-810, "Monthly Refinery Report," EIA-812, "Monthly Product Pipeline Report," EIA-813, "MonthlyCrude Oil Report," EIA-814, "Monthly Imports Report," EIA-815, "Monthly Bulk Terminal and Blender Report," EIA-816, "Monthly Natural Gas Liquids Report," EIA-817, "Monthly Tanker and Barge Movements Report,"and EIA-819, "Monthly Oxygenate Report." Domestic crude oil field production estimates based on Form EIA-914, "Monthly Crude Oil and Lease Condensate, and Natural Gas Production Report," and data from Stateconservation agencies, U.S. Department of Interior, and the Bureau of Ocean Energy Management. Export data from the U.S. Census Bureau and EIA estimates. Rail net receipts estimates based on EIA analysis ofdata from the Surface Transportation Board and other information.
Table 6. PAD District 1 - Year-to-Date Supply, Disposition, and Ending Stocks of Crude Oil and Petroleum Products, January-April 2018(Thousand Barrels)
Commodity
Supply Disposition
EndingStocks
FieldProduction
RenewableFuels andOxygenatePlant Net
Production
Refineryand
BlenderNet
Production
Imports(PADD ofEntry)1
NetReceipts2
Adjust-ments3
StockChange4
Refineryand
BlenderNet
Inputs ExportsProductsSupplied5
Crude Oil ............................................................. 6,236 – – – – 97,135 24,701 3,921 3,649 122,019 6,325 0 15,128
Hydrocarbon Gas Liquids .................................. 55,014 -50 3,189 7,977 -924 – – -3,968 5,794 7,190 56,190 4,509Natural Gas Liquids .......................................... 55,014 -50 2,200 7,314 -1,918 – – -3,791 5,794 7,190 53,367 –
Ethane .......................................................... 23,771 – – – – – – – -87 – – 2,713 2,826 –Propane ........................................................ 18,167 – – 2,442 6,933 16,266 – – -3,146 – – 3,995 42,959 –Normal Butane .............................................. 5,392 – – -97 128 784 – – -390 3,564 232 2,801 –Isobutane ...................................................... 2,701 – – -145 253 -166 – – -33 1,694 4 978 –Natural Gasoline ........................................... 4,983 -50 – – – -483 – – -135 536 246 3,803 –
Refinery Olefins ................................................ – – – – 989 663 – – – -177 – – – – 2,823 –Ethylene ........................................................ – – – – 5 – – – – – – – – – 5 –Propylene ..................................................... – – – – 1,077 663 – – – -66 – – – – 2,800 –Butylene ........................................................ – – – – -149 – – – – -108 – – – – -41 –Isobutylene ................................................... – – – – 56 – – – – -3 – – – – 59 –
Other Liquids ...................................................... – – 3,727 – – 66,585 224,020 27,670 7,194 314,107 1,050 -351 76,323Hydrogen/Oxygenates/Renewables/ Other Hydrocarbons ....................................... – – 3,739 – – 687 39,503 -2,258 416 40,676 578 0 9,227
Hydrogen ...................................................... – – – – – – – – 389 – – 389 – 0 – –Oxygenates (excluding Fuel Ethanol) ........... – – – – – – – 6 – – 6 0 –Renewable Fuels (including Fuel Ethanol) ... – – 3,739 – – 687 39,503 -2,653 416 40,287 572 0 9,227
Fuel Ethanol ............................................. – – 2,930 – – – 38,482 -1,312 485 39,084 531 0 7,499Renewable Fuels Except Fuel Ethanol ..... – – 809 – – 687 1,021 -1,341 -69 1,203 41 0 1,728
Other Hydrocarbons ..................................... – – – – – – – – – – – – – –Unfinished Oils ................................................. – – – – – – 3,715 -86 – – 1,162 2,731 87 -351 6,375Motor Gasoline Blend.Comp. (MGBC) ............. – – -12 – – 62,183 184,603 29,927 5,616 270,700 385 0 60,721
Reformulated ................................................ – – – – – 21,967 28,919 12,247 1,936 61,186 11 0 21,799Conventional ................................................. – – -12 – – 40,216 155,684 17,680 3,680 209,514 374 0 38,922
Aviation Gasoline Blend. Comp. ....................... – – – – – – – – – – – – – – –
Finished Petroleum Products ............................ – – – 444,121 48,674 192,096 -27,273 -19,043 – – 17,021 659,639 64,036Finished Motor Gasoline ................................... – – – 376,834 3,327 27,538 -28,615 -1,678 – – 223 380,539 3,827
Reformulated ................................................ – – – 151,895 – – -11,393 -7 – – – 140,509 17Conventional ................................................. – – – 224,939 3,327 27,538 -17,222 -1,671 – – 223 240,030 3,810
Finished Aviation Gasoline ............................... – – – – – 23 285 – – 26 – – – 282 201Kerosene-Type Jet Fuel ................................... – – – – 10,331 5,752 57,964 – – -301 – – 1,132 73,216 9,208Kerosene .......................................................... – – – – 398 506 286 – – -605 – – 5 1,790 1,193Distillate Fuel Oil6 ............................................. – – – – 37,103 21,961 98,520 1,342 -19,645 – – 6,000 172,571 33,032
15 ppm sulfur and under ............................... – – – – 31,825 18,149 88,859 1,342 -16,379 – – 4,061 152,492 27,479Greater than 15 ppm to 500 ppm sulfur ........ – – – – 67 759 642 – – -2,478 – – 938 3,008 2,114Greater than 500 ppm sulfur ......................... – – – – 5,211 3,053 9,019 – – -788 – – 1,000 17,071 3,439
Residual Fuel Oil7 ............................................ – – – – 4,869 13,347 164 – – -496 – – 3,791 15,085 6,808Less than 0.31 percent sulfur ....................... – – – – 991 692 – – – -168 – – NA NA 1,0220.31 to 1.00 percent sulfur ............................ – – – – 1,653 884 – – – -181 – – NA NA 1,245Greater than 1.00 percent sulfur ................... – – – – 2,225 11,771 164 – – -147 – – NA NA 4,541
Petrochemical Feedstocks ............................... – – – – 341 4 63 – – -7 – – – – 415 91Naphtha for Petro. Feed. Use ....................... – – – – 341 4 72 – – -7 – – – – 424 91Other Oils for Petro. Feed. Use .................... – – – – – – -9 – – – – – – – -9 –
Special Naphthas ............................................. – – – – 69 – – – – -8 – – – – 77 39Lubricants ......................................................... – – – – 1,603 718 1,688 – – -15 – – 1,465 2,559 1,047Waxes ............................................................... – – – – 33 289 – – – -30 – – 244 108 497Petroleum Coke ................................................ – – – – 3,925 171 1,583 – – – – – 3,809 1,870 –
Marketable .................................................... – – – – 1,577 171 1,583 – – – – – 3,809 -478 –Catalyst ......................................................... – – – – 2,348 – – – – – – – – – – – – 2,348 – –
Asphalt and Road Oil ........................................ – – – – 3,040 2,576 4,005 – – 3,710 – – 293 5,617 8,058Still Gas ............................................................ – – – – 5,241 – – – – – – – – – – – – 5,241 – –Miscellaneous Products .................................... – – – – 334 – – – – 6 – – 60 268 35
Total ..................................................................... 61,250 3,677 447,310 220,371 439,892 4,317 -12,168 441,920 31,586 715,479 159,996
– – = Not Applicable.– = No Data Reported.
NA = Not Available.1 Represents the PAD District in which the material entered the United States and not necessarily where the crude oil or product is processed and/or consumed.2 A negative number indicates a decrease in stocks and a positive number indicates an increase in stocks. Stock change for crude oil excludes lease stocks beginning with January 2005 (see explanatory notes).3 Includes an adjustment for crude oil, previously referred to as ’Unaccounted For Crude Oil.’ Also included is an adjustment for motor gasoline blending components, fuel ethanol, and distillate fuel oil. See
Appendix B, Note 2C for a detailed explanation of these adjustments.4 A negative number indicates a decrease in stocks and a positive number indicates an increase in stocks. Stock change for crude oil excludes lease stocks beginning with January 2005 (see explanatory notes).5 Product supplied is equal to field production, plus renewable fuels and oxygenate plant net production, plus refinery and blender net production, plus imports, plus net receipts, plus adjustments, minus stock
change, minus refinery and blender net inputs, minus exports.6 Excludes stocks located in the “Northeast Heating Oil Reserve”, “Northeast Regional Refined Petroleum Product Reserve”, and “State of New York’s Strategic Fuels Reserve Program”. For details see Appendix
D.7 Total residual fuel oil ending stocks and stock change include stocks held at pipelines. Residual fuel oil ending stocks and stock change by sulfur content exclude pipeline stocks. Therefore, the sum of residual
fuel oil ending stocks and stock change by sulfur content may not equal total residual fuel oil ending stocks and stock change.Notes: Totals may not equal sum of components due to independent rounding. Domestic crude oil field production are estimates.Sources: Energy Information Administration (EIA) Forms EIA-22M "Monthly Biodiesel Production Survey", Forms EIA-810, "Monthly Refinery Report," EIA-812, "Monthly Product Pipeline Report," EIA-813, "MonthlyCrude Oil Report," EIA-814, "Monthly Imports Report," EIA-815, "Monthly Bulk Terminal and Blender Report," EIA-816, "Monthly Natural Gas Liquids Report," EIA-817, "Monthly Tanker and Barge Movements Report,"and EIA-819, "Monthly Oxygenate Report." Domestic crude oil field production estimates based on Form EIA-914, "Monthly Crude Oil and Lease Condensate, and Natural Gas Production Report," and data from Stateconservation agencies, U.S. Department of Interior, and the Bureau of Ocean Energy Management. Export data from the U.S. Census Bureau and EIA estimates. Rail net receipts estimates based on EIA analysis ofdata from the Surface Transportation Board and other information.

Energy Information Administration/Petroleum Supply Monthly,12 April 2018
Table 7. PAD District 1 - Daily Average Supply and Disposition of Crude Oil and Petroleum Products, April 2018(Thousand Barrels per Day)
Commodity
Supply Disposition
FieldProduction
RenewableFuels andOxygenatePlant Net
Production
Refineryand
BlenderNet
Production
Imports(PADD ofEntry)1
NetReceipts2
Adjust-ments3
StockChange4
Refineryand
BlenderNet
Inputs ExportsProductsSupplied5
Crude Oil ............................................................. 53 – – – – 890 261 45 112 1,110 25 0
Hydrocarbon Gas Liquids .................................. 447 0 49 42 -104 – – 10 34 48 342Natural Gas Liquids .......................................... 447 0 37 40 -112 – – 9 34 48 320
Ethane .......................................................... 181 – – – – – – – -1 – – 0 0Propane ........................................................ 155 – – 25 37 86 – – 6 – – – 257Normal Butane .............................................. 46 – – 13 1 -3 – – 9 18 6 24Isobutane ...................................................... 23 – – -1 2 -5 – – -2 14 0 7Natural Gasoline ........................................... 43 0 – – – -8 – – -2 2 2 32
Refinery Olefins ................................................ – – – – 12 2 – – – 1 – – – – 22Ethylene ........................................................ – – – – – – – – – – – – – – –Propylene ..................................................... – – – – 13 2 8 – – 2 – – – – 21Butylene ........................................................ – – – – -2 – – – – -2 – – – – 0Isobutylene ................................................... – – – – 1 – – – – 1 – – – – 0
Other Liquids ...................................................... – – 31 – – 722 1,916 247 218 2,699 6 -7Hydrogen/Oxygenates/Renewables/ Other Hydrocarbons ....................................... – – 31 – – 6 387 -64 12 347 1 0
Hydrogen ...................................................... – – – – – – – – 4 – – 4 – 0Oxygenates (excluding Fuel Ethanol) ........... – – – – – – – 0 – – 0 0Renewable Fuels (including Fuel Ethanol) ... – – 31 – – 6 387 -68 12 344 1 0
Fuel Ethanol6 ............................................ – – 24 – – – 379 -52 17 333 1 0Renewable Fuels Except Fuel Ethanol ..... – – 7 – – 6 8 -15 -5 10 0 0
Other Hydrocarbons ..................................... – – – – – – – – – – – – –Unfinished Oils ................................................. – – – – – – 50 -1 – – 6 49 1 -7Motor Gasoline Blend.Comp. (MGBC)6 ........... – – 0 – – 666 1,529 311 201 2,302 4 0
Reformulated ................................................ – – – – – 144 229 137 103 407 0 0Conventional ................................................. – – 0 – – 522 1,300 175 98 1,895 3 0
Aviation Gasoline Blend. Comp. ....................... – – – – – – – – – – – – – –
Finished Petroleum Products ............................ – – – 3,846 271 1,595 -244 -252 – – 215 5,506Finished Motor Gasoline ................................... – – – 3,224 24 265 -259 5 – – 1 3,249
Reformulated ................................................ – – – 1,291 – – -131 0 – – – 1,161Conventional ................................................. – – – 1,933 24 265 -128 6 – – 1 2,088
Finished Aviation Gasoline ............................... – – – – – 0 3 – – 0 – – – 3Kerosene-Type Jet Fuel ................................... – – – – 104 40 512 – – 11 – – 26 619Kerosene .......................................................... – – – – 1 – – – – -6 – – 0 7Distillate Fuel Oil6 ............................................. – – – – 359 73 749 15 -259 – – 123 1,332
15 ppm sulfur and under ............................... – – – – 343 63 657 15 -209 – – 90 1,198Greater than 15 ppm to 500 ppm sulfur ........ – – – – 3 1 – – – -14 – – 10 9Greater than 500 ppm sulfur ......................... – – – – 12 8 92 – – -36 – – 23 126
Residual Fuel Oil7 ............................................ – – – – 36 98 – – – -36 – – 18 153Less than 0.31 percent sulfur ....................... – – – – 12 – – – – 3 – – NA NA0.31 to 1.00 percent sulfur ............................ – – – – 10 – – – – -14 – – NA NAGreater than 1.00 percent sulfur ................... – – – – 15 98 – – – -25 – – NA NA
Petrochemical Feedstocks ............................... – – – – 3 – 1 – – 0 – – – – 5Naphtha for Petro. Feed. Use ....................... – – – – 3 – 1 – – 0 – – – – 5Other Oils for Petro. Feed. Use .................... – – – – – – – – – – – – – – –
Special Naphthas ............................................. – – – – 0 – – – – 0 – – – – 0Lubricants ......................................................... – – – – 13 8 19 – – 3 – – 6 31Waxes ............................................................... – – – – 0 3 – – – -2 – – 2 3Petroleum Coke ................................................ – – – – 35 0 8 – – – – – 38 5
Marketable .................................................... – – – – 13 0 8 – – – – – 38 -17Catalyst ......................................................... – – – – 23 – – – – – – – – – – – – 23
Asphalt and Road Oil ........................................ – – – – 22 25 37 – – 30 – – 2 52Still Gas ............................................................ – – – – 45 – – – – – – – – – – – – 45Miscellaneous Products .................................... – – – – 3 – – – – 0 – – 0 2
Total ..................................................................... 500 31 3,895 1,925 3,668 48 88 3,844 294 5,840
– – = Not Applicable.– = No Data Reported.
NA = Not Available.1 Represents the PAD District in which the material entered the United States and not necessarily where the crude oil or product is processed and/or consumed.2 A negative number indicates a decrease in stocks and a positive number indicates an increase in stocks. Stock change for crude oil excludes lease stocks beginning with January 2005 (see explanatory notes).3 Includes an adjustment for crude oil, previously referred to as ’Unaccounted For Crude Oil.’ Also included is an adjustment for motor gasoline blending components, fuel ethanol, and distillate fuel oil. See
Appendix B, Note 2C for a detailed explanation of these adjustments.4 A negative number indicates a decrease in stocks and a positive number indicates an increase in stocks. Stock change for crude oil excludes lease stocks beginning with January 2005 (see explanatory notes).5 Product supplied is equal to field production, plus renewable fuels and oxygenate plant net production, plus refinery and blender net production, plus imports, plus net receipts, plus adjustments, minus stock
change, minus refinery and blender net inputs, minus exports.6 Excludes stocks located in the “Northeast Heating Oil Reserve”, “Northeast Regional Refined Petroleum Product Reserve”, and “State of New York’s Strategic Fuels Reserve Program”. For details see Appendix
D.7 Total residual fuel oil ending stocks and stock change include stocks held at pipelines. Residual fuel oil ending stocks and stock change by sulfur content exclude pipeline stocks. Therefore, the sum of residual
fuel oil ending stocks and stock change by sulfur content may not equal total residual fuel oil ending stocks and stock change.Notes: Totals may not equal sum of components due to independent rounding. Domestic crude oil field production are estimates.Sources: Energy Information Administration (EIA) Forms EIA-22M "Monthly Biodiesel Production Survey", Forms EIA-810, "Monthly Refinery Report," EIA-812, "Monthly Product Pipeline Report," EIA-813, "MonthlyCrude Oil Report," EIA-814, "Monthly Imports Report," EIA-815, "Monthly Bulk Terminal and Blender Report," EIA-816, "Monthly Natural Gas Liquids Report," EIA-817, "Monthly Tanker and Barge Movements Report,"and EIA-819, "Monthly Oxygenate Report." Domestic crude oil field production estimates based on Form EIA-914, "Monthly Crude Oil and Lease Condensate, and Natural Gas Production Report," and data from Stateconservation agencies, U.S. Department of Interior, and the Bureau of Ocean Energy Management. Export data from the U.S. Census Bureau and EIA estimates. Rail net receipts estimates based on EIA analysis ofdata from the Surface Transportation Board and other information.

Energy Information Administration/Petroleum Supply Monthly, 13 April 2018
Table 7. PAD District 1 - Daily Average Supply and Disposition of Crude Oil and Petroleum Products, April 2018(Thousand Barrels per Day)
Commodity
Supply Disposition
FieldProduction
RenewableFuels andOxygenatePlant Net
Production
Refineryand
BlenderNet
Production
Imports(PADD ofEntry)1
NetReceipts2
Adjust-ments3
StockChange4
Refineryand
BlenderNet
Inputs ExportsProductsSupplied5
Crude Oil ............................................................. 53 – – – – 890 261 45 112 1,110 25 0
Hydrocarbon Gas Liquids .................................. 447 0 49 42 -104 – – 10 34 48 342Natural Gas Liquids .......................................... 447 0 37 40 -112 – – 9 34 48 320
Ethane .......................................................... 181 – – – – – – – -1 – – 0 0Propane ........................................................ 155 – – 25 37 86 – – 6 – – – 257Normal Butane .............................................. 46 – – 13 1 -3 – – 9 18 6 24Isobutane ...................................................... 23 – – -1 2 -5 – – -2 14 0 7Natural Gasoline ........................................... 43 0 – – – -8 – – -2 2 2 32
Refinery Olefins ................................................ – – – – 12 2 – – – 1 – – – – 22Ethylene ........................................................ – – – – – – – – – – – – – – –Propylene ..................................................... – – – – 13 2 8 – – 2 – – – – 21Butylene ........................................................ – – – – -2 – – – – -2 – – – – 0Isobutylene ................................................... – – – – 1 – – – – 1 – – – – 0
Other Liquids ...................................................... – – 31 – – 722 1,916 247 218 2,699 6 -7Hydrogen/Oxygenates/Renewables/ Other Hydrocarbons ....................................... – – 31 – – 6 387 -64 12 347 1 0
Hydrogen ...................................................... – – – – – – – – 4 – – 4 – 0Oxygenates (excluding Fuel Ethanol) ........... – – – – – – – 0 – – 0 0Renewable Fuels (including Fuel Ethanol) ... – – 31 – – 6 387 -68 12 344 1 0
Fuel Ethanol6 ............................................ – – 24 – – – 379 -52 17 333 1 0Renewable Fuels Except Fuel Ethanol ..... – – 7 – – 6 8 -15 -5 10 0 0
Other Hydrocarbons ..................................... – – – – – – – – – – – – –Unfinished Oils ................................................. – – – – – – 50 -1 – – 6 49 1 -7Motor Gasoline Blend.Comp. (MGBC)6 ........... – – 0 – – 666 1,529 311 201 2,302 4 0
Reformulated ................................................ – – – – – 144 229 137 103 407 0 0Conventional ................................................. – – 0 – – 522 1,300 175 98 1,895 3 0
Aviation Gasoline Blend. Comp. ....................... – – – – – – – – – – – – – –
Finished Petroleum Products ............................ – – – 3,846 271 1,595 -244 -252 – – 215 5,506Finished Motor Gasoline ................................... – – – 3,224 24 265 -259 5 – – 1 3,249
Reformulated ................................................ – – – 1,291 – – -131 0 – – – 1,161Conventional ................................................. – – – 1,933 24 265 -128 6 – – 1 2,088
Finished Aviation Gasoline ............................... – – – – – 0 3 – – 0 – – – 3Kerosene-Type Jet Fuel ................................... – – – – 104 40 512 – – 11 – – 26 619Kerosene .......................................................... – – – – 1 – – – – -6 – – 0 7Distillate Fuel Oil6 ............................................. – – – – 359 73 749 15 -259 – – 123 1,332
15 ppm sulfur and under ............................... – – – – 343 63 657 15 -209 – – 90 1,198Greater than 15 ppm to 500 ppm sulfur ........ – – – – 3 1 – – – -14 – – 10 9Greater than 500 ppm sulfur ......................... – – – – 12 8 92 – – -36 – – 23 126
Residual Fuel Oil7 ............................................ – – – – 36 98 – – – -36 – – 18 153Less than 0.31 percent sulfur ....................... – – – – 12 – – – – 3 – – NA NA0.31 to 1.00 percent sulfur ............................ – – – – 10 – – – – -14 – – NA NAGreater than 1.00 percent sulfur ................... – – – – 15 98 – – – -25 – – NA NA
Petrochemical Feedstocks ............................... – – – – 3 – 1 – – 0 – – – – 5Naphtha for Petro. Feed. Use ....................... – – – – 3 – 1 – – 0 – – – – 5Other Oils for Petro. Feed. Use .................... – – – – – – – – – – – – – – –
Special Naphthas ............................................. – – – – 0 – – – – 0 – – – – 0Lubricants ......................................................... – – – – 13 8 19 – – 3 – – 6 31Waxes ............................................................... – – – – 0 3 – – – -2 – – 2 3Petroleum Coke ................................................ – – – – 35 0 8 – – – – – 38 5
Marketable .................................................... – – – – 13 0 8 – – – – – 38 -17Catalyst ......................................................... – – – – 23 – – – – – – – – – – – – 23
Asphalt and Road Oil ........................................ – – – – 22 25 37 – – 30 – – 2 52Still Gas ............................................................ – – – – 45 – – – – – – – – – – – – 45Miscellaneous Products .................................... – – – – 3 – – – – 0 – – 0 2
Total ..................................................................... 500 31 3,895 1,925 3,668 48 88 3,844 294 5,840
– – = Not Applicable.– = No Data Reported.
NA = Not Available.1 Represents the PAD District in which the material entered the United States and not necessarily where the crude oil or product is processed and/or consumed.2 A negative number indicates a decrease in stocks and a positive number indicates an increase in stocks. Stock change for crude oil excludes lease stocks beginning with January 2005 (see explanatory notes).3 Includes an adjustment for crude oil, previously referred to as ’Unaccounted For Crude Oil.’ Also included is an adjustment for motor gasoline blending components, fuel ethanol, and distillate fuel oil. See
Appendix B, Note 2C for a detailed explanation of these adjustments.4 A negative number indicates a decrease in stocks and a positive number indicates an increase in stocks. Stock change for crude oil excludes lease stocks beginning with January 2005 (see explanatory notes).5 Product supplied is equal to field production, plus renewable fuels and oxygenate plant net production, plus refinery and blender net production, plus imports, plus net receipts, plus adjustments, minus stock
change, minus refinery and blender net inputs, minus exports.6 Excludes stocks located in the “Northeast Heating Oil Reserve”, “Northeast Regional Refined Petroleum Product Reserve”, and “State of New York’s Strategic Fuels Reserve Program”. For details see Appendix
D.7 Total residual fuel oil ending stocks and stock change include stocks held at pipelines. Residual fuel oil ending stocks and stock change by sulfur content exclude pipeline stocks. Therefore, the sum of residual
fuel oil ending stocks and stock change by sulfur content may not equal total residual fuel oil ending stocks and stock change.Notes: Totals may not equal sum of components due to independent rounding. Domestic crude oil field production are estimates.Sources: Energy Information Administration (EIA) Forms EIA-22M "Monthly Biodiesel Production Survey", Forms EIA-810, "Monthly Refinery Report," EIA-812, "Monthly Product Pipeline Report," EIA-813, "MonthlyCrude Oil Report," EIA-814, "Monthly Imports Report," EIA-815, "Monthly Bulk Terminal and Blender Report," EIA-816, "Monthly Natural Gas Liquids Report," EIA-817, "Monthly Tanker and Barge Movements Report,"and EIA-819, "Monthly Oxygenate Report." Domestic crude oil field production estimates based on Form EIA-914, "Monthly Crude Oil and Lease Condensate, and Natural Gas Production Report," and data from Stateconservation agencies, U.S. Department of Interior, and the Bureau of Ocean Energy Management. Export data from the U.S. Census Bureau and EIA estimates. Rail net receipts estimates based on EIA analysis ofdata from the Surface Transportation Board and other information.
Table 8. PAD District 1 - Year-to-Date Daily Average Supply and Disposition of Crude Oil and Petroleum Products, January-April 2018(Thousand Barrels per Day)
Commodity
Supply Disposition
FieldProduction
RenewableFuels andOxygenatePlant Net
Production
Refineryand
BlenderNet
Production
Imports(PADD ofEntry)1
NetReceipts2
Adjust-ments3
StockChange4
Refineryand
BlenderNet
Inputs ExportsProductsSupplied5
Crude Oil ............................................................. 52 – – – – 809 206 33 30 1,017 53 0
Hydrocarbon Gas Liquids .................................. 458 0 27 66 -8 – – -33 48 60 468Natural Gas Liquids .......................................... 458 0 18 61 -16 – – -32 48 60 445
Ethane .......................................................... 198 – – – – – – – -1 – – 23 24Propane ........................................................ 151 – – 20 58 136 – – -26 – – – 358Normal Butane .............................................. 45 – – -1 1 7 – – -3 30 2 23Isobutane ...................................................... 23 – – -1 2 -1 – – 0 14 0 8Natural Gasoline ........................................... 42 0 – – – -4 – – -1 4 2 32
Refinery Olefins ................................................ – – – – 8 6 – – – -1 – – – – 24Ethylene ........................................................ – – – – 0 – – – – – – – – – 0Propylene ..................................................... – – – – 9 6 8 – – -1 – – – – 23Butylene ........................................................ – – – – -1 – – – – -1 – – – – 0Isobutylene ................................................... – – – – 0 – – – – 0 – – – – 0
Other Liquids ...................................................... – – 31 – – 555 1,867 231 60 2,618 9 -3Hydrogen/Oxygenates/Renewables/ Other Hydrocarbons ....................................... – – 31 – – 6 329 -19 3 339 5 0
Hydrogen ...................................................... – – – – – – – – 3 – – 3 – 0Oxygenates (excluding Fuel Ethanol) ........... – – – – – – – 0 – – 0 0Renewable Fuels (including Fuel Ethanol) ... – – 31 – – 6 329 -22 3 336 5 0
Fuel Ethanol6 ............................................ – – 24 – – – 321 -11 4 326 4 0Renewable Fuels Except Fuel Ethanol ..... – – 7 – – 6 9 -11 -1 10 0 0
Other Hydrocarbons ..................................... – – – – – – – – – – – – –Unfinished Oils ................................................. – – – – – – 31 -1 – – 10 23 1 -3Motor Gasoline Blend.Comp. (MGBC)6 ........... – – 0 – – 518 1,538 249 47 2,256 3 0
Reformulated ................................................ – – – – – 183 241 102 16 510 0 0Conventional ................................................. – – 0 – – 335 1,297 147 31 1,746 3 0
Aviation Gasoline Blend. Comp. ....................... – – – – – – – – – – – – – –
Finished Petroleum Products ............................ – – – 3,701 406 1,601 -227 -159 – – 142 5,497Finished Motor Gasoline ................................... – – – 3,140 28 229 -238 -14 – – 2 3,171
Reformulated ................................................ – – – 1,266 – – -95 0 – – – 1,171Conventional ................................................. – – – 1,874 28 229 -144 -14 – – 2 2,000
Finished Aviation Gasoline ............................... – – – – – 0 2 – – 0 – – – 2Kerosene-Type Jet Fuel ................................... – – – – 86 48 483 – – -3 – – 9 610Kerosene .......................................................... – – – – 3 4 2 – – -5 – – 0 15Distillate Fuel Oil6 ............................................. – – – – 309 183 821 11 -164 – – 50 1,438
15 ppm sulfur and under ............................... – – – – 265 151 740 11 -136 – – 34 1,271Greater than 15 ppm to 500 ppm sulfur ........ – – – – 1 6 5 – – -21 – – 8 25Greater than 500 ppm sulfur ......................... – – – – 43 25 75 – – -7 – – 8 142
Residual Fuel Oil7 ............................................ – – – – 41 111 1 – – -4 – – 32 126Less than 0.31 percent sulfur ....................... – – – – 8 6 – – – -1 – – NA NA0.31 to 1.00 percent sulfur ............................ – – – – 14 7 – – – -2 – – NA NAGreater than 1.00 percent sulfur ................... – – – – 19 98 1 – – -1 – – NA NA
Petrochemical Feedstocks ............................... – – – – 3 0 1 – – 0 – – – – 3Naphtha for Petro. Feed. Use ....................... – – – – 3 0 1 – – 0 – – – – 4Other Oils for Petro. Feed. Use .................... – – – – – – 0 – – – – – – – 0
Special Naphthas ............................................. – – – – 1 – – – – 0 – – – – 1Lubricants ......................................................... – – – – 13 6 14 – – 0 – – 12 21Waxes ............................................................... – – – – 0 2 – – – 0 – – 2 1Petroleum Coke ................................................ – – – – 33 1 13 – – – – – 32 16
Marketable .................................................... – – – – 13 1 13 – – – – – 32 -4Catalyst ......................................................... – – – – 20 – – – – – – – – – – – – 20
Asphalt and Road Oil ........................................ – – – – 25 21 33 – – 31 – – 2 47Still Gas ............................................................ – – – – 44 – – – – – – – – – – – – 44Miscellaneous Products .................................... – – – – 3 – – – – 0 – – 1 2
Total ..................................................................... 510 31 3,728 1,836 3,666 36 -101 3,683 263 5,962
– – = Not Applicable.– = No Data Reported.
NA = Not Available.1 Represents the PAD District in which the material entered the United States and not necessarily where the crude oil or product is processed and/or consumed.2 A negative number indicates a decrease in stocks and a positive number indicates an increase in stocks. Stock change for crude oil excludes lease stocks beginning with January 2005 (see explanatory notes).3 Includes an adjustment for crude oil, previously referred to as ’Unaccounted For Crude Oil.’ Also included is an adjustment for motor gasoline blending components, fuel ethanol, and distillate fuel oil. See
Appendix B, Note 2C for a detailed explanation of these adjustments.4 A negative number indicates a decrease in stocks and a positive number indicates an increase in stocks. Stock change for crude oil excludes lease stocks beginning with January 2005 (see explanatory notes).5 Product supplied is equal to field production, plus renewable fuels and oxygenate plant net production, plus refinery and blender net production, plus imports, plus net receipts, plus adjustments, minus stock
change, minus refinery and blender net inputs, minus exports.6 Excludes stocks located in the “Northeast Heating Oil Reserve”, “Northeast Regional Refined Petroleum Product Reserve”, and “State of New York’s Strategic Fuels Reserve Program”. For details see Appendix
D.7 Total residual fuel oil ending stocks and stock change include stocks held at pipelines. Residual fuel oil ending stocks and stock change by sulfur content exclude pipeline stocks. Therefore, the sum of residual
fuel oil ending stocks and stock change by sulfur content may not equal total residual fuel oil ending stocks and stock change.Notes: Totals may not equal sum of components due to independent rounding. Domestic crude oil field production are estimates.Sources: Energy Information Administration (EIA) Forms EIA-22M "Monthly Biodiesel Production Survey", Forms EIA-810, "Monthly Refinery Report," EIA-812, "Monthly Product Pipeline Report," EIA-813, "MonthlyCrude Oil Report," EIA-814, "Monthly Imports Report," EIA-815, "Monthly Bulk Terminal and Blender Report," EIA-816, "Monthly Natural Gas Liquids Report," EIA-817, "Monthly Tanker and Barge Movements Report,"and EIA-819, "Monthly Oxygenate Report." Domestic crude oil field production estimates based on Form EIA-914, "Monthly Crude Oil and Lease Condensate, and Natural Gas Production Report," and data from Stateconservation agencies, U.S. Department of Interior, and the Bureau of Ocean Energy Management. Export data from the U.S. Census Bureau and EIA estimates. Rail net receipts estimates based on EIA analysis ofdata from the Surface Transportation Board and other information.

Energy Information Administration/Petroleum Supply Monthly,14 April 2018
Table 9. PAD District 2 - Supply, Disposition, and Ending Stocks of Crude Oil and Petroleum Products, April 2018(Thousand Barrels)
Commodity
Supply Disposition
EndingStocks
FieldProduction
RenewableFuels andOxygenatePlant Net
Production
Refineryand
BlenderNet
Production
Imports(PADD ofEntry)1
NetReceipts2
Adjust-ments3
StockChange4
Refineryand
BlenderNet
Inputs ExportsProductsSupplied5
Crude Oil ............................................................. 58,333 – – – – 86,196 -13,680 -6,795 3,335 117,135 3,585 0 124,905
Hydrocarbon Gas Liquids .................................. 29,589 -559 5,430 2,228 -8,178 – – 3,857 3,037 10,481 11,135 36,717Natural Gas Liquids .......................................... 29,589 -559 4,007 1,919 -7,441 – – 3,860 3,037 10,481 10,137 36,235
Ethane .......................................................... 11,459 – – – – – – – 659 – – 3,083 3,760 6,253Propane ........................................................ 10,038 – – 2,345 1,575 -8,685 – – 492 – – 238 4,543 10,237Normal Butane .............................................. 3,227 – – 1,758 170 -1,485 – – 2,369 412 514 375 8,109Isobutane ...................................................... 1,826 – – -96 170 135 – – -7 1,776 0 266 1,646Natural Gasoline ........................................... 3,039 -559 – – 4 6,551 – – 347 849 6,646 1,193 9,990
Refinery Olefins ................................................ – – – – 1,423 309 – – – -3 – – – – 998 482Ethylene ........................................................ – – – – – – – – – – – – – – – –Propylene ..................................................... – – – – 1,381 247 – – – 22 – – – – 869 350Butylene ........................................................ – – – – 42 62 – – – -25 – – – – 129 132Isobutylene ................................................... – – – – – – – – – 0 – – – – 0 0
Other Liquids ...................................................... – – 30,199 – – 274 -17,050 1,353 -1,600 14,905 3,219 -1,747 72,919Hydrogen/Oxygenates/Renewables/ Other Hydrocarbons ....................................... – – 30,200 – – 21 -22,492 1,370 -704 9,054 750 0 9,135
Hydrogen ...................................................... – – – – – – – – 1,186 – – 1,186 – 0 – –Oxygenates (excluding Fuel Ethanol) ........... – – – – – – – 2 0 – 2 0 6Renewable Fuels (including Fuel Ethanol) ... – – 30,200 – – 21 -22,492 149 -703 7,833 748 0 9,098
Fuel Ethanol ............................................. – – 27,963 – – – -21,796 1,003 -734 7,302 601 0 8,053Renewable Fuels Except Fuel Ethanol ..... – – 2,237 – – 21 -695 -854 31 531 147 0 1,045
Other Hydrocarbons ..................................... – – – – – – – – 34 -1 35 – 0 31Unfinished Oils ................................................. – – – – – – 22 -424 – – -15 -1,006 2,366 -1,747 13,383Motor Gasoline Blend.Comp. (MGBC) ............. – – -1 – – 231 5,866 -17 -881 6,857 103 0 50,401
Reformulated ................................................ – – – – – – 1,153 -572 -419 1,000 0 0 5,820Conventional ................................................. – – -1 – – 231 4,713 555 -462 5,857 103 0 44,581
Aviation Gasoline Blend. Comp. ....................... – – – – – – – – – – – – – – –
Finished Petroleum Products ............................ – – 149 136,441 789 281 -132 201 – – 1,113 136,214 64,527Finished Motor Gasoline ................................... – – 149 76,644 – -170 -985 722 – – 379 74,537 6,706
Reformulated ................................................ – – – 10,852 – – 620 – – – – 11,472 –Conventional ................................................. – – 149 65,792 – -170 -1,606 722 – – 379 63,065 6,706
Finished Aviation Gasoline ............................... – – – – 27 2 30 – – -23 – – – 82 182Kerosene-Type Jet Fuel ................................... – – – – 7,564 – 702 – – -316 – – 42 8,540 7,219Kerosene .......................................................... – – – – 8 – – – – 1 – – 3 4 99Distillate Fuel Oil ............................................... – – – – 34,348 91 1,925 854 -1,294 – – 47 38,465 30,951
15 ppm sulfur and under ............................... – – – – 34,519 9 1,812 854 -1,294 – – 0 38,487 30,252Greater than 15 ppm to 500 ppm sulfur ........ – – – – 10 – 113 – – 28 – – 31 64 273Greater than 500 ppm sulfur ......................... – – – – -181 82 – – – -28 – – 16 -87 426
Residual Fuel Oil6 ............................................ – – – – 1,489 32 -613 – – 123 – – 100 685 1,341Less than 0.31 percent sulfur ....................... – – – – 72 – -20 – – 63 – – NA NA 1050.31 to 1.00 percent sulfur ............................ – – – – 190 32 – – – 1 – – NA NA 153Greater than 1.00 percent sulfur ................... – – – – 1,227 – -593 – – 59 – – NA NA 1,083
Petrochemical Feedstocks ............................... – – – – 844 149 -113 – – -97 – – – – 977 536Naphtha for Petro. Feed. Use ....................... – – – – 551 80 -90 – – -90 – – – – 631 365Other Oils for Petro. Feed. Use .................... – – – – 293 69 -23 – – -7 – – – – 346 171
Special Naphthas ............................................. – – – – 55 46 29 – – -21 – – – – 151 118Lubricants ......................................................... – – – – 124 127 189 – – 2 – – 218 220 635Waxes ............................................................... – – – – 24 4 – – – 6 – – 26 -4 39Petroleum Coke ................................................ – – – – 5,878 24 -893 – – -80 – – 202 4,887 2,271
Marketable .................................................... – – – – 4,370 24 -893 – – -80 – – 202 3,379 2,271Catalyst ......................................................... – – – – 1,508 – – – – – – – – – – – – 1,508 – –
Asphalt and Road Oil ........................................ – – – – 4,520 313 -813 – – 1,158 – – 95 2,767 14,298Still Gas ............................................................ – – – – 4,407 – – – – – – – – – – – – 4,407 – –Miscellaneous Products .................................... – – – – 509 1 8 – – 20 – – 2 496 132
Total ..................................................................... 87,922 29,789 141,871 89,487 -38,626 -5,573 5,793 135,077 18,399 145,602 299,068
– – = Not Applicable.– = No Data Reported.
NA = Not Available.1 Represents the PAD District in which the material entered the United States and not necessarily where the crude oil or product is processed and/or consumed.2 A negative number indicates a decrease in stocks and a positive number indicates an increase in stocks. Stock change for crude oil excludes lease stocks beginning with January 2005 (see explanatory notes).3 Includes an adjustment for crude oil, previously referred to as ’Unaccounted For Crude Oil.’ Also included is an adjustment for motor gasoline blending components, fuel ethanol, and distillate fuel oil. See
Appendix B, Note 2C for a detailed explanation of these adjustments.4 A negative number indicates a decrease in stocks and a positive number indicates an increase in stocks. Stock change for crude oil excludes lease stocks beginning with January 2005 (see explanatory notes).5 Product supplied is equal to field production, plus renewable fuels and oxygenate plant net production, plus refinery and blender net production, plus imports, plus net receipts, plus adjustments, minus stock
change, minus refinery and blender net inputs, minus exports.6 Total residual fuel oil ending stocks and stock change include stocks held at pipelines. Residual fuel oil ending stocks and stock change by sulfur content exclude pipeline stocks. Therefore, the sum of residual
fuel oil ending stocks and stock change by sulfur content may not equal total residual fuel oil ending stocks and stock change.Notes: Totals may not equal sum of components due to independent rounding. Domestic crude oil field production are estimates.Sources: Energy Information Administration (EIA) Forms EIA-22M "Monthly Biodiesel Production Survey", Forms EIA-810, "Monthly Refinery Report," EIA-812, "Monthly Product Pipeline Report," EIA-813, "MonthlyCrude Oil Report," EIA-814, "Monthly Imports Report," EIA-815, "Monthly Bulk Terminal and Blender Report," EIA-816, "Monthly Natural Gas Liquids Report," EIA-817, "Monthly Tanker and Barge Movements Report,"and EIA-819, "Monthly Oxygenate Report." Domestic crude oil field production estimates based on Form EIA-914, "Monthly Crude Oil and Lease Condensate, and Natural Gas Production Report," and data from Stateconservation agencies, U.S. Department of Interior, and the Bureau of Ocean Energy Management. Export data from the U.S. Census Bureau and EIA estimates. Rail net receipts estimates based on EIA analysis ofdata from the Surface Transportation Board and other information.

Energy Information Administration/Petroleum Supply Monthly, 15 April 2018
Table 9. PAD District 2 - Supply, Disposition, and Ending Stocks of Crude Oil and Petroleum Products, April 2018(Thousand Barrels)
Commodity
Supply Disposition
EndingStocks
FieldProduction
RenewableFuels andOxygenatePlant Net
Production
Refineryand
BlenderNet
Production
Imports(PADD ofEntry)1
NetReceipts2
Adjust-ments3
StockChange4
Refineryand
BlenderNet
Inputs ExportsProductsSupplied5
Crude Oil ............................................................. 58,333 – – – – 86,196 -13,680 -6,795 3,335 117,135 3,585 0 124,905
Hydrocarbon Gas Liquids .................................. 29,589 -559 5,430 2,228 -8,178 – – 3,857 3,037 10,481 11,135 36,717Natural Gas Liquids .......................................... 29,589 -559 4,007 1,919 -7,441 – – 3,860 3,037 10,481 10,137 36,235
Ethane .......................................................... 11,459 – – – – – – – 659 – – 3,083 3,760 6,253Propane ........................................................ 10,038 – – 2,345 1,575 -8,685 – – 492 – – 238 4,543 10,237Normal Butane .............................................. 3,227 – – 1,758 170 -1,485 – – 2,369 412 514 375 8,109Isobutane ...................................................... 1,826 – – -96 170 135 – – -7 1,776 0 266 1,646Natural Gasoline ........................................... 3,039 -559 – – 4 6,551 – – 347 849 6,646 1,193 9,990
Refinery Olefins ................................................ – – – – 1,423 309 – – – -3 – – – – 998 482Ethylene ........................................................ – – – – – – – – – – – – – – – –Propylene ..................................................... – – – – 1,381 247 – – – 22 – – – – 869 350Butylene ........................................................ – – – – 42 62 – – – -25 – – – – 129 132Isobutylene ................................................... – – – – – – – – – 0 – – – – 0 0
Other Liquids ...................................................... – – 30,199 – – 274 -17,050 1,353 -1,600 14,905 3,219 -1,747 72,919Hydrogen/Oxygenates/Renewables/ Other Hydrocarbons ....................................... – – 30,200 – – 21 -22,492 1,370 -704 9,054 750 0 9,135
Hydrogen ...................................................... – – – – – – – – 1,186 – – 1,186 – 0 – –Oxygenates (excluding Fuel Ethanol) ........... – – – – – – – 2 0 – 2 0 6Renewable Fuels (including Fuel Ethanol) ... – – 30,200 – – 21 -22,492 149 -703 7,833 748 0 9,098
Fuel Ethanol ............................................. – – 27,963 – – – -21,796 1,003 -734 7,302 601 0 8,053Renewable Fuels Except Fuel Ethanol ..... – – 2,237 – – 21 -695 -854 31 531 147 0 1,045
Other Hydrocarbons ..................................... – – – – – – – – 34 -1 35 – 0 31Unfinished Oils ................................................. – – – – – – 22 -424 – – -15 -1,006 2,366 -1,747 13,383Motor Gasoline Blend.Comp. (MGBC) ............. – – -1 – – 231 5,866 -17 -881 6,857 103 0 50,401
Reformulated ................................................ – – – – – – 1,153 -572 -419 1,000 0 0 5,820Conventional ................................................. – – -1 – – 231 4,713 555 -462 5,857 103 0 44,581
Aviation Gasoline Blend. Comp. ....................... – – – – – – – – – – – – – – –
Finished Petroleum Products ............................ – – 149 136,441 789 281 -132 201 – – 1,113 136,214 64,527Finished Motor Gasoline ................................... – – 149 76,644 – -170 -985 722 – – 379 74,537 6,706
Reformulated ................................................ – – – 10,852 – – 620 – – – – 11,472 –Conventional ................................................. – – 149 65,792 – -170 -1,606 722 – – 379 63,065 6,706
Finished Aviation Gasoline ............................... – – – – 27 2 30 – – -23 – – – 82 182Kerosene-Type Jet Fuel ................................... – – – – 7,564 – 702 – – -316 – – 42 8,540 7,219Kerosene .......................................................... – – – – 8 – – – – 1 – – 3 4 99Distillate Fuel Oil ............................................... – – – – 34,348 91 1,925 854 -1,294 – – 47 38,465 30,951
15 ppm sulfur and under ............................... – – – – 34,519 9 1,812 854 -1,294 – – 0 38,487 30,252Greater than 15 ppm to 500 ppm sulfur ........ – – – – 10 – 113 – – 28 – – 31 64 273Greater than 500 ppm sulfur ......................... – – – – -181 82 – – – -28 – – 16 -87 426
Residual Fuel Oil6 ............................................ – – – – 1,489 32 -613 – – 123 – – 100 685 1,341Less than 0.31 percent sulfur ....................... – – – – 72 – -20 – – 63 – – NA NA 1050.31 to 1.00 percent sulfur ............................ – – – – 190 32 – – – 1 – – NA NA 153Greater than 1.00 percent sulfur ................... – – – – 1,227 – -593 – – 59 – – NA NA 1,083
Petrochemical Feedstocks ............................... – – – – 844 149 -113 – – -97 – – – – 977 536Naphtha for Petro. Feed. Use ....................... – – – – 551 80 -90 – – -90 – – – – 631 365Other Oils for Petro. Feed. Use .................... – – – – 293 69 -23 – – -7 – – – – 346 171
Special Naphthas ............................................. – – – – 55 46 29 – – -21 – – – – 151 118Lubricants ......................................................... – – – – 124 127 189 – – 2 – – 218 220 635Waxes ............................................................... – – – – 24 4 – – – 6 – – 26 -4 39Petroleum Coke ................................................ – – – – 5,878 24 -893 – – -80 – – 202 4,887 2,271
Marketable .................................................... – – – – 4,370 24 -893 – – -80 – – 202 3,379 2,271Catalyst ......................................................... – – – – 1,508 – – – – – – – – – – – – 1,508 – –
Asphalt and Road Oil ........................................ – – – – 4,520 313 -813 – – 1,158 – – 95 2,767 14,298Still Gas ............................................................ – – – – 4,407 – – – – – – – – – – – – 4,407 – –Miscellaneous Products .................................... – – – – 509 1 8 – – 20 – – 2 496 132
Total ..................................................................... 87,922 29,789 141,871 89,487 -38,626 -5,573 5,793 135,077 18,399 145,602 299,068
– – = Not Applicable.– = No Data Reported.
NA = Not Available.1 Represents the PAD District in which the material entered the United States and not necessarily where the crude oil or product is processed and/or consumed.2 A negative number indicates a decrease in stocks and a positive number indicates an increase in stocks. Stock change for crude oil excludes lease stocks beginning with January 2005 (see explanatory notes).3 Includes an adjustment for crude oil, previously referred to as ’Unaccounted For Crude Oil.’ Also included is an adjustment for motor gasoline blending components, fuel ethanol, and distillate fuel oil. See
Appendix B, Note 2C for a detailed explanation of these adjustments.4 A negative number indicates a decrease in stocks and a positive number indicates an increase in stocks. Stock change for crude oil excludes lease stocks beginning with January 2005 (see explanatory notes).5 Product supplied is equal to field production, plus renewable fuels and oxygenate plant net production, plus refinery and blender net production, plus imports, plus net receipts, plus adjustments, minus stock
change, minus refinery and blender net inputs, minus exports.6 Total residual fuel oil ending stocks and stock change include stocks held at pipelines. Residual fuel oil ending stocks and stock change by sulfur content exclude pipeline stocks. Therefore, the sum of residual
fuel oil ending stocks and stock change by sulfur content may not equal total residual fuel oil ending stocks and stock change.Notes: Totals may not equal sum of components due to independent rounding. Domestic crude oil field production are estimates.Sources: Energy Information Administration (EIA) Forms EIA-22M "Monthly Biodiesel Production Survey", Forms EIA-810, "Monthly Refinery Report," EIA-812, "Monthly Product Pipeline Report," EIA-813, "MonthlyCrude Oil Report," EIA-814, "Monthly Imports Report," EIA-815, "Monthly Bulk Terminal and Blender Report," EIA-816, "Monthly Natural Gas Liquids Report," EIA-817, "Monthly Tanker and Barge Movements Report,"and EIA-819, "Monthly Oxygenate Report." Domestic crude oil field production estimates based on Form EIA-914, "Monthly Crude Oil and Lease Condensate, and Natural Gas Production Report," and data from Stateconservation agencies, U.S. Department of Interior, and the Bureau of Ocean Energy Management. Export data from the U.S. Census Bureau and EIA estimates. Rail net receipts estimates based on EIA analysis ofdata from the Surface Transportation Board and other information.
Table 10. PAD District 2 - Year-to-Date Supply, Disposition, and Ending Stocks of Crude Oil and Petroleum Products, January-April 2018(Thousand Barrels)
Commodity
Supply Disposition
EndingStocks
FieldProduction
RenewableFuels andOxygenatePlant Net
Production
Refineryand
BlenderNet
Production
Imports(PADD ofEntry)1
NetReceipts2
Adjust-ments3
StockChange4
Refineryand
BlenderNet
Inputs ExportsProductsSupplied5
Crude Oil ............................................................. 228,448 – – – – 333,205 -72,132 -30,906 -6,838 449,709 15,743 0 124,905
Hydrocarbon Gas Liquids .................................. 111,544 -2,249 10,167 11,614 -36,214 – – -13,412 12,826 34,891 60,557 36,717Natural Gas Liquids .......................................... 111,544 -2,249 5,028 9,943 -33,552 – – -13,141 12,826 34,891 56,138 –
Ethane .......................................................... 40,964 – – – – – – – 1,220 – – 10,463 9,987 –Propane ........................................................ 39,419 – – 8,962 8,470 -28,841 – – -9,782 – – 696 37,096 –Normal Butane .............................................. 13,290 – – -27 593 -6,598 – – -3,706 3,932 1,204 2,652 –Isobutane ...................................................... 6,343 – – -726 862 179 – – -514 6,029 1 1,142 –Natural Gasoline ........................................... 11,528 -2,249 – – 18 21,002 – – -359 2,865 22,532 5,261 –
Refinery Olefins ................................................ – – – – 5,139 1,671 – – – -271 – – – – 4,419 –Ethylene ........................................................ – – – – – – – – – – – – – – – –Propylene ..................................................... – – – – 5,127 1,456 – – – -288 – – – – 4,209 –Butylene ........................................................ – – – – 12 215 – – – 17 – – – – 210 –Isobutylene ................................................... – – – – – – – – – 0 – – – – 0 –
Other Liquids ...................................................... – – 123,099 – – 1,925 -63,426 -1,837 3,399 53,619 10,695 -7,952 72,919Hydrogen/Oxygenates/Renewables/ Other Hydrocarbons ....................................... – – 123,103 – – 129 -89,311 2,384 -1,243 35,137 2,411 0 9,135
Hydrogen ...................................................... – – – – – – – – 4,639 – – 4,639 – 0 – –Oxygenates (excluding Fuel Ethanol) ........... – – – – – – – 3 -1 – 4 0 6Renewable Fuels (including Fuel Ethanol) ... – – 123,103 – – 129 -89,311 -2,382 -1,226 30,358 2,407 0 9,098
Fuel Ethanol ............................................. – – 114,483 – – – -85,972 1,250 -1,027 28,717 2,070 0 8,053Renewable Fuels Except Fuel Ethanol ..... – – 8,620 – – 129 -3,338 -3,632 -199 1,641 337 0 1,045
Other Hydrocarbons ..................................... – – – – – – – – 124 -16 140 – 0 31Unfinished Oils ................................................. – – – – – – 192 416 – – -85 473 8,172 -7,952 13,383Motor Gasoline Blend.Comp. (MGBC) ............. – – -4 – – 1,604 25,469 -4,221 4,727 18,009 112 0 50,401
Reformulated ................................................ – – – – – 64 6,609 -2,818 -343 4,197 1 0 5,820Conventional ................................................. – – -4 – – 1,540 18,860 -1,403 5,070 13,812 111 0 44,581
Aviation Gasoline Blend. Comp. ....................... – – – – – – – – – – – – – – –
Finished Petroleum Products ............................ – – 574 533,007 3,579 7,656 6,613 8,050 – – 2,994 540,385 64,527Finished Motor Gasoline ................................... – – 574 300,453 – 231 2,971 170 – – 600 303,460 6,706
Reformulated ................................................ – – – 43,385 – – 3,562 – – – – 46,947 –Conventional ................................................. – – 574 257,068 – 231 -590 170 – – 600 256,513 6,706
Finished Aviation Gasoline ............................... – – – – 147 5 32 – – 24 – – – 160 182Kerosene-Type Jet Fuel ................................... – – – – 29,940 – 4,061 – – 319 – – 159 33,523 7,219Kerosene .......................................................... – – – – 427 2 12 – – -21 – – 12 450 99Distillate Fuel Oil ............................................... – – – – 133,855 652 11,796 3,642 2,156 – – 246 147,543 30,951
15 ppm sulfur and under ............................... – – – – 133,703 465 11,443 3,642 2,120 – – 1 147,132 30,252Greater than 15 ppm to 500 ppm sulfur ........ – – – – 448 – 353 – – -51 – – 132 720 273Greater than 500 ppm sulfur ......................... – – – – -296 187 – – – 87 – – 113 -309 426
Residual Fuel Oil6 ............................................ – – – – 5,432 492 -2,798 – – 108 – – 558 2,460 1,341Less than 0.31 percent sulfur ....................... – – – – 72 1 -20 – – -4 – – NA NA 1050.31 to 1.00 percent sulfur ............................ – – – – 913 259 -226 – – -31 – – NA NA 153Greater than 1.00 percent sulfur ................... – – – – 4,447 232 -2,552 – – 143 – – NA NA 1,083
Petrochemical Feedstocks ............................... – – – – 3,394 632 -390 – – 48 – – – – 3,588 536Naphtha for Petro. Feed. Use ....................... – – – – 2,233 331 -308 – – 13 – – – – 2,243 365Other Oils for Petro. Feed. Use .................... – – – – 1,161 301 -82 – – 35 – – – – 1,345 171
Special Naphthas ............................................. – – – – 235 194 118 – – 17 – – – – 530 118Lubricants ......................................................... – – – – 545 606 869 – – -248 – – 744 1,524 635Waxes ............................................................... – – – – 92 20 – – – -24 – – 107 29 39Petroleum Coke ................................................ – – – – 22,208 100 -3,297 – – 754 – – 324 17,933 2,271
Marketable .................................................... – – – – 16,473 100 -3,297 – – 754 – – 324 12,198 2,271Catalyst ......................................................... – – – – 5,735 – – – – – – – – – – – – 5,735 – –
Asphalt and Road Oil ........................................ – – – – 17,256 871 -3,011 – – 4,740 – – 235 10,141 14,298Still Gas ............................................................ – – – – 17,093 – – – – – – – – – – – – 17,093 – –Miscellaneous Products .................................... – – – – 1,930 5 33 – – 7 – – 9 1,952 132
Total ..................................................................... 339,992 121,424 543,174 350,323 -164,117 -26,130 -8,801 516,154 64,324 592,989 299,068
– – = Not Applicable.– = No Data Reported.
NA = Not Available.1 Represents the PAD District in which the material entered the United States and not necessarily where the crude oil or product is processed and/or consumed.2 A negative number indicates a decrease in stocks and a positive number indicates an increase in stocks. Stock change for crude oil excludes lease stocks beginning with January 2005 (see explanatory notes).3 Includes an adjustment for crude oil, previously referred to as ’Unaccounted For Crude Oil.’ Also included is an adjustment for motor gasoline blending components, fuel ethanol, and distillate fuel oil. See
Appendix B, Note 2C for a detailed explanation of these adjustments.4 A negative number indicates a decrease in stocks and a positive number indicates an increase in stocks. Stock change for crude oil excludes lease stocks beginning with January 2005 (see explanatory notes).5 Product supplied is equal to field production, plus renewable fuels and oxygenate plant net production, plus refinery and blender net production, plus imports, plus net receipts, plus adjustments, minus stock
change, minus refinery and blender net inputs, minus exports.6 Total residual fuel oil ending stocks and stock change include stocks held at pipelines. Residual fuel oil ending stocks and stock change by sulfur content exclude pipeline stocks. Therefore, the sum of residual
fuel oil ending stocks and stock change by sulfur content may not equal total residual fuel oil ending stocks and stock change.Notes: Totals may not equal sum of components due to independent rounding. Domestic crude oil field production are estimates.Sources: Energy Information Administration (EIA) Forms EIA-22M "Monthly Biodiesel Production Survey", Forms EIA-810, "Monthly Refinery Report," EIA-812, "Monthly Product Pipeline Report," EIA-813, "MonthlyCrude Oil Report," EIA-814, "Monthly Imports Report," EIA-815, "Monthly Bulk Terminal and Blender Report," EIA-816, "Monthly Natural Gas Liquids Report," EIA-817, "Monthly Tanker and Barge Movements Report,"and EIA-819, "Monthly Oxygenate Report." Domestic crude oil field production estimates based on Form EIA-914, "Monthly Crude Oil and Lease Condensate, and Natural Gas Production Report," and data from Stateconservation agencies, U.S. Department of Interior, and the Bureau of Ocean Energy Management. Export data from the U.S. Census Bureau and EIA estimates. Rail net receipts estimates based on EIA analysis ofdata from the Surface Transportation Board and other information.

Energy Information Administration/Petroleum Supply Monthly,16 April 2018
Table 11. PAD District 2 - Daily Average Supply and Disposition of Crude Oil and Petroleum Products, April 2018(Thousand Barrels per Day)
Commodity
Supply Disposition
FieldProduction
RenewableFuels andOxygenatePlant Net
Production
Refineryand
BlenderNet
Production
Imports(PADD ofEntry)1
NetReceipts2
Adjust-ments3
StockChange4
Refineryand
BlenderNet
Inputs ExportsProductsSupplied5
Crude Oil ............................................................. 1,944 – – – – 2,873 -456 -226 111 3,905 120 0
Hydrocarbon Gas Liquids .................................. 986 -19 181 74 -273 – – 129 101 349 371Natural Gas Liquids .......................................... 986 -19 134 64 -248 – – 129 101 349 338
Ethane .......................................................... 382 – – – – – – – 22 – – 103 125Propane ........................................................ 335 – – 78 53 -290 – – 16 – – 8 151Normal Butane .............................................. 108 – – 3,278 6 -50 – – 79 14 17 13Isobutane ...................................................... 61 – – -3 6 5 – – 0 59 0 9Natural Gasoline ........................................... 101 -19 – – 0 218 – – 12 28 222 40
Refinery Olefins ................................................ – – – – 47 10 – – – 0 – – – – 33Ethylene ........................................................ – – – – – – – – – – – – – – –Propylene ..................................................... – – – – 46 8 -25 – – 1 – – – – 29Butylene ........................................................ – – – – 1 2 – – – -1 – – – – 4Isobutylene ................................................... – – – – – – – – – 0 – – – – 0
Other Liquids ...................................................... – – 1,007 – – 9 -568 45 -53 497 107 -58Hydrogen/Oxygenates/Renewables/ Other Hydrocarbons ....................................... – – 1,007 – – 1 -750 46 -23 302 25 0
Hydrogen ...................................................... – – – – – – – – 40 – – 40 – 0Oxygenates (excluding Fuel Ethanol) ........... – – – – – – – 0 0 – 0 0Renewable Fuels (including Fuel Ethanol) ... – – 1,007 – – 1 -750 5 -23 261 25 0
Fuel Ethanol ............................................. – – 932 – – – -727 33 -24 243 20 0Renewable Fuels Except Fuel Ethanol ..... – – 75 – – 1 -23 -28 1 18 5 0
Other Hydrocarbons ..................................... – – – – – – – – 1 0 1 – 0Unfinished Oils ................................................. – – – – – – 1 -14 – – -1 -34 79 -58Motor Gasoline Blend.Comp. (MGBC) ............. – – 0 – – 8 196 -1 -29 229 3 0
Reformulated ................................................ – – – – – – 38 -19 -14 33 0 0Conventional ................................................. – – 0 – – 8 157 18 -15 195 3 0
Aviation Gasoline Blend. Comp. ....................... – – – – – – – – – – – – – –
Finished Petroleum Products ............................ – – 5 4,548 26 9 -4 7 – – 37 4,540Finished Motor Gasoline ................................... – – 5 2,555 – -6 -33 24 – – 13 2,485
Reformulated ................................................ – – – 362 – – 21 – – – – 382Conventional ................................................. – – 5 2,193 – -6 -54 24 – – 13 2,102
Finished Aviation Gasoline ............................... – – – – 1 0 1 – – -1 – – – 3Kerosene-Type Jet Fuel ................................... – – – – 252 – 23 – – -11 – – 1 285Kerosene .......................................................... – – – – 0 – – – – 0 – – 0 0Distillate Fuel Oil ............................................... – – – – 1,145 3 64 28 -43 – – 2 1,282
15 ppm sulfur and under ............................... – – – – 1,151 0 60 28 -43 – – 0 1,283Greater than 15 ppm to 500 ppm sulfur ........ – – – – 0 – 4 – – 1 – – 1 2Greater than 500 ppm sulfur ......................... – – – – -6 3 – – – -1 – – 1 -3
Residual Fuel Oil6 ............................................ – – – – 50 1 -20 – – 4 – – 3 23Less than 0.31 percent sulfur ....................... – – – – 2 – -1 – – 2 – – NA NA0.31 to 1.00 percent sulfur ............................ – – – – 6 1 – – – 0 – – NA NAGreater than 1.00 percent sulfur ................... – – – – 41 – -20 – – 2 – – NA NA
Petrochemical Feedstocks ............................... – – – – 28 5 -4 – – -3 – – – – 33Naphtha for Petro. Feed. Use ....................... – – – – 18 3 -3 – – -3 – – – – 21Other Oils for Petro. Feed. Use .................... – – – – 10 2 -1 – – 0 – – – – 12
Special Naphthas ............................................. – – – – 2 2 1 – – -1 – – – – 5Lubricants ......................................................... – – – – 4 4 6 – – 0 – – 7 7Waxes ............................................................... – – – – 1 0 – – – 0 – – 1 0Petroleum Coke ................................................ – – – – 196 1 -30 – – -3 – – 7 163
Marketable .................................................... – – – – 146 1 -30 – – -3 – – 7 113Catalyst ......................................................... – – – – 50 – – – – – – – – – – – – 50
Asphalt and Road Oil ........................................ – – – – 151 10 -27 – – 39 – – 3 92Still Gas ............................................................ – – – – 147 – – – – – – – – – – – – 147Miscellaneous Products .................................... – – – – 17 0 0 – – 1 – – 0 17
Total ..................................................................... 2,931 993 4,729 2,983 -1,288 -186 193 4,503 613 4,853
– – = Not Applicable.– = No Data Reported.
NA = Not Available.1 Represents the PAD District in which the material entered the United States and not necessarily where the crude oil or product is processed and/or consumed.2 A negative number indicates a decrease in stocks and a positive number indicates an increase in stocks. Stock change for crude oil excludes lease stocks beginning with January 2005 (see explanatory notes).3 Includes an adjustment for crude oil, previously referred to as ’Unaccounted For Crude Oil.’ Also included is an adjustment for motor gasoline blending components, fuel ethanol, and distillate fuel oil. See
Appendix B, Note 2C for a detailed explanation of these adjustments.4 A negative number indicates a decrease in stocks and a positive number indicates an increase in stocks. Stock change for crude oil excludes lease stocks beginning with January 2005 (see explanatory notes).5 Product supplied is equal to field production, plus renewable fuels and oxygenate plant net production, plus refinery and blender net production, plus imports, plus net receipts, plus adjustments, minus stock
change, minus refinery and blender net inputs, minus exports.6 Total residual fuel oil ending stocks and stock change include stocks held at pipelines. Residual fuel oil ending stocks and stock change by sulfur content exclude pipeline stocks. Therefore, the sum of residual
fuel oil ending stocks and stock change by sulfur content may not equal total residual fuel oil ending stocks and stock change.Notes: Totals may not equal sum of components due to independent rounding. Domestic crude oil field production are estimates.Sources: Energy Information Administration (EIA) Forms EIA-22M "Monthly Biodiesel Production Survey", Forms EIA-810, "Monthly Refinery Report," EIA-812, "Monthly Product Pipeline Report," EIA-813, "MonthlyCrude Oil Report," EIA-814, "Monthly Imports Report," EIA-815, "Monthly Bulk Terminal and Blender Report," EIA-816, "Monthly Natural Gas Liquids Report," EIA-817, "Monthly Tanker and Barge Movements Report,"and EIA-819, "Monthly Oxygenate Report." Domestic crude oil field production estimates based on Form EIA-914, "Monthly Crude Oil and Lease Condensate, and Natural Gas Production Report," and data from Stateconservation agencies, U.S. Department of Interior, and the Bureau of Ocean Energy Management. Export data from the U.S. Census Bureau and EIA estimates. Rail net receipts estimates based on EIA analysis ofdata from the Surface Transportation Board and other information.

Energy Information Administration/Petroleum Supply Monthly, 17 April 2018
Table 11. PAD District 2 - Daily Average Supply and Disposition of Crude Oil and Petroleum Products, April 2018(Thousand Barrels per Day)
Commodity
Supply Disposition
FieldProduction
RenewableFuels andOxygenatePlant Net
Production
Refineryand
BlenderNet
Production
Imports(PADD ofEntry)1
NetReceipts2
Adjust-ments3
StockChange4
Refineryand
BlenderNet
Inputs ExportsProductsSupplied5
Crude Oil ............................................................. 1,944 – – – – 2,873 -456 -226 111 3,905 120 0
Hydrocarbon Gas Liquids .................................. 986 -19 181 74 -273 – – 129 101 349 371Natural Gas Liquids .......................................... 986 -19 134 64 -248 – – 129 101 349 338
Ethane .......................................................... 382 – – – – – – – 22 – – 103 125Propane ........................................................ 335 – – 78 53 -290 – – 16 – – 8 151Normal Butane .............................................. 108 – – 3,278 6 -50 – – 79 14 17 13Isobutane ...................................................... 61 – – -3 6 5 – – 0 59 0 9Natural Gasoline ........................................... 101 -19 – – 0 218 – – 12 28 222 40
Refinery Olefins ................................................ – – – – 47 10 – – – 0 – – – – 33Ethylene ........................................................ – – – – – – – – – – – – – – –Propylene ..................................................... – – – – 46 8 -25 – – 1 – – – – 29Butylene ........................................................ – – – – 1 2 – – – -1 – – – – 4Isobutylene ................................................... – – – – – – – – – 0 – – – – 0
Other Liquids ...................................................... – – 1,007 – – 9 -568 45 -53 497 107 -58Hydrogen/Oxygenates/Renewables/ Other Hydrocarbons ....................................... – – 1,007 – – 1 -750 46 -23 302 25 0
Hydrogen ...................................................... – – – – – – – – 40 – – 40 – 0Oxygenates (excluding Fuel Ethanol) ........... – – – – – – – 0 0 – 0 0Renewable Fuels (including Fuel Ethanol) ... – – 1,007 – – 1 -750 5 -23 261 25 0
Fuel Ethanol ............................................. – – 932 – – – -727 33 -24 243 20 0Renewable Fuels Except Fuel Ethanol ..... – – 75 – – 1 -23 -28 1 18 5 0
Other Hydrocarbons ..................................... – – – – – – – – 1 0 1 – 0Unfinished Oils ................................................. – – – – – – 1 -14 – – -1 -34 79 -58Motor Gasoline Blend.Comp. (MGBC) ............. – – 0 – – 8 196 -1 -29 229 3 0
Reformulated ................................................ – – – – – – 38 -19 -14 33 0 0Conventional ................................................. – – 0 – – 8 157 18 -15 195 3 0
Aviation Gasoline Blend. Comp. ....................... – – – – – – – – – – – – – –
Finished Petroleum Products ............................ – – 5 4,548 26 9 -4 7 – – 37 4,540Finished Motor Gasoline ................................... – – 5 2,555 – -6 -33 24 – – 13 2,485
Reformulated ................................................ – – – 362 – – 21 – – – – 382Conventional ................................................. – – 5 2,193 – -6 -54 24 – – 13 2,102
Finished Aviation Gasoline ............................... – – – – 1 0 1 – – -1 – – – 3Kerosene-Type Jet Fuel ................................... – – – – 252 – 23 – – -11 – – 1 285Kerosene .......................................................... – – – – 0 – – – – 0 – – 0 0Distillate Fuel Oil ............................................... – – – – 1,145 3 64 28 -43 – – 2 1,282
15 ppm sulfur and under ............................... – – – – 1,151 0 60 28 -43 – – 0 1,283Greater than 15 ppm to 500 ppm sulfur ........ – – – – 0 – 4 – – 1 – – 1 2Greater than 500 ppm sulfur ......................... – – – – -6 3 – – – -1 – – 1 -3
Residual Fuel Oil6 ............................................ – – – – 50 1 -20 – – 4 – – 3 23Less than 0.31 percent sulfur ....................... – – – – 2 – -1 – – 2 – – NA NA0.31 to 1.00 percent sulfur ............................ – – – – 6 1 – – – 0 – – NA NAGreater than 1.00 percent sulfur ................... – – – – 41 – -20 – – 2 – – NA NA
Petrochemical Feedstocks ............................... – – – – 28 5 -4 – – -3 – – – – 33Naphtha for Petro. Feed. Use ....................... – – – – 18 3 -3 – – -3 – – – – 21Other Oils for Petro. Feed. Use .................... – – – – 10 2 -1 – – 0 – – – – 12
Special Naphthas ............................................. – – – – 2 2 1 – – -1 – – – – 5Lubricants ......................................................... – – – – 4 4 6 – – 0 – – 7 7Waxes ............................................................... – – – – 1 0 – – – 0 – – 1 0Petroleum Coke ................................................ – – – – 196 1 -30 – – -3 – – 7 163
Marketable .................................................... – – – – 146 1 -30 – – -3 – – 7 113Catalyst ......................................................... – – – – 50 – – – – – – – – – – – – 50
Asphalt and Road Oil ........................................ – – – – 151 10 -27 – – 39 – – 3 92Still Gas ............................................................ – – – – 147 – – – – – – – – – – – – 147Miscellaneous Products .................................... – – – – 17 0 0 – – 1 – – 0 17
Total ..................................................................... 2,931 993 4,729 2,983 -1,288 -186 193 4,503 613 4,853
– – = Not Applicable.– = No Data Reported.
NA = Not Available.1 Represents the PAD District in which the material entered the United States and not necessarily where the crude oil or product is processed and/or consumed.2 A negative number indicates a decrease in stocks and a positive number indicates an increase in stocks. Stock change for crude oil excludes lease stocks beginning with January 2005 (see explanatory notes).3 Includes an adjustment for crude oil, previously referred to as ’Unaccounted For Crude Oil.’ Also included is an adjustment for motor gasoline blending components, fuel ethanol, and distillate fuel oil. See
Appendix B, Note 2C for a detailed explanation of these adjustments.4 A negative number indicates a decrease in stocks and a positive number indicates an increase in stocks. Stock change for crude oil excludes lease stocks beginning with January 2005 (see explanatory notes).5 Product supplied is equal to field production, plus renewable fuels and oxygenate plant net production, plus refinery and blender net production, plus imports, plus net receipts, plus adjustments, minus stock
change, minus refinery and blender net inputs, minus exports.6 Total residual fuel oil ending stocks and stock change include stocks held at pipelines. Residual fuel oil ending stocks and stock change by sulfur content exclude pipeline stocks. Therefore, the sum of residual
fuel oil ending stocks and stock change by sulfur content may not equal total residual fuel oil ending stocks and stock change.Notes: Totals may not equal sum of components due to independent rounding. Domestic crude oil field production are estimates.Sources: Energy Information Administration (EIA) Forms EIA-22M "Monthly Biodiesel Production Survey", Forms EIA-810, "Monthly Refinery Report," EIA-812, "Monthly Product Pipeline Report," EIA-813, "MonthlyCrude Oil Report," EIA-814, "Monthly Imports Report," EIA-815, "Monthly Bulk Terminal and Blender Report," EIA-816, "Monthly Natural Gas Liquids Report," EIA-817, "Monthly Tanker and Barge Movements Report,"and EIA-819, "Monthly Oxygenate Report." Domestic crude oil field production estimates based on Form EIA-914, "Monthly Crude Oil and Lease Condensate, and Natural Gas Production Report," and data from Stateconservation agencies, U.S. Department of Interior, and the Bureau of Ocean Energy Management. Export data from the U.S. Census Bureau and EIA estimates. Rail net receipts estimates based on EIA analysis ofdata from the Surface Transportation Board and other information.
Table 12. PAD District 2 - Year-to-Date Daily Average Supply and Disposition of Crude Oil and Petroleum Products, January-April 2018(Thousand Barrels per Day)
Commodity
Supply Disposition
FieldProduction
RenewableFuels andOxygenatePlant Net
Production
Refineryand
BlenderNet
Production
Imports(PADD ofEntry)1
NetReceipts2
Adjust-ments3
StockChange4
Refineryand
BlenderNet
Inputs ExportsProductsSupplied5
Crude Oil ............................................................. 1,904 – – – – 2,777 -601 -258 -57 3,748 131 0
Hydrocarbon Gas Liquids .................................. 930 -19 85 97 -302 – – -112 107 291 505Natural Gas Liquids .......................................... 930 -19 42 83 -280 – – -110 107 291 468
Ethane .......................................................... 341 – – – – – – – 10 – – 87 83Propane ........................................................ 328 – – 75 71 -240 – – -82 – – 6 309Normal Butane .............................................. 111 – – -27 5 -55 – – -31 33 10 22Isobutane ...................................................... 53 – – -6 7 1 – – -4 50 0 10Natural Gasoline ........................................... 96 -19 – – 0 175 – – -3 24 188 44
Refinery Olefins ................................................ – – – – 43 14 – – – -2 – – – – 37Ethylene ........................................................ – – – – – – – – – – – – – – –Propylene ..................................................... – – – – 43 12 -22 – – -2 – – – – 35Butylene ........................................................ – – – – 0 2 – – – 0 – – – – 2Isobutylene ................................................... – – – – – – – – – 0 – – – – 0
Other Liquids ...................................................... – – 1,026 – – 16 -529 -15 28 447 89 -66Hydrogen/Oxygenates/Renewables/ Other Hydrocarbons ....................................... – – 1,026 – – 1 -744 20 -10 293 20 0
Hydrogen ...................................................... – – – – – – – – 39 – – 39 – 0Oxygenates (excluding Fuel Ethanol) ........... – – – – – – – 0 0 – 0 0Renewable Fuels (including Fuel Ethanol) ... – – 1,026 – – 1 -744 -20 -10 253 20 0
Fuel Ethanol ............................................. – – 954 – – – -716 10 -9 239 17 0Renewable Fuels Except Fuel Ethanol ..... – – 72 – – 1 -28 -30 -2 14 3 0
Other Hydrocarbons ..................................... – – – – – – – – 1 0 1 – 0Unfinished Oils ................................................. – – – – – – 2 3 – – -1 4 68 -66Motor Gasoline Blend.Comp. (MGBC) ............. – – 0 – – 13 212 -35 39 150 1 0
Reformulated ................................................ – – – – – 1 55 -23 -3 35 0 0Conventional ................................................. – – 0 – – 13 157 -12 42 115 1 0
Aviation Gasoline Blend. Comp. ....................... – – – – – – – – – – – – – –
Finished Petroleum Products ............................ – – 5 4,442 30 64 55 67 – – 25 4,503Finished Motor Gasoline ................................... – – 5 2,504 – 2 25 1 – – 5 2,529
Reformulated ................................................ – – – 362 – – 30 – – – – 391Conventional ................................................. – – 5 2,142 – 2 -5 1 – – 5 2,138
Finished Aviation Gasoline ............................... – – – – 1 0 0 – – 0 – – – 1Kerosene-Type Jet Fuel ................................... – – – – 250 – 34 – – 3 – – 1 279Kerosene .......................................................... – – – – 4 0 0 – – 0 – – 0 4Distillate Fuel Oil ............................................... – – – – 1,115 5 98 30 18 – – 2 1,230
15 ppm sulfur and under ............................... – – – – 1,114 4 95 30 18 – – 0 1,226Greater than 15 ppm to 500 ppm sulfur ........ – – – – 4 – 3 – – 0 – – 1 6Greater than 500 ppm sulfur ......................... – – – – -2 2 – – – 1 – – 1 -3
Residual Fuel Oil6 ............................................ – – – – 45 4 -23 – – 1 – – 5 20Less than 0.31 percent sulfur ....................... – – – – 1 0 0 – – 0 – – NA NA0.31 to 1.00 percent sulfur ............................ – – – – 8 2 -2 – – 0 – – NA NAGreater than 1.00 percent sulfur ................... – – – – 37 2 -21 – – 1 – – NA NA
Petrochemical Feedstocks ............................... – – – – 28 5 -3 – – 0 – – – – 30Naphtha for Petro. Feed. Use ....................... – – – – 19 3 -3 – – 0 – – – – 19Other Oils for Petro. Feed. Use .................... – – – – 10 3 -1 – – 0 – – – – 11
Special Naphthas ............................................. – – – – 2 2 1 – – 0 – – – – 4Lubricants ......................................................... – – – – 5 5 7 – – -2 – – 6 13Waxes ............................................................... – – – – 1 0 – – – 0 – – 1 0Petroleum Coke ................................................ – – – – 185 1 -27 – – 6 – – 3 149
Marketable .................................................... – – – – 137 1 -27 – – 6 – – 3 102Catalyst ......................................................... – – – – 48 – – – – – – – – – – – – 48
Asphalt and Road Oil ........................................ – – – – 144 7 -25 – – 40 – – 2 85Still Gas ............................................................ – – – – 142 – – – – – – – – – – – – 142Miscellaneous Products .................................... – – – – 16 0 0 – – 0 – – 0 16
Total ..................................................................... 2,833 1,012 4,526 2,919 -1,368 -218 -73 4,301 536 4,942
– – = Not Applicable.– = No Data Reported.
NA = Not Available.1 Represents the PAD District in which the material entered the United States and not necessarily where the crude oil or product is processed and/or consumed.2 A negative number indicates a decrease in stocks and a positive number indicates an increase in stocks. Stock change for crude oil excludes lease stocks beginning with January 2005 (see explanatory notes).3 Includes an adjustment for crude oil, previously referred to as ’Unaccounted For Crude Oil.’ Also included is an adjustment for motor gasoline blending components, fuel ethanol, and distillate fuel oil. See
Appendix B, Note 2C for a detailed explanation of these adjustments.4 A negative number indicates a decrease in stocks and a positive number indicates an increase in stocks. Stock change for crude oil excludes lease stocks beginning with January 2005 (see explanatory notes).5 Product supplied is equal to field production, plus renewable fuels and oxygenate plant net production, plus refinery and blender net production, plus imports, plus net receipts, plus adjustments, minus stock
change, minus refinery and blender net inputs, minus exports.6 Total residual fuel oil ending stocks and stock change include stocks held at pipelines. Residual fuel oil ending stocks and stock change by sulfur content exclude pipeline stocks. Therefore, the sum of residual
fuel oil ending stocks and stock change by sulfur content may not equal total residual fuel oil ending stocks and stock change.Notes: Totals may not equal sum of components due to independent rounding. Domestic crude oil field production are estimates.Sources: Energy Information Administration (EIA) Forms EIA-22M "Monthly Biodiesel Production Survey", Forms EIA-810, "Monthly Refinery Report," EIA-812, "Monthly Product Pipeline Report," EIA-813, "MonthlyCrude Oil Report," EIA-814, "Monthly Imports Report," EIA-815, "Monthly Bulk Terminal and Blender Report," EIA-816, "Monthly Natural Gas Liquids Report," EIA-817, "Monthly Tanker and Barge Movements Report,"and EIA-819, "Monthly Oxygenate Report." Domestic crude oil field production estimates based on Form EIA-914, "Monthly Crude Oil and Lease Condensate, and Natural Gas Production Report," and data from Stateconservation agencies, U.S. Department of Interior, and the Bureau of Ocean Energy Management. Export data from the U.S. Census Bureau and EIA estimates. Rail net receipts estimates based on EIA analysis ofdata from the Surface Transportation Board and other information.

Energy Information Administration/Petroleum Supply Monthly,18 April 2018
Table 13. PAD District 3 - Supply, Disposition, and Ending Stocks of Crude Oil and Petroleum Products, April 2018(Thousand Barrels)
Commodity
Supply Disposition
EndingStocks
FieldProduction
RenewableFuels andOxygenatePlant Net
Production
Refineryand
BlenderNet
Production
Imports(PADD ofEntry)1
NetReceipts2
Adjust-ments3
StockChange4
Refineryand
BlenderNet
Inputs ExportsProductsSupplied5
Crude Oil6 ............................................................ 199,655 – – – – 85,880 18,827 11,089 1,435 265,991 48,025 0 884,304
Hydrocarbon Gas Liquids .................................. 70,053 -15 14,420 103 22,642 – – 1,417 7,898 35,882 62,006 98,307Natural Gas Liquids .......................................... 70,053 -15 7,921 – 22,152 – – 1,437 7,898 35,882 54,894 93,386
Ethane .......................................................... 30,734 – – 182 – – – – -2,448 – – 6,477 40,234 41,361Propane ........................................................ 21,111 – – 4,827 – 9,972 – – 328 – – 24,947 10,635 20,302Normal Butane .............................................. 3,287 – – 3,278 – 2,831 – – 4,137 1,159 3,794 306 17,601Isobutane ...................................................... 7,875 – – -366 – 772 – – 179 3,945 646 3,511 5,822Natural Gasoline ........................................... 7,046 -15 – – – -4,770 – – -759 2,794 18 208 8,300
Refinery Olefins ................................................ – – – – 6,499 103 – – – -20 – – – – 7,112 4,921Ethylene ........................................................ – – – – – – – – – 0 – – – – 0 0Propylene ..................................................... – – – – 6,473 – – – – 203 – – – – 6,760 3,668Butylene ........................................................ – – – – 49 103 – – – -222 – – – – 374 1,253Isobutylene ................................................... – – – – -23 – – – – -1 – – – – -22 0
Other Liquids ...................................................... – – 3,959 – – 15,689 -50,631 -3,925 -6,562 -41,533 14,242 -1,055 128,614Hydrogen/Oxygenates/Renewables/ Other Hydrocarbons ....................................... – – 3,959 – – 193 5,576 4,575 5 9,208 5,090 0 7,267
Hydrogen ...................................................... – – – – – – – – 4,180 – – 4,180 – 0 – –Oxygenates (excluding Fuel Ethanol) ........... – – 2,549 – – 79 – -1,135 -475 – 1,968 0 1,229Renewable Fuels (including Fuel Ethanol) ... – – 1,410 – – 108 5,576 1,536 480 5,028 3,122 0 6,038
Fuel Ethanol ............................................. – – 803 – – – 5,519 1,880 593 4,488 3,121 0 4,648Renewable Fuels Except Fuel Ethanol ..... – – 607 – – 108 58 -344 -113 540 1 0 1,390
Other Hydrocarbons ..................................... – – – – – – 6 – -6 – – – 0 –Unfinished Oils ................................................. – – – – – – 13,955 451 – – -3,474 11,258 7,643 -1,021 49,453Motor Gasoline Blend.Comp. (MGBC) ............. – – – – – 1,541 -56,658 -8,500 -3,097 -62,029 1,509 0 71,849
Reformulated ................................................ – – – – – – -10,485 52 158 -10,602 11 0 10,791Conventional ................................................. – – – – – 1,541 -46,173 -8,552 -3,255 -51,427 1,498 0 61,058
Aviation Gasoline Blend. Comp. ....................... – – – – – – – – – – 4 30 – -34 45
Finished Petroleum Products ............................ – – – 236,261 4,551 -49,912 7,340 -1,624 – – 90,806 109,058 104,565Finished Motor Gasoline ................................... – – – 68,690 – -7,779 6,620 -1,125 – – 24,246 44,410 8,174
Reformulated ................................................ – – – 13,717 – – 169 – – – – 13,886 –Conventional ................................................. – – – 54,973 – -7,779 6,451 -1,125 – – 24,246 30,524 8,174
Finished Aviation Gasoline ............................... – – – – 237 – -133 – – 11 – – – 93 331Kerosene-Type Jet Fuel ................................... – – – – 29,048 – -16,977 – – 1,060 – – 5,617 5,394 14,153Kerosene .......................................................... – – – – -47 – – – – -49 – – 187 -185 114Distillate Fuel Oil ............................................... – – – – 87,321 293 -25,638 720 -367 – – 36,825 26,238 39,762
15 ppm sulfur and under ............................... – – – – 79,457 293 -22,763 720 63 – – 32,500 25,145 33,453Greater than 15 ppm to 500 ppm sulfur ........ – – – – 1,844 – -113 – – 232 – – 1,939 -440 1,399Greater than 500 ppm sulfur ......................... – – – – 6,020 – -2,762 – – -662 – – 2,386 1,534 4,910
Residual Fuel Oil7 ............................................ – – – – 7,356 1,688 613 – – -1,522 – – 7,298 3,881 18,949Less than 0.31 percent sulfur ....................... – – – – 1,217 – 20 – – 106 – – NA NA 1,2350.31 to 1.00 percent sulfur ............................ – – – – 477 242 – – – -931 – – NA NA 2,736Greater than 1.00 percent sulfur ................... – – – – 5,662 1,446 593 – – -697 – – NA NA 14,978
Petrochemical Feedstocks ............................... – – – – 8,273 365 77 – – -187 – – – – 8,902 2,345Naphtha for Petro. Feed. Use ....................... – – – – 4,733 336 54 – – -199 – – – – 5,322 1,448Other Oils for Petro. Feed. Use .................... – – – – 3,540 29 23 – – 12 – – – – 3,580 897
Special Naphthas ............................................. – – – – 1,023 530 -29 – – -12 – – – – 1,536 857Lubricants ......................................................... – – – – 4,459 1,177 -752 – – -181 – – 3,449 1,616 8,831Waxes ............................................................... – – – – 105 32 – – – 49 – – 15 73 261Petroleum Coke ................................................ – – – – 14,531 456 1,061 – – 463 – – 12,705 2,881 4,973
Marketable .................................................... – – – – 10,959 456 1,061 – – 463 – – 12,705 -691 4,973Catalyst ......................................................... – – – – 3,572 – – – – – – – – – – – – 3,572 – –
Asphalt and Road Oil ........................................ – – – – 2,679 – -347 – – 262 – – 453 1,618 5,478Still Gas ............................................................ – – – – 10,835 – – – – – – – – – – – – 10,835 – –Miscellaneous Products .................................... – – – – 1,751 10 -8 – – -26 – – 10 1,769 337
Total ..................................................................... 269,708 3,944 250,681 106,223 -59,073 14,504 -5,334 232,356 188,955 170,009 1,215,790
– – = Not Applicable.– = No Data Reported.
NA = Not Available.1 Represents the PAD District in which the material entered the United States and not necessarily where the crude oil or product is processed and/or consumed.2 A negative number indicates a decrease in stocks and a positive number indicates an increase in stocks. Stock change for crude oil excludes lease stocks beginning with January 2005 (see explanatory notes).3 Includes an adjustment for crude oil, previously referred to as ’Unaccounted For Crude Oil.’ Also included is an adjustment for motor gasoline blending components, fuel ethanol, and distillate fuel oil. See
Appendix B, Note 2C for a detailed explanation of these adjustments.4 A negative number indicates a decrease in stocks and a positive number indicates an increase in stocks. Stock change for crude oil excludes lease stocks beginning with January 2005 (see explanatory notes).5 Product supplied is equal to field production, plus renewable fuels and oxygenate plant net production, plus refinery and blender net production, plus imports, plus net receipts, plus adjustments, minus stock
change, minus refinery and blender net inputs, minus exports.6 Includes value for the Strategic Petroleum Reserve. See Table 25 for the breakout of Commercial Crude Oil.7 Total residual fuel oil ending stocks and stock change include stocks held at pipelines. Residual fuel oil ending stocks and stock change by sulfur content exclude pipeline stocks. Therefore, the sum of residual
fuel oil ending stocks and stock change by sulfur content may not equal total residual fuel oil ending stocks and stock change.Notes: Totals may not equal sum of components due to independent rounding. Domestic crude oil field production are estimates.Sources: Energy Information Administration (EIA) Forms EIA-22M "Monthly Biodiesel Production Survey", Forms EIA-810, "Monthly Refinery Report," EIA-812, "Monthly Product Pipeline Report," EIA-813, "MonthlyCrude Oil Report," EIA-814, "Monthly Imports Report," EIA-815, "Monthly Bulk Terminal and Blender Report," EIA-816, "Monthly Natural Gas Liquids Report," EIA-817, "Monthly Tanker and Barge Movements Report,"and EIA-819, "Monthly Oxygenate Report." Domestic crude oil field production estimates based on Form EIA-914, "Monthly Crude Oil and Lease Condensate, and Natural Gas Production Report," and data from Stateconservation agencies, U.S. Department of Interior, and the Bureau of Ocean Energy Management. Export data from the U.S. Census Bureau and EIA estimates. Rail net receipts estimates based on EIA analysis ofdata from the Surface Transportation Board and other information.

Energy Information Administration/Petroleum Supply Monthly, 19 April 2018
Table 13. PAD District 3 - Supply, Disposition, and Ending Stocks of Crude Oil and Petroleum Products, April 2018(Thousand Barrels)
Commodity
Supply Disposition
EndingStocks
FieldProduction
RenewableFuels andOxygenatePlant Net
Production
Refineryand
BlenderNet
Production
Imports(PADD ofEntry)1
NetReceipts2
Adjust-ments3
StockChange4
Refineryand
BlenderNet
Inputs ExportsProductsSupplied5
Crude Oil6 ............................................................ 199,655 – – – – 85,880 18,827 11,089 1,435 265,991 48,025 0 884,304
Hydrocarbon Gas Liquids .................................. 70,053 -15 14,420 103 22,642 – – 1,417 7,898 35,882 62,006 98,307Natural Gas Liquids .......................................... 70,053 -15 7,921 – 22,152 – – 1,437 7,898 35,882 54,894 93,386
Ethane .......................................................... 30,734 – – 182 – – – – -2,448 – – 6,477 40,234 41,361Propane ........................................................ 21,111 – – 4,827 – 9,972 – – 328 – – 24,947 10,635 20,302Normal Butane .............................................. 3,287 – – 3,278 – 2,831 – – 4,137 1,159 3,794 306 17,601Isobutane ...................................................... 7,875 – – -366 – 772 – – 179 3,945 646 3,511 5,822Natural Gasoline ........................................... 7,046 -15 – – – -4,770 – – -759 2,794 18 208 8,300
Refinery Olefins ................................................ – – – – 6,499 103 – – – -20 – – – – 7,112 4,921Ethylene ........................................................ – – – – – – – – – 0 – – – – 0 0Propylene ..................................................... – – – – 6,473 – – – – 203 – – – – 6,760 3,668Butylene ........................................................ – – – – 49 103 – – – -222 – – – – 374 1,253Isobutylene ................................................... – – – – -23 – – – – -1 – – – – -22 0
Other Liquids ...................................................... – – 3,959 – – 15,689 -50,631 -3,925 -6,562 -41,533 14,242 -1,055 128,614Hydrogen/Oxygenates/Renewables/ Other Hydrocarbons ....................................... – – 3,959 – – 193 5,576 4,575 5 9,208 5,090 0 7,267
Hydrogen ...................................................... – – – – – – – – 4,180 – – 4,180 – 0 – –Oxygenates (excluding Fuel Ethanol) ........... – – 2,549 – – 79 – -1,135 -475 – 1,968 0 1,229Renewable Fuels (including Fuel Ethanol) ... – – 1,410 – – 108 5,576 1,536 480 5,028 3,122 0 6,038
Fuel Ethanol ............................................. – – 803 – – – 5,519 1,880 593 4,488 3,121 0 4,648Renewable Fuels Except Fuel Ethanol ..... – – 607 – – 108 58 -344 -113 540 1 0 1,390
Other Hydrocarbons ..................................... – – – – – – 6 – -6 – – – 0 –Unfinished Oils ................................................. – – – – – – 13,955 451 – – -3,474 11,258 7,643 -1,021 49,453Motor Gasoline Blend.Comp. (MGBC) ............. – – – – – 1,541 -56,658 -8,500 -3,097 -62,029 1,509 0 71,849
Reformulated ................................................ – – – – – – -10,485 52 158 -10,602 11 0 10,791Conventional ................................................. – – – – – 1,541 -46,173 -8,552 -3,255 -51,427 1,498 0 61,058
Aviation Gasoline Blend. Comp. ....................... – – – – – – – – – – 4 30 – -34 45
Finished Petroleum Products ............................ – – – 236,261 4,551 -49,912 7,340 -1,624 – – 90,806 109,058 104,565Finished Motor Gasoline ................................... – – – 68,690 – -7,779 6,620 -1,125 – – 24,246 44,410 8,174
Reformulated ................................................ – – – 13,717 – – 169 – – – – 13,886 –Conventional ................................................. – – – 54,973 – -7,779 6,451 -1,125 – – 24,246 30,524 8,174
Finished Aviation Gasoline ............................... – – – – 237 – -133 – – 11 – – – 93 331Kerosene-Type Jet Fuel ................................... – – – – 29,048 – -16,977 – – 1,060 – – 5,617 5,394 14,153Kerosene .......................................................... – – – – -47 – – – – -49 – – 187 -185 114Distillate Fuel Oil ............................................... – – – – 87,321 293 -25,638 720 -367 – – 36,825 26,238 39,762
15 ppm sulfur and under ............................... – – – – 79,457 293 -22,763 720 63 – – 32,500 25,145 33,453Greater than 15 ppm to 500 ppm sulfur ........ – – – – 1,844 – -113 – – 232 – – 1,939 -440 1,399Greater than 500 ppm sulfur ......................... – – – – 6,020 – -2,762 – – -662 – – 2,386 1,534 4,910
Residual Fuel Oil7 ............................................ – – – – 7,356 1,688 613 – – -1,522 – – 7,298 3,881 18,949Less than 0.31 percent sulfur ....................... – – – – 1,217 – 20 – – 106 – – NA NA 1,2350.31 to 1.00 percent sulfur ............................ – – – – 477 242 – – – -931 – – NA NA 2,736Greater than 1.00 percent sulfur ................... – – – – 5,662 1,446 593 – – -697 – – NA NA 14,978
Petrochemical Feedstocks ............................... – – – – 8,273 365 77 – – -187 – – – – 8,902 2,345Naphtha for Petro. Feed. Use ....................... – – – – 4,733 336 54 – – -199 – – – – 5,322 1,448Other Oils for Petro. Feed. Use .................... – – – – 3,540 29 23 – – 12 – – – – 3,580 897
Special Naphthas ............................................. – – – – 1,023 530 -29 – – -12 – – – – 1,536 857Lubricants ......................................................... – – – – 4,459 1,177 -752 – – -181 – – 3,449 1,616 8,831Waxes ............................................................... – – – – 105 32 – – – 49 – – 15 73 261Petroleum Coke ................................................ – – – – 14,531 456 1,061 – – 463 – – 12,705 2,881 4,973
Marketable .................................................... – – – – 10,959 456 1,061 – – 463 – – 12,705 -691 4,973Catalyst ......................................................... – – – – 3,572 – – – – – – – – – – – – 3,572 – –
Asphalt and Road Oil ........................................ – – – – 2,679 – -347 – – 262 – – 453 1,618 5,478Still Gas ............................................................ – – – – 10,835 – – – – – – – – – – – – 10,835 – –Miscellaneous Products .................................... – – – – 1,751 10 -8 – – -26 – – 10 1,769 337
Total ..................................................................... 269,708 3,944 250,681 106,223 -59,073 14,504 -5,334 232,356 188,955 170,009 1,215,790
– – = Not Applicable.– = No Data Reported.
NA = Not Available.1 Represents the PAD District in which the material entered the United States and not necessarily where the crude oil or product is processed and/or consumed.2 A negative number indicates a decrease in stocks and a positive number indicates an increase in stocks. Stock change for crude oil excludes lease stocks beginning with January 2005 (see explanatory notes).3 Includes an adjustment for crude oil, previously referred to as ’Unaccounted For Crude Oil.’ Also included is an adjustment for motor gasoline blending components, fuel ethanol, and distillate fuel oil. See
Appendix B, Note 2C for a detailed explanation of these adjustments.4 A negative number indicates a decrease in stocks and a positive number indicates an increase in stocks. Stock change for crude oil excludes lease stocks beginning with January 2005 (see explanatory notes).5 Product supplied is equal to field production, plus renewable fuels and oxygenate plant net production, plus refinery and blender net production, plus imports, plus net receipts, plus adjustments, minus stock
change, minus refinery and blender net inputs, minus exports.6 Includes value for the Strategic Petroleum Reserve. See Table 25 for the breakout of Commercial Crude Oil.7 Total residual fuel oil ending stocks and stock change include stocks held at pipelines. Residual fuel oil ending stocks and stock change by sulfur content exclude pipeline stocks. Therefore, the sum of residual
fuel oil ending stocks and stock change by sulfur content may not equal total residual fuel oil ending stocks and stock change.Notes: Totals may not equal sum of components due to independent rounding. Domestic crude oil field production are estimates.Sources: Energy Information Administration (EIA) Forms EIA-22M "Monthly Biodiesel Production Survey", Forms EIA-810, "Monthly Refinery Report," EIA-812, "Monthly Product Pipeline Report," EIA-813, "MonthlyCrude Oil Report," EIA-814, "Monthly Imports Report," EIA-815, "Monthly Bulk Terminal and Blender Report," EIA-816, "Monthly Natural Gas Liquids Report," EIA-817, "Monthly Tanker and Barge Movements Report,"and EIA-819, "Monthly Oxygenate Report." Domestic crude oil field production estimates based on Form EIA-914, "Monthly Crude Oil and Lease Condensate, and Natural Gas Production Report," and data from Stateconservation agencies, U.S. Department of Interior, and the Bureau of Ocean Energy Management. Export data from the U.S. Census Bureau and EIA estimates. Rail net receipts estimates based on EIA analysis ofdata from the Surface Transportation Board and other information.
Table 14. PAD District 3 - Year-to-Date Supply, Disposition, and Ending Stocks of Crude Oil and Petroleum Products, January-April 2018(Thousand Barrels)
Commodity
Supply Disposition
EndingStocks
FieldProduction
RenewableFuels andOxygenatePlant Net
Production
Refineryand
BlenderNet
Production
Imports(PADD ofEntry)1
NetReceipts2
Adjust-ments3
StockChange4
Refineryand
BlenderNet
Inputs ExportsProductsSupplied5
Crude Oil6 ............................................................ 783,931 – – – – 316,259 91,903 38,064 16,938 1,045,192 168,027 0 884,304
Hydrocarbon Gas Liquids .................................. 263,451 -61 47,465 598 79,983 – – -27,024 37,292 133,940 247,228 98,307Natural Gas Liquids .......................................... 263,451 -61 20,284 – 78,315 – – -26,993 37,292 133,940 217,750 –
Ethane .......................................................... 113,897 – – 715 – – – – -8,303 – – 16,008 159,464 –Propane ........................................................ 80,486 – – 18,937 – 27,342 – – -13,236 – – 102,211 37,790 –Normal Butane .............................................. 11,849 – – 2,064 – 10,219 – – -5,124 11,921 14,803 2,532 –Isobutane ...................................................... 30,917 – – -1,432 – 2,869 – – 456 14,670 838 16,390 –Natural Gasoline ........................................... 26,302 -61 – – – -14,672 – – -786 10,701 81 1,573 –
Refinery Olefins ................................................ – – – – 27,181 598 – – – -31 – – – – 29,478 –Ethylene ........................................................ – – – – 7 – – – – 0 – – – – 7 –Propylene ..................................................... – – – – 26,872 – – – – -355 – – – – 28,895 –Butylene ........................................................ – – – – 408 598 – – – 324 – – – – 682 –Isobutylene ................................................... – – – – -106 – – – – 0 – – – – -106 –
Other Liquids ...................................................... – – 14,786 – – 67,706 -202,846 -10,726 2,522 -197,817 50,200 14,015 128,614Hydrogen/Oxygenates/Renewables/ Other Hydrocarbons ....................................... – – 14,786 – – 1,352 26,605 13,484 446 34,255 21,525 0 7,267
Hydrogen ...................................................... – – – – – – – – 15,238 – – 15,238 – 0 – –Oxygenates (excluding Fuel Ethanol) ........... – – 9,272 – – 1,152 – -2,655 -210 – 7,979 0 1,229Renewable Fuels (including Fuel Ethanol) ... – – 5,514 – – 179 26,605 922 656 19,017 13,546 0 6,038
Fuel Ethanol ............................................. – – 3,166 – – – 25,722 2,438 570 17,416 13,340 0 4,648Renewable Fuels Except Fuel Ethanol ..... – – 2,348 – – 179 882 -1,516 86 1,601 206 0 1,390
Other Hydrocarbons ..................................... – – – – – – 21 – -21 0 – – 0 –Unfinished Oils ................................................. – – – – – – 59,954 -330 – – 4,533 17,253 23,761 14,077 49,453Motor Gasoline Blend.Comp. (MGBC) ............. – – – – – 6,400 -229,121 -24,209 -2,487 -249,357 4,914 0 71,849
Reformulated ................................................ – – – – – – -46,073 13,673 -341 -32,094 35 0 10,791Conventional ................................................. – – – – – 6,400 -183,048 -37,883 -2,146 -217,263 4,878 0 61,058
Aviation Gasoline Blend. Comp. ....................... – – – – – – – – – – 30 32 – -62 45
Finished Petroleum Products ............................ – – – 910,525 17,578 -205,628 24,421 -3,967 – – 344,884 405,979 104,565Finished Motor Gasoline ................................... – – – 275,819 – -27,263 21,772 -708 – – 103,945 167,090 8,174
Reformulated ................................................ – – – 55,195 – – -14,012 – – – – 41,183 –Conventional ................................................. – – – 220,624 – -27,263 35,783 -708 – – 103,945 125,907 8,174
Finished Aviation Gasoline ............................... – – – – 830 – -317 – – -138 – – – 651 331Kerosene-Type Jet Fuel ................................... – – – – 108,397 – -65,888 – – 309 – – 20,440 21,760 14,153Kerosene .......................................................... – – – – 3 – -298 – – -62 – – 762 -995 114Distillate Fuel Oil ............................................... – – – – 327,515 1,044 -114,113 2,650 -6,060 – – 124,068 99,088 39,762
15 ppm sulfur and under ............................... – – – – 295,484 309 -104,099 2,650 -5,350 – – 106,321 93,373 33,453Greater than 15 ppm to 500 ppm sulfur ........ – – – – 8,654 – -995 – – -842 – – 10,420 -1,919 1,399Greater than 500 ppm sulfur ......................... – – – – 23,377 735 -9,019 – – 132 – – 7,326 7,635 4,910
Residual Fuel Oil7 ............................................ – – – – 27,946 6,687 2,634 – – 2,592 – – 28,886 5,789 18,949Less than 0.31 percent sulfur ....................... – – – – 5,049 1,042 20 – – 585 – – NA NA 1,2350.31 to 1.00 percent sulfur ............................ – – – – 1,984 582 226 – – -1,731 – – NA NA 2,736Greater than 1.00 percent sulfur ................... – – – – 20,913 5,063 2,388 – – 3,738 – – NA NA 14,978
Petrochemical Feedstocks ............................... – – – – 31,325 2,009 327 – – 32 – – – – 33,629 2,345Naphtha for Petro. Feed. Use ....................... – – – – 20,567 1,876 236 – – 51 – – – – 22,628 1,448Other Oils for Petro. Feed. Use .................... – – – – 10,758 133 91 – – -19 – – – – 11,001 897
Special Naphthas ............................................. – – – – 4,164 1,749 -118 – – -142 – – – – 5,937 857Lubricants ......................................................... – – – – 17,630 4,259 -2,477 – – -230 – – 11,231 8,411 8,831Waxes ............................................................... – – – – 361 131 – – – -6 – – 65 433 261Petroleum Coke ................................................ – – – – 58,655 1,649 3,228 – – -590 – – 53,982 10,140 4,973
Marketable .................................................... – – – – 44,383 1,649 3,228 – – -590 – – 53,982 -4,132 4,973Catalyst ......................................................... – – – – 14,272 – – – – – – – – – – – – 14,272 – –
Asphalt and Road Oil ........................................ – – – – 8,995 – -1,310 – – 1,077 – – 1,488 5,120 5,478Still Gas ............................................................ – – – – 42,218 – – – – – – – – – – – – 42,218 – –Miscellaneous Products .................................... – – – – 6,667 50 -33 – – -41 – – 17 6,708 337
Total ..................................................................... 1,047,382 14,725 957,990 402,141 -236,589 51,760 -11,531 884,667 697,051 667,222 1,215,790
– – = Not Applicable.– = No Data Reported.
NA = Not Available.1 Represents the PAD District in which the material entered the United States and not necessarily where the crude oil or product is processed and/or consumed.2 A negative number indicates a decrease in stocks and a positive number indicates an increase in stocks. Stock change for crude oil excludes lease stocks beginning with January 2005 (see explanatory notes).3 Includes an adjustment for crude oil, previously referred to as ’Unaccounted For Crude Oil.’ Also included is an adjustment for motor gasoline blending components, fuel ethanol, and distillate fuel oil. See
Appendix B, Note 2C for a detailed explanation of these adjustments.4 A negative number indicates a decrease in stocks and a positive number indicates an increase in stocks. Stock change for crude oil excludes lease stocks beginning with January 2005 (see explanatory notes).5 Product supplied is equal to field production, plus renewable fuels and oxygenate plant net production, plus refinery and blender net production, plus imports, plus net receipts, plus adjustments, minus stock
change, minus refinery and blender net inputs, minus exports.6 Includes value for the Strategic Petroleum Reserve. See Table 25 for the breakout of Commercial Crude Oil.7 Total residual fuel oil ending stocks and stock change include stocks held at pipelines. Residual fuel oil ending stocks and stock change by sulfur content exclude pipeline stocks. Therefore, the sum of residual
fuel oil ending stocks and stock change by sulfur content may not equal total residual fuel oil ending stocks and stock change.Notes: Totals may not equal sum of components due to independent rounding. Domestic crude oil field production are estimates.Sources: Energy Information Administration (EIA) Forms EIA-22M "Monthly Biodiesel Production Survey", Forms EIA-810, "Monthly Refinery Report," EIA-812, "Monthly Product Pipeline Report," EIA-813, "MonthlyCrude Oil Report," EIA-814, "Monthly Imports Report," EIA-815, "Monthly Bulk Terminal and Blender Report," EIA-816, "Monthly Natural Gas Liquids Report," EIA-817, "Monthly Tanker and Barge Movements Report,"and EIA-819, "Monthly Oxygenate Report." Domestic crude oil field production estimates based on Form EIA-914, "Monthly Crude Oil and Lease Condensate, and Natural Gas Production Report," and data from Stateconservation agencies, U.S. Department of Interior, and the Bureau of Ocean Energy Management. Export data from the U.S. Census Bureau and EIA estimates. Rail net receipts estimates based on EIA analysis ofdata from the Surface Transportation Board and other information.

Energy Information Administration/Petroleum Supply Monthly,20 April 2018
Table 15. PAD District 3 - Daily Average Supply and Disposition of Crude Oil and Petroleum Products, April 2018(Thousand Barrels per Day)
Commodity
Supply Disposition
FieldProduction
RenewableFuels andOxygenatePlant Net
Production
Refineryand
BlenderNet
Production
Imports(PADD ofEntry)1
NetReceipts2
Adjust-ments3
StockChange4
Refineryand
BlenderNet
Inputs ExportsProductsSupplied5
Crude Oil6 ............................................................ 6,655 – – – – 2,863 628 370 48 8,866 1,601 0
Hydrocarbon Gas Liquids .................................. 2,335 -1 481 3 755 – – 47 263 1,196 2,067Natural Gas Liquids .......................................... 2,335 -1 264 – 738 – – 48 263 1,196 1,830
Ethane .......................................................... 1,024 – – 6 – – – – -82 – – 216 1,341Propane ........................................................ 704 – – 161 – 332 – – 11 – – 832 354Normal Butane .............................................. 110 – – 109 – 94 – – 138 39 126 10Isobutane ...................................................... 263 – – -12 – 26 – – 6 132 22 117Natural Gasoline ........................................... 235 -1 – – – -159 – – -25 93 1 7
Refinery Olefins ................................................ – – – – 217 3 – – – -1 – – – – 237Ethylene ........................................................ – – – – – – – – – 0 – – – – 0Propylene ..................................................... – – – – 216 – 16 – – 7 – – – – 225Butylene ........................................................ – – – – 2 3 – – – -7 – – – – 12Isobutylene ................................................... – – – – -1 – – – – 0 – – – – -1
Other Liquids ...................................................... – – 132 – – 523 -1,688 -131 -219 -1,384 475 -35Hydrogen/Oxygenates/Renewables/ Other Hydrocarbons ....................................... – – 132 – – 6 186 152 0 307 170 0
Hydrogen ...................................................... – – – – – – – – 139 – – 139 – 0Oxygenates (excluding Fuel Ethanol) ........... – – 85 – – 3 – -38 -16 – 66 0Renewable Fuels (including Fuel Ethanol) ... – – 47 – – 4 186 51 16 168 104 0
Fuel Ethanol ............................................. – – 27 – – – 184 63 20 150 104 0Renewable Fuels Except Fuel Ethanol ..... – – 20 – – 4 2 -11 -4 18 0 0
Other Hydrocarbons ..................................... – – – – – – 0 – 0 – – – 0Unfinished Oils ................................................. – – – – – – 465 15 – – -116 375 255 -34Motor Gasoline Blend.Comp. (MGBC) ............. – – – – – 51 -1,889 -283 -103 -2,068 50 0
Reformulated ................................................ – – – – – – -350 2 5 -353 0 0Conventional ................................................. – – – – – 51 -1,539 -285 -109 -1,714 50 0
Aviation Gasoline Blend. Comp. ....................... – – – – – – – – – – 0 1 – -1
Finished Petroleum Products ............................ – – – 7,875 152 -1,664 245 -54 – – 3,027 3,635Finished Motor Gasoline ................................... – – – 2,290 – -259 221 -38 – – 808 1,480
Reformulated ................................................ – – – 457 – – 6 – – – – 463Conventional ................................................. – – – 1,832 – -259 215 -38 – – 808 1,017
Finished Aviation Gasoline ............................... – – – – 8 – -4 – – 0 – – – 3Kerosene-Type Jet Fuel ................................... – – – – 968 – -566 – – 35 – – 187 180Kerosene .......................................................... – – – – -2 – – – – -2 – – 6 -6Distillate Fuel Oil ............................................... – – – – 2,911 10 -855 24 -12 – – 1,228 875
15 ppm sulfur and under ............................... – – – – 2,649 10 -759 24 2 – – 1,083 838Greater than 15 ppm to 500 ppm sulfur ........ – – – – 61 – -4 – – 8 – – 65 -15Greater than 500 ppm sulfur ......................... – – – – 201 – -92 – – -22 – – 80 51
Residual Fuel Oil7 ............................................ – – – – 245 56 20 – – -51 – – 243 129Less than 0.31 percent sulfur ....................... – – – – 41 – 1 – – 4 – – NA NA0.31 to 1.00 percent sulfur ............................ – – – – 16 8 – – – -31 – – NA NAGreater than 1.00 percent sulfur ................... – – – – 189 48 20 – – -23 – – NA NA
Petrochemical Feedstocks ............................... – – – – 276 12 3 – – -6 – – – – 297Naphtha for Petro. Feed. Use ....................... – – – – 158 11 2 – – -7 – – – – 177Other Oils for Petro. Feed. Use .................... – – – – 118 1 1 – – 0 – – – – 119
Special Naphthas ............................................. – – – – 34 18 -1 – – 0 – – – – 51Lubricants ......................................................... – – – – 149 39 -25 – – -6 – – 115 54Waxes ............................................................... – – – – 4 1 – – – 2 – – 1 2Petroleum Coke ................................................ – – – – 484 15 35 – – 15 – – 423 96
Marketable .................................................... – – – – 365 15 35 – – 15 – – 423 -23Catalyst ......................................................... – – – – 119 – – – – – – – – – – – – 119
Asphalt and Road Oil ........................................ – – – – 89 – -12 – – 9 – – 15 54Still Gas ............................................................ – – – – 361 – – – – – – – – – – – – 361Miscellaneous Products .................................... – – – – 58 0 0 – – -1 – – 0 59
Total ..................................................................... 8,990 131 8,356 3,541 -1,969 483 -178 7,745 6,298 5,667
– – = Not Applicable.– = No Data Reported.
NA = Not Available.1 Represents the PAD District in which the material entered the United States and not necessarily where the crude oil or product is processed and/or consumed.2 A negative number indicates a decrease in stocks and a positive number indicates an increase in stocks. Stock change for crude oil excludes lease stocks beginning with January 2005 (see explanatory notes).3 Includes an adjustment for crude oil, previously referred to as ’Unaccounted For Crude Oil.’ Also included is an adjustment for motor gasoline blending components, fuel ethanol, and distillate fuel oil. See
Appendix B, Note 2C for a detailed explanation of these adjustments.4 A negative number indicates a decrease in stocks and a positive number indicates an increase in stocks. Stock change for crude oil excludes lease stocks beginning with January 2005 (see explanatory notes).5 Product supplied is equal to field production, plus renewable fuels and oxygenate plant net production, plus refinery and blender net production, plus imports, plus net receipts, plus adjustments, minus stock
change, minus refinery and blender net inputs, minus exports.6 Includes value for the Strategic Petroleum Reserve. See Table 25 for the breakout of Commercial Crude Oil.7 Total residual fuel oil ending stocks and stock change include stocks held at pipelines. Residual fuel oil ending stocks and stock change by sulfur content exclude pipeline stocks. Therefore, the sum of residual
fuel oil ending stocks and stock change by sulfur content may not equal total residual fuel oil ending stocks and stock change.Notes: Totals may not equal sum of components due to independent rounding. Domestic crude oil field production are estimates.Sources: Energy Information Administration (EIA) Forms EIA-22M "Monthly Biodiesel Production Survey", Forms EIA-810, "Monthly Refinery Report," EIA-812, "Monthly Product Pipeline Report," EIA-813, "MonthlyCrude Oil Report," EIA-814, "Monthly Imports Report," EIA-815, "Monthly Bulk Terminal and Blender Report," EIA-816, "Monthly Natural Gas Liquids Report," EIA-817, "Monthly Tanker and Barge Movements Report,"and EIA-819, "Monthly Oxygenate Report." Domestic crude oil field production estimates based on Form EIA-914, "Monthly Crude Oil and Lease Condensate, and Natural Gas Production Report," and data from Stateconservation agencies, U.S. Department of Interior, and the Bureau of Ocean Energy Management. Export data from the U.S. Census Bureau and EIA estimates. Rail net receipts estimates based on EIA analysis ofdata from the Surface Transportation Board and other information.

Energy Information Administration/Petroleum Supply Monthly, 21 April 2018
Table 15. PAD District 3 - Daily Average Supply and Disposition of Crude Oil and Petroleum Products, April 2018(Thousand Barrels per Day)
Commodity
Supply Disposition
FieldProduction
RenewableFuels andOxygenatePlant Net
Production
Refineryand
BlenderNet
Production
Imports(PADD ofEntry)1
NetReceipts2
Adjust-ments3
StockChange4
Refineryand
BlenderNet
Inputs ExportsProductsSupplied5
Crude Oil6 ............................................................ 6,655 – – – – 2,863 628 370 48 8,866 1,601 0
Hydrocarbon Gas Liquids .................................. 2,335 -1 481 3 755 – – 47 263 1,196 2,067Natural Gas Liquids .......................................... 2,335 -1 264 – 738 – – 48 263 1,196 1,830
Ethane .......................................................... 1,024 – – 6 – – – – -82 – – 216 1,341Propane ........................................................ 704 – – 161 – 332 – – 11 – – 832 354Normal Butane .............................................. 110 – – 109 – 94 – – 138 39 126 10Isobutane ...................................................... 263 – – -12 – 26 – – 6 132 22 117Natural Gasoline ........................................... 235 -1 – – – -159 – – -25 93 1 7
Refinery Olefins ................................................ – – – – 217 3 – – – -1 – – – – 237Ethylene ........................................................ – – – – – – – – – 0 – – – – 0Propylene ..................................................... – – – – 216 – 16 – – 7 – – – – 225Butylene ........................................................ – – – – 2 3 – – – -7 – – – – 12Isobutylene ................................................... – – – – -1 – – – – 0 – – – – -1
Other Liquids ...................................................... – – 132 – – 523 -1,688 -131 -219 -1,384 475 -35Hydrogen/Oxygenates/Renewables/ Other Hydrocarbons ....................................... – – 132 – – 6 186 152 0 307 170 0
Hydrogen ...................................................... – – – – – – – – 139 – – 139 – 0Oxygenates (excluding Fuel Ethanol) ........... – – 85 – – 3 – -38 -16 – 66 0Renewable Fuels (including Fuel Ethanol) ... – – 47 – – 4 186 51 16 168 104 0
Fuel Ethanol ............................................. – – 27 – – – 184 63 20 150 104 0Renewable Fuels Except Fuel Ethanol ..... – – 20 – – 4 2 -11 -4 18 0 0
Other Hydrocarbons ..................................... – – – – – – 0 – 0 – – – 0Unfinished Oils ................................................. – – – – – – 465 15 – – -116 375 255 -34Motor Gasoline Blend.Comp. (MGBC) ............. – – – – – 51 -1,889 -283 -103 -2,068 50 0
Reformulated ................................................ – – – – – – -350 2 5 -353 0 0Conventional ................................................. – – – – – 51 -1,539 -285 -109 -1,714 50 0
Aviation Gasoline Blend. Comp. ....................... – – – – – – – – – – 0 1 – -1
Finished Petroleum Products ............................ – – – 7,875 152 -1,664 245 -54 – – 3,027 3,635Finished Motor Gasoline ................................... – – – 2,290 – -259 221 -38 – – 808 1,480
Reformulated ................................................ – – – 457 – – 6 – – – – 463Conventional ................................................. – – – 1,832 – -259 215 -38 – – 808 1,017
Finished Aviation Gasoline ............................... – – – – 8 – -4 – – 0 – – – 3Kerosene-Type Jet Fuel ................................... – – – – 968 – -566 – – 35 – – 187 180Kerosene .......................................................... – – – – -2 – – – – -2 – – 6 -6Distillate Fuel Oil ............................................... – – – – 2,911 10 -855 24 -12 – – 1,228 875
15 ppm sulfur and under ............................... – – – – 2,649 10 -759 24 2 – – 1,083 838Greater than 15 ppm to 500 ppm sulfur ........ – – – – 61 – -4 – – 8 – – 65 -15Greater than 500 ppm sulfur ......................... – – – – 201 – -92 – – -22 – – 80 51
Residual Fuel Oil7 ............................................ – – – – 245 56 20 – – -51 – – 243 129Less than 0.31 percent sulfur ....................... – – – – 41 – 1 – – 4 – – NA NA0.31 to 1.00 percent sulfur ............................ – – – – 16 8 – – – -31 – – NA NAGreater than 1.00 percent sulfur ................... – – – – 189 48 20 – – -23 – – NA NA
Petrochemical Feedstocks ............................... – – – – 276 12 3 – – -6 – – – – 297Naphtha for Petro. Feed. Use ....................... – – – – 158 11 2 – – -7 – – – – 177Other Oils for Petro. Feed. Use .................... – – – – 118 1 1 – – 0 – – – – 119
Special Naphthas ............................................. – – – – 34 18 -1 – – 0 – – – – 51Lubricants ......................................................... – – – – 149 39 -25 – – -6 – – 115 54Waxes ............................................................... – – – – 4 1 – – – 2 – – 1 2Petroleum Coke ................................................ – – – – 484 15 35 – – 15 – – 423 96
Marketable .................................................... – – – – 365 15 35 – – 15 – – 423 -23Catalyst ......................................................... – – – – 119 – – – – – – – – – – – – 119
Asphalt and Road Oil ........................................ – – – – 89 – -12 – – 9 – – 15 54Still Gas ............................................................ – – – – 361 – – – – – – – – – – – – 361Miscellaneous Products .................................... – – – – 58 0 0 – – -1 – – 0 59
Total ..................................................................... 8,990 131 8,356 3,541 -1,969 483 -178 7,745 6,298 5,667
– – = Not Applicable.– = No Data Reported.
NA = Not Available.1 Represents the PAD District in which the material entered the United States and not necessarily where the crude oil or product is processed and/or consumed.2 A negative number indicates a decrease in stocks and a positive number indicates an increase in stocks. Stock change for crude oil excludes lease stocks beginning with January 2005 (see explanatory notes).3 Includes an adjustment for crude oil, previously referred to as ’Unaccounted For Crude Oil.’ Also included is an adjustment for motor gasoline blending components, fuel ethanol, and distillate fuel oil. See
Appendix B, Note 2C for a detailed explanation of these adjustments.4 A negative number indicates a decrease in stocks and a positive number indicates an increase in stocks. Stock change for crude oil excludes lease stocks beginning with January 2005 (see explanatory notes).5 Product supplied is equal to field production, plus renewable fuels and oxygenate plant net production, plus refinery and blender net production, plus imports, plus net receipts, plus adjustments, minus stock
change, minus refinery and blender net inputs, minus exports.6 Includes value for the Strategic Petroleum Reserve. See Table 25 for the breakout of Commercial Crude Oil.7 Total residual fuel oil ending stocks and stock change include stocks held at pipelines. Residual fuel oil ending stocks and stock change by sulfur content exclude pipeline stocks. Therefore, the sum of residual
fuel oil ending stocks and stock change by sulfur content may not equal total residual fuel oil ending stocks and stock change.Notes: Totals may not equal sum of components due to independent rounding. Domestic crude oil field production are estimates.Sources: Energy Information Administration (EIA) Forms EIA-22M "Monthly Biodiesel Production Survey", Forms EIA-810, "Monthly Refinery Report," EIA-812, "Monthly Product Pipeline Report," EIA-813, "MonthlyCrude Oil Report," EIA-814, "Monthly Imports Report," EIA-815, "Monthly Bulk Terminal and Blender Report," EIA-816, "Monthly Natural Gas Liquids Report," EIA-817, "Monthly Tanker and Barge Movements Report,"and EIA-819, "Monthly Oxygenate Report." Domestic crude oil field production estimates based on Form EIA-914, "Monthly Crude Oil and Lease Condensate, and Natural Gas Production Report," and data from Stateconservation agencies, U.S. Department of Interior, and the Bureau of Ocean Energy Management. Export data from the U.S. Census Bureau and EIA estimates. Rail net receipts estimates based on EIA analysis ofdata from the Surface Transportation Board and other information.
Table 16. PAD District 3 - Year-to-Date Daily Average Supply and Disposition of Crude Oil and Petroleum Products, January-April 2018(Thousand Barrels per Day)
Commodity
Supply Disposition
FieldProduction
RenewableFuels andOxygenatePlant Net
Production
Refineryand
BlenderNet
Production
Imports(PADD ofEntry)1
NetReceipts2
Adjust-ments3
StockChange4
Refineryand
BlenderNet
Inputs ExportsProductsSupplied5
Crude Oil6 ............................................................ 6,533 – – – – 2,635 766 317 141 8,710 1,400 0
Hydrocarbon Gas Liquids .................................. 2,195 -1 396 5 667 – – -225 311 1,116 2,060Natural Gas Liquids .......................................... 2,195 -1 169 – 653 – – -225 311 1,116 1,815
Ethane .......................................................... 949 – – 6 – – – – -69 – – 133 1,329Propane ........................................................ 671 – – 158 – 228 – – -110 – – 852 315Normal Butane .............................................. 99 – – -30 – 85 – – -43 99 123 21Isobutane ...................................................... 258 – – -12 – 24 – – 4 122 7 137Natural Gasoline ........................................... 219 -1 – – – -122 – – -7 89 1 13
Refinery Olefins ................................................ – – – – 227 5 – – – 0 – – – – 246Ethylene ........................................................ – – – – 0 – – – – 0 – – – – 0Propylene ..................................................... – – – – 224 – 14 – – -3 – – – – 241Butylene ........................................................ – – – – 3 5 – – – 3 – – – – 6Isobutylene ................................................... – – – – -1 – – – – 0 – – – – -1
Other Liquids ...................................................... – – 123 – – 564 -1,690 -89 21 -1,648 418 117Hydrogen/Oxygenates/Renewables/ Other Hydrocarbons ....................................... – – 123 – – 11 222 112 4 285 179 0
Hydrogen ...................................................... – – – – – – – – 127 – – 127 – 0Oxygenates (excluding Fuel Ethanol) ........... – – 77 – – 10 – -22 -2 – 66 0Renewable Fuels (including Fuel Ethanol) ... – – 46 – – 1 222 8 5 158 113 0
Fuel Ethanol ............................................. – – 26 – – – 214 20 5 145 111 0Renewable Fuels Except Fuel Ethanol ..... – – 20 – – 1 7 -13 1 13 2 0
Other Hydrocarbons ..................................... – – – – – – 0 – 0 0 – – 0Unfinished Oils ................................................. – – – – – – 500 -3 – – 38 144 198 117Motor Gasoline Blend.Comp. (MGBC) ............. – – – – – 53 -1,909 -202 -21 -2,078 41 0
Reformulated ................................................ – – – – – – -384 114 -3 -267 0 0Conventional ................................................. – – – – – 53 -1,525 -316 -18 -1,811 41 0
Aviation Gasoline Blend. Comp. ....................... – – – – – – – – – – 0 0 – -1
Finished Petroleum Products ............................ – – – 7,588 146 -1,714 204 -33 – – 2,874 3,383Finished Motor Gasoline ................................... – – – 2,298 – -227 181 -6 – – 866 1,392
Reformulated ................................................ – – – 460 – – -117 – – – – 343Conventional ................................................. – – – 1,839 – -227 298 -6 – – 866 1,049
Finished Aviation Gasoline ............................... – – – – 7 – -3 – – -1 – – – 5Kerosene-Type Jet Fuel ................................... – – – – 903 – -549 – – 3 – – 170 181Kerosene .......................................................... – – – – 0 – -2 – – -1 – – 6 -8Distillate Fuel Oil ............................................... – – – – 2,729 9 -951 22 -51 – – 1,034 826
15 ppm sulfur and under ............................... – – – – 2,462 3 -867 22 -45 – – 886 778Greater than 15 ppm to 500 ppm sulfur ........ – – – – 72 – -8 – – -7 – – 87 -16Greater than 500 ppm sulfur ......................... – – – – 195 6 -75 – – 1 – – 61 64
Residual Fuel Oil7 ............................................ – – – – 233 56 22 – – 22 – – 241 48Less than 0.31 percent sulfur ....................... – – – – 42 9 0 – – 5 – – NA NA0.31 to 1.00 percent sulfur ............................ – – – – 17 5 2 – – -14 – – NA NAGreater than 1.00 percent sulfur ................... – – – – 174 42 20 – – 31 – – NA NA
Petrochemical Feedstocks ............................... – – – – 261 17 3 – – 0 – – – – 280Naphtha for Petro. Feed. Use ....................... – – – – 171 16 2 – – 0 – – – – 189Other Oils for Petro. Feed. Use .................... – – – – 90 1 1 – – 0 – – – – 92
Special Naphthas ............................................. – – – – 35 15 -1 – – -1 – – – – 49Lubricants ......................................................... – – – – 147 35 -21 – – -2 – – 94 70Waxes ............................................................... – – – – 3 1 – – – 0 – – 1 4Petroleum Coke ................................................ – – – – 489 14 27 – – -5 – – 450 84
Marketable .................................................... – – – – 370 14 27 – – -5 – – 450 -34Catalyst ......................................................... – – – – 119 – – – – – – – – – – – – 119
Asphalt and Road Oil ........................................ – – – – 75 – -11 – – 9 – – 12 43Still Gas ............................................................ – – – – 352 – – – – – – – – – – – – 352Miscellaneous Products .................................... – – – – 56 0 0 – – 0 – – 0 56
Total ..................................................................... 8,728 123 7,983 3,351 -1,972 431 -96 7,372 5,809 5,560
– – = Not Applicable.– = No Data Reported.
NA = Not Available.1 Represents the PAD District in which the material entered the United States and not necessarily where the crude oil or product is processed and/or consumed.2 A negative number indicates a decrease in stocks and a positive number indicates an increase in stocks. Stock change for crude oil excludes lease stocks beginning with January 2005 (see explanatory notes).3 Includes an adjustment for crude oil, previously referred to as ’Unaccounted For Crude Oil.’ Also included is an adjustment for motor gasoline blending components, fuel ethanol, and distillate fuel oil. See
Appendix B, Note 2C for a detailed explanation of these adjustments.4 A negative number indicates a decrease in stocks and a positive number indicates an increase in stocks. Stock change for crude oil excludes lease stocks beginning with January 2005 (see explanatory notes).5 Product supplied is equal to field production, plus renewable fuels and oxygenate plant net production, plus refinery and blender net production, plus imports, plus net receipts, plus adjustments, minus stock
change, minus refinery and blender net inputs, minus exports.6 Includes value for the Strategic Petroleum Reserve. See Table 25 for the breakout of Commercial Crude Oil.7 Total residual fuel oil ending stocks and stock change include stocks held at pipelines. Residual fuel oil ending stocks and stock change by sulfur content exclude pipeline stocks. Therefore, the sum of residual
fuel oil ending stocks and stock change by sulfur content may not equal total residual fuel oil ending stocks and stock change.Notes: Totals may not equal sum of components due to independent rounding. Domestic crude oil field production are estimates.Sources: Energy Information Administration (EIA) Forms EIA-22M "Monthly Biodiesel Production Survey", Forms EIA-810, "Monthly Refinery Report," EIA-812, "Monthly Product Pipeline Report," EIA-813, "MonthlyCrude Oil Report," EIA-814, "Monthly Imports Report," EIA-815, "Monthly Bulk Terminal and Blender Report," EIA-816, "Monthly Natural Gas Liquids Report," EIA-817, "Monthly Tanker and Barge Movements Report,"and EIA-819, "Monthly Oxygenate Report." Domestic crude oil field production estimates based on Form EIA-914, "Monthly Crude Oil and Lease Condensate, and Natural Gas Production Report," and data from Stateconservation agencies, U.S. Department of Interior, and the Bureau of Ocean Energy Management. Export data from the U.S. Census Bureau and EIA estimates. Rail net receipts estimates based on EIA analysis ofdata from the Surface Transportation Board and other information.

Energy Information Administration/Petroleum Supply Monthly,22 April 2018
Table 17. PAD District 4 - Supply, Disposition, and Ending Stocks of Crude Oil and Petroleum Products, April 2018(Thousand Barrels)
Commodity
Supply Disposition
EndingStocks
FieldProduction
RenewableFuels andOxygenatePlant Net
Production
Refineryand
BlenderNet
Production
Imports(PADD ofEntry)1
NetReceipts2
Adjust-ments3
StockChange4
Refineryand
BlenderNet
Inputs ExportsProductsSupplied5
Crude Oil ............................................................. 25,146 – – – – 10,189 -16,448 -1,121 547 17,199 20 0 23,512
Hydrocarbon Gas Liquids .................................. 12,670 -8 412 301 -12,181 – – 347 561 95 191 3,054Natural Gas Liquids .......................................... 12,670 -8 387 301 -12,181 – – 365 561 95 148 3,013
Ethane .......................................................... 3,946 – – – – – – – 48 – – – -30 507Propane ........................................................ 4,414 – – 282 258 -4,206 – – 16 – – – 732 981Normal Butane .............................................. 1,719 – – 136 – -1,613 – – 283 202 25 -268 893Isobutane ...................................................... 784 – – -31 43 -883 – – 14 196 – -297 266Natural Gasoline ........................................... 1,807 -8 – – – -1,551 – – 4 163 70 11 366
Refinery Olefins ................................................ – – – – 25 – – – – -18 – – – – 43 41Ethylene ........................................................ – – – – – – – – – – – – – – – –Propylene ..................................................... – – – – -4 – – – – -4 – – – – 0 0Butylene ........................................................ – – – – 29 – – – – -14 – – – – 43 41Isobutylene ................................................... – – – – – – – – – 0 – – – – 0 0
Other Liquids ...................................................... – – 422 – – 74 450 -945 -154 82 0 73 9,218Hydrogen/Oxygenates/Renewables/ Other Hydrocarbons ....................................... – – 422 – – 1 395 317 37 1,098 0 0 406
Hydrogen ...................................................... – – – – – – – – 197 – – 197 – 0 – –Oxygenates (excluding Fuel Ethanol) ........... – – – – – – – -1 -1 – – 0 –Renewable Fuels (including Fuel Ethanol) ... – – 422 – – 1 395 121 38 901 0 0 406
Fuel Ethanol ............................................. – – 422 – – – 375 102 42 857 – 0 395Renewable Fuels Except Fuel Ethanol ..... – – – – – 1 20 20 -4 44 0 0 11
Other Hydrocarbons ..................................... – – – – – – – – – – – – – –Unfinished Oils ................................................. – – – – – – – – – – 169 -242 0 73 3,299Motor Gasoline Blend.Comp. (MGBC) ............. – – – – – 73 55 -1,262 -360 -774 – 0 5,513
Reformulated ................................................ – – – – – – – – – – – – –Conventional ................................................. – – – – – – 55 -1,262 -360 -774 – 0 5,513
Aviation Gasoline Blend. Comp. ....................... – – – – – – – – – – – – – – –
Finished Petroleum Products ............................ – – – 18,283 45 -871 1,141 -251 – – 19 18,829 8,928Finished Motor Gasoline ................................... – – – 8,726 – -730 1,160 -171 – – 2 9,325 1,667
Reformulated ................................................ – – – – – – – – – – – – –Conventional ................................................. – – – 8,726 – -730 1,160 -171 – – 2 9,325 1,667
Finished Aviation Gasoline ............................... – – – – 3 – – – – -2 – – – 5 7Kerosene-Type Jet Fuel ................................... – – – – 1,000 8 594 – – -16 – – – 1,618 666Kerosene .......................................................... – – – – – – – – – 0 – – – 0 2Distillate Fuel Oil ............................................... – – – – 5,638 21 240 -20 -176 – – 0 6,055 3,674
15 ppm sulfur and under ............................... – – – – 5,610 21 280 -20 -166 – – 0 6,057 3,432Greater than 15 ppm to 500 ppm sulfur ........ – – – – 34 – -40 – – -5 – – – -1 190Greater than 500 ppm sulfur ......................... – – – – -6 – – – – -5 – – – -1 52
Residual Fuel Oil6 ............................................ – – – – 325 – – – – 21 – – 9 295 279Less than 0.31 percent sulfur ....................... – – – – 192 – – – – 0 – – NA NA 300.31 to 1.00 percent sulfur ............................ – – – – 20 – – – – 20 – – NA NA 39Greater than 1.00 percent sulfur ................... – – – – 113 – – – – 1 – – NA NA 210
Petrochemical Feedstocks ............................... – – – – – – – – – – – – – – – –Naphtha for Petro. Feed. Use ....................... – – – – – – – – – – – – – – – –Other Oils for Petro. Feed. Use .................... – – – – – – – – – – – – – – – –
Special Naphthas ............................................. – – – – – – – – – – – – – – – –Lubricants ......................................................... – – – – – – – – – – – – 7 -7 –Waxes ............................................................... – – – – – – – – – – – – 0 0 –Petroleum Coke ................................................ – – – – 774 – -371 – – -41 – – – 444 111
Marketable .................................................... – – – – 545 – -371 – – -41 – – – 215 111Catalyst ......................................................... – – – – 229 – – – – – – – – – – – – 229 – –
Asphalt and Road Oil ........................................ – – – – 1,087 15 -604 – – 136 – – 1 361 2,505Still Gas ............................................................ – – – – 633 – – – – – – – – – – – – 633 – –Miscellaneous Products .................................... – – – – 97 1 – – – -2 – – 0 100 17
Total ..................................................................... 37,816 414 18,695 10,609 -29,050 -925 489 17,842 134 19,094 44,712
– – = Not Applicable.– = No Data Reported.
NA = Not Available.1 Represents the PAD District in which the material entered the United States and not necessarily where the crude oil or product is processed and/or consumed.2 A negative number indicates a decrease in stocks and a positive number indicates an increase in stocks. Stock change for crude oil excludes lease stocks beginning with January 2005 (see explanatory notes).3 Includes an adjustment for crude oil, previously referred to as ’Unaccounted For Crude Oil.’ Also included is an adjustment for motor gasoline blending components, fuel ethanol, and distillate fuel oil. See
Appendix B, Note 2C for a detailed explanation of these adjustments.4 A negative number indicates a decrease in stocks and a positive number indicates an increase in stocks. Stock change for crude oil excludes lease stocks beginning with January 2005 (see explanatory notes).5 Product supplied is equal to field production, plus renewable fuels and oxygenate plant net production, plus refinery and blender net production, plus imports, plus net receipts, plus adjustments, minus stock
change, minus refinery and blender net inputs, minus exports.6 Total residual fuel oil ending stocks and stock change include stocks held at pipelines. Residual fuel oil ending stocks and stock change by sulfur content exclude pipeline stocks. Therefore, the sum of residual
fuel oil ending stocks and stock change by sulfur content may not equal total residual fuel oil ending stocks and stock change.Notes: Totals may not equal sum of components due to independent rounding. Domestic crude oil field production are estimates.Sources: Energy Information Administration (EIA) Forms EIA-22M "Monthly Biodiesel Production Survey", Forms EIA-810, "Monthly Refinery Report," EIA-812, "Monthly Product Pipeline Report," EIA-813, "MonthlyCrude Oil Report," EIA-814, "Monthly Imports Report," EIA-815, "Monthly Bulk Terminal and Blender Report," EIA-816, "Monthly Natural Gas Liquids Report," EIA-817, "Monthly Tanker and Barge Movements Report,"and EIA-819, "Monthly Oxygenate Report." Domestic crude oil field production estimates based on Form EIA-914, "Monthly Crude Oil and Lease Condensate, and Natural Gas Production Report," and data from Stateconservation agencies, U.S. Department of Interior, and the Bureau of Ocean Energy Management. Export data from the U.S. Census Bureau and EIA estimates. Rail net receipts estimates based on EIA analysis ofdata from the Surface Transportation Board and other information.
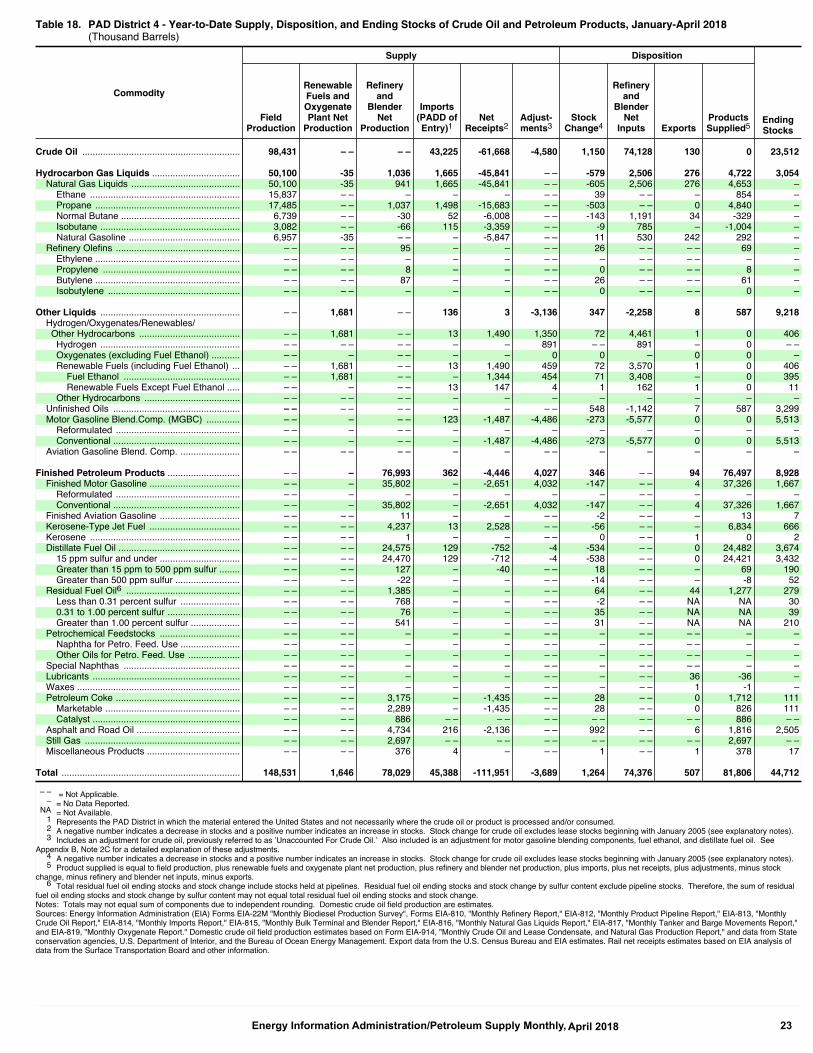
Energy Information Administration/Petroleum Supply Monthly, 23 April 2018
Table 17. PAD District 4 - Supply, Disposition, and Ending Stocks of Crude Oil and Petroleum Products, April 2018(Thousand Barrels)
Commodity
Supply Disposition
EndingStocks
FieldProduction
RenewableFuels andOxygenatePlant Net
Production
Refineryand
BlenderNet
Production
Imports(PADD ofEntry)1
NetReceipts2
Adjust-ments3
StockChange4
Refineryand
BlenderNet
Inputs ExportsProductsSupplied5
Crude Oil ............................................................. 25,146 – – – – 10,189 -16,448 -1,121 547 17,199 20 0 23,512
Hydrocarbon Gas Liquids .................................. 12,670 -8 412 301 -12,181 – – 347 561 95 191 3,054Natural Gas Liquids .......................................... 12,670 -8 387 301 -12,181 – – 365 561 95 148 3,013
Ethane .......................................................... 3,946 – – – – – – – 48 – – – -30 507Propane ........................................................ 4,414 – – 282 258 -4,206 – – 16 – – – 732 981Normal Butane .............................................. 1,719 – – 136 – -1,613 – – 283 202 25 -268 893Isobutane ...................................................... 784 – – -31 43 -883 – – 14 196 – -297 266Natural Gasoline ........................................... 1,807 -8 – – – -1,551 – – 4 163 70 11 366
Refinery Olefins ................................................ – – – – 25 – – – – -18 – – – – 43 41Ethylene ........................................................ – – – – – – – – – – – – – – – –Propylene ..................................................... – – – – -4 – – – – -4 – – – – 0 0Butylene ........................................................ – – – – 29 – – – – -14 – – – – 43 41Isobutylene ................................................... – – – – – – – – – 0 – – – – 0 0
Other Liquids ...................................................... – – 422 – – 74 450 -945 -154 82 0 73 9,218Hydrogen/Oxygenates/Renewables/ Other Hydrocarbons ....................................... – – 422 – – 1 395 317 37 1,098 0 0 406
Hydrogen ...................................................... – – – – – – – – 197 – – 197 – 0 – –Oxygenates (excluding Fuel Ethanol) ........... – – – – – – – -1 -1 – – 0 –Renewable Fuels (including Fuel Ethanol) ... – – 422 – – 1 395 121 38 901 0 0 406
Fuel Ethanol ............................................. – – 422 – – – 375 102 42 857 – 0 395Renewable Fuels Except Fuel Ethanol ..... – – – – – 1 20 20 -4 44 0 0 11
Other Hydrocarbons ..................................... – – – – – – – – – – – – – –Unfinished Oils ................................................. – – – – – – – – – – 169 -242 0 73 3,299Motor Gasoline Blend.Comp. (MGBC) ............. – – – – – 73 55 -1,262 -360 -774 – 0 5,513
Reformulated ................................................ – – – – – – – – – – – – –Conventional ................................................. – – – – – – 55 -1,262 -360 -774 – 0 5,513
Aviation Gasoline Blend. Comp. ....................... – – – – – – – – – – – – – – –
Finished Petroleum Products ............................ – – – 18,283 45 -871 1,141 -251 – – 19 18,829 8,928Finished Motor Gasoline ................................... – – – 8,726 – -730 1,160 -171 – – 2 9,325 1,667
Reformulated ................................................ – – – – – – – – – – – – –Conventional ................................................. – – – 8,726 – -730 1,160 -171 – – 2 9,325 1,667
Finished Aviation Gasoline ............................... – – – – 3 – – – – -2 – – – 5 7Kerosene-Type Jet Fuel ................................... – – – – 1,000 8 594 – – -16 – – – 1,618 666Kerosene .......................................................... – – – – – – – – – 0 – – – 0 2Distillate Fuel Oil ............................................... – – – – 5,638 21 240 -20 -176 – – 0 6,055 3,674
15 ppm sulfur and under ............................... – – – – 5,610 21 280 -20 -166 – – 0 6,057 3,432Greater than 15 ppm to 500 ppm sulfur ........ – – – – 34 – -40 – – -5 – – – -1 190Greater than 500 ppm sulfur ......................... – – – – -6 – – – – -5 – – – -1 52
Residual Fuel Oil6 ............................................ – – – – 325 – – – – 21 – – 9 295 279Less than 0.31 percent sulfur ....................... – – – – 192 – – – – 0 – – NA NA 300.31 to 1.00 percent sulfur ............................ – – – – 20 – – – – 20 – – NA NA 39Greater than 1.00 percent sulfur ................... – – – – 113 – – – – 1 – – NA NA 210
Petrochemical Feedstocks ............................... – – – – – – – – – – – – – – – –Naphtha for Petro. Feed. Use ....................... – – – – – – – – – – – – – – – –Other Oils for Petro. Feed. Use .................... – – – – – – – – – – – – – – – –
Special Naphthas ............................................. – – – – – – – – – – – – – – – –Lubricants ......................................................... – – – – – – – – – – – – 7 -7 –Waxes ............................................................... – – – – – – – – – – – – 0 0 –Petroleum Coke ................................................ – – – – 774 – -371 – – -41 – – – 444 111
Marketable .................................................... – – – – 545 – -371 – – -41 – – – 215 111Catalyst ......................................................... – – – – 229 – – – – – – – – – – – – 229 – –
Asphalt and Road Oil ........................................ – – – – 1,087 15 -604 – – 136 – – 1 361 2,505Still Gas ............................................................ – – – – 633 – – – – – – – – – – – – 633 – –Miscellaneous Products .................................... – – – – 97 1 – – – -2 – – 0 100 17
Total ..................................................................... 37,816 414 18,695 10,609 -29,050 -925 489 17,842 134 19,094 44,712
– – = Not Applicable.– = No Data Reported.
NA = Not Available.1 Represents the PAD District in which the material entered the United States and not necessarily where the crude oil or product is processed and/or consumed.2 A negative number indicates a decrease in stocks and a positive number indicates an increase in stocks. Stock change for crude oil excludes lease stocks beginning with January 2005 (see explanatory notes).3 Includes an adjustment for crude oil, previously referred to as ’Unaccounted For Crude Oil.’ Also included is an adjustment for motor gasoline blending components, fuel ethanol, and distillate fuel oil. See
Appendix B, Note 2C for a detailed explanation of these adjustments.4 A negative number indicates a decrease in stocks and a positive number indicates an increase in stocks. Stock change for crude oil excludes lease stocks beginning with January 2005 (see explanatory notes).5 Product supplied is equal to field production, plus renewable fuels and oxygenate plant net production, plus refinery and blender net production, plus imports, plus net receipts, plus adjustments, minus stock
change, minus refinery and blender net inputs, minus exports.6 Total residual fuel oil ending stocks and stock change include stocks held at pipelines. Residual fuel oil ending stocks and stock change by sulfur content exclude pipeline stocks. Therefore, the sum of residual
fuel oil ending stocks and stock change by sulfur content may not equal total residual fuel oil ending stocks and stock change.Notes: Totals may not equal sum of components due to independent rounding. Domestic crude oil field production are estimates.Sources: Energy Information Administration (EIA) Forms EIA-22M "Monthly Biodiesel Production Survey", Forms EIA-810, "Monthly Refinery Report," EIA-812, "Monthly Product Pipeline Report," EIA-813, "MonthlyCrude Oil Report," EIA-814, "Monthly Imports Report," EIA-815, "Monthly Bulk Terminal and Blender Report," EIA-816, "Monthly Natural Gas Liquids Report," EIA-817, "Monthly Tanker and Barge Movements Report,"and EIA-819, "Monthly Oxygenate Report." Domestic crude oil field production estimates based on Form EIA-914, "Monthly Crude Oil and Lease Condensate, and Natural Gas Production Report," and data from Stateconservation agencies, U.S. Department of Interior, and the Bureau of Ocean Energy Management. Export data from the U.S. Census Bureau and EIA estimates. Rail net receipts estimates based on EIA analysis ofdata from the Surface Transportation Board and other information.
Table 18. PAD District 4 - Year-to-Date Supply, Disposition, and Ending Stocks of Crude Oil and Petroleum Products, January-April 2018(Thousand Barrels)
Commodity
Supply Disposition
EndingStocks
FieldProduction
RenewableFuels andOxygenatePlant Net
Production
Refineryand
BlenderNet
Production
Imports(PADD ofEntry)1
NetReceipts2
Adjust-ments3
StockChange4
Refineryand
BlenderNet
Inputs ExportsProductsSupplied5
Crude Oil ............................................................. 98,431 – – – – 43,225 -61,668 -4,580 1,150 74,128 130 0 23,512
Hydrocarbon Gas Liquids .................................. 50,100 -35 1,036 1,665 -45,841 – – -579 2,506 276 4,722 3,054Natural Gas Liquids .......................................... 50,100 -35 941 1,665 -45,841 – – -605 2,506 276 4,653 –
Ethane .......................................................... 15,837 – – – – – – – 39 – – – 854 –Propane ........................................................ 17,485 – – 1,037 1,498 -15,683 – – -503 – – 0 4,840 –Normal Butane .............................................. 6,739 – – -30 52 -6,008 – – -143 1,191 34 -329 –Isobutane ...................................................... 3,082 – – -66 115 -3,359 – – -9 785 – -1,004 –Natural Gasoline ........................................... 6,957 -35 – – – -5,847 – – 11 530 242 292 –
Refinery Olefins ................................................ – – – – 95 – – – – 26 – – – – 69 –Ethylene ........................................................ – – – – – – – – – – – – – – – –Propylene ..................................................... – – – – 8 – – – – 0 – – – – 8 –Butylene ........................................................ – – – – 87 – – – – 26 – – – – 61 –Isobutylene ................................................... – – – – – – – – – 0 – – – – 0 –
Other Liquids ...................................................... – – 1,681 – – 136 3 -3,136 347 -2,258 8 587 9,218Hydrogen/Oxygenates/Renewables/ Other Hydrocarbons ....................................... – – 1,681 – – 13 1,490 1,350 72 4,461 1 0 406
Hydrogen ...................................................... – – – – – – – – 891 – – 891 – 0 – –Oxygenates (excluding Fuel Ethanol) ........... – – – – – – – 0 0 – 0 0 –Renewable Fuels (including Fuel Ethanol) ... – – 1,681 – – 13 1,490 459 72 3,570 1 0 406
Fuel Ethanol ............................................. – – 1,681 – – – 1,344 454 71 3,408 – 0 395Renewable Fuels Except Fuel Ethanol ..... – – – – – 13 147 4 1 162 1 0 11
Other Hydrocarbons ..................................... – – – – – – – – – – – – – –Unfinished Oils ................................................. – – – – – – – – – – 548 -1,142 7 587 3,299Motor Gasoline Blend.Comp. (MGBC) ............. – – – – – 123 -1,487 -4,486 -273 -5,577 0 0 5,513
Reformulated ................................................ – – – – – – – – – – – – –Conventional ................................................. – – – – – – -1,487 -4,486 -273 -5,577 0 0 5,513
Aviation Gasoline Blend. Comp. ....................... – – – – – – – – – – – – – – –
Finished Petroleum Products ............................ – – – 76,993 362 -4,446 4,027 346 – – 94 76,497 8,928Finished Motor Gasoline ................................... – – – 35,802 – -2,651 4,032 -147 – – 4 37,326 1,667
Reformulated ................................................ – – – – – – – – – – – – –Conventional ................................................. – – – 35,802 – -2,651 4,032 -147 – – 4 37,326 1,667
Finished Aviation Gasoline ............................... – – – – 11 – – – – -2 – – – 13 7Kerosene-Type Jet Fuel ................................... – – – – 4,237 13 2,528 – – -56 – – – 6,834 666Kerosene .......................................................... – – – – 1 – – – – 0 – – 1 0 2Distillate Fuel Oil ............................................... – – – – 24,575 129 -752 -4 -534 – – 0 24,482 3,674
15 ppm sulfur and under ............................... – – – – 24,470 129 -712 -4 -538 – – 0 24,421 3,432Greater than 15 ppm to 500 ppm sulfur ........ – – – – 127 – -40 – – 18 – – – 69 190Greater than 500 ppm sulfur ......................... – – – – -22 – – – – -14 – – – -8 52
Residual Fuel Oil6 ............................................ – – – – 1,385 – – – – 64 – – 44 1,277 279Less than 0.31 percent sulfur ....................... – – – – 768 – – – – -2 – – NA NA 300.31 to 1.00 percent sulfur ............................ – – – – 76 – – – – 35 – – NA NA 39Greater than 1.00 percent sulfur ................... – – – – 541 – – – – 31 – – NA NA 210
Petrochemical Feedstocks ............................... – – – – – – – – – – – – – – – –Naphtha for Petro. Feed. Use ....................... – – – – – – – – – – – – – – – –Other Oils for Petro. Feed. Use .................... – – – – – – – – – – – – – – – –
Special Naphthas ............................................. – – – – – – – – – – – – – – – –Lubricants ......................................................... – – – – – – – – – – – – 36 -36 –Waxes ............................................................... – – – – – – – – – – – – 1 -1 –Petroleum Coke ................................................ – – – – 3,175 – -1,435 – – 28 – – 0 1,712 111
Marketable .................................................... – – – – 2,289 – -1,435 – – 28 – – 0 826 111Catalyst ......................................................... – – – – 886 – – – – – – – – – – – – 886 – –
Asphalt and Road Oil ........................................ – – – – 4,734 216 -2,136 – – 992 – – 6 1,816 2,505Still Gas ............................................................ – – – – 2,697 – – – – – – – – – – – – 2,697 – –Miscellaneous Products .................................... – – – – 376 4 – – – 1 – – 1 378 17
Total ..................................................................... 148,531 1,646 78,029 45,388 -111,951 -3,689 1,264 74,376 507 81,806 44,712
– – = Not Applicable.– = No Data Reported.
NA = Not Available.1 Represents the PAD District in which the material entered the United States and not necessarily where the crude oil or product is processed and/or consumed.2 A negative number indicates a decrease in stocks and a positive number indicates an increase in stocks. Stock change for crude oil excludes lease stocks beginning with January 2005 (see explanatory notes).3 Includes an adjustment for crude oil, previously referred to as ’Unaccounted For Crude Oil.’ Also included is an adjustment for motor gasoline blending components, fuel ethanol, and distillate fuel oil. See
Appendix B, Note 2C for a detailed explanation of these adjustments.4 A negative number indicates a decrease in stocks and a positive number indicates an increase in stocks. Stock change for crude oil excludes lease stocks beginning with January 2005 (see explanatory notes).5 Product supplied is equal to field production, plus renewable fuels and oxygenate plant net production, plus refinery and blender net production, plus imports, plus net receipts, plus adjustments, minus stock
change, minus refinery and blender net inputs, minus exports.6 Total residual fuel oil ending stocks and stock change include stocks held at pipelines. Residual fuel oil ending stocks and stock change by sulfur content exclude pipeline stocks. Therefore, the sum of residual
fuel oil ending stocks and stock change by sulfur content may not equal total residual fuel oil ending stocks and stock change.Notes: Totals may not equal sum of components due to independent rounding. Domestic crude oil field production are estimates.Sources: Energy Information Administration (EIA) Forms EIA-22M "Monthly Biodiesel Production Survey", Forms EIA-810, "Monthly Refinery Report," EIA-812, "Monthly Product Pipeline Report," EIA-813, "MonthlyCrude Oil Report," EIA-814, "Monthly Imports Report," EIA-815, "Monthly Bulk Terminal and Blender Report," EIA-816, "Monthly Natural Gas Liquids Report," EIA-817, "Monthly Tanker and Barge Movements Report,"and EIA-819, "Monthly Oxygenate Report." Domestic crude oil field production estimates based on Form EIA-914, "Monthly Crude Oil and Lease Condensate, and Natural Gas Production Report," and data from Stateconservation agencies, U.S. Department of Interior, and the Bureau of Ocean Energy Management. Export data from the U.S. Census Bureau and EIA estimates. Rail net receipts estimates based on EIA analysis ofdata from the Surface Transportation Board and other information.

Energy Information Administration/Petroleum Supply Monthly,24 April 2018
Table 19. PAD District 4 - Daily Average Supply and Disposition of Crude Oil and Petroleum Products, April 2018(Thousand Barrels per Day)
Commodity
Supply Disposition
FieldProduction
RenewableFuels andOxygenatePlant Net
Production
Refineryand
BlenderNet
Production
Imports(PADD ofEntry)1
NetReceipts2
Adjust-ments3
StockChange4
Refineryand
BlenderNet
Inputs ExportsProductsSupplied5
Crude Oil ............................................................. 838 – – – – 340 -548 -37 18 573 1 0
Hydrocarbon Gas Liquids .................................. 422 0 14 10 -406 – – 12 19 3 6Natural Gas Liquids .......................................... 422 0 13 10 -406 – – 12 19 3 5
Ethane .......................................................... 132 – – – – – – – 2 – – – -1Propane ........................................................ 147 – – 9 9 -140 – – 1 – – – 24Normal Butane .............................................. 57 – – 5 – -54 – – 9 7 1 -9Isobutane ...................................................... 26 – – -1 1 -29 – – 0 7 – -10Natural Gasoline ........................................... 60 0 – – – -52 – – 0 5 2 0
Refinery Olefins ................................................ – – – – 1 – – – – -1 – – – – 1Ethylene ........................................................ – – – – – – – – – – – – – – –Propylene ..................................................... – – – – 0 – – – – 0 – – – – 0Butylene ........................................................ – – – – 1 – – – – 0 – – – – 1Isobutylene ................................................... – – – – – – – – – 0 – – – – 0
Other Liquids ...................................................... – – 14 – – 2 15 -31 -5 3 0 2Hydrogen/Oxygenates/Renewables/ Other Hydrocarbons ....................................... – – 14 – – 0 13 11 1 37 0 0
Hydrogen ...................................................... – – – – – – – – 7 – – 7 – 0Oxygenates (excluding Fuel Ethanol) ........... – – – – – – – 0 0 – – 0Renewable Fuels (including Fuel Ethanol) ... – – 14 – – 0 13 4 1 30 0 0
Fuel Ethanol ............................................. – – 14 – – – 13 3 1 29 – 0Renewable Fuels Except Fuel Ethanol ..... – – – – – 0 1 1 0 1 0 0
Other Hydrocarbons ..................................... – – – – – – – – – – – – –Unfinished Oils ................................................. – – – – – – – – – – 6 -8 0 2Motor Gasoline Blend.Comp. (MGBC) ............. – – – – – 2 2 -42 -12 -26 – 0
Reformulated ................................................ – – – – – – – – – – – –Conventional ................................................. – – – – – – 2 -42 -12 -26 – 0
Aviation Gasoline Blend. Comp. ....................... – – – – – – – – – – – – – –
Finished Petroleum Products ............................ – – – 609 2 -29 38 -8 – – 1 628Finished Motor Gasoline ................................... – – – 291 – -24 39 -6 – – 0 311
Reformulated ................................................ – – – – – – – – – – – –Conventional ................................................. – – – 291 – -24 39 -6 – – 0 311
Finished Aviation Gasoline ............................... – – – – 0 – – – – 0 – – – 0Kerosene-Type Jet Fuel ................................... – – – – 33 0 20 – – -1 – – – 54Kerosene .......................................................... – – – – – – – – – 0 – – – 0Distillate Fuel Oil ............................................... – – – – 188 1 8 -1 -6 – – 0 202
15 ppm sulfur and under ............................... – – – – 187 1 9 -1 -6 – – 0 202Greater than 15 ppm to 500 ppm sulfur ........ – – – – 1 – -1 – – 0 – – – 0Greater than 500 ppm sulfur ......................... – – – – 0 – – – – 0 – – – 0
Residual Fuel Oil6 ............................................ – – – – 11 – – – – 1 – – 0 10Less than 0.31 percent sulfur ....................... – – – – 6 – – – – 0 – – NA NA0.31 to 1.00 percent sulfur ............................ – – – – 1 – – – – 1 – – NA NAGreater than 1.00 percent sulfur ................... – – – – 4 – – – – 0 – – NA NA
Petrochemical Feedstocks ............................... – – – – – – – – – – – – – – –Naphtha for Petro. Feed. Use ....................... – – – – – – – – – – – – – – –Other Oils for Petro. Feed. Use .................... – – – – – – – – – – – – – – –
Special Naphthas ............................................. – – – – – – – – – – – – – – –Lubricants ......................................................... – – – – – – – – – – – – 0 0Waxes ............................................................... – – – – – – – – – – – – 0 0Petroleum Coke ................................................ – – – – 26 – -12 – – -1 – – – 15
Marketable .................................................... – – – – 18 – -12 – – -1 – – – 7Catalyst ......................................................... – – – – 8 – – – – – – – – – – – – 8
Asphalt and Road Oil ........................................ – – – – 36 1 -20 – – 5 – – 0 12Still Gas ............................................................ – – – – 21 – – – – – – – – – – – – 21Miscellaneous Products .................................... – – – – 3 0 – – – 0 – – 0 3
Total ..................................................................... 1,261 14 623 354 -968 -31 16 595 4 636
– – = Not Applicable.– = No Data Reported.
NA = Not Available.1 Represents the PAD District in which the material entered the United States and not necessarily where the crude oil or product is processed and/or consumed.2 A negative number indicates a decrease in stocks and a positive number indicates an increase in stocks. Stock change for crude oil excludes lease stocks beginning with January 2005 (see explanatory notes).3 Includes an adjustment for crude oil, previously referred to as ’Unaccounted For Crude Oil.’ Also included is an adjustment for motor gasoline blending components, fuel ethanol, and distillate fuel oil. See
Appendix B, Note 2C for a detailed explanation of these adjustments.4 A negative number indicates a decrease in stocks and a positive number indicates an increase in stocks. Stock change for crude oil excludes lease stocks beginning with January 2005 (see explanatory notes).5 Product supplied is equal to field production, plus renewable fuels and oxygenate plant net production, plus refinery and blender net production, plus imports, plus net receipts, plus adjustments, minus stock
change, minus refinery and blender net inputs, minus exports.6 Total residual fuel oil ending stocks and stock change include stocks held at pipelines. Residual fuel oil ending stocks and stock change by sulfur content exclude pipeline stocks. Therefore, the sum of residual
fuel oil ending stocks and stock change by sulfur content may not equal total residual fuel oil ending stocks and stock change.Notes: Totals may not equal sum of components due to independent rounding. Domestic crude oil field production are estimates.Sources: Energy Information Administration (EIA) Forms EIA-22M "Monthly Biodiesel Production Survey", Forms EIA-810, "Monthly Refinery Report," EIA-812, "Monthly Product Pipeline Report," EIA-813, "MonthlyCrude Oil Report," EIA-814, "Monthly Imports Report," EIA-815, "Monthly Bulk Terminal and Blender Report," EIA-816, "Monthly Natural Gas Liquids Report," EIA-817, "Monthly Tanker and Barge Movements Report,"and EIA-819, "Monthly Oxygenate Report." Domestic crude oil field production estimates based on Form EIA-914, "Monthly Crude Oil and Lease Condensate, and Natural Gas Production Report," and data from Stateconservation agencies, U.S. Department of Interior, and the Bureau of Ocean Energy Management. Export data from the U.S. Census Bureau and EIA estimates. Rail net receipts estimates based on EIA analysis ofdata from the Surface Transportation Board and other information.

Energy Information Administration/Petroleum Supply Monthly, 25 April 2018
Table 19. PAD District 4 - Daily Average Supply and Disposition of Crude Oil and Petroleum Products, April 2018(Thousand Barrels per Day)
Commodity
Supply Disposition
FieldProduction
RenewableFuels andOxygenatePlant Net
Production
Refineryand
BlenderNet
Production
Imports(PADD ofEntry)1
NetReceipts2
Adjust-ments3
StockChange4
Refineryand
BlenderNet
Inputs ExportsProductsSupplied5
Crude Oil ............................................................. 838 – – – – 340 -548 -37 18 573 1 0
Hydrocarbon Gas Liquids .................................. 422 0 14 10 -406 – – 12 19 3 6Natural Gas Liquids .......................................... 422 0 13 10 -406 – – 12 19 3 5
Ethane .......................................................... 132 – – – – – – – 2 – – – -1Propane ........................................................ 147 – – 9 9 -140 – – 1 – – – 24Normal Butane .............................................. 57 – – 5 – -54 – – 9 7 1 -9Isobutane ...................................................... 26 – – -1 1 -29 – – 0 7 – -10Natural Gasoline ........................................... 60 0 – – – -52 – – 0 5 2 0
Refinery Olefins ................................................ – – – – 1 – – – – -1 – – – – 1Ethylene ........................................................ – – – – – – – – – – – – – – –Propylene ..................................................... – – – – 0 – – – – 0 – – – – 0Butylene ........................................................ – – – – 1 – – – – 0 – – – – 1Isobutylene ................................................... – – – – – – – – – 0 – – – – 0
Other Liquids ...................................................... – – 14 – – 2 15 -31 -5 3 0 2Hydrogen/Oxygenates/Renewables/ Other Hydrocarbons ....................................... – – 14 – – 0 13 11 1 37 0 0
Hydrogen ...................................................... – – – – – – – – 7 – – 7 – 0Oxygenates (excluding Fuel Ethanol) ........... – – – – – – – 0 0 – – 0Renewable Fuels (including Fuel Ethanol) ... – – 14 – – 0 13 4 1 30 0 0
Fuel Ethanol ............................................. – – 14 – – – 13 3 1 29 – 0Renewable Fuels Except Fuel Ethanol ..... – – – – – 0 1 1 0 1 0 0
Other Hydrocarbons ..................................... – – – – – – – – – – – – –Unfinished Oils ................................................. – – – – – – – – – – 6 -8 0 2Motor Gasoline Blend.Comp. (MGBC) ............. – – – – – 2 2 -42 -12 -26 – 0
Reformulated ................................................ – – – – – – – – – – – –Conventional ................................................. – – – – – – 2 -42 -12 -26 – 0
Aviation Gasoline Blend. Comp. ....................... – – – – – – – – – – – – – –
Finished Petroleum Products ............................ – – – 609 2 -29 38 -8 – – 1 628Finished Motor Gasoline ................................... – – – 291 – -24 39 -6 – – 0 311
Reformulated ................................................ – – – – – – – – – – – –Conventional ................................................. – – – 291 – -24 39 -6 – – 0 311
Finished Aviation Gasoline ............................... – – – – 0 – – – – 0 – – – 0Kerosene-Type Jet Fuel ................................... – – – – 33 0 20 – – -1 – – – 54Kerosene .......................................................... – – – – – – – – – 0 – – – 0Distillate Fuel Oil ............................................... – – – – 188 1 8 -1 -6 – – 0 202
15 ppm sulfur and under ............................... – – – – 187 1 9 -1 -6 – – 0 202Greater than 15 ppm to 500 ppm sulfur ........ – – – – 1 – -1 – – 0 – – – 0Greater than 500 ppm sulfur ......................... – – – – 0 – – – – 0 – – – 0
Residual Fuel Oil6 ............................................ – – – – 11 – – – – 1 – – 0 10Less than 0.31 percent sulfur ....................... – – – – 6 – – – – 0 – – NA NA0.31 to 1.00 percent sulfur ............................ – – – – 1 – – – – 1 – – NA NAGreater than 1.00 percent sulfur ................... – – – – 4 – – – – 0 – – NA NA
Petrochemical Feedstocks ............................... – – – – – – – – – – – – – – –Naphtha for Petro. Feed. Use ....................... – – – – – – – – – – – – – – –Other Oils for Petro. Feed. Use .................... – – – – – – – – – – – – – – –
Special Naphthas ............................................. – – – – – – – – – – – – – – –Lubricants ......................................................... – – – – – – – – – – – – 0 0Waxes ............................................................... – – – – – – – – – – – – 0 0Petroleum Coke ................................................ – – – – 26 – -12 – – -1 – – – 15
Marketable .................................................... – – – – 18 – -12 – – -1 – – – 7Catalyst ......................................................... – – – – 8 – – – – – – – – – – – – 8
Asphalt and Road Oil ........................................ – – – – 36 1 -20 – – 5 – – 0 12Still Gas ............................................................ – – – – 21 – – – – – – – – – – – – 21Miscellaneous Products .................................... – – – – 3 0 – – – 0 – – 0 3
Total ..................................................................... 1,261 14 623 354 -968 -31 16 595 4 636
– – = Not Applicable.– = No Data Reported.
NA = Not Available.1 Represents the PAD District in which the material entered the United States and not necessarily where the crude oil or product is processed and/or consumed.2 A negative number indicates a decrease in stocks and a positive number indicates an increase in stocks. Stock change for crude oil excludes lease stocks beginning with January 2005 (see explanatory notes).3 Includes an adjustment for crude oil, previously referred to as ’Unaccounted For Crude Oil.’ Also included is an adjustment for motor gasoline blending components, fuel ethanol, and distillate fuel oil. See
Appendix B, Note 2C for a detailed explanation of these adjustments.4 A negative number indicates a decrease in stocks and a positive number indicates an increase in stocks. Stock change for crude oil excludes lease stocks beginning with January 2005 (see explanatory notes).5 Product supplied is equal to field production, plus renewable fuels and oxygenate plant net production, plus refinery and blender net production, plus imports, plus net receipts, plus adjustments, minus stock
change, minus refinery and blender net inputs, minus exports.6 Total residual fuel oil ending stocks and stock change include stocks held at pipelines. Residual fuel oil ending stocks and stock change by sulfur content exclude pipeline stocks. Therefore, the sum of residual
fuel oil ending stocks and stock change by sulfur content may not equal total residual fuel oil ending stocks and stock change.Notes: Totals may not equal sum of components due to independent rounding. Domestic crude oil field production are estimates.Sources: Energy Information Administration (EIA) Forms EIA-22M "Monthly Biodiesel Production Survey", Forms EIA-810, "Monthly Refinery Report," EIA-812, "Monthly Product Pipeline Report," EIA-813, "MonthlyCrude Oil Report," EIA-814, "Monthly Imports Report," EIA-815, "Monthly Bulk Terminal and Blender Report," EIA-816, "Monthly Natural Gas Liquids Report," EIA-817, "Monthly Tanker and Barge Movements Report,"and EIA-819, "Monthly Oxygenate Report." Domestic crude oil field production estimates based on Form EIA-914, "Monthly Crude Oil and Lease Condensate, and Natural Gas Production Report," and data from Stateconservation agencies, U.S. Department of Interior, and the Bureau of Ocean Energy Management. Export data from the U.S. Census Bureau and EIA estimates. Rail net receipts estimates based on EIA analysis ofdata from the Surface Transportation Board and other information.
Table 20. PAD District 4 - Year-to-Date Daily Average Supply and Disposition of Crude Oil and Petroleum Products, January-April 2018(Thousand Barrels per Day)
Commodity
Supply Disposition
FieldProduction
RenewableFuels andOxygenatePlant Net
Production
Refineryand
BlenderNet
Production
Imports(PADD ofEntry)1
NetReceipts2
Adjust-ments3
StockChange4
Refineryand
BlenderNet
Inputs ExportsProductsSupplied5
Crude Oil ............................................................. 820 – – – – 360 -514 -38 10 618 1 0
Hydrocarbon Gas Liquids .................................. 418 0 9 14 -382 – – -5 21 2 39Natural Gas Liquids .......................................... 418 0 8 14 -382 – – -5 21 2 39
Ethane .......................................................... 132 – – – – – – – 0 – – – 7Propane ........................................................ 146 – – 9 12 -131 – – -4 – – 0 40Normal Butane .............................................. 56 – – 0 0 -50 – – -1 10 0 -3Isobutane ...................................................... 26 – – -1 1 -28 – – 0 7 – -8Natural Gasoline ........................................... 58 0 – – – -49 – – 0 4 2 2
Refinery Olefins ................................................ – – – – 1 – – – – 0 – – – – 1Ethylene ........................................................ – – – – – – – – – – – – – – –Propylene ..................................................... – – – – 0 – – – – 0 – – – – 0Butylene ........................................................ – – – – 1 – – – – 0 – – – – 1Isobutylene ................................................... – – – – – – – – – 0 – – – – 0
Other Liquids ...................................................... – – 14 – – 1 0 -26 3 -19 0 5Hydrogen/Oxygenates/Renewables/ Other Hydrocarbons ....................................... – – 14 – – 0 12 11 1 37 0 0
Hydrogen ...................................................... – – – – – – – – 7 – – 7 – 0Oxygenates (excluding Fuel Ethanol) ........... – – – – – – – 0 0 – 0 0Renewable Fuels (including Fuel Ethanol) ... – – 14 – – 0 12 4 1 30 0 0
Fuel Ethanol ............................................. – – 14 – – – 11 4 1 28 – 0Renewable Fuels Except Fuel Ethanol ..... – – – – – 0 1 0 0 1 0 0
Other Hydrocarbons ..................................... – – – – – – – – – – – – –Unfinished Oils ................................................. – – – – – – – – – – 5 -10 0 5Motor Gasoline Blend.Comp. (MGBC) ............. – – – – – 1 -12 -37 -2 -46 0 0
Reformulated ................................................ – – – – – – – – – – – –Conventional ................................................. – – – – – – -12 -37 -2 -46 0 0
Aviation Gasoline Blend. Comp. ....................... – – – – – – – – – – – – – –
Finished Petroleum Products ............................ – – – 642 3 -37 34 3 – – 1 637Finished Motor Gasoline ................................... – – – 298 – -22 34 -1 – – 0 311
Reformulated ................................................ – – – – – – – – – – – –Conventional ................................................. – – – 298 – -22 34 -1 – – 0 311
Finished Aviation Gasoline ............................... – – – – 0 – – – – 0 – – – 0Kerosene-Type Jet Fuel ................................... – – – – 35 0 21 – – 0 – – – 57Kerosene .......................................................... – – – – 0 – – – – 0 – – 0 0Distillate Fuel Oil ............................................... – – – – 205 1 -6 0 -4 – – 0 204
15 ppm sulfur and under ............................... – – – – 204 1 -6 0 -4 – – 0 204Greater than 15 ppm to 500 ppm sulfur ........ – – – – 1 – 0 – – 0 – – – 1Greater than 500 ppm sulfur ......................... – – – – 0 – – – – 0 – – – 0
Residual Fuel Oil6 ............................................ – – – – 12 – – – – 1 – – 0 11Less than 0.31 percent sulfur ....................... – – – – 6 – – – – 0 – – NA NA0.31 to 1.00 percent sulfur ............................ – – – – 1 – – – – 0 – – NA NAGreater than 1.00 percent sulfur ................... – – – – 5 – – – – 0 – – NA NA
Petrochemical Feedstocks ............................... – – – – – – – – – – – – – – –Naphtha for Petro. Feed. Use ....................... – – – – – – – – – – – – – – –Other Oils for Petro. Feed. Use .................... – – – – – – – – – – – – – – –
Special Naphthas ............................................. – – – – – – – – – – – – – – –Lubricants ......................................................... – – – – – – – – – – – – 0 0Waxes ............................................................... – – – – – – – – – – – – 0 0Petroleum Coke ................................................ – – – – 26 – -12 – – 0 – – 0 14
Marketable .................................................... – – – – 19 – -12 – – 0 – – 0 7Catalyst ......................................................... – – – – 7 – – – – – – – – – – – – 7
Asphalt and Road Oil ........................................ – – – – 39 2 -18 – – 8 – – 0 15Still Gas ............................................................ – – – – 22 – – – – – – – – – – – – 22Miscellaneous Products .................................... – – – – 3 0 – – – 0 – – 0 3
Total ..................................................................... 1,238 14 650 378 -933 -31 11 620 4 682
– – = Not Applicable.– = No Data Reported.
NA = Not Available.1 Represents the PAD District in which the material entered the United States and not necessarily where the crude oil or product is processed and/or consumed.2 A negative number indicates a decrease in stocks and a positive number indicates an increase in stocks. Stock change for crude oil excludes lease stocks beginning with January 2005 (see explanatory notes).3 Includes an adjustment for crude oil, previously referred to as ’Unaccounted For Crude Oil.’ Also included is an adjustment for motor gasoline blending components, fuel ethanol, and distillate fuel oil. See
Appendix B, Note 2C for a detailed explanation of these adjustments.4 A negative number indicates a decrease in stocks and a positive number indicates an increase in stocks. Stock change for crude oil excludes lease stocks beginning with January 2005 (see explanatory notes).5 Product supplied is equal to field production, plus renewable fuels and oxygenate plant net production, plus refinery and blender net production, plus imports, plus net receipts, plus adjustments, minus stock
change, minus refinery and blender net inputs, minus exports.6 Total residual fuel oil ending stocks and stock change include stocks held at pipelines. Residual fuel oil ending stocks and stock change by sulfur content exclude pipeline stocks. Therefore, the sum of residual
fuel oil ending stocks and stock change by sulfur content may not equal total residual fuel oil ending stocks and stock change.Notes: Totals may not equal sum of components due to independent rounding. Domestic crude oil field production are estimates.Sources: Energy Information Administration (EIA) Forms EIA-22M "Monthly Biodiesel Production Survey", Forms EIA-810, "Monthly Refinery Report," EIA-812, "Monthly Product Pipeline Report," EIA-813, "MonthlyCrude Oil Report," EIA-814, "Monthly Imports Report," EIA-815, "Monthly Bulk Terminal and Blender Report," EIA-816, "Monthly Natural Gas Liquids Report," EIA-817, "Monthly Tanker and Barge Movements Report,"and EIA-819, "Monthly Oxygenate Report." Domestic crude oil field production estimates based on Form EIA-914, "Monthly Crude Oil and Lease Condensate, and Natural Gas Production Report," and data from Stateconservation agencies, U.S. Department of Interior, and the Bureau of Ocean Energy Management. Export data from the U.S. Census Bureau and EIA estimates. Rail net receipts estimates based on EIA analysis ofdata from the Surface Transportation Board and other information.

Energy Information Administration/Petroleum Supply Monthly,26 April 2018
Table 21. PAD District 5 - Supply, Disposition, and Ending Stocks of Crude Oil and Petroleum Products, April 2018(Thousand Barrels)
Commodity
Supply Disposition
EndingStocks
FieldProduction
RenewableFuels andOxygenatePlant Net
Production
Refineryand
BlenderNet
Production
Imports(PADD ofEntry)1
NetReceipts2
Adjust-ments3
StockChange4
Refineryand
BlenderNet
Inputs ExportsProductsSupplied5
Crude Oil ............................................................. 29,294 – – – – 38,377 3,480 -92 1,441 69,339 279 0 51,174
Hydrocarbon Gas Liquids .................................. 2,067 -14 2,275 1,140 824 – – 165 2,365 2,444 1,318 2,787Natural Gas Liquids .......................................... 2,067 -14 1,952 1,140 824 – – 163 2,365 2,444 997 2,745
Ethane .......................................................... 1 – – – – – – – – – – 0 1 –Propane ........................................................ 307 – – 1,021 978 343 – – 33 – – 1,807 809 617Normal Butane .............................................. 430 – – 814 161 344 – – 278 707 612 152 1,464Isobutane ...................................................... 325 – – 117 1 137 – – -149 759 1 -31 610Natural Gasoline ........................................... 1,004 -14 – – – – – – 1 899 25 65 54
Refinery Olefins ................................................ – – – – 323 – – – – 2 – – – – 321 42Ethylene ........................................................ – – – – – – – – – – – – – – – –Propylene ..................................................... – – – – 324 – – – – 19 – – – – 305 38Butylene ........................................................ – – – – -1 – – – – -17 – – – – 16 4Isobutylene ................................................... – – – – – – – – – 0 – – – – 0 0
Other Liquids ...................................................... – – 912 – – 4,247 9,760 -2,017 -1,809 14,638 527 -454 54,739Hydrogen/Oxygenates/Renewables/ Other Hydrocarbons ....................................... – – 912 – – 454 4,901 517 203 6,411 170 0 4,379
Hydrogen ...................................................... – – – – – – – – 1,149 – – 1,149 – 0 – –Oxygenates (excluding Fuel Ethanol) ........... – – – – – – – 0 – – 0 0 –Renewable Fuels (including Fuel Ethanol) ... – – 912 – – 454 4,901 -632 203 5,262 169 0 4,379
Fuel Ethanol ............................................. – – 633 – – – 4,519 -272 -23 4,792 110 0 2,661Renewable Fuels Except Fuel Ethanol ..... – – 279 – – 454 382 -360 226 470 59 0 1,718
Other Hydrocarbons ..................................... – – – – – – – – – – – – – –Unfinished Oils ................................................. – – – – – – 1,790 – – – -891 3,083 52 -454 21,788Motor Gasoline Blend.Comp. (MGBC) ............. – – – – – 2,003 4,859 -2,533 -1,121 5,144 306 0 28,572
Reformulated ................................................ – – – – – 319 2,457 737 -379 3,890 2 0 13,731Conventional ................................................. – – – – – 1,684 2,402 -3,270 -742 1,254 304 0 14,841
Aviation Gasoline Blend. Comp. ....................... – – – – – – – – – – – – – – –
Finished Petroleum Products ............................ – – – 89,979 3,095 2,658 3,009 -1,036 – – 12,332 87,445 35,838Finished Motor Gasoline ................................... – – – 48,130 253 721 2,806 92 – – 1,940 49,878 2,434
Reformulated ................................................ – – – 34,116 – – -42 1 – – – 34,073 17Conventional ................................................. – – – 14,014 253 721 2,848 91 – – 1,940 15,805 2,417
Finished Aviation Gasoline ............................... – – – – – – – – – -99 – – – 99 175Kerosene-Type Jet Fuel ................................... – – – – 13,232 1,440 309 – – -531 – – 610 14,902 9,669Kerosene .......................................................... – – – – 8 – – – – -9 – – 1 16 10Distillate Fuel Oil ............................................... – – – – 15,497 149 1,001 203 -191 – – 3,157 13,884 13,172
15 ppm sulfur and under ............................... – – – – 15,191 149 961 203 54 – – 1,814 14,636 12,200Greater than 15 ppm to 500 ppm sulfur ........ – – – – 104 – 40 – – -90 – – 11 223 205Greater than 500 ppm sulfur ......................... – – – – 202 – – – – -155 – – 1,331 -974 767
Residual Fuel Oil6 ............................................ – – – – 3,249 1,036 – – – -239 – – 1,693 2,831 4,972Less than 0.31 percent sulfur ....................... – – – – 11 – – – – -25 – – NA NA 1990.31 to 1.00 percent sulfur ............................ – – – – 664 145 – – – 169 – – NA NA 955Greater than 1.00 percent sulfur ................... – – – – 2,574 891 – – – -382 – – NA NA 3,809
Petrochemical Feedstocks ............................... – – – – 3 80 – – – 1 – – – – 82 2Naphtha for Petro. Feed. Use ....................... – – – – 3 80 – – – 1 – – – – 82 2Other Oils for Petro. Feed. Use .................... – – – – – – – – – – – – – – – –
Special Naphthas ............................................. – – – – 54 – – – – 8 – – – – 46 35Lubricants ......................................................... – – – – 327 6 – – – -317 – – 418 232 915Waxes ............................................................... – – – – – 38 – – – – – – 5 33 –Petroleum Coke ................................................ – – – – 4,763 33 -40 – – -351 – – 4,475 633 1,405
Marketable .................................................... – – – – 3,757 33 -40 – – -351 – – 4,475 -373 1,405Catalyst ......................................................... – – – – 1,006 – – – – – – – – – – – – 1,006 – –
Asphalt and Road Oil ........................................ – – – – 849 60 666 – – 599 – – 33 944 2,941Still Gas ............................................................ – – – – 3,465 – – – – – – – – – – – – 3,465 – –Miscellaneous Products .................................... – – – – 402 – – – – 1 – – 0 401 108
Total ..................................................................... 31,361 898 92,254 46,859 16,722 900 -1,239 86,342 15,582 88,309 144,538
– – = Not Applicable.– = No Data Reported.
NA = Not Available.1 Represents the PAD District in which the material entered the United States and not necessarily where the crude oil or product is processed and/or consumed.2 A negative number indicates a decrease in stocks and a positive number indicates an increase in stocks. Stock change for crude oil excludes lease stocks beginning with January 2005 (see explanatory notes).3 Includes an adjustment for crude oil, previously referred to as ’Unaccounted For Crude Oil.’ Also included is an adjustment for motor gasoline blending components, fuel ethanol, and distillate fuel oil. See
Appendix B, Note 2C for a detailed explanation of these adjustments.4 A negative number indicates a decrease in stocks and a positive number indicates an increase in stocks. Stock change for crude oil excludes lease stocks beginning with January 2005 (see explanatory notes).5 Product supplied is equal to field production, plus renewable fuels and oxygenate plant net production, plus refinery and blender net production, plus imports, plus net receipts, plus adjustments, minus stock
change, minus refinery and blender net inputs, minus exports.6 Total residual fuel oil ending stocks and stock change include stocks held at pipelines. Residual fuel oil ending stocks and stock change by sulfur content exclude pipeline stocks. Therefore, the sum of residual
fuel oil ending stocks and stock change by sulfur content may not equal total residual fuel oil ending stocks and stock change.Notes: Totals may not equal sum of components due to independent rounding. Domestic crude oil field production are estimates.Sources: Energy Information Administration (EIA) Forms EIA-22M "Monthly Biodiesel Production Survey", Forms EIA-810, "Monthly Refinery Report," EIA-812, "Monthly Product Pipeline Report," EIA-813, "MonthlyCrude Oil Report," EIA-814, "Monthly Imports Report," EIA-815, "Monthly Bulk Terminal and Blender Report," EIA-816, "Monthly Natural Gas Liquids Report," EIA-817, "Monthly Tanker and Barge Movements Report,"and EIA-819, "Monthly Oxygenate Report." Domestic crude oil field production estimates based on Form EIA-914, "Monthly Crude Oil and Lease Condensate, and Natural Gas Production Report," and data from Stateconservation agencies, U.S. Department of Interior, and the Bureau of Ocean Energy Management. Export data from the U.S. Census Bureau and EIA estimates. Rail net receipts estimates based on EIA analysis ofdata from the Surface Transportation Board and other information.

Energy Information Administration/Petroleum Supply Monthly, 27 April 2018
Table 21. PAD District 5 - Supply, Disposition, and Ending Stocks of Crude Oil and Petroleum Products, April 2018(Thousand Barrels)
Commodity
Supply Disposition
EndingStocks
FieldProduction
RenewableFuels andOxygenatePlant Net
Production
Refineryand
BlenderNet
Production
Imports(PADD ofEntry)1
NetReceipts2
Adjust-ments3
StockChange4
Refineryand
BlenderNet
Inputs ExportsProductsSupplied5
Crude Oil ............................................................. 29,294 – – – – 38,377 3,480 -92 1,441 69,339 279 0 51,174
Hydrocarbon Gas Liquids .................................. 2,067 -14 2,275 1,140 824 – – 165 2,365 2,444 1,318 2,787Natural Gas Liquids .......................................... 2,067 -14 1,952 1,140 824 – – 163 2,365 2,444 997 2,745
Ethane .......................................................... 1 – – – – – – – – – – 0 1 –Propane ........................................................ 307 – – 1,021 978 343 – – 33 – – 1,807 809 617Normal Butane .............................................. 430 – – 814 161 344 – – 278 707 612 152 1,464Isobutane ...................................................... 325 – – 117 1 137 – – -149 759 1 -31 610Natural Gasoline ........................................... 1,004 -14 – – – – – – 1 899 25 65 54
Refinery Olefins ................................................ – – – – 323 – – – – 2 – – – – 321 42Ethylene ........................................................ – – – – – – – – – – – – – – – –Propylene ..................................................... – – – – 324 – – – – 19 – – – – 305 38Butylene ........................................................ – – – – -1 – – – – -17 – – – – 16 4Isobutylene ................................................... – – – – – – – – – 0 – – – – 0 0
Other Liquids ...................................................... – – 912 – – 4,247 9,760 -2,017 -1,809 14,638 527 -454 54,739Hydrogen/Oxygenates/Renewables/ Other Hydrocarbons ....................................... – – 912 – – 454 4,901 517 203 6,411 170 0 4,379
Hydrogen ...................................................... – – – – – – – – 1,149 – – 1,149 – 0 – –Oxygenates (excluding Fuel Ethanol) ........... – – – – – – – 0 – – 0 0 –Renewable Fuels (including Fuel Ethanol) ... – – 912 – – 454 4,901 -632 203 5,262 169 0 4,379
Fuel Ethanol ............................................. – – 633 – – – 4,519 -272 -23 4,792 110 0 2,661Renewable Fuels Except Fuel Ethanol ..... – – 279 – – 454 382 -360 226 470 59 0 1,718
Other Hydrocarbons ..................................... – – – – – – – – – – – – – –Unfinished Oils ................................................. – – – – – – 1,790 – – – -891 3,083 52 -454 21,788Motor Gasoline Blend.Comp. (MGBC) ............. – – – – – 2,003 4,859 -2,533 -1,121 5,144 306 0 28,572
Reformulated ................................................ – – – – – 319 2,457 737 -379 3,890 2 0 13,731Conventional ................................................. – – – – – 1,684 2,402 -3,270 -742 1,254 304 0 14,841
Aviation Gasoline Blend. Comp. ....................... – – – – – – – – – – – – – – –
Finished Petroleum Products ............................ – – – 89,979 3,095 2,658 3,009 -1,036 – – 12,332 87,445 35,838Finished Motor Gasoline ................................... – – – 48,130 253 721 2,806 92 – – 1,940 49,878 2,434
Reformulated ................................................ – – – 34,116 – – -42 1 – – – 34,073 17Conventional ................................................. – – – 14,014 253 721 2,848 91 – – 1,940 15,805 2,417
Finished Aviation Gasoline ............................... – – – – – – – – – -99 – – – 99 175Kerosene-Type Jet Fuel ................................... – – – – 13,232 1,440 309 – – -531 – – 610 14,902 9,669Kerosene .......................................................... – – – – 8 – – – – -9 – – 1 16 10Distillate Fuel Oil ............................................... – – – – 15,497 149 1,001 203 -191 – – 3,157 13,884 13,172
15 ppm sulfur and under ............................... – – – – 15,191 149 961 203 54 – – 1,814 14,636 12,200Greater than 15 ppm to 500 ppm sulfur ........ – – – – 104 – 40 – – -90 – – 11 223 205Greater than 500 ppm sulfur ......................... – – – – 202 – – – – -155 – – 1,331 -974 767
Residual Fuel Oil6 ............................................ – – – – 3,249 1,036 – – – -239 – – 1,693 2,831 4,972Less than 0.31 percent sulfur ....................... – – – – 11 – – – – -25 – – NA NA 1990.31 to 1.00 percent sulfur ............................ – – – – 664 145 – – – 169 – – NA NA 955Greater than 1.00 percent sulfur ................... – – – – 2,574 891 – – – -382 – – NA NA 3,809
Petrochemical Feedstocks ............................... – – – – 3 80 – – – 1 – – – – 82 2Naphtha for Petro. Feed. Use ....................... – – – – 3 80 – – – 1 – – – – 82 2Other Oils for Petro. Feed. Use .................... – – – – – – – – – – – – – – – –
Special Naphthas ............................................. – – – – 54 – – – – 8 – – – – 46 35Lubricants ......................................................... – – – – 327 6 – – – -317 – – 418 232 915Waxes ............................................................... – – – – – 38 – – – – – – 5 33 –Petroleum Coke ................................................ – – – – 4,763 33 -40 – – -351 – – 4,475 633 1,405
Marketable .................................................... – – – – 3,757 33 -40 – – -351 – – 4,475 -373 1,405Catalyst ......................................................... – – – – 1,006 – – – – – – – – – – – – 1,006 – –
Asphalt and Road Oil ........................................ – – – – 849 60 666 – – 599 – – 33 944 2,941Still Gas ............................................................ – – – – 3,465 – – – – – – – – – – – – 3,465 – –Miscellaneous Products .................................... – – – – 402 – – – – 1 – – 0 401 108
Total ..................................................................... 31,361 898 92,254 46,859 16,722 900 -1,239 86,342 15,582 88,309 144,538
– – = Not Applicable.– = No Data Reported.
NA = Not Available.1 Represents the PAD District in which the material entered the United States and not necessarily where the crude oil or product is processed and/or consumed.2 A negative number indicates a decrease in stocks and a positive number indicates an increase in stocks. Stock change for crude oil excludes lease stocks beginning with January 2005 (see explanatory notes).3 Includes an adjustment for crude oil, previously referred to as ’Unaccounted For Crude Oil.’ Also included is an adjustment for motor gasoline blending components, fuel ethanol, and distillate fuel oil. See
Appendix B, Note 2C for a detailed explanation of these adjustments.4 A negative number indicates a decrease in stocks and a positive number indicates an increase in stocks. Stock change for crude oil excludes lease stocks beginning with January 2005 (see explanatory notes).5 Product supplied is equal to field production, plus renewable fuels and oxygenate plant net production, plus refinery and blender net production, plus imports, plus net receipts, plus adjustments, minus stock
change, minus refinery and blender net inputs, minus exports.6 Total residual fuel oil ending stocks and stock change include stocks held at pipelines. Residual fuel oil ending stocks and stock change by sulfur content exclude pipeline stocks. Therefore, the sum of residual
fuel oil ending stocks and stock change by sulfur content may not equal total residual fuel oil ending stocks and stock change.Notes: Totals may not equal sum of components due to independent rounding. Domestic crude oil field production are estimates.Sources: Energy Information Administration (EIA) Forms EIA-22M "Monthly Biodiesel Production Survey", Forms EIA-810, "Monthly Refinery Report," EIA-812, "Monthly Product Pipeline Report," EIA-813, "MonthlyCrude Oil Report," EIA-814, "Monthly Imports Report," EIA-815, "Monthly Bulk Terminal and Blender Report," EIA-816, "Monthly Natural Gas Liquids Report," EIA-817, "Monthly Tanker and Barge Movements Report,"and EIA-819, "Monthly Oxygenate Report." Domestic crude oil field production estimates based on Form EIA-914, "Monthly Crude Oil and Lease Condensate, and Natural Gas Production Report," and data from Stateconservation agencies, U.S. Department of Interior, and the Bureau of Ocean Energy Management. Export data from the U.S. Census Bureau and EIA estimates. Rail net receipts estimates based on EIA analysis ofdata from the Surface Transportation Board and other information.
Table 22. PAD District 5 - Year-to-Date Supply, Disposition, and Ending Stocks of Crude Oil and Petroleum Products, January-April 2018(Thousand Barrels)
Commodity
Supply Disposition
EndingStocks
FieldProduction
RenewableFuels andOxygenatePlant Net
Production
Refineryand
BlenderNet
Production
Imports(PADD ofEntry)1
NetReceipts2
Adjust-ments3
StockChange4
Refineryand
BlenderNet
Inputs ExportsProductsSupplied5
Crude Oil ............................................................. 118,419 – – – – 151,775 17,197 2,780 168 289,215 788 0 51,174
Hydrocarbon Gas Liquids .................................. 8,271 -54 5,402 4,438 2,996 – – -547 10,965 5,001 5,634 2,787Natural Gas Liquids .......................................... 8,271 -54 4,260 4,436 2,996 – – -561 10,965 5,001 4,504 –
Ethane .......................................................... 4 – – – – – – – – – – 0 4 –Propane ........................................................ 1,197 – – 4,396 3,130 916 – – -844 – – 4,027 6,456 –Normal Butane .............................................. 1,740 – – -848 1,217 1,603 – – 69 3,975 938 -1,270 –Isobutane ...................................................... 1,309 – – 712 89 477 – – 194 3,270 1 -878 –Natural Gasoline ........................................... 4,021 -54 – – – – – – 20 3,720 35 192 –
Refinery Olefins ................................................ – – – – 1,142 2 – – – 14 – – – – 1,130 –Ethylene ........................................................ – – – – – – – – – – – – – – – –Propylene ..................................................... – – – – 1,136 2 – – – 11 – – – – 1,127 –Butylene ........................................................ – – – – 6 – – – – 3 – – – – 3 –Isobutylene ................................................... – – – – – – – – – 0 – – – – 0 –
Other Liquids ...................................................... – – 3,437 – – 14,880 42,249 -10,510 -105 46,188 1,599 2,374 54,739Hydrogen/Oxygenates/Renewables/ Other Hydrocarbons ....................................... – – 3,437 – – 1,713 21,713 106 650 25,774 545 0 4,379
Hydrogen ...................................................... – – – – – – – – 4,793 – – 4,793 – 0 – –Oxygenates (excluding Fuel Ethanol) ........... – – – – – – – 4 – – 4 0 –Renewable Fuels (including Fuel Ethanol) ... – – 3,437 – – 1,713 21,713 -4,691 650 20,981 541 0 4,379
Fuel Ethanol ............................................. – – 2,435 – – – 20,425 -3,623 109 18,679 448 0 2,661Renewable Fuels Except Fuel Ethanol ..... – – 1,002 – – 1,713 1,289 -1,068 541 2,302 93 0 1,718
Other Hydrocarbons ..................................... – – – – – – – – – – – – – –Unfinished Oils ................................................. – – – – – – 10,274 – – – 1,880 5,767 253 2,374 21,788Motor Gasoline Blend.Comp. (MGBC) ............. – – – – – 2,893 20,536 -10,617 -2,635 14,647 800 0 28,572
Reformulated ................................................ – – – – – 630 10,545 -825 -2,566 12,906 10 0 13,731Conventional ................................................. – – – – – 2,263 9,991 -9,791 -69 1,741 791 0 14,841
Aviation Gasoline Blend. Comp. ....................... – – – – – – – – – – – – – – –
Finished Petroleum Products ............................ – – – 365,071 12,801 10,323 14,794 871 – – 47,984 354,133 35,838Finished Motor Gasoline ................................... – – – 191,108 333 2,145 14,240 530 – – 9,396 197,900 2,434
Reformulated ................................................ – – – 133,195 – – 1,540 1 – – – 134,734 17Conventional ................................................. – – – 57,913 333 2,145 12,699 529 – – 9,396 63,165 2,417
Finished Aviation Gasoline ............................... – – – – 112 3 – – – -55 – – – 170 175Kerosene-Type Jet Fuel ................................... – – – – 56,048 6,509 1,335 – – -574 – – 3,586 60,880 9,669Kerosene .......................................................... – – – – 66 – – – – -32 – – 16 82 10Distillate Fuel Oil ............................................... – – – – 63,739 769 4,549 554 -900 – – 13,212 57,299 13,172
15 ppm sulfur and under ............................... – – – – 60,862 769 4,509 554 -928 – – 8,925 58,697 12,200Greater than 15 ppm to 500 ppm sulfur ........ – – – – 1,073 – 40 – – -35 – – 1,227 -79 205Greater than 500 ppm sulfur ......................... – – – – 1,804 – – – – 63 – – 3,060 -1,319 767
Residual Fuel Oil6 ............................................ – – – – 13,764 4,360 – – – 722 – – 4,382 13,020 4,972Less than 0.31 percent sulfur ....................... – – – – 40 – – – – 32 – – NA NA 1990.31 to 1.00 percent sulfur ............................ – – – – 2,558 458 – – – 435 – – NA NA 955Greater than 1.00 percent sulfur ................... – – – – 11,166 3,902 – – – 252 – – NA NA 3,809
Petrochemical Feedstocks ............................... – – – – 10 176 – – – 0 – – – – 186 2Naphtha for Petro. Feed. Use ....................... – – – – 10 176 – – – 0 – – – – 186 2Other Oils for Petro. Feed. Use .................... – – – – – – – – – – – – – – – –
Special Naphthas ............................................. – – – – 157 – – – – -10 – – – – 167 35Lubricants ......................................................... – – – – 2,292 42 -80 – – -100 – – 1,473 881 915Waxes ............................................................... – – – – – 161 – – – – – – 23 138 –Petroleum Coke ................................................ – – – – 18,803 96 -79 – – 49 – – 15,699 3,073 1,405
Marketable .................................................... – – – – 14,626 96 -79 – – 49 – – 15,699 -1,104 1,405Catalyst ......................................................... – – – – 4,177 – – – – – – – – – – – – 4,177 – –
Asphalt and Road Oil ........................................ – – – – 2,787 352 2,452 – – 1,255 – – 126 4,210 2,941Still Gas ............................................................ – – – – 14,452 – – – – – – – – – – – – 14,452 – –Miscellaneous Products .................................... – – – – 1,733 – – – – -14 – – 72 1,675 108
Total ..................................................................... 126,690 3,383 370,473 183,894 72,764 7,064 387 346,368 55,372 362,141 144,538
– – = Not Applicable.– = No Data Reported.
NA = Not Available.1 Represents the PAD District in which the material entered the United States and not necessarily where the crude oil or product is processed and/or consumed.2 A negative number indicates a decrease in stocks and a positive number indicates an increase in stocks. Stock change for crude oil excludes lease stocks beginning with January 2005 (see explanatory notes).3 Includes an adjustment for crude oil, previously referred to as ’Unaccounted For Crude Oil.’ Also included is an adjustment for motor gasoline blending components, fuel ethanol, and distillate fuel oil. See
Appendix B, Note 2C for a detailed explanation of these adjustments.4 A negative number indicates a decrease in stocks and a positive number indicates an increase in stocks. Stock change for crude oil excludes lease stocks beginning with January 2005 (see explanatory notes).5 Product supplied is equal to field production, plus renewable fuels and oxygenate plant net production, plus refinery and blender net production, plus imports, plus net receipts, plus adjustments, minus stock
change, minus refinery and blender net inputs, minus exports.6 Total residual fuel oil ending stocks and stock change include stocks held at pipelines. Residual fuel oil ending stocks and stock change by sulfur content exclude pipeline stocks. Therefore, the sum of residual
fuel oil ending stocks and stock change by sulfur content may not equal total residual fuel oil ending stocks and stock change.Notes: Totals may not equal sum of components due to independent rounding. Domestic crude oil field production are estimates.Sources: Energy Information Administration (EIA) Forms EIA-22M "Monthly Biodiesel Production Survey", Forms EIA-810, "Monthly Refinery Report," EIA-812, "Monthly Product Pipeline Report," EIA-813, "MonthlyCrude Oil Report," EIA-814, "Monthly Imports Report," EIA-815, "Monthly Bulk Terminal and Blender Report," EIA-816, "Monthly Natural Gas Liquids Report," EIA-817, "Monthly Tanker and Barge Movements Report,"and EIA-819, "Monthly Oxygenate Report." Domestic crude oil field production estimates based on Form EIA-914, "Monthly Crude Oil and Lease Condensate, and Natural Gas Production Report," and data from Stateconservation agencies, U.S. Department of Interior, and the Bureau of Ocean Energy Management. Export data from the U.S. Census Bureau and EIA estimates. Rail net receipts estimates based on EIA analysis ofdata from the Surface Transportation Board and other information.

Energy Information Administration/Petroleum Supply Monthly,28 April 2018
Table 23. PAD District 5 - Daily Average Supply and Disposition of Crude Oil and Petroleum Products, April 2018(Thousand Barrels per Day)
Commodity
Supply Disposition
FieldProduction
RenewableFuels andOxygenatePlant Net
Production
Refineryand
BlenderNet
Production
Imports(PADD ofEntry)1
NetReceipts2
Adjust-ments3
StockChange4
Refineryand
BlenderNet
Inputs ExportsProductsSupplied5
Crude Oil ............................................................. 976 – – – – 1,279 116 -3 48 2,311 9 0
Hydrocarbon Gas Liquids .................................. 69 0 76 38 27 – – 6 79 81 44Natural Gas Liquids .......................................... 69 0 65 38 27 – – 5 79 81 33
Ethane .......................................................... 0 – – – – – – – – – – 0 0Propane ........................................................ 10 – – 34 33 11 – – 1 – – 60 27Normal Butane .............................................. 14 – – 27 5 11 – – 9 24 20 5Isobutane ...................................................... 11 – – 4 0 5 – – -5 25 0 -1Natural Gasoline ........................................... 33 0 – – – – – – 0 30 1 2
Refinery Olefins ................................................ – – – – 11 – – – – 0 – – – – 11Ethylene ........................................................ – – – – – – – – – – – – – – –Propylene ..................................................... – – – – 11 – – – – 1 – – – – 10Butylene ........................................................ – – – – 0 – – – – -1 – – – – 1Isobutylene ................................................... – – – – – – – – – 0 – – – – 0
Other Liquids ...................................................... – – 30 – – 142 325 -67 -60 488 18 -15Hydrogen/Oxygenates/Renewables/ Other Hydrocarbons ....................................... – – 30 – – 15 163 17 7 214 6 0
Hydrogen ...................................................... – – – – – – – – 38 – – 38 – 0Oxygenates (excluding Fuel Ethanol) ........... – – – – – – – 0 – – 0 0Renewable Fuels (including Fuel Ethanol) ... – – 30 – – 15 163 -21 7 175 6 0
Fuel Ethanol ............................................. – – 21 – – – 151 -9 -1 160 4 0Renewable Fuels Except Fuel Ethanol ..... – – 9 – – 15 13 -12 8 16 2 0
Other Hydrocarbons ..................................... – – – – – – – – – – – – –Unfinished Oils ................................................. – – – – – – 60 – – – -30 103 2 -15Motor Gasoline Blend.Comp. (MGBC) ............. – – – – – 67 162 -84 -37 171 10 0
Reformulated ................................................ – – – – – 11 82 25 -13 130 0 0Conventional ................................................. – – – – – 56 80 -109 -25 42 10 0
Aviation Gasoline Blend. Comp. ....................... – – – – – – – – – – – – – –
Finished Petroleum Products ............................ – – – 2,999 103 89 100 -35 – – 411 2,915Finished Motor Gasoline ................................... – – – 1,604 8 24 94 3 – – 65 1,663
Reformulated ................................................ – – – 1,137 – – -1 0 – – – 1,136Conventional ................................................. – – – 467 8 24 95 3 – – 65 527
Finished Aviation Gasoline ............................... – – – – – – – – – -3 – – – 3Kerosene-Type Jet Fuel ................................... – – – – 441 48 10 – – -18 – – 20 497Kerosene .......................................................... – – – – 0 – – – – 0 – – 0 1Distillate Fuel Oil ............................................... – – – – 517 5 33 7 -6 – – 105 463
15 ppm sulfur and under ............................... – – – – 506 5 32 7 2 – – 60 488Greater than 15 ppm to 500 ppm sulfur ........ – – – – 3 – 1 – – -3 – – 0 7Greater than 500 ppm sulfur ......................... – – – – 7 – – – – -5 – – 44 -32
Residual Fuel Oil6 ............................................ – – – – 108 35 – – – -8 – – 56 94Less than 0.31 percent sulfur ....................... – – – – 0 – – – – -1 – – NA NA0.31 to 1.00 percent sulfur ............................ – – – – 22 5 – – – 6 – – NA NAGreater than 1.00 percent sulfur ................... – – – – 86 30 – – – -13 – – NA NA
Petrochemical Feedstocks ............................... – – – – 0 3 – – – 0 – – – – 3Naphtha for Petro. Feed. Use ....................... – – – – 0 3 – – – 0 – – – – 3Other Oils for Petro. Feed. Use .................... – – – – – – – – – – – – – – –
Special Naphthas ............................................. – – – – 2 – – – – 0 – – – – 2Lubricants ......................................................... – – – – 11 0 – – – -11 – – 14 8Waxes ............................................................... – – – – – 1 – – – – – – 0 1Petroleum Coke ................................................ – – – – 159 1 -1 – – -12 – – 149 21
Marketable .................................................... – – – – 125 1 -1 – – -12 – – 149 -12Catalyst ......................................................... – – – – 34 – – – – – – – – – – – – 34
Asphalt and Road Oil ........................................ – – – – 28 2 22 – – 20 – – 1 31Still Gas ............................................................ – – – – 116 – – – – – – – – – – – – 116Miscellaneous Products .................................... – – – – 13 – – – – 0 – – 0 13
Total ..................................................................... 1,045 30 3,075 1,562 557 30 -41 2,878 519 2,944
– – = Not Applicable.– = No Data Reported.
NA = Not Available.1 Represents the PAD District in which the material entered the United States and not necessarily where the crude oil or product is processed and/or consumed.2 A negative number indicates a decrease in stocks and a positive number indicates an increase in stocks. Stock change for crude oil excludes lease stocks beginning with January 2005 (see explanatory notes).3 Includes an adjustment for crude oil, previously referred to as ’Unaccounted For Crude Oil.’ Also included is an adjustment for motor gasoline blending components, fuel ethanol, and distillate fuel oil. See
Appendix B, Note 2C for a detailed explanation of these adjustments.4 A negative number indicates a decrease in stocks and a positive number indicates an increase in stocks. Stock change for crude oil excludes lease stocks beginning with January 2005 (see explanatory notes).5 Product supplied is equal to field production, plus renewable fuels and oxygenate plant net production, plus refinery and blender net production, plus imports, plus net receipts, plus adjustments, minus stock
change, minus refinery and blender net inputs, minus exports.6 Total residual fuel oil ending stocks and stock change include stocks held at pipelines. Residual fuel oil ending stocks and stock change by sulfur content exclude pipeline stocks. Therefore, the sum of residual
fuel oil ending stocks and stock change by sulfur content may not equal total residual fuel oil ending stocks and stock change.Notes: Totals may not equal sum of components due to independent rounding. Domestic crude oil field production are estimates.Sources: Energy Information Administration (EIA) Forms EIA-22M "Monthly Biodiesel Production Survey", Forms EIA-810, "Monthly Refinery Report," EIA-812, "Monthly Product Pipeline Report," EIA-813, "MonthlyCrude Oil Report," EIA-814, "Monthly Imports Report," EIA-815, "Monthly Bulk Terminal and Blender Report," EIA-816, "Monthly Natural Gas Liquids Report," EIA-817, "Monthly Tanker and Barge Movements Report,"and EIA-819, "Monthly Oxygenate Report." Domestic crude oil field production estimates based on Form EIA-914, "Monthly Crude Oil and Lease Condensate, and Natural Gas Production Report," and data from Stateconservation agencies, U.S. Department of Interior, and the Bureau of Ocean Energy Management. Export data from the U.S. Census Bureau and EIA estimates. Rail net receipts estimates based on EIA analysis ofdata from the Surface Transportation Board and other information.

Energy Information Administration/Petroleum Supply Monthly, 29 April 2018
Table 23. PAD District 5 - Daily Average Supply and Disposition of Crude Oil and Petroleum Products, April 2018(Thousand Barrels per Day)
Commodity
Supply Disposition
FieldProduction
RenewableFuels andOxygenatePlant Net
Production
Refineryand
BlenderNet
Production
Imports(PADD ofEntry)1
NetReceipts2
Adjust-ments3
StockChange4
Refineryand
BlenderNet
Inputs ExportsProductsSupplied5
Crude Oil ............................................................. 976 – – – – 1,279 116 -3 48 2,311 9 0
Hydrocarbon Gas Liquids .................................. 69 0 76 38 27 – – 6 79 81 44Natural Gas Liquids .......................................... 69 0 65 38 27 – – 5 79 81 33
Ethane .......................................................... 0 – – – – – – – – – – 0 0Propane ........................................................ 10 – – 34 33 11 – – 1 – – 60 27Normal Butane .............................................. 14 – – 27 5 11 – – 9 24 20 5Isobutane ...................................................... 11 – – 4 0 5 – – -5 25 0 -1Natural Gasoline ........................................... 33 0 – – – – – – 0 30 1 2
Refinery Olefins ................................................ – – – – 11 – – – – 0 – – – – 11Ethylene ........................................................ – – – – – – – – – – – – – – –Propylene ..................................................... – – – – 11 – – – – 1 – – – – 10Butylene ........................................................ – – – – 0 – – – – -1 – – – – 1Isobutylene ................................................... – – – – – – – – – 0 – – – – 0
Other Liquids ...................................................... – – 30 – – 142 325 -67 -60 488 18 -15Hydrogen/Oxygenates/Renewables/ Other Hydrocarbons ....................................... – – 30 – – 15 163 17 7 214 6 0
Hydrogen ...................................................... – – – – – – – – 38 – – 38 – 0Oxygenates (excluding Fuel Ethanol) ........... – – – – – – – 0 – – 0 0Renewable Fuels (including Fuel Ethanol) ... – – 30 – – 15 163 -21 7 175 6 0
Fuel Ethanol ............................................. – – 21 – – – 151 -9 -1 160 4 0Renewable Fuels Except Fuel Ethanol ..... – – 9 – – 15 13 -12 8 16 2 0
Other Hydrocarbons ..................................... – – – – – – – – – – – – –Unfinished Oils ................................................. – – – – – – 60 – – – -30 103 2 -15Motor Gasoline Blend.Comp. (MGBC) ............. – – – – – 67 162 -84 -37 171 10 0
Reformulated ................................................ – – – – – 11 82 25 -13 130 0 0Conventional ................................................. – – – – – 56 80 -109 -25 42 10 0
Aviation Gasoline Blend. Comp. ....................... – – – – – – – – – – – – – –
Finished Petroleum Products ............................ – – – 2,999 103 89 100 -35 – – 411 2,915Finished Motor Gasoline ................................... – – – 1,604 8 24 94 3 – – 65 1,663
Reformulated ................................................ – – – 1,137 – – -1 0 – – – 1,136Conventional ................................................. – – – 467 8 24 95 3 – – 65 527
Finished Aviation Gasoline ............................... – – – – – – – – – -3 – – – 3Kerosene-Type Jet Fuel ................................... – – – – 441 48 10 – – -18 – – 20 497Kerosene .......................................................... – – – – 0 – – – – 0 – – 0 1Distillate Fuel Oil ............................................... – – – – 517 5 33 7 -6 – – 105 463
15 ppm sulfur and under ............................... – – – – 506 5 32 7 2 – – 60 488Greater than 15 ppm to 500 ppm sulfur ........ – – – – 3 – 1 – – -3 – – 0 7Greater than 500 ppm sulfur ......................... – – – – 7 – – – – -5 – – 44 -32
Residual Fuel Oil6 ............................................ – – – – 108 35 – – – -8 – – 56 94Less than 0.31 percent sulfur ....................... – – – – 0 – – – – -1 – – NA NA0.31 to 1.00 percent sulfur ............................ – – – – 22 5 – – – 6 – – NA NAGreater than 1.00 percent sulfur ................... – – – – 86 30 – – – -13 – – NA NA
Petrochemical Feedstocks ............................... – – – – 0 3 – – – 0 – – – – 3Naphtha for Petro. Feed. Use ....................... – – – – 0 3 – – – 0 – – – – 3Other Oils for Petro. Feed. Use .................... – – – – – – – – – – – – – – –
Special Naphthas ............................................. – – – – 2 – – – – 0 – – – – 2Lubricants ......................................................... – – – – 11 0 – – – -11 – – 14 8Waxes ............................................................... – – – – – 1 – – – – – – 0 1Petroleum Coke ................................................ – – – – 159 1 -1 – – -12 – – 149 21
Marketable .................................................... – – – – 125 1 -1 – – -12 – – 149 -12Catalyst ......................................................... – – – – 34 – – – – – – – – – – – – 34
Asphalt and Road Oil ........................................ – – – – 28 2 22 – – 20 – – 1 31Still Gas ............................................................ – – – – 116 – – – – – – – – – – – – 116Miscellaneous Products .................................... – – – – 13 – – – – 0 – – 0 13
Total ..................................................................... 1,045 30 3,075 1,562 557 30 -41 2,878 519 2,944
– – = Not Applicable.– = No Data Reported.
NA = Not Available.1 Represents the PAD District in which the material entered the United States and not necessarily where the crude oil or product is processed and/or consumed.2 A negative number indicates a decrease in stocks and a positive number indicates an increase in stocks. Stock change for crude oil excludes lease stocks beginning with January 2005 (see explanatory notes).3 Includes an adjustment for crude oil, previously referred to as ’Unaccounted For Crude Oil.’ Also included is an adjustment for motor gasoline blending components, fuel ethanol, and distillate fuel oil. See
Appendix B, Note 2C for a detailed explanation of these adjustments.4 A negative number indicates a decrease in stocks and a positive number indicates an increase in stocks. Stock change for crude oil excludes lease stocks beginning with January 2005 (see explanatory notes).5 Product supplied is equal to field production, plus renewable fuels and oxygenate plant net production, plus refinery and blender net production, plus imports, plus net receipts, plus adjustments, minus stock
change, minus refinery and blender net inputs, minus exports.6 Total residual fuel oil ending stocks and stock change include stocks held at pipelines. Residual fuel oil ending stocks and stock change by sulfur content exclude pipeline stocks. Therefore, the sum of residual
fuel oil ending stocks and stock change by sulfur content may not equal total residual fuel oil ending stocks and stock change.Notes: Totals may not equal sum of components due to independent rounding. Domestic crude oil field production are estimates.Sources: Energy Information Administration (EIA) Forms EIA-22M "Monthly Biodiesel Production Survey", Forms EIA-810, "Monthly Refinery Report," EIA-812, "Monthly Product Pipeline Report," EIA-813, "MonthlyCrude Oil Report," EIA-814, "Monthly Imports Report," EIA-815, "Monthly Bulk Terminal and Blender Report," EIA-816, "Monthly Natural Gas Liquids Report," EIA-817, "Monthly Tanker and Barge Movements Report,"and EIA-819, "Monthly Oxygenate Report." Domestic crude oil field production estimates based on Form EIA-914, "Monthly Crude Oil and Lease Condensate, and Natural Gas Production Report," and data from Stateconservation agencies, U.S. Department of Interior, and the Bureau of Ocean Energy Management. Export data from the U.S. Census Bureau and EIA estimates. Rail net receipts estimates based on EIA analysis ofdata from the Surface Transportation Board and other information.
Table 24. PAD District 5 - Year-to-Date Daily Average Supply and Disposition of Crude Oil and Petroleum Products, January-April 2018(Thousand Barrels per Day)
Commodity
Supply Disposition
FieldProduction
RenewableFuels andOxygenatePlant Net
Production
Refineryand
BlenderNet
Production
Imports(PADD ofEntry)1
NetReceipts2
Adjust-ments3
StockChange4
Refineryand
BlenderNet
Inputs ExportsProductsSupplied5
Crude Oil ............................................................. 987 – – – – 1,265 143 23 1 2,410 7 0
Hydrocarbon Gas Liquids .................................. 69 0 45 37 25 – – -5 91 42 47Natural Gas Liquids .......................................... 69 0 36 37 25 – – -5 91 42 38
Ethane .......................................................... 0 – – – – – – – – – – 0 0Propane ........................................................ 10 – – 37 26 8 – – -7 – – 34 54Normal Butane .............................................. 15 – – -7 10 13 – – 1 33 8 -11Isobutane ...................................................... 11 – – 6 1 4 – – 2 27 0 -7Natural Gasoline ........................................... 34 0 – – – – – – 0 31 0 2
Refinery Olefins ................................................ – – – – 10 0 – – – 0 – – – – 9Ethylene ........................................................ – – – – – – – – – – – – – – –Propylene ..................................................... – – – – 9 0 – – – 0 – – – – 9Butylene ........................................................ – – – – 0 – – – – 0 – – – – 0Isobutylene ................................................... – – – – – – – – – 0 – – – – 0
Other Liquids ...................................................... – – 29 – – 124 352 -88 -1 385 13 20Hydrogen/Oxygenates/Renewables/ Other Hydrocarbons ....................................... – – 29 – – 14 181 1 5 215 5 0
Hydrogen ...................................................... – – – – – – – – 40 – – 40 – 0Oxygenates (excluding Fuel Ethanol) ........... – – – – – – – 0 – – 0 0Renewable Fuels (including Fuel Ethanol) ... – – 29 – – 14 181 -39 5 175 5 0
Fuel Ethanol ............................................. – – 20 – – – 170 -30 1 156 4 0Renewable Fuels Except Fuel Ethanol ..... – – 8 – – 14 11 -9 5 19 1 0
Other Hydrocarbons ..................................... – – – – – – – – – – – – –Unfinished Oils ................................................. – – – – – – 86 – – – 16 48 2 20Motor Gasoline Blend.Comp. (MGBC) ............. – – – – – 24 171 -88 -22 122 7 0
Reformulated ................................................ – – – – – 5 88 -7 -21 108 0 0Conventional ................................................. – – – – – 19 83 -82 -1 15 7 0
Aviation Gasoline Blend. Comp. ....................... – – – – – – – – – – – – – –
Finished Petroleum Products ............................ – – – 3,042 107 86 123 7 – – 400 2,951Finished Motor Gasoline ................................... – – – 1,593 3 18 119 4 – – 78 1,649
Reformulated ................................................ – – – 1,110 – – 13 0 – – – 1,123Conventional ................................................. – – – 483 3 18 106 4 – – 78 526
Finished Aviation Gasoline ............................... – – – – 1 0 – – – 0 – – – 1Kerosene-Type Jet Fuel ................................... – – – – 467 54 11 – – -5 – – 30 507Kerosene .......................................................... – – – – 1 – – – – 0 – – 0 1Distillate Fuel Oil ............................................... – – – – 531 6 38 5 -8 – – 110 477
15 ppm sulfur and under ............................... – – – – 507 6 38 5 -8 – – 74 489Greater than 15 ppm to 500 ppm sulfur ........ – – – – 9 – 0 – – 0 – – 10 -1Greater than 500 ppm sulfur ......................... – – – – 15 – – – – 1 – – 26 -11
Residual Fuel Oil6 ............................................ – – – – 115 36 – – – 6 – – 37 108Less than 0.31 percent sulfur ....................... – – – – 0 – – – – 0 – – NA NA0.31 to 1.00 percent sulfur ............................ – – – – 21 4 – – – 4 – – NA NAGreater than 1.00 percent sulfur ................... – – – – 93 33 – – – 2 – – NA NA
Petrochemical Feedstocks ............................... – – – – 0 1 – – – 0 – – – – 2Naphtha for Petro. Feed. Use ....................... – – – – 0 1 – – – 0 – – – – 2Other Oils for Petro. Feed. Use .................... – – – – – – – – – – – – – – –
Special Naphthas ............................................. – – – – 1 – – – – 0 – – – – 1Lubricants ......................................................... – – – – 19 0 -1 – – -1 – – 12 7Waxes ............................................................... – – – – – 1 – – – – – – 0 1Petroleum Coke ................................................ – – – – 157 1 -1 – – 0 – – 131 26
Marketable .................................................... – – – – 122 1 -1 – – 0 – – 131 -9Catalyst ......................................................... – – – – 35 – – – – – – – – – – – – 35
Asphalt and Road Oil ........................................ – – – – 23 3 20 – – 10 – – 1 35Still Gas ............................................................ – – – – 120 – – – – – – – – – – – – 120Miscellaneous Products .................................... – – – – 14 – – – – 0 – – 1 14
Total ..................................................................... 1,056 28 3,087 1,532 606 59 3 2,886 461 3,018
– – = Not Applicable.– = No Data Reported.
NA = Not Available.1 Represents the PAD District in which the material entered the United States and not necessarily where the crude oil or product is processed and/or consumed.2 A negative number indicates a decrease in stocks and a positive number indicates an increase in stocks. Stock change for crude oil excludes lease stocks beginning with January 2005 (see explanatory notes).3 Includes an adjustment for crude oil, previously referred to as ’Unaccounted For Crude Oil.’ Also included is an adjustment for motor gasoline blending components, fuel ethanol, and distillate fuel oil. See
Appendix B, Note 2C for a detailed explanation of these adjustments.4 A negative number indicates a decrease in stocks and a positive number indicates an increase in stocks. Stock change for crude oil excludes lease stocks beginning with January 2005 (see explanatory notes).5 Product supplied is equal to field production, plus renewable fuels and oxygenate plant net production, plus refinery and blender net production, plus imports, plus net receipts, plus adjustments, minus stock
change, minus refinery and blender net inputs, minus exports.6 Total residual fuel oil ending stocks and stock change include stocks held at pipelines. Residual fuel oil ending stocks and stock change by sulfur content exclude pipeline stocks. Therefore, the sum of residual
fuel oil ending stocks and stock change by sulfur content may not equal total residual fuel oil ending stocks and stock change.Notes: Totals may not equal sum of components due to independent rounding. Domestic crude oil field production are estimates.Sources: Energy Information Administration (EIA) Forms EIA-22M "Monthly Biodiesel Production Survey", Forms EIA-810, "Monthly Refinery Report," EIA-812, "Monthly Product Pipeline Report," EIA-813, "MonthlyCrude Oil Report," EIA-814, "Monthly Imports Report," EIA-815, "Monthly Bulk Terminal and Blender Report," EIA-816, "Monthly Natural Gas Liquids Report," EIA-817, "Monthly Tanker and Barge Movements Report,"and EIA-819, "Monthly Oxygenate Report." Domestic crude oil field production estimates based on Form EIA-914, "Monthly Crude Oil and Lease Condensate, and Natural Gas Production Report," and data from Stateconservation agencies, U.S. Department of Interior, and the Bureau of Ocean Energy Management. Export data from the U.S. Census Bureau and EIA estimates. Rail net receipts estimates based on EIA analysis ofdata from the Surface Transportation Board and other information.

Energy Information Administration/Petroleum Supply Monthly,30 April 2018
Table 25. Crude Oil Supply, Disposition, and Ending Stocks by PAD District, April 2018(Thousand Barrels, Except Where Noted)
Process
PAD Districts U.S. Total
1 2 3 4 5 Total DailyAverage
SupplyField Production .................................................... 1,582 58,333 199,655 25,146 29,294 314,010 10,467
Alaskan ............................................................. – – – – – – – – – 14,922 497Lower 48 States ................................................ – – – – – 299,088 9,970
Imports (PAD District of Entry) ............................. 26,688 86,196 85,880 10,189 38,377 247,330 8,244Commercial ...................................................... 26,688 86,196 85,880 10,189 38,377 247,330 8,244Strategic Petroleum Reserve (SPR) ................. – – – – – – –
Net Receipts ......................................................... 7,820 -13,680 18,827 -16,448 3,480 – –Adjustments1 ........................................................ 1,339 -6,795 11,089 -1,121 -92 4,420 147
DispositionStock Change2 ..................................................... 3,361 3,335 1,435 547 1,441 10,119 337
Commercial ...................................................... – – 2,925 – – 11,609 387SPR .................................................................. – – -1,490 – – -1,490 -50
Refinery Inputs ..................................................... 33,308 117,135 265,991 17,199 69,339 502,972 16,766Exports ................................................................. 760 3,585 48,025 20 279 52,668 1,756
Ending StocksTotal ...................................................................... 15,128 124,905 884,304 23,512 51,174 1,099,023 – –
Commercial ...................................................... 15,128 124,905 220,338 23,512 51,174 435,057 – –Refinery ........................................................ 12,933 13,779 48,073 2,839 22,990 100,614 – –Tank Farms and Pipelines ............................ 2,195 111,126 172,265 20,673 24,784 331,043 – –
Cushing, Oklahoma .................................. – – 36,946 – – – – – – 36,946 – –Lease ............................................................ – – – – – – – –Alaskan Crude Oil In-Transit by Water ......... – – – – 3,400 3,400 – –
SPR .................................................................. – – 663,966 – – 663,966 – –
SPR StocksPercent of Total Crude Oil Stocks (Percent) ........ – – – – – – – – – – 60.4 – –Percent of Total Petroleum Stocks (Percent) ....... – – – – – – – – – – 35.6 – –Days of Total Petroleum Net Imports (Days) ........ – – – – – – – – – – 252 – –
SPR Receipts DetailReceipts ................................................................ – – – – – – –
Domestic ........................................................... – – – – – – –Imports .............................................................. – – – – – – –
Imported by SPR .......................................... – – – – – – –Imported for SPR by Others ......................... – – – – – – –
ImportsPAD District of Entry ............................................. 26,688 86,196 85,880 10,189 38,377 247,330 8,244PAD District of Processing ................................... 28,283 77,620 94,033 8,492 38,902 247,330 8,244
– – = Not Applicable.– = No Data Reported.1 Crude oil adjustment was previously referred to as Unaccounted-for Crude Oil.2 A negative number indicates a decrease in stocks and a positive number indicates an increase in stocks. Stock change for crude oil excludes lease stocks beginning with January 2005 (see explanatory notes).
Notes: Totals may not equal the sum of components due to independent rounding. Values of Domestic Crude Oil Field Production are estimates.Sources: Energy Information Administration (EIA) Forms EIA-810, "Monthly Refinery Report," EIA-813, "Monthly Crude Oil Report," EIA-814, "Monthly Imports Report," and EIA-817, "Monthly Tanker and BargeMovements Report." Domestic crude oil field production estimates based on Form EIA-914, "Monthly Crude Oil and Lease Condensate, and Natural Gas Production Report," and data from State conservation agencies,U.S. Department of Interior, and the Bureau of Ocean Energy Management. Export data from the U.S. Census Bureau and EIA estimates. Rail net receipts estimates based on EIA analysis of data from the SurfaceTransportation Board and other information.

Energy Information Administration/Petroleum Supply Monthly, 31 April 2018
Table 25. Crude Oil Supply, Disposition, and Ending Stocks by PAD District, April 2018(Thousand Barrels, Except Where Noted)
Process
PAD Districts U.S. Total
1 2 3 4 5 Total DailyAverage
SupplyField Production .................................................... 1,582 58,333 199,655 25,146 29,294 314,010 10,467
Alaskan ............................................................. – – – – – – – – – 14,922 497Lower 48 States ................................................ – – – – – 299,088 9,970
Imports (PAD District of Entry) ............................. 26,688 86,196 85,880 10,189 38,377 247,330 8,244Commercial ...................................................... 26,688 86,196 85,880 10,189 38,377 247,330 8,244Strategic Petroleum Reserve (SPR) ................. – – – – – – –
Net Receipts ......................................................... 7,820 -13,680 18,827 -16,448 3,480 – –Adjustments1 ........................................................ 1,339 -6,795 11,089 -1,121 -92 4,420 147
DispositionStock Change2 ..................................................... 3,361 3,335 1,435 547 1,441 10,119 337
Commercial ...................................................... – – 2,925 – – 11,609 387SPR .................................................................. – – -1,490 – – -1,490 -50
Refinery Inputs ..................................................... 33,308 117,135 265,991 17,199 69,339 502,972 16,766Exports ................................................................. 760 3,585 48,025 20 279 52,668 1,756
Ending StocksTotal ...................................................................... 15,128 124,905 884,304 23,512 51,174 1,099,023 – –
Commercial ...................................................... 15,128 124,905 220,338 23,512 51,174 435,057 – –Refinery ........................................................ 12,933 13,779 48,073 2,839 22,990 100,614 – –Tank Farms and Pipelines ............................ 2,195 111,126 172,265 20,673 24,784 331,043 – –
Cushing, Oklahoma .................................. – – 36,946 – – – – – – 36,946 – –Lease ............................................................ – – – – – – – –Alaskan Crude Oil In-Transit by Water ......... – – – – 3,400 3,400 – –
SPR .................................................................. – – 663,966 – – 663,966 – –
SPR StocksPercent of Total Crude Oil Stocks (Percent) ........ – – – – – – – – – – 60.4 – –Percent of Total Petroleum Stocks (Percent) ....... – – – – – – – – – – 35.6 – –Days of Total Petroleum Net Imports (Days) ........ – – – – – – – – – – 252 – –
SPR Receipts DetailReceipts ................................................................ – – – – – – –
Domestic ........................................................... – – – – – – –Imports .............................................................. – – – – – – –
Imported by SPR .......................................... – – – – – – –Imported for SPR by Others ......................... – – – – – – –
ImportsPAD District of Entry ............................................. 26,688 86,196 85,880 10,189 38,377 247,330 8,244PAD District of Processing ................................... 28,283 77,620 94,033 8,492 38,902 247,330 8,244
– – = Not Applicable.– = No Data Reported.1 Crude oil adjustment was previously referred to as Unaccounted-for Crude Oil.2 A negative number indicates a decrease in stocks and a positive number indicates an increase in stocks. Stock change for crude oil excludes lease stocks beginning with January 2005 (see explanatory notes).
Notes: Totals may not equal the sum of components due to independent rounding. Values of Domestic Crude Oil Field Production are estimates.Sources: Energy Information Administration (EIA) Forms EIA-810, "Monthly Refinery Report," EIA-813, "Monthly Crude Oil Report," EIA-814, "Monthly Imports Report," and EIA-817, "Monthly Tanker and BargeMovements Report." Domestic crude oil field production estimates based on Form EIA-914, "Monthly Crude Oil and Lease Condensate, and Natural Gas Production Report," and data from State conservation agencies,U.S. Department of Interior, and the Bureau of Ocean Energy Management. Export data from the U.S. Census Bureau and EIA estimates. Rail net receipts estimates based on EIA analysis of data from the SurfaceTransportation Board and other information.
Table 26. Production of Crude Oil by PAD District and State, April 2018(Thousand Barrels)
PAD District and StateApril 2018 January-April 2018
Total Daily Average Total Daily Average
PAD District 1 ...................................................... 1,582 53 6,236 52Florida ............................................................... 137 5 615 5New York .......................................................... 18 1 73 1Pennsylvania .................................................... 563 19 2,151 18Virginia .............................................................. 1 0 3 0West Virginia .................................................... 863 29 3,395 28
PAD District 2 ...................................................... 58,333 1,944 228,448 1,904Illinois ................................................................ 668 22 2,601 22Indiana .............................................................. 133 4 530 4Kansas .............................................................. 2,897 97 11,456 95Kentucky ........................................................... 106 4 662 6Michigan ........................................................... 426 14 1,750 15Missouri ............................................................ 8 0 33 0Nebraska .......................................................... 150 5 647 5North Dakota .................................................... 36,205 1,207 139,865 1,166Ohio .................................................................. 1,619 54 6,349 53Oklahoma ......................................................... 15,999 533 64,062 534South Dakota .................................................... 108 4 428 4Tennessee ........................................................ 16 1 63 1
PAD District 3 ...................................................... 199,655 6,655 783,931 6,533Alabama ........................................................... 519 17 2,039 17Arkansas ........................................................... 409 14 1,636 14Louisiana .......................................................... 3,842 128 15,335 128Mississippi ........................................................ 1,425 48 5,678 47New Mexico ...................................................... 19,474 649 71,990 600Texas ................................................................ 126,514 4,217 489,440 4,079Federal Offshore PAD District 3 ....................... 47,472 1,582 197,813 1,648
PAD District 4 ...................................................... 25,146 838 98,431 820Colorado ........................................................... 13,518 451 52,412 437Idaho ................................................................. 6 0 22 0Montana ............................................................ 1,617 54 6,571 55Utah .................................................................. 3,018 101 12,156 101Wyoming ........................................................... 6,986 233 27,269 227
PAD District 5 ...................................................... 29,294 976 118,419 987Alaska ............................................................... 14,922 497 60,905 508
South Alaska ................................................ 462 15 1,888 16North Slope ................................................... 14,461 482 59,017 492
Arizona ............................................................. 1 0 4 0California .......................................................... 13,862 462 55,517 463Nevada ............................................................. 22 1 86 1Federal Offshore PAD District 5 ....................... 487 16 1,907 16
U.S. Total ............................................................. 314,010 10,467 1,235,465 10,296
– = No Data Reported.Note: Year-to-date totals include revised monthly production estimates by state published in Petroleum Navigator. Crude oil production quantities are estimated by state and summed to the PADD and the U.S. level. State production estimates reported by EIA are normally different from data reported by state agencies. For example, production estimates for Texas reported on table 26 are different from production reported by theRailroad Commission of Texas. See EIA “Today In Energy” article released on July 10, 2015 (http://www.eia.gov/todayinenergy/detail.cfm?id=22012) for an explanation of differences in production data for Texas.Totals may not equal sum of components due to independent rounding.Sources: Energy Information Administration Form EIA-914, "Monthly Crude Oil and Lease Condensate, and Natural Gas Production Report," state government agencies, U.S. Department of the Interior, and the Bureauof Ocean Energy Management.
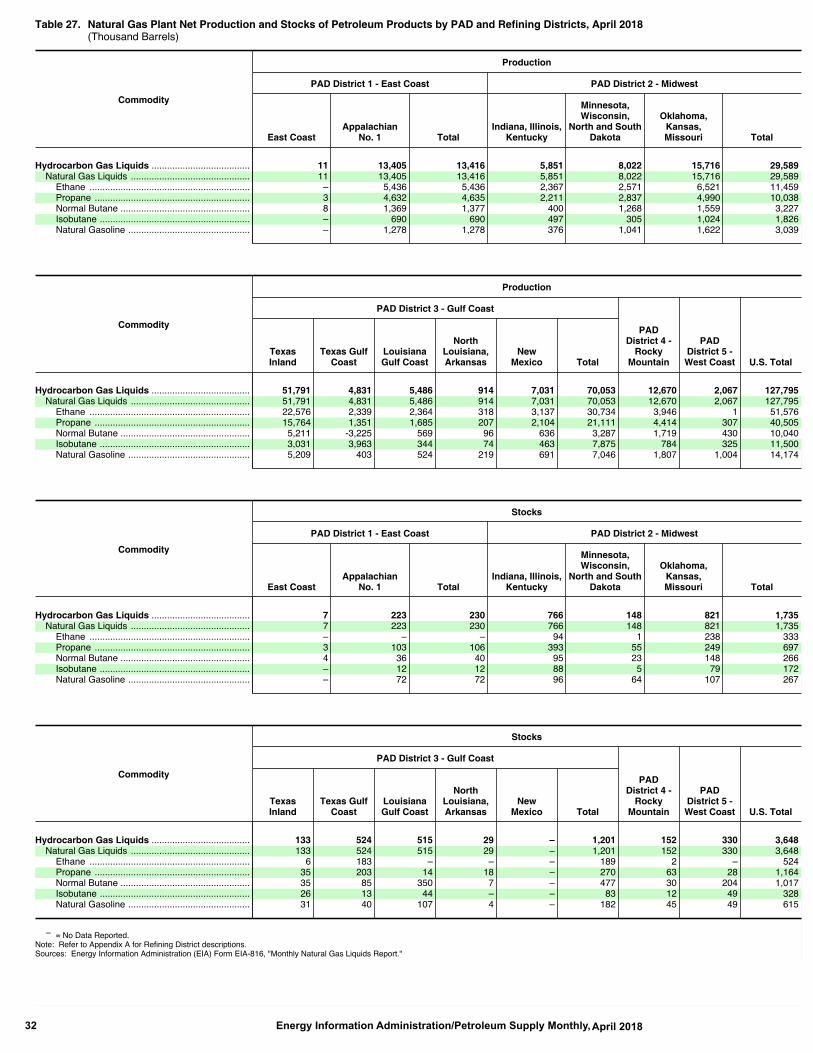
Energy Information Administration/Petroleum Supply Monthly,32 April 2018
Table 27. Natural Gas Plant Net Production and Stocks of Petroleum Products by PAD and Refining Districts, April 2018(Thousand Barrels)
Commodity
Production
PAD District 1 - East Coast PAD District 2 - Midwest
East CoastAppalachian
No. 1 TotalIndiana, Illinois,
Kentucky
Minnesota,Wisconsin,
North and SouthDakota
Oklahoma,Kansas,Missouri Total
Hydrocarbon Gas Liquids ...................................... 11 13,405 13,416 5,851 8,022 15,716 29,589Natural Gas Liquids .............................................. 11 13,405 13,416 5,851 8,022 15,716 29,589
Ethane .............................................................. – 5,436 5,436 2,367 2,571 6,521 11,459Propane ............................................................ 3 4,632 4,635 2,211 2,837 4,990 10,038Normal Butane .................................................. 8 1,369 1,377 400 1,268 1,559 3,227Isobutane .......................................................... – 690 690 497 305 1,024 1,826Natural Gasoline ............................................... – 1,278 1,278 376 1,041 1,622 3,039
Commodity
Production
PAD District 3 - Gulf Coast
PADDistrict 4 -
RockyMountain
PADDistrict 5 -West Coast U.S. Total
TexasInland
Texas GulfCoast
LouisianaGulf Coast
NorthLouisiana,Arkansas
NewMexico Total
Hydrocarbon Gas Liquids ...................................... 51,791 4,831 5,486 914 7,031 70,053 12,670 2,067 127,795Natural Gas Liquids .............................................. 51,791 4,831 5,486 914 7,031 70,053 12,670 2,067 127,795
Ethane .............................................................. 22,576 2,339 2,364 318 3,137 30,734 3,946 1 51,576Propane ............................................................ 15,764 1,351 1,685 207 2,104 21,111 4,414 307 40,505Normal Butane .................................................. 5,211 -3,225 569 96 636 3,287 1,719 430 10,040Isobutane .......................................................... 3,031 3,963 344 74 463 7,875 784 325 11,500Natural Gasoline ............................................... 5,209 403 524 219 691 7,046 1,807 1,004 14,174
Commodity
Stocks
PAD District 1 - East Coast PAD District 2 - Midwest
East CoastAppalachian
No. 1 TotalIndiana, Illinois,
Kentucky
Minnesota,Wisconsin,
North and SouthDakota
Oklahoma,Kansas,Missouri Total
Hydrocarbon Gas Liquids ...................................... 7 223 230 766 148 821 1,735Natural Gas Liquids .............................................. 7 223 230 766 148 821 1,735
Ethane .............................................................. – – – 94 1 238 333Propane ............................................................ 3 103 106 393 55 249 697Normal Butane .................................................. 4 36 40 95 23 148 266Isobutane .......................................................... – 12 12 88 5 79 172Natural Gasoline ............................................... – 72 72 96 64 107 267
Commodity
Stocks
PAD District 3 - Gulf Coast
PADDistrict 4 -
RockyMountain
PADDistrict 5 -West Coast U.S. Total
TexasInland
Texas GulfCoast
LouisianaGulf Coast
NorthLouisiana,Arkansas
NewMexico Total
Hydrocarbon Gas Liquids ...................................... 133 524 515 29 – 1,201 152 330 3,648Natural Gas Liquids .............................................. 133 524 515 29 – 1,201 152 330 3,648
Ethane .............................................................. 6 183 – – – 189 2 – 524Propane ............................................................ 35 203 14 18 – 270 63 28 1,164Normal Butane .................................................. 35 85 350 7 – 477 30 204 1,017Isobutane .......................................................... 26 13 44 – – 83 12 49 328Natural Gasoline ............................................... 31 40 107 4 – 182 45 49 615
– = No Data Reported.Note: Refer to Appendix A for Refining District descriptions.Sources: Energy Information Administration (EIA) Form EIA-816, "Monthly Natural Gas Liquids Report."

Energy Information Administration/Petroleum Supply Monthly, 33 April 2018
Table 27. Natural Gas Plant Net Production and Stocks of Petroleum Products by PAD and Refining Districts, April 2018(Thousand Barrels)
Commodity
Production
PAD District 1 - East Coast PAD District 2 - Midwest
East CoastAppalachian
No. 1 TotalIndiana, Illinois,
Kentucky
Minnesota,Wisconsin,
North and SouthDakota
Oklahoma,Kansas,Missouri Total
Hydrocarbon Gas Liquids ...................................... 11 13,405 13,416 5,851 8,022 15,716 29,589Natural Gas Liquids .............................................. 11 13,405 13,416 5,851 8,022 15,716 29,589
Ethane .............................................................. – 5,436 5,436 2,367 2,571 6,521 11,459Propane ............................................................ 3 4,632 4,635 2,211 2,837 4,990 10,038Normal Butane .................................................. 8 1,369 1,377 400 1,268 1,559 3,227Isobutane .......................................................... – 690 690 497 305 1,024 1,826Natural Gasoline ............................................... – 1,278 1,278 376 1,041 1,622 3,039
Commodity
Production
PAD District 3 - Gulf Coast
PADDistrict 4 -
RockyMountain
PADDistrict 5 -West Coast U.S. Total
TexasInland
Texas GulfCoast
LouisianaGulf Coast
NorthLouisiana,Arkansas
NewMexico Total
Hydrocarbon Gas Liquids ...................................... 51,791 4,831 5,486 914 7,031 70,053 12,670 2,067 127,795Natural Gas Liquids .............................................. 51,791 4,831 5,486 914 7,031 70,053 12,670 2,067 127,795
Ethane .............................................................. 22,576 2,339 2,364 318 3,137 30,734 3,946 1 51,576Propane ............................................................ 15,764 1,351 1,685 207 2,104 21,111 4,414 307 40,505Normal Butane .................................................. 5,211 -3,225 569 96 636 3,287 1,719 430 10,040Isobutane .......................................................... 3,031 3,963 344 74 463 7,875 784 325 11,500Natural Gasoline ............................................... 5,209 403 524 219 691 7,046 1,807 1,004 14,174
Commodity
Stocks
PAD District 1 - East Coast PAD District 2 - Midwest
East CoastAppalachian
No. 1 TotalIndiana, Illinois,
Kentucky
Minnesota,Wisconsin,
North and SouthDakota
Oklahoma,Kansas,Missouri Total
Hydrocarbon Gas Liquids ...................................... 7 223 230 766 148 821 1,735Natural Gas Liquids .............................................. 7 223 230 766 148 821 1,735
Ethane .............................................................. – – – 94 1 238 333Propane ............................................................ 3 103 106 393 55 249 697Normal Butane .................................................. 4 36 40 95 23 148 266Isobutane .......................................................... – 12 12 88 5 79 172Natural Gasoline ............................................... – 72 72 96 64 107 267
Commodity
Stocks
PAD District 3 - Gulf Coast
PADDistrict 4 -
RockyMountain
PADDistrict 5 -West Coast U.S. Total
TexasInland
Texas GulfCoast
LouisianaGulf Coast
NorthLouisiana,Arkansas
NewMexico Total
Hydrocarbon Gas Liquids ...................................... 133 524 515 29 – 1,201 152 330 3,648Natural Gas Liquids .............................................. 133 524 515 29 – 1,201 152 330 3,648
Ethane .............................................................. 6 183 – – – 189 2 – 524Propane ............................................................ 35 203 14 18 – 270 63 28 1,164Normal Butane .................................................. 35 85 350 7 – 477 30 204 1,017Isobutane .......................................................... 26 13 44 – – 83 12 49 328Natural Gasoline ............................................... 31 40 107 4 – 182 45 49 615
– = No Data Reported.Note: Refer to Appendix A for Refining District descriptions.Sources: Energy Information Administration (EIA) Form EIA-816, "Monthly Natural Gas Liquids Report."
Table 28. Refinery and Blender Net Input of Crude Oil and Petroleum Products by PAD and Refining Districts, April 2018(Thousand Barrels)
Commodity
PAD District 1 - East Coast PAD District 2 - Midwest
East CoastAppalachian
No. 1 TotalIndiana, Illinois,
Kentucky
Minnesota,Wisconsin,
North and SouthDakota
Oklahoma,Kansas,Missouri Total
Crude Oil ................................................................. 31,763 1,545 33,308 73,989 16,399 26,747 117,135
Hydrocarbon Gas Liquids ...................................... 1,010 24 1,034 1,859 69 1,109 3,037Natural Gas Liquids .............................................. 1,010 24 1,034 1,859 69 1,109 3,037
Normal Butane .................................................. 511 24 535 214 29 169 412Isobutane .......................................................... 425 – 425 1,277 33 466 1,776Natural Gasoline ............................................... 74 – 74 368 7 474 849
Other Liquids .......................................................... 74,727 6,237 80,964 10,718 1,946 2,241 14,905Hydrogen/Oxygenates/Renewables/Other Hydrocarbons ............................................. 9,710 709 10,419 5,791 1,460 1,803 9,054
Hydrogen .......................................................... 103 10 113 713 285 188 1,186Oxygenates (excluding Fuel Ethanol) ............... – – – – – – –
Methyl Tertiary Butyl Ether (MTBE) .............. – – – – – – –All Other Oxygenates1 .................................. – – – – – – –
Renewable Fuels (including Fuel Ethanol) ....... 9,607 699 10,306 5,043 1,175 1,615 7,833Fuel Ethanol ................................................. 9,348 652 10,000 4,748 999 1,555 7,302Renewable Diesel Fuel ................................. 259 47 306 295 176 60 531Other Renewable Fuels ................................ – – – – – – –
Other Hydrocarbons ......................................... – – – 35 – – 35Unfinished Oils (net) ............................................. 1,579 -101 1,478 -569 -193 -244 -1,006
Naphthas and Lighter ....................................... 858 -94 764 46 -85 -138 -177Kerosene and Light Gas Oils ............................ 331 – 331 -702 -108 -52 -862Heavy Gas Oils ................................................. 462 -15 447 221 -8 256 469Residuum ......................................................... -72 8 -64 -134 8 -310 -436
Motor Gasoline Blend.Comp. (MGBC)(net) .......... 63,438 5,629 69,067 5,496 679 682 6,857Reformulated - RBOB ....................................... 12,116 96 12,212 -1,220 1,224 996 1,000Conventional ..................................................... 51,322 5,533 56,855 6,716 -545 -314 5,857
CBOB ........................................................... 37,711 5,579 43,290 6,040 -712 -464 4,864GTAB ............................................................ 5,021 – 5,021 – – – –Other ............................................................. 8,590 -46 8,544 676 167 150 993
Aviation Gasoline Blend. Comp. (net) .................. – – – – – – –
Total Input ............................................................... 107,500 7,806 115,306 86,566 18,414 30,097 135,077
See footnotes at end of table.

Energy Information Administration/Petroleum Supply Monthly,34 April 2018
Table 28. Refinery and Blender Net Input of Crude Oil and Petroleum Products by PAD and Refining Districts, April 2018(Thousand Barrels) — Continued
Commodity
PAD District 3 - Gulf Coast
PADDistrict 4 -
RockyMountain
PADDistrict 5 -West Coast U.S. Total
TexasInland
Texas GulfCoast
LouisianaGulf Coast
NorthLouisiana,Arkansas
NewMexico Total
Crude Oil ................................................................. 20,012 135,116 99,871 6,892 4,100 265,991 17,199 69,339 502,972
Hydrocarbon Gas Liquids ...................................... 356 4,081 3,219 69 173 7,898 561 2,365 14,895Natural Gas Liquids .............................................. 356 4,081 3,219 69 173 7,898 561 2,365 14,895
Normal Butane .................................................. 121 896 122 20 – 1,159 202 707 3,015Isobutane .......................................................... 112 1,994 1,619 47 173 3,945 196 759 7,101Natural Gasoline ............................................... 123 1,191 1,478 2 – 2,794 163 899 4,779
Other Liquids .......................................................... 9,390 -37,139 -21,132 7,426 -78 -41,533 82 14,638 69,056Hydrogen/Oxygenates/Renewables/Other Hydrocarbons ............................................. 2,178 3,185 2,478 1,126 241 9,208 1,098 6,411 36,190
Hydrogen .......................................................... 35 2,259 1,772 69 45 4,180 197 1,149 6,825Oxygenates (excluding Fuel Ethanol) ............... – – – – – – – – –
Methyl Tertiary Butyl Ether (MTBE) .............. – – – – – – – – –All Other Oxygenates1 .................................. – – – – – – – – –
Renewable Fuels (including Fuel Ethanol) ....... 2,143 926 706 1,057 196 5,028 901 5,262 29,330Fuel Ethanol ................................................. 2,010 838 466 1,011 163 4,488 857 4,792 27,439Renewable Diesel Fuel ................................. 133 88 240 46 33 540 44 467 1,888Other Renewable Fuels ................................ – – – – – – – 3 3
Other Hydrocarbons ......................................... – – – – – – – – 35Unfinished Oils (net) ............................................. -349 -25 11,679 -106 59 11,258 -242 3,083 14,571
Naphthas and Lighter ....................................... 70 -5,012 363 -40 10 -4,609 -140 649 -3,513Kerosene and Light Gas Oils ............................ -46 -1,222 863 -12 40 -377 -217 42 -1,083Heavy Gas Oils ................................................. 60 6,759 9,328 10 9 16,166 229 2,233 19,544Residuum ......................................................... -433 -550 1,125 -64 – 78 -114 159 -377
Motor Gasoline Blend.Comp. (MGBC)(net) .......... 7,539 -40,299 -35,297 6,406 -378 -62,029 -774 5,144 18,265Reformulated - RBOB ....................................... 5,196 -9,614 -5,524 – -660 -10,602 – 3,890 6,500Conventional ..................................................... 2,343 -30,685 -29,773 6,406 282 -51,427 -774 1,254 11,765
CBOB ........................................................... 2,461 -34,037 -28,637 6,393 324 -53,496 -902 -225 -6,469GTAB ............................................................ – – – – – – – – 5,021Other ............................................................. -118 3,352 -1,136 13 -42 2,069 128 1,479 13,213
Aviation Gasoline Blend. Comp. (net) .................. 22 – 8 – – 30 – – 30
Total Input ............................................................... 29,758 102,058 81,958 14,387 4,195 232,356 17,842 86,342 586,923
– = No Data Reported.1 Includes ethyl tertiary butyl ether (ETBE), tertiary amyl methyl ether (TAME), tertiary butyl alcohol (TBA), and other aliphatic alcohols and ethers intended for motor gasoline blending (e.g., isopropyl ether (IPE) or
n-propanol).Note: Totals may not equal sum of components due to independent rounding.Note: Refer to Appendix A for Refining District descriptions.Source: Energy Information Administration (EIA) Forms EIA-810, "Monthly Refinery Report," and EIA-815, "Monthly Bulk Terminal and Blender Report."

Energy Information Administration/Petroleum Supply Monthly, 35 April 2018
Table 28. Refinery and Blender Net Input of Crude Oil and Petroleum Products by PAD and Refining Districts, April 2018(Thousand Barrels) — Continued
Commodity
PAD District 3 - Gulf Coast
PADDistrict 4 -
RockyMountain
PADDistrict 5 -West Coast U.S. Total
TexasInland
Texas GulfCoast
LouisianaGulf Coast
NorthLouisiana,Arkansas
NewMexico Total
Crude Oil ................................................................. 20,012 135,116 99,871 6,892 4,100 265,991 17,199 69,339 502,972
Hydrocarbon Gas Liquids ...................................... 356 4,081 3,219 69 173 7,898 561 2,365 14,895Natural Gas Liquids .............................................. 356 4,081 3,219 69 173 7,898 561 2,365 14,895
Normal Butane .................................................. 121 896 122 20 – 1,159 202 707 3,015Isobutane .......................................................... 112 1,994 1,619 47 173 3,945 196 759 7,101Natural Gasoline ............................................... 123 1,191 1,478 2 – 2,794 163 899 4,779
Other Liquids .......................................................... 9,390 -37,139 -21,132 7,426 -78 -41,533 82 14,638 69,056Hydrogen/Oxygenates/Renewables/Other Hydrocarbons ............................................. 2,178 3,185 2,478 1,126 241 9,208 1,098 6,411 36,190
Hydrogen .......................................................... 35 2,259 1,772 69 45 4,180 197 1,149 6,825Oxygenates (excluding Fuel Ethanol) ............... – – – – – – – – –
Methyl Tertiary Butyl Ether (MTBE) .............. – – – – – – – – –All Other Oxygenates1 .................................. – – – – – – – – –
Renewable Fuels (including Fuel Ethanol) ....... 2,143 926 706 1,057 196 5,028 901 5,262 29,330Fuel Ethanol ................................................. 2,010 838 466 1,011 163 4,488 857 4,792 27,439Renewable Diesel Fuel ................................. 133 88 240 46 33 540 44 467 1,888Other Renewable Fuels ................................ – – – – – – – 3 3
Other Hydrocarbons ......................................... – – – – – – – – 35Unfinished Oils (net) ............................................. -349 -25 11,679 -106 59 11,258 -242 3,083 14,571
Naphthas and Lighter ....................................... 70 -5,012 363 -40 10 -4,609 -140 649 -3,513Kerosene and Light Gas Oils ............................ -46 -1,222 863 -12 40 -377 -217 42 -1,083Heavy Gas Oils ................................................. 60 6,759 9,328 10 9 16,166 229 2,233 19,544Residuum ......................................................... -433 -550 1,125 -64 – 78 -114 159 -377
Motor Gasoline Blend.Comp. (MGBC)(net) .......... 7,539 -40,299 -35,297 6,406 -378 -62,029 -774 5,144 18,265Reformulated - RBOB ....................................... 5,196 -9,614 -5,524 – -660 -10,602 – 3,890 6,500Conventional ..................................................... 2,343 -30,685 -29,773 6,406 282 -51,427 -774 1,254 11,765
CBOB ........................................................... 2,461 -34,037 -28,637 6,393 324 -53,496 -902 -225 -6,469GTAB ............................................................ – – – – – – – – 5,021Other ............................................................. -118 3,352 -1,136 13 -42 2,069 128 1,479 13,213
Aviation Gasoline Blend. Comp. (net) .................. 22 – 8 – – 30 – – 30
Total Input ............................................................... 29,758 102,058 81,958 14,387 4,195 232,356 17,842 86,342 586,923
– = No Data Reported.1 Includes ethyl tertiary butyl ether (ETBE), tertiary amyl methyl ether (TAME), tertiary butyl alcohol (TBA), and other aliphatic alcohols and ethers intended for motor gasoline blending (e.g., isopropyl ether (IPE) or
n-propanol).Note: Totals may not equal sum of components due to independent rounding.Note: Refer to Appendix A for Refining District descriptions.Source: Energy Information Administration (EIA) Forms EIA-810, "Monthly Refinery Report," and EIA-815, "Monthly Bulk Terminal and Blender Report."
Table 29. Refinery and Blender Net Production of Finished Petroleum Products by PAD and Refining Districts, April 2018(Thousand Barrels)
Commodity
PAD District 1 - East Coast PAD District 2 - Midwest
East CoastAppalachian
No. 1 TotalIndiana, Illinois,
Kentucky
Minnesota,Wisconsin,
North and SouthDakota
Oklahoma,Kansas,Missouri Total
Hydrocarbon Gas Liquids ......................................... 1,471 1 1,472 4,030 590 810 5,430Natural Gas Liquids .............................................. 1,099 1 1,100 3,035 442 530 4,007
Ethane .............................................................. – – – – – – –Propane ............................................................ 736 -1 735 1,560 312 473 2,345Normal Butane .................................................. 370 10 380 1,483 163 112 1,758Isobutane .......................................................... -7 -8 -15 -8 -33 -55 -96Natural Gasoline ............................................... – – – – – – –
Refinery Olefins .................................................... 372 – 372 995 148 280 1,423Ethylene ............................................................ – – – – – – –Propylene ......................................................... 399 – 399 953 148 280 1,381Butylene ............................................................ -48 – -48 42 – – 42Isobutylene ....................................................... 21 – 21 – – – –
Finished Motor Gasoline ........................................... 89,984 6,745 96,729 50,309 9,911 16,424 76,644Reformulated ........................................................ 38,632 105 38,737 8,262 1,483 1,107 10,852
Reformulated Blended with Fuel Ethanol ......... 38,632 105 38,737 8,262 1,483 1,107 10,852Reformulated Other .......................................... – – – – – – –
Conventional ......................................................... 51,352 6,640 57,992 42,047 8,428 15,317 65,792Conventional Blended with Fuel Ethanol .......... 54,356 6,432 60,788 38,755 8,663 14,022 61,440
Ed55 and Lower ........................................... 54,318 6,432 60,750 38,743 8,640 13,954 61,337Greater than Ed55 ........................................ 38 – 38 12 23 68 103
Conventional Other ........................................... -3,004 208 -2,796 3,292 -235 1,295 4,352Finished Aviation Gasoline ....................................... – – – – 27 – 27Kerosene-Type Jet Fuel ........................................... 3,107 – 3,107 5,604 1,000 960 7,564Kerosene .................................................................. 24 – 24 4 – 4 8Distillate Fuel Oil ....................................................... 10,299 467 10,766 18,996 4,967 10,385 34,348
15 ppm sulfur and under ....................................... 9,905 388 10,293 19,164 4,926 10,429 34,519Greater than 15 ppm to 500 ppm sulfur ................ 33 67 100 -60 -2 72 10Greater than 500 ppm sulfur ................................. 361 12 373 -108 43 -116 -181
Residual Fuel Oil ...................................................... 1,091 3 1,094 1,140 231 118 1,489Less than 0.31 percent sulfur ............................... 342 3 345 71 – 1 720.31 to 1.00 percent sulfur .................................... 297 – 297 114 76 – 190Greater than 1.00 percent sulfur ........................... 452 – 452 955 155 117 1,227
Petrochemical Feedstocks ....................................... 102 – 102 808 – 36 844Naphtha for Petro. Feed. Use ............................... 102 – 102 551 – – 551Other Oils for Petro. Feed. Use ............................ – – – 257 – 36 293
Special Naphthas ..................................................... – 12 12 45 – 10 55Lubricants ................................................................. 206 184 390 – – 124 124Waxes ....................................................................... – 14 14 – – 24 24Petroleum Coke ........................................................ 1,051 6 1,057 4,078 911 889 5,878
Marketable ............................................................ 380 – 380 2,966 737 667 4,370Catalyst ................................................................. 671 6 677 1,112 174 222 1,508
Asphalt and Road Oil ................................................ 449 209 658 2,810 1,277 433 4,520Still Gas .................................................................... 1,318 21 1,339 2,731 648 1,028 4,407Miscellaneous Products ............................................ 78 11 89 330 123 56 509
Total ......................................................................... 109,180 7,673 116,853 90,885 19,685 31,301 141,871
Processing Gain(-) or Loss(+)1 ................................ -1,680 133 -1,547 -4,319 -1,271 -1,204 -6,794
See footnotes at end of table.

Energy Information Administration/Petroleum Supply Monthly,36 April 2018
Table 29. Refinery and Blender Net Production of Finished Petroleum Products by PAD and Refining Districts, April 2018(Thousand Barrels) — Continued
Commodity
PAD District 3 - Gulf Coast
PADDistrict 4 -
RockyMountain
PADDistrict 5 -West Coast U.S. Total
TexasInland
Texas GulfCoast
LouisianaGulf Coast
NorthLouisiana,Arkansas
NewMexico Total
Hydrocarbon Gas Liquids ......................................... 752 7,443 6,065 95 65 14,420 412 2,275 24,009Natural Gas Liquids .............................................. 423 4,136 3,233 64 65 7,921 387 1,952 15,367
Ethane .............................................................. 1 138 43 – – 182 – – 182Propane ............................................................ 302 2,240 2,213 21 51 4,827 282 1,021 9,210Normal Butane .................................................. 303 2,171 747 43 14 3,278 136 814 6,366Isobutane .......................................................... -183 -413 230 – – -366 -31 117 -391Natural Gasoline ............................................... – – – – – – – – –
Refinery Olefins .................................................... 329 3,307 2,832 31 – 6,499 25 323 8,642Ethylene ............................................................ – – – – – – – – –Propylene ......................................................... 330 3,365 2,747 31 – 6,473 -4 324 8,573Butylene ............................................................ -1 -35 85 – – 49 29 -1 71Isobutylene ....................................................... – -23 – – – -23 – – -2
Finished Motor Gasoline ........................................... 20,620 22,716 13,922 9,376 2,056 68,690 8,726 48,130 298,919Reformulated ........................................................ 7,172 6,545 – – – 13,717 – 34,116 97,422
Reformulated Blended with Fuel Ethanol ......... 7,172 6,545 – – – 13,717 – 34,116 97,422Reformulated Other .......................................... – – – – – – – – –
Conventional ......................................................... 13,448 16,171 13,922 9,376 2,056 54,973 8,726 14,014 201,497Conventional Blended with Fuel Ethanol .......... 12,605 1,708 4,617 10,031 1,631 30,592 8,544 13,669 175,033
Ed55 and Lower ........................................... 12,587 1,708 4,617 10,016 1,631 30,559 8,531 13,667 174,844Greater than Ed55 ........................................ 18 – – 15 – 33 13 2 189
Conventional Other ........................................... 843 14,463 9,305 -655 425 24,381 182 345 26,464Finished Aviation Gasoline ....................................... 84 60 93 – – 237 3 – 267Kerosene-Type Jet Fuel ........................................... 1,540 14,932 12,454 122 – 29,048 1,000 13,232 53,951Kerosene .................................................................. -14 3 -34 -2 – -47 – 8 -7Distillate Fuel Oil ....................................................... 5,713 41,629 35,759 2,415 1,805 87,321 5,638 15,497 153,570
15 ppm sulfur and under ....................................... 5,658 39,703 29,962 2,329 1,805 79,457 5,610 15,191 145,070Greater than 15 ppm to 500 ppm sulfur ................ 55 281 1,486 22 – 1,844 34 104 2,092Greater than 500 ppm sulfur ................................. – 1,645 4,311 64 – 6,020 -6 202 6,408
Residual Fuel Oil ...................................................... 297 1,583 5,459 -49 66 7,356 325 3,249 13,513Less than 0.31 percent sulfur ............................... 188 110 919 – – 1,217 192 11 1,8370.31 to 1.00 percent sulfur .................................... – 115 391 -49 20 477 20 664 1,648Greater than 1.00 percent sulfur ........................... 109 1,358 4,149 – 46 5,662 113 2,574 10,028
Petrochemical Feedstocks ....................................... 122 5,241 2,904 6 – 8,273 – 3 9,222Naphtha for Petro. Feed. Use ............................... 111 3,348 1,268 6 – 4,733 – 3 5,389Other Oils for Petro. Feed. Use ............................ 11 1,893 1,636 – – 3,540 – – 3,833
Special Naphthas ..................................................... 41 753 – 229 – 1,023 – 54 1,144Lubricants ................................................................. 22 1,742 1,829 866 – 4,459 – 327 5,300Waxes ....................................................................... – 49 39 17 – 105 – – 143Petroleum Coke ........................................................ 297 8,816 5,209 165 44 14,531 774 4,763 27,003
Marketable ............................................................ 80 6,832 3,897 150 – 10,959 545 3,757 20,011Catalyst ................................................................. 217 1,984 1,312 15 44 3,572 229 1,006 6,992
Asphalt and Road Oil ................................................ 217 384 1,122 872 84 2,679 1,087 849 9,793Still Gas .................................................................... 683 5,861 4,032 185 74 10,835 633 3,465 20,679Miscellaneous Products ............................................ 112 963 601 21 54 1,751 97 402 2,848
Total ......................................................................... 30,486 112,175 89,454 14,318 4,248 250,681 18,695 92,254 620,354
Processing Gain(-) or Loss(+)1 ................................ -728 -10,117 -7,496 69 -53 -18,325 -853 -5,912 -33,431
– = No Data Reported.1 Represents the arithmetic difference between input and production.
Note: Refer to Appendix A for Refining District descriptions.Source: Energy Information Administration (EIA) Forms EIA-810, "Monthly Refinery Report," and EIA-815, "Monthly Bulk Terminal and Blender Report."

Energy Information Administration/Petroleum Supply Monthly, 37 April 2018
Table 29. Refinery and Blender Net Production of Finished Petroleum Products by PAD and Refining Districts, April 2018(Thousand Barrels) — Continued
Commodity
PAD District 3 - Gulf Coast
PADDistrict 4 -
RockyMountain
PADDistrict 5 -West Coast U.S. Total
TexasInland
Texas GulfCoast
LouisianaGulf Coast
NorthLouisiana,Arkansas
NewMexico Total
Hydrocarbon Gas Liquids ......................................... 752 7,443 6,065 95 65 14,420 412 2,275 24,009Natural Gas Liquids .............................................. 423 4,136 3,233 64 65 7,921 387 1,952 15,367
Ethane .............................................................. 1 138 43 – – 182 – – 182Propane ............................................................ 302 2,240 2,213 21 51 4,827 282 1,021 9,210Normal Butane .................................................. 303 2,171 747 43 14 3,278 136 814 6,366Isobutane .......................................................... -183 -413 230 – – -366 -31 117 -391Natural Gasoline ............................................... – – – – – – – – –
Refinery Olefins .................................................... 329 3,307 2,832 31 – 6,499 25 323 8,642Ethylene ............................................................ – – – – – – – – –Propylene ......................................................... 330 3,365 2,747 31 – 6,473 -4 324 8,573Butylene ............................................................ -1 -35 85 – – 49 29 -1 71Isobutylene ....................................................... – -23 – – – -23 – – -2
Finished Motor Gasoline ........................................... 20,620 22,716 13,922 9,376 2,056 68,690 8,726 48,130 298,919Reformulated ........................................................ 7,172 6,545 – – – 13,717 – 34,116 97,422
Reformulated Blended with Fuel Ethanol ......... 7,172 6,545 – – – 13,717 – 34,116 97,422Reformulated Other .......................................... – – – – – – – – –
Conventional ......................................................... 13,448 16,171 13,922 9,376 2,056 54,973 8,726 14,014 201,497Conventional Blended with Fuel Ethanol .......... 12,605 1,708 4,617 10,031 1,631 30,592 8,544 13,669 175,033
Ed55 and Lower ........................................... 12,587 1,708 4,617 10,016 1,631 30,559 8,531 13,667 174,844Greater than Ed55 ........................................ 18 – – 15 – 33 13 2 189
Conventional Other ........................................... 843 14,463 9,305 -655 425 24,381 182 345 26,464Finished Aviation Gasoline ....................................... 84 60 93 – – 237 3 – 267Kerosene-Type Jet Fuel ........................................... 1,540 14,932 12,454 122 – 29,048 1,000 13,232 53,951Kerosene .................................................................. -14 3 -34 -2 – -47 – 8 -7Distillate Fuel Oil ....................................................... 5,713 41,629 35,759 2,415 1,805 87,321 5,638 15,497 153,570
15 ppm sulfur and under ....................................... 5,658 39,703 29,962 2,329 1,805 79,457 5,610 15,191 145,070Greater than 15 ppm to 500 ppm sulfur ................ 55 281 1,486 22 – 1,844 34 104 2,092Greater than 500 ppm sulfur ................................. – 1,645 4,311 64 – 6,020 -6 202 6,408
Residual Fuel Oil ...................................................... 297 1,583 5,459 -49 66 7,356 325 3,249 13,513Less than 0.31 percent sulfur ............................... 188 110 919 – – 1,217 192 11 1,8370.31 to 1.00 percent sulfur .................................... – 115 391 -49 20 477 20 664 1,648Greater than 1.00 percent sulfur ........................... 109 1,358 4,149 – 46 5,662 113 2,574 10,028
Petrochemical Feedstocks ....................................... 122 5,241 2,904 6 – 8,273 – 3 9,222Naphtha for Petro. Feed. Use ............................... 111 3,348 1,268 6 – 4,733 – 3 5,389Other Oils for Petro. Feed. Use ............................ 11 1,893 1,636 – – 3,540 – – 3,833
Special Naphthas ..................................................... 41 753 – 229 – 1,023 – 54 1,144Lubricants ................................................................. 22 1,742 1,829 866 – 4,459 – 327 5,300Waxes ....................................................................... – 49 39 17 – 105 – – 143Petroleum Coke ........................................................ 297 8,816 5,209 165 44 14,531 774 4,763 27,003
Marketable ............................................................ 80 6,832 3,897 150 – 10,959 545 3,757 20,011Catalyst ................................................................. 217 1,984 1,312 15 44 3,572 229 1,006 6,992
Asphalt and Road Oil ................................................ 217 384 1,122 872 84 2,679 1,087 849 9,793Still Gas .................................................................... 683 5,861 4,032 185 74 10,835 633 3,465 20,679Miscellaneous Products ............................................ 112 963 601 21 54 1,751 97 402 2,848
Total ......................................................................... 30,486 112,175 89,454 14,318 4,248 250,681 18,695 92,254 620,354
Processing Gain(-) or Loss(+)1 ................................ -728 -10,117 -7,496 69 -53 -18,325 -853 -5,912 -33,431
– = No Data Reported.1 Represents the arithmetic difference between input and production.
Note: Refer to Appendix A for Refining District descriptions.Source: Energy Information Administration (EIA) Forms EIA-810, "Monthly Refinery Report," and EIA-815, "Monthly Bulk Terminal and Blender Report."
Table 30. Refinery Net Input of Crude Oil and Petroleum Products by PAD and Refining Districts, April 2018(Thousand Barrels, Except Where Noted)
Commodity
PAD District 1 - East Coast PAD District 2 - Midwest
East CoastAppalachian
No. 1 TotalIndiana, Illinois,
Kentucky
Minnesota,Wisconsin,
North and SouthDakota
Oklahoma,Kansas,Missouri Total
Crude Oil ................................................................. 31,763 1,545 33,308 73,989 16,399 26,747 117,135
Hydrocarbon Gas Liquids ...................................... 473 – 473 1,663 33 901 2,597Natural Gas Liquids .............................................. 473 – 473 1,663 33 901 2,597
Normal Butane .................................................. 48 – 48 18 – 5 23Isobutane .......................................................... 425 – 425 1,277 33 466 1,776Natural Gasoline ............................................... – – – 368 – 430 798
Other Liquids .......................................................... -14,096 85 -14,011 -33,362 -6,081 -11,195 -50,638Hydrogen/Oxygenates/Renewables/Other Hydrocarbons ............................................. 173 56 229 1,008 481 313 1,802
Hydrogen .......................................................... 103 10 113 713 285 188 1,186Oxygenates (excluding Fuel Ethanol) ............... – – – – – – –
Methyl Tertiary Butyl Ether (MTBE) .............. – – – – – – –All Other Oxygenates1 .................................. – – – – – – –
Renewable Fuels (including Fuel Ethanol) ....... 70 46 116 260 196 125 581Fuel Ethanol ................................................. 70 38 108 157 117 119 393Renewable Diesel Fuel ................................. – 8 8 103 79 6 188Other Renewable Fuels ................................ – – – – – – –
Other Hydrocarbons ......................................... – – – 35 – – 35Unfinished Oils (net) ............................................. 1,579 -101 1,478 -684 -193 -244 -1,121
Naphthas and Lighter ....................................... 858 -94 764 46 -85 -138 -177Kerosene and Light Gas Oils ............................ 331 – 331 -702 -108 -52 -862Heavy Gas Oils ................................................. 462 -15 447 221 -8 256 469Residuum ......................................................... -72 8 -64 -249 8 -310 -551
Motor Gasoline Blend.Comp. (MGBC)(net) .......... -15,848 130 -15,718 -33,686 -6,369 -11,264 -51,319Reformulated - RBOB ....................................... -9,772 – -9,772 -8,411 -119 – -8,530Conventional ..................................................... -6,076 130 -5,946 -25,275 -6,250 -11,264 -42,789
CBOB ........................................................... -5,504 176 -5,328 -25,930 -6,417 -11,412 -43,759GTAB ............................................................ – – – – – – –Other ............................................................. -572 -46 -618 655 167 148 970
Aviation Gasoline Blend. Comp. (net) .................. – – – – – – –
Total Input to Refineries ................................ 18,140 1,630 19,770 42,290 10,351 16,453 69,094
Atmospheric Crude Oil DistillationGross Input (daily average) .................................. 1,059 55 1,114 2,429 547 894 3,869Operable Capacity (daily average) ....................... 1,125 98 1,224 2,640 540 912 4,092Operable Utilization Rate (percent)2 .................... 94.1 56.3 91.1 92.0 101.3 98.0 94.6
Downstream Processing Fresh Feed Input (daily average)
Catalytic Reforming .............................................. 187 9 196 420 78 163 660Catalytic Cracking ................................................. 396 5 401 780 152 228 1,160Catalytic Hydrocracking ........................................ 40 – 40 160 65 62 287Delayed and Fluid Coking .................................... 55 – 55 342 73 83 498
Crude Oil QualitiesSulfur Content, Weighted Average (percent) ........ 0.85 1.07 0.86 1.69 1.99 0.84 1.54API Gravity, Weighted Average (degrees) ........... 35.74 35.46 35.73 32.45 27.79 36.67 32.73
Operable Capacity (daily average) ........................ 1,125 98 1,224 2,640 540 912 4,092Operating .............................................................. 1,125 98 1,224 2,613 540 912 4,065Idle ........................................................................ – – – 28 – – 28
Alaskan Crude Oil Receipts ................................... – – – – – – –
See footnotes at end of table.

Energy Information Administration/Petroleum Supply Monthly,38 April 2018
Table 30. Refinery Net Input of Crude Oil and Petroleum Products by PAD and Refining Districts, April 2018(Thousand Barrels, Except Where Noted) — Continued
Commodity
PAD District 3 - Gulf Coast
PADDistrict 4 -
RockyMountain
PADDistrict 5 -West Coast U.S. Total
TexasInland
Texas GulfCoast
LouisianaGulf Coast
NorthLouisiana,Arkansas
NewMexico Total
Crude Oil ................................................................. 20,012 135,116 99,871 6,892 4,100 265,991 17,199 69,339 502,972
Hydrocarbon Gas Liquids ...................................... 339 3,715 3,199 49 173 7,475 508 2,298 13,351Natural Gas Liquids .............................................. 339 3,715 3,199 49 173 7,475 508 2,298 13,351
Normal Butane .................................................. 108 838 102 – – 1,048 166 640 1,925Isobutane .......................................................... 112 1,994 1,619 47 173 3,945 195 759 7,100Natural Gasoline ............................................... 119 883 1,478 2 – 2,482 147 899 4,326
Other Liquids .......................................................... -8,161 -47,941 -23,888 -1,601 -1,164 -82,755 -4,588 -30,642 -182,634Hydrogen/Oxygenates/Renewables/Other Hydrocarbons ............................................. 305 2,322 2,190 118 112 5,047 484 1,422 8,984
Hydrogen .......................................................... 35 2,259 1,772 69 45 4,180 197 1,149 6,825Oxygenates (excluding Fuel Ethanol) ............... – – – – – – – – –
Methyl Tertiary Butyl Ether (MTBE) .............. – – – – – – – – –All Other Oxygenates1 .................................. – – – – – – – – –
Renewable Fuels (including Fuel Ethanol) ....... 270 63 418 49 67 867 287 273 2,124Fuel Ethanol ................................................. 209 49 178 25 56 517 252 87 1,357Renewable Diesel Fuel ................................. 61 14 240 24 11 350 35 186 767Other Renewable Fuels ................................ – – – – – – – – –
Other Hydrocarbons ......................................... – – – – – – – – 35Unfinished Oils (net) ............................................. -349 138 11,785 -106 59 11,527 -242 3,083 14,725
Naphthas and Lighter ....................................... 70 -5,012 363 -40 10 -4,609 -140 649 -3,513Kerosene and Light Gas Oils ............................ -46 -1,059 851 -12 40 -226 -217 42 -932Heavy Gas Oils ................................................. 60 6,759 9,446 10 9 16,284 229 2,233 19,662Residuum ......................................................... -433 -550 1,125 -64 – 78 -114 159 -492
Motor Gasoline Blend.Comp. (MGBC)(net) .......... -8,139 -50,401 -37,871 -1,613 -1,335 -99,359 -4,830 -35,147 -206,373Reformulated - RBOB ....................................... -1,265 -14,216 -5,524 – -660 -21,665 – -26,093 -66,060Conventional ..................................................... -6,874 -36,185 -32,347 -1,613 -675 -77,694 -4,830 -9,054 -140,313
CBOB ........................................................... -6,756 -32,884 -30,136 -1,616 -633 -72,025 -4,957 -10,368 -136,437GTAB ............................................................ – – – – – – – – –Other ............................................................. -118 -3,301 -2,211 3 -42 -5,669 127 1,314 -3,876
Aviation Gasoline Blend. Comp. (net) .................. 22 – 8 – – 30 – – 30
Total Input to Refineries ................................ 12,190 90,890 79,182 5,340 3,109 190,711 13,119 40,995 333,689
Atmospheric Crude Oil DistillationGross Input (daily average) .................................. 664 4,578 3,472 207 137 9,058 587 2,479 17,107Operable Capacity (daily average) ....................... 747 4,955 3,668 256 137 9,762 683 2,838 18,598Operable Utilization Rate (percent)2 .................... 88.9 92.4 94.7 80.7 100.1 92.8 86.0 87.3 92.0
Downstream Processing Fresh Feed Input (daily average)
Catalytic Reforming .............................................. 147 713 541 32 28 1,461 74 408 2,799Catalytic Cracking ................................................. 165 1,379 1,049 19 35 2,647 164 701 5,073Catalytic Hydrocracking ........................................ 48 511 468 15 18 1,060 21 444 1,852Delayed and Fluid Coking .................................... 18 727 441 28 – 1,214 65 443 2,275
Crude Oil QualitiesSulfur Content, Weighted Average (percent) ........ 0.44 1.62 1.43 1.61 0.69 1.44 1.47 1.49 1.43API Gravity, Weighted Average (degrees) ........... 40.46 31.57 31.58 30.72 39.45 32.35 32.95 27.61 32.01
Operable Capacity (daily average) ........................ 747 4,955 3,668 256 137 9,762 683 2,838 18,598Operating .............................................................. 747 4,955 3,668 256 137 9,762 673 2,838 18,561Idle ........................................................................ – – – – – – 10 – 37
Alaskan Crude Oil Receipts ................................... – – – – – – – 13,251 13,251
– = No Data Reported.NA = Not Available.
1 Includes ethyl tertiary butyl ether (ETBE), tertiary amyl methyl ether (TAME), tertiary butyl alcohol (TBA), and other aliphatic alcohols and ethers intended for motor gasoline blending (e.g., isopropyl ether (IPE) orn-propanol).
2 Represents gross input divided by operable calendar day capacity.Note: Totals may not equal sum of components due to independent rounding.Note: Refer to Appendix A for Refining District descriptions.Source: Energy Information Administration (EIA) Form EIA-810, "Monthly Refinery Report."

Energy Information Administration/Petroleum Supply Monthly, 39 April 2018
Table 31. Refinery Net Production of Finished Petroleum Products by PAD and Refining Districts, April 2018(Thousand Barrels)
Commodity
PAD District 1 - East Coast PAD District 2 - Midwest
East CoastAppalachian
No. 1 TotalIndiana, Illinois,
Kentucky
Minnesota,Wisconsin,
North and SouthDakota
Oklahoma,Kansas,Missouri Total
Hydrocarbon Gas Liquids ......................................... 1,471 1 1,472 4,030 590 810 5,430Natural Gas Liquids .............................................. 1,099 1 1,100 3,035 442 530 4,007
Ethane .............................................................. – – – – – – –Propane ............................................................ 736 -1 735 1,560 312 473 2,345Normal Butane .................................................. 370 10 380 1,483 163 112 1,758Isobutane .......................................................... -7 -8 -15 -8 -33 -55 -96Natural Gasoline ............................................... – – – – – – –
Refinery Olefins .................................................... 372 – 372 995 148 280 1,423Ethylene ............................................................ – – – – – – –Propylene ......................................................... 399 – 399 953 148 280 1,381Butylene ............................................................ -48 – -48 42 – – 42Isobutylene ....................................................... 21 – 21 – – – –
Finished Motor Gasoline ........................................... 702 608 1,310 6,416 1,943 2,832 11,191Reformulated ........................................................ 702 – 702 – – – –
Reformulated Blended with Fuel Ethanol ......... 702 – 702 – – – –Reformulated Other .......................................... – – – – – – –
Conventional ......................................................... – 608 608 6,416 1,943 2,832 11,191Conventional Blended with Fuel Ethanol .......... – 386 386 1,626 1,444 1,182 4,252
Ed55 and Lower ........................................... – 386 386 1,626 1,444 1,182 4,252Greater than Ed55 ........................................ – – – – – – –
Conventional Other ........................................... – 222 222 4,790 499 1,650 6,939Finished Aviation Gasoline ....................................... – – – – 27 – 27Kerosene-Type Jet Fuel ........................................... 3,108 – 3,108 5,604 1,000 960 7,564Kerosene .................................................................. 26 – 26 4 – 4 8Distillate Fuel Oil ....................................................... 10,186 428 10,614 18,724 4,872 10,333 33,929
15 ppm sulfur and under ....................................... 9,796 349 10,145 18,892 4,831 10,377 34,100Greater than 15 ppm to 500 ppm sulfur ................ 7 67 74 -60 -2 -32 -94Greater than 500 ppm sulfur ................................. 383 12 395 -108 43 -12 -77
Residual Fuel Oil ...................................................... 1,125 3 1,128 1,140 231 118 1,489Less than 0.31 percent sulfur ............................... 372 3 375 71 – 1 720.31 to 1.00 percent sulfur .................................... 294 – 294 114 76 – 190Greater than 1.00 percent sulfur ........................... 459 – 459 955 155 117 1,227
Petrochemical Feedstocks ....................................... 102 – 102 808 – 36 844Naphtha for Petro. Feed. Use ............................... 102 – 102 551 – – 551Other Oils for Petro. Feed. Use ............................ – – – 257 – 36 293
Special Naphthas ..................................................... – 12 12 45 – 10 55Lubricants ................................................................. 206 184 390 – – 124 124Waxes ....................................................................... – 14 14 – – 24 24Petroleum Coke ........................................................ 1,051 6 1,057 4,078 911 889 5,878
Marketable ............................................................ 380 – 380 2,966 737 667 4,370Catalyst ................................................................. 671 6 677 1,112 174 222 1,508
Asphalt and Road Oil ................................................ 449 209 658 2,695 1,277 433 4,405Still Gas .................................................................... 1,318 21 1,339 2,731 648 1,028 4,407Miscellaneous Products ............................................ 78 11 89 330 123 56 509
Total ......................................................................... 19,822 1,497 21,319 46,605 11,622 17,657 75,884
Processing Gain(-) or Loss(+)1 ................................ -1,682 133 -1,549 -4,315 -1,271 -1,204 -6,790
See footnotes at end of table.

Energy Information Administration/Petroleum Supply Monthly,40 April 2018
Table 31. Refinery Net Production of Finished Petroleum Products by PAD and Refining Districts, April 2018(Thousand Barrels) — Continued
Commodity
PAD District 3 - Gulf Coast
PADDistrict 4 -
RockyMountain
PADDistrict 5 -West Coast U.S. Total
TexasInland
Texas GulfCoast
LouisianaGulf Coast
NorthLouisiana,Arkansas
NewMexico Total
Hydrocarbon Gas Liquids ......................................... 752 7,443 6,065 95 65 14,420 412 2,275 24,009Natural Gas Liquids .............................................. 423 4,136 3,233 64 65 7,921 387 1,952 15,367
Ethane .............................................................. 1 138 43 – – 182 – – 182Propane ............................................................ 302 2,240 2,213 21 51 4,827 282 1,021 9,210Normal Butane .................................................. 303 2,171 747 43 14 3,278 136 814 6,366Isobutane .......................................................... -183 -413 230 – – -366 -31 117 -391Natural Gasoline ............................................... – – – – – – – – –
Refinery Olefins .................................................... 329 3,307 2,832 31 – 6,499 25 323 8,642Ethylene ............................................................ – – – – – – – – –Propylene ......................................................... 330 3,365 2,747 31 – 6,473 -4 324 8,573Butylene ............................................................ -1 -35 85 – – 49 29 -1 71Isobutylene ....................................................... – -23 – – – -23 – – -2
Finished Motor Gasoline ........................................... 3,125 11,459 11,040 355 992 26,971 4,013 3,068 46,553Reformulated ........................................................ – – – – – – – 552 1,254
Reformulated Blended with Fuel Ethanol ......... – – – – – – – 552 1,254Reformulated Other .......................................... – – – – – – – – –
Conventional ......................................................... 3,125 11,459 11,040 355 992 26,971 4,013 2,516 45,299Conventional Blended with Fuel Ethanol .......... 2,036 492 1,766 256 537 5,087 2,538 305 12,568
Ed55 and Lower ........................................... 2,029 492 1,766 256 537 5,080 2,538 305 12,561Greater than Ed55 ........................................ 7 – – – – 7 – – 7
Conventional Other ........................................... 1,089 10,967 9,274 99 455 21,884 1,475 2,211 32,731Finished Aviation Gasoline ....................................... 84 60 93 – – 237 3 – 267Kerosene-Type Jet Fuel ........................................... 1,540 14,932 12,448 122 – 29,042 960 13,255 53,929Kerosene .................................................................. -14 3 -36 -2 – -49 – 0 -15Distillate Fuel Oil ....................................................... 5,640 41,541 35,767 2,393 1,783 87,124 5,669 15,207 152,543
15 ppm sulfur and under ....................................... 5,585 39,660 29,970 2,307 1,783 79,305 5,641 14,916 144,107Greater than 15 ppm to 500 ppm sulfur ................ 55 281 1,486 22 – 1,844 34 104 1,962Greater than 500 ppm sulfur ................................. – 1,600 4,311 64 – 5,975 -6 187 6,474
Residual Fuel Oil ...................................................... 297 1,760 5,803 -49 66 7,877 325 3,238 14,057Less than 0.31 percent sulfur ............................... 188 32 926 – – 1,146 192 – 1,7850.31 to 1.00 percent sulfur .................................... – 193 391 -49 20 555 20 664 1,723Greater than 1.00 percent sulfur ........................... 109 1,535 4,486 – 46 6,176 113 2,574 10,549
Petrochemical Feedstocks ....................................... 122 5,241 2,904 6 – 8,273 – 3 9,222Naphtha for Petro. Feed. Use ............................... 111 3,348 1,268 6 – 4,733 – 3 5,389Other Oils for Petro. Feed. Use ............................ 11 1,893 1,636 – – 3,540 – – 3,833
Special Naphthas ..................................................... 41 753 – 229 – 1,023 – 54 1,144Lubricants ................................................................. 22 1,742 1,829 866 – 4,459 – 327 5,300Waxes ....................................................................... – 49 39 17 – 105 – – 143Petroleum Coke ........................................................ 297 8,816 5,209 165 44 14,531 774 4,763 27,003
Marketable ............................................................ 80 6,832 3,897 150 – 10,959 545 3,757 20,011Catalyst ................................................................. 217 1,984 1,312 15 44 3,572 229 1,006 6,992
Asphalt and Road Oil ................................................ 217 384 884 872 84 2,441 1,087 849 9,440Still Gas .................................................................... 683 5,861 4,032 185 74 10,835 633 3,465 20,679Miscellaneous Products ............................................ 112 963 601 21 54 1,751 97 402 2,848
Total ......................................................................... 12,918 101,007 86,678 5,275 3,162 209,040 13,973 46,906 367,122
Processing Gain(-) or Loss(+)1 ................................ -728 -10,117 -7,496 65 -53 -18,329 -854 -5,911 -33,433
– = No Data Reported.1 Represents the arithmetic difference between input and production.
Note: Refer to Appendix A for Refining District descriptions.Source: Energy Information Administration (EIA) Form EIA-810, "Monthly Refinery Report."

Energy Information Administration/Petroleum Supply Monthly, 41 April 2018
Table 31. Refinery Net Production of Finished Petroleum Products by PAD and Refining Districts, April 2018(Thousand Barrels) — Continued
Commodity
PAD District 3 - Gulf Coast
PADDistrict 4 -
RockyMountain
PADDistrict 5 -West Coast U.S. Total
TexasInland
Texas GulfCoast
LouisianaGulf Coast
NorthLouisiana,Arkansas
NewMexico Total
Hydrocarbon Gas Liquids ......................................... 752 7,443 6,065 95 65 14,420 412 2,275 24,009Natural Gas Liquids .............................................. 423 4,136 3,233 64 65 7,921 387 1,952 15,367
Ethane .............................................................. 1 138 43 – – 182 – – 182Propane ............................................................ 302 2,240 2,213 21 51 4,827 282 1,021 9,210Normal Butane .................................................. 303 2,171 747 43 14 3,278 136 814 6,366Isobutane .......................................................... -183 -413 230 – – -366 -31 117 -391Natural Gasoline ............................................... – – – – – – – – –
Refinery Olefins .................................................... 329 3,307 2,832 31 – 6,499 25 323 8,642Ethylene ............................................................ – – – – – – – – –Propylene ......................................................... 330 3,365 2,747 31 – 6,473 -4 324 8,573Butylene ............................................................ -1 -35 85 – – 49 29 -1 71Isobutylene ....................................................... – -23 – – – -23 – – -2
Finished Motor Gasoline ........................................... 3,125 11,459 11,040 355 992 26,971 4,013 3,068 46,553Reformulated ........................................................ – – – – – – – 552 1,254
Reformulated Blended with Fuel Ethanol ......... – – – – – – – 552 1,254Reformulated Other .......................................... – – – – – – – – –
Conventional ......................................................... 3,125 11,459 11,040 355 992 26,971 4,013 2,516 45,299Conventional Blended with Fuel Ethanol .......... 2,036 492 1,766 256 537 5,087 2,538 305 12,568
Ed55 and Lower ........................................... 2,029 492 1,766 256 537 5,080 2,538 305 12,561Greater than Ed55 ........................................ 7 – – – – 7 – – 7
Conventional Other ........................................... 1,089 10,967 9,274 99 455 21,884 1,475 2,211 32,731Finished Aviation Gasoline ....................................... 84 60 93 – – 237 3 – 267Kerosene-Type Jet Fuel ........................................... 1,540 14,932 12,448 122 – 29,042 960 13,255 53,929Kerosene .................................................................. -14 3 -36 -2 – -49 – 0 -15Distillate Fuel Oil ....................................................... 5,640 41,541 35,767 2,393 1,783 87,124 5,669 15,207 152,543
15 ppm sulfur and under ....................................... 5,585 39,660 29,970 2,307 1,783 79,305 5,641 14,916 144,107Greater than 15 ppm to 500 ppm sulfur ................ 55 281 1,486 22 – 1,844 34 104 1,962Greater than 500 ppm sulfur ................................. – 1,600 4,311 64 – 5,975 -6 187 6,474
Residual Fuel Oil ...................................................... 297 1,760 5,803 -49 66 7,877 325 3,238 14,057Less than 0.31 percent sulfur ............................... 188 32 926 – – 1,146 192 – 1,7850.31 to 1.00 percent sulfur .................................... – 193 391 -49 20 555 20 664 1,723Greater than 1.00 percent sulfur ........................... 109 1,535 4,486 – 46 6,176 113 2,574 10,549
Petrochemical Feedstocks ....................................... 122 5,241 2,904 6 – 8,273 – 3 9,222Naphtha for Petro. Feed. Use ............................... 111 3,348 1,268 6 – 4,733 – 3 5,389Other Oils for Petro. Feed. Use ............................ 11 1,893 1,636 – – 3,540 – – 3,833
Special Naphthas ..................................................... 41 753 – 229 – 1,023 – 54 1,144Lubricants ................................................................. 22 1,742 1,829 866 – 4,459 – 327 5,300Waxes ....................................................................... – 49 39 17 – 105 – – 143Petroleum Coke ........................................................ 297 8,816 5,209 165 44 14,531 774 4,763 27,003
Marketable ............................................................ 80 6,832 3,897 150 – 10,959 545 3,757 20,011Catalyst ................................................................. 217 1,984 1,312 15 44 3,572 229 1,006 6,992
Asphalt and Road Oil ................................................ 217 384 884 872 84 2,441 1,087 849 9,440Still Gas .................................................................... 683 5,861 4,032 185 74 10,835 633 3,465 20,679Miscellaneous Products ............................................ 112 963 601 21 54 1,751 97 402 2,848
Total ......................................................................... 12,918 101,007 86,678 5,275 3,162 209,040 13,973 46,906 367,122
Processing Gain(-) or Loss(+)1 ................................ -728 -10,117 -7,496 65 -53 -18,329 -854 -5,911 -33,433
– = No Data Reported.1 Represents the arithmetic difference between input and production.
Note: Refer to Appendix A for Refining District descriptions.Source: Energy Information Administration (EIA) Form EIA-810, "Monthly Refinery Report."
Table 32. Blender Net Inputs of Petroleum Products by PAD District, April 2018(Thousand Barrels)
Commodity
PAD District 1 - East Coast PAD District 2 - Midwest
East CoastAppalachian
No. 1 TotalIndiana, Illinois,
Kentucky
Minnesota,Wisconsin,
North and SouthDakota
Oklahoma,Kansas,Missouri Total
Hydrocarbon Gas Liquids ...................................... 537 24 561 196 36 208 440Natural Gas Liquids .............................................. 537 24 561 196 36 208 440
Normal Butane .................................................. 463 24 487 196 29 164 389Isobutane .......................................................... – – – – – – –Natural Gasoline ............................................... 74 – 74 – 7 44 51
Other Liquids .......................................................... 88,823 6,152 94,975 44,080 8,027 13,436 65,543Oxygenates/Renewables ...................................... 9,537 653 10,190 4,783 979 1,490 7,252
Oxygenates (excluding Fuel Ethanol) ............... – – – – – – –Methyl Tertiary Butyl Ether (MTBE) .............. – – – – – – –All Other Oxygenates1 .................................. – – – – – – –
Renewable Fuels (including Fuel Ethanol) ....... 9,537 653 10,190 4,783 979 1,490 7,252Fuel Ethanol ................................................. 9,278 614 9,892 4,591 882 1,436 6,909Renewable Diesel Fuel ................................. 259 39 298 192 97 54 343Other Renewable Fuels ................................ – – – – – – –
Unfinished Oils (net) ............................................. – – – 115 – – 115Naphthas and Lighter ....................................... – – – – – – –Kerosene and Light Gas Oils ............................ – – – – – – –Heavy Gas Oils ................................................. – – – – – – –Residuum ......................................................... – – – 115 – – 115
Motor Gasoline Blend.Comp. (MGBC)(net) .......... 79,286 5,499 84,785 39,182 7,048 11,946 58,176Reformulated - RBOB ....................................... 21,888 96 21,984 7,191 1,343 996 9,530Conventional ..................................................... 57,398 5,403 62,801 31,991 5,705 10,950 48,646
CBOB ........................................................... 43,215 5,403 48,618 31,970 5,705 10,948 48,623GTAB ............................................................ 5,021 – 5,021 – – – –Other ............................................................. 9,162 – 9,162 21 – 2 23
Aviation Gasoline Blend. Comp. (net) .................. – – – – – – –Total Input ............................................................... 89,360 6,176 95,536 44,276 8,063 13,644 65,983
Commodity
PAD District 3 - Gulf Coast
PADDistrict 4 -
RockyMountain
PADDistrict 5 -West Coast U.S. Total
TexasInland
Texas GulfCoast
LouisianaGulf Coast
NorthLouisiana,Arkansas
NewMexico Total
Hydrocarbon Gas Liquids ...................................... 17 366 20 20 – 423 53 67 1,544Natural Gas Liquids .............................................. 17 366 20 20 – 423 53 67 1,544
Normal Butane .................................................. 13 58 20 20 – 111 36 67 1,090Isobutane .......................................................... – – – – – – 1 – 1Natural Gasoline ............................................... 4 308 – – – 312 16 – 453
Other Liquids .......................................................... 17,551 10,802 2,756 9,027 1,086 41,222 4,670 45,280 251,690Oxygenates/Renewables ...................................... 1,873 863 288 1,008 129 4,161 614 4,989 27,206
Oxygenates (excluding Fuel Ethanol) ............... – – – – – – – – –Methyl Tertiary Butyl Ether (MTBE) .............. – – – – – – – – –All Other Oxygenates1 .................................. – – – – – – – – –
Renewable Fuels (including Fuel Ethanol) ....... 1,873 863 288 1,008 129 4,161 614 4,989 27,206Fuel Ethanol ................................................. 1,801 789 288 986 107 3,971 605 4,705 26,082Renewable Diesel Fuel ................................. 72 74 – 22 22 190 9 281 1,121Other Renewable Fuels ................................ – – – – – – – 3 3
Unfinished Oils (net) ............................................. – -163 -106 – – -269 – – -154Naphthas and Lighter ....................................... – – – – – – – – –Kerosene and Light Gas Oils ............................ – -163 12 – – -151 – – -151Heavy Gas Oils ................................................. – – -118 – – -118 – – -118Residuum ......................................................... – – – – – – – – 115
Motor Gasoline Blend.Comp. (MGBC)(net) .......... 15,678 10,102 2,574 8,019 957 37,330 4,056 40,291 224,638Reformulated - RBOB ....................................... 6,461 4,602 – – – 11,063 – 29,983 72,560Conventional ..................................................... 9,217 5,500 2,574 8,019 957 26,267 4,056 10,308 152,078
CBOB ........................................................... 9,217 -1,153 1,499 8,009 957 18,529 4,055 10,143 129,968GTAB ............................................................ – – – – – – – – 5,021Other ............................................................. – 6,653 1,075 10 – 7,738 1 165 17,089
Aviation Gasoline Blend. Comp. (net) .................. – – – – – – – – –Total Input ............................................................... 17,568 11,168 2,776 9,047 1,086 41,645 4,723 45,347 253,234
– = No Data Reported.1 Includes ethyl tertiary butyl ether (ETBE), tertiary amyl methyl ether (TAME), tertiary butyl alcohol (TBA), and other aliphatic alcohols and ethers intended for motor gasoline blending (e.g., isopropyl ether (IPE) or
n-propanol).Note: Refer to Appendix A for Refining District descriptions.Sources: Energy Information Administration (EIA) Form EIA-815, "Monthly Bulk Terminal and Blender Report."

Energy Information Administration/Petroleum Supply Monthly,42 April 2018
Table 33. Blender Net Production of Petroleum Products by PAD District, April 2018(Thousand Barrels)
Commodity
PAD District 1 - East Coast PAD District 2 - Midwest
East CoastAppalachian
No. 1 TotalIndiana, Illinois,
Kentucky
Minnesota,Wisconsin,
North and SouthDakota
Oklahoma,Kansas,Missouri Total
Finished Motor Gasoline ........................................... 89,282 6,137 95,419 43,893 7,968 13,592 65,453Reformulated ........................................................ 37,930 105 38,035 8,262 1,483 1,107 10,852
Reformulated Blended with Fuel Ethanol ......... 37,930 105 38,035 8,262 1,483 1,107 10,852Reformulated Other .......................................... – – – – – – –
Conventional ......................................................... 51,352 6,032 57,384 35,631 6,485 12,485 54,601Conventional Blended with Fuel Ethanol .......... 54,356 6,046 60,402 37,129 7,219 12,840 57,188
Ed55 and Lower ........................................... 54,318 6,046 60,364 37,117 7,196 12,772 57,085Greater than Ed55 ........................................ 38 – 38 12 23 68 103
Conventional Other ........................................... -3,004 -14 -3,018 -1,498 -734 -355 -2,587Finished Aviation Gasoline ....................................... – – – – – – –Kerosene-Type Jet Fuel ........................................... -1 – -1 – – – –Kerosene .................................................................. -2 – -2 – – – –Distillate Fuel Oil ....................................................... 113 39 152 272 95 52 419
15 ppm sulfur and under ....................................... 109 39 148 272 95 52 419Greater than 15 ppm to 500 ppm sulfur ................ 26 – 26 – – 104 104Greater than 500 ppm sulfur ................................. -22 – -22 – – -104 -104
Residual Fuel Oil ...................................................... -34 – -34 – – – –Less than 0.31 percent sulfur ............................... -30 – -30 – – – –0.31 to 1.00 percent sulfur .................................... 3 – 3 – – – –Greater than 1.00 percent sulfur ........................... -7 – -7 – – – –
Special Naphthas ..................................................... – – – – – – –Lubricants ................................................................. – – – – – – –Asphalt and Road Oil ................................................ – – – 115 – – 115Miscellaneous Products ............................................ – – – – – – –
Total Production ..................................................... 89,358 6,176 95,534 44,280 8,063 13,644 65,987
Processing Gain(-) or Loss(+)1 ................................ 2 0 2 -4 0 0 -4
Commodity
PAD District 3 - Gulf Coast
PADDistrict 4 -
RockyMountain
PADDistrict 5 -West Coast U.S. Total
TexasInland
Texas GulfCoast
LouisianaGulf Coast
NorthLouisiana,Arkansas
NewMexico Total
Finished Motor Gasoline ........................................... 17,495 11,257 2,882 9,021 1,064 41,719 4,713 45,062 252,366Reformulated ........................................................ 7,172 6,545 – – – 13,717 – 33,564 96,168
Reformulated Blended with Fuel Ethanol ......... 7,172 6,545 – – – 13,717 – 33,564 96,168Reformulated Other .......................................... – – – – – – – – –
Conventional ......................................................... 10,323 4,712 2,882 9,021 1,064 28,002 4,713 11,498 156,198Conventional Blended with Fuel Ethanol .......... 10,569 1,216 2,851 9,775 1,094 25,505 6,006 13,364 162,465
Ed55 and Lower ........................................... 10,558 1,216 2,851 9,760 1,094 25,479 5,993 13,362 162,283Greater than Ed55 ........................................ 11 – – 15 – 26 13 2 182
Conventional Other ........................................... -246 3,496 31 -754 -30 2,497 -1,293 -1,866 -6,267Finished Aviation Gasoline ....................................... – – – – – – – – –Kerosene-Type Jet Fuel ........................................... – 0 6 – – 6 40 -23 22Kerosene .................................................................. – – 2 – – 2 – 8 8Distillate Fuel Oil ....................................................... 73 88 -8 22 22 197 -31 290 1,027
15 ppm sulfur and under ....................................... 73 43 -8 22 22 152 -31 275 963Greater than 15 ppm to 500 ppm sulfur ................ – – – – – – – – 130Greater than 500 ppm sulfur ................................. – 45 – – – 45 – 15 -66
Residual Fuel Oil ...................................................... – -177 -344 – – -521 – 11 -544Less than 0.31 percent sulfur ............................... – 78 -7 – – 71 – 11 520.31 to 1.00 percent sulfur .................................... – -78 – – – -78 – – -75Greater than 1.00 percent sulfur ........................... – -177 -337 – – -514 – – -521
Special Naphthas ..................................................... – – – – – – – – –Lubricants ................................................................. – – – – – – – – –Asphalt and Road Oil ................................................ – – 238 – – 238 – – 353Miscellaneous Products ............................................ – – – – – – – – –
Total Production ..................................................... 17,568 11,168 2,776 9,043 1,086 41,641 4,722 45,348 253,232
Processing Gain(-) or Loss(+)1 ................................ 0 0 0 4 0 4 1 -1 2
– = No Data Reported.1 Represents the arithmetic difference between input and production.
Note: Refer to Appendix A for Refining District descriptions.Sources: Energy Information Administration (EIA) Form EIA-815, "Monthly Bulk Terminal and Blender Report."

Energy Information Administration/Petroleum Supply Monthly, 43 April 2018
Table 33. Blender Net Production of Petroleum Products by PAD District, April 2018(Thousand Barrels)
Commodity
PAD District 1 - East Coast PAD District 2 - Midwest
East CoastAppalachian
No. 1 TotalIndiana, Illinois,
Kentucky
Minnesota,Wisconsin,
North and SouthDakota
Oklahoma,Kansas,Missouri Total
Finished Motor Gasoline ........................................... 89,282 6,137 95,419 43,893 7,968 13,592 65,453Reformulated ........................................................ 37,930 105 38,035 8,262 1,483 1,107 10,852
Reformulated Blended with Fuel Ethanol ......... 37,930 105 38,035 8,262 1,483 1,107 10,852Reformulated Other .......................................... – – – – – – –
Conventional ......................................................... 51,352 6,032 57,384 35,631 6,485 12,485 54,601Conventional Blended with Fuel Ethanol .......... 54,356 6,046 60,402 37,129 7,219 12,840 57,188
Ed55 and Lower ........................................... 54,318 6,046 60,364 37,117 7,196 12,772 57,085Greater than Ed55 ........................................ 38 – 38 12 23 68 103
Conventional Other ........................................... -3,004 -14 -3,018 -1,498 -734 -355 -2,587Finished Aviation Gasoline ....................................... – – – – – – –Kerosene-Type Jet Fuel ........................................... -1 – -1 – – – –Kerosene .................................................................. -2 – -2 – – – –Distillate Fuel Oil ....................................................... 113 39 152 272 95 52 419
15 ppm sulfur and under ....................................... 109 39 148 272 95 52 419Greater than 15 ppm to 500 ppm sulfur ................ 26 – 26 – – 104 104Greater than 500 ppm sulfur ................................. -22 – -22 – – -104 -104
Residual Fuel Oil ...................................................... -34 – -34 – – – –Less than 0.31 percent sulfur ............................... -30 – -30 – – – –0.31 to 1.00 percent sulfur .................................... 3 – 3 – – – –Greater than 1.00 percent sulfur ........................... -7 – -7 – – – –
Special Naphthas ..................................................... – – – – – – –Lubricants ................................................................. – – – – – – –Asphalt and Road Oil ................................................ – – – 115 – – 115Miscellaneous Products ............................................ – – – – – – –
Total Production ..................................................... 89,358 6,176 95,534 44,280 8,063 13,644 65,987
Processing Gain(-) or Loss(+)1 ................................ 2 0 2 -4 0 0 -4
Commodity
PAD District 3 - Gulf Coast
PADDistrict 4 -
RockyMountain
PADDistrict 5 -West Coast U.S. Total
TexasInland
Texas GulfCoast
LouisianaGulf Coast
NorthLouisiana,Arkansas
NewMexico Total
Finished Motor Gasoline ........................................... 17,495 11,257 2,882 9,021 1,064 41,719 4,713 45,062 252,366Reformulated ........................................................ 7,172 6,545 – – – 13,717 – 33,564 96,168
Reformulated Blended with Fuel Ethanol ......... 7,172 6,545 – – – 13,717 – 33,564 96,168Reformulated Other .......................................... – – – – – – – – –
Conventional ......................................................... 10,323 4,712 2,882 9,021 1,064 28,002 4,713 11,498 156,198Conventional Blended with Fuel Ethanol .......... 10,569 1,216 2,851 9,775 1,094 25,505 6,006 13,364 162,465
Ed55 and Lower ........................................... 10,558 1,216 2,851 9,760 1,094 25,479 5,993 13,362 162,283Greater than Ed55 ........................................ 11 – – 15 – 26 13 2 182
Conventional Other ........................................... -246 3,496 31 -754 -30 2,497 -1,293 -1,866 -6,267Finished Aviation Gasoline ....................................... – – – – – – – – –Kerosene-Type Jet Fuel ........................................... – 0 6 – – 6 40 -23 22Kerosene .................................................................. – – 2 – – 2 – 8 8Distillate Fuel Oil ....................................................... 73 88 -8 22 22 197 -31 290 1,027
15 ppm sulfur and under ....................................... 73 43 -8 22 22 152 -31 275 963Greater than 15 ppm to 500 ppm sulfur ................ – – – – – – – – 130Greater than 500 ppm sulfur ................................. – 45 – – – 45 – 15 -66
Residual Fuel Oil ...................................................... – -177 -344 – – -521 – 11 -544Less than 0.31 percent sulfur ............................... – 78 -7 – – 71 – 11 520.31 to 1.00 percent sulfur .................................... – -78 – – – -78 – – -75Greater than 1.00 percent sulfur ........................... – -177 -337 – – -514 – – -521
Special Naphthas ..................................................... – – – – – – – – –Lubricants ................................................................. – – – – – – – – –Asphalt and Road Oil ................................................ – – 238 – – 238 – – 353Miscellaneous Products ............................................ – – – – – – – – –
Total Production ..................................................... 17,568 11,168 2,776 9,043 1,086 41,641 4,722 45,348 253,232
Processing Gain(-) or Loss(+)1 ................................ 0 0 0 4 0 4 1 -1 2
– = No Data Reported.1 Represents the arithmetic difference between input and production.
Note: Refer to Appendix A for Refining District descriptions.Sources: Energy Information Administration (EIA) Form EIA-815, "Monthly Bulk Terminal and Blender Report."
Table 34. Refinery Stocks of Crude Oil and Petroleum Products by PAD and Refining Districts, April 2018(Thousand Barrels)
Commodity
PAD District 1 - East Coast PAD District 2 - Midwest
East CoastAppalachian
No. 1 TotalIndiana, Illinois,
Kentucky
Minnesota,Wisconsin,North and
South Dakota
Oklahoma,Kansas,Missouri Total
Crude Oil ..................................................................... 12,297 636 12,933 9,671 2,243 1,865 13,779
Petroleum Products ................................................... 15,494 2,305 17,799 29,488 10,053 10,952 50,493Hydrocarbon Gas Liquids ......................................... 630 20 650 2,251 398 832 3,481
Natural Gas Liquids .............................................. 475 20 495 1,821 372 823 3,016Ethane .............................................................. – – – – – – –Propane ............................................................ 85 5 90 430 41 174 645Normal Butane .................................................. 283 2 285 1,156 286 154 1,596Isobutane .......................................................... 107 13 120 201 45 133 379Natural Gasoline ............................................... – – – 34 – 362 396
Refinery Olefins .................................................... 155 0 155 430 26 9 465Ethylene ............................................................ – – – – – – –Propylene ......................................................... 88 0 88 298 26 9 333Butylene ............................................................ 40 0 40 132 0 0 132Isobutylene ....................................................... 27 0 27 0 0 0 0
Oxygenates/Renewable Fuels/Other Hydrocarbons .... 51 78 129 105 58 30 193Oxygenates (excluding Fuel Ethanol) ....................... – – – – – – –
Methyl Tertiary Butyl Ether (MTBE) ...................... – – – – – – –All Other Oxygenates1 .......................................... – – – – – – –
Renewable Fuels (including Fuel Ethanol) ............... 51 78 129 74 58 30 162Fuel Ethanol ......................................................... 51 72 123 57 52 28 137Renewable Diesel Fuel ......................................... – 6 6 17 6 2 25Other Renewable Fuels ........................................ – – – – – – –
Other Hydrocarbons ................................................. – – – 31 – – 31Unfinished Oils ............................................................. 5,106 465 5,571 8,584 828 3,735 13,147
Naphthas and Lighter ............................................... 942 333 1,275 2,288 186 1,054 3,528Kerosene and Light Gas Oils .................................... 651 – 651 2,520 290 587 3,397Heavy Gas Oils ......................................................... 2,343 127 2,470 2,344 348 1,347 4,039Residuum ................................................................. 1,170 5 1,175 1,432 4 747 2,183
Motor Gasoline Blending Components (MGBC) ........... 5,327 228 5,555 7,935 2,769 3,153 13,857Reformulated - RBOB ............................................... 1,488 – 1,488 993 – – 993Conventional ............................................................. 3,839 228 4,067 6,942 2,769 3,153 12,864
CBOB ................................................................... 478 132 610 2,990 1,500 2,221 6,711GTAB .................................................................... – – – – – – –Other ..................................................................... 3,361 96 3,457 3,952 1,269 932 6,153
Aviation Gasoline Blending Components ..................... – – – – – – –Finished Motor Gasoline ............................................... – 27 27 905 211 328 1,444
Reformulated ............................................................ – – – – – – –Reformulated Blended with Fuel Ethanol ............. – – – – – – –Reformulated Other .............................................. – – – – – – –
Conventional ............................................................. – 27 27 905 211 328 1,444Conventional Blended with Fuel Ethanol .............. – – – – – – –
Ed55 and Lower ............................................... – – – – – – –Greater than Ed55 ............................................ – – – – – – –
Conventional Other ............................................... – 27 27 905 211 328 1,444Finished Aviation Gasoline ........................................... – – – – 93 – 93Kerosene-Type Jet Fuel ............................................... 576 – 576 1,444 338 275 2,057Kerosene ...................................................................... 178 2 180 68 – 11 79Distillate Fuel Oil ........................................................... 2,592 256 2,848 3,871 1,265 1,686 6,822
15 ppm sulfur and under ........................................... 1,974 123 2,097 3,655 1,106 1,568 6,329Greater than 15 ppm to 500 ppm sulfur .................... 41 105 146 – 63 28 91Greater than 500 ppm sulfur ..................................... 577 28 605 216 96 90 402
Residual Fuel Oil .......................................................... 431 20 451 799 186 63 1,048Less than 0.31 percent sulfur ................................... 184 18 202 70 – – 700.31 to 1.00 percent sulfur ........................................ 42 2 44 87 27 – 114Greater than 1.00 percent sulfur ............................... 205 – 205 642 159 63 864
Petrochemical Feedstocks ........................................... 91 – 91 536 – – 536Naphtha for Petro. Feed. Use ................................... 91 – 91 365 – – 365Other Oils for Petro. Feed. Use ................................ – – – 171 – – 171
Special Naphthas ......................................................... – 15 15 49 – 14 63Lubricants ..................................................................... 349 210 559 – – 218 218Waxes ........................................................................... – 497 497 – – 39 39Petroleum Coke ............................................................ – – – 604 1,606 61 2,271
Marketable ................................................................ – – – 604 1,606 61 2,271Catalyst ..................................................................... – – – – – – –
Asphalt and Road Oil .................................................... 147 468 615 2,249 2,264 500 5,013Miscellaneous Products ................................................ 16 19 35 88 37 7 132
Total Stocks, All Oils .................................................. 27,791 2,941 30,732 39,159 12,296 12,817 64,272
See footnotes at end of table.

Energy Information Administration/Petroleum Supply Monthly,44 April 2018
Table 34. Refinery Stocks of Crude Oil and Petroleum Products by PAD and Refining Districts, April 2018(Thousand Barrels) — Continued
Commodity
PAD District 3 - Gulf Coast
PADDistrict 4 -
RockyMountain
PADDistrict 5 -
West Coast U.S. TotalTexasInland
Texas GulfCoast
LouisianaGulf Coast
NorthLouisiana,Arkansas
NewMexico Total
Crude Oil ..................................................................... 1,848 26,914 17,737 1,216 358 48,073 2,839 22,990 100,614
Petroleum Products ................................................... 9,404 58,658 49,868 3,923 1,395 123,248 10,984 53,235 255,759Hydrocarbon Gas Liquids ......................................... 2,182 1,824 4,072 14 50 8,142 442 1,462 14,177
Natural Gas Liquids .............................................. 1,663 1,517 2,806 13 50 6,049 401 1,420 11,381Ethane .............................................................. 407 – – – – 407 – – 407Propane ............................................................ 500 177 166 2 5 850 49 94 1,728Normal Butane .................................................. 434 1,078 1,359 6 29 2,906 226 764 5,777Isobutane .......................................................... 239 237 933 5 12 1,426 94 561 2,580Natural Gasoline ............................................... 83 25 348 – 4 460 32 1 889
Refinery Olefins .................................................... 519 307 1,266 1 0 2,093 41 42 2,796Ethylene ............................................................ 0 – – – – 0 – – 0Propylene ......................................................... 519 55 265 1 0 840 0 38 1,299Butylene ............................................................ 0 252 1,001 0 0 1,253 41 4 1,470Isobutylene ....................................................... 0 0 0 0 0 0 0 0 27
Oxygenates/Renewable Fuels/Other Hydrocarbons .... 37 71 251 69 11 439 142 327 1,230Oxygenates (excluding Fuel Ethanol) ....................... – – – – – – – – –
Methyl Tertiary Butyl Ether (MTBE) ...................... – – – – – – – – –All Other Oxygenates1 .......................................... – – – – – – – – –
Renewable Fuels (including Fuel Ethanol) ............... 37 71 251 69 11 439 142 327 1,199Fuel Ethanol ......................................................... 29 43 73 28 8 181 135 38 614Renewable Diesel Fuel ......................................... 8 28 178 41 3 258 7 289 585Other Renewable Fuels ........................................ – – – – – – – – –
Other Hydrocarbons ................................................. – – – – – – – – 31Unfinished Oils ............................................................. 2,707 21,187 15,450 1,006 573 40,923 3,299 20,703 83,643
Naphthas and Lighter ............................................... 632 6,210 2,741 289 224 10,096 756 3,618 19,273Kerosene and Light Gas Oils .................................... 850 3,453 2,584 285 165 7,337 694 4,198 16,277Heavy Gas Oils ......................................................... 433 9,487 7,979 373 184 18,456 1,244 10,332 36,541Residuum ................................................................. 792 2,037 2,146 59 – 5,034 605 2,555 11,552
Motor Gasoline Blending Components (MGBC) ........... 2,330 11,392 12,645 268 308 26,943 2,878 14,117 63,350Reformulated - RBOB ............................................... 201 1,255 327 – – 1,783 – 5,200 9,464Conventional ............................................................. 2,129 10,137 12,318 268 308 25,160 2,878 8,917 53,886
CBOB ................................................................... 1,032 3,173 6,005 200 12 10,422 1,519 2,334 21,596GTAB .................................................................... – – – – – – – – –Other ..................................................................... 1,097 6,964 6,313 68 296 14,738 1,359 6,583 32,290
Aviation Gasoline Blending Components ..................... 34 – 11 – – 45 – – 45Finished Motor Gasoline ............................................... 301 1,377 1,131 10 82 2,901 671 1,161 6,204
Reformulated ............................................................ – – – – – – – 17 17Reformulated Blended with Fuel Ethanol ............. – – – – – – – 17 17Reformulated Other .............................................. – – – – – – – – –
Conventional ............................................................. 301 1,377 1,131 10 82 2,901 671 1,144 6,187Conventional Blended with Fuel Ethanol .............. – – – – – – 48 – 48
Ed55 and Lower ............................................... – – – – – – 48 – 48Greater than Ed55 ............................................ – – – – – – – – –
Conventional Other ............................................... 301 1,377 1,131 10 82 2,901 623 1,144 6,139Finished Aviation Gasoline ........................................... 39 92 147 – – 278 7 108 486Kerosene-Type Jet Fuel ............................................... 310 3,766 2,355 71 – 6,502 308 4,262 13,705Kerosene ...................................................................... 26 9 55 4 – 94 2 3 358Distillate Fuel Oil ........................................................... 710 7,300 7,102 375 129 15,616 1,794 5,555 32,635
15 ppm sulfur and under ........................................... 633 6,433 5,331 237 129 12,763 1,606 4,795 27,590Greater than 15 ppm to 500 ppm sulfur .................... 77 123 496 41 – 737 136 204 1,314Greater than 500 ppm sulfur ..................................... – 744 1,275 97 – 2,116 52 556 3,731
Residual Fuel Oil .......................................................... 104 2,595 1,824 27 84 4,634 279 2,375 8,787Less than 0.31 percent sulfur ................................... 4 – 209 – – 213 30 – 5150.31 to 1.00 percent sulfur ........................................ – 175 67 27 4 273 39 569 1,039Greater than 1.00 percent sulfur ............................... 100 2,420 1,548 – 80 4,148 210 1,806 7,233
Petrochemical Feedstocks ........................................... 108 1,618 600 19 – 2,345 – 2 2,974Naphtha for Petro. Feed. Use ................................... 35 938 456 19 – 1,448 – 2 1,906Other Oils for Petro. Feed. Use ................................ 73 680 144 – – 897 – – 1,068
Special Naphthas ......................................................... 28 695 – 117 – 840 – 35 953Lubricants ..................................................................... 53 2,421 2,183 795 – 5,452 – 641 6,870Waxes ........................................................................... – 88 134 39 – 261 – – 797Petroleum Coke ............................................................ 4 3,794 1,175 – – 4,973 111 1,405 8,760
Marketable ................................................................ 4 3,794 1,175 – – 4,973 111 1,405 8,760Catalyst ..................................................................... – – – – – – – – –
Asphalt and Road Oil .................................................... 403 244 645 1,108 128 2,528 1,034 975 10,165Miscellaneous Products ................................................ 28 185 88 1 30 332 17 104 620
Total Stocks, All Oils .................................................. 11,252 85,572 67,605 5,139 1,753 171,321 13,823 76,225 356,373
– = No Data Reported.1 Includes ethyl tertiary butyl ether (ETBE), tertiary amyl methyl ether (TAME), tertiary butyl alcohol (TBA), and other aliphatic alcohols and ethers intended for motor gasoline blending (e.g., isopropyl ether (IPE) or
n-propanol).Note: Refer to Appendix A for Refining District descriptions.Source: Energy Information Administration (EIA) Form EIA-810, "Monthly Refinery Report."

Energy Information Administration/Petroleum Supply Monthly, 45 April 2018
Table 34. Refinery Stocks of Crude Oil and Petroleum Products by PAD and Refining Districts, April 2018(Thousand Barrels) — Continued
Commodity
PAD District 3 - Gulf Coast
PADDistrict 4 -
RockyMountain
PADDistrict 5 -
West Coast U.S. TotalTexasInland
Texas GulfCoast
LouisianaGulf Coast
NorthLouisiana,Arkansas
NewMexico Total
Crude Oil ..................................................................... 1,848 26,914 17,737 1,216 358 48,073 2,839 22,990 100,614
Petroleum Products ................................................... 9,404 58,658 49,868 3,923 1,395 123,248 10,984 53,235 255,759Hydrocarbon Gas Liquids ......................................... 2,182 1,824 4,072 14 50 8,142 442 1,462 14,177
Natural Gas Liquids .............................................. 1,663 1,517 2,806 13 50 6,049 401 1,420 11,381Ethane .............................................................. 407 – – – – 407 – – 407Propane ............................................................ 500 177 166 2 5 850 49 94 1,728Normal Butane .................................................. 434 1,078 1,359 6 29 2,906 226 764 5,777Isobutane .......................................................... 239 237 933 5 12 1,426 94 561 2,580Natural Gasoline ............................................... 83 25 348 – 4 460 32 1 889
Refinery Olefins .................................................... 519 307 1,266 1 0 2,093 41 42 2,796Ethylene ............................................................ 0 – – – – 0 – – 0Propylene ......................................................... 519 55 265 1 0 840 0 38 1,299Butylene ............................................................ 0 252 1,001 0 0 1,253 41 4 1,470Isobutylene ....................................................... 0 0 0 0 0 0 0 0 27
Oxygenates/Renewable Fuels/Other Hydrocarbons .... 37 71 251 69 11 439 142 327 1,230Oxygenates (excluding Fuel Ethanol) ....................... – – – – – – – – –
Methyl Tertiary Butyl Ether (MTBE) ...................... – – – – – – – – –All Other Oxygenates1 .......................................... – – – – – – – – –
Renewable Fuels (including Fuel Ethanol) ............... 37 71 251 69 11 439 142 327 1,199Fuel Ethanol ......................................................... 29 43 73 28 8 181 135 38 614Renewable Diesel Fuel ......................................... 8 28 178 41 3 258 7 289 585Other Renewable Fuels ........................................ – – – – – – – – –
Other Hydrocarbons ................................................. – – – – – – – – 31Unfinished Oils ............................................................. 2,707 21,187 15,450 1,006 573 40,923 3,299 20,703 83,643
Naphthas and Lighter ............................................... 632 6,210 2,741 289 224 10,096 756 3,618 19,273Kerosene and Light Gas Oils .................................... 850 3,453 2,584 285 165 7,337 694 4,198 16,277Heavy Gas Oils ......................................................... 433 9,487 7,979 373 184 18,456 1,244 10,332 36,541Residuum ................................................................. 792 2,037 2,146 59 – 5,034 605 2,555 11,552
Motor Gasoline Blending Components (MGBC) ........... 2,330 11,392 12,645 268 308 26,943 2,878 14,117 63,350Reformulated - RBOB ............................................... 201 1,255 327 – – 1,783 – 5,200 9,464Conventional ............................................................. 2,129 10,137 12,318 268 308 25,160 2,878 8,917 53,886
CBOB ................................................................... 1,032 3,173 6,005 200 12 10,422 1,519 2,334 21,596GTAB .................................................................... – – – – – – – – –Other ..................................................................... 1,097 6,964 6,313 68 296 14,738 1,359 6,583 32,290
Aviation Gasoline Blending Components ..................... 34 – 11 – – 45 – – 45Finished Motor Gasoline ............................................... 301 1,377 1,131 10 82 2,901 671 1,161 6,204
Reformulated ............................................................ – – – – – – – 17 17Reformulated Blended with Fuel Ethanol ............. – – – – – – – 17 17Reformulated Other .............................................. – – – – – – – – –
Conventional ............................................................. 301 1,377 1,131 10 82 2,901 671 1,144 6,187Conventional Blended with Fuel Ethanol .............. – – – – – – 48 – 48
Ed55 and Lower ............................................... – – – – – – 48 – 48Greater than Ed55 ............................................ – – – – – – – – –
Conventional Other ............................................... 301 1,377 1,131 10 82 2,901 623 1,144 6,139Finished Aviation Gasoline ........................................... 39 92 147 – – 278 7 108 486Kerosene-Type Jet Fuel ............................................... 310 3,766 2,355 71 – 6,502 308 4,262 13,705Kerosene ...................................................................... 26 9 55 4 – 94 2 3 358Distillate Fuel Oil ........................................................... 710 7,300 7,102 375 129 15,616 1,794 5,555 32,635
15 ppm sulfur and under ........................................... 633 6,433 5,331 237 129 12,763 1,606 4,795 27,590Greater than 15 ppm to 500 ppm sulfur .................... 77 123 496 41 – 737 136 204 1,314Greater than 500 ppm sulfur ..................................... – 744 1,275 97 – 2,116 52 556 3,731
Residual Fuel Oil .......................................................... 104 2,595 1,824 27 84 4,634 279 2,375 8,787Less than 0.31 percent sulfur ................................... 4 – 209 – – 213 30 – 5150.31 to 1.00 percent sulfur ........................................ – 175 67 27 4 273 39 569 1,039Greater than 1.00 percent sulfur ............................... 100 2,420 1,548 – 80 4,148 210 1,806 7,233
Petrochemical Feedstocks ........................................... 108 1,618 600 19 – 2,345 – 2 2,974Naphtha for Petro. Feed. Use ................................... 35 938 456 19 – 1,448 – 2 1,906Other Oils for Petro. Feed. Use ................................ 73 680 144 – – 897 – – 1,068
Special Naphthas ......................................................... 28 695 – 117 – 840 – 35 953Lubricants ..................................................................... 53 2,421 2,183 795 – 5,452 – 641 6,870Waxes ........................................................................... – 88 134 39 – 261 – – 797Petroleum Coke ............................................................ 4 3,794 1,175 – – 4,973 111 1,405 8,760
Marketable ................................................................ 4 3,794 1,175 – – 4,973 111 1,405 8,760Catalyst ..................................................................... – – – – – – – – –
Asphalt and Road Oil .................................................... 403 244 645 1,108 128 2,528 1,034 975 10,165Miscellaneous Products ................................................ 28 185 88 1 30 332 17 104 620
Total Stocks, All Oils .................................................. 11,252 85,572 67,605 5,139 1,753 171,321 13,823 76,225 356,373
– = No Data Reported.1 Includes ethyl tertiary butyl ether (ETBE), tertiary amyl methyl ether (TAME), tertiary butyl alcohol (TBA), and other aliphatic alcohols and ethers intended for motor gasoline blending (e.g., isopropyl ether (IPE) or
n-propanol).Note: Refer to Appendix A for Refining District descriptions.Source: Energy Information Administration (EIA) Form EIA-810, "Monthly Refinery Report."
Table 35. Percent Yield of Petroleum Products by PAD and Refining Districts, April 2018
Commodity
PAD District 1 - East Coast PAD District 2 - Midwest
East CoastAppalachian
No. 1 TotalIndiana, Illinois,
Kentucky
Minnesota,Wisconsin,
North and SouthDakota
Oklahoma,Kansas,Missouri Total
Hydrocarbon Gas Liquids ......................................... 4.4 0.1 4.2 5.4 3.6 3.0 4.6Finished Motor Gasoline1 ......................................... 47.9 30.3 47.1 51.7 49.5 49.0 50.8Finished Aviation Gasoline2 ..................................... – – – – 0.2 – 0.0Kerosene-Type Jet Fuel ........................................... 9.3 – 8.9 7.6 6.1 3.6 6.5Kerosene .................................................................. 0.1 – 0.1 0.0 – 0.0 0.0Distillate Fuel Oil3 ..................................................... 30.5 28.9 30.4 25.2 29.1 38.7 28.8Residual Fuel Oil ...................................................... 3.4 0.2 3.2 1.5 1.4 0.4 1.3Naphtha for Petro. Feed. Use ................................... 0.3 – 0.3 0.7 – – 0.5Other Oils for Petro. Feed. Use ................................ – – – 0.4 – 0.1 0.3Special Naphthas ..................................................... – 0.8 0.0 0.1 – 0.0 0.1Lubricants ................................................................. 0.6 12.7 1.1 – – 0.5 0.1Waxes ....................................................................... – 1.0 0.0 – – 0.1 0.0Petroleum Coke ........................................................ 3.1 0.4 3.0 5.5 5.5 3.3 5.0Asphalt and Road Oil ................................................ 1.3 14.4 1.9 3.6 7.7 1.6 3.8Still Gas .................................................................... 3.9 1.4 3.8 3.7 3.9 3.9 3.8Miscellaneous Products ............................................ 0.2 0.8 0.3 0.5 0.8 0.2 0.4
Processing Gain(-) or Loss(+)4 ................................ -5.0 9.2 -4.4 -5.8 -7.7 -4.5 -5.8
Commodity
PAD District 3 - Gulf Coast
PADDistrict 4 -
RockyMountain
PADDistrict 5 -West Coast U.S. Total
TexasInland
Texas GulfCoast
LouisianaGulf Coast
NorthLouisiana,Arkansas
NewMexico Total
Hydrocarbon Gas Liquids ......................................... 3.8 5.4 5.4 1.4 1.6 5.1 2.4 3.1 4.6Finished Motor Gasoline1 ......................................... 54.4 42.3 40.1 27.6 49.9 42.0 47.1 48.7 45.4Finished Aviation Gasoline2 ..................................... 0.3 0.0 0.1 – – 0.1 0.0 – 0.1Kerosene-Type Jet Fuel ........................................... 7.8 10.9 11.0 1.8 – 10.3 5.6 18.0 10.3Kerosene .................................................................. -0.1 0.0 0.0 0.0 – 0.0 – 0.0 0.0Distillate Fuel Oil3 ..................................................... 28.3 30.2 31.3 34.6 42.2 30.8 32.8 20.4 28.9Residual Fuel Oil ...................................................... 1.5 1.3 5.1 -0.7 1.6 2.8 1.9 4.4 2.7Naphtha for Petro. Feed. Use ................................... 0.6 2.4 1.1 0.1 – 1.7 – 0.0 1.0Other Oils for Petro. Feed. Use ................................ 0.1 1.4 1.4 – – 1.3 – – 0.7Special Naphthas ..................................................... 0.2 0.6 – 3.3 – 0.4 – 0.1 0.2Lubricants ................................................................. 0.1 1.3 1.6 12.6 – 1.6 – 0.4 1.0Waxes ....................................................................... – 0.0 0.0 0.3 – 0.0 – – 0.0Petroleum Coke ........................................................ 1.5 6.4 4.6 2.4 1.1 5.2 4.5 6.5 5.2Asphalt and Road Oil ................................................ 1.1 0.3 0.8 12.7 2.0 0.9 6.3 1.2 1.8Still Gas .................................................................... 3.5 4.3 3.6 2.7 1.8 3.9 3.7 4.7 3.9Miscellaneous Products ............................................ 0.6 0.7 0.5 0.0 1.0 0.6 0.6 0.6 0.5
Processing Gain(-) or Loss(+)4 ................................ -3.7 -7.4 -6.6 1.0 -1.3 -6.5 -5.0 -8.0 -6.4
– = No Data Reported.1 Based on net production of finished motor gasoline minus input of natural gas plant liquids, fuel ethanol, oxygenates, and net input of motor gasoline blending components.2 Based on finished aviation gasoline net production minus net input of aviation gasoline blending components.3 Based on distillate fuel oil net production minus input of biodiesel, “other” renewable diesel fuels, and “other” renewable fuels.4 Represents the arithmetic difference between input and production.
Note: Percent yield is calculated as net production (or adjusted net production) divided by input of crude oil, hydrogen, “other” hydrocarbons, and net input of unfinished oils.Note: Totals may not equal sum of components due to independent rounding.Note: Refer to Appendix A for Refining District descriptions.Source: Calculated from data on Tables 30 and 31.
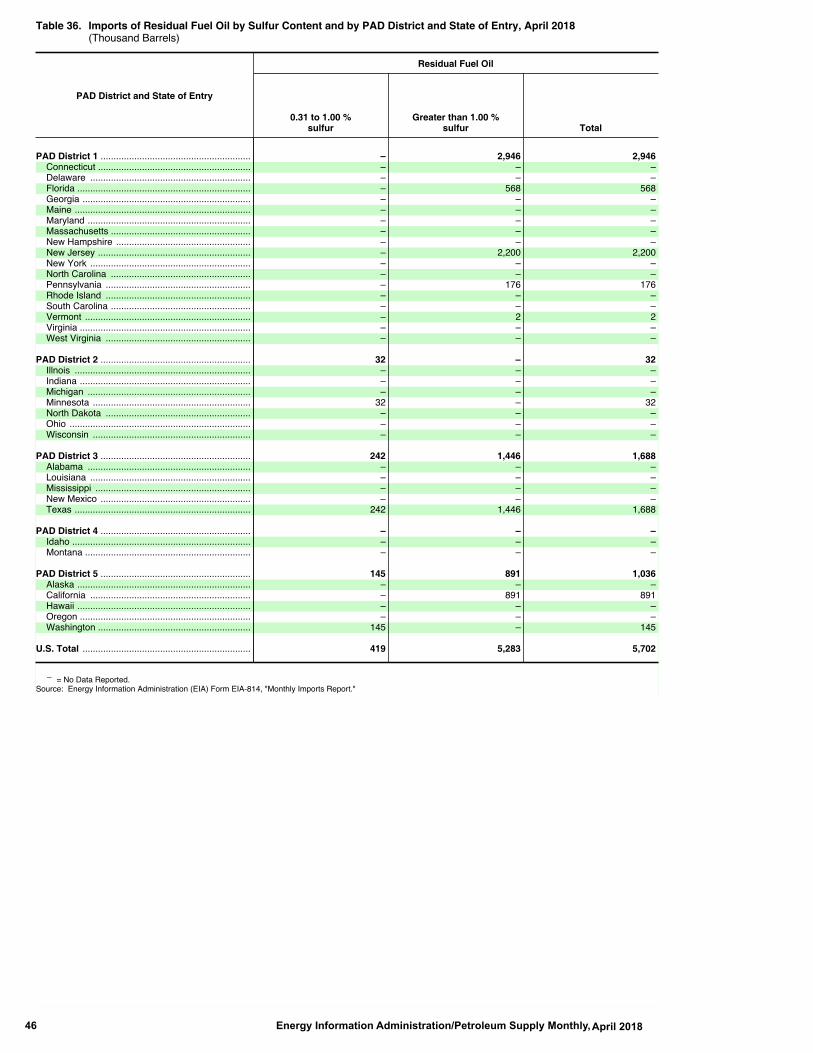
Energy Information Administration/Petroleum Supply Monthly,46 April 2018
Table 36. Imports of Residual Fuel Oil by Sulfur Content and by PAD District and State of Entry, April 2018(Thousand Barrels)
PAD District and State of Entry
Residual Fuel Oil
0.31 to 1.00 %sulfur
Greater than 1.00 %sulfur Total
PAD District 1 .......................................................... – 2,946 2,946Connecticut ........................................................... – – –Delaware .............................................................. – – –Florida ................................................................... – 568 568Georgia ................................................................. – – –Maine .................................................................... – – –Maryland ............................................................... – – –Massachusetts ...................................................... – – –New Hampshire .................................................... – – –New Jersey ........................................................... – 2,200 2,200New York .............................................................. – – –North Carolina ...................................................... – – –Pennsylvania ........................................................ – 176 176Rhode Island ........................................................ – – –South Carolina ...................................................... – – –Vermont ................................................................ – 2 2Virginia .................................................................. – – –West Virginia ........................................................ – – –
PAD District 2 .......................................................... 32 – 32Illnois .................................................................... – – –Indiana .................................................................. – – –Michigan ............................................................... – – –Minnesota ............................................................. 32 – 32North Dakota ........................................................ – – –Ohio ...................................................................... – – –Wisconsin ............................................................. – – –
PAD District 3 .......................................................... 242 1,446 1,688Alabama ............................................................... – – –Louisiana .............................................................. – – –Mississippi ............................................................ – – –New Mexico .......................................................... – – –Texas .................................................................... 242 1,446 1,688
PAD District 4 .......................................................... – – –Idaho ..................................................................... – – –Montana ................................................................ – – –
PAD District 5 .......................................................... 145 891 1,036Alaska ................................................................... – – –California .............................................................. – 891 891Hawaii ................................................................... – – –Oregon .................................................................. – – –Washington ........................................................... 145 – 145
U.S. Total ................................................................. 419 5,283 5,702
– = No Data Reported.Source: Energy Information Administration (EIA) Form EIA-814, "Monthly Imports Report."

Energy Information Administration/Petroleum Supply Monthly, 47 April 2018
Table 37. Imports of Crude Oil and Petroleum Products by PAD District, April 2018(Thousand Barrels, Except Where Noted)
CommodityPAD Districts U.S. Total
1 2 3 4 5 Total Daily Average
Crude Oil1,2 ................................................................................. 28,283 77,620 94,033 8,492 38,902 247,330 8,244Hydrocarbon Gas Liquids .......................................................... 1,261 2,228 103 301 1,140 5,033 168
Natural Gas Liquids .................................................................. 1,206 1,919 – 301 1,140 4,566 152Ethane .................................................................................. – – – – – – –Propane ................................................................................ 1,122 1,575 – 258 978 3,933 131Normal Butane ...................................................................... 18 170 – – 161 349 12Isobutane .............................................................................. 66 170 – 43 1 280 9Natural Gasoline ................................................................... – 4 – – – 4 0
Refinery Olefins ........................................................................ 55 309 103 – – 467 16Ethylene ................................................................................ – – – – – – –Propylene ............................................................................. 55 247 – – – 302 10Butylene ................................................................................ – 62 103 – – 165 6Isobutylene ........................................................................... – – – – – – –
Other Liquids .............................................................................. 21,660 268 15,695 74 4,247 41,944 1,398Hydrogen/Oxygenates/Renewables/Other Hydrocarbons ........ 170 21 193 1 454 839 28
Hydrogen .............................................................................. – – – – – – –Oxygenates (excluding Fuel Ethanol) ................................... – – 79 – – 79 3
Methyl Tertiary Butyl Ether (MTBE) .................................. – – 35 – – 35 1Other Oxygenates3 ........................................................... – – 44 – – 44 1
Renewable Fuels (including Fuel Ethanol) ........................... 170 21 108 1 454 754 25Fuel Ethanol ..................................................................... – – – – – – –Biomass-Based Diesel Fuel ............................................. 170 21 108 1 8 308 10Other Renewable Diesel Fuel ........................................... – – – – 446 446 15Other Renewable Fuels .................................................... – – – – – – –
Other Hydrocarbons ............................................................. – – 6 – – 6 0Unfinished Oils1 ........................................................................ 1,513 16 13,961 – 1,790 17,280 576
Naphthas and Lighter ........................................................... 439 – 200 – 192 831 28Kerosene and Lighter Gas Oils ............................................ – – – – – – –Heavy Gas Oils ..................................................................... 656 16 12,182 – 915 13,769 459Residuum ............................................................................. 418 – 1,579 – 683 2,680 89
Motor Gasoline Blend.Comp. (MGBC) ..................................... 19,977 231 1,541 73 2,003 23,825 794Reformulated - RBOB ........................................................... 4,326 – – – 319 4,645 155Conventional ......................................................................... 15,651 231 1,541 73 1,684 19,180 639
CBOB ............................................................................... 1,236 61 – – – 1,297 43GTAB ................................................................................ 3,808 – – – 80 3,888 130Other ................................................................................. 10,607 170 1,541 73 1,604 13,995 467
Aviation Gasoline Blend. Comp. .............................................. – – – – – – –Finished Petroleum Products .................................................... 8,138 789 4,551 45 3,095 16,618 554
Finished Motor Gasoline ........................................................... 729 – – – 253 982 33Reformulated ........................................................................ – – – – – – –
Reformulated Blended with Fuel Ethanol ......................... – – – – – – –Reformulated Other .......................................................... – – – – – – –
Conventional ......................................................................... 729 – – – 253 982 33Conventional Blended with Fuel Ethanol .......................... – – – – – – –
Ed55 and Lower ........................................................... – – – – – – –Greater than Ed55 ........................................................ – – – – – – –
Conventional Other ........................................................... 729 – – – 253 982 33Finished Aviation Gasoline ....................................................... 1 2 – – – 3 0Kerosene-Type Jet Fuel ........................................................... 1,202 – – 8 1,440 2,650 88
Bonded Aircraft Fuel ............................................................. 232 – – – 709 941 31Other ..................................................................................... 970 – – 8 731 1,709 57
Kerosene .................................................................................. – – – – – – –Distillate Fuel Oil ....................................................................... 2,178 91 293 21 149 2,732 91
15 ppm sulfur and under ....................................................... 1,900 9 293 21 149 2,372 79Bonded ............................................................................. – – – – – – –Other ................................................................................. 1,900 9 293 21 149 2,372 79
Greater than 15 ppm to 500 ppm sulfur ................................ 41 – – – – 41 1Bonded ............................................................................. – – – – – – –Other ................................................................................. 41 – – – – 41 1
Greater than 500 ppm to 2000 ppm sulfur ............................ 237 73 – – – 310 10Bonded ............................................................................. – – – – – – –Other ................................................................................. 237 73 – – – 310 10
Greater than 2000 ppm ........................................................ – 9 – – – 9 0Bonded ............................................................................. – – – – – – –Other ................................................................................. – 9 – – – 9 0
Residual Fuel Oil ...................................................................... 2,946 32 1,688 – 1,036 5,702 190Less than 0.31 percent sulfur ............................................... – – – – – – –0.31 to 1.00 percent sulfur .................................................... – 32 242 – 145 419 14Greater than 1.00 percent sulfur ........................................... 2,946 – 1,446 – 891 5,283 176
Petrochemical Feedstocks ....................................................... – 149 365 – 80 594 20Naphtha for Petro. Feed. Use ............................................... – 80 336 – 80 496 17Other Oils for Petro. Feed. Use ............................................ – 69 29 – – 98 3
Special Naphthas ..................................................................... – 46 530 – – 576 19Lubricants ................................................................................. 225 127 1,177 – 6 1,535 51Waxes ....................................................................................... 95 4 32 – 38 169 6Petroleum Coke (Marketable) ................................................... 1 24 456 – 33 514 17Asphalt and Road Oil ................................................................ 761 313 – 15 60 1,149 38Miscellaneous Products ............................................................ – 1 10 1 – 12 0
Total ............................................................................................. 59,342 80,905 114,382 8,912 47,384 310,925 10,364– = No Data Reported.1 Crude oil and unfinished oils are reported by the PAD District in which they are to be processed; all other products are reported by the PAD District of entry.2 Includes crude oil imported for storage in the Strategic Petroleum Reserve.3 Includes ethyl tertiary butyl ether (ETBE), tertiary amyl methyl ether (TAME), tertiary butyl alcohol (TBA), and other aliphatic alcohols and ethers intended for motor gasoline blending (e.g., isopropyl ether (IPE) or
n-propanol).Note: Totals may not equal sum of components due to independent rounding.Source: Energy Information Administration (EIA) Form EIA-814, "Monthly Imports Report."

Energy Information Administration/Petroleum Supply Monthly,48 April 2018
Table 38. Year-to-Date Imports of Crude Oil and Petroleum Products by PAD District, January-April 2018(Thousand Barrels)
CommodityPAD Districts U.S. Total
1 2 3 4 5 Total Daily Average
Crude Oil1,2 ............................................................................. 103,008 299,077 349,845 35,687 153,982 941,599 7,847Hydrocarbon Gas Liquids ...................................................... 7,977 11,614 598 1,665 4,438 26,292 219
Natural Gas Liquids .............................................................. 7,314 9,943 – 1,665 4,436 23,358 195Ethane .............................................................................. – – – – – – –Propane ............................................................................ 6,933 8,470 – 1,498 3,130 20,031 167Normal Butane .................................................................. 128 593 – 52 1,217 1,990 17Isobutane .......................................................................... 253 862 – 115 89 1,319 11Natural Gasoline ............................................................... – 18 – – – 18 0
Refinery Olefins .................................................................... 663 1,671 598 – 2 2,934 24Ethylene ............................................................................ – – – – – – –Propylene ......................................................................... 663 1,456 – – 2 2,121 18Butylene ............................................................................ – 215 598 – – 813 7Isobutylene ....................................................................... – – – – – – –
Other Liquids .......................................................................... 66,585 2,240 67,776 136 14,495 151,232 1,260Hydrogen/Oxygenates/Renewables/Other Hydrocarbons .... 687 129 1,352 13 1,713 3,894 32
Hydrogen .......................................................................... – – – – – – –Oxygenates (excluding Fuel Ethanol) ............................... – – 1,152 – – 1,152 10
Methyl Tertiary Butyl Ether (MTBE) .............................. – – 763 – – 763 6Other Oxygenates3 ....................................................... – – 389 – – 389 3
Renewable Fuels (including Fuel Ethanol) ....................... 687 129 179 13 1,713 2,721 23Fuel Ethanol ................................................................. – – – – – – –Biomass-Based Diesel Fuel ......................................... 687 129 179 13 149 1,157 10Other Renewable Diesel Fuel ....................................... – – – – 1,564 1,564 13Other Renewable Fuels ................................................ – – – – – – –
Other Hydrocarbons ......................................................... – – 21 – – 21 0Unfinished Oils1 .................................................................... 3,715 507 60,024 – 9,889 74,135 618
Naphthas and Lighter ....................................................... 796 321 1,016 – 192 2,325 19Kerosene and Lighter Gas Oils ........................................ – – 1 – – 1 0Heavy Gas Oils ................................................................. 2,034 186 45,325 – 7,036 54,581 455Residuum ......................................................................... 885 – 13,682 – 2,661 17,228 144
Motor Gasoline Blend.Comp. (MGBC) ................................. 62,183 1,604 6,400 123 2,893 73,203 610Reformulated - RBOB ....................................................... 21,967 64 – – 630 22,661 189Conventional ..................................................................... 40,216 1,540 6,400 123 2,263 50,542 421
CBOB ........................................................................... 2,629 260 – – 189 3,078 26GTAB ............................................................................ 7,191 – 570 – 80 7,841 65Other ............................................................................. 30,396 1,280 5,830 123 1,994 39,623 330
Aviation Gasoline Blend. Comp. .......................................... – – – – – – –Finished Petroleum Products ................................................ 48,674 3,579 17,578 362 12,801 82,994 692
Finished Motor Gasoline ....................................................... 3,327 – – – 333 3,660 31Reformulated .................................................................... – – – – – – –
Reformulated Blended with Fuel Ethanol ..................... – – – – – – –Reformulated Other ...................................................... – – – – – – –
Conventional ..................................................................... 3,327 – – – 333 3,660 31Conventional Blended with Fuel Ethanol ...................... – – – – – – –
Ed55 and Lower ....................................................... – – – – – – –Greater than Ed55 .................................................... – – – – – – –
Conventional Other ....................................................... 3,327 – – – 333 3,660 31Finished Aviation Gasoline ................................................... 23 5 – – 3 31 0Kerosene-Type Jet Fuel ....................................................... 5,752 – – 13 6,509 12,274 102
Bonded Aircraft Fuel ......................................................... 723 – – – 3,576 4,299 36Other ................................................................................. 5,029 – – 13 2,933 7,975 66
Kerosene .............................................................................. 506 2 – – – 508 4Distillate Fuel Oil ................................................................... 21,961 652 1,044 129 769 24,555 205
15 ppm sulfur and under ................................................... 18,149 465 309 129 769 19,821 165Bonded ......................................................................... – – – – – – –Other ............................................................................. 18,149 465 309 129 769 19,821 165
Greater than 15 ppm to 500 ppm sulfur ............................ 759 – – – – 759 6Bonded ......................................................................... – – – – – – –Other ............................................................................. 759 – – – – 759 6
Greater than 500 ppm to 2000 ppm sulfur ........................ 2,603 155 494 – – 3,252 27Bonded ......................................................................... – – – – – – –Other ............................................................................. 2,603 155 494 – – 3,252 27
Greater than 2000 ppm .................................................... 450 32 241 – – 723 6Bonded ......................................................................... – – – – – – –Other ............................................................................. 450 32 241 – – 723 6
Residual Fuel Oil .................................................................. 13,347 492 6,687 – 4,360 24,886 207Less than 0.31 percent sulfur ........................................... 692 1 1,042 – – 1,735 140.31 to 1.00 percent sulfur ................................................ 884 259 582 – 458 2,183 18Greater than 1.00 percent sulfur ....................................... 11,771 232 5,063 – 3,902 20,968 175
Petrochemical Feedstocks ................................................... 4 632 2,009 – 176 2,821 24Naphtha for Petro. Feed. Use ........................................... 4 331 1,876 – 176 2,387 20Other Oils for Petro. Feed. Use ........................................ – 301 133 – – 434 4
Special Naphthas ................................................................. – 194 1,749 – – 1,943 16Lubricants ............................................................................. 718 606 4,259 – 42 5,625 47Waxes ................................................................................... 289 20 131 – 161 601 5Petroleum Coke (Marketable) ............................................... 171 100 1,649 – 96 2,016 17Asphalt and Road Oil ............................................................ 2,576 871 – 216 352 4,015 33Miscellaneous Products ........................................................ – 5 50 4 – 59 0
Total ......................................................................................... 226,244 316,510 435,797 37,850 185,716 1,202,117 10,018– = No Data Reported.1 Crude oil and unfinished oils are reported by the PAD District in which they are to be processed; all other products are reported by the PAD District of entry.2 Includes crude oil imported for storage in the Strategic Petroleum Reserve.3 Includes ethyl tertiary butyl ether (ETBE), tertiary amyl methyl ether (TAME), tertiary butyl alcohol (TBA), and other aliphatic alcohols and ethers intended for motor gasoline blending (e.g., isopropyl ether (IPE) or
n-propanol).Note: Totals may not equal sum of components due to independent rounding.Source: Energy Information Administration (EIA) Form EIA-814, "Monthly Imports Report."

Energy Information Administration/Petroleum Supply Monthly, 49 April 2018
Table 38. Year-to-Date Imports of Crude Oil and Petroleum Products by PAD District, January-April 2018(Thousand Barrels)
CommodityPAD Districts U.S. Total
1 2 3 4 5 Total Daily Average
Crude Oil1,2 ............................................................................. 103,008 299,077 349,845 35,687 153,982 941,599 7,847Hydrocarbon Gas Liquids ...................................................... 7,977 11,614 598 1,665 4,438 26,292 219
Natural Gas Liquids .............................................................. 7,314 9,943 – 1,665 4,436 23,358 195Ethane .............................................................................. – – – – – – –Propane ............................................................................ 6,933 8,470 – 1,498 3,130 20,031 167Normal Butane .................................................................. 128 593 – 52 1,217 1,990 17Isobutane .......................................................................... 253 862 – 115 89 1,319 11Natural Gasoline ............................................................... – 18 – – – 18 0
Refinery Olefins .................................................................... 663 1,671 598 – 2 2,934 24Ethylene ............................................................................ – – – – – – –Propylene ......................................................................... 663 1,456 – – 2 2,121 18Butylene ............................................................................ – 215 598 – – 813 7Isobutylene ....................................................................... – – – – – – –
Other Liquids .......................................................................... 66,585 2,240 67,776 136 14,495 151,232 1,260Hydrogen/Oxygenates/Renewables/Other Hydrocarbons .... 687 129 1,352 13 1,713 3,894 32
Hydrogen .......................................................................... – – – – – – –Oxygenates (excluding Fuel Ethanol) ............................... – – 1,152 – – 1,152 10
Methyl Tertiary Butyl Ether (MTBE) .............................. – – 763 – – 763 6Other Oxygenates3 ....................................................... – – 389 – – 389 3
Renewable Fuels (including Fuel Ethanol) ....................... 687 129 179 13 1,713 2,721 23Fuel Ethanol ................................................................. – – – – – – –Biomass-Based Diesel Fuel ......................................... 687 129 179 13 149 1,157 10Other Renewable Diesel Fuel ....................................... – – – – 1,564 1,564 13Other Renewable Fuels ................................................ – – – – – – –
Other Hydrocarbons ......................................................... – – 21 – – 21 0Unfinished Oils1 .................................................................... 3,715 507 60,024 – 9,889 74,135 618
Naphthas and Lighter ....................................................... 796 321 1,016 – 192 2,325 19Kerosene and Lighter Gas Oils ........................................ – – 1 – – 1 0Heavy Gas Oils ................................................................. 2,034 186 45,325 – 7,036 54,581 455Residuum ......................................................................... 885 – 13,682 – 2,661 17,228 144
Motor Gasoline Blend.Comp. (MGBC) ................................. 62,183 1,604 6,400 123 2,893 73,203 610Reformulated - RBOB ....................................................... 21,967 64 – – 630 22,661 189Conventional ..................................................................... 40,216 1,540 6,400 123 2,263 50,542 421
CBOB ........................................................................... 2,629 260 – – 189 3,078 26GTAB ............................................................................ 7,191 – 570 – 80 7,841 65Other ............................................................................. 30,396 1,280 5,830 123 1,994 39,623 330
Aviation Gasoline Blend. Comp. .......................................... – – – – – – –Finished Petroleum Products ................................................ 48,674 3,579 17,578 362 12,801 82,994 692
Finished Motor Gasoline ....................................................... 3,327 – – – 333 3,660 31Reformulated .................................................................... – – – – – – –
Reformulated Blended with Fuel Ethanol ..................... – – – – – – –Reformulated Other ...................................................... – – – – – – –
Conventional ..................................................................... 3,327 – – – 333 3,660 31Conventional Blended with Fuel Ethanol ...................... – – – – – – –
Ed55 and Lower ....................................................... – – – – – – –Greater than Ed55 .................................................... – – – – – – –
Conventional Other ....................................................... 3,327 – – – 333 3,660 31Finished Aviation Gasoline ................................................... 23 5 – – 3 31 0Kerosene-Type Jet Fuel ....................................................... 5,752 – – 13 6,509 12,274 102
Bonded Aircraft Fuel ......................................................... 723 – – – 3,576 4,299 36Other ................................................................................. 5,029 – – 13 2,933 7,975 66
Kerosene .............................................................................. 506 2 – – – 508 4Distillate Fuel Oil ................................................................... 21,961 652 1,044 129 769 24,555 205
15 ppm sulfur and under ................................................... 18,149 465 309 129 769 19,821 165Bonded ......................................................................... – – – – – – –Other ............................................................................. 18,149 465 309 129 769 19,821 165
Greater than 15 ppm to 500 ppm sulfur ............................ 759 – – – – 759 6Bonded ......................................................................... – – – – – – –Other ............................................................................. 759 – – – – 759 6
Greater than 500 ppm to 2000 ppm sulfur ........................ 2,603 155 494 – – 3,252 27Bonded ......................................................................... – – – – – – –Other ............................................................................. 2,603 155 494 – – 3,252 27
Greater than 2000 ppm .................................................... 450 32 241 – – 723 6Bonded ......................................................................... – – – – – – –Other ............................................................................. 450 32 241 – – 723 6
Residual Fuel Oil .................................................................. 13,347 492 6,687 – 4,360 24,886 207Less than 0.31 percent sulfur ........................................... 692 1 1,042 – – 1,735 140.31 to 1.00 percent sulfur ................................................ 884 259 582 – 458 2,183 18Greater than 1.00 percent sulfur ....................................... 11,771 232 5,063 – 3,902 20,968 175
Petrochemical Feedstocks ................................................... 4 632 2,009 – 176 2,821 24Naphtha for Petro. Feed. Use ........................................... 4 331 1,876 – 176 2,387 20Other Oils for Petro. Feed. Use ........................................ – 301 133 – – 434 4
Special Naphthas ................................................................. – 194 1,749 – – 1,943 16Lubricants ............................................................................. 718 606 4,259 – 42 5,625 47Waxes ................................................................................... 289 20 131 – 161 601 5Petroleum Coke (Marketable) ............................................... 171 100 1,649 – 96 2,016 17Asphalt and Road Oil ............................................................ 2,576 871 – 216 352 4,015 33Miscellaneous Products ........................................................ – 5 50 4 – 59 0
Total ......................................................................................... 226,244 316,510 435,797 37,850 185,716 1,202,117 10,018– = No Data Reported.1 Crude oil and unfinished oils are reported by the PAD District in which they are to be processed; all other products are reported by the PAD District of entry.2 Includes crude oil imported for storage in the Strategic Petroleum Reserve.3 Includes ethyl tertiary butyl ether (ETBE), tertiary amyl methyl ether (TAME), tertiary butyl alcohol (TBA), and other aliphatic alcohols and ethers intended for motor gasoline blending (e.g., isopropyl ether (IPE) or
n-propanol).Note: Totals may not equal sum of components due to independent rounding.Source: Energy Information Administration (EIA) Form EIA-814, "Monthly Imports Report."
Table 39. Imports of Crude Oil and Petroleum Products into the United States by Country of Origin, April 2018(Thousand Barrels)
Country of Origin
Crude Oil1,2
NaturalGas
LiquidsRefineryOlefins
UnfinishedOils1
Finished Motor Gasoline Motor Gasoline Blending Components
Reform-ulated
Conven-tional Total
Reform- ulated
Conven- tional Total
OPEC ..................................... 97,060 – – 5,213 – – – – 1,116 1,116Algeria ................................ 2,707 – – 3,523 – – – – – –Angola ................................ 4,753 – – – – – – – 323 323Ecuador .............................. 6,737 – – – – – – – – –Equatorial Guinea ............... 994 – – – – – – – – –Gabon ................................. – – – – – – – – – –Iran ..................................... – – – – – – – – – –Iraq ..................................... 24,886 – – 110 – – – – – –Kuwait ................................. 3,201 – – – – – – – – –Libya ................................... 2,623 – – – – – – – – –Nigeria ................................ 7,753 – – 1 – – – – 492 492Qatar ................................... – – – – – – – – – –Saudi Arabia ....................... 26,572 – – 543 – – – – – –United Arab Emirates ......... – – – 1,036 – – – – – –Venezuela ........................... 16,834 – – – – – – – 301 301
Non-OPEC ............................. 150,270 4,566 467 12,067 – 982 982 4,645 18,064 22,709Argentina ............................ 301 – – – – – – – – –Aruba .................................. – – – – – – – – – –Australia .............................. – – – – – – – – – –Bahamas ............................ – – – – – – – – – –Bahrain ............................... – – – – – – – – – –Belgium ............................... – – – 1,350 – – – – 284 284Brazil ................................... 4,471 – – 485 – – – – 313 313Brunei ................................. – – – – – – – – – –Cameroon ........................... 813 – – 255 – – – – – –Canada ............................... 111,930 4,511 364 527 – 226 226 2,750 1,331 4,081Chad ................................... – – – – – – – – – –China .................................. – – – – – – – – – –Colombia ............................ 7,106 – – 209 – – – – 837 837Congo (Brazzaville) ............ – – – 415 – – – – – –Denmark ............................. 380 – – – – – – – 15 15Egypt .................................. 999 – – 204 – – – – – –Estonia ................................ – – – – – – – – – –Finland ................................ – – – – – – – – – –France ................................ – – – 102 – – – – 327 327Germany ............................. – – – 75 – – – – – –Guatemala .......................... 281 – – – – – – – – –India .................................... – – – – – – – – 3,258 3,258Indonesia ............................ 1,088 – – – – – – – – –Italy ..................................... – – – 433 – – – – 579 579Korea, South ....................... – – – 58 – 87 87 – 1,005 1,005Latvia .................................. – – – – – – – – – –Lithuania ............................. – – – – – – – – – –Malaysia ............................. – – – – – – – – – –Mexico ................................ 16,781 – – – – – – – 363 363Netherlands ........................ – – – 440 – 162 162 56 1,248 1,304Netherlands Antilles ............ – – – – – – – – – –Norway ............................... 2,034 – – 594 – – – – 1,022 1,022Oman .................................. – – – – – – – – – –Portugal .............................. – – – – – – – 279 1,041 1,320Russia ................................. 894 – – 4,676 – 78 78 140 1,490 1,630Spain .................................. – – – 584 – 275 275 – 1,063 1,063Sweden ............................... – – – – – – – – 335 335Syria ................................... – – – – – – – – – –Trinidad and Tobago .......... – 55 – – – – – – – –United Kingdom .................. 2,838 – – 467 – – – 1,420 1,339 2,759Vietnam .............................. 290 – – – – – – – – –Virgin Islands, U.S. ............. – – – – – – – – – –Yemen ................................ – – – – – – – – – –Other ................................... 64 0 103 1,193 – 154 154 0 2,214 2,214
Total ....................................... 247,330 4,566 467 17,280 – 982 982 4,645 19,180 23,825
Persian Gulf3 ......................... 54,659 – – 1,689 – – – – – –
See footnotes at end of table.

Energy Information Administration/Petroleum Supply Monthly,50 April 2018
Table 39. Imports of Crude Oil and Petroleum Products into the United States by Country of Origin, April 2018(Thousand Barrels) — Continued
Country of Origin
Oxygenates Renewable Fuels Distillate Fuel Oil
MethylTertiary
ButylEther
(MTBE)
OtherOxygen-
atesFuel
Ethanol
Biomass-BasedDiesel
OtherRenewable
Diesel
OtherRenewable
Fuels
15 ppmsulfur and
under
Greaterthan 15ppm to 500 ppm
sulfur501 to
2000 ppm
Greaterthan 2000
ppm Total
OPEC ..................................... – – – – – – – – – – –Algeria ................................ – – – – – – – – – – –Angola ................................ – – – – – – – – – – –Ecuador .............................. – – – – – – – – – – –Equatorial Guinea ............... – – – – – – – – – – –Gabon ................................. – – – – – – – – – – –Iran ..................................... – – – – – – – – – – –Iraq ..................................... – – – – – – – – – – –Kuwait ................................. – – – – – – – – – – –Libya ................................... – – – – – – – – – – –Nigeria ................................ – – – – – – – – – – –Qatar ................................... – – – – – – – – – – –Saudi Arabia ....................... – – – – – – – – – – –United Arab Emirates ......... – – – – – – – – – – –Venezuela ........................... – – – – – – – – – – –
Non-OPEC ............................. 35 44 – 308 446 – 2,372 41 310 9 2,732Argentina ............................ – – – – – – – – – – –Aruba .................................. – – – – – – – – – – –Australia .............................. – – – – – – – – – – –Bahamas ............................ – – – – – – – – – – –Bahrain ............................... – – – – – – – – – – –Belgium ............................... – – – – – – – – – – –Brazil ................................... 35 44 – – – – – – – – –Brunei ................................. – – – – – – – – – – –Cameroon ........................... – – – – – – – – – – –Canada ............................... – – – 143 – – 1,984 41 310 9 2,344Chad ................................... – – – – – – – – – – –China .................................. – – – – – – – – – – –Colombia ............................ – – – – – – – – – – –Congo (Brazzaville) ............ – – – – – – – – – – –Denmark ............................. – – – – – – – – – – –Egypt .................................. – – – – – – – – – – –Estonia ................................ – – – – – – – – – – –Finland ................................ – – – – – – – – – – –France ................................ – – – 87 – – – – – – –Germany ............................. – – – 78 – – – – – – –Guatemala .......................... – – – – – – – – – – –India .................................... – – – – – – – – – – –Indonesia ............................ – – – – – – – – – – –Italy ..................................... – – – – – – – – – – –Korea, South ....................... – – – – – – 32 – – – 32Latvia .................................. – – – – – – – – – – –Lithuania ............................. – – – – – – – – – – –Malaysia ............................. – – – – – – – – – – –Mexico ................................ – – – – – – 293 – – – 293Netherlands ........................ – – – – – – – – – – –Netherlands Antilles ............ – – – – – – – – – – –Norway ............................... – – – – – – – – – – –Oman .................................. – – – – – – – – – – –Portugal .............................. – – – – – – – – – – –Russia ................................. – – – – – – – – – – –Spain .................................. – – – – – – – – – – –Sweden ............................... – – – – – – – – – – –Syria ................................... – – – – – – – – – – –Trinidad and Tobago .......... – – – – – – – – – – –United Kingdom .................. – – – – – – – – – – –Vietnam .............................. – – – – – – – – – – –Virgin Islands, U.S. ............. – – – – – – – – – – –Yemen ................................ – – – – – – – – – – –Other ................................... 0 0 – 0 446 – 63 0 0 0 63
Total ....................................... 35 44 – 308 446 – 2,372 41 310 9 2,732
Persian Gulf3 ......................... – – – – – – – – – – –
See footnotes at end of table.

Energy Information Administration/Petroleum Supply Monthly, 51 April 2018
Table 39. Imports of Crude Oil and Petroleum Products into the United States by Country of Origin, April 2018(Thousand Barrels) — Continued
Country of Origin
Oxygenates Renewable Fuels Distillate Fuel Oil
MethylTertiary
ButylEther
(MTBE)
OtherOxygen-
atesFuel
Ethanol
Biomass-BasedDiesel
OtherRenewable
Diesel
OtherRenewable
Fuels
15 ppmsulfur and
under
Greaterthan 15ppm to 500 ppm
sulfur501 to
2000 ppm
Greaterthan 2000
ppm Total
OPEC ..................................... – – – – – – – – – – –Algeria ................................ – – – – – – – – – – –Angola ................................ – – – – – – – – – – –Ecuador .............................. – – – – – – – – – – –Equatorial Guinea ............... – – – – – – – – – – –Gabon ................................. – – – – – – – – – – –Iran ..................................... – – – – – – – – – – –Iraq ..................................... – – – – – – – – – – –Kuwait ................................. – – – – – – – – – – –Libya ................................... – – – – – – – – – – –Nigeria ................................ – – – – – – – – – – –Qatar ................................... – – – – – – – – – – –Saudi Arabia ....................... – – – – – – – – – – –United Arab Emirates ......... – – – – – – – – – – –Venezuela ........................... – – – – – – – – – – –
Non-OPEC ............................. 35 44 – 308 446 – 2,372 41 310 9 2,732Argentina ............................ – – – – – – – – – – –Aruba .................................. – – – – – – – – – – –Australia .............................. – – – – – – – – – – –Bahamas ............................ – – – – – – – – – – –Bahrain ............................... – – – – – – – – – – –Belgium ............................... – – – – – – – – – – –Brazil ................................... 35 44 – – – – – – – – –Brunei ................................. – – – – – – – – – – –Cameroon ........................... – – – – – – – – – – –Canada ............................... – – – 143 – – 1,984 41 310 9 2,344Chad ................................... – – – – – – – – – – –China .................................. – – – – – – – – – – –Colombia ............................ – – – – – – – – – – –Congo (Brazzaville) ............ – – – – – – – – – – –Denmark ............................. – – – – – – – – – – –Egypt .................................. – – – – – – – – – – –Estonia ................................ – – – – – – – – – – –Finland ................................ – – – – – – – – – – –France ................................ – – – 87 – – – – – – –Germany ............................. – – – 78 – – – – – – –Guatemala .......................... – – – – – – – – – – –India .................................... – – – – – – – – – – –Indonesia ............................ – – – – – – – – – – –Italy ..................................... – – – – – – – – – – –Korea, South ....................... – – – – – – 32 – – – 32Latvia .................................. – – – – – – – – – – –Lithuania ............................. – – – – – – – – – – –Malaysia ............................. – – – – – – – – – – –Mexico ................................ – – – – – – 293 – – – 293Netherlands ........................ – – – – – – – – – – –Netherlands Antilles ............ – – – – – – – – – – –Norway ............................... – – – – – – – – – – –Oman .................................. – – – – – – – – – – –Portugal .............................. – – – – – – – – – – –Russia ................................. – – – – – – – – – – –Spain .................................. – – – – – – – – – – –Sweden ............................... – – – – – – – – – – –Syria ................................... – – – – – – – – – – –Trinidad and Tobago .......... – – – – – – – – – – –United Kingdom .................. – – – – – – – – – – –Vietnam .............................. – – – – – – – – – – –Virgin Islands, U.S. ............. – – – – – – – – – – –Yemen ................................ – – – – – – – – – – –Other ................................... 0 0 – 0 446 – 63 0 0 0 63
Total ....................................... 35 44 – 308 446 – 2,372 41 310 9 2,732
Persian Gulf3 ......................... – – – – – – – – – – –
See footnotes at end of table.
Table 39. Imports of Crude Oil and Petroleum Products into the United States by Country of Origin, April 2018(Thousand Barrels) — Continued
Country of Origin
Kerosene
FinishedAviationGasoline
AviationGasolineBlending
Components
Kerosene-Type Jet
FuelSpecial
Naphthas
Residual Fuel Oil
Less than 0.31 % sulfur
0.31 to 1.00 % sulfur
Greater than1.00 % sulfur Total
OPEC ..................................... – – – 97 – – – 1,723 1,723Algeria ................................ – – – – – – – – –Angola ................................ – – – – – – – – –Ecuador .............................. – – – – – – – – –Equatorial Guinea ............... – – – – – – – – –Gabon ................................. – – – – – – – – –Iran ..................................... – – – – – – – – –Iraq ..................................... – – – 10 – – – – –Kuwait ................................. – – – – – – – – –Libya ................................... – – – – – – – – –Nigeria ................................ – – – – – – – – –Qatar ................................... – – – – – – – – –Saudi Arabia ....................... – – – – – – – – –United Arab Emirates ......... – – – – – – – – –Venezuela ........................... – – – 87 – – – 1,723 1,723
Non-OPEC ............................. – 3 – 2,553 576 – 419 3,560 3,979Argentina ............................ – – – – – – – – –Aruba .................................. – – – – – – – – –Australia .............................. – – – – – – – – –Bahamas ............................ – – – – – – – – –Bahrain ............................... – – – – – – – – –Belgium ............................... – – – – – – – – –Brazil ................................... – – – – – – – 17 17Brunei ................................. – – – – – – – – –Cameroon ........................... – – – – – – – – –Canada ............................... – 3 – 796 129 – 177 1,293 1,470Chad ................................... – – – – – – – – –China .................................. – – – 318 – – – – –Colombia ............................ – – – – – – – 298 298Congo (Brazzaville) ............ – – – – – – – – –Denmark ............................. – – – – – – – – –Egypt .................................. – – – – – – – – –Estonia ................................ – – – – – – – – –Finland ................................ – – – – – – – – –France ................................ – – – – 64 – – – –Germany ............................. – – – – – – – – –Guatemala .......................... – – – – – – – – –India .................................... – – – 329 – – – – –Indonesia ............................ – – – – – – – – –Italy ..................................... – – – – – – – – –Korea, South ....................... – – – 799 129 – – – –Latvia .................................. – – – – – – – – –Lithuania ............................. – – – – – – – – –Malaysia ............................. – – – – – – – – –Mexico ................................ – – – – – – – 1,295 1,295Netherlands ........................ – – – – – – – 17 17Netherlands Antilles ............ – – – – – – – – –Norway ............................... – – – – – – – – –Oman .................................. – – – – – – – – –Portugal .............................. – – – – 30 – – – –Russia ................................. – – – – – – – – –Spain .................................. – – – – – – – – –Sweden ............................... – – – – – – – – –Syria ................................... – – – – – – – – –Trinidad and Tobago .......... – – – – – – – 319 319United Kingdom .................. – – – – – – – – –Vietnam .............................. – – – – – – – – –Virgin Islands, U.S. ............. – – – – – – – – –Yemen ................................ – – – – – – – – –Other ................................... – 0 – 311 224 – 242 321 563
Total ....................................... – 3 – 2,650 576 – 419 5,283 5,702
Persian Gulf3 ......................... – – – 10 – – – – –
See footnotes at end of table.

Energy Information Administration/Petroleum Supply Monthly,52 April 2018
Table 39. Imports of Crude Oil and Petroleum Products into the United States by Country of Origin, April 2018(Thousand Barrels) — Continued
Country of Origin
Petrochemical Feedstocks
WaxesPetroleum
Coke
Asphaltand Road
Oil Lubricants
Miscellan-eous
ProductsTotal
Products
TotalCrudeOil and
Products
Daily Average
Crude Oil Products TotalNaphtha
OtherOils
OPEC ..................................... – – – – – 487 – 8,636 105,696 3,235 288 3,523Algeria ................................ – – – – – – – 3,523 6,230 90 117 208Angola ................................ – – – – – – – 323 5,076 158 11 169Ecuador .............................. – – – – – – – – 6,737 225 – 225Equatorial Guinea ............... – – – – – – – – 994 33 – 33Gabon ................................. – – – – – – – – – – – –Iran ..................................... – – – – – – – – – – – –Iraq ..................................... – – – – – – – 120 25,006 830 4 834Kuwait ................................. – – – – – – – – 3,201 107 – 107Libya ................................... – – – – – – – – 2,623 87 – 87Nigeria ................................ – – – – – – – 493 8,246 258 16 275Qatar ................................... – – – – – 229 – 229 229 – 8 8Saudi Arabia ....................... – – – – – – – 543 27,115 886 18 904United Arab Emirates ......... – – – – – 258 – 1,294 1,294 – 43 43Venezuela ........................... – – – – – – – 2,111 18,945 561 70 632
Non-OPEC ............................. 496 98 169 514 1,149 1,048 12 54,959 205,229 5,009 1,832 6,841Argentina ............................ – – – – – 4 – 4 305 10 0 10Aruba .................................. – – – – – – – – – – – –Australia .............................. – – – – – – – – – – – –Bahamas ............................ – – – – – – – – – – – –Bahrain ............................... – – – – – 138 – 138 138 – 5 5Belgium ............................... – – – – – 3 – 1,637 1,637 – 55 55Brazil ................................... – – – 145 – – – 1,039 5,510 149 35 184Brunei ................................. – – – – – – – – – – – –Cameroon ........................... – – – – – – – 255 1,068 27 9 36Canada ............................... 80 69 56 56 1,071 223 2 16,151 128,081 3,731 538 4,269Chad ................................... – – – – – – – – – – – –China .................................. – – 86 116 – – – 520 520 – 17 17Colombia ............................ – – – – – – – 1,344 8,450 237 45 282Congo (Brazzaville) ............ – – – – – – – 415 415 – 14 14Denmark ............................. – – – – – – – 15 395 13 1 13Egypt .................................. – – – – – – – 204 1,203 33 7 40Estonia ................................ – – – – – – – – – – – –Finland ................................ – – – – – 15 – 15 15 – 1 1France ................................ – 29 – – – 33 – 642 642 – 21 21Germany ............................. – – – – – 11 – 165 165 – 6 6Guatemala .......................... – – – – – – – – 281 9 – 9India .................................... – – – – – – – 3,587 3,587 – 120 120Indonesia ............................ – – – – – 68 – 68 1,156 36 2 39Italy ..................................... – – – – – 22 – 1,035 1,035 – 35 35Korea, South ....................... – – 1 – – 394 – 2,505 2,505 – 84 84Latvia .................................. – – – – – – – – – – – –Lithuania ............................. – – – – – – – – – – – –Malaysia ............................. – – 24 – – – – 24 24 – 1 1Mexico ................................ 220 – – – – – – 2,171 18,952 559 72 632Netherlands ........................ – – – – – – 10 1,933 1,933 – 64 64Netherlands Antilles ............ – – – – – – – – – – – –Norway ............................... – – – – – – – 1,616 3,650 68 54 122Oman .................................. – – – 195 – 66 – 261 261 – 9 9Portugal .............................. – – – – – – – 1,350 1,350 – 45 45Russia ................................. – – – – – 24 – 6,408 7,302 30 214 243Spain .................................. – – 1 – 78 – – 2,001 2,001 – 67 67Sweden ............................... – – – 1 – – – 336 336 – 11 11Syria ................................... – – – – – – – – – – – –Trinidad and Tobago .......... – – – – – – – 374 374 – 12 12United Kingdom .................. 29 – – 1 – 44 – 3,300 6,138 95 110 205Vietnam .............................. – – – – – – – – 290 10 – 10Virgin Islands, U.S. ............. – – – – – – – – – – – –Yemen ................................ – – – – – – – – – – – –Other ................................... 167 0 1 0 0 3 0 5,446 5,510 2 178 180
Total ....................................... 496 98 169 514 1,149 1,535 12 63,595 310,925 8,244 2,120 10,364
Persian Gulf3 ......................... – – – – – 625 – 2,324 56,983 1,822 77 1,899
– = No Data Reported.1 Crude oil and unfinished oils are reported by PAD District of processing; all other products are reported by PAD District of Entry.2 Includes crude oil imported for storage in the Strategic Petroleum Reserve.3 Includes Bahrain, Iran, Iraq, Kuwait, Qatar, Saudi Arabia, and United Arab Emirates.
Note: Totals may not equal sum of components due to independent rounding.Source: Energy Information Administration (EIA) Form EIA-814, "Monthly Imports Report."

Energy Information Administration/Petroleum Supply Monthly, 53 April 2018
Table 39. Imports of Crude Oil and Petroleum Products into the United States by Country of Origin, April 2018(Thousand Barrels) — Continued
Country of Origin
Petrochemical Feedstocks
WaxesPetroleum
Coke
Asphaltand Road
Oil Lubricants
Miscellan-eous
ProductsTotal
Products
TotalCrudeOil and
Products
Daily Average
Crude Oil Products TotalNaphtha
OtherOils
OPEC ..................................... – – – – – 487 – 8,636 105,696 3,235 288 3,523Algeria ................................ – – – – – – – 3,523 6,230 90 117 208Angola ................................ – – – – – – – 323 5,076 158 11 169Ecuador .............................. – – – – – – – – 6,737 225 – 225Equatorial Guinea ............... – – – – – – – – 994 33 – 33Gabon ................................. – – – – – – – – – – – –Iran ..................................... – – – – – – – – – – – –Iraq ..................................... – – – – – – – 120 25,006 830 4 834Kuwait ................................. – – – – – – – – 3,201 107 – 107Libya ................................... – – – – – – – – 2,623 87 – 87Nigeria ................................ – – – – – – – 493 8,246 258 16 275Qatar ................................... – – – – – 229 – 229 229 – 8 8Saudi Arabia ....................... – – – – – – – 543 27,115 886 18 904United Arab Emirates ......... – – – – – 258 – 1,294 1,294 – 43 43Venezuela ........................... – – – – – – – 2,111 18,945 561 70 632
Non-OPEC ............................. 496 98 169 514 1,149 1,048 12 54,959 205,229 5,009 1,832 6,841Argentina ............................ – – – – – 4 – 4 305 10 0 10Aruba .................................. – – – – – – – – – – – –Australia .............................. – – – – – – – – – – – –Bahamas ............................ – – – – – – – – – – – –Bahrain ............................... – – – – – 138 – 138 138 – 5 5Belgium ............................... – – – – – 3 – 1,637 1,637 – 55 55Brazil ................................... – – – 145 – – – 1,039 5,510 149 35 184Brunei ................................. – – – – – – – – – – – –Cameroon ........................... – – – – – – – 255 1,068 27 9 36Canada ............................... 80 69 56 56 1,071 223 2 16,151 128,081 3,731 538 4,269Chad ................................... – – – – – – – – – – – –China .................................. – – 86 116 – – – 520 520 – 17 17Colombia ............................ – – – – – – – 1,344 8,450 237 45 282Congo (Brazzaville) ............ – – – – – – – 415 415 – 14 14Denmark ............................. – – – – – – – 15 395 13 1 13Egypt .................................. – – – – – – – 204 1,203 33 7 40Estonia ................................ – – – – – – – – – – – –Finland ................................ – – – – – 15 – 15 15 – 1 1France ................................ – 29 – – – 33 – 642 642 – 21 21Germany ............................. – – – – – 11 – 165 165 – 6 6Guatemala .......................... – – – – – – – – 281 9 – 9India .................................... – – – – – – – 3,587 3,587 – 120 120Indonesia ............................ – – – – – 68 – 68 1,156 36 2 39Italy ..................................... – – – – – 22 – 1,035 1,035 – 35 35Korea, South ....................... – – 1 – – 394 – 2,505 2,505 – 84 84Latvia .................................. – – – – – – – – – – – –Lithuania ............................. – – – – – – – – – – – –Malaysia ............................. – – 24 – – – – 24 24 – 1 1Mexico ................................ 220 – – – – – – 2,171 18,952 559 72 632Netherlands ........................ – – – – – – 10 1,933 1,933 – 64 64Netherlands Antilles ............ – – – – – – – – – – – –Norway ............................... – – – – – – – 1,616 3,650 68 54 122Oman .................................. – – – 195 – 66 – 261 261 – 9 9Portugal .............................. – – – – – – – 1,350 1,350 – 45 45Russia ................................. – – – – – 24 – 6,408 7,302 30 214 243Spain .................................. – – 1 – 78 – – 2,001 2,001 – 67 67Sweden ............................... – – – 1 – – – 336 336 – 11 11Syria ................................... – – – – – – – – – – – –Trinidad and Tobago .......... – – – – – – – 374 374 – 12 12United Kingdom .................. 29 – – 1 – 44 – 3,300 6,138 95 110 205Vietnam .............................. – – – – – – – – 290 10 – 10Virgin Islands, U.S. ............. – – – – – – – – – – – –Yemen ................................ – – – – – – – – – – – –Other ................................... 167 0 1 0 0 3 0 5,446 5,510 2 178 180
Total ....................................... 496 98 169 514 1,149 1,535 12 63,595 310,925 8,244 2,120 10,364
Persian Gulf3 ......................... – – – – – 625 – 2,324 56,983 1,822 77 1,899
– = No Data Reported.1 Crude oil and unfinished oils are reported by PAD District of processing; all other products are reported by PAD District of Entry.2 Includes crude oil imported for storage in the Strategic Petroleum Reserve.3 Includes Bahrain, Iran, Iraq, Kuwait, Qatar, Saudi Arabia, and United Arab Emirates.
Note: Totals may not equal sum of components due to independent rounding.Source: Energy Information Administration (EIA) Form EIA-814, "Monthly Imports Report."
Table 40. Year-to-Date Imports of Crude Oil and Petroleum Products into the United States by Country of Origin, January-April 2018(Thousand Barrels)
Country of Origin
Crude Oil1,2
NaturalGas
LiquidsRefineryOlefins
UnfinishedOils1
Finished Motor Gasoline Motor Gasoline Blending Components
Reform-ulated
Conven-tional Total
Reform- ulated
Conven- tional Total
OPEC ..................................... 326,922 140 – 19,502 – – – – 4,805 4,805Algeria ................................ 9,213 140 – 10,460 – – – – – –Angola ................................ 8,083 – – – – – – – 473 473Ecuador .............................. 18,964 – – – – – – – – –Equatorial Guinea ............... 2,998 – – – – – – – – –Gabon ................................. 398 – – – – – – – – –Iran ..................................... – – – – – – – – – –Iraq ..................................... 85,794 – – 508 – – – – – –Kuwait ................................. 15,202 – – – – – – – – –Libya ................................... 8,178 – – 149 – – – – – –Nigeria ................................ 32,035 – – 423 – – – – 1,780 1,780Qatar ................................... – – – – – – – – – –Saudi Arabia ....................... 89,290 – – 905 – – – – – –United Arab Emirates ......... – – – 6,518 – – – – – –Venezuela ........................... 56,767 – – 539 – – – – 2,552 2,552
Non-OPEC ............................. 614,677 23,218 2,934 54,633 – 3,660 3,660 22,661 45,737 68,398Argentina ............................ 3,412 – – – – – – – 491 491Aruba .................................. – – – – – – – – – –Australia .............................. – – – – – – – – – –Bahamas ............................ – – – – – – – – – –Bahrain ............................... – – – – – – – – – –Belgium ............................... – – – 5,763 – – – 147 1,287 1,434Brazil ................................... 16,585 – – 1,382 – – – – 1,862 1,862Brunei ................................. – – – – – – – – – –Cameroon ........................... 1,142 – – 559 – – – – – –Canada ............................... 438,978 22,137 2,336 1,510 – 1,073 1,073 14,471 6,709 21,180Chad ................................... 4,453 – – – – – – – – –China .................................. – – – – – – – – – –Colombia ............................ 43,823 – – 210 – – – – 2,215 2,215Congo (Brazzaville) ............ 952 – – 510 – – – – – –Denmark ............................. 380 – – 122 – – – – 15 15Egypt .................................. 2,748 – – 204 – – – – – –Estonia ................................ – – – – – – – – – –Finland ................................ – – – 379 – – – – 828 828France ................................ – – – 293 – – – 2,038 823 2,861Germany ............................. – – – 432 – 18 18 – – –Guatemala .......................... 1,091 – – – – – – – – –India .................................... – – – – – – – – 4,832 4,832Indonesia ............................ 5,066 – – – – – – – – –Italy ..................................... 220 – – 547 – – – – 904 904Korea, South ....................... – – – 120 – 87 87 – 1,155 1,155Latvia .................................. – – – – – – – – – –Lithuania ............................. – – – – – – – – – –Malaysia ............................. 288 – – 150 – – – – – –Mexico ................................ 75,519 – 69 – – – – – 1,651 1,651Netherlands ........................ – – – 2,941 – 625 625 701 2,583 3,284Netherlands Antilles ............ – – – – – – – – – –Norway ............................... 5,551 595 – 2,610 – – – – 1,022 1,022Oman .................................. – – – – – – – – – –Portugal .............................. – – – – – – – 563 2,326 2,889Russia ................................. 2,649 – – 28,340 – 174 174 185 4,824 5,009Spain .................................. – – – 1,267 – 275 275 – 4,843 4,843Sweden ............................... – 263 – 16 – 968 968 – 730 730Syria ................................... – – – – – – – – – –Trinidad and Tobago .......... 499 167 – – – – – – – –United Kingdom .................. 7,002 – – 467 – 286 286 4,556 1,946 6,502Vietnam .............................. 788 – – – – – – – – –Virgin Islands, U.S. ............. – – – – – – – – – –Yemen ................................ – – – – – – – – – –Other ................................... 3,531 56 529 6,811 – 154 154 0 4,691 4,691
Total ....................................... 941,599 23,358 2,934 74,135 – 3,660 3,660 22,661 50,542 73,203
Persian Gulf3 ......................... 190,286 – – 7,931 – – – – – –
See footnotes at end of table.

Energy Information Administration/Petroleum Supply Monthly,54 April 2018
Table 40. Year-to-Date Imports of Crude Oil and Petroleum Products into the United States by Country of Origin, January-April 2018(Thousand Barrels) — Continued
Country of Origin
Oxygenates Renewable Fuels Distillate Fuel Oil
MethylTertiary
ButylEther
(MTBE)
OtherOxygen-
atesFuel
Ethanol
Biomass-BasedDiesel
OtherRenewable
Diesel
OtherRenewable
Fuels
15 ppmsulfur and
under
Greaterthan 15ppm to 500 ppm
sulfur501 to
2000 ppm
Greaterthan 2000
ppm Total
OPEC ..................................... – – – – – – 3,545 – 140 100 3,785Algeria ................................ – – – – – – – – – – –Angola ................................ – – – – – – – – – – –Ecuador .............................. – – – – – – – – – – –Equatorial Guinea ............... – – – – – – – – – – –Gabon ................................. – – – – – – – – – – –Iran ..................................... – – – – – – – – – – –Iraq ..................................... – – – – – – – – – – –Kuwait ................................. – – – – – – – – – – –Libya ................................... – – – – – – – – – – –Nigeria ................................ – – – – – – – – 140 – 140Qatar ................................... – – – – – – 1,408 – – – 1,408Saudi Arabia ....................... – – – – – – 2,137 – – – 2,137United Arab Emirates ......... – – – – – – – – – – –Venezuela ........................... – – – – – – – – – 100 100
Non-OPEC ............................. 763 389 – 1,157 1,564 – 16,276 759 3,112 623 20,770Argentina ............................ – – – – – – – – – – –Aruba .................................. – – – – – – – – – – –Australia .............................. – – – – – – – – – – –Bahamas ............................ – – – – – – – – – – –Bahrain ............................... – – – – – – – – – – –Belgium ............................... 52 – – – – – 605 – – – 605Brazil ................................... 269 292 – – – – 717 – – – 717Brunei ................................. – – – – – – – – – – –Cameroon ........................... – – – – – – – – – – –Canada ............................... – – – 631 – – 10,537 186 2,585 32 13,340Chad ................................... – – – – – – – – – – –China .................................. – – – – – – – – – – –Colombia ............................ – – – – – – 730 – – 300 1,030Congo (Brazzaville) ............ – – – – – – – – – – –Denmark ............................. – – – – – – – – – – –Egypt .................................. – – – – – – – – – – –Estonia ................................ – – – – – – – – – – –Finland ................................ – – – – – – – – – – –France ................................ – – – 87 – – – – – – –Germany ............................. 87 – – 411 – – – – – – 5Guatemala .......................... – – – – – – – – – – –India .................................... – – – – – – 2,279 – – – 2,279Indonesia ............................ – – – – – – – – – – –Italy ..................................... – – – – – – – – – – –Korea, South ....................... – – – 28 – – 32 – – – 32Latvia .................................. – – – – – – – – – – –Lithuania ............................. – – – – – – – – – – –Malaysia ............................. – – – – – – – – – – –Mexico ................................ – – – – – – 293 – 277 – 570Netherlands ........................ 337 97 – – – – 524 – – 69 593Netherlands Antilles ............ – – – – – – – – – – –Norway ............................... – – – – – – – – – – –Oman .................................. – – – – – – 161 – – – 161Portugal .............................. – – – – – – – – – – –Russia ................................. 18 – – – – – 335 573 250 167 1,325Spain .................................. – – – – – – – – – – –Sweden ............................... – – – – – – – – – – –Syria ................................... – – – – – – – – – – –Trinidad and Tobago .......... – – – – – – – – – – –United Kingdom .................. – – – – – – – – – – –Vietnam .............................. – – – – – – – – – – –Virgin Islands, U.S. ............. – – – – – – – – – – –Yemen ................................ – – – – – – – – – – –Other ................................... 0 0 – 0 1,564 – 63 0 0 55 113
Total ....................................... 763 389 – 1,157 1,564 – 19,821 759 3,252 723 24,555
Persian Gulf3 ......................... – – – – – – 3,545 – – – 3,545
See footnotes at end of table.

Energy Information Administration/Petroleum Supply Monthly, 55 April 2018
Table 40. Year-to-Date Imports of Crude Oil and Petroleum Products into the United States by Country of Origin, January-April 2018(Thousand Barrels) — Continued
Country of Origin
Oxygenates Renewable Fuels Distillate Fuel Oil
MethylTertiary
ButylEther
(MTBE)
OtherOxygen-
atesFuel
Ethanol
Biomass-BasedDiesel
OtherRenewable
Diesel
OtherRenewable
Fuels
15 ppmsulfur and
under
Greaterthan 15ppm to 500 ppm
sulfur501 to
2000 ppm
Greaterthan 2000
ppm Total
OPEC ..................................... – – – – – – 3,545 – 140 100 3,785Algeria ................................ – – – – – – – – – – –Angola ................................ – – – – – – – – – – –Ecuador .............................. – – – – – – – – – – –Equatorial Guinea ............... – – – – – – – – – – –Gabon ................................. – – – – – – – – – – –Iran ..................................... – – – – – – – – – – –Iraq ..................................... – – – – – – – – – – –Kuwait ................................. – – – – – – – – – – –Libya ................................... – – – – – – – – – – –Nigeria ................................ – – – – – – – – 140 – 140Qatar ................................... – – – – – – 1,408 – – – 1,408Saudi Arabia ....................... – – – – – – 2,137 – – – 2,137United Arab Emirates ......... – – – – – – – – – – –Venezuela ........................... – – – – – – – – – 100 100
Non-OPEC ............................. 763 389 – 1,157 1,564 – 16,276 759 3,112 623 20,770Argentina ............................ – – – – – – – – – – –Aruba .................................. – – – – – – – – – – –Australia .............................. – – – – – – – – – – –Bahamas ............................ – – – – – – – – – – –Bahrain ............................... – – – – – – – – – – –Belgium ............................... 52 – – – – – 605 – – – 605Brazil ................................... 269 292 – – – – 717 – – – 717Brunei ................................. – – – – – – – – – – –Cameroon ........................... – – – – – – – – – – –Canada ............................... – – – 631 – – 10,537 186 2,585 32 13,340Chad ................................... – – – – – – – – – – –China .................................. – – – – – – – – – – –Colombia ............................ – – – – – – 730 – – 300 1,030Congo (Brazzaville) ............ – – – – – – – – – – –Denmark ............................. – – – – – – – – – – –Egypt .................................. – – – – – – – – – – –Estonia ................................ – – – – – – – – – – –Finland ................................ – – – – – – – – – – –France ................................ – – – 87 – – – – – – –Germany ............................. 87 – – 411 – – – – – – 5Guatemala .......................... – – – – – – – – – – –India .................................... – – – – – – 2,279 – – – 2,279Indonesia ............................ – – – – – – – – – – –Italy ..................................... – – – – – – – – – – –Korea, South ....................... – – – 28 – – 32 – – – 32Latvia .................................. – – – – – – – – – – –Lithuania ............................. – – – – – – – – – – –Malaysia ............................. – – – – – – – – – – –Mexico ................................ – – – – – – 293 – 277 – 570Netherlands ........................ 337 97 – – – – 524 – – 69 593Netherlands Antilles ............ – – – – – – – – – – –Norway ............................... – – – – – – – – – – –Oman .................................. – – – – – – 161 – – – 161Portugal .............................. – – – – – – – – – – –Russia ................................. 18 – – – – – 335 573 250 167 1,325Spain .................................. – – – – – – – – – – –Sweden ............................... – – – – – – – – – – –Syria ................................... – – – – – – – – – – –Trinidad and Tobago .......... – – – – – – – – – – –United Kingdom .................. – – – – – – – – – – –Vietnam .............................. – – – – – – – – – – –Virgin Islands, U.S. ............. – – – – – – – – – – –Yemen ................................ – – – – – – – – – – –Other ................................... 0 0 – 0 1,564 – 63 0 0 55 113
Total ....................................... 763 389 – 1,157 1,564 – 19,821 759 3,252 723 24,555
Persian Gulf3 ......................... – – – – – – 3,545 – – – 3,545
See footnotes at end of table.
Table 40. Year-to-Date Imports of Crude Oil and Petroleum Products into the United States by Country of Origin, January-April 2018(Thousand Barrels) — Continued
Country of Origin
Kerosene
FinishedAviationGasoline
AviationGasolineBlending
Components
Kerosene-Type Jet
FuelSpecial
Naphthas
Residual Fuel Oil
Less than 0.31 % sulfur
0.31 to 1.00 % sulfur
Greater than1.00 % sulfur Total
OPEC ..................................... – – – 1,149 36 502 – 4,597 5,099Algeria ................................ – – – – – – – – –Angola ................................ – – – – – – – – –Ecuador .............................. – – – – – – – 438 438Equatorial Guinea ............... – – – – – – – – –Gabon ................................. – – – – – – – – –Iran ..................................... – – – – – – – – –Iraq ..................................... – – – 15 – – – – –Kuwait ................................. – – – 118 – – – – –Libya ................................... – – – – – 147 – – 147Nigeria ................................ – – – – – – – – –Qatar ................................... – – – – – – – – –Saudi Arabia ....................... – – – 58 36 – – – –United Arab Emirates ......... – – – – – – – – –Venezuela ........................... – – – 958 – 355 – 4,159 4,514
Non-OPEC ............................. 508 31 – 11,125 1,907 1,233 2,183 16,371 19,787Argentina ............................ – – – – – 204 317 – 521Aruba .................................. – – – – – – – – –Australia .............................. – – – – – – – – –Bahamas ............................ – – – – – – – – –Bahrain ............................... – – – – – – – – –Belgium ............................... – – – – 22 – 50 – 50Brazil ................................... – – – – 84 80 315 39 434Brunei ................................. – – – – – – – – –Cameroon ........................... – – – – – – – – –Canada ............................... 2 12 – 2,269 354 1 844 4,144 4,989Chad ................................... – – – – – – – – –China .................................. 153 – – 2,367 – – – – –Colombia ............................ – – – – – – – 1,495 1,495Congo (Brazzaville) ............ – – – – – – – – –Denmark ............................. – – – – – – – – –Egypt .................................. – – – – – – – – –Estonia ................................ – – – – – – – – –Finland ................................ – – – – – – – – –France ................................ – – – – 107 – – – –Germany ............................. – – – – 14 – – – –Guatemala .......................... – – – – – – – – –India .................................... – – – 1,460 – – – – –Indonesia ............................ – – – – – – – – –Italy ..................................... – – – 74 – – – – –Korea, South ....................... 353 – – 4,099 851 – – – –Latvia .................................. – – – – – – – – –Lithuania ............................. – – – – – – – – –Malaysia ............................. – – – – – – – – –Mexico ................................ – – – – – 283 – 4,930 5,213Netherlands ........................ – 19 – – 3 57 – 277 334Netherlands Antilles ............ – – – – – – – – –Norway ............................... – – – – – – – – –Oman .................................. – – – – – – – – –Portugal .............................. – – – – 53 – – – –Russia ................................. – – – – – 347 – 620 967Spain .................................. – – – – – – – 80 80Sweden ............................... – – – – – – – 286 286Syria ................................... – – – – – – – – –Trinidad and Tobago .......... – – – – – – – 2,101 2,101United Kingdom .................. – – – – – – – – –Vietnam .............................. – – – – – – – – –Virgin Islands, U.S. ............. – – – – – – – – –Yemen ................................ – – – – – – – – –Other ................................... 0 0 – 856 419 261 657 2,399 3,317
Total ....................................... 508 31 – 12,274 1,943 1,735 2,183 20,968 24,886
Persian Gulf3 ......................... – – – 191 36 – – – –
See footnotes at end of table.

Energy Information Administration/Petroleum Supply Monthly,56 April 2018
Table 40. Year-to-Date Imports of Crude Oil and Petroleum Products into the United States by Country of Origin, January-April 2018(Thousand Barrels) — Continued
Country of Origin
Petrochemical Feedstocks
WaxesPetroleum
Coke
Asphaltand Road
Oil Lubricants
Miscellan-eous
ProductsTotal
Products
TotalCrudeOil and
Products
Daily Average
Crude Oil Products TotalNaphtha
OtherOils
OPEC ..................................... 558 – – – 436 1,408 – 36,918 363,840 2,724 308 3,032Algeria ................................ 327 – – – – – – 10,927 20,140 77 91 168Angola ................................ – – – – – – – 473 8,556 67 4 71Ecuador .............................. – – – – – – – 438 19,402 158 4 162Equatorial Guinea ............... – – – – – – – – 2,998 25 – 25Gabon ................................. – – – – – – – – 398 3 – 3Iran ..................................... – – – – – – – – – – – –Iraq ..................................... – – – – – – – 523 86,317 715 4 719Kuwait ................................. – – – – – – – 118 15,320 127 1 128Libya ................................... – – – – – – – 296 8,474 68 2 71Nigeria ................................ 231 – – – – – – 2,574 34,609 267 21 288Qatar ................................... – – – – – 938 – 2,346 2,346 – 20 20Saudi Arabia ....................... – – – – – – – 3,136 92,426 744 26 770United Arab Emirates ......... – – – – – 470 – 6,988 6,988 – 58 58Venezuela ........................... – – – – 436 – – 9,099 65,866 473 76 549
Non-OPEC ............................. 1,829 434 601 2,016 3,579 4,217 59 223,600 838,277 5,122 1,863 6,986Argentina ............................ – 36 – 484 – 23 – 1,555 4,967 28 13 41Aruba .................................. – – – – – – – – – – – –Australia .............................. – – – – – – – – – – – –Bahamas ............................ – – – – – – – – – – – –Bahrain ............................... – – – – – 302 – 302 302 – 3 3Belgium ............................... – – – – 78 48 – 8,053 8,053 – 67 67Brazil ................................... – – – 145 – – – 5,185 21,770 138 43 181Brunei ................................. – – – – – – – – – – – –Cameroon ........................... – – – – – – – 559 1,701 10 5 14Canada ............................... 331 301 181 436 3,293 1,033 9 75,417 514,395 3,658 628 4,287Chad ................................... – – – – – – – – 4,453 37 – 37China .................................. – – 321 318 – – – 3,159 3,159 – 26 26Colombia ............................ – – – 167 – – – 5,117 48,940 365 43 408Congo (Brazzaville) ............ – – – – – – – 510 1,462 8 4 12Denmark ............................. – – – – – – – 137 517 3 1 4Egypt .................................. – – – – – – – 204 2,952 23 2 25Estonia ................................ – – – – – – – – – – – –Finland ................................ – – – – – 16 – 1,223 1,223 – 10 10France ................................ – 97 – – – 61 – 3,506 3,506 – 29 29Germany ............................. – – 17 – – 54 – 1,040 1,040 – 9 9Guatemala .......................... – – – – – – – – 1,091 9 – 9India .................................... – – – – – – – 8,571 8,571 – 71 71Indonesia ............................ – – – – – 341 – 341 5,407 42 3 45Italy ..................................... – – – – – 100 – 1,630 1,850 2 14 15Korea, South ....................... – – 3 – – 1,961 – 8,689 8,689 – 72 72Latvia .................................. – – – – – – – – – – – –Lithuania ............................. – – – – – – – – – – – –Malaysia ............................. – – 47 – – – – 197 485 2 2 4Mexico ................................ 928 – – – – – – 8,431 83,950 629 70 700Netherlands ........................ – – – – – – 50 8,283 8,283 – 69 69Netherlands Antilles ............ – – – – – – – – – – – –Norway ............................... – – – – – – – 4,227 9,778 46 35 81Oman .................................. – – – 195 – 66 – 422 422 – 4 4Portugal .............................. – – – – – – – 2,942 2,942 – 25 25Russia ................................. – – – 95 – 24 – 35,952 38,601 22 300 322Spain .................................. – – 5 – 129 – – 6,599 6,599 – 55 55Sweden ............................... – – – 3 – – – 2,266 2,266 – 19 19Syria ................................... – – – – – – – – – – – –Trinidad and Tobago .......... – – – – – – – 2,268 2,767 4 19 23United Kingdom .................. 118 – – 170 – 59 – 7,602 14,604 58 63 122Vietnam .............................. – – – – – – – – 788 7 – 7Virgin Islands, U.S. ............. – – – – – – – – – – – –Yemen ................................ – – – – – – – – – – – –Other ................................... 452 0 27 3 79 129 0 19,213 22,744 31 159 190
Total ....................................... 2,387 434 601 2,016 4,015 5,625 59 260,518 1,202,117 7,847 2,171 10,018
Persian Gulf3 ......................... – – – – – 1,710 – 13,413 203,699 1,586 112 1,697
– = No Data Reported.1 Crude oil and unfinished oils are reported by PAD District of processing; all other products are reported by PAD District of Entry.2 Includes crude oil imported for storage in the Strategic Petroleum Reserve.3 Includes Bahrain, Iran, Iraq, Kuwait, Qatar, Saudi Arabia, and United Arab Emirates.
Note: Totals may not equal sum of components due to independent rounding.Source: Energy Information Administration (EIA) Form EIA-814, "Monthly Imports Report."

Energy Information Administration/Petroleum Supply Monthly, 57 April 2018
Table 40. Year-to-Date Imports of Crude Oil and Petroleum Products into the United States by Country of Origin, January-April 2018(Thousand Barrels) — Continued
Country of Origin
Petrochemical Feedstocks
WaxesPetroleum
Coke
Asphaltand Road
Oil Lubricants
Miscellan-eous
ProductsTotal
Products
TotalCrudeOil and
Products
Daily Average
Crude Oil Products TotalNaphtha
OtherOils
OPEC ..................................... 558 – – – 436 1,408 – 36,918 363,840 2,724 308 3,032Algeria ................................ 327 – – – – – – 10,927 20,140 77 91 168Angola ................................ – – – – – – – 473 8,556 67 4 71Ecuador .............................. – – – – – – – 438 19,402 158 4 162Equatorial Guinea ............... – – – – – – – – 2,998 25 – 25Gabon ................................. – – – – – – – – 398 3 – 3Iran ..................................... – – – – – – – – – – – –Iraq ..................................... – – – – – – – 523 86,317 715 4 719Kuwait ................................. – – – – – – – 118 15,320 127 1 128Libya ................................... – – – – – – – 296 8,474 68 2 71Nigeria ................................ 231 – – – – – – 2,574 34,609 267 21 288Qatar ................................... – – – – – 938 – 2,346 2,346 – 20 20Saudi Arabia ....................... – – – – – – – 3,136 92,426 744 26 770United Arab Emirates ......... – – – – – 470 – 6,988 6,988 – 58 58Venezuela ........................... – – – – 436 – – 9,099 65,866 473 76 549
Non-OPEC ............................. 1,829 434 601 2,016 3,579 4,217 59 223,600 838,277 5,122 1,863 6,986Argentina ............................ – 36 – 484 – 23 – 1,555 4,967 28 13 41Aruba .................................. – – – – – – – – – – – –Australia .............................. – – – – – – – – – – – –Bahamas ............................ – – – – – – – – – – – –Bahrain ............................... – – – – – 302 – 302 302 – 3 3Belgium ............................... – – – – 78 48 – 8,053 8,053 – 67 67Brazil ................................... – – – 145 – – – 5,185 21,770 138 43 181Brunei ................................. – – – – – – – – – – – –Cameroon ........................... – – – – – – – 559 1,701 10 5 14Canada ............................... 331 301 181 436 3,293 1,033 9 75,417 514,395 3,658 628 4,287Chad ................................... – – – – – – – – 4,453 37 – 37China .................................. – – 321 318 – – – 3,159 3,159 – 26 26Colombia ............................ – – – 167 – – – 5,117 48,940 365 43 408Congo (Brazzaville) ............ – – – – – – – 510 1,462 8 4 12Denmark ............................. – – – – – – – 137 517 3 1 4Egypt .................................. – – – – – – – 204 2,952 23 2 25Estonia ................................ – – – – – – – – – – – –Finland ................................ – – – – – 16 – 1,223 1,223 – 10 10France ................................ – 97 – – – 61 – 3,506 3,506 – 29 29Germany ............................. – – 17 – – 54 – 1,040 1,040 – 9 9Guatemala .......................... – – – – – – – – 1,091 9 – 9India .................................... – – – – – – – 8,571 8,571 – 71 71Indonesia ............................ – – – – – 341 – 341 5,407 42 3 45Italy ..................................... – – – – – 100 – 1,630 1,850 2 14 15Korea, South ....................... – – 3 – – 1,961 – 8,689 8,689 – 72 72Latvia .................................. – – – – – – – – – – – –Lithuania ............................. – – – – – – – – – – – –Malaysia ............................. – – 47 – – – – 197 485 2 2 4Mexico ................................ 928 – – – – – – 8,431 83,950 629 70 700Netherlands ........................ – – – – – – 50 8,283 8,283 – 69 69Netherlands Antilles ............ – – – – – – – – – – – –Norway ............................... – – – – – – – 4,227 9,778 46 35 81Oman .................................. – – – 195 – 66 – 422 422 – 4 4Portugal .............................. – – – – – – – 2,942 2,942 – 25 25Russia ................................. – – – 95 – 24 – 35,952 38,601 22 300 322Spain .................................. – – 5 – 129 – – 6,599 6,599 – 55 55Sweden ............................... – – – 3 – – – 2,266 2,266 – 19 19Syria ................................... – – – – – – – – – – – –Trinidad and Tobago .......... – – – – – – – 2,268 2,767 4 19 23United Kingdom .................. 118 – – 170 – 59 – 7,602 14,604 58 63 122Vietnam .............................. – – – – – – – – 788 7 – 7Virgin Islands, U.S. ............. – – – – – – – – – – – –Yemen ................................ – – – – – – – – – – – –Other ................................... 452 0 27 3 79 129 0 19,213 22,744 31 159 190
Total ....................................... 2,387 434 601 2,016 4,015 5,625 59 260,518 1,202,117 7,847 2,171 10,018
Persian Gulf3 ......................... – – – – – 1,710 – 13,413 203,699 1,586 112 1,697
– = No Data Reported.1 Crude oil and unfinished oils are reported by PAD District of processing; all other products are reported by PAD District of Entry.2 Includes crude oil imported for storage in the Strategic Petroleum Reserve.3 Includes Bahrain, Iran, Iraq, Kuwait, Qatar, Saudi Arabia, and United Arab Emirates.
Note: Totals may not equal sum of components due to independent rounding.Source: Energy Information Administration (EIA) Form EIA-814, "Monthly Imports Report."
Table 41. PAD District 1 - Imports of Crude Oil and Petroleum Products by Country of Origin, April 2018(Thousand Barrels)
Country of Origin
Crude Oil1,2
NaturalGas
LiquidsRefineryOlefins
UnfinishedOils1
Finished Motor Gasoline Motor Gasoline Blending Components
Reform-ulated
Conven-tional Total
Reform- ulated
Conven- tional Total
OPEC ..................................... 16,996 – – 839 – – – – 833 833Algeria ................................ 2,707 – – 839 – – – – – –Angola ................................ 2,857 – – – – – – – 323 323Ecuador .............................. – – – – – – – – – –Equatorial Guinea ............... – – – – – – – – – –Gabon ................................. – – – – – – – – – –Iran ..................................... – – – – – – – – – –Iraq ..................................... 2,889 – – – – – – – – –Kuwait ................................. – – – – – – – – – –Libya ................................... 1,610 – – – – – – – – –Nigeria ................................ 3,437 – – – – – – – 264 264Qatar ................................... – – – – – – – – – –Saudi Arabia ....................... 3,496 – – – – – – – – –United Arab Emirates ......... – – – – – – – – – –Venezuela ........................... – – – – – – – – 246 246
Non-OPEC ............................. 11,287 1,206 55 674 – 729 729 4,326 14,818 19,144Argentina ............................ – – – – – – – – – –Aruba .................................. – – – – – – – – – –Australia .............................. – – – – – – – – – –Bahamas ............................ – – – – – – – – – –Bahrain ............................... – – – – – – – – – –Belgium ............................... – – – – – – – – 272 272Brazil ................................... – – – – – – – – 288 288Brunei ................................. – – – – – – – – – –Cameroon ........................... 813 – – – – – – – – –Canada ............................... 5,252 1,206 55 – – 214 214 2,750 1,027 3,777Chad ................................... – – – – – – – – – –China .................................. – – – – – – – – – –Colombia ............................ – – – 209 – – – – 540 540Congo (Brazzaville) ............ – – – – – – – – – –Denmark ............................. 380 – – – – – – – – –Egypt .................................. 999 – – – – – – – – –Estonia ................................ – – – – – – – – – –Finland ................................ – – – – – – – – – –France ................................ – – – – – – – – 297 297Germany ............................. – – – – – – – – – –Guatemala .......................... – – – – – – – – – –India .................................... – – – – – – – – 3,258 3,258Indonesia ............................ – – – – – – – – – –Italy ..................................... – – – – – – – – 221 221Korea, South ....................... – – – – – – – – 928 928Latvia .................................. – – – – – – – – – –Lithuania ............................. – – – – – – – – – –Malaysia ............................. – – – – – – – – – –Mexico ................................ – – – – – – – – – –Netherlands ........................ – – – – – 162 162 56 851 907Netherlands Antilles ............ – – – – – – – – – –Norway ............................... 2,034 – – – – – – – 983 983Oman .................................. – – – – – – – – – –Portugal .............................. – – – – – – – 279 1,041 1,320Russia ................................. 190 – – – – 78 78 140 1,490 1,630Spain .................................. – – – – – 275 275 – 991 991Sweden ............................... – – – – – – – – 307 307Syria ................................... – – – – – – – – – –Trinidad and Tobago .......... – – – – – – – – – –United Kingdom .................. 1,619 – – – – – – 1,101 924 2,025Vietnam .............................. – – – – – – – – – –Virgin Islands, U.S. ............. – – – – – – – – – –Yemen ................................ – – – – – – – – – –Other ................................... 0 0 0 465 – 0 0 0 1,400 1,400
Total ....................................... 28,283 1,206 55 1,513 – 729 729 4,326 15,651 19,977
Persian Gulf3 ......................... 6,385 – – – – – – – – –
See footnotes at end of table.

Energy Information Administration/Petroleum Supply Monthly,58 April 2018
Table 41. PAD District 1 - Imports of Crude Oil and Petroleum Products by Country of Origin, April 2018(Thousand Barrels) — Continued
Country of Origin
Oxygenates Renewable Fuels Distillate Fuel Oil
MethylTertiary
ButylEther
(MTBE)
OtherOxygen-
atesFuel
Ethanol
Biomass-BasedDiesel
OtherRenewable
Diesel
OtherRenewable
Fuels
15 ppmsulfur and
under
Greaterthan 15ppm to 500 ppm
sulfur501 to
2000 ppm
Greaterthan 2000
ppm Total
OPEC ..................................... – – – – – – – – – – –Algeria ................................ – – – – – – – – – – –Angola ................................ – – – – – – – – – – –Ecuador .............................. – – – – – – – – – – –Equatorial Guinea ............... – – – – – – – – – – –Gabon ................................. – – – – – – – – – – –Iran ..................................... – – – – – – – – – – –Iraq ..................................... – – – – – – – – – – –Kuwait ................................. – – – – – – – – – – –Libya ................................... – – – – – – – – – – –Nigeria ................................ – – – – – – – – – – –Qatar ................................... – – – – – – – – – – –Saudi Arabia ....................... – – – – – – – – – – –United Arab Emirates ......... – – – – – – – – – – –Venezuela ........................... – – – – – – – – – – –
Non-OPEC ............................. – – – 170 – – 1,900 41 237 – 2,178Argentina ............................ – – – – – – – – – – –Aruba .................................. – – – – – – – – – – –Australia .............................. – – – – – – – – – – –Bahamas ............................ – – – – – – – – – – –Bahrain ............................... – – – – – – – – – – –Belgium ............................... – – – – – – – – – – –Brazil ................................... – – – – – – – – – – –Brunei ................................. – – – – – – – – – – –Cameroon ........................... – – – – – – – – – – –Canada ............................... – – – 42 – – 1,900 41 237 – 2,178Chad ................................... – – – – – – – – – – –China .................................. – – – – – – – – – – –Colombia ............................ – – – – – – – – – – –Congo (Brazzaville) ............ – – – – – – – – – – –Denmark ............................. – – – – – – – – – – –Egypt .................................. – – – – – – – – – – –Estonia ................................ – – – – – – – – – – –Finland ................................ – – – – – – – – – – –France ................................ – – – 50 – – – – – – –Germany ............................. – – – 78 – – – – – – –Guatemala .......................... – – – – – – – – – – –India .................................... – – – – – – – – – – –Indonesia ............................ – – – – – – – – – – –Italy ..................................... – – – – – – – – – – –Korea, South ....................... – – – – – – – – – – –Latvia .................................. – – – – – – – – – – –Lithuania ............................. – – – – – – – – – – –Malaysia ............................. – – – – – – – – – – –Mexico ................................ – – – – – – – – – – –Netherlands ........................ – – – – – – – – – – –Netherlands Antilles ............ – – – – – – – – – – –Norway ............................... – – – – – – – – – – –Oman .................................. – – – – – – – – – – –Portugal .............................. – – – – – – – – – – –Russia ................................. – – – – – – – – – – –Spain .................................. – – – – – – – – – – –Sweden ............................... – – – – – – – – – – –Syria ................................... – – – – – – – – – – –Trinidad and Tobago .......... – – – – – – – – – – –United Kingdom .................. – – – – – – – – – – –Vietnam .............................. – – – – – – – – – – –Virgin Islands, U.S. ............. – – – – – – – – – – –Yemen ................................ – – – – – – – – – – –Other ................................... – – – 0 – – 0 0 0 – 0
Total ....................................... – – – 170 – – 1,900 41 237 – 2,178
Persian Gulf3 ......................... – – – – – – – – – – –
See footnotes at end of table.

Energy Information Administration/Petroleum Supply Monthly, 59 April 2018
Table 41. PAD District 1 - Imports of Crude Oil and Petroleum Products by Country of Origin, April 2018(Thousand Barrels) — Continued
Country of Origin
Oxygenates Renewable Fuels Distillate Fuel Oil
MethylTertiary
ButylEther
(MTBE)
OtherOxygen-
atesFuel
Ethanol
Biomass-BasedDiesel
OtherRenewable
Diesel
OtherRenewable
Fuels
15 ppmsulfur and
under
Greaterthan 15ppm to 500 ppm
sulfur501 to
2000 ppm
Greaterthan 2000
ppm Total
OPEC ..................................... – – – – – – – – – – –Algeria ................................ – – – – – – – – – – –Angola ................................ – – – – – – – – – – –Ecuador .............................. – – – – – – – – – – –Equatorial Guinea ............... – – – – – – – – – – –Gabon ................................. – – – – – – – – – – –Iran ..................................... – – – – – – – – – – –Iraq ..................................... – – – – – – – – – – –Kuwait ................................. – – – – – – – – – – –Libya ................................... – – – – – – – – – – –Nigeria ................................ – – – – – – – – – – –Qatar ................................... – – – – – – – – – – –Saudi Arabia ....................... – – – – – – – – – – –United Arab Emirates ......... – – – – – – – – – – –Venezuela ........................... – – – – – – – – – – –
Non-OPEC ............................. – – – 170 – – 1,900 41 237 – 2,178Argentina ............................ – – – – – – – – – – –Aruba .................................. – – – – – – – – – – –Australia .............................. – – – – – – – – – – –Bahamas ............................ – – – – – – – – – – –Bahrain ............................... – – – – – – – – – – –Belgium ............................... – – – – – – – – – – –Brazil ................................... – – – – – – – – – – –Brunei ................................. – – – – – – – – – – –Cameroon ........................... – – – – – – – – – – –Canada ............................... – – – 42 – – 1,900 41 237 – 2,178Chad ................................... – – – – – – – – – – –China .................................. – – – – – – – – – – –Colombia ............................ – – – – – – – – – – –Congo (Brazzaville) ............ – – – – – – – – – – –Denmark ............................. – – – – – – – – – – –Egypt .................................. – – – – – – – – – – –Estonia ................................ – – – – – – – – – – –Finland ................................ – – – – – – – – – – –France ................................ – – – 50 – – – – – – –Germany ............................. – – – 78 – – – – – – –Guatemala .......................... – – – – – – – – – – –India .................................... – – – – – – – – – – –Indonesia ............................ – – – – – – – – – – –Italy ..................................... – – – – – – – – – – –Korea, South ....................... – – – – – – – – – – –Latvia .................................. – – – – – – – – – – –Lithuania ............................. – – – – – – – – – – –Malaysia ............................. – – – – – – – – – – –Mexico ................................ – – – – – – – – – – –Netherlands ........................ – – – – – – – – – – –Netherlands Antilles ............ – – – – – – – – – – –Norway ............................... – – – – – – – – – – –Oman .................................. – – – – – – – – – – –Portugal .............................. – – – – – – – – – – –Russia ................................. – – – – – – – – – – –Spain .................................. – – – – – – – – – – –Sweden ............................... – – – – – – – – – – –Syria ................................... – – – – – – – – – – –Trinidad and Tobago .......... – – – – – – – – – – –United Kingdom .................. – – – – – – – – – – –Vietnam .............................. – – – – – – – – – – –Virgin Islands, U.S. ............. – – – – – – – – – – –Yemen ................................ – – – – – – – – – – –Other ................................... – – – 0 – – 0 0 0 – 0
Total ....................................... – – – 170 – – 1,900 41 237 – 2,178
Persian Gulf3 ......................... – – – – – – – – – – –
See footnotes at end of table.
Table 41. PAD District 1 - Imports of Crude Oil and Petroleum Products by Country of Origin, April 2018(Thousand Barrels) — Continued
Country of Origin
Kerosene
FinishedAviationGasoline
AviationGasolineBlending
Components
Kerosene-Type Jet
FuelSpecial
Naphthas
Residual Fuel Oil
Less than 0.31 % sulfur
0.31 to 1.00 % sulfur
Greater than1.00 % sulfur Total
OPEC ..................................... – – – 89 – – – 1,222 1,222Algeria ................................ – – – – – – – – –Angola ................................ – – – – – – – – –Ecuador .............................. – – – – – – – – –Equatorial Guinea ............... – – – – – – – – –Gabon ................................. – – – – – – – – –Iran ..................................... – – – – – – – – –Iraq ..................................... – – – 2 – – – – –Kuwait ................................. – – – – – – – – –Libya ................................... – – – – – – – – –Nigeria ................................ – – – – – – – – –Qatar ................................... – – – – – – – – –Saudi Arabia ....................... – – – – – – – – –United Arab Emirates ......... – – – – – – – – –Venezuela ........................... – – – 87 – – – 1,222 1,222
Non-OPEC ............................. – 1 – 1,113 – – – 1,724 1,724Argentina ............................ – – – – – – – – –Aruba .................................. – – – – – – – – –Australia .............................. – – – – – – – – –Bahamas ............................ – – – – – – – – –Bahrain ............................... – – – – – – – – –Belgium ............................... – – – – – – – – –Brazil ................................... – – – – – – – 17 17Brunei ................................. – – – – – – – – –Cameroon ........................... – – – – – – – – –Canada ............................... – 1 – 784 – – – 988 988Chad ................................... – – – – – – – – –China .................................. – – – – – – – – –Colombia ............................ – – – – – – – 298 298Congo (Brazzaville) ............ – – – – – – – – –Denmark ............................. – – – – – – – – –Egypt .................................. – – – – – – – – –Estonia ................................ – – – – – – – – –Finland ................................ – – – – – – – – –France ................................ – – – – – – – – –Germany ............................. – – – – – – – – –Guatemala .......................... – – – – – – – – –India .................................... – – – 329 – – – – –Indonesia ............................ – – – – – – – – –Italy ..................................... – – – – – – – – –Korea, South ....................... – – – – – – – – –Latvia .................................. – – – – – – – – –Lithuania ............................. – – – – – – – – –Malaysia ............................. – – – – – – – – –Mexico ................................ – – – – – – – – –Netherlands ........................ – – – – – – – 17 17Netherlands Antilles ............ – – – – – – – – –Norway ............................... – – – – – – – – –Oman .................................. – – – – – – – – –Portugal .............................. – – – – – – – – –Russia ................................. – – – – – – – – –Spain .................................. – – – – – – – – –Sweden ............................... – – – – – – – – –Syria ................................... – – – – – – – – –Trinidad and Tobago .......... – – – – – – – 319 319United Kingdom .................. – – – – – – – – –Vietnam .............................. – – – – – – – – –Virgin Islands, U.S. ............. – – – – – – – – –Yemen ................................ – – – – – – – – –Other ................................... – 0 – 0 – – – 85 85
Total ....................................... – 1 – 1,202 – – – 2,946 2,946
Persian Gulf3 ......................... – – – 2 – – – – –
See footnotes at end of table.

Energy Information Administration/Petroleum Supply Monthly,60 April 2018
Table 41. PAD District 1 - Imports of Crude Oil and Petroleum Products by Country of Origin, April 2018(Thousand Barrels) — Continued
Country of Origin
Petrochemical Feedstocks
WaxesPetroleum
Coke
Asphaltand Road
Oil Lubricants
Miscellan-eous
ProductsTotal
Products
TotalCrudeOil and
Products
Daily Average
Crude Oil Products TotalNaphtha
OtherOils
OPEC ..................................... – – – – – 57 – 3,040 20,036 567 101 668Algeria ................................ – – – – – – – 839 3,546 90 28 118Angola ................................ – – – – – – – 323 3,180 95 11 106Ecuador .............................. – – – – – – – – – – – –Equatorial Guinea ............... – – – – – – – – – – – –Gabon ................................. – – – – – – – – – – – –Iran ..................................... – – – – – – – – – – – –Iraq ..................................... – – – – – – – 2 2,891 96 0 96Kuwait ................................. – – – – – – – – – – – –Libya ................................... – – – – – – – – 1,610 54 – 54Nigeria ................................ – – – – – – – 264 3,701 115 9 123Qatar ................................... – – – – – – – – – – – –Saudi Arabia ....................... – – – – – – – – 3,496 117 – 117United Arab Emirates ......... – – – – – 57 – 57 57 – 2 2Venezuela ........................... – – – – – – – 1,555 1,555 – 52 52
Non-OPEC ............................. – – 95 1 761 168 – 28,019 39,306 376 934 1,310Argentina ............................ – – – – – – – – – – – –Aruba .................................. – – – – – – – – – – – –Australia .............................. – – – – – – – – – – – –Bahamas ............................ – – – – – – – – – – – –Bahrain ............................... – – – – – 15 – 15 15 – 1 1Belgium ............................... – – – – – – – 272 272 – 9 9Brazil ................................... – – – – – – – 305 305 – 10 10Brunei ................................. – – – – – – – – – – – –Cameroon ........................... – – – – – – – – 813 27 – 27Canada ............................... – – 52 – 683 91 – 10,071 15,323 175 336 511Chad ................................... – – – – – – – – – – – –China .................................. – – 39 – – – – 39 39 – 1 1Colombia ............................ – – – – – – – 1,047 1,047 – 35 35Congo (Brazzaville) ............ – – – – – – – – – – – –Denmark ............................. – – – – – – – – 380 13 – 13Egypt .................................. – – – – – – – – 999 33 – 33Estonia ................................ – – – – – – – – – – – –Finland ................................ – – – – – 15 – 15 15 – 1 1France ................................ – – – – – 13 – 360 360 – 12 12Germany ............................. – – – – – 8 – 86 86 – 3 3Guatemala .......................... – – – – – – – – – – – –India .................................... – – – – – – – 3,587 3,587 – 120 120Indonesia ............................ – – – – – – – – – – – –Italy ..................................... – – – – – 1 – 222 222 – 7 7Korea, South ....................... – – 1 – – – – 929 929 – 31 31Latvia .................................. – – – – – – – – – – – –Lithuania ............................. – – – – – – – – – – – –Malaysia ............................. – – 1 – – – – 1 1 – 0 0Mexico ................................ – – – – – – – – – – – –Netherlands ........................ – – – – – – – 1,086 1,086 – 36 36Netherlands Antilles ............ – – – – – – – – – – – –Norway ............................... – – – – – – – 983 3,017 68 33 101Oman .................................. – – – – – – – – – – – –Portugal .............................. – – – – – – – 1,320 1,320 – 44 44Russia ................................. – – – – – 24 – 1,732 1,922 6 58 64Spain .................................. – – 1 – 78 – – 1,345 1,345 – 45 45Sweden ............................... – – – – – – – 307 307 – 10 10Syria ................................... – – – – – – – – – – – –Trinidad and Tobago .......... – – – – – – – 319 319 – 11 11United Kingdom .................. – – – 1 – – – 2,026 3,645 54 68 122Vietnam .............................. – – – – – – – – – – – –Virgin Islands, U.S. ............. – – – – – – – – – – – –Yemen ................................ – – – – – – – – – – – –Other ................................... – – 1 0 0 1 – 1,952 1,952 0 63 63
Total ....................................... – – 95 1 761 225 – 31,059 59,342 943 1,035 1,978
Persian Gulf3 ......................... – – – – – 72 – 74 6,459 213 2 215
– = No Data Reported.1 Crude oil and unfinished oils are reported by PAD District of processing; all other products are reported by PAD District of Entry.2 Includes crude oil imported for storage in the Strategic Petroleum Reserve.3 Includes Bahrain, Iran, Iraq, Kuwait, Qatar, Saudi Arabia, and United Arab Emirates.
Note: Totals may not equal sum of components due to independent rounding.Source: Energy Information Administration (EIA) Form EIA-814, "Monthly Imports Report."

Energy Information Administration/Petroleum Supply Monthly, 61 April 2018
Table 41. PAD District 1 - Imports of Crude Oil and Petroleum Products by Country of Origin, April 2018(Thousand Barrels) — Continued
Country of Origin
Petrochemical Feedstocks
WaxesPetroleum
Coke
Asphaltand Road
Oil Lubricants
Miscellan-eous
ProductsTotal
Products
TotalCrudeOil and
Products
Daily Average
Crude Oil Products TotalNaphtha
OtherOils
OPEC ..................................... – – – – – 57 – 3,040 20,036 567 101 668Algeria ................................ – – – – – – – 839 3,546 90 28 118Angola ................................ – – – – – – – 323 3,180 95 11 106Ecuador .............................. – – – – – – – – – – – –Equatorial Guinea ............... – – – – – – – – – – – –Gabon ................................. – – – – – – – – – – – –Iran ..................................... – – – – – – – – – – – –Iraq ..................................... – – – – – – – 2 2,891 96 0 96Kuwait ................................. – – – – – – – – – – – –Libya ................................... – – – – – – – – 1,610 54 – 54Nigeria ................................ – – – – – – – 264 3,701 115 9 123Qatar ................................... – – – – – – – – – – – –Saudi Arabia ....................... – – – – – – – – 3,496 117 – 117United Arab Emirates ......... – – – – – 57 – 57 57 – 2 2Venezuela ........................... – – – – – – – 1,555 1,555 – 52 52
Non-OPEC ............................. – – 95 1 761 168 – 28,019 39,306 376 934 1,310Argentina ............................ – – – – – – – – – – – –Aruba .................................. – – – – – – – – – – – –Australia .............................. – – – – – – – – – – – –Bahamas ............................ – – – – – – – – – – – –Bahrain ............................... – – – – – 15 – 15 15 – 1 1Belgium ............................... – – – – – – – 272 272 – 9 9Brazil ................................... – – – – – – – 305 305 – 10 10Brunei ................................. – – – – – – – – – – – –Cameroon ........................... – – – – – – – – 813 27 – 27Canada ............................... – – 52 – 683 91 – 10,071 15,323 175 336 511Chad ................................... – – – – – – – – – – – –China .................................. – – 39 – – – – 39 39 – 1 1Colombia ............................ – – – – – – – 1,047 1,047 – 35 35Congo (Brazzaville) ............ – – – – – – – – – – – –Denmark ............................. – – – – – – – – 380 13 – 13Egypt .................................. – – – – – – – – 999 33 – 33Estonia ................................ – – – – – – – – – – – –Finland ................................ – – – – – 15 – 15 15 – 1 1France ................................ – – – – – 13 – 360 360 – 12 12Germany ............................. – – – – – 8 – 86 86 – 3 3Guatemala .......................... – – – – – – – – – – – –India .................................... – – – – – – – 3,587 3,587 – 120 120Indonesia ............................ – – – – – – – – – – – –Italy ..................................... – – – – – 1 – 222 222 – 7 7Korea, South ....................... – – 1 – – – – 929 929 – 31 31Latvia .................................. – – – – – – – – – – – –Lithuania ............................. – – – – – – – – – – – –Malaysia ............................. – – 1 – – – – 1 1 – 0 0Mexico ................................ – – – – – – – – – – – –Netherlands ........................ – – – – – – – 1,086 1,086 – 36 36Netherlands Antilles ............ – – – – – – – – – – – –Norway ............................... – – – – – – – 983 3,017 68 33 101Oman .................................. – – – – – – – – – – – –Portugal .............................. – – – – – – – 1,320 1,320 – 44 44Russia ................................. – – – – – 24 – 1,732 1,922 6 58 64Spain .................................. – – 1 – 78 – – 1,345 1,345 – 45 45Sweden ............................... – – – – – – – 307 307 – 10 10Syria ................................... – – – – – – – – – – – –Trinidad and Tobago .......... – – – – – – – 319 319 – 11 11United Kingdom .................. – – – 1 – – – 2,026 3,645 54 68 122Vietnam .............................. – – – – – – – – – – – –Virgin Islands, U.S. ............. – – – – – – – – – – – –Yemen ................................ – – – – – – – – – – – –Other ................................... – – 1 0 0 1 – 1,952 1,952 0 63 63
Total ....................................... – – 95 1 761 225 – 31,059 59,342 943 1,035 1,978
Persian Gulf3 ......................... – – – – – 72 – 74 6,459 213 2 215
– = No Data Reported.1 Crude oil and unfinished oils are reported by PAD District of processing; all other products are reported by PAD District of Entry.2 Includes crude oil imported for storage in the Strategic Petroleum Reserve.3 Includes Bahrain, Iran, Iraq, Kuwait, Qatar, Saudi Arabia, and United Arab Emirates.
Note: Totals may not equal sum of components due to independent rounding.Source: Energy Information Administration (EIA) Form EIA-814, "Monthly Imports Report."
Table 42. PAD District 2 - Imports of Crude Oil and Petroleum Products by Country of Origin, April 2018(Thousand Barrels)
Country of Origin
Crude Oil1,2
NaturalGas
LiquidsRefineryOlefins
UnfinishedOils1
Finished Motor Gasoline Motor Gasoline Blending Components
Reform-ulated
Conven-tional Total
Reform- ulated
Conven- tional Total
OPEC ..................................... 400 – – – – – – – – –Algeria ................................ – – – – – – – – – –Angola ................................ – – – – – – – – – –Ecuador .............................. – – – – – – – – – –Equatorial Guinea ............... – – – – – – – – – –Gabon ................................. – – – – – – – – – –Iran ..................................... – – – – – – – – – –Iraq ..................................... 400 – – – – – – – – –Kuwait ................................. – – – – – – – – – –Libya ................................... – – – – – – – – – –Nigeria ................................ – – – – – – – – – –Qatar ................................... – – – – – – – – – –Saudi Arabia ....................... – – – – – – – – – –United Arab Emirates ......... – – – – – – – – – –Venezuela ........................... – – – – – – – – – –
Non-OPEC ............................. 77,220 1,919 309 16 – – – – 231 231Argentina ............................ – – – – – – – – – –Aruba .................................. – – – – – – – – – –Australia .............................. – – – – – – – – – –Bahamas ............................ – – – – – – – – – –Bahrain ............................... – – – – – – – – – –Belgium ............................... – – – – – – – – – –Brazil ................................... – – – – – – – – – –Brunei ................................. – – – – – – – – – –Cameroon ........................... – – – – – – – – – –Canada ............................... 76,721 1,919 309 16 – – – – 231 231Chad ................................... – – – – – – – – – –China .................................. – – – – – – – – – –Colombia ............................ – – – – – – – – – –Congo (Brazzaville) ............ – – – – – – – – – –Denmark ............................. – – – – – – – – – –Egypt .................................. – – – – – – – – – –Estonia ................................ – – – – – – – – – –Finland ................................ – – – – – – – – – –France ................................ – – – – – – – – – –Germany ............................. – – – – – – – – – –Guatemala .......................... – – – – – – – – – –India .................................... – – – – – – – – – –Indonesia ............................ – – – – – – – – – –Italy ..................................... – – – – – – – – – –Korea, South ....................... – – – – – – – – – –Latvia .................................. – – – – – – – – – –Lithuania ............................. – – – – – – – – – –Malaysia ............................. – – – – – – – – – –Mexico ................................ 499 – – – – – – – – –Netherlands ........................ – – – – – – – – – –Netherlands Antilles ............ – – – – – – – – – –Norway ............................... – – – – – – – – – –Oman .................................. – – – – – – – – – –Portugal .............................. – – – – – – – – – –Russia ................................. – – – – – – – – – –Spain .................................. – – – – – – – – – –Sweden ............................... – – – – – – – – – –Syria ................................... – – – – – – – – – –Trinidad and Tobago .......... – – – – – – – – – –United Kingdom .................. – – – – – – – – – –Vietnam .............................. – – – – – – – – – –Virgin Islands, U.S. ............. – – – – – – – – – –Yemen ................................ – – – – – – – – – –Other ................................... 0 0 0 0 – – – – 0 0
Total ....................................... 77,620 1,919 309 16 – – – – 231 231
Persian Gulf3 ......................... 400 – – – – – – – – –
See footnotes at end of table.

Energy Information Administration/Petroleum Supply Monthly,62 April 2018
Table 42. PAD District 2 - Imports of Crude Oil and Petroleum Products by Country of Origin, April 2018(Thousand Barrels) — Continued
Country of Origin
Oxygenates Renewable Fuels Distillate Fuel Oil
MethylTertiary
ButylEther
(MTBE)
OtherOxygen-
atesFuel
Ethanol
Biomass-BasedDiesel
OtherRenewable
Diesel
OtherRenewable
Fuels
15 ppmsulfur and
under
Greaterthan 15ppm to 500 ppm
sulfur501 to
2000 ppm
Greaterthan 2000
ppm Total
OPEC ..................................... – – – – – – – – – – –Algeria ................................ – – – – – – – – – – –Angola ................................ – – – – – – – – – – –Ecuador .............................. – – – – – – – – – – –Equatorial Guinea ............... – – – – – – – – – – –Gabon ................................. – – – – – – – – – – –Iran ..................................... – – – – – – – – – – –Iraq ..................................... – – – – – – – – – – –Kuwait ................................. – – – – – – – – – – –Libya ................................... – – – – – – – – – – –Nigeria ................................ – – – – – – – – – – –Qatar ................................... – – – – – – – – – – –Saudi Arabia ....................... – – – – – – – – – – –United Arab Emirates ......... – – – – – – – – – – –Venezuela ........................... – – – – – – – – – – –
Non-OPEC ............................. – – – 21 – – 9 – 73 9 91Argentina ............................ – – – – – – – – – – –Aruba .................................. – – – – – – – – – – –Australia .............................. – – – – – – – – – – –Bahamas ............................ – – – – – – – – – – –Bahrain ............................... – – – – – – – – – – –Belgium ............................... – – – – – – – – – – –Brazil ................................... – – – – – – – – – – –Brunei ................................. – – – – – – – – – – –Cameroon ........................... – – – – – – – – – – –Canada ............................... – – – 21 – – 9 – 73 9 91Chad ................................... – – – – – – – – – – –China .................................. – – – – – – – – – – –Colombia ............................ – – – – – – – – – – –Congo (Brazzaville) ............ – – – – – – – – – – –Denmark ............................. – – – – – – – – – – –Egypt .................................. – – – – – – – – – – –Estonia ................................ – – – – – – – – – – –Finland ................................ – – – – – – – – – – –France ................................ – – – – – – – – – – –Germany ............................. – – – – – – – – – – –Guatemala .......................... – – – – – – – – – – –India .................................... – – – – – – – – – – –Indonesia ............................ – – – – – – – – – – –Italy ..................................... – – – – – – – – – – –Korea, South ....................... – – – – – – – – – – –Latvia .................................. – – – – – – – – – – –Lithuania ............................. – – – – – – – – – – –Malaysia ............................. – – – – – – – – – – –Mexico ................................ – – – – – – – – – – –Netherlands ........................ – – – – – – – – – – –Netherlands Antilles ............ – – – – – – – – – – –Norway ............................... – – – – – – – – – – –Oman .................................. – – – – – – – – – – –Portugal .............................. – – – – – – – – – – –Russia ................................. – – – – – – – – – – –Spain .................................. – – – – – – – – – – –Sweden ............................... – – – – – – – – – – –Syria ................................... – – – – – – – – – – –Trinidad and Tobago .......... – – – – – – – – – – –United Kingdom .................. – – – – – – – – – – –Vietnam .............................. – – – – – – – – – – –Virgin Islands, U.S. ............. – – – – – – – – – – –Yemen ................................ – – – – – – – – – – –Other ................................... – – – 0 – – 0 – 0 0 0
Total ....................................... – – – 21 – – 9 – 73 9 91
Persian Gulf3 ......................... – – – – – – – – – – –
See footnotes at end of table.

Energy Information Administration/Petroleum Supply Monthly, 63 April 2018
Table 42. PAD District 2 - Imports of Crude Oil and Petroleum Products by Country of Origin, April 2018(Thousand Barrels) — Continued
Country of Origin
Oxygenates Renewable Fuels Distillate Fuel Oil
MethylTertiary
ButylEther
(MTBE)
OtherOxygen-
atesFuel
Ethanol
Biomass-BasedDiesel
OtherRenewable
Diesel
OtherRenewable
Fuels
15 ppmsulfur and
under
Greaterthan 15ppm to 500 ppm
sulfur501 to
2000 ppm
Greaterthan 2000
ppm Total
OPEC ..................................... – – – – – – – – – – –Algeria ................................ – – – – – – – – – – –Angola ................................ – – – – – – – – – – –Ecuador .............................. – – – – – – – – – – –Equatorial Guinea ............... – – – – – – – – – – –Gabon ................................. – – – – – – – – – – –Iran ..................................... – – – – – – – – – – –Iraq ..................................... – – – – – – – – – – –Kuwait ................................. – – – – – – – – – – –Libya ................................... – – – – – – – – – – –Nigeria ................................ – – – – – – – – – – –Qatar ................................... – – – – – – – – – – –Saudi Arabia ....................... – – – – – – – – – – –United Arab Emirates ......... – – – – – – – – – – –Venezuela ........................... – – – – – – – – – – –
Non-OPEC ............................. – – – 21 – – 9 – 73 9 91Argentina ............................ – – – – – – – – – – –Aruba .................................. – – – – – – – – – – –Australia .............................. – – – – – – – – – – –Bahamas ............................ – – – – – – – – – – –Bahrain ............................... – – – – – – – – – – –Belgium ............................... – – – – – – – – – – –Brazil ................................... – – – – – – – – – – –Brunei ................................. – – – – – – – – – – –Cameroon ........................... – – – – – – – – – – –Canada ............................... – – – 21 – – 9 – 73 9 91Chad ................................... – – – – – – – – – – –China .................................. – – – – – – – – – – –Colombia ............................ – – – – – – – – – – –Congo (Brazzaville) ............ – – – – – – – – – – –Denmark ............................. – – – – – – – – – – –Egypt .................................. – – – – – – – – – – –Estonia ................................ – – – – – – – – – – –Finland ................................ – – – – – – – – – – –France ................................ – – – – – – – – – – –Germany ............................. – – – – – – – – – – –Guatemala .......................... – – – – – – – – – – –India .................................... – – – – – – – – – – –Indonesia ............................ – – – – – – – – – – –Italy ..................................... – – – – – – – – – – –Korea, South ....................... – – – – – – – – – – –Latvia .................................. – – – – – – – – – – –Lithuania ............................. – – – – – – – – – – –Malaysia ............................. – – – – – – – – – – –Mexico ................................ – – – – – – – – – – –Netherlands ........................ – – – – – – – – – – –Netherlands Antilles ............ – – – – – – – – – – –Norway ............................... – – – – – – – – – – –Oman .................................. – – – – – – – – – – –Portugal .............................. – – – – – – – – – – –Russia ................................. – – – – – – – – – – –Spain .................................. – – – – – – – – – – –Sweden ............................... – – – – – – – – – – –Syria ................................... – – – – – – – – – – –Trinidad and Tobago .......... – – – – – – – – – – –United Kingdom .................. – – – – – – – – – – –Vietnam .............................. – – – – – – – – – – –Virgin Islands, U.S. ............. – – – – – – – – – – –Yemen ................................ – – – – – – – – – – –Other ................................... – – – 0 – – 0 – 0 0 0
Total ....................................... – – – 21 – – 9 – 73 9 91
Persian Gulf3 ......................... – – – – – – – – – – –
See footnotes at end of table.
Table 42. PAD District 2 - Imports of Crude Oil and Petroleum Products by Country of Origin, April 2018(Thousand Barrels) — Continued
Country of Origin
Kerosene
FinishedAviationGasoline
AviationGasolineBlending
Components
Kerosene-Type Jet
FuelSpecial
Naphthas
Residual Fuel Oil
Less than 0.31 % sulfur
0.31 to 1.00 % sulfur
Greater than1.00 % sulfur Total
OPEC ..................................... – – – – – – – – –Algeria ................................ – – – – – – – – –Angola ................................ – – – – – – – – –Ecuador .............................. – – – – – – – – –Equatorial Guinea ............... – – – – – – – – –Gabon ................................. – – – – – – – – –Iran ..................................... – – – – – – – – –Iraq ..................................... – – – – – – – – –Kuwait ................................. – – – – – – – – –Libya ................................... – – – – – – – – –Nigeria ................................ – – – – – – – – –Qatar ................................... – – – – – – – – –Saudi Arabia ....................... – – – – – – – – –United Arab Emirates ......... – – – – – – – – –Venezuela ........................... – – – – – – – – –
Non-OPEC ............................. – 2 – – 46 – 32 – 32Argentina ............................ – – – – – – – – –Aruba .................................. – – – – – – – – –Australia .............................. – – – – – – – – –Bahamas ............................ – – – – – – – – –Bahrain ............................... – – – – – – – – –Belgium ............................... – – – – – – – – –Brazil ................................... – – – – – – – – –Brunei ................................. – – – – – – – – –Cameroon ........................... – – – – – – – – –Canada ............................... – 2 – – 46 – 32 – 32Chad ................................... – – – – – – – – –China .................................. – – – – – – – – –Colombia ............................ – – – – – – – – –Congo (Brazzaville) ............ – – – – – – – – –Denmark ............................. – – – – – – – – –Egypt .................................. – – – – – – – – –Estonia ................................ – – – – – – – – –Finland ................................ – – – – – – – – –France ................................ – – – – – – – – –Germany ............................. – – – – – – – – –Guatemala .......................... – – – – – – – – –India .................................... – – – – – – – – –Indonesia ............................ – – – – – – – – –Italy ..................................... – – – – – – – – –Korea, South ....................... – – – – – – – – –Latvia .................................. – – – – – – – – –Lithuania ............................. – – – – – – – – –Malaysia ............................. – – – – – – – – –Mexico ................................ – – – – – – – – –Netherlands ........................ – – – – – – – – –Netherlands Antilles ............ – – – – – – – – –Norway ............................... – – – – – – – – –Oman .................................. – – – – – – – – –Portugal .............................. – – – – – – – – –Russia ................................. – – – – – – – – –Spain .................................. – – – – – – – – –Sweden ............................... – – – – – – – – –Syria ................................... – – – – – – – – –Trinidad and Tobago .......... – – – – – – – – –United Kingdom .................. – – – – – – – – –Vietnam .............................. – – – – – – – – –Virgin Islands, U.S. ............. – – – – – – – – –Yemen ................................ – – – – – – – – –Other ................................... – 0 – – 0 – 0 – 0
Total ....................................... – 2 – – 46 – 32 – 32
Persian Gulf3 ......................... – – – – – – – – –
See footnotes at end of table.

Energy Information Administration/Petroleum Supply Monthly,64 April 2018
Table 42. PAD District 2 - Imports of Crude Oil and Petroleum Products by Country of Origin, April 2018(Thousand Barrels) — Continued
Country of Origin
Petrochemical Feedstocks
WaxesPetroleum
Coke
Asphaltand Road
Oil Lubricants
Miscellan-eous
ProductsTotal
Products
TotalCrudeOil and
Products
Daily Average
Crude Oil Products TotalNaphtha
OtherOils
OPEC ..................................... – – – – – 1 – 1 401 13 0 13Algeria ................................ – – – – – – – – – – – –Angola ................................ – – – – – – – – – – – –Ecuador .............................. – – – – – – – – – – – –Equatorial Guinea ............... – – – – – – – – – – – –Gabon ................................. – – – – – – – – – – – –Iran ..................................... – – – – – – – – – – – –Iraq ..................................... – – – – – – – – 400 13 – 13Kuwait ................................. – – – – – – – – – – – –Libya ................................... – – – – – – – – – – – –Nigeria ................................ – – – – – – – – – – – –Qatar ................................... – – – – – 1 – 1 1 – 0 0Saudi Arabia ....................... – – – – – – – – – – – –United Arab Emirates ......... – – – – – – – – – – – –Venezuela ........................... – – – – – – – – – – – –
Non-OPEC ............................. 80 69 4 24 313 126 1 3,284 80,504 2,574 109 2,683Argentina ............................ – – – – – – – – – – – –Aruba .................................. – – – – – – – – – – – –Australia .............................. – – – – – – – – – – – –Bahamas ............................ – – – – – – – – – – – –Bahrain ............................... – – – – – – – – – – – –Belgium ............................... – – – – – – – – – – – –Brazil ................................... – – – – – – – – – – – –Brunei ................................. – – – – – – – – – – – –Cameroon ........................... – – – – – – – – – – – –Canada ............................... 80 69 4 23 313 126 1 3,283 80,004 2,557 109 2,667Chad ................................... – – – – – – – – – – – –China .................................. – – – – – – – – – – – –Colombia ............................ – – – – – – – – – – – –Congo (Brazzaville) ............ – – – – – – – – – – – –Denmark ............................. – – – – – – – – – – – –Egypt .................................. – – – – – – – – – – – –Estonia ................................ – – – – – – – – – – – –Finland ................................ – – – – – – – – – – – –France ................................ – – – – – – – – – – – –Germany ............................. – – – – – – – – – – – –Guatemala .......................... – – – – – – – – – – – –India .................................... – – – – – – – – – – – –Indonesia ............................ – – – – – – – – – – – –Italy ..................................... – – – – – – – – – – – –Korea, South ....................... – – – – – – – – – – – –Latvia .................................. – – – – – – – – – – – –Lithuania ............................. – – – – – – – – – – – –Malaysia ............................. – – – – – – – – – – – –Mexico ................................ – – – – – – – – 499 17 – 17Netherlands ........................ – – – – – – – – – – – –Netherlands Antilles ............ – – – – – – – – – – – –Norway ............................... – – – – – – – – – – – –Oman .................................. – – – – – – – – – – – –Portugal .............................. – – – – – – – – – – – –Russia ................................. – – – – – – – – – – – –Spain .................................. – – – – – – – – – – – –Sweden ............................... – – – 1 – – – 1 1 – 0 0Syria ................................... – – – – – – – – – – – –Trinidad and Tobago .......... – – – – – – – – – – – –United Kingdom .................. – – – – – – – – – – – –Vietnam .............................. – – – – – – – – – – – –Virgin Islands, U.S. ............. – – – – – – – – – – – –Yemen ................................ – – – – – – – – – – – –Other ................................... 0 0 0 0 0 0 0 0 0 0 0 -1
Total ....................................... 80 69 4 24 313 127 1 3,285 80,905 2,587 110 2,697
Persian Gulf3 ......................... – – – – – 1 – 1 401 13 0 13
– = No Data Reported.1 Crude oil and unfinished oils are reported by PAD District of processing; all other products are reported by PAD District of Entry.2 Includes crude oil imported for storage in the Strategic Petroleum Reserve.3 Includes Bahrain, Iran, Iraq, Kuwait, Qatar, Saudi Arabia, and United Arab Emirates.
Note: Totals may not equal sum of components due to independent rounding.Source: Energy Information Administration (EIA) Form EIA-814, "Monthly Imports Report."

Energy Information Administration/Petroleum Supply Monthly, 65 April 2018
Table 42. PAD District 2 - Imports of Crude Oil and Petroleum Products by Country of Origin, April 2018(Thousand Barrels) — Continued
Country of Origin
Petrochemical Feedstocks
WaxesPetroleum
Coke
Asphaltand Road
Oil Lubricants
Miscellan-eous
ProductsTotal
Products
TotalCrudeOil and
Products
Daily Average
Crude Oil Products TotalNaphtha
OtherOils
OPEC ..................................... – – – – – 1 – 1 401 13 0 13Algeria ................................ – – – – – – – – – – – –Angola ................................ – – – – – – – – – – – –Ecuador .............................. – – – – – – – – – – – –Equatorial Guinea ............... – – – – – – – – – – – –Gabon ................................. – – – – – – – – – – – –Iran ..................................... – – – – – – – – – – – –Iraq ..................................... – – – – – – – – 400 13 – 13Kuwait ................................. – – – – – – – – – – – –Libya ................................... – – – – – – – – – – – –Nigeria ................................ – – – – – – – – – – – –Qatar ................................... – – – – – 1 – 1 1 – 0 0Saudi Arabia ....................... – – – – – – – – – – – –United Arab Emirates ......... – – – – – – – – – – – –Venezuela ........................... – – – – – – – – – – – –
Non-OPEC ............................. 80 69 4 24 313 126 1 3,284 80,504 2,574 109 2,683Argentina ............................ – – – – – – – – – – – –Aruba .................................. – – – – – – – – – – – –Australia .............................. – – – – – – – – – – – –Bahamas ............................ – – – – – – – – – – – –Bahrain ............................... – – – – – – – – – – – –Belgium ............................... – – – – – – – – – – – –Brazil ................................... – – – – – – – – – – – –Brunei ................................. – – – – – – – – – – – –Cameroon ........................... – – – – – – – – – – – –Canada ............................... 80 69 4 23 313 126 1 3,283 80,004 2,557 109 2,667Chad ................................... – – – – – – – – – – – –China .................................. – – – – – – – – – – – –Colombia ............................ – – – – – – – – – – – –Congo (Brazzaville) ............ – – – – – – – – – – – –Denmark ............................. – – – – – – – – – – – –Egypt .................................. – – – – – – – – – – – –Estonia ................................ – – – – – – – – – – – –Finland ................................ – – – – – – – – – – – –France ................................ – – – – – – – – – – – –Germany ............................. – – – – – – – – – – – –Guatemala .......................... – – – – – – – – – – – –India .................................... – – – – – – – – – – – –Indonesia ............................ – – – – – – – – – – – –Italy ..................................... – – – – – – – – – – – –Korea, South ....................... – – – – – – – – – – – –Latvia .................................. – – – – – – – – – – – –Lithuania ............................. – – – – – – – – – – – –Malaysia ............................. – – – – – – – – – – – –Mexico ................................ – – – – – – – – 499 17 – 17Netherlands ........................ – – – – – – – – – – – –Netherlands Antilles ............ – – – – – – – – – – – –Norway ............................... – – – – – – – – – – – –Oman .................................. – – – – – – – – – – – –Portugal .............................. – – – – – – – – – – – –Russia ................................. – – – – – – – – – – – –Spain .................................. – – – – – – – – – – – –Sweden ............................... – – – 1 – – – 1 1 – 0 0Syria ................................... – – – – – – – – – – – –Trinidad and Tobago .......... – – – – – – – – – – – –United Kingdom .................. – – – – – – – – – – – –Vietnam .............................. – – – – – – – – – – – –Virgin Islands, U.S. ............. – – – – – – – – – – – –Yemen ................................ – – – – – – – – – – – –Other ................................... 0 0 0 0 0 0 0 0 0 0 0 -1
Total ....................................... 80 69 4 24 313 127 1 3,285 80,905 2,587 110 2,697
Persian Gulf3 ......................... – – – – – 1 – 1 401 13 0 13
– = No Data Reported.1 Crude oil and unfinished oils are reported by PAD District of processing; all other products are reported by PAD District of Entry.2 Includes crude oil imported for storage in the Strategic Petroleum Reserve.3 Includes Bahrain, Iran, Iraq, Kuwait, Qatar, Saudi Arabia, and United Arab Emirates.
Note: Totals may not equal sum of components due to independent rounding.Source: Energy Information Administration (EIA) Form EIA-814, "Monthly Imports Report."
Table 43. PAD District 3 - Imports of Crude Oil and Petroleum Products by Country of Origin, April 2018(Thousand Barrels)
Country of Origin
Crude Oil1,2
NaturalGas
LiquidsRefineryOlefins
UnfinishedOils1
Finished Motor Gasoline Motor Gasoline Blending Components
Reform-ulated
Conven-tional Total
Reform- ulated
Conven- tional Total
OPEC ..................................... 55,514 – – 3,999 – – – – 55 55Algeria ................................ – – – 2,309 – – – – – –Angola ................................ 948 – – – – – – – – –Ecuador .............................. 728 – – – – – – – – –Equatorial Guinea ............... – – – – – – – – – –Gabon ................................. – – – – – – – – – –Iran ..................................... – – – – – – – – – –Iraq ..................................... 18,701 – – 110 – – – – – –Kuwait ................................. 400 – – – – – – – – –Libya ................................... – – – – – – – – – –Nigeria ................................ 4,316 – – 1 – – – – – –Qatar ................................... – – – – – – – – – –Saudi Arabia ....................... 13,587 – – 543 – – – – – –United Arab Emirates ......... – – – 1,036 – – – – – –Venezuela ........................... 16,834 – – – – – – – 55 55
Non-OPEC ............................. 38,519 – 103 9,962 – – – – 1,486 1,486Argentina ............................ 301 – – – – – – – – –Aruba .................................. – – – – – – – – – –Australia .............................. – – – – – – – – – –Bahamas ............................ – – – – – – – – – –Bahrain ............................... – – – – – – – – – –Belgium ............................... – – – 1,350 – – – – 12 12Brazil ................................... 1,640 – – 485 – – – – 25 25Brunei ................................. – – – – – – – – – –Cameroon ........................... – – – 255 – – – – – –Canada ............................... 15,058 – – 511 – – – – – –Chad ................................... – – – – – – – – – –China .................................. – – – – – – – – – –Colombia ............................ 4,430 – – – – – – – – –Congo (Brazzaville) ............ – – – 415 – – – – – –Denmark ............................. – – – – – – – – 15 15Egypt .................................. – – – 204 – – – – – –Estonia ................................ – – – – – – – – – –Finland ................................ – – – – – – – – – –France ................................ – – – 102 – – – – 30 30Germany ............................. – – – 75 – – – – – –Guatemala .......................... 281 – – – – – – – – –India .................................... – – – – – – – – – –Indonesia ............................ – – – – – – – – – –Italy ..................................... – – – 433 – – – – 358 358Korea, South ....................... – – – – – – – – – –Latvia .................................. – – – – – – – – – –Lithuania ............................. – – – – – – – – – –Malaysia ............................. – – – – – – – – – –Mexico ................................ 15,526 – – – – – – – 363 363Netherlands ........................ – – – 386 – – – – 129 129Netherlands Antilles ............ – – – – – – – – – –Norway ............................... – – – 594 – – – – 39 39Oman .................................. – – – – – – – – – –Portugal .............................. – – – – – – – – – –Russia ................................. – – – 3,720 – – – – – –Spain .................................. – – – 584 – – – – 72 72Sweden ............................... – – – – – – – – 28 28Syria ................................... – – – – – – – – – –Trinidad and Tobago .......... – – – – – – – – – –United Kingdom .................. 1,219 – – 467 – – – – 415 415Vietnam .............................. – – – – – – – – – –Virgin Islands, U.S. ............. – – – – – – – – – –Yemen ................................ – – – – – – – – – –Other ................................... 64 – 103 381 – – – – 0 0
Total ....................................... 94,033 – 103 13,961 – – – – 1,541 1,541
Persian Gulf3 ......................... 32,688 – – 1,689 – – – – – –
See footnotes at end of table.

Energy Information Administration/Petroleum Supply Monthly,66 April 2018
Table 43. PAD District 3 - Imports of Crude Oil and Petroleum Products by Country of Origin, April 2018(Thousand Barrels) — Continued
Country of Origin
Oxygenates Renewable Fuels Distillate Fuel Oil
MethylTertiary
ButylEther
(MTBE)
OtherOxygen-
atesFuel
Ethanol
Biomass-BasedDiesel
OtherRenewable
Diesel
OtherRenewable
Fuels
15 ppmsulfur and
under
Greaterthan 15ppm to 500 ppm
sulfur501 to
2000 ppm
Greaterthan 2000
ppm Total
OPEC ..................................... – – – – – – – – – – –Algeria ................................ – – – – – – – – – – –Angola ................................ – – – – – – – – – – –Ecuador .............................. – – – – – – – – – – –Equatorial Guinea ............... – – – – – – – – – – –Gabon ................................. – – – – – – – – – – –Iran ..................................... – – – – – – – – – – –Iraq ..................................... – – – – – – – – – – –Kuwait ................................. – – – – – – – – – – –Libya ................................... – – – – – – – – – – –Nigeria ................................ – – – – – – – – – – –Qatar ................................... – – – – – – – – – – –Saudi Arabia ....................... – – – – – – – – – – –United Arab Emirates ......... – – – – – – – – – – –Venezuela ........................... – – – – – – – – – – –
Non-OPEC ............................. 35 44 – 108 – – 293 – – – 293Argentina ............................ – – – – – – – – – – –Aruba .................................. – – – – – – – – – – –Australia .............................. – – – – – – – – – – –Bahamas ............................ – – – – – – – – – – –Bahrain ............................... – – – – – – – – – – –Belgium ............................... – – – – – – – – – – –Brazil ................................... 35 44 – – – – – – – – –Brunei ................................. – – – – – – – – – – –Cameroon ........................... – – – – – – – – – – –Canada ............................... – – – 71 – – – – – – –Chad ................................... – – – – – – – – – – –China .................................. – – – – – – – – – – –Colombia ............................ – – – – – – – – – – –Congo (Brazzaville) ............ – – – – – – – – – – –Denmark ............................. – – – – – – – – – – –Egypt .................................. – – – – – – – – – – –Estonia ................................ – – – – – – – – – – –Finland ................................ – – – – – – – – – – –France ................................ – – – 37 – – – – – – –Germany ............................. – – – – – – – – – – –Guatemala .......................... – – – – – – – – – – –India .................................... – – – – – – – – – – –Indonesia ............................ – – – – – – – – – – –Italy ..................................... – – – – – – – – – – –Korea, South ....................... – – – – – – – – – – –Latvia .................................. – – – – – – – – – – –Lithuania ............................. – – – – – – – – – – –Malaysia ............................. – – – – – – – – – – –Mexico ................................ – – – – – – 293 – – – 293Netherlands ........................ – – – – – – – – – – –Netherlands Antilles ............ – – – – – – – – – – –Norway ............................... – – – – – – – – – – –Oman .................................. – – – – – – – – – – –Portugal .............................. – – – – – – – – – – –Russia ................................. – – – – – – – – – – –Spain .................................. – – – – – – – – – – –Sweden ............................... – – – – – – – – – – –Syria ................................... – – – – – – – – – – –Trinidad and Tobago .......... – – – – – – – – – – –United Kingdom .................. – – – – – – – – – – –Vietnam .............................. – – – – – – – – – – –Virgin Islands, U.S. ............. – – – – – – – – – – –Yemen ................................ – – – – – – – – – – –Other ................................... 0 0 – 0 – – 0 – – – 0
Total ....................................... 35 44 – 108 – – 293 – – – 293
Persian Gulf3 ......................... – – – – – – – – – – –
See footnotes at end of table.

Energy Information Administration/Petroleum Supply Monthly, 67 April 2018
Table 43. PAD District 3 - Imports of Crude Oil and Petroleum Products by Country of Origin, April 2018(Thousand Barrels) — Continued
Country of Origin
Oxygenates Renewable Fuels Distillate Fuel Oil
MethylTertiary
ButylEther
(MTBE)
OtherOxygen-
atesFuel
Ethanol
Biomass-BasedDiesel
OtherRenewable
Diesel
OtherRenewable
Fuels
15 ppmsulfur and
under
Greaterthan 15ppm to 500 ppm
sulfur501 to
2000 ppm
Greaterthan 2000
ppm Total
OPEC ..................................... – – – – – – – – – – –Algeria ................................ – – – – – – – – – – –Angola ................................ – – – – – – – – – – –Ecuador .............................. – – – – – – – – – – –Equatorial Guinea ............... – – – – – – – – – – –Gabon ................................. – – – – – – – – – – –Iran ..................................... – – – – – – – – – – –Iraq ..................................... – – – – – – – – – – –Kuwait ................................. – – – – – – – – – – –Libya ................................... – – – – – – – – – – –Nigeria ................................ – – – – – – – – – – –Qatar ................................... – – – – – – – – – – –Saudi Arabia ....................... – – – – – – – – – – –United Arab Emirates ......... – – – – – – – – – – –Venezuela ........................... – – – – – – – – – – –
Non-OPEC ............................. 35 44 – 108 – – 293 – – – 293Argentina ............................ – – – – – – – – – – –Aruba .................................. – – – – – – – – – – –Australia .............................. – – – – – – – – – – –Bahamas ............................ – – – – – – – – – – –Bahrain ............................... – – – – – – – – – – –Belgium ............................... – – – – – – – – – – –Brazil ................................... 35 44 – – – – – – – – –Brunei ................................. – – – – – – – – – – –Cameroon ........................... – – – – – – – – – – –Canada ............................... – – – 71 – – – – – – –Chad ................................... – – – – – – – – – – –China .................................. – – – – – – – – – – –Colombia ............................ – – – – – – – – – – –Congo (Brazzaville) ............ – – – – – – – – – – –Denmark ............................. – – – – – – – – – – –Egypt .................................. – – – – – – – – – – –Estonia ................................ – – – – – – – – – – –Finland ................................ – – – – – – – – – – –France ................................ – – – 37 – – – – – – –Germany ............................. – – – – – – – – – – –Guatemala .......................... – – – – – – – – – – –India .................................... – – – – – – – – – – –Indonesia ............................ – – – – – – – – – – –Italy ..................................... – – – – – – – – – – –Korea, South ....................... – – – – – – – – – – –Latvia .................................. – – – – – – – – – – –Lithuania ............................. – – – – – – – – – – –Malaysia ............................. – – – – – – – – – – –Mexico ................................ – – – – – – 293 – – – 293Netherlands ........................ – – – – – – – – – – –Netherlands Antilles ............ – – – – – – – – – – –Norway ............................... – – – – – – – – – – –Oman .................................. – – – – – – – – – – –Portugal .............................. – – – – – – – – – – –Russia ................................. – – – – – – – – – – –Spain .................................. – – – – – – – – – – –Sweden ............................... – – – – – – – – – – –Syria ................................... – – – – – – – – – – –Trinidad and Tobago .......... – – – – – – – – – – –United Kingdom .................. – – – – – – – – – – –Vietnam .............................. – – – – – – – – – – –Virgin Islands, U.S. ............. – – – – – – – – – – –Yemen ................................ – – – – – – – – – – –Other ................................... 0 0 – 0 – – 0 – – – 0
Total ....................................... 35 44 – 108 – – 293 – – – 293
Persian Gulf3 ......................... – – – – – – – – – – –
See footnotes at end of table.
Table 43. PAD District 3 - Imports of Crude Oil and Petroleum Products by Country of Origin, April 2018(Thousand Barrels) — Continued
Country of Origin
Kerosene
FinishedAviationGasoline
AviationGasolineBlending
Components
Kerosene-Type Jet
FuelSpecial
Naphthas
Residual Fuel Oil
Less than 0.31 % sulfur
0.31 to 1.00 % sulfur
Greater than1.00 % sulfur Total
OPEC ..................................... – – – – – – – 501 501Algeria ................................ – – – – – – – – –Angola ................................ – – – – – – – – –Ecuador .............................. – – – – – – – – –Equatorial Guinea ............... – – – – – – – – –Gabon ................................. – – – – – – – – –Iran ..................................... – – – – – – – – –Iraq ..................................... – – – – – – – – –Kuwait ................................. – – – – – – – – –Libya ................................... – – – – – – – – –Nigeria ................................ – – – – – – – – –Qatar ................................... – – – – – – – – –Saudi Arabia ....................... – – – – – – – – –United Arab Emirates ......... – – – – – – – – –Venezuela ........................... – – – – – – – 501 501
Non-OPEC ............................. – – – – 530 – 242 945 1,187Argentina ............................ – – – – – – – – –Aruba .................................. – – – – – – – – –Australia .............................. – – – – – – – – –Bahamas ............................ – – – – – – – – –Bahrain ............................... – – – – – – – – –Belgium ............................... – – – – – – – – –Brazil ................................... – – – – – – – – –Brunei ................................. – – – – – – – – –Cameroon ........................... – – – – – – – – –Canada ............................... – – – – 83 – – – –Chad ................................... – – – – – – – – –China .................................. – – – – – – – – –Colombia ............................ – – – – – – – – –Congo (Brazzaville) ............ – – – – – – – – –Denmark ............................. – – – – – – – – –Egypt .................................. – – – – – – – – –Estonia ................................ – – – – – – – – –Finland ................................ – – – – – – – – –France ................................ – – – – 64 – – – –Germany ............................. – – – – – – – – –Guatemala .......................... – – – – – – – – –India .................................... – – – – – – – – –Indonesia ............................ – – – – – – – – –Italy ..................................... – – – – – – – – –Korea, South ....................... – – – – 129 – – – –Latvia .................................. – – – – – – – – –Lithuania ............................. – – – – – – – – –Malaysia ............................. – – – – – – – – –Mexico ................................ – – – – – – – 945 945Netherlands ........................ – – – – – – – – –Netherlands Antilles ............ – – – – – – – – –Norway ............................... – – – – – – – – –Oman .................................. – – – – – – – – –Portugal .............................. – – – – 30 – – – –Russia ................................. – – – – – – – – –Spain .................................. – – – – – – – – –Sweden ............................... – – – – – – – – –Syria ................................... – – – – – – – – –Trinidad and Tobago .......... – – – – – – – – –United Kingdom .................. – – – – – – – – –Vietnam .............................. – – – – – – – – –Virgin Islands, U.S. ............. – – – – – – – – –Yemen ................................ – – – – – – – – –Other ................................... – – – – 224 – 242 0 242
Total ....................................... – – – – 530 – 242 1,446 1,688
Persian Gulf3 ......................... – – – – – – – – –
See footnotes at end of table.

Energy Information Administration/Petroleum Supply Monthly,68 April 2018
Table 43. PAD District 3 - Imports of Crude Oil and Petroleum Products by Country of Origin, April 2018(Thousand Barrels) — Continued
Country of Origin
Petrochemical Feedstocks
WaxesPetroleum
Coke
Asphaltand Road
Oil Lubricants
Miscellan-eous
ProductsTotal
Products
TotalCrudeOil and
Products
Daily Average
Crude Oil Products TotalNaphtha
OtherOils
OPEC ..................................... – – – – – 429 – 4,984 60,498 1,850 166 2,017Algeria ................................ – – – – – – – 2,309 2,309 – 77 77Angola ................................ – – – – – – – – 948 32 – 32Ecuador .............................. – – – – – – – – 728 24 – 24Equatorial Guinea ............... – – – – – – – – – – – –Gabon ................................. – – – – – – – – – – – –Iran ..................................... – – – – – – – – – – – –Iraq ..................................... – – – – – – – 110 18,811 623 4 627Kuwait ................................. – – – – – – – – 400 13 – 13Libya ................................... – – – – – – – – – – – –Nigeria ................................ – – – – – – – 1 4,317 144 0 144Qatar ................................... – – – – – 228 – 228 228 – 8 8Saudi Arabia ....................... – – – – – – – 543 14,130 453 18 471United Arab Emirates ......... – – – – – 201 – 1,237 1,237 – 41 41Venezuela ........................... – – – – – – – 556 17,390 561 19 580
Non-OPEC ............................. 336 29 32 456 – 748 10 15,365 53,884 1,284 512 1,796Argentina ............................ – – – – – 4 – 4 305 10 0 10Aruba .................................. – – – – – – – – – – – –Australia .............................. – – – – – – – – – – – –Bahamas ............................ – – – – – – – – – – – –Bahrain ............................... – – – – – 123 – 123 123 – 4 4Belgium ............................... – – – – – 3 – 1,365 1,365 – 46 46Brazil ................................... – – – 145 – – – 734 2,374 55 24 79Brunei ................................. – – – – – – – – – – – –Cameroon ........................... – – – – – – – 255 255 – 9 9Canada ............................... – – – – – – – 665 15,723 502 22 524Chad ................................... – – – – – – – – – – – –China .................................. – – 10 116 – – – 126 126 – 4 4Colombia ............................ – – – – – – – – 4,430 148 – 148Congo (Brazzaville) ............ – – – – – – – 415 415 – 14 14Denmark ............................. – – – – – – – 15 15 – 1 1Egypt .................................. – – – – – – – 204 204 – 7 7Estonia ................................ – – – – – – – – – – – –Finland ................................ – – – – – – – – – – – –France ................................ – 29 – – – 20 – 282 282 – 9 9Germany ............................. – – – – – 3 – 79 79 – 3 3Guatemala .......................... – – – – – – – – 281 9 – 9India .................................... – – – – – – – – – – – –Indonesia ............................ – – – – – 68 – 68 68 – 2 2Italy ..................................... – – – – – 21 – 813 813 – 27 27Korea, South ....................... – – – – – 394 – 523 523 – 17 17Latvia .................................. – – – – – – – – – – – –Lithuania ............................. – – – – – – – – – – – –Malaysia ............................. – – 22 – – – – 22 22 – 1 1Mexico ................................ 220 – – – – – – 1,821 17,347 518 61 578Netherlands ........................ – – – – – – 10 525 525 – 18 18Netherlands Antilles ............ – – – – – – – – – – – –Norway ............................... – – – – – – – 633 633 – 21 21Oman .................................. – – – 195 – 66 – 261 261 – 9 9Portugal .............................. – – – – – – – 30 30 – 1 1Russia ................................. – – – – – – – 3,720 3,720 – 124 124Spain .................................. – – – – – – – 656 656 – 22 22Sweden ............................... – – – – – – – 28 28 – 1 1Syria ................................... – – – – – – – – – – – –Trinidad and Tobago .......... – – – – – – – – – – – –United Kingdom .................. 29 – – – – 44 – 955 2,174 41 32 72Vietnam .............................. – – – – – – – – – – – –Virgin Islands, U.S. ............. – – – – – – – – – – – –Yemen ................................ – – – – – – – – – – – –Other ................................... 87 0 0 0 – 2 0 1,043 1,107 1 33 36
Total ....................................... 336 29 32 456 – 1,177 10 20,349 114,382 3,134 678 3,813
Persian Gulf3 ......................... – – – – – 552 – 2,241 34,929 1,090 75 1,164
– = No Data Reported.1 Crude oil and unfinished oils are reported by PAD District of processing; all other products are reported by PAD District of Entry.2 Includes crude oil imported for storage in the Strategic Petroleum Reserve.3 Includes Bahrain, Iran, Iraq, Kuwait, Qatar, Saudi Arabia, and United Arab Emirates.
Note: Totals may not equal sum of components due to independent rounding.Source: Energy Information Administration (EIA) Form EIA-814, "Monthly Imports Report."

Energy Information Administration/Petroleum Supply Monthly, 69 April 2018
Table 43. PAD District 3 - Imports of Crude Oil and Petroleum Products by Country of Origin, April 2018(Thousand Barrels) — Continued
Country of Origin
Petrochemical Feedstocks
WaxesPetroleum
Coke
Asphaltand Road
Oil Lubricants
Miscellan-eous
ProductsTotal
Products
TotalCrudeOil and
Products
Daily Average
Crude Oil Products TotalNaphtha
OtherOils
OPEC ..................................... – – – – – 429 – 4,984 60,498 1,850 166 2,017Algeria ................................ – – – – – – – 2,309 2,309 – 77 77Angola ................................ – – – – – – – – 948 32 – 32Ecuador .............................. – – – – – – – – 728 24 – 24Equatorial Guinea ............... – – – – – – – – – – – –Gabon ................................. – – – – – – – – – – – –Iran ..................................... – – – – – – – – – – – –Iraq ..................................... – – – – – – – 110 18,811 623 4 627Kuwait ................................. – – – – – – – – 400 13 – 13Libya ................................... – – – – – – – – – – – –Nigeria ................................ – – – – – – – 1 4,317 144 0 144Qatar ................................... – – – – – 228 – 228 228 – 8 8Saudi Arabia ....................... – – – – – – – 543 14,130 453 18 471United Arab Emirates ......... – – – – – 201 – 1,237 1,237 – 41 41Venezuela ........................... – – – – – – – 556 17,390 561 19 580
Non-OPEC ............................. 336 29 32 456 – 748 10 15,365 53,884 1,284 512 1,796Argentina ............................ – – – – – 4 – 4 305 10 0 10Aruba .................................. – – – – – – – – – – – –Australia .............................. – – – – – – – – – – – –Bahamas ............................ – – – – – – – – – – – –Bahrain ............................... – – – – – 123 – 123 123 – 4 4Belgium ............................... – – – – – 3 – 1,365 1,365 – 46 46Brazil ................................... – – – 145 – – – 734 2,374 55 24 79Brunei ................................. – – – – – – – – – – – –Cameroon ........................... – – – – – – – 255 255 – 9 9Canada ............................... – – – – – – – 665 15,723 502 22 524Chad ................................... – – – – – – – – – – – –China .................................. – – 10 116 – – – 126 126 – 4 4Colombia ............................ – – – – – – – – 4,430 148 – 148Congo (Brazzaville) ............ – – – – – – – 415 415 – 14 14Denmark ............................. – – – – – – – 15 15 – 1 1Egypt .................................. – – – – – – – 204 204 – 7 7Estonia ................................ – – – – – – – – – – – –Finland ................................ – – – – – – – – – – – –France ................................ – 29 – – – 20 – 282 282 – 9 9Germany ............................. – – – – – 3 – 79 79 – 3 3Guatemala .......................... – – – – – – – – 281 9 – 9India .................................... – – – – – – – – – – – –Indonesia ............................ – – – – – 68 – 68 68 – 2 2Italy ..................................... – – – – – 21 – 813 813 – 27 27Korea, South ....................... – – – – – 394 – 523 523 – 17 17Latvia .................................. – – – – – – – – – – – –Lithuania ............................. – – – – – – – – – – – –Malaysia ............................. – – 22 – – – – 22 22 – 1 1Mexico ................................ 220 – – – – – – 1,821 17,347 518 61 578Netherlands ........................ – – – – – – 10 525 525 – 18 18Netherlands Antilles ............ – – – – – – – – – – – –Norway ............................... – – – – – – – 633 633 – 21 21Oman .................................. – – – 195 – 66 – 261 261 – 9 9Portugal .............................. – – – – – – – 30 30 – 1 1Russia ................................. – – – – – – – 3,720 3,720 – 124 124Spain .................................. – – – – – – – 656 656 – 22 22Sweden ............................... – – – – – – – 28 28 – 1 1Syria ................................... – – – – – – – – – – – –Trinidad and Tobago .......... – – – – – – – – – – – –United Kingdom .................. 29 – – – – 44 – 955 2,174 41 32 72Vietnam .............................. – – – – – – – – – – – –Virgin Islands, U.S. ............. – – – – – – – – – – – –Yemen ................................ – – – – – – – – – – – –Other ................................... 87 0 0 0 – 2 0 1,043 1,107 1 33 36
Total ....................................... 336 29 32 456 – 1,177 10 20,349 114,382 3,134 678 3,813
Persian Gulf3 ......................... – – – – – 552 – 2,241 34,929 1,090 75 1,164
– = No Data Reported.1 Crude oil and unfinished oils are reported by PAD District of processing; all other products are reported by PAD District of Entry.2 Includes crude oil imported for storage in the Strategic Petroleum Reserve.3 Includes Bahrain, Iran, Iraq, Kuwait, Qatar, Saudi Arabia, and United Arab Emirates.
Note: Totals may not equal sum of components due to independent rounding.Source: Energy Information Administration (EIA) Form EIA-814, "Monthly Imports Report."
Table 44. PAD District 4 and 5 - Imports of Crude Oil and Petroleum Products by Country of Origin, April 2018(Thousand Barrels)
Country of Origin
Crude Oil1,2
NaturalGas
LiquidsRefineryOlefins
UnfinishedOils1
Finished Motor Gasoline Motor Gasoline Blending Components
Reform-ulated
Conven-tional Total
Reform- ulated
Conven- tional Total
PAD District 4
OPEC ..................................... – – – – – – – – – –Algeria ................................ – – – – – – – – – –Angola ................................ – – – – – – – – – –Ecuador .............................. – – – – – – – – – –Iran ..................................... – – – – – – – – – –Iraq ..................................... – – – – – – – – – –Kuwait ................................. – – – – – – – – – –Libya ................................... – – – – – – – – – –Nigeria ................................ – – – – – – – – – –Qatar ................................... – – – – – – – – – –Saudi Arabia ....................... – – – – – – – – – –United Arab Emirates ......... – – – – – – – – – –Venezuela ........................... – – – – – – – – – –
Non-OPEC ............................. 8,492 301 – – – – – – 73 73Canada ............................... 8,492 301 – – – – – – 73 73Other ................................... 0 0 – – – – – – 0 0
Total ....................................... 8,492 301 – – – – – – 73 73
PAD District 5
OPEC ..................................... 24,150 – – 375 – – – – 228 228Algeria ................................ – – – 375 – – – – – –Angola ................................ 948 – – – – – – – – –Ecuador .............................. 6,009 – – – – – – – – –Iran ..................................... – – – – – – – – – –Iraq ..................................... 2,896 – – – – – – – – –Kuwait ................................. 2,801 – – – – – – – – –Libya ................................... 1,013 – – – – – – – – –Nigeria ................................ – – – – – – – – 228 228Qatar ................................... – – – – – – – – – –Saudi Arabia ....................... 9,489 – – – – – – – – –United Arab Emirates ......... – – – – – – – – – –Venezuela ........................... – – – – – – – – – –
Non-OPEC ............................. 14,752 1,140 – 1,415 – 253 253 319 1,456 1,775Argentina ............................ – – – – – – – – – –Aruba .................................. – – – – – – – – – –Australia .............................. – – – – – – – – – –Brazil ................................... 2,831 – – – – – – – – –Brunei ................................. – – – – – – – – – –Canada ............................... 6,407 1,085 – – – 12 12 – – –China .................................. – – – – – – – – – –Colombia ............................ 2,676 – – – – – – – 297 297Finland ................................ – – – – – – – – – –Germany ............................. – – – – – – – – – –Indonesia ............................ 1,088 – – – – – – – – –Japan .................................. – – – – – – – – 233 233Korea, South ....................... – – – 58 – 87 87 – 77 77Malaysia ............................. – – – – – – – – – –Mexico ................................ 756 – – – – – – – – –Netherlands ........................ – – – 54 – – – – 268 268Netherlands Antilles ............ – – – – – – – – – –Oman .................................. – – – – – – – – – –Papua New Guinea ............ – – – – – – – – – –Peru .................................... – – – 347 – – – – – –Singapore ........................... – – – – – – – – 158 158Sweden ............................... – – – – – – – – – –Taiwan ................................ – – – – – – – – 196 196United Kingdom .................. – – – – – – – 319 – 319Vietnam .............................. 290 – – – – – – – – –Virgin Islands, U.S. ............. – – – – – – – – – –Other ................................... 704 55 – 956 – 154 154 0 227 227
Total ....................................... 38,902 1,140 – 1,790 – 253 253 319 1,684 2,003
Persian Gulf3 ......................... 15,186 – – – – – – – – –
See footnotes at end of table.

Energy Information Administration/Petroleum Supply Monthly,70 April 2018
Table 44. PAD District 4 and 5 - Imports of Crude Oil and Petroleum Products by Country of Origin, April 2018(Thousand Barrels) — Continued
Country of Origin
Oxygenates Renewable Fuels Distillate Fuel Oil
MethylTertiary
ButylEther
(MTBE)
OtherOxygen-
atesFuel
Ethanol
Biomass-BasedDiesel
OtherRenewable
Diesel
OtherRenewable
Fuels
15 ppmsulfur and
under
Greaterthan 15ppm to 500 ppm
sulfur501 to
2000 ppm
Greaterthan 2000
ppm Total
PAD District 4
OPEC ..................................... – – – – – – – – – – –Algeria ................................ – – – – – – – – – – –Angola ................................ – – – – – – – – – – –Ecuador .............................. – – – – – – – – – – –Iran ..................................... – – – – – – – – – – –Iraq ..................................... – – – – – – – – – – –Kuwait ................................. – – – – – – – – – – –Libya ................................... – – – – – – – – – – –Nigeria ................................ – – – – – – – – – – –Qatar ................................... – – – – – – – – – – –Saudi Arabia ....................... – – – – – – – – – – –United Arab Emirates ......... – – – – – – – – – – –Venezuela ........................... – – – – – – – – – – –
Non-OPEC ............................. – – – 1 – – 21 – – – 21Canada ............................... – – – 1 – – 21 – – – 21Other ................................... – – – 0 – – 0 – – – 0
Total ....................................... – – – 1 – – 21 – – – 21
PAD District 5
OPEC ..................................... – – – – – – – – – – –Algeria ................................ – – – – – – – – – – –Angola ................................ – – – – – – – – – – –Ecuador .............................. – – – – – – – – – – –Iran ..................................... – – – – – – – – – – –Iraq ..................................... – – – – – – – – – – –Kuwait ................................. – – – – – – – – – – –Libya ................................... – – – – – – – – – – –Nigeria ................................ – – – – – – – – – – –Qatar ................................... – – – – – – – – – – –Saudi Arabia ....................... – – – – – – – – – – –United Arab Emirates ......... – – – – – – – – – – –Venezuela ........................... – – – – – – – – – – –
Non-OPEC ............................. – – – 8 446 – 149 – – – 149Argentina ............................ – – – – – – – – – – –Aruba .................................. – – – – – – – – – – –Australia .............................. – – – – – – – – – – –Brazil ................................... – – – – – – – – – – –Brunei ................................. – – – – – – – – – – –Canada ............................... – – – 8 – – 54 – – – 54China .................................. – – – – – – – – – – –Colombia ............................ – – – – – – – – – – –Finland ................................ – – – – – – – – – – –Germany ............................. – – – – – – – – – – –Indonesia ............................ – – – – – – – – – – –Japan .................................. – – – – – – 63 – – – 63Korea, South ....................... – – – – – – 32 – – – 32Malaysia ............................. – – – – – – – – – – –Mexico ................................ – – – – – – – – – – –Netherlands ........................ – – – – – – – – – – –Netherlands Antilles ............ – – – – – – – – – – –Oman .................................. – – – – – – – – – – –Papua New Guinea ............ – – – – – – – – – – –Peru .................................... – – – – – – – – – – –Singapore ........................... – – – – – – – – – – –Sweden ............................... – – – – – – – – – – –Taiwan ................................ – – – – – – – – – – –United Kingdom .................. – – – – – – – – – – –Vietnam .............................. – – – – – – – – – – –Virgin Islands, U.S. ............. – – – – – – – – – – –Other ................................... – – – 0 446 – 0 – – – 0
Total ....................................... – – – 8 446 – 149 – – – 149
Persian Gulf3 ......................... – – – – – – – – – – –
See footnotes at end of table.

Energy Information Administration/Petroleum Supply Monthly, 71 April 2018
Table 44. PAD District 4 and 5 - Imports of Crude Oil and Petroleum Products by Country of Origin, April 2018(Thousand Barrels) — Continued
Country of Origin
Oxygenates Renewable Fuels Distillate Fuel Oil
MethylTertiary
ButylEther
(MTBE)
OtherOxygen-
atesFuel
Ethanol
Biomass-BasedDiesel
OtherRenewable
Diesel
OtherRenewable
Fuels
15 ppmsulfur and
under
Greaterthan 15ppm to 500 ppm
sulfur501 to
2000 ppm
Greaterthan 2000
ppm Total
PAD District 4
OPEC ..................................... – – – – – – – – – – –Algeria ................................ – – – – – – – – – – –Angola ................................ – – – – – – – – – – –Ecuador .............................. – – – – – – – – – – –Iran ..................................... – – – – – – – – – – –Iraq ..................................... – – – – – – – – – – –Kuwait ................................. – – – – – – – – – – –Libya ................................... – – – – – – – – – – –Nigeria ................................ – – – – – – – – – – –Qatar ................................... – – – – – – – – – – –Saudi Arabia ....................... – – – – – – – – – – –United Arab Emirates ......... – – – – – – – – – – –Venezuela ........................... – – – – – – – – – – –
Non-OPEC ............................. – – – 1 – – 21 – – – 21Canada ............................... – – – 1 – – 21 – – – 21Other ................................... – – – 0 – – 0 – – – 0
Total ....................................... – – – 1 – – 21 – – – 21
PAD District 5
OPEC ..................................... – – – – – – – – – – –Algeria ................................ – – – – – – – – – – –Angola ................................ – – – – – – – – – – –Ecuador .............................. – – – – – – – – – – –Iran ..................................... – – – – – – – – – – –Iraq ..................................... – – – – – – – – – – –Kuwait ................................. – – – – – – – – – – –Libya ................................... – – – – – – – – – – –Nigeria ................................ – – – – – – – – – – –Qatar ................................... – – – – – – – – – – –Saudi Arabia ....................... – – – – – – – – – – –United Arab Emirates ......... – – – – – – – – – – –Venezuela ........................... – – – – – – – – – – –
Non-OPEC ............................. – – – 8 446 – 149 – – – 149Argentina ............................ – – – – – – – – – – –Aruba .................................. – – – – – – – – – – –Australia .............................. – – – – – – – – – – –Brazil ................................... – – – – – – – – – – –Brunei ................................. – – – – – – – – – – –Canada ............................... – – – 8 – – 54 – – – 54China .................................. – – – – – – – – – – –Colombia ............................ – – – – – – – – – – –Finland ................................ – – – – – – – – – – –Germany ............................. – – – – – – – – – – –Indonesia ............................ – – – – – – – – – – –Japan .................................. – – – – – – 63 – – – 63Korea, South ....................... – – – – – – 32 – – – 32Malaysia ............................. – – – – – – – – – – –Mexico ................................ – – – – – – – – – – –Netherlands ........................ – – – – – – – – – – –Netherlands Antilles ............ – – – – – – – – – – –Oman .................................. – – – – – – – – – – –Papua New Guinea ............ – – – – – – – – – – –Peru .................................... – – – – – – – – – – –Singapore ........................... – – – – – – – – – – –Sweden ............................... – – – – – – – – – – –Taiwan ................................ – – – – – – – – – – –United Kingdom .................. – – – – – – – – – – –Vietnam .............................. – – – – – – – – – – –Virgin Islands, U.S. ............. – – – – – – – – – – –Other ................................... – – – 0 446 – 0 – – – 0
Total ....................................... – – – 8 446 – 149 – – – 149
Persian Gulf3 ......................... – – – – – – – – – – –
See footnotes at end of table.
Table 44. PAD District 4 and 5 - Imports of Crude Oil and Petroleum Products by Country of Origin, April 2018(Thousand Barrels) — Continued
Country of Origin
Kerosene
FinishedAviationGasoline
AviationGasolineBlending
Components
Kerosene-Type Jet
FuelSpecial
Naphthas
Residual Fuel Oil
Less than 0.31 % sulfur
0.31 to 1.00 % sulfur
Greater than1.00 % sulfur Total
PAD District 4
OPEC ..................................... – – – 8 – – – – –Algeria ................................ – – – – – – – – –Angola ................................ – – – – – – – – –Ecuador .............................. – – – – – – – – –Iran ..................................... – – – – – – – – –Iraq ..................................... – – – 8 – – – – –Kuwait ................................. – – – – – – – – –Libya ................................... – – – – – – – – –Nigeria ................................ – – – – – – – – –Qatar ................................... – – – – – – – – –Saudi Arabia ....................... – – – – – – – – –United Arab Emirates ......... – – – – – – – – –Venezuela ........................... – – – – – – – – –
Non-OPEC ............................. – – – – – – – – –Canada ............................... – – – – – – – – –Other ................................... – – – 0 – – – – –
Total ....................................... – – – 8 – – – – –
PAD District 5
OPEC ..................................... – – – – – – – – –Algeria ................................ – – – – – – – – –Angola ................................ – – – – – – – – –Ecuador .............................. – – – – – – – – –Iran ..................................... – – – – – – – – –Iraq ..................................... – – – – – – – – –Kuwait ................................. – – – – – – – – –Libya ................................... – – – – – – – – –Nigeria ................................ – – – – – – – – –Qatar ................................... – – – – – – – – –Saudi Arabia ....................... – – – – – – – – –United Arab Emirates ......... – – – – – – – – –Venezuela ........................... – – – – – – – – –
Non-OPEC ............................. – – – 1,440 – – 145 891 1,036Argentina ............................ – – – – – – – – –Aruba .................................. – – – – – – – – –Australia .............................. – – – – – – – – –Brazil ................................... – – – – – – – – –Brunei ................................. – – – – – – – – –Canada ............................... – – – 12 – – 145 305 450China .................................. – – – 318 – – – – –Colombia ............................ – – – – – – – – –Finland ................................ – – – – – – – – –Germany ............................. – – – – – – – – –Indonesia ............................ – – – – – – – – –Japan .................................. – – – – – – – – –Korea, South ....................... – – – 799 – – – – –Malaysia ............................. – – – – – – – – –Mexico ................................ – – – – – – – 350 350Netherlands ........................ – – – – – – – – –Netherlands Antilles ............ – – – – – – – – –Oman .................................. – – – – – – – – –Papua New Guinea ............ – – – – – – – – –Peru .................................... – – – – – – – 236 236Singapore ........................... – – – 311 – – – – –Sweden ............................... – – – – – – – – –Taiwan ................................ – – – – – – – – –United Kingdom .................. – – – – – – – – –Vietnam .............................. – – – – – – – – –Virgin Islands, U.S. ............. – – – – – – – – –Other ................................... – – – 0 – – 0 0 0
Total ....................................... – – – 1,440 – – 145 891 1,036
Persian Gulf3 ......................... – – – – – – – – –
See footnotes at end of table.

Energy Information Administration/Petroleum Supply Monthly,72 April 2018
Table 44. PAD District 4 and 5 - Imports of Crude Oil and Petroleum Products by Country of Origin, April 2018(Thousand Barrels) — Continued
Country of Origin
Petrochemical Feedstocks
WaxesPetroleum
Coke
Asphaltand Road
Oil Lubricants
Miscellan-eous
ProductsTotal
Products
TotalCrudeOil and
Products
Daily Average
Crude Oil Products TotalNaphtha
OtherOils
PAD District 4
OPEC ..................................... – – – – – – – 8 8 – 0 0Algeria ................................ – – – – – – – – – – – –Angola ................................ – – – – – – – – – – – –Ecuador .............................. – – – – – – – – – – – –Iran ..................................... – – – – – – – – – – – –Iraq ..................................... – – – – – – – 8 8 – 0 0Kuwait ................................. – – – – – – – – – – – –Libya ................................... – – – – – – – – – – – –Nigeria ................................ – – – – – – – – – – – –Qatar ................................... – – – – – – – – – – – –Saudi Arabia ....................... – – – – – – – – – – – –United Arab Emirates ......... – – – – – – – – – – – –Venezuela ........................... – – – – – – – – – – – –
Non-OPEC ............................. – – – – 15 – 1 412 8,904 283 14 297Canada ............................... – – – – 15 – 1 412 8,904 283 14 297Other ................................... – – – – 0 – 0 0 0 0 0 0
Total ....................................... – – – – 15 – 1 420 8,912 283 14 297
PAD District 5
OPEC ..................................... – – – – – – – 603 24,753 805 20 825Algeria ................................ – – – – – – – 375 375 – 13 13Angola ................................ – – – – – – – – 948 32 – 32Ecuador .............................. – – – – – – – – 6,009 200 – 200Iran ..................................... – – – – – – – – – – – –Iraq ..................................... – – – – – – – – 2,896 97 – 97Kuwait ................................. – – – – – – – – 2,801 93 – 93Libya ................................... – – – – – – – – 1,013 34 – 34Nigeria ................................ – – – – – – – 228 228 – 8 8Qatar ................................... – – – – – – – – – – – –Saudi Arabia ....................... – – – – – – – – 9,489 316 – 316United Arab Emirates ......... – – – – – – – – – – – –Venezuela ........................... – – – – – – – – – – – –
Non-OPEC ............................. 80 – 38 33 60 6 – 7,879 22,631 492 263 754Argentina ............................ – – – – – – – – – – – –Aruba .................................. – – – – – – – – – – – –Australia .............................. – – – – – – – – – – – –Brazil ................................... – – – – – – – – 2,831 94 – 94Brunei ................................. – – – – – – – – – – – –Canada ............................... – – – 33 60 6 – 1,720 8,127 214 57 271China .................................. – – 37 – – – – 355 355 – 12 12Colombia ............................ – – – – – – – 297 2,973 89 10 99Finland ................................ – – – – – – – – – – – –Germany ............................. – – – – – – – – – – – –Indonesia ............................ – – – – – – – – 1,088 36 – 36Japan .................................. – – – – – – – 296 296 – 10 10Korea, South ....................... – – – – – – – 1,053 1,053 – 35 35Malaysia ............................. – – 1 – – – – 1 1 – 0 0Mexico ................................ – – – – – – – 350 1,106 25 12 37Netherlands ........................ – – – – – – – 322 322 – 11 11Netherlands Antilles ............ – – – – – – – – – – – –Oman .................................. – – – – – – – – – – – –Papua New Guinea ............ – – – – – – – – – – – –Peru .................................... – – – – – – – 583 583 – 19 19Singapore ........................... – – – – – – – 915 915 – 31 31Sweden ............................... – – – – – – – – – – – –Taiwan ................................ 80 – – – – – – 276 276 – 9 9United Kingdom .................. – – – – – – – 319 319 – 11 11Vietnam .............................. – – – – – – – – 290 10 – 10Virgin Islands, U.S. ............. – – – – – – – – – – – –Other ................................... 0 – 0 0 0 0 – 1,392 2,096 24 46 69
Total ....................................... 80 – 38 33 60 6 – 8,482 47,384 1,297 283 1,579
Persian Gulf3 ......................... – – – – – – – – 15,186 506 – 506
– = No Data Reported.1 Crude oil and unfinished oils are reported by PAD District of processing; all other products are reported by PAD District of Entry.2 Includes crude oil imported for storage in the Strategic Petroleum Reserve.3 Includes Bahrain, Iran, Iraq, Kuwait, Qatar, Saudi Arabia, and United Arab Emirates.
Note: Totals may not equal sum of components due to independent rounding.Source: Energy Information Administration (EIA) Form EIA-814, "Monthly Imports Report."

Energy Information Administration/Petroleum Supply Monthly, 73 April 2018
Table 44. PAD District 4 and 5 - Imports of Crude Oil and Petroleum Products by Country of Origin, April 2018(Thousand Barrels) — Continued
Country of Origin
Petrochemical Feedstocks
WaxesPetroleum
Coke
Asphaltand Road
Oil Lubricants
Miscellan-eous
ProductsTotal
Products
TotalCrudeOil and
Products
Daily Average
Crude Oil Products TotalNaphtha
OtherOils
PAD District 4
OPEC ..................................... – – – – – – – 8 8 – 0 0Algeria ................................ – – – – – – – – – – – –Angola ................................ – – – – – – – – – – – –Ecuador .............................. – – – – – – – – – – – –Iran ..................................... – – – – – – – – – – – –Iraq ..................................... – – – – – – – 8 8 – 0 0Kuwait ................................. – – – – – – – – – – – –Libya ................................... – – – – – – – – – – – –Nigeria ................................ – – – – – – – – – – – –Qatar ................................... – – – – – – – – – – – –Saudi Arabia ....................... – – – – – – – – – – – –United Arab Emirates ......... – – – – – – – – – – – –Venezuela ........................... – – – – – – – – – – – –
Non-OPEC ............................. – – – – 15 – 1 412 8,904 283 14 297Canada ............................... – – – – 15 – 1 412 8,904 283 14 297Other ................................... – – – – 0 – 0 0 0 0 0 0
Total ....................................... – – – – 15 – 1 420 8,912 283 14 297
PAD District 5
OPEC ..................................... – – – – – – – 603 24,753 805 20 825Algeria ................................ – – – – – – – 375 375 – 13 13Angola ................................ – – – – – – – – 948 32 – 32Ecuador .............................. – – – – – – – – 6,009 200 – 200Iran ..................................... – – – – – – – – – – – –Iraq ..................................... – – – – – – – – 2,896 97 – 97Kuwait ................................. – – – – – – – – 2,801 93 – 93Libya ................................... – – – – – – – – 1,013 34 – 34Nigeria ................................ – – – – – – – 228 228 – 8 8Qatar ................................... – – – – – – – – – – – –Saudi Arabia ....................... – – – – – – – – 9,489 316 – 316United Arab Emirates ......... – – – – – – – – – – – –Venezuela ........................... – – – – – – – – – – – –
Non-OPEC ............................. 80 – 38 33 60 6 – 7,879 22,631 492 263 754Argentina ............................ – – – – – – – – – – – –Aruba .................................. – – – – – – – – – – – –Australia .............................. – – – – – – – – – – – –Brazil ................................... – – – – – – – – 2,831 94 – 94Brunei ................................. – – – – – – – – – – – –Canada ............................... – – – 33 60 6 – 1,720 8,127 214 57 271China .................................. – – 37 – – – – 355 355 – 12 12Colombia ............................ – – – – – – – 297 2,973 89 10 99Finland ................................ – – – – – – – – – – – –Germany ............................. – – – – – – – – – – – –Indonesia ............................ – – – – – – – – 1,088 36 – 36Japan .................................. – – – – – – – 296 296 – 10 10Korea, South ....................... – – – – – – – 1,053 1,053 – 35 35Malaysia ............................. – – 1 – – – – 1 1 – 0 0Mexico ................................ – – – – – – – 350 1,106 25 12 37Netherlands ........................ – – – – – – – 322 322 – 11 11Netherlands Antilles ............ – – – – – – – – – – – –Oman .................................. – – – – – – – – – – – –Papua New Guinea ............ – – – – – – – – – – – –Peru .................................... – – – – – – – 583 583 – 19 19Singapore ........................... – – – – – – – 915 915 – 31 31Sweden ............................... – – – – – – – – – – – –Taiwan ................................ 80 – – – – – – 276 276 – 9 9United Kingdom .................. – – – – – – – 319 319 – 11 11Vietnam .............................. – – – – – – – – 290 10 – 10Virgin Islands, U.S. ............. – – – – – – – – – – – –Other ................................... 0 – 0 0 0 0 – 1,392 2,096 24 46 69
Total ....................................... 80 – 38 33 60 6 – 8,482 47,384 1,297 283 1,579
Persian Gulf3 ......................... – – – – – – – – 15,186 506 – 506
– = No Data Reported.1 Crude oil and unfinished oils are reported by PAD District of processing; all other products are reported by PAD District of Entry.2 Includes crude oil imported for storage in the Strategic Petroleum Reserve.3 Includes Bahrain, Iran, Iraq, Kuwait, Qatar, Saudi Arabia, and United Arab Emirates.
Note: Totals may not equal sum of components due to independent rounding.Source: Energy Information Administration (EIA) Form EIA-814, "Monthly Imports Report."
Table 45. PAD District 1 - Year-to-Date Imports of Crude Oil and Petroleum Products by Country of Origin, January-April 2018(Thousand Barrels)
Country of Origin
Crude Oil1,2
NaturalGas
LiquidsRefineryOlefins
UnfinishedOils1
Finished Motor Gasoline Motor Gasoline Blending Components
Reform-ulated
Conven-tional Total
Reform- ulated
Conven- tional Total
OPEC ..................................... 59,031 140 – 1,767 – – – – 4,376 4,376Algeria ................................ 9,213 140 – 1,339 – – – – – –Angola ................................ 3,918 – – – – – – – 473 473Ecuador .............................. – – – – – – – – – –Equatorial Guinea ............... 1,001 – – – – – – – – –Gabon ................................. – – – – – – – – – –Iran ..................................... – – – – – – – – – –Iraq ..................................... 6,149 – – 398 – – – – – –Kuwait ................................. – – – – – – – – – –Libya ................................... 4,557 – – – – – – – – –Nigeria ................................ 22,099 – – 30 – – – – 1,552 1,552Qatar ................................... – – – – – – – – – –Saudi Arabia ....................... 12,094 – – – – – – – – –United Arab Emirates ......... – – – – – – – – – –Venezuela ........................... – – – – – – – – 2,351 2,351
Non-OPEC ............................. 43,977 7,174 663 1,948 – 3,327 3,327 21,967 35,840 57,807Argentina ............................ – – – – – – – – – –Aruba .................................. – – – – – – – – – –Australia .............................. – – – – – – – – – –Bahamas ............................ – – – – – – – – – –Bahrain ............................... – – – – – – – – – –Belgium ............................... – – – – – – – 147 1,246 1,393Brazil ................................... – – – – – – – – 1,785 1,785Brunei ................................. – – – – – – – – – –Cameroon ........................... 1,142 – – – – – – – – –Canada ............................... 21,394 6,371 663 – – 981 981 14,407 4,772 19,179Chad ................................... 1,854 – – – – – – – – –China .................................. – – – – – – – – – –Colombia ............................ 5,445 – – 209 – – – – 1,918 1,918Congo (Brazzaville) ............ 952 – – – – – – – – –Denmark ............................. 380 – – – – – – – – –Egypt .................................. 2,748 – – – – – – – – –Estonia ................................ – – – – – – – – – –Finland ................................ – – – – – – – – 828 828France ................................ – – – – – – – 2,038 546 2,584Germany ............................. – – – 26 – 18 18 – – –Guatemala .......................... – – – – – – – – – –India .................................... – – – – – – – – 4,832 4,832Indonesia ............................ – – – – – – – – – –Italy ..................................... – – – – – – – – 546 546Korea, South ....................... – – – – – – – – 1,078 1,078Latvia .................................. – – – – – – – – – –Lithuania ............................. – – – – – – – – – –Malaysia ............................. – – – – – – – – – –Mexico ................................ – – – – – – – – – –Netherlands ........................ – – – 57 – 625 625 390 1,879 2,269Netherlands Antilles ............ – – – – – – – – – –Norway ............................... 5,551 540 – – – – – – 983 983Oman .................................. – – – – – – – – – –Portugal .............................. – – – – – – – 563 2,211 2,774Russia ................................. 1,243 – – 656 – 174 174 185 4,824 5,009Spain .................................. – – – 353 – 275 275 – 4,474 4,474Sweden ............................... – 263 – – – 968 968 – 621 621Syria ................................... – – – – – – – – – –Trinidad and Tobago .......... – – – – – – – – – –United Kingdom .................. 2,218 – – – – 286 286 4,237 924 5,161Vietnam .............................. – – – – – – – – – –Virgin Islands, U.S. ............. – – – – – – – – – –Yemen ................................ – – – – – – – – – –Other ................................... 1,050 0 0 647 – 0 0 0 2,373 2,373
Total ....................................... 103,008 7,314 663 3,715 – 3,327 3,327 21,967 40,216 62,183
Persian Gulf3 ......................... 18,243 – – 398 – – – – – –
See footnotes at end of table.

Energy Information Administration/Petroleum Supply Monthly,74 April 2018
Table 45. PAD District 1 - Year-to-Date Imports of Crude Oil and Petroleum Products by Country of Origin, January-April 2018(Thousand Barrels) — Continued
Country of Origin
Oxygenates Renewable Fuels Distillate Fuel Oil
MethylTertiary
ButylEther
(MTBE)
OtherOxygen-
atesFuel
Ethanol
Biomass-BasedDiesel
OtherRenewable
Diesel
OtherRenewable
Fuels
15 ppmsulfur and
under
Greaterthan 15ppm to 500 ppm
sulfur501 to
2000 ppm
Greaterthan 2000
ppm Total
OPEC ..................................... – – – – – – 3,545 – – 100 3,645Algeria ................................ – – – – – – – – – – –Angola ................................ – – – – – – – – – – –Ecuador .............................. – – – – – – – – – – –Equatorial Guinea ............... – – – – – – – – – – –Gabon ................................. – – – – – – – – – – –Iran ..................................... – – – – – – – – – – –Iraq ..................................... – – – – – – – – – – –Kuwait ................................. – – – – – – – – – – –Libya ................................... – – – – – – – – – – –Nigeria ................................ – – – – – – – – – – –Qatar ................................... – – – – – – 1,408 – – – 1,408Saudi Arabia ....................... – – – – – – 2,137 – – – 2,137United Arab Emirates ......... – – – – – – – – – – –Venezuela ........................... – – – – – – – – – 100 100
Non-OPEC ............................. – – – 687 – – 14,604 759 2,603 350 18,316Argentina ............................ – – – – – – – – – – –Aruba .................................. – – – – – – – – – – –Australia .............................. – – – – – – – – – – –Bahamas ............................ – – – – – – – – – – –Bahrain ............................... – – – – – – – – – – –Belgium ............................... – – – – – – 605 – – – 605Brazil ................................... – – – – – – 717 – – – 717Brunei ................................. – – – – – – – – – – –Cameroon ........................... – – – – – – – – – – –Canada ............................... – – – 226 – – 9,269 186 2,353 – 11,808Chad ................................... – – – – – – – – – – –China .................................. – – – – – – – – – – –Colombia ............................ – – – – – – 730 – – 300 1,030Congo (Brazzaville) ............ – – – – – – – – – – –Denmark ............................. – – – – – – – – – – –Egypt .................................. – – – – – – – – – – –Estonia ................................ – – – – – – – – – – –Finland ................................ – – – – – – – – – – –France ................................ – – – 50 – – – – – – –Germany ............................. – – – 411 – – – – – – –Guatemala .......................... – – – – – – – – – – –India .................................... – – – – – – 2,279 – – – 2,279Indonesia ............................ – – – – – – – – – – –Italy ..................................... – – – – – – – – – – –Korea, South ....................... – – – – – – – – – – –Latvia .................................. – – – – – – – – – – –Lithuania ............................. – – – – – – – – – – –Malaysia ............................. – – – – – – – – – – –Mexico ................................ – – – – – – – – – – –Netherlands ........................ – – – – – – 508 – – – 508Netherlands Antilles ............ – – – – – – – – – – –Norway ............................... – – – – – – – – – – –Oman .................................. – – – – – – 161 – – – 161Portugal .............................. – – – – – – – – – – –Russia ................................. – – – – – – 335 573 250 – 1,158Spain .................................. – – – – – – – – – – –Sweden ............................... – – – – – – – – – – –Syria ................................... – – – – – – – – – – –Trinidad and Tobago .......... – – – – – – – – – – –United Kingdom .................. – – – – – – – – – – –Vietnam .............................. – – – – – – – – – – –Virgin Islands, U.S. ............. – – – – – – – – – – –Yemen ................................ – – – – – – – – – – –Other ................................... – – – 0 – – 0 0 0 50 50
Total ....................................... – – – 687 – – 18,149 759 2,603 450 21,961
Persian Gulf3 ......................... – – – – – – 3,545 – – – 3,545
See footnotes at end of table.

Energy Information Administration/Petroleum Supply Monthly, 75 April 2018
Table 45. PAD District 1 - Year-to-Date Imports of Crude Oil and Petroleum Products by Country of Origin, January-April 2018(Thousand Barrels) — Continued
Country of Origin
Oxygenates Renewable Fuels Distillate Fuel Oil
MethylTertiary
ButylEther
(MTBE)
OtherOxygen-
atesFuel
Ethanol
Biomass-BasedDiesel
OtherRenewable
Diesel
OtherRenewable
Fuels
15 ppmsulfur and
under
Greaterthan 15ppm to 500 ppm
sulfur501 to
2000 ppm
Greaterthan 2000
ppm Total
OPEC ..................................... – – – – – – 3,545 – – 100 3,645Algeria ................................ – – – – – – – – – – –Angola ................................ – – – – – – – – – – –Ecuador .............................. – – – – – – – – – – –Equatorial Guinea ............... – – – – – – – – – – –Gabon ................................. – – – – – – – – – – –Iran ..................................... – – – – – – – – – – –Iraq ..................................... – – – – – – – – – – –Kuwait ................................. – – – – – – – – – – –Libya ................................... – – – – – – – – – – –Nigeria ................................ – – – – – – – – – – –Qatar ................................... – – – – – – 1,408 – – – 1,408Saudi Arabia ....................... – – – – – – 2,137 – – – 2,137United Arab Emirates ......... – – – – – – – – – – –Venezuela ........................... – – – – – – – – – 100 100
Non-OPEC ............................. – – – 687 – – 14,604 759 2,603 350 18,316Argentina ............................ – – – – – – – – – – –Aruba .................................. – – – – – – – – – – –Australia .............................. – – – – – – – – – – –Bahamas ............................ – – – – – – – – – – –Bahrain ............................... – – – – – – – – – – –Belgium ............................... – – – – – – 605 – – – 605Brazil ................................... – – – – – – 717 – – – 717Brunei ................................. – – – – – – – – – – –Cameroon ........................... – – – – – – – – – – –Canada ............................... – – – 226 – – 9,269 186 2,353 – 11,808Chad ................................... – – – – – – – – – – –China .................................. – – – – – – – – – – –Colombia ............................ – – – – – – 730 – – 300 1,030Congo (Brazzaville) ............ – – – – – – – – – – –Denmark ............................. – – – – – – – – – – –Egypt .................................. – – – – – – – – – – –Estonia ................................ – – – – – – – – – – –Finland ................................ – – – – – – – – – – –France ................................ – – – 50 – – – – – – –Germany ............................. – – – 411 – – – – – – –Guatemala .......................... – – – – – – – – – – –India .................................... – – – – – – 2,279 – – – 2,279Indonesia ............................ – – – – – – – – – – –Italy ..................................... – – – – – – – – – – –Korea, South ....................... – – – – – – – – – – –Latvia .................................. – – – – – – – – – – –Lithuania ............................. – – – – – – – – – – –Malaysia ............................. – – – – – – – – – – –Mexico ................................ – – – – – – – – – – –Netherlands ........................ – – – – – – 508 – – – 508Netherlands Antilles ............ – – – – – – – – – – –Norway ............................... – – – – – – – – – – –Oman .................................. – – – – – – 161 – – – 161Portugal .............................. – – – – – – – – – – –Russia ................................. – – – – – – 335 573 250 – 1,158Spain .................................. – – – – – – – – – – –Sweden ............................... – – – – – – – – – – –Syria ................................... – – – – – – – – – – –Trinidad and Tobago .......... – – – – – – – – – – –United Kingdom .................. – – – – – – – – – – –Vietnam .............................. – – – – – – – – – – –Virgin Islands, U.S. ............. – – – – – – – – – – –Yemen ................................ – – – – – – – – – – –Other ................................... – – – 0 – – 0 0 0 50 50
Total ....................................... – – – 687 – – 18,149 759 2,603 450 21,961
Persian Gulf3 ......................... – – – – – – 3,545 – – – 3,545
See footnotes at end of table.
Table 45. PAD District 1 - Year-to-Date Imports of Crude Oil and Petroleum Products by Country of Origin, January-April 2018(Thousand Barrels) — Continued
Country of Origin
Kerosene
FinishedAviationGasoline
AviationGasolineBlending
Components
Kerosene-Type Jet
FuelSpecial
Naphthas
Residual Fuel Oil
Less than 0.31 % sulfur
0.31 to 1.00 % sulfur
Greater than1.00 % sulfur Total
OPEC ..................................... – – – 1,136 – 147 – 3,111 3,258Algeria ................................ – – – – – – – – –Angola ................................ – – – – – – – – –Ecuador .............................. – – – – – – – – –Equatorial Guinea ............... – – – – – – – – –Gabon ................................. – – – – – – – – –Iran ..................................... – – – – – – – – –Iraq ..................................... – – – 2 – – – – –Kuwait ................................. – – – 118 – – – – –Libya ................................... – – – – – 147 – – 147Nigeria ................................ – – – – – – – – –Qatar ................................... – – – – – – – – –Saudi Arabia ....................... – – – 58 – – – – –United Arab Emirates ......... – – – – – – – – –Venezuela ........................... – – – 958 – – – 3,111 3,111
Non-OPEC ............................. 506 23 – 4,616 – 545 884 8,660 10,089Argentina ............................ – – – – – 204 317 – 521Aruba .................................. – – – – – – – – –Australia .............................. – – – – – – – – –Bahamas ............................ – – – – – – – – –Bahrain ............................... – – – – – – – – –Belgium ............................... – – – – – – – – –Brazil ................................... – – – – – 80 315 39 434Brunei ................................. – – – – – – – – –Cameroon ........................... – – – – – – – – –Canada ............................... – 4 – 2,257 – – 127 3,557 3,684Chad ................................... – – – – – – – – –China .................................. 153 – – 116 – – – – –Colombia ............................ – – – – – – – 1,206 1,206Congo (Brazzaville) ............ – – – – – – – – –Denmark ............................. – – – – – – – – –Egypt .................................. – – – – – – – – –Estonia ................................ – – – – – – – – –Finland ................................ – – – – – – – – –France ................................ – – – – – – – – –Germany ............................. – – – – – – – – –Guatemala .......................... – – – – – – – – –India .................................... – – – 1,460 – – – – –Indonesia ............................ – – – – – – – – –Italy ..................................... – – – 74 – – – – –Korea, South ....................... 353 – – 680 – – – – –Latvia .................................. – – – – – – – – –Lithuania ............................. – – – – – – – – –Malaysia ............................. – – – – – – – – –Mexico ................................ – – – – – – – 316 316Netherlands ........................ – 19 – – – – – 277 277Netherlands Antilles ............ – – – – – – – – –Norway ............................... – – – – – – – – –Oman .................................. – – – – – – – – –Portugal .............................. – – – – – – – – –Russia ................................. – – – – – – – 260 260Spain .................................. – – – – – – – 80 80Sweden ............................... – – – – – – – 286 286Syria ................................... – – – – – – – – –Trinidad and Tobago .......... – – – – – – – 2,101 2,101United Kingdom .................. – – – – – – – – –Vietnam .............................. – – – – – – – – –Virgin Islands, U.S. ............. – – – – – – – – –Yemen ................................ – – – – – – – – –Other ................................... 0 0 – 29 – 261 125 538 924
Total ....................................... 506 23 – 5,752 – 692 884 11,771 13,347
Persian Gulf3 ......................... – – – 178 – – – – –
See footnotes at end of table.

Energy Information Administration/Petroleum Supply Monthly,76 April 2018
Table 45. PAD District 1 - Year-to-Date Imports of Crude Oil and Petroleum Products by Country of Origin, January-April 2018(Thousand Barrels) — Continued
Country of Origin
Petrochemical Feedstocks
WaxesPetroleum
Coke
Asphaltand Road
Oil Lubricants
Miscellan-eous
ProductsTotal
Products
TotalCrudeOil and
Products
Daily Average
Crude Oil Products TotalNaphtha
OtherOils
OPEC ..................................... – – – – 436 87 – 14,845 73,876 492 124 616Algeria ................................ – – – – – – – 1,479 10,692 77 12 89Angola ................................ – – – – – – – 473 4,391 33 4 37Ecuador .............................. – – – – – – – – – – – –Equatorial Guinea ............... – – – – – – – – 1,001 8 – 8Gabon ................................. – – – – – – – – – – – –Iran ..................................... – – – – – – – – – – – –Iraq ..................................... – – – – – – – 400 6,549 51 3 55Kuwait ................................. – – – – – – – 118 118 – 1 1Libya ................................... – – – – – – – 147 4,704 38 1 39Nigeria ................................ – – – – – – – 1,582 23,681 184 13 197Qatar ................................... – – – – – – – 1,408 1,408 – 12 12Saudi Arabia ....................... – – – – – – – 2,195 14,289 101 18 119United Arab Emirates ......... – – – – – 87 – 87 87 – 1 1Venezuela ........................... – – – – 436 – – 6,956 6,956 – 58 58
Non-OPEC ............................. 4 – 289 171 2,140 631 – 108,391 152,368 366 903 1,270Argentina ............................ – – – – – 12 – 533 533 – 4 4Aruba .................................. – – – – – – – – – – – –Australia .............................. – – – – – – – – – – – –Bahamas ............................ – – – – – – – – – – – –Bahrain ............................... – – – – – 15 – 15 15 – 0 0Belgium ............................... – – – – 78 10 – 2,086 2,086 – 17 17Brazil ................................... – – – – – – – 2,936 2,936 – 24 24Brunei ................................. – – – – – – – – – – – –Cameroon ........................... – – – – – – – – 1,142 10 – 10Canada ............................... – – 161 – 1,854 413 – 47,601 68,995 178 397 575Chad ................................... – – – – – – – – 1,854 15 – 15China .................................. – – 100 – – – – 369 369 – 3 3Colombia ............................ – – – 167 – – – 4,530 9,975 45 38 83Congo (Brazzaville) ............ – – – – – – – – 952 8 – 8Denmark ............................. – – – – – – – – 380 3 – 3Egypt .................................. – – – – – – – – 2,748 23 – 23Estonia ................................ – – – – – – – – – – – –Finland ................................ – – – – – 15 – 843 843 – 7 7France ................................ – – – – – 38 – 2,672 2,672 – 22 22Germany ............................. – – 17 – – 39 – 511 511 – 4 4Guatemala .......................... – – – – – – – – – – – –India .................................... – – – – – – – 8,571 8,571 – 71 71Indonesia ............................ – – – – – – – – – – – –Italy ..................................... – – – – – 8 – 628 628 – 5 5Korea, South ....................... – – 3 – – 46 – 2,160 2,160 – 18 18Latvia .................................. – – – – – – – – – – – –Lithuania ............................. – – – – – – – – – – – –Malaysia ............................. – – 2 – – – – 2 2 – 0 0Mexico ................................ – – – – – – – 316 316 – 3 3Netherlands ........................ – – – – – – – 3,755 3,755 – 31 31Netherlands Antilles ............ – – – – – – – – – – – –Norway ............................... – – – – – – – 1,523 7,074 46 13 59Oman .................................. – – – – – – – 161 161 – 1 1Portugal .............................. – – – – – – – 2,774 2,774 – 23 23Russia ................................. – – – – – 24 – 7,281 8,524 10 61 71Spain .................................. – – 5 – 129 – – 5,316 5,316 – 44 44Sweden ............................... – – – – – – – 2,138 2,138 – 18 18Syria ................................... – – – – – – – – – – – –Trinidad and Tobago .......... – – – – – – – 2,101 2,101 – 18 18United Kingdom .................. 4 – – 1 – – – 5,452 7,670 18 45 64Vietnam .............................. – – – – – – – – – – – –Virgin Islands, U.S. ............. – – – – – – – – – – – –Yemen ................................ – – – – – – – – – – – –Other ................................... 0 – 1 3 79 11 – 4,117 5,167 10 36 46
Total ....................................... 4 – 289 171 2,576 718 – 123,236 226,244 858 1,027 1,885
Persian Gulf3 ......................... – – – – – 102 – 4,223 22,466 152 35 187
– = No Data Reported.1 Crude oil and unfinished oils are reported by PAD District of processing; all other products are reported by PAD District of Entry.2 Includes crude oil imported for storage in the Strategic Petroleum Reserve.3 Includes Bahrain, Iran, Iraq, Kuwait, Qatar, Saudi Arabia, and United Arab Emirates.
Note: Totals may not equal sum of components due to independent rounding.Source: Energy Information Administration (EIA) Form EIA-814, "Monthly Imports Report."

Energy Information Administration/Petroleum Supply Monthly, 77 April 2018
Table 45. PAD District 1 - Year-to-Date Imports of Crude Oil and Petroleum Products by Country of Origin, January-April 2018(Thousand Barrels) — Continued
Country of Origin
Petrochemical Feedstocks
WaxesPetroleum
Coke
Asphaltand Road
Oil Lubricants
Miscellan-eous
ProductsTotal
Products
TotalCrudeOil and
Products
Daily Average
Crude Oil Products TotalNaphtha
OtherOils
OPEC ..................................... – – – – 436 87 – 14,845 73,876 492 124 616Algeria ................................ – – – – – – – 1,479 10,692 77 12 89Angola ................................ – – – – – – – 473 4,391 33 4 37Ecuador .............................. – – – – – – – – – – – –Equatorial Guinea ............... – – – – – – – – 1,001 8 – 8Gabon ................................. – – – – – – – – – – – –Iran ..................................... – – – – – – – – – – – –Iraq ..................................... – – – – – – – 400 6,549 51 3 55Kuwait ................................. – – – – – – – 118 118 – 1 1Libya ................................... – – – – – – – 147 4,704 38 1 39Nigeria ................................ – – – – – – – 1,582 23,681 184 13 197Qatar ................................... – – – – – – – 1,408 1,408 – 12 12Saudi Arabia ....................... – – – – – – – 2,195 14,289 101 18 119United Arab Emirates ......... – – – – – 87 – 87 87 – 1 1Venezuela ........................... – – – – 436 – – 6,956 6,956 – 58 58
Non-OPEC ............................. 4 – 289 171 2,140 631 – 108,391 152,368 366 903 1,270Argentina ............................ – – – – – 12 – 533 533 – 4 4Aruba .................................. – – – – – – – – – – – –Australia .............................. – – – – – – – – – – – –Bahamas ............................ – – – – – – – – – – – –Bahrain ............................... – – – – – 15 – 15 15 – 0 0Belgium ............................... – – – – 78 10 – 2,086 2,086 – 17 17Brazil ................................... – – – – – – – 2,936 2,936 – 24 24Brunei ................................. – – – – – – – – – – – –Cameroon ........................... – – – – – – – – 1,142 10 – 10Canada ............................... – – 161 – 1,854 413 – 47,601 68,995 178 397 575Chad ................................... – – – – – – – – 1,854 15 – 15China .................................. – – 100 – – – – 369 369 – 3 3Colombia ............................ – – – 167 – – – 4,530 9,975 45 38 83Congo (Brazzaville) ............ – – – – – – – – 952 8 – 8Denmark ............................. – – – – – – – – 380 3 – 3Egypt .................................. – – – – – – – – 2,748 23 – 23Estonia ................................ – – – – – – – – – – – –Finland ................................ – – – – – 15 – 843 843 – 7 7France ................................ – – – – – 38 – 2,672 2,672 – 22 22Germany ............................. – – 17 – – 39 – 511 511 – 4 4Guatemala .......................... – – – – – – – – – – – –India .................................... – – – – – – – 8,571 8,571 – 71 71Indonesia ............................ – – – – – – – – – – – –Italy ..................................... – – – – – 8 – 628 628 – 5 5Korea, South ....................... – – 3 – – 46 – 2,160 2,160 – 18 18Latvia .................................. – – – – – – – – – – – –Lithuania ............................. – – – – – – – – – – – –Malaysia ............................. – – 2 – – – – 2 2 – 0 0Mexico ................................ – – – – – – – 316 316 – 3 3Netherlands ........................ – – – – – – – 3,755 3,755 – 31 31Netherlands Antilles ............ – – – – – – – – – – – –Norway ............................... – – – – – – – 1,523 7,074 46 13 59Oman .................................. – – – – – – – 161 161 – 1 1Portugal .............................. – – – – – – – 2,774 2,774 – 23 23Russia ................................. – – – – – 24 – 7,281 8,524 10 61 71Spain .................................. – – 5 – 129 – – 5,316 5,316 – 44 44Sweden ............................... – – – – – – – 2,138 2,138 – 18 18Syria ................................... – – – – – – – – – – – –Trinidad and Tobago .......... – – – – – – – 2,101 2,101 – 18 18United Kingdom .................. 4 – – 1 – – – 5,452 7,670 18 45 64Vietnam .............................. – – – – – – – – – – – –Virgin Islands, U.S. ............. – – – – – – – – – – – –Yemen ................................ – – – – – – – – – – – –Other ................................... 0 – 1 3 79 11 – 4,117 5,167 10 36 46
Total ....................................... 4 – 289 171 2,576 718 – 123,236 226,244 858 1,027 1,885
Persian Gulf3 ......................... – – – – – 102 – 4,223 22,466 152 35 187
– = No Data Reported.1 Crude oil and unfinished oils are reported by PAD District of processing; all other products are reported by PAD District of Entry.2 Includes crude oil imported for storage in the Strategic Petroleum Reserve.3 Includes Bahrain, Iran, Iraq, Kuwait, Qatar, Saudi Arabia, and United Arab Emirates.
Note: Totals may not equal sum of components due to independent rounding.Source: Energy Information Administration (EIA) Form EIA-814, "Monthly Imports Report."
Table 46. PAD District 2 - Year-to-Date Imports of Crude Oil and Petroleum Products by Country of Origin, January-April 2018(Thousand Barrels)
Country of Origin
Crude Oil1,2
NaturalGas
LiquidsRefineryOlefins
UnfinishedOils1
Finished Motor Gasoline Motor Gasoline Blending Components
Reform-ulated
Conven-tional Total
Reform- ulated
Conven- tional Total
OPEC ..................................... 400 – – – – – – – – –Algeria ................................ – – – – – – – – – –Angola ................................ – – – – – – – – – –Ecuador .............................. – – – – – – – – – –Equatorial Guinea ............... – – – – – – – – – –Gabon ................................. – – – – – – – – – –Iran ..................................... – – – – – – – – – –Iraq ..................................... 400 – – – – – – – – –Kuwait ................................. – – – – – – – – – –Libya ................................... – – – – – – – – – –Nigeria ................................ – – – – – – – – – –Qatar ................................... – – – – – – – – – –Saudi Arabia ....................... – – – – – – – – – –United Arab Emirates ......... – – – – – – – – – –Venezuela ........................... – – – – – – – – – –
Non-OPEC ............................. 298,677 9,943 1,671 507 – – – 64 1,540 1,604Argentina ............................ – – – – – – – – – –Aruba .................................. – – – – – – – – – –Australia .............................. – – – – – – – – – –Bahamas ............................ – – – – – – – – – –Bahrain ............................... – – – – – – – – – –Belgium ............................... – – – – – – – – – –Brazil ................................... – – – – – – – – 22 22Brunei ................................. – – – – – – – – – –Cameroon ........................... – – – – – – – – – –Canada ............................... 297,689 9,943 1,671 186 – – – 64 1,518 1,582Chad ................................... – – – – – – – – – –China .................................. – – – – – – – – – –Colombia ............................ – – – – – – – – – –Congo (Brazzaville) ............ – – – – – – – – – –Denmark ............................. – – – – – – – – – –Egypt .................................. – – – – – – – – – –Estonia ................................ – – – – – – – – – –Finland ................................ – – – – – – – – – –France ................................ – – – – – – – – – –Germany ............................. – – – – – – – – – –Guatemala .......................... – – – – – – – – – –India .................................... – – – – – – – – – –Indonesia ............................ – – – – – – – – – –Italy ..................................... – – – – – – – – – –Korea, South ....................... – – – – – – – – – –Latvia .................................. – – – – – – – – – –Lithuania ............................. – – – – – – – – – –Malaysia ............................. – – – – – – – – – –Mexico ................................ 988 – – – – – – – – –Netherlands ........................ – – – – – – – – – –Netherlands Antilles ............ – – – – – – – – – –Norway ............................... – – – – – – – – – –Oman .................................. – – – – – – – – – –Portugal .............................. – – – – – – – – – –Russia ................................. – – – – – – – – – –Spain .................................. – – – – – – – – – –Sweden ............................... – – – – – – – – – –Syria ................................... – – – – – – – – – –Trinidad and Tobago .......... – – – – – – – – – –United Kingdom .................. – – – – – – – – – –Vietnam .............................. – – – – – – – – – –Virgin Islands, U.S. ............. – – – – – – – – – –Yemen ................................ – – – – – – – – – –Other ................................... 0 0 0 321 – – – 0 0 0
Total ....................................... 299,077 9,943 1,671 507 – – – 64 1,540 1,604
Persian Gulf3 ......................... 400 – – – – – – – – –
See footnotes at end of table.

Energy Information Administration/Petroleum Supply Monthly,78 April 2018
Table 46. PAD District 2 - Year-to-Date Imports of Crude Oil and Petroleum Products by Country of Origin, January-April 2018(Thousand Barrels) — Continued
Country of Origin
Oxygenates Renewable Fuels Distillate Fuel Oil
MethylTertiary
ButylEther
(MTBE)
OtherOxygen-
atesFuel
Ethanol
Biomass-BasedDiesel
OtherRenewable
Diesel
OtherRenewable
Fuels
15 ppmsulfur and
under
Greaterthan 15ppm to 500 ppm
sulfur501 to
2000 ppm
Greaterthan 2000
ppm Total
OPEC ..................................... – – – – – – – – – – –Algeria ................................ – – – – – – – – – – –Angola ................................ – – – – – – – – – – –Ecuador .............................. – – – – – – – – – – –Equatorial Guinea ............... – – – – – – – – – – –Gabon ................................. – – – – – – – – – – –Iran ..................................... – – – – – – – – – – –Iraq ..................................... – – – – – – – – – – –Kuwait ................................. – – – – – – – – – – –Libya ................................... – – – – – – – – – – –Nigeria ................................ – – – – – – – – – – –Qatar ................................... – – – – – – – – – – –Saudi Arabia ....................... – – – – – – – – – – –United Arab Emirates ......... – – – – – – – – – – –Venezuela ........................... – – – – – – – – – – –
Non-OPEC ............................. – – – 129 – – 465 – 155 32 652Argentina ............................ – – – – – – – – – – –Aruba .................................. – – – – – – – – – – –Australia .............................. – – – – – – – – – – –Bahamas ............................ – – – – – – – – – – –Bahrain ............................... – – – – – – – – – – –Belgium ............................... – – – – – – – – – – –Brazil ................................... – – – – – – – – – – –Brunei ................................. – – – – – – – – – – –Cameroon ........................... – – – – – – – – – – –Canada ............................... – – – 129 – – 465 – 155 32 652Chad ................................... – – – – – – – – – – –China .................................. – – – – – – – – – – –Colombia ............................ – – – – – – – – – – –Congo (Brazzaville) ............ – – – – – – – – – – –Denmark ............................. – – – – – – – – – – –Egypt .................................. – – – – – – – – – – –Estonia ................................ – – – – – – – – – – –Finland ................................ – – – – – – – – – – –France ................................ – – – – – – – – – – –Germany ............................. – – – – – – – – – – –Guatemala .......................... – – – – – – – – – – –India .................................... – – – – – – – – – – –Indonesia ............................ – – – – – – – – – – –Italy ..................................... – – – – – – – – – – –Korea, South ....................... – – – – – – – – – – –Latvia .................................. – – – – – – – – – – –Lithuania ............................. – – – – – – – – – – –Malaysia ............................. – – – – – – – – – – –Mexico ................................ – – – – – – – – – – –Netherlands ........................ – – – – – – – – – – –Netherlands Antilles ............ – – – – – – – – – – –Norway ............................... – – – – – – – – – – –Oman .................................. – – – – – – – – – – –Portugal .............................. – – – – – – – – – – –Russia ................................. – – – – – – – – – – –Spain .................................. – – – – – – – – – – –Sweden ............................... – – – – – – – – – – –Syria ................................... – – – – – – – – – – –Trinidad and Tobago .......... – – – – – – – – – – –United Kingdom .................. – – – – – – – – – – –Vietnam .............................. – – – – – – – – – – –Virgin Islands, U.S. ............. – – – – – – – – – – –Yemen ................................ – – – – – – – – – – –Other ................................... – – – 0 – – 0 – 0 0 0
Total ....................................... – – – 129 – – 465 – 155 32 652
Persian Gulf3 ......................... – – – – – – – – – – –
See footnotes at end of table.

Energy Information Administration/Petroleum Supply Monthly, 79 April 2018
Table 46. PAD District 2 - Year-to-Date Imports of Crude Oil and Petroleum Products by Country of Origin, January-April 2018(Thousand Barrels) — Continued
Country of Origin
Oxygenates Renewable Fuels Distillate Fuel Oil
MethylTertiary
ButylEther
(MTBE)
OtherOxygen-
atesFuel
Ethanol
Biomass-BasedDiesel
OtherRenewable
Diesel
OtherRenewable
Fuels
15 ppmsulfur and
under
Greaterthan 15ppm to 500 ppm
sulfur501 to
2000 ppm
Greaterthan 2000
ppm Total
OPEC ..................................... – – – – – – – – – – –Algeria ................................ – – – – – – – – – – –Angola ................................ – – – – – – – – – – –Ecuador .............................. – – – – – – – – – – –Equatorial Guinea ............... – – – – – – – – – – –Gabon ................................. – – – – – – – – – – –Iran ..................................... – – – – – – – – – – –Iraq ..................................... – – – – – – – – – – –Kuwait ................................. – – – – – – – – – – –Libya ................................... – – – – – – – – – – –Nigeria ................................ – – – – – – – – – – –Qatar ................................... – – – – – – – – – – –Saudi Arabia ....................... – – – – – – – – – – –United Arab Emirates ......... – – – – – – – – – – –Venezuela ........................... – – – – – – – – – – –
Non-OPEC ............................. – – – 129 – – 465 – 155 32 652Argentina ............................ – – – – – – – – – – –Aruba .................................. – – – – – – – – – – –Australia .............................. – – – – – – – – – – –Bahamas ............................ – – – – – – – – – – –Bahrain ............................... – – – – – – – – – – –Belgium ............................... – – – – – – – – – – –Brazil ................................... – – – – – – – – – – –Brunei ................................. – – – – – – – – – – –Cameroon ........................... – – – – – – – – – – –Canada ............................... – – – 129 – – 465 – 155 32 652Chad ................................... – – – – – – – – – – –China .................................. – – – – – – – – – – –Colombia ............................ – – – – – – – – – – –Congo (Brazzaville) ............ – – – – – – – – – – –Denmark ............................. – – – – – – – – – – –Egypt .................................. – – – – – – – – – – –Estonia ................................ – – – – – – – – – – –Finland ................................ – – – – – – – – – – –France ................................ – – – – – – – – – – –Germany ............................. – – – – – – – – – – –Guatemala .......................... – – – – – – – – – – –India .................................... – – – – – – – – – – –Indonesia ............................ – – – – – – – – – – –Italy ..................................... – – – – – – – – – – –Korea, South ....................... – – – – – – – – – – –Latvia .................................. – – – – – – – – – – –Lithuania ............................. – – – – – – – – – – –Malaysia ............................. – – – – – – – – – – –Mexico ................................ – – – – – – – – – – –Netherlands ........................ – – – – – – – – – – –Netherlands Antilles ............ – – – – – – – – – – –Norway ............................... – – – – – – – – – – –Oman .................................. – – – – – – – – – – –Portugal .............................. – – – – – – – – – – –Russia ................................. – – – – – – – – – – –Spain .................................. – – – – – – – – – – –Sweden ............................... – – – – – – – – – – –Syria ................................... – – – – – – – – – – –Trinidad and Tobago .......... – – – – – – – – – – –United Kingdom .................. – – – – – – – – – – –Vietnam .............................. – – – – – – – – – – –Virgin Islands, U.S. ............. – – – – – – – – – – –Yemen ................................ – – – – – – – – – – –Other ................................... – – – 0 – – 0 – 0 0 0
Total ....................................... – – – 129 – – 465 – 155 32 652
Persian Gulf3 ......................... – – – – – – – – – – –
See footnotes at end of table.
Table 46. PAD District 2 - Year-to-Date Imports of Crude Oil and Petroleum Products by Country of Origin, January-April 2018(Thousand Barrels) — Continued
Country of Origin
Kerosene
FinishedAviationGasoline
AviationGasolineBlending
Components
Kerosene-Type Jet
FuelSpecial
Naphthas
Residual Fuel Oil
Less than 0.31 % sulfur
0.31 to 1.00 % sulfur
Greater than1.00 % sulfur Total
OPEC ..................................... – – – – – – – – –Algeria ................................ – – – – – – – – –Angola ................................ – – – – – – – – –Ecuador .............................. – – – – – – – – –Equatorial Guinea ............... – – – – – – – – –Gabon ................................. – – – – – – – – –Iran ..................................... – – – – – – – – –Iraq ..................................... – – – – – – – – –Kuwait ................................. – – – – – – – – –Libya ................................... – – – – – – – – –Nigeria ................................ – – – – – – – – –Qatar ................................... – – – – – – – – –Saudi Arabia ....................... – – – – – – – – –United Arab Emirates ......... – – – – – – – – –Venezuela ........................... – – – – – – – – –
Non-OPEC ............................. 2 5 – – 194 1 259 232 492Argentina ............................ – – – – – – – – –Aruba .................................. – – – – – – – – –Australia .............................. – – – – – – – – –Bahamas ............................ – – – – – – – – –Bahrain ............................... – – – – – – – – –Belgium ............................... – – – – – – – – –Brazil ................................... – – – – – – – – –Brunei ................................. – – – – – – – – –Cameroon ........................... – – – – – – – – –Canada ............................... 2 5 – – 194 1 259 232 492Chad ................................... – – – – – – – – –China .................................. – – – – – – – – –Colombia ............................ – – – – – – – – –Congo (Brazzaville) ............ – – – – – – – – –Denmark ............................. – – – – – – – – –Egypt .................................. – – – – – – – – –Estonia ................................ – – – – – – – – –Finland ................................ – – – – – – – – –France ................................ – – – – – – – – –Germany ............................. – – – – – – – – –Guatemala .......................... – – – – – – – – –India .................................... – – – – – – – – –Indonesia ............................ – – – – – – – – –Italy ..................................... – – – – – – – – –Korea, South ....................... – – – – – – – – –Latvia .................................. – – – – – – – – –Lithuania ............................. – – – – – – – – –Malaysia ............................. – – – – – – – – –Mexico ................................ – – – – – – – – –Netherlands ........................ – – – – – – – – –Netherlands Antilles ............ – – – – – – – – –Norway ............................... – – – – – – – – –Oman .................................. – – – – – – – – –Portugal .............................. – – – – – – – – –Russia ................................. – – – – – – – – –Spain .................................. – – – – – – – – –Sweden ............................... – – – – – – – – –Syria ................................... – – – – – – – – –Trinidad and Tobago .......... – – – – – – – – –United Kingdom .................. – – – – – – – – –Vietnam .............................. – – – – – – – – –Virgin Islands, U.S. ............. – – – – – – – – –Yemen ................................ – – – – – – – – –Other ................................... 0 0 – – 0 0 0 0 0
Total ....................................... 2 5 – – 194 1 259 232 492
Persian Gulf3 ......................... – – – – – – – – –
See footnotes at end of table.

Energy Information Administration/Petroleum Supply Monthly,80 April 2018
Table 46. PAD District 2 - Year-to-Date Imports of Crude Oil and Petroleum Products by Country of Origin, January-April 2018(Thousand Barrels) — Continued
Country of Origin
Petrochemical Feedstocks
WaxesPetroleum
Coke
Asphaltand Road
Oil Lubricants
Miscellan-eous
ProductsTotal
Products
TotalCrudeOil and
Products
Daily Average
Crude Oil Products TotalNaphtha
OtherOils
OPEC ..................................... – – – – – 2 – 2 402 3 0 3Algeria ................................ – – – – – – – – – – – –Angola ................................ – – – – – – – – – – – –Ecuador .............................. – – – – – – – – – – – –Equatorial Guinea ............... – – – – – – – – – – – –Gabon ................................. – – – – – – – – – – – –Iran ..................................... – – – – – – – – – – – –Iraq ..................................... – – – – – – – – 400 3 – 3Kuwait ................................. – – – – – – – – – – – –Libya ................................... – – – – – – – – – – – –Nigeria ................................ – – – – – – – – – – – –Qatar ................................... – – – – – 2 – 2 2 – 0 0Saudi Arabia ....................... – – – – – – – – – – – –United Arab Emirates ......... – – – – – – – – – – – –Venezuela ........................... – – – – – – – – – – – –
Non-OPEC ............................. 331 301 20 100 871 604 5 17,431 316,108 2,489 145 2,634Argentina ............................ – – – – – – – – – – – –Aruba .................................. – – – – – – – – – – – –Australia .............................. – – – – – – – – – – – –Bahamas ............................ – – – – – – – – – – – –Bahrain ............................... – – – – – – – – – – – –Belgium ............................... – – – – – – – – – – – –Brazil ................................... – – – – – – – 22 22 – 0 0Brunei ................................. – – – – – – – – – – – –Cameroon ........................... – – – – – – – – – – – –Canada ............................... 331 301 20 97 871 601 5 17,082 314,771 2,481 142 2,623Chad ................................... – – – – – – – – – – – –China .................................. – – – – – – – – – – – –Colombia ............................ – – – – – – – – – – – –Congo (Brazzaville) ............ – – – – – – – – – – – –Denmark ............................. – – – – – – – – – – – –Egypt .................................. – – – – – – – – – – – –Estonia ................................ – – – – – – – – – – – –Finland ................................ – – – – – 1 – 1 1 – 0 0France ................................ – – – – – – – – – – – –Germany ............................. – – – – – – – – – – – –Guatemala .......................... – – – – – – – – – – – –India .................................... – – – – – – – – – – – –Indonesia ............................ – – – – – – – – – – – –Italy ..................................... – – – – – – – – – – – –Korea, South ....................... – – – – – – – – – – – –Latvia .................................. – – – – – – – – – – – –Lithuania ............................. – – – – – – – – – – – –Malaysia ............................. – – – – – – – – – – – –Mexico ................................ – – – – – – – – 988 8 – 8Netherlands ........................ – – – – – – – – – – – –Netherlands Antilles ............ – – – – – – – – – – – –Norway ............................... – – – – – – – – – – – –Oman .................................. – – – – – – – – – – – –Portugal .............................. – – – – – – – – – – – –Russia ................................. – – – – – – – – – – – –Spain .................................. – – – – – – – – – – – –Sweden ............................... – – – 3 – – – 3 3 – 0 0Syria ................................... – – – – – – – – – – – –Trinidad and Tobago .......... – – – – – – – – – – – –United Kingdom .................. – – – – – – – – – – – –Vietnam .............................. – – – – – – – – – – – –Virgin Islands, U.S. ............. – – – – – – – – – – – –Yemen ................................ – – – – – – – – – – – –Other ................................... 0 0 0 0 0 2 0 323 323 0 3 3
Total ....................................... 331 301 20 100 871 606 5 17,433 316,510 2,492 145 2,638
Persian Gulf3 ......................... – – – – – 2 – 2 402 3 0 3
– = No Data Reported.1 Crude oil and unfinished oils are reported by PAD District of processing; all other products are reported by PAD District of Entry.2 Includes crude oil imported for storage in the Strategic Petroleum Reserve.3 Includes Bahrain, Iran, Iraq, Kuwait, Qatar, Saudi Arabia, and United Arab Emirates.
Note: Totals may not equal sum of components due to independent rounding.Source: Energy Information Administration (EIA) Form EIA-814, "Monthly Imports Report."

Energy Information Administration/Petroleum Supply Monthly, 81 April 2018
Table 46. PAD District 2 - Year-to-Date Imports of Crude Oil and Petroleum Products by Country of Origin, January-April 2018(Thousand Barrels) — Continued
Country of Origin
Petrochemical Feedstocks
WaxesPetroleum
Coke
Asphaltand Road
Oil Lubricants
Miscellan-eous
ProductsTotal
Products
TotalCrudeOil and
Products
Daily Average
Crude Oil Products TotalNaphtha
OtherOils
OPEC ..................................... – – – – – 2 – 2 402 3 0 3Algeria ................................ – – – – – – – – – – – –Angola ................................ – – – – – – – – – – – –Ecuador .............................. – – – – – – – – – – – –Equatorial Guinea ............... – – – – – – – – – – – –Gabon ................................. – – – – – – – – – – – –Iran ..................................... – – – – – – – – – – – –Iraq ..................................... – – – – – – – – 400 3 – 3Kuwait ................................. – – – – – – – – – – – –Libya ................................... – – – – – – – – – – – –Nigeria ................................ – – – – – – – – – – – –Qatar ................................... – – – – – 2 – 2 2 – 0 0Saudi Arabia ....................... – – – – – – – – – – – –United Arab Emirates ......... – – – – – – – – – – – –Venezuela ........................... – – – – – – – – – – – –
Non-OPEC ............................. 331 301 20 100 871 604 5 17,431 316,108 2,489 145 2,634Argentina ............................ – – – – – – – – – – – –Aruba .................................. – – – – – – – – – – – –Australia .............................. – – – – – – – – – – – –Bahamas ............................ – – – – – – – – – – – –Bahrain ............................... – – – – – – – – – – – –Belgium ............................... – – – – – – – – – – – –Brazil ................................... – – – – – – – 22 22 – 0 0Brunei ................................. – – – – – – – – – – – –Cameroon ........................... – – – – – – – – – – – –Canada ............................... 331 301 20 97 871 601 5 17,082 314,771 2,481 142 2,623Chad ................................... – – – – – – – – – – – –China .................................. – – – – – – – – – – – –Colombia ............................ – – – – – – – – – – – –Congo (Brazzaville) ............ – – – – – – – – – – – –Denmark ............................. – – – – – – – – – – – –Egypt .................................. – – – – – – – – – – – –Estonia ................................ – – – – – – – – – – – –Finland ................................ – – – – – 1 – 1 1 – 0 0France ................................ – – – – – – – – – – – –Germany ............................. – – – – – – – – – – – –Guatemala .......................... – – – – – – – – – – – –India .................................... – – – – – – – – – – – –Indonesia ............................ – – – – – – – – – – – –Italy ..................................... – – – – – – – – – – – –Korea, South ....................... – – – – – – – – – – – –Latvia .................................. – – – – – – – – – – – –Lithuania ............................. – – – – – – – – – – – –Malaysia ............................. – – – – – – – – – – – –Mexico ................................ – – – – – – – – 988 8 – 8Netherlands ........................ – – – – – – – – – – – –Netherlands Antilles ............ – – – – – – – – – – – –Norway ............................... – – – – – – – – – – – –Oman .................................. – – – – – – – – – – – –Portugal .............................. – – – – – – – – – – – –Russia ................................. – – – – – – – – – – – –Spain .................................. – – – – – – – – – – – –Sweden ............................... – – – 3 – – – 3 3 – 0 0Syria ................................... – – – – – – – – – – – –Trinidad and Tobago .......... – – – – – – – – – – – –United Kingdom .................. – – – – – – – – – – – –Vietnam .............................. – – – – – – – – – – – –Virgin Islands, U.S. ............. – – – – – – – – – – – –Yemen ................................ – – – – – – – – – – – –Other ................................... 0 0 0 0 0 2 0 323 323 0 3 3
Total ....................................... 331 301 20 100 871 606 5 17,433 316,510 2,492 145 2,638
Persian Gulf3 ......................... – – – – – 2 – 2 402 3 0 3
– = No Data Reported.1 Crude oil and unfinished oils are reported by PAD District of processing; all other products are reported by PAD District of Entry.2 Includes crude oil imported for storage in the Strategic Petroleum Reserve.3 Includes Bahrain, Iran, Iraq, Kuwait, Qatar, Saudi Arabia, and United Arab Emirates.
Note: Totals may not equal sum of components due to independent rounding.Source: Energy Information Administration (EIA) Form EIA-814, "Monthly Imports Report."
Table 47. PAD District 3 - Year-to-Date Imports of Crude Oil and Petroleum Products by Country of Origin, January-April 2018(Thousand Barrels)
Country of Origin
Crude Oil1,2
NaturalGas
LiquidsRefineryOlefins
UnfinishedOils1
Finished Motor Gasoline Motor Gasoline Blending Components
Reform-ulated
Conven-tional Total
Reform- ulated
Conven- tional Total
OPEC ..................................... 187,524 – – 15,505 – – – – 201 201Algeria ................................ – – – 7,998 – – – – – –Angola ................................ 2,407 – – – – – – – – –Ecuador .............................. 2,346 – – – – – – – – –Equatorial Guinea ............... – – – – – – – – – –Gabon ................................. 398 – – – – – – – – –Iran ..................................... – – – – – – – – – –Iraq ..................................... 68,590 – – 110 – – – – – –Kuwait ................................. 6,988 – – – – – – – – –Libya ................................... – – – 149 – – – – – –Nigeria ................................ 7,939 – – 307 – – – – – –Qatar ................................... – – – – – – – – – –Saudi Arabia ....................... 42,089 – – 905 – – – – – –United Arab Emirates ......... – – – 5,497 – – – – – –Venezuela ........................... 56,767 – – 539 – – – – 201 201
Non-OPEC ............................. 162,321 – 598 44,519 – – – – 6,199 6,199Argentina ............................ 681 – – – – – – – 491 491Aruba .................................. – – – – – – – – – –Australia .............................. – – – – – – – – – –Bahamas ............................ – – – – – – – – – –Bahrain ............................... – – – – – – – – – –Belgium ............................... – – – 5,578 – – – – 41 41Brazil ................................... 6,997 – – 1,382 – – – – 55 55Brunei ................................. – – – – – – – – – –Cameroon ........................... – – – 559 – – – – – –Canada ............................... 55,076 – – 1,264 – – – – – –Chad ................................... 2,599 – – – – – – – – –China .................................. – – – – – – – – – –Colombia ............................ 21,200 – – 1 – – – – – –Congo (Brazzaville) ............ – – – 510 – – – – – –Denmark ............................. – – – 122 – – – – 15 15Egypt .................................. – – – 204 – – – – – –Estonia ................................ – – – – – – – – – –Finland ................................ – – – 379 – – – – – –France ................................ – – – 293 – – – – 277 277Germany ............................. – – – 310 – – – – – –Guatemala .......................... 1,091 – – – – – – – – –India .................................... – – – – – – – – – –Indonesia ............................ – – – – – – – – – –Italy ..................................... 220 – – 547 – – – – 358 358Korea, South ....................... – – – – – – – – – –Latvia .................................. – – – – – – – – – –Lithuania ............................. – – – – – – – – – –Malaysia ............................. – – – – – – – – – –Mexico ................................ 68,060 – 69 – – – – – 1,651 1,651Netherlands ........................ – – – 2,651 – – – – 436 436Netherlands Antilles ............ – – – – – – – – – –Norway ............................... – – – 2,610 – – – – 39 39Oman .................................. – – – – – – – – – –Portugal .............................. – – – – – – – – 115 115Russia ................................. – – – 22,796 – – – – – –Spain .................................. – – – 795 – – – – 369 369Sweden ............................... – – – 16 – – – – 109 109Syria ................................... – – – – – – – – – –Trinidad and Tobago .......... 499 – – – – – – – – –United Kingdom .................. 4,784 – – 467 – – – – 1,022 1,022Vietnam .............................. – – – – – – – – – –Virgin Islands, U.S. ............. – – – – – – – – – –Yemen ................................ – – – – – – – – – –Other ................................... 716 – 529 4,035 – – – – 1,221 1,221
Total ....................................... 349,845 – 598 60,024 – – – – 6,400 6,400
Persian Gulf3 ......................... 117,667 – – 6,512 – – – – – –
See footnotes at end of table.

Energy Information Administration/Petroleum Supply Monthly,82 April 2018
Table 47. PAD District 3 - Year-to-Date Imports of Crude Oil and Petroleum Products by Country of Origin, January-April 2018(Thousand Barrels) — Continued
Country of Origin
Oxygenates Renewable Fuels Distillate Fuel Oil
MethylTertiary
ButylEther
(MTBE)
OtherOxygen-
atesFuel
Ethanol
Biomass-BasedDiesel
OtherRenewable
Diesel
OtherRenewable
Fuels
15 ppmsulfur and
under
Greaterthan 15ppm to 500 ppm
sulfur501 to
2000 ppm
Greaterthan 2000
ppm Total
OPEC ..................................... – – – – – – – – 140 – 140Algeria ................................ – – – – – – – – – – –Angola ................................ – – – – – – – – – – –Ecuador .............................. – – – – – – – – – – –Equatorial Guinea ............... – – – – – – – – – – –Gabon ................................. – – – – – – – – – – –Iran ..................................... – – – – – – – – – – –Iraq ..................................... – – – – – – – – – – –Kuwait ................................. – – – – – – – – – – –Libya ................................... – – – – – – – – – – –Nigeria ................................ – – – – – – – – 140 – 140Qatar ................................... – – – – – – – – – – –Saudi Arabia ....................... – – – – – – – – – – –United Arab Emirates ......... – – – – – – – – – – –Venezuela ........................... – – – – – – – – – – –
Non-OPEC ............................. 763 389 – 179 – – 309 – 354 241 904Argentina ............................ – – – – – – – – – – –Aruba .................................. – – – – – – – – – – –Australia .............................. – – – – – – – – – – –Bahamas ............................ – – – – – – – – – – –Bahrain ............................... – – – – – – – – – – –Belgium ............................... 52 – – – – – – – – – –Brazil ................................... 269 292 – – – – – – – – –Brunei ................................. – – – – – – – – – – –Cameroon ........................... – – – – – – – – – – –Canada ............................... – – – 142 – – – – 77 – 77Chad ................................... – – – – – – – – – – –China .................................. – – – – – – – – – – –Colombia ............................ – – – – – – – – – – –Congo (Brazzaville) ............ – – – – – – – – – – –Denmark ............................. – – – – – – – – – – –Egypt .................................. – – – – – – – – – – –Estonia ................................ – – – – – – – – – – –Finland ................................ – – – – – – – – – – –France ................................ – – – 37 – – – – – – –Germany ............................. 87 – – – – – – – – – 5Guatemala .......................... – – – – – – – – – – –India .................................... – – – – – – – – – – –Indonesia ............................ – – – – – – – – – – –Italy ..................................... – – – – – – – – – – –Korea, South ....................... – – – – – – – – – – –Latvia .................................. – – – – – – – – – – –Lithuania ............................. – – – – – – – – – – –Malaysia ............................. – – – – – – – – – – –Mexico ................................ – – – – – – 293 – 277 – 570Netherlands ........................ 337 97 – – – – 16 – – – 85Netherlands Antilles ............ – – – – – – – – – – –Norway ............................... – – – – – – – – – – –Oman .................................. – – – – – – – – – – –Portugal .............................. – – – – – – – – – – –Russia ................................. 18 – – – – – – – – 167 167Spain .................................. – – – – – – – – – – –Sweden ............................... – – – – – – – – – – –Syria ................................... – – – – – – – – – – –Trinidad and Tobago .......... – – – – – – – – – – –United Kingdom .................. – – – – – – – – – – –Vietnam .............................. – – – – – – – – – – –Virgin Islands, U.S. ............. – – – – – – – – – – –Yemen ................................ – – – – – – – – – – –Other ................................... 0 0 – 0 – – 0 – 0 74 0
Total ....................................... 763 389 – 179 – – 309 – 494 241 1,044
Persian Gulf3 ......................... – – – – – – – – – – –
See footnotes at end of table.

Energy Information Administration/Petroleum Supply Monthly, 83 April 2018
Table 47. PAD District 3 - Year-to-Date Imports of Crude Oil and Petroleum Products by Country of Origin, January-April 2018(Thousand Barrels) — Continued
Country of Origin
Oxygenates Renewable Fuels Distillate Fuel Oil
MethylTertiary
ButylEther
(MTBE)
OtherOxygen-
atesFuel
Ethanol
Biomass-BasedDiesel
OtherRenewable
Diesel
OtherRenewable
Fuels
15 ppmsulfur and
under
Greaterthan 15ppm to 500 ppm
sulfur501 to
2000 ppm
Greaterthan 2000
ppm Total
OPEC ..................................... – – – – – – – – 140 – 140Algeria ................................ – – – – – – – – – – –Angola ................................ – – – – – – – – – – –Ecuador .............................. – – – – – – – – – – –Equatorial Guinea ............... – – – – – – – – – – –Gabon ................................. – – – – – – – – – – –Iran ..................................... – – – – – – – – – – –Iraq ..................................... – – – – – – – – – – –Kuwait ................................. – – – – – – – – – – –Libya ................................... – – – – – – – – – – –Nigeria ................................ – – – – – – – – 140 – 140Qatar ................................... – – – – – – – – – – –Saudi Arabia ....................... – – – – – – – – – – –United Arab Emirates ......... – – – – – – – – – – –Venezuela ........................... – – – – – – – – – – –
Non-OPEC ............................. 763 389 – 179 – – 309 – 354 241 904Argentina ............................ – – – – – – – – – – –Aruba .................................. – – – – – – – – – – –Australia .............................. – – – – – – – – – – –Bahamas ............................ – – – – – – – – – – –Bahrain ............................... – – – – – – – – – – –Belgium ............................... 52 – – – – – – – – – –Brazil ................................... 269 292 – – – – – – – – –Brunei ................................. – – – – – – – – – – –Cameroon ........................... – – – – – – – – – – –Canada ............................... – – – 142 – – – – 77 – 77Chad ................................... – – – – – – – – – – –China .................................. – – – – – – – – – – –Colombia ............................ – – – – – – – – – – –Congo (Brazzaville) ............ – – – – – – – – – – –Denmark ............................. – – – – – – – – – – –Egypt .................................. – – – – – – – – – – –Estonia ................................ – – – – – – – – – – –Finland ................................ – – – – – – – – – – –France ................................ – – – 37 – – – – – – –Germany ............................. 87 – – – – – – – – – 5Guatemala .......................... – – – – – – – – – – –India .................................... – – – – – – – – – – –Indonesia ............................ – – – – – – – – – – –Italy ..................................... – – – – – – – – – – –Korea, South ....................... – – – – – – – – – – –Latvia .................................. – – – – – – – – – – –Lithuania ............................. – – – – – – – – – – –Malaysia ............................. – – – – – – – – – – –Mexico ................................ – – – – – – 293 – 277 – 570Netherlands ........................ 337 97 – – – – 16 – – – 85Netherlands Antilles ............ – – – – – – – – – – –Norway ............................... – – – – – – – – – – –Oman .................................. – – – – – – – – – – –Portugal .............................. – – – – – – – – – – –Russia ................................. 18 – – – – – – – – 167 167Spain .................................. – – – – – – – – – – –Sweden ............................... – – – – – – – – – – –Syria ................................... – – – – – – – – – – –Trinidad and Tobago .......... – – – – – – – – – – –United Kingdom .................. – – – – – – – – – – –Vietnam .............................. – – – – – – – – – – –Virgin Islands, U.S. ............. – – – – – – – – – – –Yemen ................................ – – – – – – – – – – –Other ................................... 0 0 – 0 – – 0 – 0 74 0
Total ....................................... 763 389 – 179 – – 309 – 494 241 1,044
Persian Gulf3 ......................... – – – – – – – – – – –
See footnotes at end of table.
Table 47. PAD District 3 - Year-to-Date Imports of Crude Oil and Petroleum Products by Country of Origin, January-April 2018(Thousand Barrels) — Continued
Country of Origin
Kerosene
FinishedAviationGasoline
AviationGasolineBlending
Components
Kerosene-Type Jet
FuelSpecial
Naphthas
Residual Fuel Oil
Less than 0.31 % sulfur
0.31 to 1.00 % sulfur
Greater than1.00 % sulfur Total
OPEC ..................................... – – – – 36 355 – 1,048 1,403Algeria ................................ – – – – – – – – –Angola ................................ – – – – – – – – –Ecuador .............................. – – – – – – – – –Equatorial Guinea ............... – – – – – – – – –Gabon ................................. – – – – – – – – –Iran ..................................... – – – – – – – – –Iraq ..................................... – – – – – – – – –Kuwait ................................. – – – – – – – – –Libya ................................... – – – – – – – – –Nigeria ................................ – – – – – – – – –Qatar ................................... – – – – – – – – –Saudi Arabia ....................... – – – – 36 – – – –United Arab Emirates ......... – – – – – – – – –Venezuela ........................... – – – – – 355 – 1,048 1,403
Non-OPEC ............................. – – – – 1,713 687 582 4,015 5,284Argentina ............................ – – – – – – – – –Aruba .................................. – – – – – – – – –Australia .............................. – – – – – – – – –Bahamas ............................ – – – – – – – – –Bahrain ............................... – – – – – – – – –Belgium ............................... – – – – 22 – 50 – 50Brazil ................................... – – – – 84 – – – –Brunei ................................. – – – – – – – – –Cameroon ........................... – – – – – – – – –Canada ............................... – – – – 160 – – – –Chad ................................... – – – – – – – – –China .................................. – – – – – – – – –Colombia ............................ – – – – – – – 289 289Congo (Brazzaville) ............ – – – – – – – – –Denmark ............................. – – – – – – – – –Egypt .................................. – – – – – – – – –Estonia ................................ – – – – – – – – –Finland ................................ – – – – – – – – –France ................................ – – – – 107 – – – –Germany ............................. – – – – 14 – – – –Guatemala .......................... – – – – – – – – –India .................................... – – – – – – – – –Indonesia ............................ – – – – – – – – –Italy ..................................... – – – – – – – – –Korea, South ....................... – – – – 851 – – – –Latvia .................................. – – – – – – – – –Lithuania ............................. – – – – – – – – –Malaysia ............................. – – – – – – – – –Mexico ................................ – – – – – 283 – 3,286 3,569Netherlands ........................ – – – – 3 57 – – 57Netherlands Antilles ............ – – – – – – – – –Norway ............................... – – – – – – – – –Oman .................................. – – – – – – – – –Portugal .............................. – – – – 53 – – – –Russia ................................. – – – – – 347 – – 347Spain .................................. – – – – – – – – –Sweden ............................... – – – – – – – – –Syria ................................... – – – – – – – – –Trinidad and Tobago .......... – – – – – – – – –United Kingdom .................. – – – – – – – – –Vietnam .............................. – – – – – – – – –Virgin Islands, U.S. ............. – – – – – – – – –Yemen ................................ – – – – – – – – –Other ................................... – – – – 419 0 532 440 972
Total ....................................... – – – – 1,749 1,042 582 5,063 6,687
Persian Gulf3 ......................... – – – – 36 – – – –
See footnotes at end of table.

Energy Information Administration/Petroleum Supply Monthly,84 April 2018
Table 47. PAD District 3 - Year-to-Date Imports of Crude Oil and Petroleum Products by Country of Origin, January-April 2018(Thousand Barrels) — Continued
Country of Origin
Petrochemical Feedstocks
WaxesPetroleum
Coke
Asphaltand Road
Oil Lubricants
Miscellan-eous
ProductsTotal
Products
TotalCrudeOil and
Products
Daily Average
Crude Oil Products TotalNaphtha
OtherOils
OPEC ..................................... 558 – – – – 1,319 – 19,162 206,686 1,563 160 1,722Algeria ................................ 327 – – – – – – 8,325 8,325 – 69 69Angola ................................ – – – – – – – – 2,407 20 – 20Ecuador .............................. – – – – – – – – 2,346 20 – 20Equatorial Guinea ............... – – – – – – – – – – – –Gabon ................................. – – – – – – – – 398 3 – 3Iran ..................................... – – – – – – – – – – – –Iraq ..................................... – – – – – – – 110 68,700 572 1 573Kuwait ................................. – – – – – – – – 6,988 58 – 58Libya ................................... – – – – – – – 149 149 – 1 1Nigeria ................................ 231 – – – – – – 678 8,617 66 6 72Qatar ................................... – – – – – 936 – 936 936 – 8 8Saudi Arabia ....................... – – – – – – – 941 43,030 351 8 359United Arab Emirates ......... – – – – – 383 – 5,880 5,880 – 49 49Venezuela ........................... – – – – – – – 2,143 58,910 473 18 491
Non-OPEC ............................. 1,318 133 131 1,649 – 2,940 50 66,790 229,111 1,353 557 1,909Argentina ............................ – 36 – 484 – 11 – 1,022 1,703 6 9 14Aruba .................................. – – – – – – – – – – – –Australia .............................. – – – – – – – – – – – –Bahamas ............................ – – – – – – – – – – – –Bahrain ............................... – – – – – 287 – 287 287 – 2 2Belgium ............................... – – – – – 38 – 5,782 5,782 – 48 48Brazil ................................... – – – 145 – – – 2,227 9,224 58 19 77Brunei ................................. – – – – – – – – – – – –Cameroon ........................... – – – – – – – 559 559 – 5 5Canada ............................... – – – 243 – – – 1,886 56,962 459 16 475Chad ................................... – – – – – – – – 2,599 22 – 22China .................................. – – 83 318 – – – 401 401 – 3 3Colombia ............................ – – – – – – – 290 21,490 177 2 179Congo (Brazzaville) ............ – – – – – – – 510 510 – 4 4Denmark ............................. – – – – – – – 137 137 – 1 1Egypt .................................. – – – – – – – 204 204 – 2 2Estonia ................................ – – – – – – – – – – – –Finland ................................ – – – – – – – 379 379 – 3 3France ................................ – 97 – – – 23 – 834 834 – 7 7Germany ............................. – – – – – 15 – 433 433 – 4 4Guatemala .......................... – – – – – – – – 1,091 9 – 9India .................................... – – – – – – – – – – – –Indonesia ............................ – – – – – 341 – 341 341 – 3 3Italy ..................................... – – – – – 92 – 1,002 1,222 2 8 10Korea, South ....................... – – – – – 1,892 – 2,743 2,743 – 23 23Latvia .................................. – – – – – – – – – – – –Lithuania ............................. – – – – – – – – – – – –Malaysia ............................. – – 43 – – – – 43 43 – 0 0Mexico ................................ 928 – – – – – – 6,787 74,847 567 57 624Netherlands ........................ – – – – – – 50 3,716 3,716 – 31 31Netherlands Antilles ............ – – – – – – – – – – – –Norway ............................... – – – – – – – 2,649 2,649 – 22 22Oman .................................. – – – 195 – 66 – 261 261 – 2 2Portugal .............................. – – – – – – – 168 168 – 1 1Russia ................................. – – – 95 – – – 23,423 23,423 – 195 195Spain .................................. – – – – – – – 1,164 1,164 – 10 10Sweden ............................... – – – – – – – 125 125 – 1 1Syria ................................... – – – – – – – – – – – –Trinidad and Tobago .......... – – – – – – – – 499 4 – 4United Kingdom .................. 114 – – 169 – 59 – 1,831 6,615 40 15 55Vietnam .............................. – – – – – – – – – – – –Virgin Islands, U.S. ............. – – – – – – – – – – – –Yemen ................................ – – – – – – – – – – – –Other ................................... 276 0 5 0 – 116 0 7,586 8,302 6 64 70
Total ....................................... 1,876 133 131 1,649 – 4,259 50 85,952 435,797 2,915 716 3,632
Persian Gulf3 ......................... – – – – – 1,606 – 8,154 125,821 981 68 1,049
– = No Data Reported.1 Crude oil and unfinished oils are reported by PAD District of processing; all other products are reported by PAD District of Entry.2 Includes crude oil imported for storage in the Strategic Petroleum Reserve.3 Includes Bahrain, Iran, Iraq, Kuwait, Qatar, Saudi Arabia, and United Arab Emirates.
Note: Totals may not equal sum of components due to independent rounding.Source: Energy Information Administration (EIA) Form EIA-814, "Monthly Imports Report."

Energy Information Administration/Petroleum Supply Monthly, 85 April 2018
Table 47. PAD District 3 - Year-to-Date Imports of Crude Oil and Petroleum Products by Country of Origin, January-April 2018(Thousand Barrels) — Continued
Country of Origin
Petrochemical Feedstocks
WaxesPetroleum
Coke
Asphaltand Road
Oil Lubricants
Miscellan-eous
ProductsTotal
Products
TotalCrudeOil and
Products
Daily Average
Crude Oil Products TotalNaphtha
OtherOils
OPEC ..................................... 558 – – – – 1,319 – 19,162 206,686 1,563 160 1,722Algeria ................................ 327 – – – – – – 8,325 8,325 – 69 69Angola ................................ – – – – – – – – 2,407 20 – 20Ecuador .............................. – – – – – – – – 2,346 20 – 20Equatorial Guinea ............... – – – – – – – – – – – –Gabon ................................. – – – – – – – – 398 3 – 3Iran ..................................... – – – – – – – – – – – –Iraq ..................................... – – – – – – – 110 68,700 572 1 573Kuwait ................................. – – – – – – – – 6,988 58 – 58Libya ................................... – – – – – – – 149 149 – 1 1Nigeria ................................ 231 – – – – – – 678 8,617 66 6 72Qatar ................................... – – – – – 936 – 936 936 – 8 8Saudi Arabia ....................... – – – – – – – 941 43,030 351 8 359United Arab Emirates ......... – – – – – 383 – 5,880 5,880 – 49 49Venezuela ........................... – – – – – – – 2,143 58,910 473 18 491
Non-OPEC ............................. 1,318 133 131 1,649 – 2,940 50 66,790 229,111 1,353 557 1,909Argentina ............................ – 36 – 484 – 11 – 1,022 1,703 6 9 14Aruba .................................. – – – – – – – – – – – –Australia .............................. – – – – – – – – – – – –Bahamas ............................ – – – – – – – – – – – –Bahrain ............................... – – – – – 287 – 287 287 – 2 2Belgium ............................... – – – – – 38 – 5,782 5,782 – 48 48Brazil ................................... – – – 145 – – – 2,227 9,224 58 19 77Brunei ................................. – – – – – – – – – – – –Cameroon ........................... – – – – – – – 559 559 – 5 5Canada ............................... – – – 243 – – – 1,886 56,962 459 16 475Chad ................................... – – – – – – – – 2,599 22 – 22China .................................. – – 83 318 – – – 401 401 – 3 3Colombia ............................ – – – – – – – 290 21,490 177 2 179Congo (Brazzaville) ............ – – – – – – – 510 510 – 4 4Denmark ............................. – – – – – – – 137 137 – 1 1Egypt .................................. – – – – – – – 204 204 – 2 2Estonia ................................ – – – – – – – – – – – –Finland ................................ – – – – – – – 379 379 – 3 3France ................................ – 97 – – – 23 – 834 834 – 7 7Germany ............................. – – – – – 15 – 433 433 – 4 4Guatemala .......................... – – – – – – – – 1,091 9 – 9India .................................... – – – – – – – – – – – –Indonesia ............................ – – – – – 341 – 341 341 – 3 3Italy ..................................... – – – – – 92 – 1,002 1,222 2 8 10Korea, South ....................... – – – – – 1,892 – 2,743 2,743 – 23 23Latvia .................................. – – – – – – – – – – – –Lithuania ............................. – – – – – – – – – – – –Malaysia ............................. – – 43 – – – – 43 43 – 0 0Mexico ................................ 928 – – – – – – 6,787 74,847 567 57 624Netherlands ........................ – – – – – – 50 3,716 3,716 – 31 31Netherlands Antilles ............ – – – – – – – – – – – –Norway ............................... – – – – – – – 2,649 2,649 – 22 22Oman .................................. – – – 195 – 66 – 261 261 – 2 2Portugal .............................. – – – – – – – 168 168 – 1 1Russia ................................. – – – 95 – – – 23,423 23,423 – 195 195Spain .................................. – – – – – – – 1,164 1,164 – 10 10Sweden ............................... – – – – – – – 125 125 – 1 1Syria ................................... – – – – – – – – – – – –Trinidad and Tobago .......... – – – – – – – – 499 4 – 4United Kingdom .................. 114 – – 169 – 59 – 1,831 6,615 40 15 55Vietnam .............................. – – – – – – – – – – – –Virgin Islands, U.S. ............. – – – – – – – – – – – –Yemen ................................ – – – – – – – – – – – –Other ................................... 276 0 5 0 – 116 0 7,586 8,302 6 64 70
Total ....................................... 1,876 133 131 1,649 – 4,259 50 85,952 435,797 2,915 716 3,632
Persian Gulf3 ......................... – – – – – 1,606 – 8,154 125,821 981 68 1,049
– = No Data Reported.1 Crude oil and unfinished oils are reported by PAD District of processing; all other products are reported by PAD District of Entry.2 Includes crude oil imported for storage in the Strategic Petroleum Reserve.3 Includes Bahrain, Iran, Iraq, Kuwait, Qatar, Saudi Arabia, and United Arab Emirates.
Note: Totals may not equal sum of components due to independent rounding.Source: Energy Information Administration (EIA) Form EIA-814, "Monthly Imports Report."
Table 48. PAD District 4 and 5 - Year-to-Date Imports of Crude Oil and Petroleum Products by Country of Origin, January-April 2018(Thousand Barrels)
Country of Origin
Crude Oil1,2
NaturalGas
LiquidsRefineryOlefins
UnfinishedOils1
Finished Motor Gasoline Motor Gasoline Blending Components
Reform-ulated
Conven-tional Total
Reform- ulated
Conven- tional Total
PAD District 4
OPEC ..................................... – – – – – – – – – –Algeria ................................ – – – – – – – – – –Angola ................................ – – – – – – – – – –Ecuador .............................. – – – – – – – – – –Iran ..................................... – – – – – – – – – –Iraq ..................................... – – – – – – – – – –Kuwait ................................. – – – – – – – – – –Libya ................................... – – – – – – – – – –Nigeria ................................ – – – – – – – – – –Qatar ................................... – – – – – – – – – –Saudi Arabia ....................... – – – – – – – – – –United Arab Emirates ......... – – – – – – – – – –Venezuela ........................... – – – – – – – – – –
Non-OPEC ............................. 35,687 1,665 – – – – – – 123 123Canada ............................... 35,687 1,665 – – – – – – 123 123Other ................................... 0 0 – – – – – – 0 0
Total ....................................... 35,687 1,665 – – – – – – 123 123
PAD District 5
OPEC ..................................... 79,967 – – 2,230 – – – – 228 228Algeria ................................ – – – 1,123 – – – – – –Angola ................................ 1,758 – – – – – – – – –Ecuador .............................. 16,618 – – – – – – – – –Iran ..................................... – – – – – – – – – –Iraq ..................................... 10,655 – – – – – – – – –Kuwait ................................. 8,214 – – – – – – – – –Libya ................................... 3,621 – – – – – – – – –Nigeria ................................ 1,997 – – 86 – – – – 228 228Qatar ................................... – – – – – – – – – –Saudi Arabia ....................... 35,107 – – – – – – – – –United Arab Emirates ......... – – – 1,021 – – – – – –Venezuela ........................... – – – – – – – – – –
Non-OPEC ............................. 74,015 4,436 2 7,659 – 333 333 630 2,035 2,665Argentina ............................ 2,731 – – – – – – – – –Aruba .................................. – – – – – – – – – –Australia .............................. – – – – – – – – – –Brazil ................................... 9,588 – – – – – – – – –Brunei ................................. – – – – – – – – – –Canada ............................... 29,132 4,158 2 60 – 92 92 – 296 296China .................................. – – – – – – – – – –Colombia ............................ 17,178 – – – – – – – 297 297Finland ................................ – – – – – – – – – –Germany ............................. – – – 96 – – – – – –Indonesia ............................ 5,066 – – – – – – – – –Japan .................................. – – – – – – – – 516 516Korea, South ....................... – – – 120 – 87 87 – 77 77Malaysia ............................. 288 – – 150 – – – – – –Mexico ................................ 6,471 – – – – – – – – –Netherlands ........................ – – – 233 – – – 311 268 579Netherlands Antilles ............ – – – – – – – – – –Oman .................................. – – – – – – – – – –Papua New Guinea ............ – – – – – – – – – –Peru .................................... – 56 – 1,009 – – – – – –Singapore ........................... – – – 147 – – – – 158 158Sweden ............................... – – – – – – – – – –Taiwan ................................ – – – – – – – – 196 196United Kingdom .................. – – – – – – – 319 – 319Vietnam .............................. 788 – – – – – – – – –Virgin Islands, U.S. ............. – – – – – – – – – –Other ................................... 2,773 222 0 5,844 – 154 154 0 227 227
Total ....................................... 153,982 4,436 2 9,889 – 333 333 630 2,263 2,893
Persian Gulf3 ......................... 53,976 – – 1,021 – – – – – –
See footnotes at end of table.

Energy Information Administration/Petroleum Supply Monthly,86 April 2018
Table 48. PAD District 4 and 5 - Year-to-Date Imports of Crude Oil and Petroleum Products by Country of Origin, January-April 2018(Thousand Barrels) — Continued
Country of Origin
Oxygenates Renewable Fuels Distillate Fuel Oil
MethylTertiary
ButylEther
(MTBE)
OtherOxygen-
atesFuel
Ethanol
Biomass-BasedDiesel
OtherRenewable
Diesel
OtherRenewable
Fuels
15 ppmsulfur and
under
Greaterthan 15ppm to 500 ppm
sulfur501 to
2000 ppm
Greaterthan 2000
ppm Total
PAD District 4
OPEC ..................................... – – – – – – – – – – –Algeria ................................ – – – – – – – – – – –Angola ................................ – – – – – – – – – – –Ecuador .............................. – – – – – – – – – – –Iran ..................................... – – – – – – – – – – –Iraq ..................................... – – – – – – – – – – –Kuwait ................................. – – – – – – – – – – –Libya ................................... – – – – – – – – – – –Nigeria ................................ – – – – – – – – – – –Qatar ................................... – – – – – – – – – – –Saudi Arabia ....................... – – – – – – – – – – –United Arab Emirates ......... – – – – – – – – – – –Venezuela ........................... – – – – – – – – – – –
Non-OPEC ............................. – – – 13 – – 129 – – – 129Canada ............................... – – – 13 – – 129 – – – 129Other ................................... – – – 0 – – 0 – – – 0
Total ....................................... – – – 13 – – 129 – – – 129
PAD District 5
OPEC ..................................... – – – – – – – – – – –Algeria ................................ – – – – – – – – – – –Angola ................................ – – – – – – – – – – –Ecuador .............................. – – – – – – – – – – –Iran ..................................... – – – – – – – – – – –Iraq ..................................... – – – – – – – – – – –Kuwait ................................. – – – – – – – – – – –Libya ................................... – – – – – – – – – – –Nigeria ................................ – – – – – – – – – – –Qatar ................................... – – – – – – – – – – –Saudi Arabia ....................... – – – – – – – – – – –United Arab Emirates ......... – – – – – – – – – – –Venezuela ........................... – – – – – – – – – – –
Non-OPEC ............................. – – – 149 1,564 – 769 – – – 769Argentina ............................ – – – – – – – – – – –Aruba .................................. – – – – – – – – – – –Australia .............................. – – – – – – – – – – –Brazil ................................... – – – – – – – – – – –Brunei ................................. – – – – – – – – – – –Canada ............................... – – – 121 – – 674 – – – 674China .................................. – – – – – – – – – – –Colombia ............................ – – – – – – – – – – –Finland ................................ – – – – – – – – – – –Germany ............................. – – – – – – – – – – –Indonesia ............................ – – – – – – – – – – –Japan .................................. – – – – – – 63 – – – 63Korea, South ....................... – – – 28 – – 32 – – – 32Malaysia ............................. – – – – – – – – – – –Mexico ................................ – – – – – – – – – – –Netherlands ........................ – – – – – – – – – – –Netherlands Antilles ............ – – – – – – – – – – –Oman .................................. – – – – – – – – – – –Papua New Guinea ............ – – – – – – – – – – –Peru .................................... – – – – – – – – – – –Singapore ........................... – – – – – – – – – – –Sweden ............................... – – – – – – – – – – –Taiwan ................................ – – – – – – – – – – –United Kingdom .................. – – – – – – – – – – –Vietnam .............................. – – – – – – – – – – –Virgin Islands, U.S. ............. – – – – – – – – – – –Other ................................... – – – 0 1,564 – 0 – – – 0
Total ....................................... – – – 149 1,564 – 769 – – – 769
Persian Gulf3 ......................... – – – – – – – – – – –
See footnotes at end of table.

Energy Information Administration/Petroleum Supply Monthly, 87 April 2018
Table 48. PAD District 4 and 5 - Year-to-Date Imports of Crude Oil and Petroleum Products by Country of Origin, January-April 2018(Thousand Barrels) — Continued
Country of Origin
Oxygenates Renewable Fuels Distillate Fuel Oil
MethylTertiary
ButylEther
(MTBE)
OtherOxygen-
atesFuel
Ethanol
Biomass-BasedDiesel
OtherRenewable
Diesel
OtherRenewable
Fuels
15 ppmsulfur and
under
Greaterthan 15ppm to 500 ppm
sulfur501 to
2000 ppm
Greaterthan 2000
ppm Total
PAD District 4
OPEC ..................................... – – – – – – – – – – –Algeria ................................ – – – – – – – – – – –Angola ................................ – – – – – – – – – – –Ecuador .............................. – – – – – – – – – – –Iran ..................................... – – – – – – – – – – –Iraq ..................................... – – – – – – – – – – –Kuwait ................................. – – – – – – – – – – –Libya ................................... – – – – – – – – – – –Nigeria ................................ – – – – – – – – – – –Qatar ................................... – – – – – – – – – – –Saudi Arabia ....................... – – – – – – – – – – –United Arab Emirates ......... – – – – – – – – – – –Venezuela ........................... – – – – – – – – – – –
Non-OPEC ............................. – – – 13 – – 129 – – – 129Canada ............................... – – – 13 – – 129 – – – 129Other ................................... – – – 0 – – 0 – – – 0
Total ....................................... – – – 13 – – 129 – – – 129
PAD District 5
OPEC ..................................... – – – – – – – – – – –Algeria ................................ – – – – – – – – – – –Angola ................................ – – – – – – – – – – –Ecuador .............................. – – – – – – – – – – –Iran ..................................... – – – – – – – – – – –Iraq ..................................... – – – – – – – – – – –Kuwait ................................. – – – – – – – – – – –Libya ................................... – – – – – – – – – – –Nigeria ................................ – – – – – – – – – – –Qatar ................................... – – – – – – – – – – –Saudi Arabia ....................... – – – – – – – – – – –United Arab Emirates ......... – – – – – – – – – – –Venezuela ........................... – – – – – – – – – – –
Non-OPEC ............................. – – – 149 1,564 – 769 – – – 769Argentina ............................ – – – – – – – – – – –Aruba .................................. – – – – – – – – – – –Australia .............................. – – – – – – – – – – –Brazil ................................... – – – – – – – – – – –Brunei ................................. – – – – – – – – – – –Canada ............................... – – – 121 – – 674 – – – 674China .................................. – – – – – – – – – – –Colombia ............................ – – – – – – – – – – –Finland ................................ – – – – – – – – – – –Germany ............................. – – – – – – – – – – –Indonesia ............................ – – – – – – – – – – –Japan .................................. – – – – – – 63 – – – 63Korea, South ....................... – – – 28 – – 32 – – – 32Malaysia ............................. – – – – – – – – – – –Mexico ................................ – – – – – – – – – – –Netherlands ........................ – – – – – – – – – – –Netherlands Antilles ............ – – – – – – – – – – –Oman .................................. – – – – – – – – – – –Papua New Guinea ............ – – – – – – – – – – –Peru .................................... – – – – – – – – – – –Singapore ........................... – – – – – – – – – – –Sweden ............................... – – – – – – – – – – –Taiwan ................................ – – – – – – – – – – –United Kingdom .................. – – – – – – – – – – –Vietnam .............................. – – – – – – – – – – –Virgin Islands, U.S. ............. – – – – – – – – – – –Other ................................... – – – 0 1,564 – 0 – – – 0
Total ....................................... – – – 149 1,564 – 769 – – – 769
Persian Gulf3 ......................... – – – – – – – – – – –
See footnotes at end of table.
Table 48. PAD District 4 and 5 - Year-to-Date Imports of Crude Oil and Petroleum Products by Country of Origin, January-April 2018(Thousand Barrels) — Continued
Country of Origin
Kerosene
FinishedAviationGasoline
AviationGasolineBlending
Components
Kerosene-Type Jet
FuelSpecial
Naphthas
Residual Fuel Oil
Less than 0.31 % sulfur
0.31 to 1.00 % sulfur
Greater than1.00 % sulfur Total
PAD District 4
OPEC ..................................... – – – 13 – – – – –Algeria ................................ – – – – – – – – –Angola ................................ – – – – – – – – –Ecuador .............................. – – – – – – – – –Iran ..................................... – – – – – – – – –Iraq ..................................... – – – 13 – – – – –Kuwait ................................. – – – – – – – – –Libya ................................... – – – – – – – – –Nigeria ................................ – – – – – – – – –Qatar ................................... – – – – – – – – –Saudi Arabia ....................... – – – – – – – – –United Arab Emirates ......... – – – – – – – – –Venezuela ........................... – – – – – – – – –
Non-OPEC ............................. – – – – – – – – –Canada ............................... – – – – – – – – –Other ................................... – – – 0 – – – – –
Total ....................................... – – – 13 – – – – –
PAD District 5
OPEC ..................................... – – – – – – – 438 438Algeria ................................ – – – – – – – – –Angola ................................ – – – – – – – – –Ecuador .............................. – – – – – – – 438 438Iran ..................................... – – – – – – – – –Iraq ..................................... – – – – – – – – –Kuwait ................................. – – – – – – – – –Libya ................................... – – – – – – – – –Nigeria ................................ – – – – – – – – –Qatar ................................... – – – – – – – – –Saudi Arabia ....................... – – – – – – – – –United Arab Emirates ......... – – – – – – – – –Venezuela ........................... – – – – – – – – –
Non-OPEC ............................. – 3 – 6,509 – – 458 3,464 3,922Argentina ............................ – – – – – – – – –Aruba .................................. – – – – – – – – –Australia .............................. – – – – – – – – –Brazil ................................... – – – – – – – – –Brunei ................................. – – – – – – – – –Canada ............................... – 3 – 12 – – 458 355 813China .................................. – – – 2,251 – – – – –Colombia ............................ – – – – – – – – –Finland ................................ – – – – – – – – –Germany ............................. – – – – – – – – –Indonesia ............................ – – – – – – – – –Japan .................................. – – – 516 – – – – –Korea, South ....................... – – – 3,419 – – – – –Malaysia ............................. – – – – – – – – –Mexico ................................ – – – – – – – 1,328 1,328Netherlands ........................ – – – – – – – – –Netherlands Antilles ............ – – – – – – – – –Oman .................................. – – – – – – – – –Papua New Guinea ............ – – – – – – – – –Peru .................................... – – – – – – – 1,421 1,421Singapore ........................... – – – 311 – – – – –Sweden ............................... – – – – – – – – –Taiwan ................................ – – – – – – – – –United Kingdom .................. – – – – – – – – –Vietnam .............................. – – – – – – – – –Virgin Islands, U.S. ............. – – – – – – – – –Other ................................... – 0 – 0 – – 0 360 360
Total ....................................... – 3 – 6,509 – – 458 3,902 4,360
Persian Gulf3 ......................... – – – – – – – – –
See footnotes at end of table.

Energy Information Administration/Petroleum Supply Monthly,88 April 2018
Table 48. PAD District 4 and 5 - Year-to-Date Imports of Crude Oil and Petroleum Products by Country of Origin, January-April 2018(Thousand Barrels) — Continued
Country of Origin
Petrochemical Feedstocks
WaxesPetroleum
Coke
Asphaltand Road
Oil Lubricants
Miscellan-eous
ProductsTotal
Products
TotalCrudeOil and
Products
Daily Average
Crude Oil Products TotalNaphtha
OtherOils
PAD District 4
OPEC ..................................... – – – – – – – 13 13 – 0 0Algeria ................................ – – – – – – – – – – – –Angola ................................ – – – – – – – – – – – –Ecuador .............................. – – – – – – – – – – – –Iran ..................................... – – – – – – – – – – – –Iraq ..................................... – – – – – – – 13 13 – 0 0Kuwait ................................. – – – – – – – – – – – –Libya ................................... – – – – – – – – – – – –Nigeria ................................ – – – – – – – – – – – –Qatar ................................... – – – – – – – – – – – –Saudi Arabia ....................... – – – – – – – – – – – –United Arab Emirates ......... – – – – – – – – – – – –Venezuela ........................... – – – – – – – – – – – –
Non-OPEC ............................. – – – – 216 – 4 2,150 37,837 297 18 315Canada ............................... – – – – 216 – 4 2,150 37,837 297 18 315Other ................................... – – – – 0 – 0 0 0 0 0 0
Total ....................................... – – – – 216 – 4 2,163 37,850 297 18 315
PAD District 5
OPEC ..................................... – – – – – – – 2,896 82,863 666 24 691Algeria ................................ – – – – – – – 1,123 1,123 – 9 9Angola ................................ – – – – – – – – 1,758 15 – 15Ecuador .............................. – – – – – – – 438 17,056 138 4 142Iran ..................................... – – – – – – – – – – – –Iraq ..................................... – – – – – – – – 10,655 89 – 89Kuwait ................................. – – – – – – – – 8,214 68 – 68Libya ................................... – – – – – – – – 3,621 30 – 30Nigeria ................................ – – – – – – – 314 2,311 17 3 19Qatar ................................... – – – – – – – – – – – –Saudi Arabia ....................... – – – – – – – – 35,107 293 – 293United Arab Emirates ......... – – – – – – – 1,021 1,021 – 9 9Venezuela ........................... – – – – – – – – – – – –
Non-OPEC ............................. 176 – 161 96 352 42 – 28,838 102,853 617 240 857Argentina ............................ – – – – – – – – 2,731 23 – 23Aruba .................................. – – – – – – – – – – – –Australia .............................. – – – – – – – – – – – –Brazil ................................... – – – – – – – – 9,588 80 – 80Brunei ................................. – – – – – – – – – – – –Canada ............................... – – – 96 352 19 – 6,698 35,830 243 56 299China .................................. – – 138 – – – – 2,389 2,389 – 20 20Colombia ............................ – – – – – – – 297 17,475 143 2 146Finland ................................ – – – – – – – – – – – –Germany ............................. – – – – – – – 96 96 – 1 1Indonesia ............................ – – – – – – – – 5,066 42 – 42Japan .................................. – – 21 – – – – 1,116 1,116 – 9 9Korea, South ....................... – – – – – 23 – 3,786 3,786 – 32 32Malaysia ............................. – – 2 – – – – 152 440 2 1 4Mexico ................................ – – – – – – – 1,328 7,799 54 11 65Netherlands ........................ – – – – – – – 812 812 – 7 7Netherlands Antilles ............ – – – – – – – – – – – –Oman .................................. – – – – – – – – – – – –Papua New Guinea ............ – – – – – – – – – – – –Peru .................................... – – – – – – – 2,486 2,486 – 21 21Singapore ........................... – – – – – – – 2,180 2,180 – 18 18Sweden ............................... – – – – – – – – – – – –Taiwan ................................ 176 – – – – – – 372 372 – 3 3United Kingdom .................. – – – – – – – 319 319 – 3 3Vietnam .............................. – – – – – – – – 788 7 – 7Virgin Islands, U.S. ............. – – – – – – – – – – – –Other ................................... 0 – 0 0 0 0 – 6,807 9,580 23 56 77
Total ....................................... 176 – 161 96 352 42 – 31,734 185,716 1,283 264 1,548
Persian Gulf3 ......................... – – – – – – – 1,021 54,997 450 9 458
– = No Data Reported.1 Crude oil and unfinished oils are reported by PAD District of processing; all other products are reported by PAD District of Entry.2 Includes crude oil imported for storage in the Strategic Petroleum Reserve.3 Includes Bahrain, Iran, Iraq, Kuwait, Qatar, Saudi Arabia, and United Arab Emirates.
Note: Totals may not equal sum of components due to independent rounding.Source: Energy Information Administration (EIA) Form EIA-814, "Monthly Imports Report."

Energy Information Administration/Petroleum Supply Monthly, 89 April 2018
Table 48. PAD District 4 and 5 - Year-to-Date Imports of Crude Oil and Petroleum Products by Country of Origin, January-April 2018(Thousand Barrels) — Continued
Country of Origin
Petrochemical Feedstocks
WaxesPetroleum
Coke
Asphaltand Road
Oil Lubricants
Miscellan-eous
ProductsTotal
Products
TotalCrudeOil and
Products
Daily Average
Crude Oil Products TotalNaphtha
OtherOils
PAD District 4
OPEC ..................................... – – – – – – – 13 13 – 0 0Algeria ................................ – – – – – – – – – – – –Angola ................................ – – – – – – – – – – – –Ecuador .............................. – – – – – – – – – – – –Iran ..................................... – – – – – – – – – – – –Iraq ..................................... – – – – – – – 13 13 – 0 0Kuwait ................................. – – – – – – – – – – – –Libya ................................... – – – – – – – – – – – –Nigeria ................................ – – – – – – – – – – – –Qatar ................................... – – – – – – – – – – – –Saudi Arabia ....................... – – – – – – – – – – – –United Arab Emirates ......... – – – – – – – – – – – –Venezuela ........................... – – – – – – – – – – – –
Non-OPEC ............................. – – – – 216 – 4 2,150 37,837 297 18 315Canada ............................... – – – – 216 – 4 2,150 37,837 297 18 315Other ................................... – – – – 0 – 0 0 0 0 0 0
Total ....................................... – – – – 216 – 4 2,163 37,850 297 18 315
PAD District 5
OPEC ..................................... – – – – – – – 2,896 82,863 666 24 691Algeria ................................ – – – – – – – 1,123 1,123 – 9 9Angola ................................ – – – – – – – – 1,758 15 – 15Ecuador .............................. – – – – – – – 438 17,056 138 4 142Iran ..................................... – – – – – – – – – – – –Iraq ..................................... – – – – – – – – 10,655 89 – 89Kuwait ................................. – – – – – – – – 8,214 68 – 68Libya ................................... – – – – – – – – 3,621 30 – 30Nigeria ................................ – – – – – – – 314 2,311 17 3 19Qatar ................................... – – – – – – – – – – – –Saudi Arabia ....................... – – – – – – – – 35,107 293 – 293United Arab Emirates ......... – – – – – – – 1,021 1,021 – 9 9Venezuela ........................... – – – – – – – – – – – –
Non-OPEC ............................. 176 – 161 96 352 42 – 28,838 102,853 617 240 857Argentina ............................ – – – – – – – – 2,731 23 – 23Aruba .................................. – – – – – – – – – – – –Australia .............................. – – – – – – – – – – – –Brazil ................................... – – – – – – – – 9,588 80 – 80Brunei ................................. – – – – – – – – – – – –Canada ............................... – – – 96 352 19 – 6,698 35,830 243 56 299China .................................. – – 138 – – – – 2,389 2,389 – 20 20Colombia ............................ – – – – – – – 297 17,475 143 2 146Finland ................................ – – – – – – – – – – – –Germany ............................. – – – – – – – 96 96 – 1 1Indonesia ............................ – – – – – – – – 5,066 42 – 42Japan .................................. – – 21 – – – – 1,116 1,116 – 9 9Korea, South ....................... – – – – – 23 – 3,786 3,786 – 32 32Malaysia ............................. – – 2 – – – – 152 440 2 1 4Mexico ................................ – – – – – – – 1,328 7,799 54 11 65Netherlands ........................ – – – – – – – 812 812 – 7 7Netherlands Antilles ............ – – – – – – – – – – – –Oman .................................. – – – – – – – – – – – –Papua New Guinea ............ – – – – – – – – – – – –Peru .................................... – – – – – – – 2,486 2,486 – 21 21Singapore ........................... – – – – – – – 2,180 2,180 – 18 18Sweden ............................... – – – – – – – – – – – –Taiwan ................................ 176 – – – – – – 372 372 – 3 3United Kingdom .................. – – – – – – – 319 319 – 3 3Vietnam .............................. – – – – – – – – 788 7 – 7Virgin Islands, U.S. ............. – – – – – – – – – – – –Other ................................... 0 – 0 0 0 0 – 6,807 9,580 23 56 77
Total ....................................... 176 – 161 96 352 42 – 31,734 185,716 1,283 264 1,548
Persian Gulf3 ......................... – – – – – – – 1,021 54,997 450 9 458
– = No Data Reported.1 Crude oil and unfinished oils are reported by PAD District of processing; all other products are reported by PAD District of Entry.2 Includes crude oil imported for storage in the Strategic Petroleum Reserve.3 Includes Bahrain, Iran, Iraq, Kuwait, Qatar, Saudi Arabia, and United Arab Emirates.
Note: Totals may not equal sum of components due to independent rounding.Source: Energy Information Administration (EIA) Form EIA-814, "Monthly Imports Report."
Table 49. Exports of Crude Oil and Petroleum Products by PAD District, April 2018(Thousand Barrels)
CommodityPAD Districts U.S. Total
1 2 3 4 5 Total Daily Average
Crude Oil1 ............................................................ 760 3,585 48,025 20 279 52,668 1,756
Hydrocarbon Gas Liquids .................................. 1,442 10,481 35,882 95 2,444 50,345 1,678Natural Gas Liquids .......................................... 1,442 10,481 35,882 95 2,444 50,345 1,678
Ethane .......................................................... 0 3,083 6,477 – 0 9,560 319Propane ........................................................ 1,188 238 24,947 – 1,807 28,179 939Normal Butane .............................................. 185 514 3,794 25 612 5,129 171Isobutane ...................................................... 1 0 646 – 1 648 22Natural Gasoline ........................................... 68 6,646 18 70 25 6,828 228
Refinery Olefins ................................................ – – – – – – –Ethylene ........................................................ – – – – – – –Propylene ..................................................... – – – – – – –Butylene ........................................................ – – – – – – –Isobutylene ................................................... – – – – – – –
Other Liquids ...................................................... 179 3,219 14,242 0 527 18,167 606Hydrogen/Oxygenates/Renewables/ Other Hydrocarbons ....................................... 44 750 5,090 0 170 6,055 202
Hydrogen ...................................................... – – – – – – –Oxygenates (excluding Fuel Ethanol) ........... 1 2 1,968 – 0 1,971 66
Methyl Tertiary Butyl Ether (MTBE) .......... 0 – 972 – 0 972 32Other Oxygenates .................................... 1 2 996 – 0 999 33
Renewable Fuels (including Fuel Ethanol) ... 44 748 3,122 0 169 4,084 136Fuel Ethanol ............................................. 34 601 3,121 – 110 3,866 129Biomass-Based Diesel ............................. 10 147 1 0 59 217 7Other Renewable Diesel ........................... – – – – – – –Other Renewable Fuels ............................ – – – – – – –
Other Hydrocarbons ..................................... – – – – – – –Unfinished Oils ................................................. 29 2,366 7,643 0 52 10,089 336
Naphthas and Lighter ................................... 4 2,359 7,477 – 42 9,881 329Kerosene and Light Gas Oils ........................ 25 7 166 0 10 208 7Heavy Gas Oils ............................................. – – – – – – –Residuum ..................................................... – – – – – – –
Motor Gasoline Blend.Comp. (MGBC) ............. 106 103 1,509 – 306 2,023 67Reformulated ................................................ 7 0 11 – 2 20 1Conventional ................................................. 98 103 1,498 – 304 2,003 67
Aviation Gasoline Blend. Comp. ....................... – – – – – – –
Finished Petroleum Products ............................ 6,452 1,113 90,806 19 12,332 110,723 3,691Finished Motor Gasoline ................................... 27 379 24,246 2 1,940 26,593 886
Reformulated ................................................ – – – – – – –Conventional ................................................. 27 379 24,246 2 1,940 26,593 886
Finished Aviation Gasoline ............................... – – – – – – –Kerosene-Type Jet Fuel ................................... 766 42 5,617 – 610 7,036 235Kerosene .......................................................... 0 3 187 – 1 192 6Distillate Fuel Oil ............................................... 3,679 47 36,825 0 3,157 43,708 1,457
15 ppm sulfur and under ............................... 2,700 0 32,500 0 1,814 37,014 1,234Greater than 15 ppm to 500 ppm sulfur ........ 300 31 1,939 – 11 2,282 76Greater than 500 ppm sulfur ......................... 680 16 2,386 – 1,331 4,413 147
Residual Fuel Oil .............................................. 537 100 7,298 9 1,693 9,638 321Naphtha for Petro. Feed. Use ........................... – – – – – – –Other Oils for Petro. Feed. Use ........................ – – – – – – –Special Naphthas ............................................. – – – – – – –Lubricants ......................................................... 176 218 3,449 7 418 4,268 142Waxes ............................................................... 62 26 15 0 5 109 4Petroleum Coke ................................................ 1,135 202 12,705 – 4,475 18,516 617Asphalt and Road Oil ........................................ 53 95 453 1 33 635 21Miscellaneous Products .................................... 15 2 10 0 0 28 1
Total ..................................................................... 8,832 18,399 188,955 134 15,582 231,902 7,730
– = No Data Reported.1 On December 18, 2015, the U.S. enacted legislation authorizing the export of U.S. crude oil without a license. Exports to embargoed or sanctioned countries continue to require authorization.
Note: Totals may not equal sum of components due to independent rounding.Sources: U.S. Census Bureau and EIA estimates.

Energy Information Administration/Petroleum Supply Monthly,90 April 2018
Table 50. Year-to-Date Exports of Crude Oil and Petroleum Products by PAD District, January-April 2018(Thousand Barrels)
CommodityPAD Districts U.S. Total
1 2 3 4 5 Total Daily Average
Crude Oil1 ............................................................ 6,325 15,743 168,027 130 788 191,012 1,592
Hydrocarbon Gas Liquids .................................. 7,190 34,891 133,940 276 5,001 181,298 1,511Natural Gas Liquids .......................................... 7,190 34,891 133,940 276 5,001 181,298 1,511
Ethane .......................................................... 2,713 10,463 16,008 – 0 29,184 243Propane ........................................................ 3,995 702 103,063 0 4,061 110,929 924Normal Butane .............................................. 234 1,209 14,926 34 946 17,205 143Isobutane ...................................................... 4 1 845 – 1 843 7Natural Gasoline ........................................... 246 22,532 81 242 35 23,136 193
Refinery Olefins ................................................ – – – – – – –Ethylene ........................................................ – – – – – – –Propylene ..................................................... – – – – – – –Butylene ........................................................ – – – – – – –Isobutylene ................................................... – – – – – – –
Other Liquids ...................................................... 1,050 10,695 50,200 8 1,599 63,553 530Hydrogen/Oxygenates/Renewables/ Other Hydrocarbons ....................................... 578 2,411 21,525 1 545 25,061 209
Hydrogen ...................................................... – – – – – – –Oxygenates (excluding Fuel Ethanol) ........... 6 4 7,979 0 4 7,994 67
Methyl Tertiary Butyl Ether (MTBE) .......... 0 0 4,396 – 0 4,396 37Other Oxygenates .................................... 6 4 3,583 0 4 3,597 30
Renewable Fuels (including Fuel Ethanol) ... 572 2,407 13,546 1 541 17,067 142Fuel Ethanol ............................................. 531 2,070 13,340 – 448 16,389 137Biomass-Based Diesel ............................. 41 337 206 1 93 678 6Other Renewable Diesel ........................... – – – – – – –Other Renewable Fuels ............................ – – – – – – –
Other Hydrocarbons ..................................... – – – – – – –Unfinished Oils ................................................. 87 8,172 23,761 7 253 32,280 269
Naphthas and Lighter ................................... 17 8,146 23,179 7 218 31,566 263Kerosene and Light Gas Oils ........................ 70 26 582 0 35 714 6Heavy Gas Oils ............................................. – – – – – – –Residuum ..................................................... – – – – – – –
Motor Gasoline Blend.Comp. (MGBC) ............. 385 112 4,914 0 800 6,211 52Reformulated ................................................ 11 1 35 – 10 57 0Conventional ................................................. 374 111 4,878 0 791 6,155 51
Aviation Gasoline Blend. Comp. ....................... – – – – – – –
Finished Petroleum Products ............................ 17,021 2,994 344,884 94 47,984 412,977 3,441Finished Motor Gasoline ................................... 223 600 103,945 4 9,396 114,168 951
Reformulated ................................................ – – – – – – –Conventional ................................................. 223 600 103,945 4 9,396 114,168 951
Finished Aviation Gasoline ............................... – – – – – – –Kerosene-Type Jet Fuel ................................... 1,132 159 20,440 – 3,586 25,317 211Kerosene .......................................................... 5 12 762 1 16 796 7Distillate Fuel Oil ............................................... 6,000 246 124,068 0 13,212 143,526 1,196
15 ppm sulfur and under ............................... 4,061 1 106,321 0 8,925 119,308 994Greater than 15 ppm to 500 ppm sulfur ........ 938 132 10,420 – 1,227 12,718 106Greater than 500 ppm sulfur ......................... 1,000 113 7,326 – 3,060 11,500 96
Residual Fuel Oil .............................................. 3,791 558 28,886 44 4,382 37,661 314Naphtha for Petro. Feed. Use ........................... – – – – – – –Other Oils for Petro. Feed. Use ........................ – – – – – – –Special Naphthas ............................................. – – – – – – –Lubricants ......................................................... 1,465 744 11,231 36 1,473 14,950 125Waxes ............................................................... 244 107 65 1 23 440 4Petroleum Coke ................................................ 3,809 324 53,982 0 15,699 73,814 615Asphalt and Road Oil ........................................ 293 235 1,488 6 126 2,148 18Miscellaneous Products .................................... 60 9 17 1 72 159 1
Total ..................................................................... 31,586 64,324 697,051 507 55,372 848,840 7,074
– = No Data Reported.1 On December 18, 2015, the U.S. enacted legislation authorizing the export of U.S. crude oil without a license. Exports to embargoed or sanctioned countries continue to require authorization.
Note: Totals may not equal sum of components due to independent rounding.Sources: U.S. Census Bureau and EIA estimates.

Energy Information Administration/Petroleum Supply Monthly, 91 April 2018
Table 50. Year-to-Date Exports of Crude Oil and Petroleum Products by PAD District, January-April 2018(Thousand Barrels)
CommodityPAD Districts U.S. Total
1 2 3 4 5 Total Daily Average
Crude Oil1 ............................................................ 6,325 15,743 168,027 130 788 191,012 1,592
Hydrocarbon Gas Liquids .................................. 7,190 34,891 133,940 276 5,001 181,298 1,511Natural Gas Liquids .......................................... 7,190 34,891 133,940 276 5,001 181,298 1,511
Ethane .......................................................... 2,713 10,463 16,008 – 0 29,184 243Propane ........................................................ 3,995 702 103,063 0 4,061 110,929 924Normal Butane .............................................. 234 1,209 14,926 34 946 17,205 143Isobutane ...................................................... 4 1 845 – 1 843 7Natural Gasoline ........................................... 246 22,532 81 242 35 23,136 193
Refinery Olefins ................................................ – – – – – – –Ethylene ........................................................ – – – – – – –Propylene ..................................................... – – – – – – –Butylene ........................................................ – – – – – – –Isobutylene ................................................... – – – – – – –
Other Liquids ...................................................... 1,050 10,695 50,200 8 1,599 63,553 530Hydrogen/Oxygenates/Renewables/ Other Hydrocarbons ....................................... 578 2,411 21,525 1 545 25,061 209
Hydrogen ...................................................... – – – – – – –Oxygenates (excluding Fuel Ethanol) ........... 6 4 7,979 0 4 7,994 67
Methyl Tertiary Butyl Ether (MTBE) .......... 0 0 4,396 – 0 4,396 37Other Oxygenates .................................... 6 4 3,583 0 4 3,597 30
Renewable Fuels (including Fuel Ethanol) ... 572 2,407 13,546 1 541 17,067 142Fuel Ethanol ............................................. 531 2,070 13,340 – 448 16,389 137Biomass-Based Diesel ............................. 41 337 206 1 93 678 6Other Renewable Diesel ........................... – – – – – – –Other Renewable Fuels ............................ – – – – – – –
Other Hydrocarbons ..................................... – – – – – – –Unfinished Oils ................................................. 87 8,172 23,761 7 253 32,280 269
Naphthas and Lighter ................................... 17 8,146 23,179 7 218 31,566 263Kerosene and Light Gas Oils ........................ 70 26 582 0 35 714 6Heavy Gas Oils ............................................. – – – – – – –Residuum ..................................................... – – – – – – –
Motor Gasoline Blend.Comp. (MGBC) ............. 385 112 4,914 0 800 6,211 52Reformulated ................................................ 11 1 35 – 10 57 0Conventional ................................................. 374 111 4,878 0 791 6,155 51
Aviation Gasoline Blend. Comp. ....................... – – – – – – –
Finished Petroleum Products ............................ 17,021 2,994 344,884 94 47,984 412,977 3,441Finished Motor Gasoline ................................... 223 600 103,945 4 9,396 114,168 951
Reformulated ................................................ – – – – – – –Conventional ................................................. 223 600 103,945 4 9,396 114,168 951
Finished Aviation Gasoline ............................... – – – – – – –Kerosene-Type Jet Fuel ................................... 1,132 159 20,440 – 3,586 25,317 211Kerosene .......................................................... 5 12 762 1 16 796 7Distillate Fuel Oil ............................................... 6,000 246 124,068 0 13,212 143,526 1,196
15 ppm sulfur and under ............................... 4,061 1 106,321 0 8,925 119,308 994Greater than 15 ppm to 500 ppm sulfur ........ 938 132 10,420 – 1,227 12,718 106Greater than 500 ppm sulfur ......................... 1,000 113 7,326 – 3,060 11,500 96
Residual Fuel Oil .............................................. 3,791 558 28,886 44 4,382 37,661 314Naphtha for Petro. Feed. Use ........................... – – – – – – –Other Oils for Petro. Feed. Use ........................ – – – – – – –Special Naphthas ............................................. – – – – – – –Lubricants ......................................................... 1,465 744 11,231 36 1,473 14,950 125Waxes ............................................................... 244 107 65 1 23 440 4Petroleum Coke ................................................ 3,809 324 53,982 0 15,699 73,814 615Asphalt and Road Oil ........................................ 293 235 1,488 6 126 2,148 18Miscellaneous Products .................................... 60 9 17 1 72 159 1
Total ..................................................................... 31,586 64,324 697,051 507 55,372 848,840 7,074
– = No Data Reported.1 On December 18, 2015, the U.S. enacted legislation authorizing the export of U.S. crude oil without a license. Exports to embargoed or sanctioned countries continue to require authorization.
Note: Totals may not equal sum of components due to independent rounding.Sources: U.S. Census Bureau and EIA estimates.
Table 51. Exports of Crude Oil and Petroleum Products by Destination, April 2018(Thousand Barrels)
Destination
Crude Oil1
NaturalGas
LiquidsRefineryOlefins
UnfinishedOils
Finished Motor Gasoline Motor Gasoline Blending Components
Reform-ulated
Conven-tional Total
Reform- ulated
Conven- tional Total
Argentina ............................ – 0 – 313 – 267 267 – – –Australia .............................. – 0 – 0 – 0 0 – 0 0Bahamas ............................ – 274 – – – 295 295 – 0 0Bahrain ............................... – – – 0 – 2 2 – – –Belgium ............................... – 0 – 335 – – – – – –Belize .................................. – – – – – 139 139 – – –Brazil ................................... – 1,404 – 50 – 1,555 1,555 0 90 91Canada ............................... 10,269 10,754 – 2,480 – 674 674 – 930 930Cayman Islands .................. – 150 – – – 0 0 – – –Chile ................................... – 1,073 – 115 – 141 141 – – –China .................................. 7,441 2,446 – 461 – 8 8 – – –Colombia ............................ 1,018 0 – 1,573 – 499 499 0 0 0Costa Rica .......................... – 188 – 5 – 170 170 0 131 131Denmark ............................. 675 – – – – – – – – –Dominican Republic ............ – 1,136 – 3 – 455 455 0 – 0Ecuador .............................. – 506 – 15 – 1,308 1,308 – – –Egypt .................................. – – – 0 – – – – – –El Salvador ......................... – 222 – 0 – 290 290 – – –Finland ................................ – – – 0 – 0 0 0 – 0France ................................ 749 281 – 25 – – – – – –Germany ............................. – 0 – 7 – – – – – –Ghana ................................. – 241 – 0 – – – – – –Gibraltar .............................. – – – – – – – – – –Greece ................................ – – – – – – – – – –Guatemala .......................... – 836 – – – 634 634 – – –Honduras ............................ – 376 – – – 762 762 – – –Hong Kong .......................... – – – 0 – – – – – –India .................................... 524 3,296 – 324 – – – 0 – 0Indonesia ............................ – 767 – 1 – 1 1 – – –Ireland ................................. – – – – – 1 1 – 0 0Israel ................................... – – – 8 – 1 1 – – –Italy ..................................... 7,449 – – – – – – – – –Jamaica .............................. – 78 – – – 3 3 – – –Japan .................................. 500 6,701 – 468 – 1 1 2 0 2Korea, South ....................... 3,069 2,762 – 494 – 200 200 – – –Lebanon .............................. – – – – – – – – – –Mexico ................................ – 3,526 – 648 – 15,677 15,677 10 849 860Montenegro ........................ – – – – – – – – – –Morocco .............................. – 254 – 13 – – – – – –Mozambique ....................... – – – – – – – – – –Netherlands ........................ 3,128 2,082 – 628 – 787 787 – 0 0Netherlands Antilles ............ – – – – – – – – – –New Zealand ...................... – – – 0 – – – – – –Nicaragua ........................... 274 – – – – 209 209 – – –Nigeria ................................ – 87 – 0 – – – – – –Norway ............................... 1,076 787 – – – – – – – –Pakistan .............................. – – – – – – – – – –Panama .............................. – 0 – 30 – 349 349 0 0 0Peru .................................... – – – 2 – 605 605 – – –Philippines .......................... – – – – – – – – – –Portugal .............................. – 781 – – – – – – – –Puerto Rico ......................... – – – – – – – – – –Romania ............................. – – – – – – – – – –Saudi Arabia ....................... – – – 1 – – – – – –Serbia ................................. – – – – – – – – – –Singapore ........................... 1,440 1,400 – 16 – 1 1 – – –South Africa ........................ 1,050 – – 0 – – – – – –Spain .................................. – 1,155 – – – – – – – –Switzerland ......................... – 1,157 – – – 116 116 – – –Taiwan ................................ 2,897 1,101 – 879 – 0 0 – – –Thailand .............................. 1,042 – – 0 – – – – – –Trinidad and Tobago .......... – 0 – – – 0 0 – – –Turkey ................................. – 1,117 – 0 – – – – – –United Arab Emirates ......... 1,133 – – 720 – – – – – –United Kingdom .................. 6,565 659 – 1 – 1 1 – 0 0Venezuela ........................... – 563 – 470 – 659 659 6 1 7Other ................................... 2,369 2,185 – 4 – 783 783 2 2 2
Total ....................................... 52,668 50,345 – 10,089 – 26,593 26,593 20 2,003 2,023
See footnotes at end of table.

Energy Information Administration/Petroleum Supply Monthly,92 April 2018
Table 51. Exports of Crude Oil and Petroleum Products by Destination, April 2018(Thousand Barrels) — Continued
Destination
Oxygenates Renewable Fuels Distillate Fuel Oil
MethylTertiary
ButylEther
(MTBE)
OtherOxygen-
atesFuel
Ethanol
Biomass-BasedDiesel
OtherRenewable
Diesel
OtherRenewable
Fuels
15 ppmsulfur and
under
Greaterthan 15ppm to 500 ppm
sulfur501 to
2000 ppm
Greaterthan 2000
ppm Total
Argentina ............................ – – 0 – – – 614 125 160 – 899Australia .............................. 0 0 0 – – – 0 – – – 0Bahamas ............................ – 0 – – – – 159 – 170 – 329Bahrain ............................... – – 0 – – – – – – – –Belgium ............................... 8 0 0 – – – – – 150 – 150Belize .................................. – – – – – – – 86 – – 86Brazil ................................... – 0 1,452 – – – 4,657 131 512 – 5,300Canada ............................... – 0 660 208 – – 851 202 42 – 1,095Cayman Islands .................. – – – – – – 90 – – – 90Chile ................................... 14 – 0 1 – – 3,091 – – – 3,091China .................................. – 0 0 – – – 1 – 8 – 9Colombia ............................ – 0 124 – – – 487 – – – 487Costa Rica .......................... – – 0 – – – 936 – – – 936Denmark ............................. – – – – – – – – – – –Dominican Republic ............ – 0 1 – – – 472 240 – – 712Ecuador .............................. – – – – – – 1,057 – – – 1,057Egypt .................................. – – 0 – – – – – – – –El Salvador ......................... – – – – – – 221 153 – – 374Finland ................................ – – 0 – – – – – – – –France ................................ – 0 – – – – 2,039 – – – 2,039Germany ............................. – 0 0 – – – 0 – – – 0Ghana ................................. – – – – – – – – – – –Gibraltar .............................. – – – – – – – – 299 – 299Greece ................................ – – – – – – – – – – –Guatemala .......................... – – – – – – 410 159 169 – 739Honduras ............................ – – 0 – – – 311 181 640 – 1,132Hong Kong .......................... – 0 0 – – – – – – – –India .................................... – 0 292 – – – 2 – – – 2Indonesia ............................ – 0 0 – – – – – – – –Ireland ................................. – – – – – – – – – – –Israel ................................... – 0 0 – – – 0 – – – 0Italy ..................................... – 0 – – – – 2 – – – 2Jamaica .............................. – – 84 – – – 83 180 3 – 266Japan .................................. – 996 14 – – – 0 – – – 0Korea, South ....................... 0 0 181 – – – 1 – 70 – 71Lebanon .............................. – – – – – – – – – – –Mexico ................................ 950 0 37 1 – – 9,362 39 80 – 9,481Montenegro ........................ – – – – – – – – – – –Morocco .............................. – – – – – – – – – – –Mozambique ....................... – – – – – – – – – – –Netherlands ........................ – 0 270 2 – – 3,171 145 150 – 3,466Netherlands Antilles ............ – – – – – – – – – – –New Zealand ...................... – – 0 – – – 1 – – – 1Nicaragua ........................... – – 0 – – – 125 50 130 – 305Nigeria ................................ – – – – – – – – – – –Norway ............................... – – – – – – – – – – –Pakistan .............................. – 0 – – – – – – – – –Panama .............................. – – – – – – 620 – 100 – 720Peru .................................... – – 124 – – – 2,579 – – – 2,579Philippines .......................... – – 115 – – – – – – – –Portugal .............................. – – – – – – – – – – –Puerto Rico ......................... – – – – – – – – – – –Romania ............................. – – – – – – – – – – –Saudi Arabia ....................... – – – – – – 0 – – – 0Serbia ................................. – – – – – – – – – – –Singapore ........................... 0 0 0 0 – – 392 – 650 – 1,042South Africa ........................ – – 0 – – – – – – – –Spain .................................. – – – – – – – – – – –Switzerland ......................... – – 24 6 – – – – – – –Taiwan ................................ – 0 0 – – – – – – – –Thailand .............................. – 0 – – – – – – – – –Trinidad and Tobago .......... – – – – – – – – – – –Turkey ................................. – 0 – – – – – – – – –United Arab Emirates ......... – – 185 – – – – – – – –United Kingdom .................. – – 0 – – – 1,212 – 62 – 1,274Venezuela ........................... – – – – – – 826 171 – – 997Other ................................... – 3 303 0 – – 3,242 420 1,018 – 4,678
Total ....................................... 972 999 3,866 217 – – 37,014 2,282 4,413 – 43,708
See footnotes at end of table.

Energy Information Administration/Petroleum Supply Monthly, 93 April 2018
Table 51. Exports of Crude Oil and Petroleum Products by Destination, April 2018(Thousand Barrels) — Continued
Destination
Oxygenates Renewable Fuels Distillate Fuel Oil
MethylTertiary
ButylEther
(MTBE)
OtherOxygen-
atesFuel
Ethanol
Biomass-BasedDiesel
OtherRenewable
Diesel
OtherRenewable
Fuels
15 ppmsulfur and
under
Greaterthan 15ppm to 500 ppm
sulfur501 to
2000 ppm
Greaterthan 2000
ppm Total
Argentina ............................ – – 0 – – – 614 125 160 – 899Australia .............................. 0 0 0 – – – 0 – – – 0Bahamas ............................ – 0 – – – – 159 – 170 – 329Bahrain ............................... – – 0 – – – – – – – –Belgium ............................... 8 0 0 – – – – – 150 – 150Belize .................................. – – – – – – – 86 – – 86Brazil ................................... – 0 1,452 – – – 4,657 131 512 – 5,300Canada ............................... – 0 660 208 – – 851 202 42 – 1,095Cayman Islands .................. – – – – – – 90 – – – 90Chile ................................... 14 – 0 1 – – 3,091 – – – 3,091China .................................. – 0 0 – – – 1 – 8 – 9Colombia ............................ – 0 124 – – – 487 – – – 487Costa Rica .......................... – – 0 – – – 936 – – – 936Denmark ............................. – – – – – – – – – – –Dominican Republic ............ – 0 1 – – – 472 240 – – 712Ecuador .............................. – – – – – – 1,057 – – – 1,057Egypt .................................. – – 0 – – – – – – – –El Salvador ......................... – – – – – – 221 153 – – 374Finland ................................ – – 0 – – – – – – – –France ................................ – 0 – – – – 2,039 – – – 2,039Germany ............................. – 0 0 – – – 0 – – – 0Ghana ................................. – – – – – – – – – – –Gibraltar .............................. – – – – – – – – 299 – 299Greece ................................ – – – – – – – – – – –Guatemala .......................... – – – – – – 410 159 169 – 739Honduras ............................ – – 0 – – – 311 181 640 – 1,132Hong Kong .......................... – 0 0 – – – – – – – –India .................................... – 0 292 – – – 2 – – – 2Indonesia ............................ – 0 0 – – – – – – – –Ireland ................................. – – – – – – – – – – –Israel ................................... – 0 0 – – – 0 – – – 0Italy ..................................... – 0 – – – – 2 – – – 2Jamaica .............................. – – 84 – – – 83 180 3 – 266Japan .................................. – 996 14 – – – 0 – – – 0Korea, South ....................... 0 0 181 – – – 1 – 70 – 71Lebanon .............................. – – – – – – – – – – –Mexico ................................ 950 0 37 1 – – 9,362 39 80 – 9,481Montenegro ........................ – – – – – – – – – – –Morocco .............................. – – – – – – – – – – –Mozambique ....................... – – – – – – – – – – –Netherlands ........................ – 0 270 2 – – 3,171 145 150 – 3,466Netherlands Antilles ............ – – – – – – – – – – –New Zealand ...................... – – 0 – – – 1 – – – 1Nicaragua ........................... – – 0 – – – 125 50 130 – 305Nigeria ................................ – – – – – – – – – – –Norway ............................... – – – – – – – – – – –Pakistan .............................. – 0 – – – – – – – – –Panama .............................. – – – – – – 620 – 100 – 720Peru .................................... – – 124 – – – 2,579 – – – 2,579Philippines .......................... – – 115 – – – – – – – –Portugal .............................. – – – – – – – – – – –Puerto Rico ......................... – – – – – – – – – – –Romania ............................. – – – – – – – – – – –Saudi Arabia ....................... – – – – – – 0 – – – 0Serbia ................................. – – – – – – – – – – –Singapore ........................... 0 0 0 0 – – 392 – 650 – 1,042South Africa ........................ – – 0 – – – – – – – –Spain .................................. – – – – – – – – – – –Switzerland ......................... – – 24 6 – – – – – – –Taiwan ................................ – 0 0 – – – – – – – –Thailand .............................. – 0 – – – – – – – – –Trinidad and Tobago .......... – – – – – – – – – – –Turkey ................................. – 0 – – – – – – – – –United Arab Emirates ......... – – 185 – – – – – – – –United Kingdom .................. – – 0 – – – 1,212 – 62 – 1,274Venezuela ........................... – – – – – – 826 171 – – 997Other ................................... – 3 303 0 – – 3,242 420 1,018 – 4,678
Total ....................................... 972 999 3,866 217 – – 37,014 2,282 4,413 – 43,708
See footnotes at end of table.
Table 51. Exports of Crude Oil and Petroleum Products by Destination, April 2018(Thousand Barrels) — Continued
Destination
Kerosene
FinishedAviationGasoline
AviationGasolineBlending
Components
Kerosene-Type Jet
FuelSpecial
NaphthasResidualFuel Oil
Petrochemical Feedstocks
NaphthaOtherOils
Argentina ............................ – – – 124 – – – –Australia .............................. – – – – – – – –Bahamas ............................ – – – 97 – 340 – –Bahrain ............................... – – – – – – – –Belgium ............................... – – – – – – – –Belize .................................. – – – – – – – –Brazil ................................... – – – – – – – –Canada ............................... 181 – – 1,755 – 536 – –Cayman Islands .................. – – – 45 – – – –Chile ................................... 1 – – 301 – – – –China .................................. – – – – – – – –Colombia ............................ – – – – – – – –Costa Rica .......................... 0 – – 105 – 0 – –Denmark ............................. – – – – – – – –Dominican Republic ............ 0 – – 184 – – – –Ecuador .............................. – – – – – 423 – –Egypt .................................. – – – – – – – –El Salvador ......................... 0 – – 21 – – – –Finland ................................ – – – – – – – –France ................................ – – – – – – – –Germany ............................. 0 – – – – – – –Ghana ................................. – – – – – – – –Gibraltar .............................. – – – – – 50 – –Greece ................................ – – – – – – – –Guatemala .......................... 0 – – 182 – – – –Honduras ............................ 0 – – 80 – 283 – –Hong Kong .......................... – – – – – 0 – –India .................................... – – – – – 1 – –Indonesia ............................ – – – – – – – –Ireland ................................. – – – – – – – –Israel ................................... – – – – – 0 – –Italy ..................................... – – – – – – – –Jamaica .............................. 0 – – 120 – 400 – –Japan .................................. – – – 0 – – – –Korea, South ....................... – – – – – 0 – –Lebanon .............................. – – – – – 645 – –Mexico ................................ 1 – – 2,022 – 1,416 – –Montenegro ........................ – – – – – – – –Morocco .............................. – – – – – – – –Mozambique ....................... – – – – – – – –Netherlands ........................ – – – 294 – 483 – –Netherlands Antilles ............ – – – – – – – –New Zealand ...................... – – – – – – – –Nicaragua ........................... – – – 52 – – – –Nigeria ................................ – – – – – – – –Norway ............................... – – – – – – – –Pakistan .............................. – – – – – – – –Panama .............................. – – – 334 – 2,155 – –Peru .................................... 0 – – 598 – – – –Philippines .......................... – – – – – – – –Portugal .............................. – – – – – – – –Puerto Rico ......................... – – – – – – – –Romania ............................. – – – – – – – –Saudi Arabia ....................... – – – – – – – –Serbia ................................. – – – – – – – –Singapore ........................... 0 – – – – 2,073 – –South Africa ........................ – – – – – – – –Spain .................................. – – – – – – – –Switzerland ......................... – – – – – – – –Taiwan ................................ – – – – – 1 – –Thailand .............................. – – – – – – – –Trinidad and Tobago .......... 0 – – 2 – – – –Turkey ................................. – – – – – – – –United Arab Emirates ......... 0 – – – – – – –United Kingdom .................. – – – 453 – 750 – –Venezuela ........................... – – – 0 – 0 – –Other ................................... 9 – – 267 – 82 – –
Total ....................................... 192 – – 7,036 – 9,638 – –
See footnotes at end of table.

Energy Information Administration/Petroleum Supply Monthly,94 April 2018
Table 51. Exports of Crude Oil and Petroleum Products by Destination, April 2018(Thousand Barrels) — Continued
Destination
WaxesPetroleum
CokeAsphalt and
Road Oil LubricantsMiscellanous
ProductsTotal
Products
TotalCrude Oil
andProducts
Daily Average
Crude Oil Products Total
Argentina ............................ 0 216 161 76 0 2,057 2,057 – 69 69Australia .............................. 1 231 – 35 0 267 267 – 9 9Bahamas ............................ – – 2 4 – 1,342 1,342 – 45 45Bahrain ............................... – – – 3 – 5 5 – 0 0Belgium ............................... 0 248 0 394 1 1,137 1,137 – 38 38Belize .................................. – – – 1 – 226 226 – 8 8Brazil ................................... 1 425 0 377 1 10,655 10,655 – 355 355Canada ............................... 81 785 152 283 7 20,580 30,848 342 686 1,028Cayman Islands .................. – – 1 0 – 286 286 – 10 10Chile ................................... 0 – 0 79 – 4,815 4,815 – 161 161China .................................. 2 2,377 4 43 0 5,351 12,793 248 178 426Colombia ............................ 0 0 0 190 0 2,876 3,894 34 96 130Costa Rica .......................... 0 182 73 22 0 1,813 1,813 – 60 60Denmark ............................. – 345 – 0 – 345 1,020 23 11 34Dominican Republic ............ 0 182 83 19 – 2,775 2,775 – 93 93Ecuador .............................. 0 255 0 48 – 3,613 3,613 – 120 120Egypt .................................. – – – 12 – 13 13 – 0 0El Salvador ......................... 0 – – 9 – 916 916 – 31 31Finland ................................ – 267 – 0 – 268 268 – 9 9France ................................ 0 7 – 54 – 2,406 3,155 25 80 105Germany ............................. 2 14 1 102 0 125 125 – 4 4Ghana ................................. – – 0 0 – 242 242 – 8 8Gibraltar .............................. – – – – – 349 349 – 12 12Greece ................................ – 552 – 0 – 553 553 – 18 18Guatemala .......................... 0 165 – 26 – 2,582 2,582 – 86 86Honduras ............................ 0 242 11 8 – 2,894 2,894 – 96 96Hong Kong .......................... 0 – 0 2 0 3 3 – 0 0India .................................... 3 1,850 1 130 0 5,899 6,424 17 197 214Indonesia ............................ 0 0 1 141 – 911 911 – 30 30Ireland ................................. 0 – – – – 1 1 – 0 0Israel ................................... – – – 26 – 35 35 – 1 1Italy ..................................... – 989 – 36 – 1,026 8,476 248 34 283Jamaica .............................. – – – 724 0 1,676 1,676 – 56 56Japan .................................. 1 1,431 0 25 5 9,644 10,144 17 321 338Korea, South ....................... 0 291 2 7 0 4,008 7,077 102 134 236Lebanon .............................. – – – – – 645 645 – 21 21Mexico ................................ 14 2,017 136 751 10 37,545 37,545 – 1,252 1,252Montenegro ........................ – – – – – – – – – –Morocco .............................. – 1,016 1 0 – 1,284 1,284 – 43 43Mozambique ....................... – 49 – – – 49 49 – 2 2Netherlands ........................ 1 75 1 90 1 8,180 11,308 104 273 377Netherlands Antilles ............ – – – – – – – – – –New Zealand ...................... 0 – 1 0 – 3 3 – 0 0Nicaragua ........................... – – – 7 – 573 847 9 19 28Nigeria ................................ – 1 – 171 – 259 259 – 9 9Norway ............................... – 99 – 0 – 887 1,963 36 30 65Pakistan .............................. 0 – – 1 0 1 1 – 0 0Panama .............................. – – – 15 0 3,603 3,603 – 120 120Peru .................................... 0 0 – 67 0 3,975 3,975 – 133 133Philippines .......................... 0 – – 2 – 117 117 – 4 4Portugal .............................. – – – 0 – 781 781 – 26 26Puerto Rico ......................... – – – – – – – – – –Romania ............................. – – – 0 – 0 0 – 0 0Saudi Arabia ....................... 0 2 – 3 – 5 5 – 0 0Serbia ................................. – – – – – – – – – –Singapore ........................... 0 – 1 20 0 4,554 5,993 48 152 200South Africa ........................ – 275 – 44 – 319 1,369 35 11 46Spain .................................. 0 732 0 1 0 1,888 1,888 – 63 63Switzerland ......................... – – – 0 – 1,302 1,302 – 43 43Taiwan ................................ 0 0 0 5 0 1,988 4,884 97 66 163Thailand .............................. 0 – – 10 1 10 1,053 35 0 35Trinidad and Tobago .......... 0 0 – 22 0 24 24 – 1 1Turkey ................................. 0 1,832 0 3 – 2,952 2,952 – 98 98United Arab Emirates ......... 0 0 1 89 – 995 2,128 38 33 71United Kingdom .................. 0 390 0 1 0 3,529 10,094 219 118 336Venezuela ........................... – – – 9 – 2,706 2,706 – 90 90Other ................................... 3 974 2 81 2 9,366 11,734 79 311 391
Total ....................................... 109 18,516 635 4,268 28 179,234 231,902 1,756 5,974 7,730
– = No Data Reported.1 On December 18, 2015, the U.S. enacted legislation authorizing the export of U.S. crude oil without a license. Exports to embargoed or sanctioned countries continue to require authorization.
Note: Totals may not equal sum of components due to independent rounding.Sources: U.S. Census Bureau and EIA estimates.

Energy Information Administration/Petroleum Supply Monthly, 95 April 2018
Table 51. Exports of Crude Oil and Petroleum Products by Destination, April 2018(Thousand Barrels) — Continued
Destination
WaxesPetroleum
CokeAsphalt and
Road Oil LubricantsMiscellanous
ProductsTotal
Products
TotalCrude Oil
andProducts
Daily Average
Crude Oil Products Total
Argentina ............................ 0 216 161 76 0 2,057 2,057 – 69 69Australia .............................. 1 231 – 35 0 267 267 – 9 9Bahamas ............................ – – 2 4 – 1,342 1,342 – 45 45Bahrain ............................... – – – 3 – 5 5 – 0 0Belgium ............................... 0 248 0 394 1 1,137 1,137 – 38 38Belize .................................. – – – 1 – 226 226 – 8 8Brazil ................................... 1 425 0 377 1 10,655 10,655 – 355 355Canada ............................... 81 785 152 283 7 20,580 30,848 342 686 1,028Cayman Islands .................. – – 1 0 – 286 286 – 10 10Chile ................................... 0 – 0 79 – 4,815 4,815 – 161 161China .................................. 2 2,377 4 43 0 5,351 12,793 248 178 426Colombia ............................ 0 0 0 190 0 2,876 3,894 34 96 130Costa Rica .......................... 0 182 73 22 0 1,813 1,813 – 60 60Denmark ............................. – 345 – 0 – 345 1,020 23 11 34Dominican Republic ............ 0 182 83 19 – 2,775 2,775 – 93 93Ecuador .............................. 0 255 0 48 – 3,613 3,613 – 120 120Egypt .................................. – – – 12 – 13 13 – 0 0El Salvador ......................... 0 – – 9 – 916 916 – 31 31Finland ................................ – 267 – 0 – 268 268 – 9 9France ................................ 0 7 – 54 – 2,406 3,155 25 80 105Germany ............................. 2 14 1 102 0 125 125 – 4 4Ghana ................................. – – 0 0 – 242 242 – 8 8Gibraltar .............................. – – – – – 349 349 – 12 12Greece ................................ – 552 – 0 – 553 553 – 18 18Guatemala .......................... 0 165 – 26 – 2,582 2,582 – 86 86Honduras ............................ 0 242 11 8 – 2,894 2,894 – 96 96Hong Kong .......................... 0 – 0 2 0 3 3 – 0 0India .................................... 3 1,850 1 130 0 5,899 6,424 17 197 214Indonesia ............................ 0 0 1 141 – 911 911 – 30 30Ireland ................................. 0 – – – – 1 1 – 0 0Israel ................................... – – – 26 – 35 35 – 1 1Italy ..................................... – 989 – 36 – 1,026 8,476 248 34 283Jamaica .............................. – – – 724 0 1,676 1,676 – 56 56Japan .................................. 1 1,431 0 25 5 9,644 10,144 17 321 338Korea, South ....................... 0 291 2 7 0 4,008 7,077 102 134 236Lebanon .............................. – – – – – 645 645 – 21 21Mexico ................................ 14 2,017 136 751 10 37,545 37,545 – 1,252 1,252Montenegro ........................ – – – – – – – – – –Morocco .............................. – 1,016 1 0 – 1,284 1,284 – 43 43Mozambique ....................... – 49 – – – 49 49 – 2 2Netherlands ........................ 1 75 1 90 1 8,180 11,308 104 273 377Netherlands Antilles ............ – – – – – – – – – –New Zealand ...................... 0 – 1 0 – 3 3 – 0 0Nicaragua ........................... – – – 7 – 573 847 9 19 28Nigeria ................................ – 1 – 171 – 259 259 – 9 9Norway ............................... – 99 – 0 – 887 1,963 36 30 65Pakistan .............................. 0 – – 1 0 1 1 – 0 0Panama .............................. – – – 15 0 3,603 3,603 – 120 120Peru .................................... 0 0 – 67 0 3,975 3,975 – 133 133Philippines .......................... 0 – – 2 – 117 117 – 4 4Portugal .............................. – – – 0 – 781 781 – 26 26Puerto Rico ......................... – – – – – – – – – –Romania ............................. – – – 0 – 0 0 – 0 0Saudi Arabia ....................... 0 2 – 3 – 5 5 – 0 0Serbia ................................. – – – – – – – – – –Singapore ........................... 0 – 1 20 0 4,554 5,993 48 152 200South Africa ........................ – 275 – 44 – 319 1,369 35 11 46Spain .................................. 0 732 0 1 0 1,888 1,888 – 63 63Switzerland ......................... – – – 0 – 1,302 1,302 – 43 43Taiwan ................................ 0 0 0 5 0 1,988 4,884 97 66 163Thailand .............................. 0 – – 10 1 10 1,053 35 0 35Trinidad and Tobago .......... 0 0 – 22 0 24 24 – 1 1Turkey ................................. 0 1,832 0 3 – 2,952 2,952 – 98 98United Arab Emirates ......... 0 0 1 89 – 995 2,128 38 33 71United Kingdom .................. 0 390 0 1 0 3,529 10,094 219 118 336Venezuela ........................... – – – 9 – 2,706 2,706 – 90 90Other ................................... 3 974 2 81 2 9,366 11,734 79 311 391
Total ....................................... 109 18,516 635 4,268 28 179,234 231,902 1,756 5,974 7,730
– = No Data Reported.1 On December 18, 2015, the U.S. enacted legislation authorizing the export of U.S. crude oil without a license. Exports to embargoed or sanctioned countries continue to require authorization.
Note: Totals may not equal sum of components due to independent rounding.Sources: U.S. Census Bureau and EIA estimates.
Table 52. Year-to-Date Exports of Crude Oil and Petroleum Products by Destination, January-April 2018(Thousand Barrels)
Destination
Crude Oil1
NaturalGas
LiquidsRefineryOlefins
UnfinishedOils
Finished Motor Gasoline Motor Gasoline Blending Components
Reform-ulated
Conven-tional Total
Reform- ulated
Conven- tional Total
Argentina ............................ 305 0 – 1,112 – 1,862 1,862 – 0 0Australia .............................. – 590 – 1 – 321 321 0 0 1Bahamas ............................ – 822 – 0 – 1,096 1,096 – 0 0Bahrain ............................... – – – 0 – 3 3 – – –Belgium ............................... – 0 – 632 – 1 1 – 0 0Belize .................................. – – – – – 271 271 – – –Brazil ................................... 1,564 4,407 – 1,124 – 6,362 6,362 0 90 91Canada ............................... 42,922 35,673 – 8,311 – 4,875 4,875 – 3,728 3,728Cayman Islands .................. – 161 – – – 169 169 0 – 0Chile ................................... – 2,743 – 762 – 1,059 1,059 – 1 1China .................................. 39,601 12,881 – 941 – 46 46 – – –Colombia ............................ 2,530 92 – 4,364 – 1,749 1,749 0 150 150Costa Rica .......................... – 587 – 17 – 1,565 1,565 0 531 532Denmark ............................. 1,740 – – – – – – – – –Dominican Republic ............ – 3,831 – 51 – 1,058 1,058 0 0 0Ecuador .............................. – 2,448 – 311 – 2,889 2,889 – 260 260Egypt .................................. – 1,499 – 0 – – – – – –El Salvador ......................... – 885 – 1 – 1,591 1,591 – – –Finland ................................ – – – 0 – 0 0 0 – 0France ................................ 2,973 1,687 – 87 – 1 1 – 1 1Germany ............................. – 0 – 17 – 1 1 – 0 0Ghana ................................. – 418 – 0 – 519 519 – – –Gibraltar .............................. – – – – – – – – – –Greece ................................ – 0 – – – – – – – –Guatemala .......................... – 1,782 – 7 – 3,295 3,295 – 1 1Honduras ............................ – 1,526 – 3 – 2,443 2,443 0 – 0Hong Kong .......................... 2,385 0 – 1 – 0 0 – – –India .................................... 3,532 9,065 – 1,343 – 0 0 0 – 0Indonesia ............................ – 3,959 – 18 – 1 1 – – –Ireland ................................. – – – – – 1 1 – 0 0Israel ................................... – – – 8 – 1 1 – – –Italy ..................................... 18,965 236 – 0 – – – – – –Jamaica .............................. – 253 – 1 – 67 67 – – –Japan .................................. 1,020 26,886 – 1,559 – 2 2 4 1 4Korea, South ....................... 9,570 8,224 – 532 – 929 929 0 – 0Lebanon .............................. – – – 0 – – – – – –Mexico ................................ – 17,668 – 980 – 66,052 66,052 40 1,385 1,425Montenegro ........................ – – – – – – – – – –Morocco .............................. – 2,532 – 32 – – – – – –Mozambique ....................... – – – – – – – – – –Netherlands ........................ 11,548 8,047 – 1,189 – 2,009 2,009 – 0 0Netherlands Antilles ............ – – – – – – – – – –New Zealand ...................... – – – 0 – 0 0 0 – 0Nicaragua ........................... 795 0 – 60 – 749 749 – – –Nigeria ................................ – 87 – 0 – 526 526 – – –Norway ............................... 3,781 1,813 – – – – – – – –Pakistan .............................. – – – – – – – – – –Panama .............................. – 52 – 126 – 2,129 2,129 0 1 1Peru .................................... – 0 – 35 – 2,973 2,973 – 0 0Philippines .......................... – – – 0 – 7 7 – – –Portugal .............................. 625 942 – – – – – – – –Puerto Rico ......................... – 7 – 1 – 9 9 – 1 1Romania ............................. – – – – – – – – – –Saudi Arabia ....................... – – – 7 – – – – – –Serbia ................................. – – – – – – – – – –Singapore ........................... 2,556 7,588 – 541 – 1 1 – – –South Africa ........................ 2,064 1 – 0 – 325 325 – – –Spain .................................. 1,543 2,679 – 0 – – – – – –Switzerland ......................... 1,594 2,521 – 304 – 116 116 – – –Taiwan ................................ 9,768 2,759 – 1,546 – 0 0 – 0 0Thailand .............................. 2,509 0 – 15 – – – – 0 0Trinidad and Tobago .......... – 2 – 8 – 1 1 – – –Turkey ................................. – 3,460 – 0 – – – – – –United Arab Emirates ......... 1,133 1 – 722 – 1 1 – – –United Kingdom .................. 16,349 4,905 – 2 – 3 3 – 0 0Venezuela ........................... – 1,214 – 4,515 – 4,455 4,455 10 1 11Other ................................... 9,640 4,365 – 994 – 2,635 2,635 3 4 4
Total ....................................... 191,012 181,298 – 32,280 – 114,168 114,168 57 6,155 6,211
See footnotes at end of table.

Energy Information Administration/Petroleum Supply Monthly,96 April 2018
Table 52. Year-to-Date Exports of Crude Oil and Petroleum Products by Destination, January-April 2018(Thousand Barrels) — Continued
Destination
Oxygenates Renewable Fuels Distillate Fuel Oil
MethylTertiary
ButylEther
(MTBE)
OtherOxygen-
atesFuel
Ethanol
Biomass-BasedDiesel
OtherRenewable
Diesel
OtherRenewable
Fuels
15 ppmsulfur and
under
Greaterthan 15ppm to 500 ppm
sulfur501 to
2000 ppm
Greaterthan 2000
ppm Total
Argentina ............................ – 0 0 – – – 2,084 395 250 – 2,729Australia .............................. 0 0 0 – – – 0 – 0 – 0Bahamas ............................ – 1 0 – – – 713 206 358 – 1,277Bahrain ............................... – – 0 – – – – – – – –Belgium ............................... 27 0 0 – – – 738 94 402 – 1,234Belize .................................. – – – – – – 38 140 27 – 204Brazil ................................... – 0 7,163 – – – 14,789 1,702 521 – 17,012Canada ............................... – 2 2,244 433 – – 1,520 1,277 251 – 3,048Cayman Islands .................. – – 0 – – – 388 – – – 388Chile ................................... 633 0 1 3 – – 11,394 801 260 – 12,455China .................................. 0 1 1,258 1 – – 3 – 8 – 12Colombia ............................ – 0 404 – – – 1,318 0 – – 1,319Costa Rica .......................... – 0 1 1 – – 2,981 – – – 2,981Denmark ............................. – – 0 – – – – – – – –Dominican Republic ............ – 0 2 – – – 496 515 200 – 1,211Ecuador .............................. – – 0 – – – 3,478 546 523 – 4,547Egypt .................................. – – 1 – – – – – – – –El Salvador ......................... – – – – – – 1,254 155 130 – 1,539Finland ................................ – – 0 – – – – – – – –France ................................ – 1 – – – – 3,310 – – – 3,310Germany ............................. – 0 0 0 – – 0 – – – 0Ghana ................................. – – – – – – – – – – –Gibraltar .............................. – – – – – – 409 399 596 – 1,404Greece ................................ – – – – – – – – – – –Guatemala .......................... – 0 – – – – 2,741 1,300 370 – 4,411Honduras ............................ – – 0 – – – 833 668 780 – 2,281Hong Kong .......................... – 0 0 – – – – – – – –India .................................... 0 0 906 – – – 3 – – – 3Indonesia ............................ – 0 0 – – – – – – – –Ireland ................................. – 0 0 – – – – – – – –Israel ................................... – 0 5 – – – 2 – – – 2Italy ..................................... – 0 0 – – – 36 – – – 36Jamaica .............................. – – 129 – – – 1,273 180 115 – 1,567Japan .................................. – 3,584 18 – – – 2 – – – 2Korea, South ....................... 0 0 699 – – – 3 – 170 – 173Lebanon .............................. – – – – – – 0 – – – 0Mexico ................................ 3,308 1 206 38 – – 36,610 437 136 – 37,183Montenegro ........................ – – – – – – 0 – – – 0Morocco .............................. – – – – – – 650 – – – 650Mozambique ....................... – – – – – – – – – – –Netherlands ........................ – 0 364 9 – – 4,696 606 1,024 – 6,327Netherlands Antilles ............ – – – – – – – – – – –New Zealand ...................... – 0 0 – – – 1 – – – 1Nicaragua ........................... – – 0 0 – – 257 145 727 – 1,129Nigeria ................................ – – 283 – – – – – – – –Norway ............................... – – 45 – – – – – – – –Pakistan .............................. – 0 0 – – – – – – – –Panama .............................. – 0 0 – – – 4,534 487 350 – 5,371Peru .................................... – 0 352 162 – – 9,132 525 – – 9,657Philippines .......................... – 0 360 – – – 0 – – – 0Portugal .............................. – – – – – – – – – – –Puerto Rico ......................... 0 1 91 – – – 1 2 – – 2Romania ............................. – – – – – – 320 – – – 320Saudi Arabia ....................... – 0 114 – – – 1 – – – 1Serbia ................................. – – – – – – – – – – –Singapore ........................... 0 2 416 1 – – 1,488 30 1,467 – 2,984South Africa ........................ – 0 0 – – – – – – – –Spain .................................. – 0 41 – – – 151 – – – 151Switzerland ......................... – 0 115 21 – – 468 132 0 – 600Taiwan ................................ 0 0 1 – – – 0 – – – 0Thailand .............................. – 0 0 0 – – – – – – –Trinidad and Tobago .......... – – 0 0 – – 0 – – – 0Turkey ................................. – 1 – – – – 1 – – – 1United Arab Emirates ......... – 0 678 – – – 2 – – – 2United Kingdom .................. – 0 1 – – – 1,932 1 62 – 1,995Venezuela ........................... 427 0 – – – – 3,577 171 – – 3,748Other ................................... 1 3 491 9 – – 5,681 1,804 2,773 – 10,259
Total ....................................... 4,396 3,597 16,389 678 – – 119,308 12,718 11,500 – 143,526
See footnotes at end of table.

Energy Information Administration/Petroleum Supply Monthly, 97 April 2018
Table 52. Year-to-Date Exports of Crude Oil and Petroleum Products by Destination, January-April 2018(Thousand Barrels) — Continued
Destination
Oxygenates Renewable Fuels Distillate Fuel Oil
MethylTertiary
ButylEther
(MTBE)
OtherOxygen-
atesFuel
Ethanol
Biomass-BasedDiesel
OtherRenewable
Diesel
OtherRenewable
Fuels
15 ppmsulfur and
under
Greaterthan 15ppm to 500 ppm
sulfur501 to
2000 ppm
Greaterthan 2000
ppm Total
Argentina ............................ – 0 0 – – – 2,084 395 250 – 2,729Australia .............................. 0 0 0 – – – 0 – 0 – 0Bahamas ............................ – 1 0 – – – 713 206 358 – 1,277Bahrain ............................... – – 0 – – – – – – – –Belgium ............................... 27 0 0 – – – 738 94 402 – 1,234Belize .................................. – – – – – – 38 140 27 – 204Brazil ................................... – 0 7,163 – – – 14,789 1,702 521 – 17,012Canada ............................... – 2 2,244 433 – – 1,520 1,277 251 – 3,048Cayman Islands .................. – – 0 – – – 388 – – – 388Chile ................................... 633 0 1 3 – – 11,394 801 260 – 12,455China .................................. 0 1 1,258 1 – – 3 – 8 – 12Colombia ............................ – 0 404 – – – 1,318 0 – – 1,319Costa Rica .......................... – 0 1 1 – – 2,981 – – – 2,981Denmark ............................. – – 0 – – – – – – – –Dominican Republic ............ – 0 2 – – – 496 515 200 – 1,211Ecuador .............................. – – 0 – – – 3,478 546 523 – 4,547Egypt .................................. – – 1 – – – – – – – –El Salvador ......................... – – – – – – 1,254 155 130 – 1,539Finland ................................ – – 0 – – – – – – – –France ................................ – 1 – – – – 3,310 – – – 3,310Germany ............................. – 0 0 0 – – 0 – – – 0Ghana ................................. – – – – – – – – – – –Gibraltar .............................. – – – – – – 409 399 596 – 1,404Greece ................................ – – – – – – – – – – –Guatemala .......................... – 0 – – – – 2,741 1,300 370 – 4,411Honduras ............................ – – 0 – – – 833 668 780 – 2,281Hong Kong .......................... – 0 0 – – – – – – – –India .................................... 0 0 906 – – – 3 – – – 3Indonesia ............................ – 0 0 – – – – – – – –Ireland ................................. – 0 0 – – – – – – – –Israel ................................... – 0 5 – – – 2 – – – 2Italy ..................................... – 0 0 – – – 36 – – – 36Jamaica .............................. – – 129 – – – 1,273 180 115 – 1,567Japan .................................. – 3,584 18 – – – 2 – – – 2Korea, South ....................... 0 0 699 – – – 3 – 170 – 173Lebanon .............................. – – – – – – 0 – – – 0Mexico ................................ 3,308 1 206 38 – – 36,610 437 136 – 37,183Montenegro ........................ – – – – – – 0 – – – 0Morocco .............................. – – – – – – 650 – – – 650Mozambique ....................... – – – – – – – – – – –Netherlands ........................ – 0 364 9 – – 4,696 606 1,024 – 6,327Netherlands Antilles ............ – – – – – – – – – – –New Zealand ...................... – 0 0 – – – 1 – – – 1Nicaragua ........................... – – 0 0 – – 257 145 727 – 1,129Nigeria ................................ – – 283 – – – – – – – –Norway ............................... – – 45 – – – – – – – –Pakistan .............................. – 0 0 – – – – – – – –Panama .............................. – 0 0 – – – 4,534 487 350 – 5,371Peru .................................... – 0 352 162 – – 9,132 525 – – 9,657Philippines .......................... – 0 360 – – – 0 – – – 0Portugal .............................. – – – – – – – – – – –Puerto Rico ......................... 0 1 91 – – – 1 2 – – 2Romania ............................. – – – – – – 320 – – – 320Saudi Arabia ....................... – 0 114 – – – 1 – – – 1Serbia ................................. – – – – – – – – – – –Singapore ........................... 0 2 416 1 – – 1,488 30 1,467 – 2,984South Africa ........................ – 0 0 – – – – – – – –Spain .................................. – 0 41 – – – 151 – – – 151Switzerland ......................... – 0 115 21 – – 468 132 0 – 600Taiwan ................................ 0 0 1 – – – 0 – – – 0Thailand .............................. – 0 0 0 – – – – – – –Trinidad and Tobago .......... – – 0 0 – – 0 – – – 0Turkey ................................. – 1 – – – – 1 – – – 1United Arab Emirates ......... – 0 678 – – – 2 – – – 2United Kingdom .................. – 0 1 – – – 1,932 1 62 – 1,995Venezuela ........................... 427 0 – – – – 3,577 171 – – 3,748Other ................................... 1 3 491 9 – – 5,681 1,804 2,773 – 10,259
Total ....................................... 4,396 3,597 16,389 678 – – 119,308 12,718 11,500 – 143,526
See footnotes at end of table.
Table 52. Year-to-Date Exports of Crude Oil and Petroleum Products by Destination, January-April 2018(Thousand Barrels) — Continued
Destination
Kerosene
FinishedAviationGasoline
AviationGasolineBlending
Components
Kerosene-Type Jet
FuelSpecial
NaphthasResidualFuel Oil
Petrochemical Feedstocks
NaphthaOtherOils
Argentina ............................ 130 – – 237 – 0 – –Australia .............................. 0 – – – – – – –Bahamas ............................ – – – 260 – 1,348 – –Bahrain ............................... – – – – – – – –Belgium ............................... – – – – – 0 – –Belize .................................. 0 – – 26 – – – –Brazil ................................... – – – 336 – 200 – –Canada ............................... 283 – – 5,798 – 2,615 – –Cayman Islands .................. – – – 118 – – – –Chile ................................... 3 – – 1,130 – – – –China .................................. 1 – – 0 – 240 – –Colombia ............................ 0 – – – – 0 – –Costa Rica .......................... 0 – – 614 – 0 – –Denmark ............................. – – – – – – – –Dominican Republic ............ 0 – – 470 – 301 – –Ecuador .............................. – – – – – 1,070 – –Egypt .................................. – – – – – 0 – –El Salvador ......................... 0 – – 41 – – – –Finland ................................ – – – – – – – –France ................................ – – – – – – – –Germany ............................. 0 – – – – – – –Ghana ................................. – – – – – – – –Gibraltar .............................. – – – – – 1,225 – –Greece ................................ – – – – – – – –Guatemala .......................... 66 – – 351 – 846 – –Honduras ............................ 0 – – 222 – 711 – –Hong Kong .......................... – – – 0 – 7 – –India .................................... – – – – – 1 – –Indonesia ............................ – – – – – – – –Ireland ................................. – – – – – – – –Israel ................................... – – – 667 – 0 – –Italy ..................................... – – – – – – – –Jamaica .............................. 0 – – 370 – 1,378 – –Japan .................................. – – – 0 – – – –Korea, South ....................... 0 – – 0 – 0 – –Lebanon .............................. – – – 0 – 1,512 – –Mexico ................................ 3 – – 6,737 – 4,562 – –Montenegro ........................ – – – – – – – –Morocco .............................. – – – – – – – –Mozambique ....................... – – – – – – – –Netherlands ........................ 1 – – 1,180 – 2,632 – –Netherlands Antilles ............ – – – – – – – –New Zealand ...................... – – – – – 70 – –Nicaragua ........................... 100 – – 52 – – – –Nigeria ................................ – – – 302 – – – –Norway ............................... 121 – – – – – – –Pakistan .............................. – – – – – – – –Panama .............................. 0 – – 2,092 – 4,371 – –Peru .................................... 1 – – 905 – 111 – –Philippines .......................... – – – – – – – –Portugal .............................. – – – – – – – –Puerto Rico ......................... 0 – – 1 – 1 – –Romania ............................. – – – – – – – –Saudi Arabia ....................... – – – – – – – –Serbia ................................. – – – – – – – –Singapore ........................... 0 – – – – 8,255 – –South Africa ........................ 0 – – – – 0 – –Spain .................................. – – – – – 0 – –Switzerland ......................... – – – – – – – –Taiwan ................................ – – – 0 – 2 – –Thailand .............................. – – – – – 0 – –Trinidad and Tobago .......... 0 – – 3 – – – –Turkey ................................. – – – – – – – –United Arab Emirates ......... 1 – – 0 – 246 – –United Kingdom .................. 0 – – 1,671 – 2,751 – –Venezuela ........................... – – – 63 – 742 – –Other ................................... 86 – – 1,671 – 2,464 – –
Total ....................................... 796 – – 25,317 – 37,661 – –
See footnotes at end of table.

Energy Information Administration/Petroleum Supply Monthly,98 April 2018
Table 52. Year-to-Date Exports of Crude Oil and Petroleum Products by Destination, January-April 2018(Thousand Barrels) — Continued
Destination
WaxesPetroleum
CokeAsphalt and
Road Oil LubricantsMiscellanous
ProductsTotal
Products
TotalCrude Oil
andProducts
Daily Average
Crude Oil Products Total
Argentina ............................ 1 390 162 255 0 6,879 7,184 3 57 60Australia .............................. 1 991 0 88 1 1,994 1,994 – 17 17Bahamas ............................ – – 10 20 – 4,836 4,836 – 40 40Bahrain ............................... 0 – – 4 – 7 7 – 0 0Belgium ............................... 0 1,074 1 1,285 2 4,256 4,256 – 35 35Belize .................................. – – – 4 – 506 506 – 4 4Brazil ................................... 3 6,147 1 1,348 3 44,196 45,760 13 368 381Canada ............................... 320 2,580 525 1,077 29 71,541 114,462 358 596 954Cayman Islands .................. – – 5 4 – 844 844 – 7 7Chile ................................... 1 – 168 315 0 19,274 19,274 – 161 161China .................................. 11 8,827 11 151 5 24,385 63,986 330 203 533Colombia ............................ 0 1 0 520 1 8,601 11,131 21 72 93Costa Rica .......................... 1 363 274 72 0 7,009 7,009 – 58 58Denmark ............................. – 494 0 0 – 495 2,235 14 4 19Dominican Republic ............ 1 527 179 116 0 7,749 7,749 – 65 65Ecuador .............................. 0 446 1 806 – 12,778 12,778 – 106 106Egypt .................................. – 1,480 – 34 – 3,015 3,015 – 25 25El Salvador ......................... 0 201 0 102 – 4,361 4,361 – 36 36Finland ................................ 0 267 – 1 – 269 269 – 2 2France ................................ 1 697 – 264 – 6,047 9,020 25 50 75Germany ............................. 5 28 3 312 1 366 366 – 3 3Ghana ................................. – – 0 2 – 940 940 – 8 8Gibraltar .............................. – – – – – 2,628 2,628 – 22 22Greece ................................ 0 2,139 – 24 – 2,163 2,163 – 18 18Guatemala .......................... 1 1,024 – 85 – 11,869 11,869 – 99 99Honduras ............................ 0 682 43 40 – 7,953 7,953 – 66 66Hong Kong .......................... 1 249 0 12 1 272 2,657 20 2 22India .................................... 7 7,555 6 900 1 19,788 23,320 29 165 194Indonesia ............................ 0 0 4 144 0 4,127 4,127 – 34 34Ireland ................................. 0 188 – 0 0 189 189 – 2 2Israel ................................... 0 284 – 33 0 1,000 1,000 – 8 8Italy ..................................... 1 3,139 0 38 – 3,450 22,415 158 29 187Jamaica .............................. – – – 745 0 4,509 4,509 – 38 38Japan .................................. 3 6,328 2 68 15 38,472 39,492 9 321 329Korea, South ....................... 1 851 7 22 1 11,440 21,011 80 95 175Lebanon .............................. 0 466 – 9 – 1,988 1,988 – 17 17Mexico ................................ 62 7,937 578 3,247 87 150,073 150,073 – 1,251 1,251Montenegro ........................ – 176 – – – 176 176 – 1 1Morocco .............................. – 2,556 1 0 – 5,771 5,771 – 48 48Mozambique ....................... – 241 – – – 241 241 – 2 2Netherlands ........................ 7 716 5 218 2 22,707 34,255 96 189 285Netherlands Antilles ............ – – – – – – – – – –New Zealand ...................... 0 165 1 4 – 242 242 – 2 2Nicaragua ........................... 0 – – 22 – 2,113 2,908 7 18 24Nigeria ................................ – 1 – 533 0 1,733 1,733 – 14 14Norway ............................... 0 297 0 1 – 2,277 6,058 32 19 50Pakistan .............................. 0 0 0 37 0 38 38 – 0 0Panama .............................. – – 101 67 0 14,310 14,310 – 119 119Peru .................................... 0 0 0 284 1 14,480 14,480 – 121 121Philippines .......................... 0 0 – 5 1 374 374 – 3 3Portugal .............................. 0 397 – 1 – 1,339 1,964 5 11 16Puerto Rico ......................... 0 – 1 46 0 162 162 – 1 1Romania ............................. 0 310 – 0 – 631 631 – 5 5Saudi Arabia ....................... 1 9 0 12 0 144 144 – 1 1Serbia ................................. – – – – – – – – – –Singapore ........................... 1 – 3 716 0 20,510 23,066 21 171 192South Africa ........................ 0 402 0 184 – 913 2,977 17 8 25Spain .................................. 2 2,472 0 4 0 5,348 6,891 13 45 57Switzerland ......................... 0 0 – 0 – 3,676 5,270 13 31 44Taiwan ................................ 0 0 1 19 1 4,331 14,099 81 36 117Thailand .............................. 0 – 2 18 1 37 2,545 21 0 21Trinidad and Tobago .......... 0 0 0 35 0 49 49 – 0 0Turkey ................................. 0 8,147 0 55 – 11,663 11,663 – 97 97United Arab Emirates ......... 0 1 2 266 0 1,919 3,052 9 16 25United Kingdom .................. 1 652 2 4 0 11,986 28,335 136 100 236Venezuela ........................... 0 66 – 21 – 15,262 15,262 – 127 127Other ................................... 7 1,851 49 251 6 25,127 34,768 81 213 297
Total ....................................... 440 73,814 2,148 14,950 159 657,828 848,840 1,592 5,482 7,074
– = No Data Reported.1 On December 18, 2015, the U.S. enacted legislation authorizing the export of U.S. crude oil without a license. Exports to embargoed or sanctioned countries continue to require authorization.
Note: Totals may not equal sum of components due to independent rounding.Sources: U.S. Census Bureau and EIA estimates.

Energy Information Administration/Petroleum Supply Monthly, 99 April 2018
Table 52. Year-to-Date Exports of Crude Oil and Petroleum Products by Destination, January-April 2018(Thousand Barrels) — Continued
Destination
WaxesPetroleum
CokeAsphalt and
Road Oil LubricantsMiscellanous
ProductsTotal
Products
TotalCrude Oil
andProducts
Daily Average
Crude Oil Products Total
Argentina ............................ 1 390 162 255 0 6,879 7,184 3 57 60Australia .............................. 1 991 0 88 1 1,994 1,994 – 17 17Bahamas ............................ – – 10 20 – 4,836 4,836 – 40 40Bahrain ............................... 0 – – 4 – 7 7 – 0 0Belgium ............................... 0 1,074 1 1,285 2 4,256 4,256 – 35 35Belize .................................. – – – 4 – 506 506 – 4 4Brazil ................................... 3 6,147 1 1,348 3 44,196 45,760 13 368 381Canada ............................... 320 2,580 525 1,077 29 71,541 114,462 358 596 954Cayman Islands .................. – – 5 4 – 844 844 – 7 7Chile ................................... 1 – 168 315 0 19,274 19,274 – 161 161China .................................. 11 8,827 11 151 5 24,385 63,986 330 203 533Colombia ............................ 0 1 0 520 1 8,601 11,131 21 72 93Costa Rica .......................... 1 363 274 72 0 7,009 7,009 – 58 58Denmark ............................. – 494 0 0 – 495 2,235 14 4 19Dominican Republic ............ 1 527 179 116 0 7,749 7,749 – 65 65Ecuador .............................. 0 446 1 806 – 12,778 12,778 – 106 106Egypt .................................. – 1,480 – 34 – 3,015 3,015 – 25 25El Salvador ......................... 0 201 0 102 – 4,361 4,361 – 36 36Finland ................................ 0 267 – 1 – 269 269 – 2 2France ................................ 1 697 – 264 – 6,047 9,020 25 50 75Germany ............................. 5 28 3 312 1 366 366 – 3 3Ghana ................................. – – 0 2 – 940 940 – 8 8Gibraltar .............................. – – – – – 2,628 2,628 – 22 22Greece ................................ 0 2,139 – 24 – 2,163 2,163 – 18 18Guatemala .......................... 1 1,024 – 85 – 11,869 11,869 – 99 99Honduras ............................ 0 682 43 40 – 7,953 7,953 – 66 66Hong Kong .......................... 1 249 0 12 1 272 2,657 20 2 22India .................................... 7 7,555 6 900 1 19,788 23,320 29 165 194Indonesia ............................ 0 0 4 144 0 4,127 4,127 – 34 34Ireland ................................. 0 188 – 0 0 189 189 – 2 2Israel ................................... 0 284 – 33 0 1,000 1,000 – 8 8Italy ..................................... 1 3,139 0 38 – 3,450 22,415 158 29 187Jamaica .............................. – – – 745 0 4,509 4,509 – 38 38Japan .................................. 3 6,328 2 68 15 38,472 39,492 9 321 329Korea, South ....................... 1 851 7 22 1 11,440 21,011 80 95 175Lebanon .............................. 0 466 – 9 – 1,988 1,988 – 17 17Mexico ................................ 62 7,937 578 3,247 87 150,073 150,073 – 1,251 1,251Montenegro ........................ – 176 – – – 176 176 – 1 1Morocco .............................. – 2,556 1 0 – 5,771 5,771 – 48 48Mozambique ....................... – 241 – – – 241 241 – 2 2Netherlands ........................ 7 716 5 218 2 22,707 34,255 96 189 285Netherlands Antilles ............ – – – – – – – – – –New Zealand ...................... 0 165 1 4 – 242 242 – 2 2Nicaragua ........................... 0 – – 22 – 2,113 2,908 7 18 24Nigeria ................................ – 1 – 533 0 1,733 1,733 – 14 14Norway ............................... 0 297 0 1 – 2,277 6,058 32 19 50Pakistan .............................. 0 0 0 37 0 38 38 – 0 0Panama .............................. – – 101 67 0 14,310 14,310 – 119 119Peru .................................... 0 0 0 284 1 14,480 14,480 – 121 121Philippines .......................... 0 0 – 5 1 374 374 – 3 3Portugal .............................. 0 397 – 1 – 1,339 1,964 5 11 16Puerto Rico ......................... 0 – 1 46 0 162 162 – 1 1Romania ............................. 0 310 – 0 – 631 631 – 5 5Saudi Arabia ....................... 1 9 0 12 0 144 144 – 1 1Serbia ................................. – – – – – – – – – –Singapore ........................... 1 – 3 716 0 20,510 23,066 21 171 192South Africa ........................ 0 402 0 184 – 913 2,977 17 8 25Spain .................................. 2 2,472 0 4 0 5,348 6,891 13 45 57Switzerland ......................... 0 0 – 0 – 3,676 5,270 13 31 44Taiwan ................................ 0 0 1 19 1 4,331 14,099 81 36 117Thailand .............................. 0 – 2 18 1 37 2,545 21 0 21Trinidad and Tobago .......... 0 0 0 35 0 49 49 – 0 0Turkey ................................. 0 8,147 0 55 – 11,663 11,663 – 97 97United Arab Emirates ......... 0 1 2 266 0 1,919 3,052 9 16 25United Kingdom .................. 1 652 2 4 0 11,986 28,335 136 100 236Venezuela ........................... 0 66 – 21 – 15,262 15,262 – 127 127Other ................................... 7 1,851 49 251 6 25,127 34,768 81 213 297
Total ....................................... 440 73,814 2,148 14,950 159 657,828 848,840 1,592 5,482 7,074
– = No Data Reported.1 On December 18, 2015, the U.S. enacted legislation authorizing the export of U.S. crude oil without a license. Exports to embargoed or sanctioned countries continue to require authorization.
Note: Totals may not equal sum of components due to independent rounding.Sources: U.S. Census Bureau and EIA estimates.
Table 53. Net Imports of Crude Oil and Petroleum Products into the United States by Country, April 2018(Thousand Barrels per Day)
Country of Origin
Crude Oil1
NaturalGas
LiquidsRefineryOlefins
UnfinishedOils
Finished Motor Gasoline Motor Gasoline Blending Components
Reform-ulated
Conven-tional Total
Reform- ulated
Conven- tional Total
OPEC ..................................... 3,198 -39 – 134 – -66 -66 0 37 37Algeria ................................ 90 – – 117 – – – – – –Angola ................................ 158 – – – – – – – 11 11Ecuador .............................. 225 -17 – -1 – -44 -44 – – –Equatorial Guinea ............... 33 – – – – – – – – –Gabon ................................. – – – – – – – – – –Iran ..................................... – – – – – – – – – –Iraq ..................................... 830 – – 4 – – – – – –Kuwait ................................. 107 – – – – – – 0 – 0Libya ................................... 87 – – – – – – – – –Nigeria ................................ 258 -3 – 0 – – – – 16 16Qatar ................................... – – – – – – – – – –Saudi Arabia ....................... 886 – – 18 – – – – – –United Arab Emirates ......... -38 – – 11 – – – – – –Venezuela ........................... 561 -19 – -16 – -22 -22 0 10 10
Non-OPEC ............................. 3,291 -1,487 16 106 – -788 -788 154 535 690Argentina ............................ 10 0 – -10 – -9 -9 – – –Aruba .................................. – – – 0 – -13 -13 – – –Australia .............................. – 0 – 0 – 0 0 – 0 0Bahamas ............................ – -9 – – – -10 -10 – 0 0Bahrain ............................... – – – 0 – 0 0 – – –Belgium ............................... – 0 – 34 – – – – 9 9Brazil ................................... 149 -47 – 15 – -52 -52 0 7 7Brunei ................................. – – – – – – – – – –Cameroon ........................... 27 0 – 8 – – – – – –Canada ............................... 3,389 -208 12 -65 – -15 -15 92 13 105Chad ................................... – – – – – – – – – –China .................................. -248 -82 – -15 – 0 0 – – –Colombia ............................ 203 0 – -45 – -17 -17 0 28 28Denmark ............................. -10 – – – – – – – 1 1Dominican Republic ............ – -38 – 0 – -15 -15 0 – 0Estonia ................................ – – – – – – – – – –Finland ................................ – – – 0 – 0 0 0 – 0France ................................ -25 -9 – 3 – – – – 11 11Germany ............................. – 0 – 2 – – – – – –Guatemala .......................... 9 -28 – – – -21 -21 – – –Honduras ............................ – -13 – – – -25 -25 – – –India .................................... -17 -110 – -11 – – – 0 109 109Indonesia ............................ 36 -26 – 0 – 0 0 – – –Italy ..................................... -248 – – 14 – – – – 19 19Japan .................................. -17 -223 – -16 – 0 0 0 13 13Korea, South ....................... -102 -92 – -15 – -4 -4 – 34 34Latvia .................................. – – – – – – – – – –Lithuania ............................. – – – – – – – – – –Malaysia ............................. -17 0 – 0 – – – 0 0 0Mexico ................................ 559 -118 – -22 – -523 -523 0 -16 -17Netherlands ........................ -104 -69 – -6 – -21 -21 2 42 43Netherlands Antilles ............ – – – – – – – – – –Norway ............................... 32 -26 – 20 – – – – 34 34Oman .................................. – – – 0 – – – – – –Panama .............................. – 0 – -1 – -12 -12 0 0 0Portugal .............................. – -26 – – – – – 9 35 44Puerto Rico ......................... – – – – – – – – – –Russia ................................. 30 – – 156 – 3 3 5 50 54Spain .................................. – -38 – 19 – 9 9 – 35 35Sweden ............................... – -11 – – – 0 0 – 11 11Trinidad and Tobago .......... – 2 – – – 0 0 – – –United Kingdom .................. -124 -22 – 16 – 0 0 47 45 92Vietnam .............................. 10 – – 0 – – – – – –Virgin Islands, U.S. ............. – – – – – – – – – –Yemen ................................ – – – – – – – – – –Other ................................... -251 -294 4 25 – -63 -63 -1 55 58
Total ....................................... 6,489 -1,526 16 240 – -854 -854 154 573 727
Persian Gulf2 ......................... 1,784 – – 32 – 0 0 0 – 0
See footnotes at end of table.

Energy Information Administration/Petroleum Supply Monthly,100 April 2018
Table 53. Net Imports of Crude Oil and Petroleum Products into the United States by Country, April 2018(Thousand Barrels per Day) — Continued
Country of Origin
Oxygenates Renewable Fuels Distillate Fuel Oil
MethylTertiary
ButylEther
(MTBE)
OtherOxygen-
atesFuel
Ethanol
Biomass-BasedDiesel
OtherRenewable
Diesel
OtherRenewable
Fuels
15 ppmsulfur and
under
Greaterthan 15ppm to 500 ppm
sulfur501 to
2000 ppm
Greaterthan 2000
ppm Total
OPEC ..................................... – – -6 – – – -63 -6 -8 – -76Algeria ................................ – – – – – – – – -8 – -8Angola ................................ – – – – – – 0 – – – 0Ecuador .............................. – – – – – – -35 – – – -35Equatorial Guinea ............... – – – – – – – – – – –Gabon ................................. – – – – – – – – – – –Iran ..................................... – – – – – – – – – – –Iraq ..................................... – – – – – – – – – – –Kuwait ................................. – – – – – – – – – – –Libya ................................... – – – – – – 0 – – – 0Nigeria ................................ – – – – – – – – – – –Qatar ................................... – – – – – – – – – – –Saudi Arabia ....................... – – – – – – 0 – – – 0United Arab Emirates ......... – – -6 – – – – – – – –Venezuela ........................... – – – – – – -28 -6 – – -33
Non-OPEC ............................. -31 -32 -123 3 15 – -1,092 -69 -129 0 -1,289Argentina ............................ – – 0 – – – -20 -4 -5 – -30Aruba .................................. – – – – – – -1 – – – -1Australia .............................. 0 0 0 – – – 0 – – – 0Bahamas ............................ – 0 – – – – -5 – -6 – -11Bahrain ............................... – – 0 – – – – – – – –Belgium ............................... 0 0 0 – – – – – -5 – -5Brazil ................................... 1 1 -48 – – – -155 -4 -17 – -177Brunei ................................. – – – – – – – – – – –Cameroon ........................... – – – – – – – – – – –Canada ............................... – 0 -22 -2 – – 38 -5 9 0 42Chad ................................... – – – – – – – – – – –China .................................. – 0 0 – – – 0 – 0 – 0Colombia ............................ – 0 -4 – – – -16 – – – -16Denmark ............................. – – – – – – – – – – –Dominican Republic ............ – 0 0 – – – -16 -8 – – -24Estonia ................................ – – – – – – – – – – –Finland ................................ – – 0 – – – – – – – –France ................................ – 0 – 3 – – -68 – – – -68Germany ............................. – 0 0 3 – – 0 – – – 0Guatemala .......................... – – – – – – -14 -5 -6 – -25Honduras ............................ – – 0 – – – -10 -6 -21 – -38India .................................... – 0 -10 – – – 0 – – – 0Indonesia ............................ – 0 0 – – – – – – – –Italy ..................................... – 0 – – – – 0 – – – 0Japan .................................. – -33 0 – – – 2 – – – 2Korea, South ....................... 0 0 -6 – – – 1 – -2 – -1Latvia .................................. – – – – – – – – – – –Lithuania ............................. – – – – – – – – – – –Malaysia ............................. – 0 – – – – 0 – -16 – -16Mexico ................................ -32 0 -1 0 – – -302 -1 -3 – -306Netherlands ........................ – 0 -9 0 – – -106 -5 -5 – -116Netherlands Antilles ............ – – – – – – – – – – –Norway ............................... – – – – – – – – – – –Oman .................................. – – -10 – – – 0 – – – 0Panama .............................. – – – – – – -21 – -3 – -24Portugal .............................. – – – – – – – – – – –Puerto Rico ......................... – – – – – – – – – – –Russia ................................. – – – – – – – – – – –Spain .................................. – – – – – – – – – – –Sweden ............................... – 0 – – – – 0 – – – 0Trinidad and Tobago .......... – – – – – – – – – – –United Kingdom .................. – – 0 – – – -40 – -2 – -42Vietnam .............................. – 0 – – – – 0 – – – 0Virgin Islands, U.S. ............. – – – – – – – – – – –Yemen ................................ – – – – – – – – – – –Other ................................... 0 0 -13 -1 15 – -359 -31 -47 0 -433
Total ....................................... -31 -32 -129 3 15 – -1,155 -75 -137 0 -1,366
Persian Gulf2 ......................... – – -6 – – – 0 – – – 0
See footnotes at end of table.

Energy Information Administration/Petroleum Supply Monthly, 101 April 2018
Table 53. Net Imports of Crude Oil and Petroleum Products into the United States by Country, April 2018(Thousand Barrels per Day) — Continued
Country of Origin
Oxygenates Renewable Fuels Distillate Fuel Oil
MethylTertiary
ButylEther
(MTBE)
OtherOxygen-
atesFuel
Ethanol
Biomass-BasedDiesel
OtherRenewable
Diesel
OtherRenewable
Fuels
15 ppmsulfur and
under
Greaterthan 15ppm to 500 ppm
sulfur501 to
2000 ppm
Greaterthan 2000
ppm Total
OPEC ..................................... – – -6 – – – -63 -6 -8 – -76Algeria ................................ – – – – – – – – -8 – -8Angola ................................ – – – – – – 0 – – – 0Ecuador .............................. – – – – – – -35 – – – -35Equatorial Guinea ............... – – – – – – – – – – –Gabon ................................. – – – – – – – – – – –Iran ..................................... – – – – – – – – – – –Iraq ..................................... – – – – – – – – – – –Kuwait ................................. – – – – – – – – – – –Libya ................................... – – – – – – 0 – – – 0Nigeria ................................ – – – – – – – – – – –Qatar ................................... – – – – – – – – – – –Saudi Arabia ....................... – – – – – – 0 – – – 0United Arab Emirates ......... – – -6 – – – – – – – –Venezuela ........................... – – – – – – -28 -6 – – -33
Non-OPEC ............................. -31 -32 -123 3 15 – -1,092 -69 -129 0 -1,289Argentina ............................ – – 0 – – – -20 -4 -5 – -30Aruba .................................. – – – – – – -1 – – – -1Australia .............................. 0 0 0 – – – 0 – – – 0Bahamas ............................ – 0 – – – – -5 – -6 – -11Bahrain ............................... – – 0 – – – – – – – –Belgium ............................... 0 0 0 – – – – – -5 – -5Brazil ................................... 1 1 -48 – – – -155 -4 -17 – -177Brunei ................................. – – – – – – – – – – –Cameroon ........................... – – – – – – – – – – –Canada ............................... – 0 -22 -2 – – 38 -5 9 0 42Chad ................................... – – – – – – – – – – –China .................................. – 0 0 – – – 0 – 0 – 0Colombia ............................ – 0 -4 – – – -16 – – – -16Denmark ............................. – – – – – – – – – – –Dominican Republic ............ – 0 0 – – – -16 -8 – – -24Estonia ................................ – – – – – – – – – – –Finland ................................ – – 0 – – – – – – – –France ................................ – 0 – 3 – – -68 – – – -68Germany ............................. – 0 0 3 – – 0 – – – 0Guatemala .......................... – – – – – – -14 -5 -6 – -25Honduras ............................ – – 0 – – – -10 -6 -21 – -38India .................................... – 0 -10 – – – 0 – – – 0Indonesia ............................ – 0 0 – – – – – – – –Italy ..................................... – 0 – – – – 0 – – – 0Japan .................................. – -33 0 – – – 2 – – – 2Korea, South ....................... 0 0 -6 – – – 1 – -2 – -1Latvia .................................. – – – – – – – – – – –Lithuania ............................. – – – – – – – – – – –Malaysia ............................. – 0 – – – – 0 – -16 – -16Mexico ................................ -32 0 -1 0 – – -302 -1 -3 – -306Netherlands ........................ – 0 -9 0 – – -106 -5 -5 – -116Netherlands Antilles ............ – – – – – – – – – – –Norway ............................... – – – – – – – – – – –Oman .................................. – – -10 – – – 0 – – – 0Panama .............................. – – – – – – -21 – -3 – -24Portugal .............................. – – – – – – – – – – –Puerto Rico ......................... – – – – – – – – – – –Russia ................................. – – – – – – – – – – –Spain .................................. – – – – – – – – – – –Sweden ............................... – 0 – – – – 0 – – – 0Trinidad and Tobago .......... – – – – – – – – – – –United Kingdom .................. – – 0 – – – -40 – -2 – -42Vietnam .............................. – 0 – – – – 0 – – – 0Virgin Islands, U.S. ............. – – – – – – – – – – –Yemen ................................ – – – – – – – – – – –Other ................................... 0 0 -13 -1 15 – -359 -31 -47 0 -433
Total ....................................... -31 -32 -129 3 15 – -1,155 -75 -137 0 -1,366
Persian Gulf2 ......................... – – -6 – – – 0 – – – 0
See footnotes at end of table.
Table 53. Net Imports of Crude Oil and Petroleum Products into the United States by Country, April 2018(Thousand Barrels per Day) — Continued
Country of Origin
Kerosene
FinishedAviationGasoline
AviationGasolineBlending
Components
Kerosene-Type Jet
FuelSpecial
NaphthasResidualFuel Oil
Petrochemical Feedstocks
NaphthaOtherOils
OPEC ..................................... 0 – – 3 – 43 – –Algeria ................................ – – – – – – – –Angola ................................ – – – – – – – –Ecuador .............................. – – – – – -14 – –Equatorial Guinea ............... – – – – – – – –Gabon ................................. – – – – – – – –Iran ..................................... – – – – – – – –Iraq ..................................... – – – 0 – – – –Kuwait ................................. – – – – – – – –Libya ................................... – – – – – – – –Nigeria ................................ – – – – – – – –Qatar ................................... 0 – – – – 0 – –Saudi Arabia ....................... – – – – – – – –United Arab Emirates ......... 0 – – – – – – –Venezuela ........................... – – – 3 – 57 – –
Non-OPEC ............................. -6 0 – -149 19 -175 17 3Argentina ............................ – – – -4 – – – –Aruba .................................. 0 – – -3 – – – –Australia .............................. – – – – – – – –Bahamas ............................ – – – -3 – -11 – –Bahrain ............................... – – – – – – – –Belgium ............................... – – – – – – – –Brazil ................................... – – – – – 1 – –Brunei ................................. – – – – – – – –Cameroon ........................... – – – – – – – –Canada ............................... -6 0 – -32 4 31 3 2Chad ................................... – – – – – – – –China .................................. – – – 11 – – – –Colombia ............................ – – – – – 10 – –Denmark ............................. – – – – – – – –Dominican Republic ............ 0 – – -6 – – – –Estonia ................................ – – – – – – – –Finland ................................ – – – – – – – –France ................................ – – – – 2 – – 1Germany ............................. 0 – – – – – – –Guatemala .......................... 0 – – -6 – – – –Honduras ............................ 0 – – -3 – -9 – –India .................................... – – – 11 – 0 – –Indonesia ............................ – – – – – – – –Italy ..................................... – – – – – – – –Japan .................................. – – – 0 3 – 3 –Korea, South ....................... – – – 27 4 0 – –Latvia .................................. – – – – – – – –Lithuania ............................. – – – – – – – –Malaysia ............................. – – – – – – – –Mexico ................................ 0 – – -67 – -4 7 –Netherlands ........................ – – – -10 – -16 – –Netherlands Antilles ............ – – – – – – – –Norway ............................... – – – – – – – –Oman .................................. – – – – – – – –Panama .............................. – – – -11 – -72 – –Portugal .............................. – – – – 1 – – –Puerto Rico ......................... – – – – – – – –Russia ................................. – – – – – 0 – –Spain .................................. – – – – – – – –Sweden ............................... – – – – – 0 – –Trinidad and Tobago .......... 0 – – 0 – 11 – –United Kingdom .................. – – – -15 – -25 1 –Vietnam .............................. – – – – – – – –Virgin Islands, U.S. ............. – – – – – – – –Yemen ................................ – – – – – – – –Other ................................... 0 0 – -38 5 -91 3 0
Total ....................................... -6 0 – -146 19 -131 17 3
Persian Gulf2 ......................... 0 – – 0 – 0 – –
See footnotes at end of table.

Energy Information Administration/Petroleum Supply Monthly,102 April 2018
Table 53. Net Imports of Crude Oil and Petroleum Products into the United States by Country, April 2018(Thousand Barrels per Day) — Continued
Country of Origin
WaxesPetroleum
CokeAsphalt and
Road Oil LubricantsMiscellanous
ProductsTotal
Products
TotalCrude Oil
andProducts
OPEC ..................................... 0 -9 0 5 – 27 3,225Algeria ................................ – – 0 – – 110 200Angola ................................ – – 0 0 – 11 169Ecuador .............................. 0 -9 0 -2 – -120 104Equatorial Guinea ............... – – – 0 – 0 33Gabon ................................. – – 0 – – 0 0Iran ..................................... – – – 0 – 0 0Iraq ..................................... 0 – – 0 – 4 833Kuwait ................................. – 0 0 0 – 0 107Libya ................................... – – 0 0 – 0 87Nigeria ................................ – 0 – -6 – 8 266Qatar ................................... – – – 8 – 8 8Saudi Arabia ....................... 0 0 – 0 – 18 904United Arab Emirates ......... 0 0 0 6 – 10 -28Venezuela ........................... – – – 0 – -20 541
Non-OPEC ............................. 2 -591 17 -97 -1 -3,882 -591Argentina ............................ 0 -7 -5 -2 0 -68 -58Aruba .................................. – – 0 0 – -17 -17Australia .............................. 0 -8 – -1 0 -9 -9Bahamas ............................ – – 0 0 – -45 -45Bahrain ............................... – – – 4 – 4 4Belgium ............................... 0 -8 0 -13 0 17 17Brazil ................................... 0 -9 0 -13 0 -321 -171Brunei ................................. – – – 0 – 0 0Cameroon ........................... – – 0 – – 8 36Canada ............................... -1 -24 31 -2 0 -148 3,241Chad ................................... – – – – – – –China .................................. 3 -75 0 -1 0 -161 -409Colombia ............................ 0 0 0 -6 0 -51 152Denmark ............................. – -11 – 0 – -11 -21Dominican Republic ............ 0 -6 -3 -1 – -93 -93Estonia ................................ – – – – – – –Finland ................................ – -9 – 0 – -8 -8France ................................ 0 0 – -1 – -59 -84Germany ............................. 0 0 0 -3 0 1 1Guatemala .......................... 0 -6 – -1 – -86 -77Honduras ............................ 0 -8 0 0 – -96 -96India .................................... 0 -62 0 -4 0 -77 -95Indonesia ............................ 0 0 0 -2 – -28 8Italy ..................................... – -33 – 0 – 0 -248Japan .................................. 0 -48 0 -1 0 -300 -317Korea, South ....................... 0 -10 0 13 0 -50 -152Latvia .................................. 0 – – 0 – 0 0Lithuania ............................. – – – 0 – 0 0Malaysia ............................. 1 – 0 0 0 -16 -32Mexico ................................ 0 -67 -5 -25 0 -1,179 -620Netherlands ........................ 0 -3 0 -3 0 -208 -313Netherlands Antilles ............ – – – – – – –Norway ............................... – -3 – 0 – 24 56Oman .................................. – 6 0 2 – -1 -1Panama .............................. – – – -1 0 -120 -120Portugal .............................. – – – 0 – 19 19Puerto Rico ......................... – – – – – – –Russia ................................. 0 – 0 1 – 213 243Spain .................................. 0 -24 3 0 0 4 4Sweden ............................... 0 -1 0 0 0 -1 -1Trinidad and Tobago .......... 0 0 – -1 0 12 12United Kingdom .................. 0 -13 0 1 0 -8 -132Vietnam .............................. 0 – 0 0 0 0 10Virgin Islands, U.S. ............. – – – – – – –Yemen ................................ – – – 0 – 0 0Other ................................... -1 -162 -4 -37 -1 -1,023 -1,275
Total ....................................... 2 -600 17 -91 -1 -3,855 2,634
Persian Gulf2 ......................... 0 0 0 18 – 44 1,828
– = No Data Reported.1 On December 18, 2015, the U.S. enacted legislation authorizing the export of U.S. crude oil without a license. Exports to embargoed or sanctioned countries continue to require authorization.2 Includes Bahrain, Iran, Iraq, Kuwait, Qatar, Saudi Arabia, and United Arab Emirates.
Note: Totals may not equal sum of components due to independent rounding.Sources: U.S. Census Bureau and EIA estimates.

Energy Information Administration/Petroleum Supply Monthly, 103 April 2018
Table 53. Net Imports of Crude Oil and Petroleum Products into the United States by Country, April 2018(Thousand Barrels per Day) — Continued
Country of Origin
WaxesPetroleum
CokeAsphalt and
Road Oil LubricantsMiscellanous
ProductsTotal
Products
TotalCrude Oil
andProducts
OPEC ..................................... 0 -9 0 5 – 27 3,225Algeria ................................ – – 0 – – 110 200Angola ................................ – – 0 0 – 11 169Ecuador .............................. 0 -9 0 -2 – -120 104Equatorial Guinea ............... – – – 0 – 0 33Gabon ................................. – – 0 – – 0 0Iran ..................................... – – – 0 – 0 0Iraq ..................................... 0 – – 0 – 4 833Kuwait ................................. – 0 0 0 – 0 107Libya ................................... – – 0 0 – 0 87Nigeria ................................ – 0 – -6 – 8 266Qatar ................................... – – – 8 – 8 8Saudi Arabia ....................... 0 0 – 0 – 18 904United Arab Emirates ......... 0 0 0 6 – 10 -28Venezuela ........................... – – – 0 – -20 541
Non-OPEC ............................. 2 -591 17 -97 -1 -3,882 -591Argentina ............................ 0 -7 -5 -2 0 -68 -58Aruba .................................. – – 0 0 – -17 -17Australia .............................. 0 -8 – -1 0 -9 -9Bahamas ............................ – – 0 0 – -45 -45Bahrain ............................... – – – 4 – 4 4Belgium ............................... 0 -8 0 -13 0 17 17Brazil ................................... 0 -9 0 -13 0 -321 -171Brunei ................................. – – – 0 – 0 0Cameroon ........................... – – 0 – – 8 36Canada ............................... -1 -24 31 -2 0 -148 3,241Chad ................................... – – – – – – –China .................................. 3 -75 0 -1 0 -161 -409Colombia ............................ 0 0 0 -6 0 -51 152Denmark ............................. – -11 – 0 – -11 -21Dominican Republic ............ 0 -6 -3 -1 – -93 -93Estonia ................................ – – – – – – –Finland ................................ – -9 – 0 – -8 -8France ................................ 0 0 – -1 – -59 -84Germany ............................. 0 0 0 -3 0 1 1Guatemala .......................... 0 -6 – -1 – -86 -77Honduras ............................ 0 -8 0 0 – -96 -96India .................................... 0 -62 0 -4 0 -77 -95Indonesia ............................ 0 0 0 -2 – -28 8Italy ..................................... – -33 – 0 – 0 -248Japan .................................. 0 -48 0 -1 0 -300 -317Korea, South ....................... 0 -10 0 13 0 -50 -152Latvia .................................. 0 – – 0 – 0 0Lithuania ............................. – – – 0 – 0 0Malaysia ............................. 1 – 0 0 0 -16 -32Mexico ................................ 0 -67 -5 -25 0 -1,179 -620Netherlands ........................ 0 -3 0 -3 0 -208 -313Netherlands Antilles ............ – – – – – – –Norway ............................... – -3 – 0 – 24 56Oman .................................. – 6 0 2 – -1 -1Panama .............................. – – – -1 0 -120 -120Portugal .............................. – – – 0 – 19 19Puerto Rico ......................... – – – – – – –Russia ................................. 0 – 0 1 – 213 243Spain .................................. 0 -24 3 0 0 4 4Sweden ............................... 0 -1 0 0 0 -1 -1Trinidad and Tobago .......... 0 0 – -1 0 12 12United Kingdom .................. 0 -13 0 1 0 -8 -132Vietnam .............................. 0 – 0 0 0 0 10Virgin Islands, U.S. ............. – – – – – – –Yemen ................................ – – – 0 – 0 0Other ................................... -1 -162 -4 -37 -1 -1,023 -1,275
Total ....................................... 2 -600 17 -91 -1 -3,855 2,634
Persian Gulf2 ......................... 0 0 0 18 – 44 1,828
– = No Data Reported.1 On December 18, 2015, the U.S. enacted legislation authorizing the export of U.S. crude oil without a license. Exports to embargoed or sanctioned countries continue to require authorization.2 Includes Bahrain, Iran, Iraq, Kuwait, Qatar, Saudi Arabia, and United Arab Emirates.
Note: Totals may not equal sum of components due to independent rounding.Sources: U.S. Census Bureau and EIA estimates.
Table 54. Year-to-Date Net Imports of Crude Oil and Petroleum Products into the United States by Country, January-April 2018(Thousand Barrels per Day)
Country of Origin
Crude Oil1
NaturalGas
LiquidsRefineryOlefins
UnfinishedOils
Finished Motor Gasoline Motor Gasoline Blending Components
Reform-ulated
Conven-tional Total
Reform- ulated
Conven- tional Total
OPEC ..................................... 2,715 -30 – 108 – -66 -66 0 38 38Algeria ................................ 77 1 – 87 – – – – – –Angola ................................ 67 – – – – – – – 4 4Ecuador .............................. 158 -20 – -3 – -24 -24 – -2 -2Equatorial Guinea ............... 25 – – – – – – – – –Gabon ................................. 3 – – – – – – – – –Iran ..................................... – – – – – – – – – –Iraq ..................................... 715 – – 4 – – – – – –Kuwait ................................. 127 – – – – 0 0 0 – 0Libya ................................... 68 – – 1 – – – – – –Nigeria ................................ 267 -1 – 4 – -4 -4 – 15 15Qatar ................................... – – – -8 – 0 0 – – –Saudi Arabia ....................... 744 – – 7 – – – – – –United Arab Emirates ......... -9 0 – 48 – 0 0 – – –Venezuela ........................... 473 -10 – -33 – -37 -37 0 21 21
Non-OPEC ............................. 3,540 -1,286 24 240 – -855 -855 188 332 520Argentina ............................ 26 0 – -9 – -16 -16 – 4 4Aruba .................................. – 0 – 0 – -5 -5 0 – 0Australia .............................. – -5 – 0 – -3 -3 0 0 0Bahamas ............................ – -7 – 0 – -9 -9 – 0 0Bahrain ............................... – – – 0 – 0 0 – – –Belgium ............................... – 0 – 43 – 0 0 1 11 12Brazil ................................... 125 -37 – 2 – -53 -53 0 15 15Brunei ................................. – – – – – – – – – –Cameroon ........................... 10 0 – 5 – – – – – –Canada ............................... 3,300 -113 19 -57 – -32 -32 121 25 145Chad ................................... 37 0 – – – – – – – –China .................................. -330 -107 – -8 – 0 0 – – –Colombia ............................ 344 -1 – -35 – -15 -15 0 17 17Denmark ............................. -11 – – 1 – – – – 0 0Dominican Republic ............ – -32 – 0 – -9 -9 0 0 0Estonia ................................ – – – – – – – – – –Finland ................................ – – – 3 – 0 0 0 7 7France ................................ -25 -14 – 2 – 0 0 17 7 24Germany ............................. – 0 – 3 – 0 0 – 0 0Guatemala .......................... 9 -15 – 0 – -27 -27 – 0 0Honduras ............................ – -13 – 0 – -20 -20 0 – 0India .................................... -29 -76 – -11 – 0 0 0 40 40Indonesia ............................ 42 -33 – 0 – 0 0 – – –Italy ..................................... -156 -2 – 5 – – – – 8 8Japan .................................. -9 -224 – -13 – 0 0 0 7 7Korea, South ....................... -80 -69 – -3 – -7 -7 0 10 10Latvia .................................. – – – 0 – – – – – –Lithuania ............................. – – – – – – – – – –Malaysia ............................. -6 0 – 1 – – – 0 0 0Mexico ................................ 629 -147 1 -8 – -550 -550 0 2 2Netherlands ........................ -96 -67 – 15 – -12 -12 6 22 27Netherlands Antilles ............ – – – – – – – – – –Norway ............................... 15 -10 – 22 – – – – 9 9Oman .................................. – – – 0 – – – – – –Panama .............................. – 0 – -1 – -18 -18 0 0 0Portugal .............................. -5 -8 – – – – – 5 19 24Puerto Rico ......................... – 0 – 0 – 0 0 – 0 0Russia ................................. 22 – – 236 – 1 1 2 40 42Spain .................................. -13 -22 – 11 – 2 2 – 40 40Sweden ............................... – -6 – 0 – 8 8 – 6 6Trinidad and Tobago .......... 4 1 – 0 – 0 0 – – –United Kingdom .................. -78 -41 – 4 – 2 2 38 16 54Vietnam .............................. 7 0 – 0 – – – – – –Virgin Islands, U.S. ............. – -3 – 0 – 0 0 – 0 0Yemen ................................ – – – – – – – – – –Other ................................... -192 -235 4 32 – -92 -92 -2 27 27
Total ....................................... 6,255 -1,316 24 349 – -921 -921 188 370 558
Persian Gulf2 ......................... 1,576 0 – 52 – 0 0 0 – 0
See footnotes at end of table.

Energy Information Administration/Petroleum Supply Monthly,104 April 2018
Table 54. Year-to-Date Net Imports of Crude Oil and Petroleum Products into the United States by Country, January-April 2018(Thousand Barrels per Day) — Continued
Country of Origin
Oxygenates Renewable Fuels Distillate Fuel Oil
MethylTertiary
ButylEther
(MTBE)
OtherOxygen-
atesFuel
Ethanol
Biomass-BasedDiesel
OtherRenewable
Diesel
OtherRenewable
Fuels
15 ppmsulfur and
under
Greaterthan 15ppm to 500 ppm
sulfur501 to
2000 ppm
Greaterthan 2000
ppm Total
OPEC ..................................... -4 0 -9 – – – -29 -8 -5 1 -41Algeria ................................ – – – – – – – -2 -2 – -4Angola ................................ – – – – – – 0 – – – 0Ecuador .............................. – – 0 – – – -29 -5 -4 – -38Equatorial Guinea ............... – – – – – – – – – – –Gabon ................................. – – – – – – – – – – –Iran ..................................... – – – – – – – – – – –Iraq ..................................... – 0 – – – – – – – – –Kuwait ................................. – – – – – – – – – – –Libya ................................... – – – – – – 0 – – – 0Nigeria ................................ – – -2 – – – – – 1 – 1Qatar ................................... – – 0 – – – 12 – – – 12Saudi Arabia ....................... – 0 -1 – – – 18 – – – 18United Arab Emirates ......... – 0 -6 – – – 0 – – – 0Venezuela ........................... -4 0 – – – – -30 -1 – 1 -30
Non-OPEC ............................. -27 -27 -128 4 13 – -800 -92 -64 5 -950Argentina ............................ – 0 0 – – – -17 -3 -2 – -23Aruba .................................. – – – – – – -2 – – – -2Australia .............................. 0 0 0 – – – 0 – 0 – 0Bahamas ............................ – 0 0 – – – -6 -2 -3 – -11Bahrain ............................... – – 0 – – – – – – – –Belgium ............................... 0 0 0 – – – -1 -1 -3 – -5Brazil ................................... 2 2 -60 – – – -117 -14 -4 – -136Brunei ................................. – – – – – – – – – – –Cameroon ........................... – – – – – – – – – – –Canada ............................... – 0 -19 2 – – 75 -9 19 0 86Chad ................................... – – – – – – – – – – –China .................................. 0 0 -10 0 – – 0 – 0 – 0Colombia ............................ – 0 -3 – – – -5 0 – 3 -2Denmark ............................. – – 0 – – – – – – – –Dominican Republic ............ – 0 0 – – – -4 -4 -2 – -10Estonia ................................ – – – – – – – – – – –Finland ................................ – – 0 – – – – – – – –France ................................ – 0 – 1 – – -28 – – – -28Germany ............................. 1 0 0 3 – – 0 – – – 0Guatemala .......................... – 0 – – – – -23 -11 -3 – -37Honduras ............................ – – 0 – – – -7 -6 -7 – -19India .................................... 0 0 -8 – – – 19 – – – 19Indonesia ............................ – 0 0 – – – – – – – –Italy ..................................... – 0 0 – – – 0 – – – 0Japan .................................. – -30 0 – – – 1 – – – 1Korea, South ....................... 0 0 -6 0 – – 0 – -1 – -1Latvia .................................. – 0 – – – – 0 – – – 0Lithuania ............................. – – – – – – – – – – –Malaysia ............................. – 0 – – – – 0 – -8 – -8Mexico ................................ -28 0 -2 0 – – -303 -4 1 – -305Netherlands ........................ 3 1 -3 0 – – -35 -5 -9 1 -48Netherlands Antilles ............ – – – – – – – – – – –Norway ............................... – – 0 – – – – – – – –Oman .................................. – – -4 – – – 1 – – – 1Panama .............................. – 0 0 – – – -38 -4 -3 – -45Portugal .............................. – – – – – – – – – – –Puerto Rico ......................... 0 0 -1 – – – 0 0 – – 0Russia ................................. 0 – – – – – 3 5 2 1 11Spain .................................. – 0 0 – – – -1 – – – -1Sweden ............................... – 0 0 – – – 0 – – – 0Trinidad and Tobago .......... – – 0 0 – – 0 – – – 0United Kingdom .................. – 0 0 – – – -16 0 -1 – -17Vietnam .............................. – 0 0 – – – 0 – – – 0Virgin Islands, U.S. ............. – – – – – – – -1 -1 – -2Yemen ................................ – – – – – – – – – – –Other ................................... -5 0 -12 -2 13 – -296 -33 -39 0 -368
Total ....................................... -30 -27 -137 4 13 – -829 -100 -69 6 -991
Persian Gulf2 ......................... – 0 -7 – – – 30 – – – 30
See footnotes at end of table.

Energy Information Administration/Petroleum Supply Monthly, 105 April 2018
Table 54. Year-to-Date Net Imports of Crude Oil and Petroleum Products into the United States by Country, January-April 2018(Thousand Barrels per Day) — Continued
Country of Origin
Oxygenates Renewable Fuels Distillate Fuel Oil
MethylTertiary
ButylEther
(MTBE)
OtherOxygen-
atesFuel
Ethanol
Biomass-BasedDiesel
OtherRenewable
Diesel
OtherRenewable
Fuels
15 ppmsulfur and
under
Greaterthan 15ppm to 500 ppm
sulfur501 to
2000 ppm
Greaterthan 2000
ppm Total
OPEC ..................................... -4 0 -9 – – – -29 -8 -5 1 -41Algeria ................................ – – – – – – – -2 -2 – -4Angola ................................ – – – – – – 0 – – – 0Ecuador .............................. – – 0 – – – -29 -5 -4 – -38Equatorial Guinea ............... – – – – – – – – – – –Gabon ................................. – – – – – – – – – – –Iran ..................................... – – – – – – – – – – –Iraq ..................................... – 0 – – – – – – – – –Kuwait ................................. – – – – – – – – – – –Libya ................................... – – – – – – 0 – – – 0Nigeria ................................ – – -2 – – – – – 1 – 1Qatar ................................... – – 0 – – – 12 – – – 12Saudi Arabia ....................... – 0 -1 – – – 18 – – – 18United Arab Emirates ......... – 0 -6 – – – 0 – – – 0Venezuela ........................... -4 0 – – – – -30 -1 – 1 -30
Non-OPEC ............................. -27 -27 -128 4 13 – -800 -92 -64 5 -950Argentina ............................ – 0 0 – – – -17 -3 -2 – -23Aruba .................................. – – – – – – -2 – – – -2Australia .............................. 0 0 0 – – – 0 – 0 – 0Bahamas ............................ – 0 0 – – – -6 -2 -3 – -11Bahrain ............................... – – 0 – – – – – – – –Belgium ............................... 0 0 0 – – – -1 -1 -3 – -5Brazil ................................... 2 2 -60 – – – -117 -14 -4 – -136Brunei ................................. – – – – – – – – – – –Cameroon ........................... – – – – – – – – – – –Canada ............................... – 0 -19 2 – – 75 -9 19 0 86Chad ................................... – – – – – – – – – – –China .................................. 0 0 -10 0 – – 0 – 0 – 0Colombia ............................ – 0 -3 – – – -5 0 – 3 -2Denmark ............................. – – 0 – – – – – – – –Dominican Republic ............ – 0 0 – – – -4 -4 -2 – -10Estonia ................................ – – – – – – – – – – –Finland ................................ – – 0 – – – – – – – –France ................................ – 0 – 1 – – -28 – – – -28Germany ............................. 1 0 0 3 – – 0 – – – 0Guatemala .......................... – 0 – – – – -23 -11 -3 – -37Honduras ............................ – – 0 – – – -7 -6 -7 – -19India .................................... 0 0 -8 – – – 19 – – – 19Indonesia ............................ – 0 0 – – – – – – – –Italy ..................................... – 0 0 – – – 0 – – – 0Japan .................................. – -30 0 – – – 1 – – – 1Korea, South ....................... 0 0 -6 0 – – 0 – -1 – -1Latvia .................................. – 0 – – – – 0 – – – 0Lithuania ............................. – – – – – – – – – – –Malaysia ............................. – 0 – – – – 0 – -8 – -8Mexico ................................ -28 0 -2 0 – – -303 -4 1 – -305Netherlands ........................ 3 1 -3 0 – – -35 -5 -9 1 -48Netherlands Antilles ............ – – – – – – – – – – –Norway ............................... – – 0 – – – – – – – –Oman .................................. – – -4 – – – 1 – – – 1Panama .............................. – 0 0 – – – -38 -4 -3 – -45Portugal .............................. – – – – – – – – – – –Puerto Rico ......................... 0 0 -1 – – – 0 0 – – 0Russia ................................. 0 – – – – – 3 5 2 1 11Spain .................................. – 0 0 – – – -1 – – – -1Sweden ............................... – 0 0 – – – 0 – – – 0Trinidad and Tobago .......... – – 0 0 – – 0 – – – 0United Kingdom .................. – 0 0 – – – -16 0 -1 – -17Vietnam .............................. – 0 0 – – – 0 – – – 0Virgin Islands, U.S. ............. – – – – – – – -1 -1 – -2Yemen ................................ – – – – – – – – – – –Other ................................... -5 0 -12 -2 13 – -296 -33 -39 0 -368
Total ....................................... -30 -27 -137 4 13 – -829 -100 -69 6 -991
Persian Gulf2 ......................... – 0 -7 – – – 30 – – – 30
See footnotes at end of table.
Table 54. Year-to-Date Net Imports of Crude Oil and Petroleum Products into the United States by Country, January-April 2018(Thousand Barrels per Day) — Continued
Country of Origin
Kerosene
FinishedAviationGasoline
AviationGasolineBlending
Components
Kerosene-Type Jet
FuelSpecial
NaphthasResidualFuel Oil
Petrochemical Feedstocks
NaphthaOtherOils
OPEC ..................................... 0 – – 7 0 25 5 –Algeria ................................ – – – – – 0 3 –Angola ................................ – – – – – – – –Ecuador .............................. – – – – – -5 – –Equatorial Guinea ............... – – – – – – – –Gabon ................................. – – – – – – – –Iran ..................................... – – – – – – – –Iraq ..................................... 0 – – 0 – – – –Kuwait ................................. – – – 1 – – – –Libya ................................... – – – – – 1 – –Nigeria ................................ – – – -3 – – 2 –Qatar ................................... 0 – – – – 0 – –Saudi Arabia ....................... – – – 0 0 – – –United Arab Emirates ......... 0 – – 0 – -2 – –Venezuela ........................... – – – 7 – 31 – –
Non-OPEC ............................. -2 0 – -115 16 -132 15 4Argentina ............................ -1 – – -2 – 4 – 0Aruba .................................. 0 – – -3 – -3 – –Australia .............................. 0 – – – – – – –Bahamas ............................ – – – -2 – -11 – –Bahrain ............................... – – – – – – – –Belgium ............................... – – – – 0 0 – –Brazil ................................... – – – -3 1 2 – –Brunei ................................. – – – – – – – –Cameroon ........................... – – – – – – – –Canada ............................... -2 0 – -29 3 20 3 3Chad ................................... – – – – – – – –China .................................. 1 – – 20 – -2 – –Colombia ............................ 0 – – – – 12 – –Denmark ............................. – – – – – – – –Dominican Republic ............ 0 – – -4 – -3 – –Estonia ................................ – – – – – – – –Finland ................................ – – – – – – – –France ................................ – – – – 1 – – 1Germany ............................. 0 – – – 0 – – –Guatemala .......................... -1 – – -3 – -7 – –Honduras ............................ 0 – – -2 – -6 – –India .................................... – – – 12 – 0 – –Indonesia ............................ – – – – – – – –Italy ..................................... – – – 1 – – – –Japan .................................. – – – 4 2 – 2 –Korea, South ....................... 3 – – 34 7 0 – –Latvia .................................. – – – – – – – –Lithuania ............................. – – – 0 – – – –Malaysia ............................. – – – – – – – –Mexico ................................ 0 – – -56 – 5 8 –Netherlands ........................ 0 0 – -10 0 -19 – –Netherlands Antilles ............ – – – – – – – –Norway ............................... -1 – – – – – – –Oman .................................. – – – – – – – –Panama .............................. 0 – – -17 – -36 – –Portugal .............................. – – – – 0 – – –Puerto Rico ......................... 0 – – 0 – 0 – –Russia ................................. – – – – – 8 – –Spain .................................. – – – – – 1 – –Sweden ............................... -1 – – – – 2 – –Trinidad and Tobago .......... 0 – – 0 – 18 – –United Kingdom .................. 0 – – -14 – -23 1 –Vietnam .............................. 0 – – 0 – – – –Virgin Islands, U.S. ............. 0 – – -2 – -12 – –Yemen ................................ – – – – – – – –Other ................................... 0 0 – -39 2 -82 1 0
Total ....................................... -2 0 – -109 16 -106 20 4
Persian Gulf2 ......................... 0 – – 2 0 -2 – –
See footnotes at end of table.

Energy Information Administration/Petroleum Supply Monthly,106 April 2018
Table 54. Year-to-Date Net Imports of Crude Oil and Petroleum Products into the United States by Country, January-April 2018(Thousand Barrels per Day) — Continued
Country of Origin
WaxesPetroleum
CokeAsphalt and
Road Oil LubricantsMiscellanous
ProductsTotal
Products
TotalCrude Oil
andProducts
OPEC ..................................... 0 -4 4 -2 0 31 2,745Algeria ................................ 0 – 0 0 – 87 164Angola ................................ – – 0 0 – 4 71Ecuador .............................. 0 -4 0 -7 – -103 55Equatorial Guinea ............... – – – 0 – 0 25Gabon ................................. – – 0 – – 0 3Iran ..................................... – – – 0 – 0 0Iraq ..................................... 0 – – 0 – 4 719Kuwait ................................. – 0 0 0 – 1 128Libya ................................... – – 0 0 – 2 71Nigeria ................................ – 0 – -4 0 7 274Qatar ................................... 0 0 – 8 – 12 12Saudi Arabia ....................... 0 0 0 0 0 25 769United Arab Emirates ......... 0 0 0 2 0 42 33Venezuela ........................... 0 -1 4 0 – -51 422
Non-OPEC ............................. 1 -594 12 -76 -1 -3,341 199Argentina ............................ 0 1 -1 -2 0 -44 -18Aruba .................................. – – 0 0 – -13 -13Australia .............................. 0 -8 0 -1 0 -17 -17Bahamas ............................ – – 0 0 – -40 -40Bahrain ............................... 0 – – 2 – 2 2Belgium ............................... 0 -9 1 -10 0 32 32Brazil ................................... 0 -50 0 -11 0 -325 -200Brunei ................................. – 0 – 0 – 0 0Cameroon ........................... – – 0 0 – 5 14Canada ............................... -1 -18 23 0 0 32 3,333Chad ................................... – – – – – 0 37China .................................. 3 -71 0 -1 0 -177 -507Colombia ............................ 0 1 0 -4 0 -29 315Denmark ............................. – -4 0 0 – -3 -14Dominican Republic ............ 0 -4 -1 -1 0 -65 -65Estonia ................................ – – – 0 – 0 0Finland ................................ 0 -2 – 0 – 8 8France ................................ 0 -6 – -2 – -21 -46Germany ............................. 0 0 0 -2 0 6 6Guatemala .......................... 0 -9 – -1 – -99 -90Honduras ............................ 0 -6 0 0 – -66 -66India .................................... 0 -63 0 -8 0 -93 -123Indonesia ............................ 0 0 0 2 0 -32 11Italy ..................................... 0 -26 0 1 – -15 -171Japan .................................. 0 -53 0 -1 0 -304 -313Korea, South ....................... 0 -7 0 16 0 -23 -103Latvia .................................. 0 – – 0 0 0 0Lithuania ............................. – – – 0 – 0 0Malaysia ............................. 0 -1 0 0 0 -8 -14Mexico ................................ -1 -66 -5 -27 -1 -1,180 -551Netherlands ........................ 0 -6 0 -2 0 -120 -216Netherlands Antilles ............ – – – – – – –Norway ............................... 0 -2 0 0 – 16 31Oman .................................. 0 1 0 1 – -1 -1Panama .............................. – – -1 -1 0 -119 -119Portugal .............................. 0 -3 – 0 – 13 8Puerto Rico ......................... 0 – 0 0 0 -1 -1Russia ................................. 0 1 0 0 – 299 321Spain .................................. 0 -21 1 0 0 10 -2Sweden ............................... 0 -1 0 0 0 9 9Trinidad and Tobago .......... 0 0 0 0 0 18 23United Kingdom .................. 0 -4 0 0 0 -37 -114Vietnam .............................. 0 – 0 0 0 0 6Virgin Islands, U.S. ............. – – 0 0 – -19 -19Yemen ................................ – – – 0 – 0 0Other ................................... 0 -158 -5 -24 0 -940 -1,134
Total ....................................... 1 -598 16 -78 -1 -3,311 2,944
Persian Gulf2 ......................... 0 0 0 12 0 86 1,663
– = No Data Reported.1 On December 18, 2015, the U.S. enacted legislation authorizing the export of U.S. crude oil without a license. Exports to embargoed or sanctioned countries continue to require authorization.2 Includes Bahrain, Iran, Iraq, Kuwait, Qatar, Saudi Arabia, and United Arab Emirates.
Note: Totals may not equal sum of components due to independent rounding.Sources: U.S. Census Bureau and EIA estimates.

Energy Information Administration/Petroleum Supply Monthly, 107 April 2018
Table 54. Year-to-Date Net Imports of Crude Oil and Petroleum Products into the United States by Country, January-April 2018(Thousand Barrels per Day) — Continued
Country of Origin
WaxesPetroleum
CokeAsphalt and
Road Oil LubricantsMiscellanous
ProductsTotal
Products
TotalCrude Oil
andProducts
OPEC ..................................... 0 -4 4 -2 0 31 2,745Algeria ................................ 0 – 0 0 – 87 164Angola ................................ – – 0 0 – 4 71Ecuador .............................. 0 -4 0 -7 – -103 55Equatorial Guinea ............... – – – 0 – 0 25Gabon ................................. – – 0 – – 0 3Iran ..................................... – – – 0 – 0 0Iraq ..................................... 0 – – 0 – 4 719Kuwait ................................. – 0 0 0 – 1 128Libya ................................... – – 0 0 – 2 71Nigeria ................................ – 0 – -4 0 7 274Qatar ................................... 0 0 – 8 – 12 12Saudi Arabia ....................... 0 0 0 0 0 25 769United Arab Emirates ......... 0 0 0 2 0 42 33Venezuela ........................... 0 -1 4 0 – -51 422
Non-OPEC ............................. 1 -594 12 -76 -1 -3,341 199Argentina ............................ 0 1 -1 -2 0 -44 -18Aruba .................................. – – 0 0 – -13 -13Australia .............................. 0 -8 0 -1 0 -17 -17Bahamas ............................ – – 0 0 – -40 -40Bahrain ............................... 0 – – 2 – 2 2Belgium ............................... 0 -9 1 -10 0 32 32Brazil ................................... 0 -50 0 -11 0 -325 -200Brunei ................................. – 0 – 0 – 0 0Cameroon ........................... – – 0 0 – 5 14Canada ............................... -1 -18 23 0 0 32 3,333Chad ................................... – – – – – 0 37China .................................. 3 -71 0 -1 0 -177 -507Colombia ............................ 0 1 0 -4 0 -29 315Denmark ............................. – -4 0 0 – -3 -14Dominican Republic ............ 0 -4 -1 -1 0 -65 -65Estonia ................................ – – – 0 – 0 0Finland ................................ 0 -2 – 0 – 8 8France ................................ 0 -6 – -2 – -21 -46Germany ............................. 0 0 0 -2 0 6 6Guatemala .......................... 0 -9 – -1 – -99 -90Honduras ............................ 0 -6 0 0 – -66 -66India .................................... 0 -63 0 -8 0 -93 -123Indonesia ............................ 0 0 0 2 0 -32 11Italy ..................................... 0 -26 0 1 – -15 -171Japan .................................. 0 -53 0 -1 0 -304 -313Korea, South ....................... 0 -7 0 16 0 -23 -103Latvia .................................. 0 – – 0 0 0 0Lithuania ............................. – – – 0 – 0 0Malaysia ............................. 0 -1 0 0 0 -8 -14Mexico ................................ -1 -66 -5 -27 -1 -1,180 -551Netherlands ........................ 0 -6 0 -2 0 -120 -216Netherlands Antilles ............ – – – – – – –Norway ............................... 0 -2 0 0 – 16 31Oman .................................. 0 1 0 1 – -1 -1Panama .............................. – – -1 -1 0 -119 -119Portugal .............................. 0 -3 – 0 – 13 8Puerto Rico ......................... 0 – 0 0 0 -1 -1Russia ................................. 0 1 0 0 – 299 321Spain .................................. 0 -21 1 0 0 10 -2Sweden ............................... 0 -1 0 0 0 9 9Trinidad and Tobago .......... 0 0 0 0 0 18 23United Kingdom .................. 0 -4 0 0 0 -37 -114Vietnam .............................. 0 – 0 0 0 0 6Virgin Islands, U.S. ............. – – 0 0 – -19 -19Yemen ................................ – – – 0 – 0 0Other ................................... 0 -158 -5 -24 0 -940 -1,134
Total ....................................... 1 -598 16 -78 -1 -3,311 2,944
Persian Gulf2 ......................... 0 0 0 12 0 86 1,663
– = No Data Reported.1 On December 18, 2015, the U.S. enacted legislation authorizing the export of U.S. crude oil without a license. Exports to embargoed or sanctioned countries continue to require authorization.2 Includes Bahrain, Iran, Iraq, Kuwait, Qatar, Saudi Arabia, and United Arab Emirates.
Note: Totals may not equal sum of components due to independent rounding.Sources: U.S. Census Bureau and EIA estimates.
Table 55. Stocks of Crude Oil and Petroleum Products by PAD District, April 2018(Thousand Barrels)
CommodityPAD Districts
U.S. Total1 2 3 4 5
Crude Oil ....................................................................... 15,128 124,905 884,304 23,512 51,174 1,099,023Refinery ...................................................................... 12,933 13,779 48,073 2,839 22,990 100,614Tank Farms and Pipelines (Includes Cushing, OK) .... 2,195 111,126 172,265 20,673 24,784 331,043
Cushing, Oklahoma ................................................ – 36,946 – – – 36,946Leases ........................................................................ – – – – – – – – – – – –Strategic Petroleum Reserve1 .................................... – – 663,966 – – 663,966Alaskan In Transit ....................................................... – – – – 3,400 3,400
Total Stocks, All Oils (excluding Crude Oil)2 ............. 144,868 174,163 331,486 21,200 93,364 765,080Refinery ...................................................................... 17,799 50,493 123,248 10,984 53,235 255,759Bulk Terminal .............................................................. 98,876 85,768 155,506 6,058 34,673 380,880Pipeline ....................................................................... 27,963 36,167 51,531 4,006 5,126 124,793Natural Gas Processing Plant .................................... 230 1,735 1,201 152 330 3,648
Natural Gas Liquids ...................................................... 4,354 36,235 93,386 3,013 2,745 139,733Refinery ...................................................................... 495 3,016 6,049 401 1,420 11,381Bulk Terminal .............................................................. 2,708 15,564 70,075 415 986 89,748Pipeline ....................................................................... 921 15,920 16,061 2,045 9 34,956Natural Gas Processing Plant .................................... 230 1,735 1,201 152 330 3,648Ethane ........................................................................ 367 6,253 41,361 507 – 48,488
Refinery .................................................................. – – 407 – – 407Bulk Terminal .......................................................... 188 2,870 34,633 – – 37,691Pipeline ................................................................... 179 3,050 6,132 505 – 9,866Natural Gas Processing Plant ................................ – 333 189 2 – 524
Propane ..................................................................... 2,699 10,237 20,302 981 617 34,836Refinery .................................................................. 90 645 850 49 94 1,728Bulk Terminal .......................................................... 1,788 5,316 14,407 75 486 22,072Pipeline ................................................................... – – – – – – – – – – – –Natural Gas Processing Plant ................................ 106 697 270 63 28 1,164
Normal Butane .......................................................... 960 8,109 17,601 893 1,464 29,027Refinery .................................................................. 285 1,596 2,906 226 764 5,777Bulk Terminal .......................................................... 629 5,183 12,701 333 496 19,342Pipeline ................................................................... 6 1,064 1,517 304 – 2,891Natural Gas Processing Plant ................................ 40 266 477 30 204 1,017
Isobutane ................................................................... 143 1,646 5,822 266 610 8,487Refinery .................................................................. 120 379 1,426 94 561 2,580Bulk Terminal .......................................................... – 504 3,506 – – 4,010Pipeline ................................................................... 11 591 807 160 – 1,569Natural Gas Processing Plant ................................ 12 172 83 12 49 328
Natural Gasoline ....................................................... 185 9,990 8,300 366 54 18,895Refinery .................................................................. – 396 460 32 1 889Bulk Terminal .......................................................... 103 1,691 4,828 7 4 6,633Pipeline ................................................................... 10 7,636 2,830 282 – 10,758Natural Gas Processing Plant ................................ 72 267 182 45 49 615
Refinery Olefins ............................................................ 155 482 4,921 41 42 5,641Refinery ...................................................................... 155 465 2,093 41 42 2,796Bulk Terminal .............................................................. – 17 2,828 – – 2,845Pipeline ....................................................................... – – – – – –Natural Gas Processing Plant .................................... – – – – – –Ethylene ..................................................................... – – 0 – – 0
Refinery .................................................................. – – 0 – – 0Bulk Terminal .......................................................... – – – – – –Pipeline ................................................................... – – – – – –Natural Gas Processing Plant ................................ – – – – – –
Propylene .................................................................. 88 350 3,668 0 38 4,144Refinery .................................................................. 88 333 840 0 38 1,299Bulk Terminal .......................................................... – 17 2,828 – – 2,845Pipeline ................................................................... – – – – – –Natural Gas Processing Plant ................................ – – – – – –
Butylene .................................................................... 40 132 1,253 41 4 1,470Refinery .................................................................. 40 132 1,253 41 4 1,470Bulk Terminal .......................................................... – – – – – –Pipeline ................................................................... – – – – – –Natural Gas Processing Plant ................................ – – – – – –
Isobutylene ................................................................ 27 0 0 0 0 27Refinery .................................................................. 27 0 0 0 0 27Bulk Terminal .......................................................... – – – – – –Pipeline ................................................................... – – – – – –Natural Gas Processing Plant ................................ – – – – – –
Other Hydrocarbons ..................................................... – 31 – – – 31Refinery ...................................................................... – 31 – – – 31
Oxygenates (excluding Fuel Ethanol) ........................ – 6 1,229 – – 1,235Refinery ...................................................................... – – – – – –Bulk Terminal .............................................................. – 6 1,229 – – 1,235Pipeline ....................................................................... – – – – – –
See footnotes at end of table.

Energy Information Administration/Petroleum Supply Monthly,108 April 2018
Table 55. Stocks of Crude Oil and Petroleum Products by PAD District, April 2018(Thousand Barrels) — Continued
CommodityPAD Districts
U.S. Total1 2 3 4 5
MTBE ......................................................................... – – 1,132 – – 1,132Refinery .................................................................. – – – – – –Bulk Terminal3 ........................................................ – – 1,132 – – 1,132Pipeline ................................................................... – – – – – –
Other Oxygenates4 ................................................... – 6 97 – – 103Refinery .................................................................. – – – – – –Bulk Terminal .......................................................... – 6 97 – – 103Pipeline ................................................................... – – – – – –
Renewable Fuels (including Fuel Ethanol) ................ 9,227 9,098 6,038 406 4,379 29,147Refinery ...................................................................... 129 162 439 142 327 1,199Bulk Terminal .............................................................. 9,098 8,936 5,599 260 4,052 27,944Pipeline ....................................................................... – – – 4 – 4Fuel Ethanol2 ............................................................ 7,499 8,053 4,648 395 2,661 23,256
Refinery .................................................................. 123 137 181 135 38 614Bulk Terminal .......................................................... 7,376 7,916 4,467 256 2,623 22,638Pipeline ................................................................... – – – 4 – 4
Renewable Diesel Fuel ............................................. 1,728 1,045 1,387 11 1,677 5,847Refinery .................................................................. 6 25 258 7 289 585Bulk Terminal .......................................................... 1,722 1,020 1,129 4 1,388 5,262Pipeline ................................................................... – – – – – –
Other Renewable Fuels ............................................ – – 3 – 41 44Refinery .................................................................. – – – – – –Bulk Terminal .......................................................... – – 3 – 41 44Pipeline ................................................................... – – – – – –
Unfinished Oils ............................................................. 6,375 13,383 49,453 3,299 21,788 94,298Naphthas and Lighter ............................................... 1,918 3,558 11,400 756 4,054 21,686
Refinery .................................................................. 1,275 3,528 10,096 756 3,618 19,273Bulk Terminal .......................................................... 643 30 1,304 – 436 2,413
Kerosene and Light Gas Oils .................................. 651 3,397 9,888 694 4,448 19,078Refinery .................................................................. 651 3,397 7,337 694 4,198 16,277Bulk Terminal .......................................................... – – 2,551 – 250 2,801
Heavy Gas Oils ......................................................... 2,631 4,102 22,616 1,244 10,704 41,297Refinery .................................................................. 2,470 4,039 18,456 1,244 10,332 36,541Bulk Terminal .......................................................... 161 63 4,160 – 372 4,756
Residuum .................................................................. 1,175 2,326 5,549 605 2,582 12,237Refinery .................................................................. 1,175 2,183 5,034 605 2,555 11,552Bulk Terminal .......................................................... – 143 515 – 27 685
Motor Gasoline Blending Components2 .................... 60,721 50,401 71,849 5,513 28,572 217,056Refinery ...................................................................... 5,555 13,857 26,943 2,878 14,117 63,350Bulk Terminal .............................................................. 42,821 27,461 27,627 1,705 11,609 111,223Pipeline ....................................................................... 12,345 9,083 17,279 930 2,846 42,483Reformulated - RBOB ............................................... 21,799 5,820 10,791 – 13,731 52,141
Refinery .................................................................. 1,488 993 1,783 – 5,200 9,464Bulk Terminal .......................................................... 15,458 3,537 4,917 – 6,966 30,878Pipeline ................................................................... 4,853 1,290 4,091 – 1,565 11,799
Conventional ............................................................. 38,922 44,581 61,058 5,513 14,841 164,915Refinery .................................................................. 4,067 12,864 25,160 2,878 8,917 53,886Bulk Terminal .......................................................... 27,363 23,924 22,710 1,705 4,643 80,345Pipeline ................................................................... 7,492 7,793 13,188 930 1,281 30,684CBOB ..................................................................... 25,444 37,051 32,107 4,152 8,047 106,801
Refinery .............................................................. 610 6,711 10,422 1,519 2,334 21,596Bulk Terminal ...................................................... 17,354 22,739 8,767 1,703 4,435 54,998Pipeline ............................................................... 7,480 7,601 12,918 930 1,278 30,207
GTAB ..................................................................... 1,414 – – – – 1,414Refinery .............................................................. – – – – – –Bulk Terminal ...................................................... 1,414 – – – – 1,414Pipeline ............................................................... – – – – – –
Other ...................................................................... 12,064 7,530 28,951 1,361 6,794 56,700Refinery .............................................................. 3,457 6,153 14,738 1,359 6,583 32,290Bulk Terminal ...................................................... 8,595 1,185 13,943 2 208 23,933Pipeline ............................................................... 12 192 270 – 3 477
Aviation Gasoline Blending Components .................. – – 45 – – 45Refinery ...................................................................... – – 45 – – 45Bulk Terminal .............................................................. – – – – – –
Finished Motor Gasoline .............................................. 3,827 6,706 8,174 1,667 2,434 22,808Refinery ...................................................................... 27 1,444 2,901 671 1,161 6,204Bulk Terminal .............................................................. 1,340 2,733 3,908 723 1,159 9,863Pipeline ....................................................................... 2,460 2,529 1,365 273 114 6,741Reformulated ............................................................ 17 – – – 17 34
Refinery .................................................................. – – – – 17 17Bulk Terminal .......................................................... 17 – – – – 17Pipeline ................................................................... – – – – – –Reformulated (Blended with Fuel Ethanol) ........ 17 – – – 17 34
Refinery .............................................................. – – – – 17 17Bulk Terminal ...................................................... 17 – – – – 17Pipeline ............................................................... – – – – – –
See footnotes at end of table.

Energy Information Administration/Petroleum Supply Monthly, 109 April 2018
Table 55. Stocks of Crude Oil and Petroleum Products by PAD District, April 2018(Thousand Barrels) — Continued
CommodityPAD Districts
U.S. Total1 2 3 4 5
MTBE ......................................................................... – – 1,132 – – 1,132Refinery .................................................................. – – – – – –Bulk Terminal3 ........................................................ – – 1,132 – – 1,132Pipeline ................................................................... – – – – – –
Other Oxygenates4 ................................................... – 6 97 – – 103Refinery .................................................................. – – – – – –Bulk Terminal .......................................................... – 6 97 – – 103Pipeline ................................................................... – – – – – –
Renewable Fuels (including Fuel Ethanol) ................ 9,227 9,098 6,038 406 4,379 29,147Refinery ...................................................................... 129 162 439 142 327 1,199Bulk Terminal .............................................................. 9,098 8,936 5,599 260 4,052 27,944Pipeline ....................................................................... – – – 4 – 4Fuel Ethanol2 ............................................................ 7,499 8,053 4,648 395 2,661 23,256
Refinery .................................................................. 123 137 181 135 38 614Bulk Terminal .......................................................... 7,376 7,916 4,467 256 2,623 22,638Pipeline ................................................................... – – – 4 – 4
Renewable Diesel Fuel ............................................. 1,728 1,045 1,387 11 1,677 5,847Refinery .................................................................. 6 25 258 7 289 585Bulk Terminal .......................................................... 1,722 1,020 1,129 4 1,388 5,262Pipeline ................................................................... – – – – – –
Other Renewable Fuels ............................................ – – 3 – 41 44Refinery .................................................................. – – – – – –Bulk Terminal .......................................................... – – 3 – 41 44Pipeline ................................................................... – – – – – –
Unfinished Oils ............................................................. 6,375 13,383 49,453 3,299 21,788 94,298Naphthas and Lighter ............................................... 1,918 3,558 11,400 756 4,054 21,686
Refinery .................................................................. 1,275 3,528 10,096 756 3,618 19,273Bulk Terminal .......................................................... 643 30 1,304 – 436 2,413
Kerosene and Light Gas Oils .................................. 651 3,397 9,888 694 4,448 19,078Refinery .................................................................. 651 3,397 7,337 694 4,198 16,277Bulk Terminal .......................................................... – – 2,551 – 250 2,801
Heavy Gas Oils ......................................................... 2,631 4,102 22,616 1,244 10,704 41,297Refinery .................................................................. 2,470 4,039 18,456 1,244 10,332 36,541Bulk Terminal .......................................................... 161 63 4,160 – 372 4,756
Residuum .................................................................. 1,175 2,326 5,549 605 2,582 12,237Refinery .................................................................. 1,175 2,183 5,034 605 2,555 11,552Bulk Terminal .......................................................... – 143 515 – 27 685
Motor Gasoline Blending Components2 .................... 60,721 50,401 71,849 5,513 28,572 217,056Refinery ...................................................................... 5,555 13,857 26,943 2,878 14,117 63,350Bulk Terminal .............................................................. 42,821 27,461 27,627 1,705 11,609 111,223Pipeline ....................................................................... 12,345 9,083 17,279 930 2,846 42,483Reformulated - RBOB ............................................... 21,799 5,820 10,791 – 13,731 52,141
Refinery .................................................................. 1,488 993 1,783 – 5,200 9,464Bulk Terminal .......................................................... 15,458 3,537 4,917 – 6,966 30,878Pipeline ................................................................... 4,853 1,290 4,091 – 1,565 11,799
Conventional ............................................................. 38,922 44,581 61,058 5,513 14,841 164,915Refinery .................................................................. 4,067 12,864 25,160 2,878 8,917 53,886Bulk Terminal .......................................................... 27,363 23,924 22,710 1,705 4,643 80,345Pipeline ................................................................... 7,492 7,793 13,188 930 1,281 30,684CBOB ..................................................................... 25,444 37,051 32,107 4,152 8,047 106,801
Refinery .............................................................. 610 6,711 10,422 1,519 2,334 21,596Bulk Terminal ...................................................... 17,354 22,739 8,767 1,703 4,435 54,998Pipeline ............................................................... 7,480 7,601 12,918 930 1,278 30,207
GTAB ..................................................................... 1,414 – – – – 1,414Refinery .............................................................. – – – – – –Bulk Terminal ...................................................... 1,414 – – – – 1,414Pipeline ............................................................... – – – – – –
Other ...................................................................... 12,064 7,530 28,951 1,361 6,794 56,700Refinery .............................................................. 3,457 6,153 14,738 1,359 6,583 32,290Bulk Terminal ...................................................... 8,595 1,185 13,943 2 208 23,933Pipeline ............................................................... 12 192 270 – 3 477
Aviation Gasoline Blending Components .................. – – 45 – – 45Refinery ...................................................................... – – 45 – – 45Bulk Terminal .............................................................. – – – – – –
Finished Motor Gasoline .............................................. 3,827 6,706 8,174 1,667 2,434 22,808Refinery ...................................................................... 27 1,444 2,901 671 1,161 6,204Bulk Terminal .............................................................. 1,340 2,733 3,908 723 1,159 9,863Pipeline ....................................................................... 2,460 2,529 1,365 273 114 6,741Reformulated ............................................................ 17 – – – 17 34
Refinery .................................................................. – – – – 17 17Bulk Terminal .......................................................... 17 – – – – 17Pipeline ................................................................... – – – – – –Reformulated (Blended with Fuel Ethanol) ........ 17 – – – 17 34
Refinery .............................................................. – – – – 17 17Bulk Terminal ...................................................... 17 – – – – 17Pipeline ............................................................... – – – – – –
See footnotes at end of table.
Table 55. Stocks of Crude Oil and Petroleum Products by PAD District, April 2018(Thousand Barrels) — Continued
CommodityPAD Districts
U.S. Total1 2 3 4 5
Reformulated (Other) ........................................... – – – – – –Refinery .............................................................. – – – – – –Bulk Terminal ...................................................... – – – – – –Pipeline ............................................................... – – – – – –
Conventional ............................................................. 3,810 6,706 8,174 1,667 2,417 22,774Refinery .................................................................. 27 1,444 2,901 671 1,144 6,187Bulk Terminal .......................................................... 1,323 2,733 3,908 723 1,159 9,846Pipeline ................................................................... 2,460 2,529 1,365 273 114 6,741Conventional (Blended with Fuel Ethanol) ........ 19 220 – 50 – 289
Refinery .............................................................. – – – 48 – 48Bulk Terminal ...................................................... 19 220 – 2 – 241Pipeline ............................................................... – – – – – –Ed55 and Lower ................................................ 19 220 – 50 – 289
Refinery .......................................................... – – – 48 – 48Bulk Terminal .................................................. 19 220 – 2 – 241Pipeline ........................................................... – – – – – –
Greater than Ed55 ............................................. – – – – – –Refinery .......................................................... – – – – – –Bulk Terminal .................................................. – – – – – –Pipeline ........................................................... – – – – – –
Conventional (Other) ............................................ 3,791 6,486 8,174 1,617 2,417 22,485Refinery .............................................................. 27 1,444 2,901 623 1,144 6,139Bulk Terminal ...................................................... 1,304 2,513 3,908 721 1,159 9,605Pipeline ............................................................... 2,460 2,529 1,365 273 114 6,741
Finished Aviation Gasoline ......................................... 201 182 331 7 175 896Refinery ...................................................................... – 93 278 7 108 486Bulk Terminal .............................................................. 201 89 53 – 67 410Pipeline ....................................................................... – – – – – –
Kerosene-Type Jet Fuel ............................................... 9,208 7,219 14,153 666 9,669 40,915Refinery ...................................................................... 576 2,057 6,502 308 4,262 13,705Bulk Terminal .............................................................. 3,810 3,388 2,686 235 4,713 14,832Pipeline ....................................................................... 4,822 1,774 4,965 123 694 12,378
Kerosene ....................................................................... 1,193 99 114 2 10 1,418Refinery ...................................................................... 180 79 94 2 3 358Bulk Terminal .............................................................. 1,009 20 2 – 7 1,038Pipeline ....................................................................... 4 – 18 – – 22
Distillate Fuel Oil2 ......................................................... 33,032 30,951 39,762 3,674 13,172 120,591Refinery ...................................................................... 2,848 6,822 15,616 1,794 5,555 32,635Bulk Terminal .............................................................. 22,773 17,268 12,308 1,249 6,167 59,765Pipeline ....................................................................... 7,411 6,861 11,838 631 1,450 28,191
15 ppm sulfur and Under ..................................... 27,479 30,252 33,453 3,432 12,200 106,816Refinery .............................................................. 2,097 6,329 12,763 1,606 4,795 27,590Bulk Terminal ...................................................... 19,088 17,239 9,994 1,197 6,064 53,582Pipeline ............................................................... 6,294 6,684 10,696 629 1,341 25,644
Greater than 15 ppm to 500 ppm sulfur .............. 2,114 273 1,399 190 205 4,181Refinery .............................................................. 146 91 737 136 204 1,314Bulk Terminal ...................................................... 1,959 19 576 52 1 2,607Pipeline ............................................................... 9 163 86 2 – 260
Greater than 500 ppm sulfur ................................ 3,439 426 4,910 52 767 9,594Refinery .............................................................. 605 402 2,116 52 556 3,731Bulk Terminal ...................................................... 1,726 10 1,738 – 102 3,576Pipeline ............................................................... 1,108 14 1,056 – 109 2,287
Residual Fuel Oil5 ......................................................... 6,808 1,341 18,949 279 4,972 32,349Refinery ...................................................................... 451 1,048 4,634 279 2,375 8,787Bulk Terminal .............................................................. 6,357 293 14,315 – 2,588 23,553Pipeline ....................................................................... – – – – 9 9
Less than 0.31% Sulfur ........................................ 1,022 105 1,235 30 199 2,591Refinery .............................................................. 202 70 213 30 – 515Bulk Terminal ...................................................... 820 35 1,022 – 199 2,076
0.31% to 1.00% Sulfur .......................................... 1,245 153 2,736 39 955 5,128Refinery .............................................................. 44 114 273 39 569 1,039Bulk Terminal ...................................................... 1,201 39 2,463 – 386 4,089
Greater than 1.00% Percent Sulfur ..................... 4,541 1,083 14,978 210 3,809 24,621Refinery .............................................................. 205 864 4,148 210 1,806 7,233Bulk Terminal ...................................................... 4,336 219 10,830 – 2,003 17,388
Petrochemical Feedstocks .......................................... 91 536 2,345 – 2 2,974Refinery ...................................................................... 91 536 2,345 – 2 2,974
Naphtha for Petrochemical Feedstock Use ............ 91 365 1,448 – 2 1,906Other Oils for Petrochemical Feedstock Use ......... – 171 897 – – 1,068
Special Naphthas .......................................................... 39 118 857 – 35 1,049Refinery ...................................................................... 15 63 840 – 35 953Bulk Terminal .............................................................. 24 55 17 – – 96
Lubricants ..................................................................... 1,047 635 8,831 – 915 11,428Refinery ...................................................................... 559 218 5,452 – 641 6,870Bulk Terminal .............................................................. 488 417 3,379 – 274 4,558
Waxes ............................................................................ 497 39 261 – – 797Refinery ...................................................................... 497 39 261 – – 797
Petroleum Coke ............................................................ – 2,271 4,973 111 1,405 8,760Refinery ...................................................................... – 2,271 4,973 111 1,405 8,760
Asphalt and Road Oil ................................................... 8,058 14,298 5,478 2,505 2,941 33,280Refinery ...................................................................... 615 5,013 2,528 1,034 975 10,165Bulk Terminal .............................................................. 7,443 9,285 2,950 1,471 1,966 23,115
See footnotes at end of table.

Energy Information Administration/Petroleum Supply Monthly,110 April 2018
Table 55. Stocks of Crude Oil and Petroleum Products by PAD District, April 2018(Thousand Barrels) — Continued
CommodityPAD Districts
U.S. Total1 2 3 4 5
Miscellaneous Products .............................................. 35 132 337 17 108 629Refinery ...................................................................... 35 132 332 17 104 620Bulk Terminal .............................................................. – – – – – –Pipeline ....................................................................... – – 5 – 4 9
Total Stocks, All Oils .................................................... 159,996 299,068 1,215,790 44,712 144,538 1,864,103
– = No Data Reported.Lease stocks were excluded from crude oil stocks beginning with data for July 2016 (see explanatory notes).
1 Crude oil stocks in the Strategic Petroleum Reserve include non-U.S. stocks held under foreign or commercial storage agreements.2 Excludes stocks located in the “Northeast Heating Oil Reserve”, “Northeast Regional Refined Petroleum Product Reserve”, and “State of New York’s Strategic Fuels Reserve Program”. For details see Appendix
D. Includes stocks held at fuel ethanol production facilities.
3 Includes stocks held by merchant producers.4 Includes ethyl tertiary butyl ether (ETBE), tertiary amyl methyl ether (TAME), tertiary butyl alcohol (TBA), and other aliphatic alcohols and ethers intended for motor gasoline blending (e.g., isopropyl ether (IPE) or
n-propanol).5 Sulfur content not available for stocks held by pipelines.
Note: Stocks are reported as of the last day of the month.Sources: Energy Information Administration (EIA) Forms EIA-22M "Monthly Biodiesel Production Survey", EIA-810, "Monthly Refinery Report," EIA-812, "Monthly Product Pipeline Report," EIA-813, "Monthly Crude OilReport," EIA-815, "Monthly Bulk Terminal and Blender Report," EIA-816, "Monthly Natural Gas Liquids Report," and EIA-819, "Monthly Oxygenate Report."

Energy Information Administration/Petroleum Supply Monthly, 111 April 2018
Table 55. Stocks of Crude Oil and Petroleum Products by PAD District, April 2018(Thousand Barrels) — Continued
CommodityPAD Districts
U.S. Total1 2 3 4 5
Miscellaneous Products .............................................. 35 132 337 17 108 629Refinery ...................................................................... 35 132 332 17 104 620Bulk Terminal .............................................................. – – – – – –Pipeline ....................................................................... – – 5 – 4 9
Total Stocks, All Oils .................................................... 159,996 299,068 1,215,790 44,712 144,538 1,864,103
– = No Data Reported.Lease stocks were excluded from crude oil stocks beginning with data for July 2016 (see explanatory notes).
1 Crude oil stocks in the Strategic Petroleum Reserve include non-U.S. stocks held under foreign or commercial storage agreements.2 Excludes stocks located in the “Northeast Heating Oil Reserve”, “Northeast Regional Refined Petroleum Product Reserve”, and “State of New York’s Strategic Fuels Reserve Program”. For details see Appendix
D. Includes stocks held at fuel ethanol production facilities.
3 Includes stocks held by merchant producers.4 Includes ethyl tertiary butyl ether (ETBE), tertiary amyl methyl ether (TAME), tertiary butyl alcohol (TBA), and other aliphatic alcohols and ethers intended for motor gasoline blending (e.g., isopropyl ether (IPE) or
n-propanol).5 Sulfur content not available for stocks held by pipelines.
Note: Stocks are reported as of the last day of the month.Sources: Energy Information Administration (EIA) Forms EIA-22M "Monthly Biodiesel Production Survey", EIA-810, "Monthly Refinery Report," EIA-812, "Monthly Product Pipeline Report," EIA-813, "Monthly Crude OilReport," EIA-815, "Monthly Bulk Terminal and Blender Report," EIA-816, "Monthly Natural Gas Liquids Report," and EIA-819, "Monthly Oxygenate Report."
Table 56. Refinery, Bulk Terminal, and Natural Gas Plant Stocks of Selected Petroleum Products by PAD District and State, April 2018(Thousand Barrels)
Commodity
Motor Gasoline Motor Gasoline Blending Components1
KeroseneReformulated Conventional Total Reformulated Conventional Total
PAD District 1 ............................................ 17 1,350 1,367 16,946 31,430 48,376 1,189Connecticut ............................................. – – – 1,127 – 1,127 115Delaware ................................................ – – – 621 710 1,331 147District of Columbia ................................ – – – – – – –Florida ..................................................... – 528 528 – 5,386 5,386 –Georgia ................................................... – 246 246 – 2,583 2,583 –Maine ...................................................... – – – 87 326 413 99Maryland ................................................. – – – 923 143 1,066 15Massachusetts ........................................ 4 – 4 1,807 – 1,807 42New Hampshire ...................................... – – – – – – 5New Jersey ............................................. – 114 114 8,669 11,010 19,679 213New York ................................................ 13 – 13 838 1,500 2,338 239North Carolina ........................................ – 156 156 – 2,096 2,096 206Pennsylvania .......................................... – 10 10 1,048 4,744 5,792 75Rhode Island .......................................... – – – 769 – 769 –South Carolina ........................................ – 165 165 – 1,465 1,465 19Vermont .................................................. – 19 19 – – – 4Virginia .................................................... – 78 78 1,057 1,365 2,422 10West Virginia .......................................... – 34 34 – 102 102 –
PAD District 2 ............................................ – 4,177 4,177 4,530 36,788 41,318 99Illinois ...................................................... – 364 364 2,102 4,563 6,665 79Indiana .................................................... – 314 314 1,047 4,895 5,942 –Iowa ........................................................ – 187 187 – 2,202 2,202 –Kansas .................................................... – 330 330 – 3,543 3,543 11Kentucky ................................................. – 332 332 466 1,076 1,542 5Michigan ................................................. – 233 233 10 2,954 2,964 –Minnesota ............................................... – 455 455 – 3,219 3,219 –Missouri .................................................. – 205 205 281 679 960 –Nebraska ................................................ – 108 108 – 888 888 –North Dakota .......................................... – 45 45 – 967 967 –Ohio ........................................................ – 697 697 20 3,930 3,950 4Oklahoma ............................................... – 491 491 – 4,078 4,078 –South Dakota .......................................... – 39 39 – 445 445 –Tennessee .............................................. – 170 170 – 1,758 1,758 –Wisconsin ............................................... – 207 207 604 1,591 2,195 –
PAD District 3 ............................................ – 6,809 6,809 6,700 47,870 54,570 96Alabama ................................................. – 182 182 – 1,267 1,267 4Arkansas ................................................. – 113 113 – 646 646 –Louisiana ................................................ – 984 984 327 12,448 12,775 55Mississippi .............................................. – 2,169 2,169 4 2,017 2,021 –New Mexico ............................................ – 103 103 – 535 535 –Texas ...................................................... – 3,258 3,258 6,369 30,957 37,326 37
PAD District 4 ............................................ – 1,394 1,394 – 4,583 4,583 2Colorado ................................................. – 263 263 – 1,142 1,142 –Idaho ....................................................... – 319 319 – 203 203 –Montana .................................................. – 430 430 – 1,113 1,113 –Utah ........................................................ – 63 63 – 1,219 1,219 2Wyoming ................................................. – 319 319 – 906 906 –
PAD District 5 ............................................ 17 2,303 2,320 12,166 13,560 25,726 10Alaska ..................................................... – 962 962 – – – 7Arizona ................................................... – 88 88 405 247 652 –California ................................................ 17 519 536 11,613 7,089 18,702 3Hawaii ..................................................... – 1 1 – 1,033 1,033 –Nevada ................................................... – 181 181 9 289 298 –Oregon .................................................... – 79 79 – 1,540 1,540 –Washington ............................................. – 473 473 139 3,362 3,501 –
U.S. Total ................................................... 34 16,033 16,067 40,342 134,231 174,573 1,396
See footnotes at end of table.

Energy Information Administration/Petroleum Supply Monthly,112 April 2018
Table 56. Refinery, Bulk Terminal, and Natural Gas Plant Stocks of Selected Petroleum Products by PAD District and State, April 2018(Thousand Barrels) — Continued
Commodity
Distillate Fuel Oil1
ResidualFuel Oil Propane15 ppm sulfur
and underGreater than 15 ppm
to 500 ppm sulfurGreater than
500 ppm Total
PAD District 1 ............................................ 21,185 2,105 2,331 25,621 6,808 1,984Connecticut ............................................. 655 759 49 1,463 15 –Delaware ................................................ 429 39 84 552 393 18District of Columbia ................................ – – – – – –Florida ..................................................... 1,906 189 – 2,095 1,435 44Georgia ................................................... 1,012 – – 1,012 309 4Maine ...................................................... 828 2 181 1,011 57 –Maryland ................................................. 920 116 – 1,036 281 1Massachusetts ........................................ 784 356 111 1,251 158 –New Hampshire ...................................... 169 – 218 387 25 203New Jersey ............................................. 5,829 103 759 6,691 2,799 44New York ................................................ 2,701 94 136 2,931 467 258North Carolina ........................................ 1,134 – 6 1,140 – 456Pennsylvania .......................................... 2,888 136 492 3,516 511 766Rhode Island .......................................... 313 222 – 535 – –South Carolina ........................................ 658 – – 658 279 130Vermont .................................................. 12 – 10 22 – –Virginia .................................................... 794 84 285 1,163 79 6West Virginia .......................................... 153 5 – 158 – 54
PAD District 2 ............................................ 23,568 110 412 24,090 1,341 6,658Illinois ...................................................... 3,142 – – 3,142 247 390Indiana .................................................... 4,274 – 95 4,369 103 262Iowa ........................................................ 1,934 1 – 1,935 3 237Kansas .................................................... 2,322 – – 2,322 32 3,701Kentucky ................................................. 713 4 – 717 210 105Michigan ................................................. 1,436 – – 1,436 306 1,151Minnesota ............................................... 1,536 – 10 1,546 101 100Missouri .................................................. 514 14 2 530 – 67Nebraska ................................................ 791 – – 791 – 107North Dakota .......................................... 941 1 – 942 30 62Ohio ........................................................ 1,737 – 121 1,858 136 372Oklahoma ............................................... 2,023 28 98 2,149 66 50South Dakota .......................................... 615 – – 615 – 12Tennessee .............................................. 749 – – 749 52 2Wisconsin ............................................... 841 62 86 989 55 40
PAD District 3 ............................................ 22,757 1,313 3,854 27,924 18,949 15,527Alabama ................................................. 881 7 30 918 433 28Arkansas ................................................. 667 – 42 709 – 42Louisiana ................................................ 4,713 863 1,538 7,114 9,077 768Mississippi .............................................. 1,366 123 132 1,621 526 317New Mexico ............................................ 323 – – 323 84 5Texas ...................................................... 14,807 320 2,112 17,239 8,829 14,367
PAD District 4 ............................................ 2,803 188 52 3,043 279 187Colorado ................................................. 477 – – 477 39 25Idaho ....................................................... 196 – – 196 – –Montana .................................................. 951 70 – 1,021 86 33Utah ........................................................ 476 49 52 577 63 81Wyoming ................................................. 703 69 – 772 91 48
PAD District 5 ............................................ 10,859 205 658 11,722 4,963 608Alaska ..................................................... 1,144 – 53 1,197 176 2Arizona ................................................... 542 – – 542 – 190California ................................................ 5,493 204 261 5,958 3,041 136Hawaii ..................................................... 254 1 340 595 941 54Nevada ................................................... 247 – 4 251 – –Oregon .................................................... 1,067 – – 1,067 7 –Washington ............................................. 2,112 – – 2,112 798 226
U.S. Total ................................................... 81,172 3,921 7,307 92,400 32,340 24,964
– = No Data Reported.1 Excludes stocks located in the “Northeast Heating Oil Reserve”, “Northeast Regional Refined Petroleum Product Reserve”, and “State of New York’s Strategic Fuels Reserve Program”. For details see Appendix
D.Note: Stocks are reported as of the last day of the month.Note: Totals may not equal sum of components due to independent rounding.Sources: Energy Information Administration (EIA) Forms EIA-810, "Monthly Refinery Report," EIA-815, "Monthly Bulk Terminal and Blender Report," EIA-816, "Monthly Natural Gas Liquids Report," and EIA-819,"Monthly Oxygenate Report."

Energy Information Administration/Petroleum Supply Monthly, 113 April 2018
Table 56. Refinery, Bulk Terminal, and Natural Gas Plant Stocks of Selected Petroleum Products by PAD District and State, April 2018(Thousand Barrels) — Continued
Commodity
Distillate Fuel Oil1
ResidualFuel Oil Propane15 ppm sulfur
and underGreater than 15 ppm
to 500 ppm sulfurGreater than
500 ppm Total
PAD District 1 ............................................ 21,185 2,105 2,331 25,621 6,808 1,984Connecticut ............................................. 655 759 49 1,463 15 –Delaware ................................................ 429 39 84 552 393 18District of Columbia ................................ – – – – – –Florida ..................................................... 1,906 189 – 2,095 1,435 44Georgia ................................................... 1,012 – – 1,012 309 4Maine ...................................................... 828 2 181 1,011 57 –Maryland ................................................. 920 116 – 1,036 281 1Massachusetts ........................................ 784 356 111 1,251 158 –New Hampshire ...................................... 169 – 218 387 25 203New Jersey ............................................. 5,829 103 759 6,691 2,799 44New York ................................................ 2,701 94 136 2,931 467 258North Carolina ........................................ 1,134 – 6 1,140 – 456Pennsylvania .......................................... 2,888 136 492 3,516 511 766Rhode Island .......................................... 313 222 – 535 – –South Carolina ........................................ 658 – – 658 279 130Vermont .................................................. 12 – 10 22 – –Virginia .................................................... 794 84 285 1,163 79 6West Virginia .......................................... 153 5 – 158 – 54
PAD District 2 ............................................ 23,568 110 412 24,090 1,341 6,658Illinois ...................................................... 3,142 – – 3,142 247 390Indiana .................................................... 4,274 – 95 4,369 103 262Iowa ........................................................ 1,934 1 – 1,935 3 237Kansas .................................................... 2,322 – – 2,322 32 3,701Kentucky ................................................. 713 4 – 717 210 105Michigan ................................................. 1,436 – – 1,436 306 1,151Minnesota ............................................... 1,536 – 10 1,546 101 100Missouri .................................................. 514 14 2 530 – 67Nebraska ................................................ 791 – – 791 – 107North Dakota .......................................... 941 1 – 942 30 62Ohio ........................................................ 1,737 – 121 1,858 136 372Oklahoma ............................................... 2,023 28 98 2,149 66 50South Dakota .......................................... 615 – – 615 – 12Tennessee .............................................. 749 – – 749 52 2Wisconsin ............................................... 841 62 86 989 55 40
PAD District 3 ............................................ 22,757 1,313 3,854 27,924 18,949 15,527Alabama ................................................. 881 7 30 918 433 28Arkansas ................................................. 667 – 42 709 – 42Louisiana ................................................ 4,713 863 1,538 7,114 9,077 768Mississippi .............................................. 1,366 123 132 1,621 526 317New Mexico ............................................ 323 – – 323 84 5Texas ...................................................... 14,807 320 2,112 17,239 8,829 14,367
PAD District 4 ............................................ 2,803 188 52 3,043 279 187Colorado ................................................. 477 – – 477 39 25Idaho ....................................................... 196 – – 196 – –Montana .................................................. 951 70 – 1,021 86 33Utah ........................................................ 476 49 52 577 63 81Wyoming ................................................. 703 69 – 772 91 48
PAD District 5 ............................................ 10,859 205 658 11,722 4,963 608Alaska ..................................................... 1,144 – 53 1,197 176 2Arizona ................................................... 542 – – 542 – 190California ................................................ 5,493 204 261 5,958 3,041 136Hawaii ..................................................... 254 1 340 595 941 54Nevada ................................................... 247 – 4 251 – –Oregon .................................................... 1,067 – – 1,067 7 –Washington ............................................. 2,112 – – 2,112 798 226
U.S. Total ................................................... 81,172 3,921 7,307 92,400 32,340 24,964
– = No Data Reported.1 Excludes stocks located in the “Northeast Heating Oil Reserve”, “Northeast Regional Refined Petroleum Product Reserve”, and “State of New York’s Strategic Fuels Reserve Program”. For details see Appendix
D.Note: Stocks are reported as of the last day of the month.Note: Totals may not equal sum of components due to independent rounding.Sources: Energy Information Administration (EIA) Forms EIA-810, "Monthly Refinery Report," EIA-815, "Monthly Bulk Terminal and Blender Report," EIA-816, "Monthly Natural Gas Liquids Report," and EIA-819,"Monthly Oxygenate Report."
Table 57. Movements of Crude Oil and Petroleum Products by Pipeline, Tanker, Barge, and Rail 1 Between PAD Districts, April 2018(Thousand Barrels)
CommodityFrom 1 to From 2 to From 3 to
2 3 5 1 3 4 5 1 2
Crude Oil ................................................................. 231 208 0 3,536 46,727 7,084 3,334 4,723 24,473
Petroleum Products ............................................... 17,058 313 0 18,149 37,088 6,728 4,925 101,428 16,944Natural Gas Liquids .............................................. 7,661 177 0 3,040 24,177 3,604 510 1,444 9,081
Ethane .............................................................. 5,462 0 – 0 11,117 553 – 0 726Propane ............................................................ 1,133 129 0 2,426 9,211 1,710 198 1,412 746Normal Butane .................................................. 402 37 0 342 2,103 732 225 20 246Isobutane .......................................................... 434 11 0 272 730 269 87 12 507Natural Gasoline ............................................... 230 0 – 0 1,016 340 – 0 6,856
Refinery Olefins .................................................... 0 0 – 247 490 – – 0 0Ethylene ............................................................ – – – – – – – – –Propylene ......................................................... 0 0 – 247 490 – – 0 0Butylene ............................................................ – – – – – – – – –Isobutylene ....................................................... – – – – – – – – –
Unfinished Oils ..................................................... 27 0 – 0 805 – – 0 354Motor Gasoline Blending Components ................. 6,460 136 0 1,163 1,771 1,303 0 51,311 3,479
Reformulated - RBOB ....................................... 0 0 0 184 186 – 0 6,691 1,523Conventional ..................................................... 6,460 136 0 979 1,585 1,303 0 44,620 1,956
CBOB ........................................................... 6,460 0 0 979 1,127 1,303 0 44,469 1,877GTAB ............................................................ – – – – – – – – –Other ............................................................. 0 136 – 0 458 – – 151 79
Renewable Fuels .................................................. 0 0 0 11,089 6,776 395 4,232 530 0Fuel Ethanol ..................................................... 0 0 0 10,854 6,494 375 4,073 530 0Renewable Diesel Fuel ..................................... 0 0 0 236 282 20 158 0 0Other Renewable Fuels .................................... – – – – – – – – –
Finished Motor Gasoline ....................................... 121 0 0 694 176 135 0 7,385 570Reformulated .................................................... – – – – – – – – –
Reformulated Blended with Fuel Ethanol ..... – – – – – – – – –Reformulated Other ...................................... – – – – – – – – –
Conventional ..................................................... 121 0 0 694 176 135 0 7,385 570Conventional Blended with Fuel Ethanol ...... – – – – – – – – –
Ed55 and Lower ....................................... – – – – – – – – –Greater than Ed55 .................................... – – – – – – – – –
Conventional Other ....................................... 121 0 0 694 176 135 0 7,385 570Finished Aviation Gasoline ................................... 0 0 – 0 0 – – 103 30Kerosene-Type Jet Fuel ....................................... 255 0 0 108 60 618 0 15,519 1,209Kerosene .............................................................. – – – – – – – – –Distillate Fuel Oil ................................................... 2,534 0 0 951 990 673 0 24,055 1,727
15 ppm sulfur and under ................................... 2,534 0 0 951 990 673 0 21,293 1,614Greater than 15 ppm to 500 ppm sulfur ............ 0 0 0 – 0 0 0 – 113Greater than 500 ppm sulfur ............................. – 0 – 0 0 – – 2,762 –
Residual Fuel Oil .................................................. 0 0 – – 613 – – – 0Petrochemical Feedstocks ................................... 0 0 – 0 113 – – 36 0
Naphtha for Petrochemical Feedstock Use ...... 0 0 – 0 90 – – 36 0Other Oils for Petrochemical Feedstock Use ... 0 0 – – 23 – – – 0
Special Naphthas ................................................. 0 0 – – 0 – – – 29Lubricants ............................................................. 0 0 – 0 0 – – 563 189Waxes ................................................................... – – – – – – – – –Marketable Petroleum Coke ................................. 0 0 0 242 708 0 0 0 0Asphalt and Road Oil ............................................ 0 0 0 615 410 0 183 482 268Miscellaneous Products ........................................ 0 0 – – 0 – – – 8
Total ......................................................................... 17,289 521 0 21,686 83,815 13,812 8,258 106,151 41,417
See footnotes at end of table.

Energy Information Administration/Petroleum Supply Monthly,114 April 2018
Table 57. Movements of Crude Oil and Petroleum Products by Pipeline, Tanker, Barge, and Rail 1 Between PAD Districts, April 2018(Thousand Barrels) — Continued
CommodityFrom 3 to From 4 to From 5 to
4 5 1 2 3 5 1 3 4
Crude Oil ................................................................. 0 53 0 22,297 1,141 94 0 0 0
Petroleum Products ............................................... 0 5,832 0 7,942 8,830 2,583 0 73 25Natural Gas Liquids .............................................. 0 41 0 7,148 8,364 273 0 0 0
Ethane .............................................................. 0 – 0 1,525 2,956 – 0 0 0Propane ............................................................ 0 0 0 2,981 2,790 145 0 0 0Normal Butane .................................................. 0 31 0 1,269 988 88 0 0 0Isobutane .......................................................... 0 10 0 552 560 40 0 0 0Natural Gasoline ............................................... 0 – 0 821 1,070 – 0 0 0
Refinery Olefins .................................................... – – 0 0 0 – 0 0 –Ethylene ............................................................ – – – – – – – – –Propylene ......................................................... – – 0 0 0 – 0 0 –Butylene ............................................................ – – – – – – – – –Isobutylene ....................................................... – – – – – – – – –
Unfinished Oils ..................................................... – – 0 0 0 – 0 0 –Motor Gasoline Blending Components ................. 0 3,775 0 164 0 1,084 0 0 0
Reformulated - RBOB ....................................... – 2,457 0 0 0 0 0 0 –Conventional ..................................................... 0 1,318 0 164 0 1,084 0 0 0
CBOB ........................................................... 0 1,318 0 164 0 1,084 0 0 0GTAB ............................................................ – – – – – – – – –Other ............................................................. – – 0 0 0 – 0 0 –
Renewable Fuels .................................................. 0 669 0 0 0 0 0 0 0Fuel Ethanol ..................................................... 0 445 0 0 0 0 0 0 0Renewable Diesel Fuel ..................................... 0 224 0 0 0 0 0 0 0Other Renewable Fuels .................................... – – – – – – – – –
Finished Motor Gasoline ....................................... 0 0 0 144 0 721 0 0 0Reformulated .................................................... – – – – – – – – –
Reformulated Blended with Fuel Ethanol ..... – – – – – – – – –Reformulated Other ...................................... – – – – – – – – –
Conventional ..................................................... 0 0 0 144 0 721 0 0 0Conventional Blended with Fuel Ethanol ...... – – – – – – – – –
Ed55 and Lower ....................................... – – – – – – – – –Greater than Ed55 .................................... – – – – – – – – –
Conventional Other ....................................... 0 0 0 144 0 721 0 0 0Finished Aviation Gasoline ................................... – – 0 0 0 – 0 0 –Kerosene-Type Jet Fuel ....................................... 0 309 0 24 0 0 0 0 0Kerosene .............................................................. – – – – – – – – –Distillate Fuel Oil ................................................... 0 846 0 278 0 155 0 0 0
15 ppm sulfur and under ................................... 0 846 0 278 0 115 0 0 0Greater than 15 ppm to 500 ppm sulfur ............ 0 0 – 0 0 40 – 0 0Greater than 500 ppm sulfur ............................. – – 0 – 0 – 0 0 –
Residual Fuel Oil .................................................. – – – 0 0 – – 0 –Petrochemical Feedstocks ................................... – – 0 0 0 – 0 0 –
Naphtha for Petrochemical Feedstock Use ...... – – 0 0 0 – 0 0 –Other Oils for Petrochemical Feedstock Use ... – – – 0 0 – – 0 –
Special Naphthas ................................................. – – – 0 0 – – 0 –Lubricants ............................................................. – – 0 0 0 – 0 0 –Waxes ................................................................... – – – – – – – – –Marketable Petroleum Coke ................................. 0 0 0 57 301 38 0 53 25Asphalt and Road Oil ............................................ 0 192 0 127 166 312 0 21 0Miscellaneous Products ........................................ – – – 0 0 – – 0 –
Total ......................................................................... 0 5,886 0 30,239 9,972 2,676 0 73 25
– = No Data Reported.1 Movements of crude oil, fuel ethanol and biodiesel include movements by rail. Movements of other products are by pipeline, tanker and barge only.
Renewable diesel fuel includes biodiesel and other renewable diesel.Sources: Energy Information Administration (EIA) Forms EIA-812, "Monthly Product Pipeline Report," EIA-813, "Monthly Crude Oil Report," EIA-817, "Monthly Tanker and Barge Movements Report." Rail netmovements estimates based on EIA analysis of data from the Surface Transportation Board and other information.

Energy Information Administration/Petroleum Supply Monthly, 115 April 2018
Table 57. Movements of Crude Oil and Petroleum Products by Pipeline, Tanker, Barge, and Rail 1 Between PAD Districts, April 2018(Thousand Barrels) — Continued
CommodityFrom 3 to From 4 to From 5 to
4 5 1 2 3 5 1 3 4
Crude Oil ................................................................. 0 53 0 22,297 1,141 94 0 0 0
Petroleum Products ............................................... 0 5,832 0 7,942 8,830 2,583 0 73 25Natural Gas Liquids .............................................. 0 41 0 7,148 8,364 273 0 0 0
Ethane .............................................................. 0 – 0 1,525 2,956 – 0 0 0Propane ............................................................ 0 0 0 2,981 2,790 145 0 0 0Normal Butane .................................................. 0 31 0 1,269 988 88 0 0 0Isobutane .......................................................... 0 10 0 552 560 40 0 0 0Natural Gasoline ............................................... 0 – 0 821 1,070 – 0 0 0
Refinery Olefins .................................................... – – 0 0 0 – 0 0 –Ethylene ............................................................ – – – – – – – – –Propylene ......................................................... – – 0 0 0 – 0 0 –Butylene ............................................................ – – – – – – – – –Isobutylene ....................................................... – – – – – – – – –
Unfinished Oils ..................................................... – – 0 0 0 – 0 0 –Motor Gasoline Blending Components ................. 0 3,775 0 164 0 1,084 0 0 0
Reformulated - RBOB ....................................... – 2,457 0 0 0 0 0 0 –Conventional ..................................................... 0 1,318 0 164 0 1,084 0 0 0
CBOB ........................................................... 0 1,318 0 164 0 1,084 0 0 0GTAB ............................................................ – – – – – – – – –Other ............................................................. – – 0 0 0 – 0 0 –
Renewable Fuels .................................................. 0 669 0 0 0 0 0 0 0Fuel Ethanol ..................................................... 0 445 0 0 0 0 0 0 0Renewable Diesel Fuel ..................................... 0 224 0 0 0 0 0 0 0Other Renewable Fuels .................................... – – – – – – – – –
Finished Motor Gasoline ....................................... 0 0 0 144 0 721 0 0 0Reformulated .................................................... – – – – – – – – –
Reformulated Blended with Fuel Ethanol ..... – – – – – – – – –Reformulated Other ...................................... – – – – – – – – –
Conventional ..................................................... 0 0 0 144 0 721 0 0 0Conventional Blended with Fuel Ethanol ...... – – – – – – – – –
Ed55 and Lower ....................................... – – – – – – – – –Greater than Ed55 .................................... – – – – – – – – –
Conventional Other ....................................... 0 0 0 144 0 721 0 0 0Finished Aviation Gasoline ................................... – – 0 0 0 – 0 0 –Kerosene-Type Jet Fuel ....................................... 0 309 0 24 0 0 0 0 0Kerosene .............................................................. – – – – – – – – –Distillate Fuel Oil ................................................... 0 846 0 278 0 155 0 0 0
15 ppm sulfur and under ................................... 0 846 0 278 0 115 0 0 0Greater than 15 ppm to 500 ppm sulfur ............ 0 0 – 0 0 40 – 0 0Greater than 500 ppm sulfur ............................. – – 0 – 0 – 0 0 –
Residual Fuel Oil .................................................. – – – 0 0 – – 0 –Petrochemical Feedstocks ................................... – – 0 0 0 – 0 0 –
Naphtha for Petrochemical Feedstock Use ...... – – 0 0 0 – 0 0 –Other Oils for Petrochemical Feedstock Use ... – – – 0 0 – – 0 –
Special Naphthas ................................................. – – – 0 0 – – 0 –Lubricants ............................................................. – – 0 0 0 – 0 0 –Waxes ................................................................... – – – – – – – – –Marketable Petroleum Coke ................................. 0 0 0 57 301 38 0 53 25Asphalt and Road Oil ............................................ 0 192 0 127 166 312 0 21 0Miscellaneous Products ........................................ – – – 0 0 – – 0 –
Total ......................................................................... 0 5,886 0 30,239 9,972 2,676 0 73 25
– = No Data Reported.1 Movements of crude oil, fuel ethanol and biodiesel include movements by rail. Movements of other products are by pipeline, tanker and barge only.
Renewable diesel fuel includes biodiesel and other renewable diesel.Sources: Energy Information Administration (EIA) Forms EIA-812, "Monthly Product Pipeline Report," EIA-813, "Monthly Crude Oil Report," EIA-817, "Monthly Tanker and Barge Movements Report." Rail netmovements estimates based on EIA analysis of data from the Surface Transportation Board and other information.
Table 58. Movements of Crude Oil and Petroleum Products by Pipeline Between PAD Districts, April 2018(Thousand Barrels)
CommodityFrom 1 to From 2 to From 3 to
2 3 1 3 4 1 2 4 5
Crude Oil1 ................................................................ 98 79 289 44,833 7,084 175 24,473 0 –
Petroleum Products2 .............................................. 16,254 0 3,200 25,188 6,333 77,067 15,344 0 4,930Natural Gas Liquids .............................................. 6,909 0 1,358 22,722 3,604 1,365 8,953 0 –
Ethane .............................................................. 5,462 0 0 11,117 553 0 726 0 –Propane ............................................................ 840 0 1,358 7,990 1,710 1,365 729 0 –Normal Butane .................................................. 113 0 0 1,918 732 0 229 0 –Isobutane .......................................................... 264 0 0 681 269 0 413 0 –Natural Gasoline ............................................... 230 0 0 1,016 340 0 6,856 0 –
Motor Gasoline Blending Components ................. 6,435 0 545 1,313 1,303 40,922 3,407 0 3,775Reformulated - RBOB ....................................... 0 0 0 186 – 6,691 1,523 – 2,457Conventional ..................................................... 6,435 0 545 1,127 1,303 34,231 1,884 0 1,318
CBOB ........................................................... 6,435 0 545 1,127 1,303 34,231 1,824 0 1,318GTAB ............................................................ – – – – – – – – –Other ............................................................. 0 0 – 0 – – 60 – –
Renewable Fuels .................................................. – – – – – – – – –Fuel Ethanol ..................................................... – – – – – – – – –Renewable Diesel Fuel ..................................... – – – – – – – – –Other Renewable Fuels .................................... – – – – – – – – –
Finished Motor Gasoline ....................................... 121 0 675 151 135 2,851 306 0 0Reformulated .................................................... – – – – – – – – –
Reformulated Blended with Fuel Ethanol ..... – – – – – – – – –Reformulated Other ...................................... – – – – – – – – –
Conventional ..................................................... 121 0 675 151 135 2,851 306 0 0Conventional Blended with Fuel Ethanol ...... – – – – – – – – –
Ed55 and Lower ....................................... – – – – – – – – –Greater than Ed55 .................................... – – – – – – – – –
Conventional Other ....................................... 121 0 675 151 135 2,851 306 0 0Finished Aviation Gasoline ................................... – – – – – – – – –Kerosene-Type Jet Fuel ....................................... 255 0 108 60 618 11,344 1,209 0 309Kerosene .............................................................. – – – – – – – – –Distillate Fuel Oil ................................................... 2,534 0 514 942 673 20,585 1,469 0 846
15 ppm sulfur and under ................................... 2,534 0 514 942 673 17,823 1,356 0 846Greater than 15 ppm to 500 ppm sulfur ............ 0 0 – 0 0 – 113 0 0Greater than 500 ppm sulfur ............................. – 0 0 0 – 2,762 – – –
Residual Fuel Oil .................................................. – – – – – – – – –Miscellaneous Products ........................................ – – – – – – – – –
Total ......................................................................... 16,352 79 3,489 70,021 13,417 77,242 39,817 0 4,930
See footnotes at end of table.

Energy Information Administration/Petroleum Supply Monthly,116 April 2018
Table 58. Movements of Crude Oil and Petroleum Products by Pipeline Between PAD Districts, April 2018(Thousand Barrels) — Continued
CommodityFrom 4 to From 5 to
1 2 3 5 3 4
Crude Oil1 ................................................................ 0 22,297 377 – 0 0
Petroleum Products2 .............................................. 0 7,758 8,364 1,961 0 0Natural Gas Liquids .............................................. 0 7,148 8,364 – 0 0
Ethane .............................................................. 0 1,525 2,956 – 0 0Propane ............................................................ 0 2,981 2,790 – 0 0Normal Butane .................................................. 0 1,269 988 – 0 0Isobutane .......................................................... 0 552 560 – 0 0Natural Gasoline ............................................... 0 821 1,070 – 0 0
Motor Gasoline Blending Components ................. 0 164 0 1,084 0 0Reformulated - RBOB ....................................... 0 0 0 0 0 –Conventional ..................................................... 0 164 0 1,084 0 0
CBOB ........................................................... 0 164 0 1,084 0 0GTAB ............................................................ – – – – – –Other ............................................................. – 0 0 – 0 –
Renewable Fuels .................................................. – – – – – –Fuel Ethanol ..................................................... – – – – – –Renewable Diesel Fuel ..................................... – – – – – –Other Renewable Fuels .................................... – – – – – –
Finished Motor Gasoline ....................................... 0 144 0 721 0 0Reformulated .................................................... – – – – – –
Reformulated Blended with Fuel Ethanol ..... – – – – – –Reformulated Other ...................................... – – – – – –
Conventional ..................................................... 0 144 0 721 0 0Conventional Blended with Fuel Ethanol ...... – – – – – –
Ed55 and Lower ....................................... – – – – – –Greater than Ed55 .................................... – – – – – –
Conventional Other ....................................... 0 144 0 721 0 0Finished Aviation Gasoline ................................... – – – – – –Kerosene-Type Jet Fuel ....................................... 0 24 0 0 0 0Kerosene .............................................................. – – – – – –Distillate Fuel Oil ................................................... 0 278 0 155 0 0
15 ppm sulfur and under ................................... 0 278 0 115 0 0Greater than 15 ppm to 500 ppm sulfur ............ – 0 0 40 0 0Greater than 500 ppm sulfur ............................. 0 – 0 – 0 –
Residual Fuel Oil .................................................. – – – – – –Miscellaneous Products ........................................ – – – – – –
Total ......................................................................... 0 30,055 8,741 1,961 0 0
– = No Data Reported.1 Movements of crude oil, fuel ethanol and biodiesel include movements by rail. Movements of other products are by pipeline, tanker and barge only.2 Renewable diesel fuel includes biodiesel and other renewable diesel.
Sources: Energy Information Administration (EIA) Forms EIA-812, "Monthly Product Pipeline Report," EIA-813, "Monthly Crude Oil Report."

Energy Information Administration/Petroleum Supply Monthly, 117 April 2018
Table 58. Movements of Crude Oil and Petroleum Products by Pipeline Between PAD Districts, April 2018(Thousand Barrels) — Continued
CommodityFrom 4 to From 5 to
1 2 3 5 3 4
Crude Oil1 ................................................................ 0 22,297 377 – 0 0
Petroleum Products2 .............................................. 0 7,758 8,364 1,961 0 0Natural Gas Liquids .............................................. 0 7,148 8,364 – 0 0
Ethane .............................................................. 0 1,525 2,956 – 0 0Propane ............................................................ 0 2,981 2,790 – 0 0Normal Butane .................................................. 0 1,269 988 – 0 0Isobutane .......................................................... 0 552 560 – 0 0Natural Gasoline ............................................... 0 821 1,070 – 0 0
Motor Gasoline Blending Components ................. 0 164 0 1,084 0 0Reformulated - RBOB ....................................... 0 0 0 0 0 –Conventional ..................................................... 0 164 0 1,084 0 0
CBOB ........................................................... 0 164 0 1,084 0 0GTAB ............................................................ – – – – – –Other ............................................................. – 0 0 – 0 –
Renewable Fuels .................................................. – – – – – –Fuel Ethanol ..................................................... – – – – – –Renewable Diesel Fuel ..................................... – – – – – –Other Renewable Fuels .................................... – – – – – –
Finished Motor Gasoline ....................................... 0 144 0 721 0 0Reformulated .................................................... – – – – – –
Reformulated Blended with Fuel Ethanol ..... – – – – – –Reformulated Other ...................................... – – – – – –
Conventional ..................................................... 0 144 0 721 0 0Conventional Blended with Fuel Ethanol ...... – – – – – –
Ed55 and Lower ....................................... – – – – – –Greater than Ed55 .................................... – – – – – –
Conventional Other ....................................... 0 144 0 721 0 0Finished Aviation Gasoline ................................... – – – – – –Kerosene-Type Jet Fuel ....................................... 0 24 0 0 0 0Kerosene .............................................................. – – – – – –Distillate Fuel Oil ................................................... 0 278 0 155 0 0
15 ppm sulfur and under ................................... 0 278 0 115 0 0Greater than 15 ppm to 500 ppm sulfur ............ – 0 0 40 0 0Greater than 500 ppm sulfur ............................. 0 – 0 – 0 –
Residual Fuel Oil .................................................. – – – – – –Miscellaneous Products ........................................ – – – – – –
Total ......................................................................... 0 30,055 8,741 1,961 0 0
– = No Data Reported.1 Movements of crude oil, fuel ethanol and biodiesel include movements by rail. Movements of other products are by pipeline, tanker and barge only.2 Renewable diesel fuel includes biodiesel and other renewable diesel.
Sources: Energy Information Administration (EIA) Forms EIA-812, "Monthly Product Pipeline Report," EIA-813, "Monthly Crude Oil Report."
Table 59. Movements of Crude Oil and Petroleum Products by Tanker and Barge Between PAD Districts, April 2018(Thousand Barrels)
Commodity
From 1 to From 2 to
2 3 5 1 3 5
Crude Oil1 ................................................................ 133 129 – 305 1,894 –
Petroleum Products2 .............................................. 52 136 0 1,120 3,101 0Natural Gas Liquids .............................................. – 0 – 0 0 –
Ethane .............................................................. – – – – – –Propane ............................................................ – 0 – 0 0 –Normal Butane .................................................. – – – – – –Isobutane .......................................................... – – – – – –Natural Gasoline ............................................... – – – – – –
Unfinished Oils ..................................................... 27 0 – 0 805 –Motor Gasoline Blending Components ................. 25 136 – 618 458 –
Reformulated - RBOB ....................................... 0 – – 184 – –Conventional ..................................................... 25 136 – 434 458 –
CBOB ........................................................... 25 0 – 434 0 –GTAB ............................................................ – – – – – –Other ............................................................. 0 136 – 0 458 –
Renewable Fuels .................................................. 0 0 0 0 889 0Fuel Ethanol ..................................................... 0 0 – 0 853 –Renewable Diesel Fuel ..................................... 0 0 0 – 36 0Other Renewable Fuels .................................... – – – – – –
Finished Motor Gasoline ....................................... 0 0 – 19 25 –Reformulated .................................................... – – – – – –
Reformulated Blended with Fuel Ethanol ..... – – – – – –Reformulated Other ...................................... – – – – – –
Conventional ..................................................... 0 0 – 19 25 –Conventional Blended with Fuel Ethanol ...... – – – – – –
Ed55 and Lower ....................................... – – – – – –Greater than Ed55 .................................... – – – – – –
Conventional Other ....................................... 0 0 – 19 25 –Finished Aviation Gasoline ................................... 0 0 – 0 0 –Kerosene-Type Jet Fuel ....................................... – 0 – 0 0 –Kerosene .............................................................. – – – – – –Distillate Fuel Oil ................................................... 0 0 – 437 48 –
15 ppm sulfur and under ................................... 0 0 – 437 48 –Greater than 15 ppm to 500 ppm sulfur ............ – – – – – –Greater than 500 ppm sulfur ............................. – – – – – –
Residual Fuel Oil .................................................. 0 0 – – 613 –Less than 0.31 percent sulfur ........................... 0 0 – – 20 –0.31 to 1.00 percent sulfur ................................ – – – – – –Greater than 1.00 percent sulfur ....................... 0 0 – – 593 –
Petrochemical Feedstocks ................................... 0 0 – 0 113 –Naphtha for Petrochemical Feedstock Use ...... 0 0 – 0 90 –Other Oils for Petrochemical Feedstock Use ... 0 0 – – 23 –
Special Naphthas ................................................. 0 0 – – 0 –Lubricants ............................................................. 0 0 – 0 0 –Waxes ................................................................... – – – – – –Marketable Petroleum Coke ................................. – – – – – –Asphalt and Road Oil ............................................ 0 0 – 46 150 –Miscellaneous Products ........................................ 0 0 – – 0 –
Total ......................................................................... 185 265 0 1,425 4,995 0
See footnotes at end of table.

Energy Information Administration/Petroleum Supply Monthly,118 April 2018
Table 59. Movements of Crude Oil and Petroleum Products by Tanker and Barge Between PAD Districts, April 2018(Thousand Barrels) — Continued
Commodity
From 3 to From 5 to
1 NewEngland
CentralAtlantic
LowerAtlantic 2 5 1 2 3
Crude Oil1 ................................................................ 4,548 – 4,548 – 0 – 0 0 0
Petroleum Products2 .............................................. 24,203 16 516 23,671 1,452 207 0 0 0Natural Gas Liquids .............................................. 46 – – 46 – – 0 – 0
Ethane .............................................................. – – – – – – – – –Propane ............................................................ 46 – – 46 – – 0 – 0Normal Butane .................................................. – – – – – – – – –Isobutane .......................................................... – – – – – – – – –Natural Gasoline ............................................... – – – – – – – – –
Unfinished Oils ..................................................... 0 – – – 354 – 0 0 0Motor Gasoline Blending Components ................. 10,389 – 151 10,238 72 – 0 0 0
Reformulated - RBOB ....................................... 0 – – – 0 – 0 0 –Conventional ..................................................... 10,389 – 151 10,238 72 – 0 0 0
CBOB ........................................................... 10,238 – – 10,238 53 – 0 0 0GTAB ............................................................ – – – – – – – – –Other ............................................................. 151 – 151 – 19 – 0 0 0
Renewable Fuels .................................................. 530 – – 530 0 207 0 0 0Fuel Ethanol ..................................................... 530 – – 530 0 – 0 0 0Renewable Diesel Fuel ..................................... – – – – 0 207 – 0 0Other Renewable Fuels .................................... – – – – – – – – –
Finished Motor Gasoline ....................................... 4,534 – – 4,534 264 – 0 0 0Reformulated .................................................... – – – – – – – – –
Reformulated Blended with Fuel Ethanol ..... – – – – – – – – –Reformulated Other ...................................... – – – – – – – – –
Conventional ..................................................... 4,534 – – 4,534 264 – 0 0 0Conventional Blended with Fuel Ethanol ...... – – – – – – – – –
Ed55 and Lower ....................................... – – – – – – – – –Greater than Ed55 .................................... – – – – – – – – –
Conventional Other ....................................... 4,534 – – 4,534 264 – 0 0 0Finished Aviation Gasoline ................................... 103 16 24 63 30 – 0 0 0Kerosene-Type Jet Fuel ....................................... 4,175 – – 4,175 – – 0 – 0Kerosene .............................................................. – – – – – – – – –Distillate Fuel Oil ................................................... 3,470 – – 3,470 258 – 0 0 0
15 ppm sulfur and under ................................... 3,470 – – 3,470 258 – 0 0 0Greater than 15 ppm to 500 ppm sulfur ............ – – – – – – – – –Greater than 500 ppm sulfur ............................. – – – – – – – – –
Residual Fuel Oil .................................................. – – – – 0 – – 0 0Less than 0.31 percent sulfur ........................... – – – – 0 – – 0 00.31 to 1.00 percent sulfur ................................ – – – – – – – – –Greater than 1.00 percent sulfur ....................... – – – – 0 – – 0 0
Petrochemical Feedstocks ................................... 36 – – 36 0 – 0 0 0Naphtha for Petrochemical Feedstock Use ...... 36 – – 36 0 – 0 0 0Other Oils for Petrochemical Feedstock Use ... – – – – 0 – – 0 0
Special Naphthas ................................................. – – – – 29 – – 0 0Lubricants ............................................................. 563 – 341 222 189 – 0 0 0Waxes ................................................................... – – – – – – – – –Marketable Petroleum Coke ................................. – – – – – – – – –Asphalt and Road Oil ............................................ 357 – – 357 248 – 0 0 0Miscellaneous Products ........................................ – – – – 8 – – 0 0
Total ......................................................................... 28,751 16 5,064 23,671 1,452 207 0 0 0
– = No Data Reported.1 Movements of crude oil, fuel ethanol and biodiesel include movements by rail. Movements of other products are by pipeline, tanker and barge only.2 Renewable diesel fuel includes biodiesel and other renewable diesel.
Sources: Energy Information Administration (EIA) Form EIA-817, "Monthly Tanker and Barge Movements Report."

Energy Information Administration/Petroleum Supply Monthly, 119 April 2018
Table 59. Movements of Crude Oil and Petroleum Products by Tanker and Barge Between PAD Districts, April 2018(Thousand Barrels) — Continued
Commodity
From 3 to From 5 to
1 NewEngland
CentralAtlantic
LowerAtlantic 2 5 1 2 3
Crude Oil1 ................................................................ 4,548 – 4,548 – 0 – 0 0 0
Petroleum Products2 .............................................. 24,203 16 516 23,671 1,452 207 0 0 0Natural Gas Liquids .............................................. 46 – – 46 – – 0 – 0
Ethane .............................................................. – – – – – – – – –Propane ............................................................ 46 – – 46 – – 0 – 0Normal Butane .................................................. – – – – – – – – –Isobutane .......................................................... – – – – – – – – –Natural Gasoline ............................................... – – – – – – – – –
Unfinished Oils ..................................................... 0 – – – 354 – 0 0 0Motor Gasoline Blending Components ................. 10,389 – 151 10,238 72 – 0 0 0
Reformulated - RBOB ....................................... 0 – – – 0 – 0 0 –Conventional ..................................................... 10,389 – 151 10,238 72 – 0 0 0
CBOB ........................................................... 10,238 – – 10,238 53 – 0 0 0GTAB ............................................................ – – – – – – – – –Other ............................................................. 151 – 151 – 19 – 0 0 0
Renewable Fuels .................................................. 530 – – 530 0 207 0 0 0Fuel Ethanol ..................................................... 530 – – 530 0 – 0 0 0Renewable Diesel Fuel ..................................... – – – – 0 207 – 0 0Other Renewable Fuels .................................... – – – – – – – – –
Finished Motor Gasoline ....................................... 4,534 – – 4,534 264 – 0 0 0Reformulated .................................................... – – – – – – – – –
Reformulated Blended with Fuel Ethanol ..... – – – – – – – – –Reformulated Other ...................................... – – – – – – – – –
Conventional ..................................................... 4,534 – – 4,534 264 – 0 0 0Conventional Blended with Fuel Ethanol ...... – – – – – – – – –
Ed55 and Lower ....................................... – – – – – – – – –Greater than Ed55 .................................... – – – – – – – – –
Conventional Other ....................................... 4,534 – – 4,534 264 – 0 0 0Finished Aviation Gasoline ................................... 103 16 24 63 30 – 0 0 0Kerosene-Type Jet Fuel ....................................... 4,175 – – 4,175 – – 0 – 0Kerosene .............................................................. – – – – – – – – –Distillate Fuel Oil ................................................... 3,470 – – 3,470 258 – 0 0 0
15 ppm sulfur and under ................................... 3,470 – – 3,470 258 – 0 0 0Greater than 15 ppm to 500 ppm sulfur ............ – – – – – – – – –Greater than 500 ppm sulfur ............................. – – – – – – – – –
Residual Fuel Oil .................................................. – – – – 0 – – 0 0Less than 0.31 percent sulfur ........................... – – – – 0 – – 0 00.31 to 1.00 percent sulfur ................................ – – – – – – – – –Greater than 1.00 percent sulfur ....................... – – – – 0 – – 0 0
Petrochemical Feedstocks ................................... 36 – – 36 0 – 0 0 0Naphtha for Petrochemical Feedstock Use ...... 36 – – 36 0 – 0 0 0Other Oils for Petrochemical Feedstock Use ... – – – – 0 – – 0 0
Special Naphthas ................................................. – – – – 29 – – 0 0Lubricants ............................................................. 563 – 341 222 189 – 0 0 0Waxes ................................................................... – – – – – – – – –Marketable Petroleum Coke ................................. – – – – – – – – –Asphalt and Road Oil ............................................ 357 – – 357 248 – 0 0 0Miscellaneous Products ........................................ – – – – 8 – – 0 0
Total ......................................................................... 28,751 16 5,064 23,671 1,452 207 0 0 0
– = No Data Reported.1 Movements of crude oil, fuel ethanol and biodiesel include movements by rail. Movements of other products are by pipeline, tanker and barge only.2 Renewable diesel fuel includes biodiesel and other renewable diesel.
Sources: Energy Information Administration (EIA) Form EIA-817, "Monthly Tanker and Barge Movements Report."
Table 60. Movements of Crude Oil and Selected Products by Rail Between PAD Districts, April 2018(Thousand Barrels)
CommodityFrom 1 to From 2 to
2 3 4 5 1 3 4 5
Crude Oil ............................................. 0 0 0 0 2,942 0 0 3,334
Propane ............................................... 293 129 0 0 1,068 1,221 0 198
Propylene ............................................ 0 0 – – 247 490 – –
Normal Butane .................................... 289 37 0 0 342 185 0 225
Isobutane ............................................. 170 11 0 0 272 49 0 87
Fuel Ethanol ........................................ 0 0 0 0 10,854 5,641 375 4,073
Biodiesel .............................................. 0 0 0 0 236 246 20 158
Marketable Petroleum Coke .............. 0 0 0 0 242 708 0 0
Asphalt and Road Oil ......................... 0 0 0 0 569 260 0 183
CommodityFrom 3 to From 4 to
1 2 4 5 1 2 3 5
Crude Oil ............................................. 0 0 0 53 0 0 764 94
Propane ............................................... 1 17 0 0 0 0 0 145
Propylene ............................................ 0 0 – – 0 0 0 –
Normal Butane .................................... 20 17 0 31 0 0 0 87
Isobutane ............................................. 12 94 0 10 0 0 0 40
Fuel Ethanol ........................................ 0 0 0 445 0 0 0 0
Biodiesel .............................................. 0 0 0 17 0 0 0 0
Marketable Petroleum Coke .............. 0 0 0 0 0 57 301 38
Asphalt and Road Oil ......................... 125 20 0 192 0 127 166 312
CommodityFrom 5 to
1 2 3 4
Crude Oil ............................................. 0 0 0 0
Propane ............................................... 0 0 0 0
Propylene ............................................ 0 0 0 –
Normal Butane .................................... 0 0 0 0
Isobutane ............................................. 0 0 0 0
Fuel Ethanol ........................................ 0 0 0 0
Biodiesel .............................................. 0 0 0 0
Marketable Petroleum Coke .............. 0 0 53 25
Asphalt and Road Oil ......................... 0 0 21 0
– = No Data Reported.Source: Rail Movements are estimates based on EIA analysis of data from the Surface Transportation Board and other information.

Energy Information Administration/Petroleum Supply Monthly,120 April 2018
Table 61. Movements of Crude Oil by Pipeline, Tanker, Barge and Rail between PAD Districts, April 2018(Thousand Barrels)
PADD Pipeline Tanker and Barge Rail Total
From 1 to2 ............................................................................ 98 133 0 2313 ............................................................................ 79 129 0 2084 ............................................................................ 0 – 0 05 ............................................................................ – – 0 0
From 2 to1 ............................................................................ 289 305 2,942 3,5363 ............................................................................ 44,833 1,894 0 46,7274 ............................................................................ 7,084 – 0 7,0845 ............................................................................ – – 3,334 3,334
From 3 to1 ............................................................................ 175 4,548 0 4,7232 ............................................................................ 24,473 0 0 24,4734 ............................................................................ 0 – 0 05 ............................................................................ – – 53 53
From 4 to1 ............................................................................ 0 0 0 02 ............................................................................ 22,297 0 0 22,2973 ............................................................................ 377 0 764 1,1415 ............................................................................ – – 94 94
From 5 to1 ............................................................................ 0 0 0 02 ............................................................................ 0 0 0 03 ............................................................................ 0 0 0 04 ............................................................................ 0 – 0 0
– = No Data Reported.Sources: Energy Information Administration (EIA) Forms EIA-813, "Monthly Crude Oil Report," EIA-817, "Monthly Tanker and Barge Movements Report." Rail movements estimates based on EIA analysis of data fromthe Surface Transportation Board and other information.

Energy Information Administration/Petroleum Supply Monthly, 121 April 2018
Table 61. Movements of Crude Oil by Pipeline, Tanker, Barge and Rail between PAD Districts, April 2018(Thousand Barrels)
PADD Pipeline Tanker and Barge Rail Total
From 1 to2 ............................................................................ 98 133 0 2313 ............................................................................ 79 129 0 2084 ............................................................................ 0 – 0 05 ............................................................................ – – 0 0
From 2 to1 ............................................................................ 289 305 2,942 3,5363 ............................................................................ 44,833 1,894 0 46,7274 ............................................................................ 7,084 – 0 7,0845 ............................................................................ – – 3,334 3,334
From 3 to1 ............................................................................ 175 4,548 0 4,7232 ............................................................................ 24,473 0 0 24,4734 ............................................................................ 0 – 0 05 ............................................................................ – – 53 53
From 4 to1 ............................................................................ 0 0 0 02 ............................................................................ 22,297 0 0 22,2973 ............................................................................ 377 0 764 1,1415 ............................................................................ – – 94 94
From 5 to1 ............................................................................ 0 0 0 02 ............................................................................ 0 0 0 03 ............................................................................ 0 0 0 04 ............................................................................ 0 – 0 0
– = No Data Reported.Sources: Energy Information Administration (EIA) Forms EIA-813, "Monthly Crude Oil Report," EIA-817, "Monthly Tanker and Barge Movements Report." Rail movements estimates based on EIA analysis of data fromthe Surface Transportation Board and other information.
Table 62. Net Movements of Crude Oil and Petroleum Products by Pipeline, Tanker, Barge and Rail Between PAD Districts, April 2018(Thousand Barrels)
Commodity
PAD District 1 PAD District 2 PAD District 3
Receipts ShipmentsNet
Receipts Receipts ShipmentsNet
Receipts Receipts ShipmentsNet
Receipts
Crude Oil1 ................................................................ 8,259 439 7,820 47,001 60,681 -13,680 48,076 29,249 18,827
Petroleum Products2 .............................................. 119,578 17,371 102,207 41,944 66,890 -24,946 46,305 124,205 -77,900Natural Gas Liquids .............................................. 4,484 7,838 -3,354 23,890 31,331 -7,441 32,718 10,566 22,152
Ethane .............................................................. 0 5,462 -5,462 7,713 11,670 -3,957 14,073 726 13,347Propane ............................................................ 3,838 1,262 2,576 4,860 13,545 -8,685 12,130 2,158 9,972Normal Butane .................................................. 362 439 -77 1,917 3,402 -1,485 3,128 297 2,831Isobutane .......................................................... 284 445 -161 1,493 1,358 135 1,301 529 772Natural Gasoline ............................................... 0 230 -230 7,907 1,356 6,551 2,086 6,856 -4,770
Refinery Olefins .................................................... 247 0 247 0 737 -737 490 0 490Ethylene ............................................................ – – – – – – 0 0 –Propylene ......................................................... 247 0 247 0 737 -737 490 0 490Butylene ............................................................ 0 0 – 0 0 – 0 0 –Isobutylene ....................................................... 0 0 – 0 0 – 0 0 –
Unfinished Oils ..................................................... 0 27 -27 381 805 -424 805 354 451Motor Gasoline Blending Components ................. 52,474 6,596 45,878 10,103 4,237 5,866 1,907 58,565 -56,658
Reformulated - RBOB ....................................... 6,875 0 6,875 1,523 370 1,153 186 10,671 -10,485Conventional ..................................................... 45,599 6,596 39,003 8,580 3,867 4,713 1,721 47,894 -46,173
CBOB ........................................................... 45,448 6,460 38,988 8,501 3,409 5,092 1,127 47,664 -46,537GTAB ............................................................ 0 0 – – – – – – –Other ............................................................. 151 136 15 79 458 -379 594 230 364
Renewable Fuels .................................................. 11,619 0 11,619 0 22,492 -22,492 6,776 1,199 5,576Fuel Ethanol ..................................................... 11,384 0 11,384 0 21,796 -21,796 6,494 975 5,519Renewable Diesel Fuel ..................................... 236 0 236 0 695 -695 282 224 58Other Renewable Fuels .................................... – – – – – – 0 0 –
Finished Motor Gasoline ....................................... 8,079 121 7,958 835 1,005 -170 176 7,955 -7,779Reformulated .................................................... 0 0 – 0 0 – 0 0 –
Reformulated Blended with Fuel Ethanol ..... 0 0 – 0 0 – 0 0 –Reformulated Other ...................................... – – – – – – – – –
Conventional ..................................................... 8,079 121 7,958 835 1,005 -170 176 7,955 -7,779Conventional Blended with Fuel Ethanol ...... 0 0 – 0 0 – 0 0 –
Ed55 and Lower ....................................... 0 0 – 0 0 – 0 0 –Greater than Ed55 .................................... 0 0 – 0 0 – 0 0 –
Conventional Other ....................................... 8,079 121 7,958 835 1,005 -170 176 7,955 -7,779Finished Aviation Gasoline ................................... 103 0 103 30 0 30 0 133 -133Kerosene-Type Jet Fuel ....................................... 15,627 255 15,372 1,488 786 702 60 17,037 -16,977Kerosene .............................................................. 0 0 – 0 0 – 0 0 –Distillate Fuel Oil ................................................... 25,006 2,534 22,472 4,539 2,614 1,925 990 26,628 -25,638
15 ppm sulfur and under ................................... 22,244 2,534 19,710 4,426 2,614 1,812 990 23,753 -22,763Greater than 15 ppm to 500 ppm sulfur ............ 0 0 – 113 0 113 0 113 -113Greater than 500 ppm sulfur ............................. 2,762 0 2,762 0 0 – 0 2,762 -2,762
Residual Fuel Oil .................................................. 0 0 – 0 613 -613 613 0 613Petrochemical Feedstocks ................................... 36 0 36 0 113 -113 113 36 77
Naphtha for Petrochemical Feedstock Use ...... 36 0 36 0 90 -90 90 36 54Other Oils for Petrochemical Feedstock Use ... – – – 0 23 -23 23 0 23
Special Naphthas ................................................. 0 0 – 29 0 29 0 29 -29Lubricants ............................................................. 563 0 563 189 0 189 0 752 -752Waxes ................................................................... 0 0 – 0 0 – 0 0 –Marketable Petroleum Coke ................................. 242 0 242 57 950 -893 1,061 0 1,061Asphalt and Road Oil ............................................ 1,097 0 1,097 395 1,208 -813 596 943 -347Miscellaneous Products ........................................ 0 0 – 8 0 8 0 8 -8
Total ......................................................................... 127,837 17,810 110,027 88,945 127,571 -38,626 94,381 153,454 -59,073
See footnotes at end of table.

Energy Information Administration/Petroleum Supply Monthly,122 April 2018
Table 62. Net Movements of Crude Oil and Petroleum Products by Pipeline, Tanker, Barge and Rail Between PAD Districts, April 2018(Thousand Barrels) — Continued
Commodity
PAD District 4 PAD District 5
Receipts ShipmentsNet
Receipts Receipts ShipmentsNet
Receipts
Crude Oil1 ................................................................ 7,084 23,532 -16,448 3,480 0 3,480
Petroleum Products2 .............................................. 6,753 19,355 -12,602 13,340 98 13,241Natural Gas Liquids .............................................. 3,604 15,785 -12,181 824 0 824
Ethane .............................................................. 553 4,481 -3,928 0 0 –Propane ............................................................ 1,710 5,916 -4,206 343 0 343Normal Butane .................................................. 732 2,345 -1,613 344 0 344Isobutane .......................................................... 269 1,152 -883 137 0 137Natural Gasoline ............................................... 340 1,891 -1,551 0 0 –
Refinery Olefins .................................................... 0 0 – 0 0 –Ethylene ............................................................ – – – – – –Propylene ......................................................... 0 0 – 0 0 –Butylene ............................................................ 0 0 – 0 0 –Isobutylene ....................................................... 0 0 – 0 0 –
Unfinished Oils ..................................................... 0 0 – 0 0 –Motor Gasoline Blending Components ................. 1,303 1,248 55 4,859 0 4,859
Reformulated - RBOB ....................................... – – – 2,457 0 2,457Conventional ..................................................... 1,303 1,248 55 2,402 0 2,402
CBOB ........................................................... 1,303 1,248 55 2,402 0 2,402GTAB ............................................................ – – – 0 0 –Other ............................................................. 0 0 – 0 0 –
Renewable Fuels .................................................. 395 0 395 4,901 0 4,901Fuel Ethanol ..................................................... 375 0 375 4,519 0 4,519Renewable Diesel Fuel ..................................... 20 0 20 382 0 382Other Renewable Fuels .................................... – – – 0 0 –
Finished Motor Gasoline ....................................... 135 865 -730 721 0 721Reformulated .................................................... – – – 0 0 –
Reformulated Blended with Fuel Ethanol ..... – – – 0 0 –Reformulated Other ...................................... – – – – – –
Conventional ..................................................... 135 865 -730 721 0 721Conventional Blended with Fuel Ethanol ...... 0 0 – 0 0 –
Ed55 and Lower ....................................... 0 0 – 0 0 –Greater than Ed55 .................................... 0 0 – 0 0 –
Conventional Other ....................................... 135 865 -730 721 0 721Finished Aviation Gasoline ................................... 0 0 – 0 0 –Kerosene-Type Jet Fuel ....................................... 618 24 594 309 0 309Kerosene .............................................................. 0 0 – 0 0 –Distillate Fuel Oil ................................................... 673 433 240 1,001 0 1,001
15 ppm sulfur and under ................................... 673 393 280 961 0 961Greater than 15 ppm to 500 ppm sulfur ............ 0 40 -40 40 0 40Greater than 500 ppm sulfur ............................. 0 0 – 0 0 –
Residual Fuel Oil .................................................. 0 0 – 0 0 –Petrochemical Feedstocks ................................... – – – 0 0 –
Naphtha for Petrochemical Feedstock Use ...... – – – 0 0 –Other Oils for Petrochemical Feedstock Use ... – – – – – –
Special Naphthas ................................................. – – – 0 0 –Lubricants ............................................................. 0 0 – 0 0 –Waxes ................................................................... 0 0 – 0 0 –Marketable Petroleum Coke ................................. 25 396 -371 38 78 -40Asphalt and Road Oil ............................................ 0 604 -604 687 21 666Miscellaneous Products ........................................ 0 0 – 0 0 –
Total ......................................................................... 13,837 42,887 -29,050 16,820 98 16,722
– = No Data Reported.1 Movements of crude oil, fuel ethanol and biodiesel include movements by rail. Movements of other products are by pipeline, tanker and barge only.2 Renewable diesel fuel includes biodiesel and other renewable diesel.
Sources: Energy Information Administration (EIA) Forms EIA-812, "Monthly Product Pipeline Report," EIA-813, "Monthly Crude Oil Report," EIA-817, "Monthly Tanker and Barge Movements Report." Rail netmovements estimates based on EIA analysis of data from the Surface Transportation Board and other information.

Energy Information Administration/Petroleum Supply Monthly, 123 April 2018
Table 62. Net Movements of Crude Oil and Petroleum Products by Pipeline, Tanker, Barge and Rail Between PAD Districts, April 2018(Thousand Barrels) — Continued
Commodity
PAD District 4 PAD District 5
Receipts ShipmentsNet
Receipts Receipts ShipmentsNet
Receipts
Crude Oil1 ................................................................ 7,084 23,532 -16,448 3,480 0 3,480
Petroleum Products2 .............................................. 6,753 19,355 -12,602 13,340 98 13,241Natural Gas Liquids .............................................. 3,604 15,785 -12,181 824 0 824
Ethane .............................................................. 553 4,481 -3,928 0 0 –Propane ............................................................ 1,710 5,916 -4,206 343 0 343Normal Butane .................................................. 732 2,345 -1,613 344 0 344Isobutane .......................................................... 269 1,152 -883 137 0 137Natural Gasoline ............................................... 340 1,891 -1,551 0 0 –
Refinery Olefins .................................................... 0 0 – 0 0 –Ethylene ............................................................ – – – – – –Propylene ......................................................... 0 0 – 0 0 –Butylene ............................................................ 0 0 – 0 0 –Isobutylene ....................................................... 0 0 – 0 0 –
Unfinished Oils ..................................................... 0 0 – 0 0 –Motor Gasoline Blending Components ................. 1,303 1,248 55 4,859 0 4,859
Reformulated - RBOB ....................................... – – – 2,457 0 2,457Conventional ..................................................... 1,303 1,248 55 2,402 0 2,402
CBOB ........................................................... 1,303 1,248 55 2,402 0 2,402GTAB ............................................................ – – – 0 0 –Other ............................................................. 0 0 – 0 0 –
Renewable Fuels .................................................. 395 0 395 4,901 0 4,901Fuel Ethanol ..................................................... 375 0 375 4,519 0 4,519Renewable Diesel Fuel ..................................... 20 0 20 382 0 382Other Renewable Fuels .................................... – – – 0 0 –
Finished Motor Gasoline ....................................... 135 865 -730 721 0 721Reformulated .................................................... – – – 0 0 –
Reformulated Blended with Fuel Ethanol ..... – – – 0 0 –Reformulated Other ...................................... – – – – – –
Conventional ..................................................... 135 865 -730 721 0 721Conventional Blended with Fuel Ethanol ...... 0 0 – 0 0 –
Ed55 and Lower ....................................... 0 0 – 0 0 –Greater than Ed55 .................................... 0 0 – 0 0 –
Conventional Other ....................................... 135 865 -730 721 0 721Finished Aviation Gasoline ................................... 0 0 – 0 0 –Kerosene-Type Jet Fuel ....................................... 618 24 594 309 0 309Kerosene .............................................................. 0 0 – 0 0 –Distillate Fuel Oil ................................................... 673 433 240 1,001 0 1,001
15 ppm sulfur and under ................................... 673 393 280 961 0 961Greater than 15 ppm to 500 ppm sulfur ............ 0 40 -40 40 0 40Greater than 500 ppm sulfur ............................. 0 0 – 0 0 –
Residual Fuel Oil .................................................. 0 0 – 0 0 –Petrochemical Feedstocks ................................... – – – 0 0 –
Naphtha for Petrochemical Feedstock Use ...... – – – 0 0 –Other Oils for Petrochemical Feedstock Use ... – – – – – –
Special Naphthas ................................................. – – – 0 0 –Lubricants ............................................................. 0 0 – 0 0 –Waxes ................................................................... 0 0 – 0 0 –Marketable Petroleum Coke ................................. 25 396 -371 38 78 -40Asphalt and Road Oil ............................................ 0 604 -604 687 21 666Miscellaneous Products ........................................ 0 0 – 0 0 –
Total ......................................................................... 13,837 42,887 -29,050 16,820 98 16,722
– = No Data Reported.1 Movements of crude oil, fuel ethanol and biodiesel include movements by rail. Movements of other products are by pipeline, tanker and barge only.2 Renewable diesel fuel includes biodiesel and other renewable diesel.
Sources: Energy Information Administration (EIA) Forms EIA-812, "Monthly Product Pipeline Report," EIA-813, "Monthly Crude Oil Report," EIA-817, "Monthly Tanker and Barge Movements Report." Rail netmovements estimates based on EIA analysis of data from the Surface Transportation Board and other information.
The following are the Refining Districts which make up the PetroleumAdministration for Defense (PAD) Districts.
PAD District I
East Coast: The District of Columbia and the States of Maine, New Hampshire, Vermont, Massachusetts, Rhode Island, Connecticut, New Jersey, Delaware, Maryland, Virginia, North Carolina, South Carolina, Georgia, Florida, and the following counties of the State of New York: Cayuga, Tompkins, Chemung, and all counties east and north thereof. Also the following counties in the State of Pennsylvania: Bradford, Sullivan, Columbia, Montour, Northumberland, Dauphin, York, and all counties east thereof.
Appalachian No. 1: The State of West Virginia and those parts of theStates of Pennsylvania and New York not included in the East Coast District.
Sub-PAD District I
New England: The States of Connecticut, Maine, Massachusetts, NewHampshire, Rhode Island, and Vermont.
Central Atlantic: The District of Columbia and the States of Delaware,Maryland, New Jersey, New York, and Pennsylvania.
Lower Atlantic: The States of Florida, Georgia, North Carolina, SouthCarolina, Virginia and West Virginia.
PAD District II
Indiana-Illinois-Kentucky: The States of Indiana, Illinois, Kentucky, Tennessee, Michigan, and Ohio.
Minnesota-Wisconsin-North and South Dakota: The States of Minnesota, Wisconsin, North Dakota, and South Dakota.
Oklahoma-Kansas-Missouri: The States of Oklahoma, Kansas, Missouri, Nebraska, and Iowa.
PAD District III
Texas Inland: The State of Texas except the Texas Gulf Coast District.
Texas Gulf Coast: The following counties of the State of Texas: Newton, Orange, Jefferson, Jasper, Tyler, Hardin, Liberty, Chambers, Polk, San Jacinto, Montgomery, Harris, Galveston, Waller, Fort Bend, Brazoria, Wharton, Matagorda, Jackson, Victoria, Calhoun, Refugio, Aransas, San Patricio, Nueces, Kleberg, Kenedy, Willacy, and Cameron.
Louisiana Gulf Coast: The following Parishes of the State of Louisiana: Vernon, Rapides, Avoyelles, Pointe Coupee, West Feliciana, East Feliciana, Saint Helena, Tangipahoa, Washington, and all Parishes south thereof. Also the following counties of the State of Mississippi: Pearl River, Stone, George, Hancock, Harrison, and Jackson. Also the following counties of the State of Alabama: Mobile and Baldwin.
North Louisiana-Arkansas: The State of Arkansas and those parts of the States of Louisiana, Mississippi, and Alabama not included in the Louisiana Gulf Coast District.
New Mexico: The State of New Mexico.
PAD District IV
Rocky Mountain: The States of Montana, Idaho, Wyoming, Utah, and Colorado.
PAD District V
West Coast: The States of Washington, Oregon, California, Nevada, Arizona, Alaska, and Hawaii.
Appendix A
District Descriptions and Maps

Energy Information Administration/Petroleum Supply Monthly,124 April 2018

Energy Information Administration/Petroleum Supply Monthly, 125 April 2018
Appendix B
PSM Explanatory Notes
PrefaceThe Petroleum Supply Monthly (PSM) is the monthly component of a series of three publications concerning the supply and disposition of crude oil and petroleum products produced by the Petroleum Division of the Energy Information Administration (EIA). The other two components are the Weekly Petroleum Status Report (WPSR) and the Petroleum Supply Annual (PSA). Together these publications present a comprehensive snapshot of petroleum supply data on a weekly, monthly and yearly basis.
Data presented in the PSM describe the supply and disposition of petroleum products in the United States and major U.S. geographic regions. The data series describe production, imports and exports, inter-Petroleum Administration for Defense (PAD) District movements, and inventories by the primary suppliers of petroleum products in the United States (50 States and the District of Columbia). The reporting universe includes those petroleum sectors in primary supply: petroleum refiners, motor gasoline blenders, operators of natural gas processing plants and fractionators, inter-PAD District transporters, importers, and major inventory holders of petroleum products and crude oil. When aggregated, the data reported by these sectors approximately represent the consumption of petroleum products in the United States.
The PSM tables present statistics for the most current month available as well as year-to-date. In most cases, the statistics are presented for several geographic areas - the United States (50 States and the District of Columbia), five PAD Districts, and 12 Refining Districts. At the U.S. and PAD District level, the total volume and the daily rate of activities are presented. The statistics are developed from monthly survey forms submitted by respondents to the EIA and from data provided from other sources.
Final statistics for the data series published in the PSM are published in the PSA. The PSA is published approximately five months after the end of the report year.

Energy Information Administration/Petroleum Supply Monthly,126 April 2018
1. Overview
A. The Energy Information Administration’s Quality Guidelines
The data contained in the Petroleum Supply Monthly (PSM) are subject to separate information quality guidelines issued by the Office of Management and Budget (OMB), the Department of Energy (DOE), and Energy Information Administration (EIA). With available resources, EIA continually works to improve its systems in order to provide high quality information needed by public and private policymakers and decision makers. EIA has performance standards to ensure the quality (i.e., objectivity, utility, and integrity) of information it disseminates to the public. Quality is ensured and maximized at levels appropriate to the nature and timeliness of the disseminated information.
B. Concepts of Product Supply and Demand
Petroleum supply estimates contained in the PSM are often interpreted as an approximation of petroleum demand measured as product supplied. Product supplied is often called “implied” demand because it is a measure of demand that is implied by disappearance of petroleum products from facilities and activities in the “primary” supply chain. Facilities and activities in the primary supply chain include refineries and blending terminals, gas processing plants and fractionators, oxygenate producers, biodiesel producers, imports, exports, bulk storage terminals, and pipelines. Total product supplied in the PSM at the U.S. level is equal to the sum of field production, plus refinery and blender net production, plus renewable fuels, and oxygenate plant net production, plus imports, plus adjustments, minus stock change, minus refinery and blender net inputs, minus exports. Net receipts are added as a component of supply at the PAD District level. Crude oil product supplied is normally zero because crude oil is processed in refineries and rarely, if ever, used directly.
The secondary system is that portion of the overall distribution network that falls between producers and end-users. Product typically flows in bulk from the primary supply system into the secondary system before delivery in small quantities to consumers (the tertiary system). The secondary system includes storage at bulk plants; at retail motor fuel outlets, such as service stations, truck stops, and convenience stores; and at retail fuel oil dealers. Bulk plants are wholesale storage facilities that have less than 50,000 barrels of storage capacity and, by definition, receive product only by tank car or truck, not by barge, tanker, or pipeline. Tertiary inventories are held by end users and include fuel in vehicle tanks, heating oil in residential tanks, fuel oil held by utilities, jet fuel stored in facilities operated by end users, and certain proprietary storage of raw materials (e.g. propane) for the chemical industry.
Data users sometimes consider demand as sales to the ultimate consumer or as the actual consumption of the product. Since there may be time delays between the movement of product into the primary market and its ultimate purchase or consumption, these definitions of demand require data on changes in secondary and/or tertiary stocks or the assumption that these values either remain constant or are small
compared to primary supply. The most recent study of secondary stocks was done by the National Petroleum Council in 1989. This study revealed that secondary distillate stocks were equal to about 6.9 percent of distillate stocks and 6.7 percent of distillate storage capacity.
C. Components of Supply and Disposition
The detailed statistics tables in the PSM provide complete supply and disposition information for the current month and year to date. The tables are organized to locate National and Petroleum Administration for Defense (PAD) District supply and disposition data at the front followed by tables that contain detailed information on supply and disposition. These include tables on crude oil and petroleum product production, import/export data, stocks information, and lastly, data on crude oil and petroleum product movements. To assist in the interpretation of these tables, the following discussion of supply, disposition, and ending stocks as shown in Tables 1– 25 is provided. The categories and products are defined in the EIA Glossary.
(1.) Supply
a. Field Production - Total Field Production is the sum of crude oil production and natural gas plant liquids and liquefied refinery gases production.
Crude oil production is an estimate based on data received from State conservation agencies and the Mineral Management Service of the U.S. Department of the Interior. Refer to “Domestic Crude Oil Production” in Section 2C (1) for further details.
Field production of natural gas plant liquids is reported on Form EIA-816 and published on a net basis (i.e., production minus inputs).
b. Renewable Fuels and Oxygenate Plant Net Production - Renewable Fuels and Oxygenate Plant Net Production are reported on Forms EIA-819 and EIA-22M. Production includes oxygenates (fuel ethanol, ETBE, MTBE, and other oxygenates) plus negative production of pentanes plus, finished motor gasoline, and motor gasoline blending components added to fuel ethanol as denaturants as well as biodiesel. Negative production will occur when the amount of a product produced during the month is less than the amount of that same product that is reported as input during the same month.
c. Refinery and Blender Net Production – Refinery and Blender Net Production is reported on Form EIA-810 and EIA- 815. Refinery and Blender Net Production equals refinery and blenders production minus refinery and blender net inputs. Negative production of finished petroleum products will occur when the amount of a product produced during the month is less than the amount of that same product that is reprocessed (input) or reclassified to become another product during the
Appendix B. Explanatory Notes

Energy Information Administration/Petroleum Supply Monthly, 127 April 2018
same month.
d. Imports - Imports include receipts of goods into the 50 States and the District of Columbia from U.S. possessions and territories or from foreign countries.
e. Net Receipts – Net Receipts data are included in tables containing PAD District-level data to account for inter-PAD District movements of crude oil and petroleum products. Net receipts for a PAD District are calculated by subtracting shipments out of the PAD District from receipts into the PAD District. Net Movements of Crude Oil and Petroleum Products by Pipeline, Tanker, and Barge, and Rail between PAD Districts are shown in Table 60.
f. Adjustments – This column includes adjustment quantities for crude oil, fuel ethanol, motor gasoline blending components, biodiesel (included in “Renewable Fuels Except Fuel Ethanol”) and distillate fuel oil. Adjustment quantities are derived either to balance supply and disposition for selected products or to reclassify one product to another product. Product supplied is the balancing item for most products and is interpreted as an implied measure of petroleum demand. Adjustments are used in cases where it does not make sense to interpret the balancing item as demand. Reclassifications reported in the adjustments column may be implied by the supply and disposition balance or reported on surveys. Recall that supply at the U.S. level is equal to the sum of field production, renewable fuels and oxygenate plant net production, refinery and blender net production, imports, and adjustments. Disposition at the U.S. level is equal to the sum of stock change, refinery and blender net inputs, exports, and products supplied. At the PAD District level, supply components include net receipts equal to gross receipts from other PAD Districts minus gross shipments to other PAD Districts. In every case, supply must equal disposition. Applicable components of supply and disposition vary depending on the product or product group. Unless otherwise noted in Section 2C, adjustment calculations that balance supply and disposition equal disposition minus supply for the U.S. and for each PAD District.
(2.) Disposition
a. Stock Change – Stock Change is calculated as the difference between the current month Ending Stocks column and the Ending Stocks column in the prior month’s publication. A negative number indicates a decrease in stocks and a positive number indicates an increase in stocks.
b. Refinery and Blender Net Inputs – Refinery and Blender Net Inputs are inputs of crude oil and intermediate materials (unfinished oils, motor and aviation gasoline blending components, liquefied petroleum gases, pentanes plus, hydrogen, oxygenates, renewable fuels, and other hydrocarbons) that are processed at refineries or blended at terminals to produce finished petroleum products.
Crude oil input represents total crude oil (domestic and foreign) input to atmospheric crude oil distillation units and other refinery processing units (e.g. vacuum distillation units).
Inputs of natural gas plant liquids are refinery input of natural gas liquids received from natural gas plants for blending and processing. Published inputs of natural gas plant liquids are reported on a gross basis.
Inputs of unfinished oils, motor gasoline blending components, and aviation gasoline blending components are published on a net basis (i.e., refinery input minus refinery production). Negative inputs of unfinished oils and motor and aviation gasoline blending components will occur when the amount of a product produced during the month is greater than the amount of that same product that is input or reclassified to become another product during the same month.
c. Exports - Exports include shipments from the 50 States and the District of Columbia to Puerto Rico, the Virgin Islands, other U.S. possessions and territories and to foreign countries.
d. Products Supplied - Products supplied is equal to field production, plus renewable fuels and oxygenate plant net production, plus refinery and blender net production, plus imports, (plus net receipts on a PAD District basis), plus adjustments, minus stock change, minus refinery and blender net inputs, minus exports.
Product supplied value indicates those quantities of petroleum products supplied for domestic consumption. Occasionally, the result for a product is negative because total disposition of the product exceeds total supply. Negative product supplied may occur for a number of reasons: (1) product reclassification has not been reported; (2) data were misreported or reported late; (3) in the case of calculations on a PAD District basis, the figure for net receipts was inaccurate because the coverage of inter-PAD movements was incomplete; and (4) products such as gasoline blending components and unfinished oils have entered the primary supply channels with their production not having been reported, e.g., streams returned to refineries from petrochemical plants.
Beginning with data for January 2010, product supplied for crude oil is assumed equal to zero. Prior to January 1983, crude oil burned on leases and by pipelines as fuel was reported as either distillate or residual fuel oil and was included in product supplied for these products. From January 1983 through December 2009, crude oil product supplied was equal to crude oil used directly as reported on Form EIA-813 “Monthly Crude Oil Report.” Reporting of crude oil used directly was discontinued on Form EIA-813 after December 2009.
(3.) Ending Stocks
Ending stocks are primary stocks of crude oil and petroleum products held in storage as of 12 midnight on the last day of the month. Primary stocks include crude oil or petroleum products held in storage at refineries, natural gas processing plants, pipelines, tank farms, and bulk terminals. Crude oil that is in-transit by water from Alaska and crude oil stored in the Strategic Petroleum Reserve is included. Primary

Energy Information Administration/Petroleum Supply Monthly,128 April 2018
Crude oil that is in-transit by water from Alaska and crude oil stored in the Strategic Petroleum Reserve is included. Primary Stocks exclude stocks of foreign origin that are held in bonded warehouse storage. Primary stocks of petroleum products also exclude secondary stocks held by dealers and jobbers and tertiary stocks held by consumers. Product stocks held as reserves by federal and state agencies are excluded from primary stock quantities reported by EIA, but quantities held in selected government reserves are provided in Appendix D.
Primary stocks of crude oil included barrels held on producing sites (lease stocks) until June 2016. Primary stocks of crude oil excluded lease stocks beginning with release of PSM data for July 2016 on September 30, 2016. Historical crude oil stocks in Petroleum Navigator were revised beginning with data for January 2005 to exclude lease stocks. Petroleum Navigator data may be accessed from the following locations on the EIA web site.
http://www.eia.gov/dnav/pet/pet_sum_snd_d_nus_mbbl_m_cur.htmhttp://www.eia.gov/dnav/pet/pet_sum_crdsnd_k_m.htmhttp://www.eia.gov/dnav/pet/pet_stoc_typ_c_nus_EPC0_mbbl_m.htm
2. Components - Forms Discussions
The data presented in the PSM include data collected by the EIA on nine monthly petroleum supply surveys, export data obtained from the U. S. Bureau of the Census, and crude production data obtained from State conservation agencies and the Minerals Management Service of the U. S. Department of Interior.
A. Petroleum Supply Reporting System
The nine monthly petroleum supply surveys are part of the Petroleum Supply Reporting System (PSRS). The PSRS tracks the supply and disposition of crude oil, petroleum products, and natural gas liquids in the United States. The PSRS is organized into two data collection subsystems: the Weekly Petroleum Supply Reporting System (WPSRS) and the Monthly Petroleum Supply Reporting System (MPSRS). The WPSRS processes the data from the seven weekly surveys. The MPSRS includes nine monthly surveys and one annual survey. The survey forms that comprise the PSRS are:
1. EIA-800, “Weekly Refinery Report,”2. EIA-802, “Weekly Product Pipeline Report,”3. EIA-803, “Weekly Crude Oil Stocks Report,”4. EIA-804, “Weekly Imports Report,”5. EIA-805, “Weekly Terminal Blender Report,”6. EIA-809, “Weekly Oxygenate Report,”
8. EIA-22M, “Monthly Biodiesel Production Survey,” 9. EIA-810, “Monthly Refinery Report,” 10. EIA-812, “Monthly Product Pipeline Report,” 11. EIA-813, “Monthly Crude Oil Report,” 12. EIA-814, “Monthly Imports Report,” 13. EIA-815, “Monthly Terminal Blender Report.” 14. EIA-816, “Monthly Natural Gas Liquids Report” 15. EIA-817, “Monthly Tanker and Barge Movement Report” 16. EIA-819, “Monthly Oxygenate Report”
17. EIA-820, “Annual Refinery Report.”
Both weekly and monthly surveys are administered at six key points along the petroleum production and supply chain including refineries, fractionators, natural gas processing plants, bulk product storage and blending terminals, crude oil and product pipelines, crude oil stock holders, importers, and renewable fuel (biodiesel and fuel ethanol) and oxygenate producing plants. Monthly surveys also include inter-PAD District movements by pipelines, tankers, and barges. Weekly surveys do not capture petroleum movements. Respondents reporting on weekly surveys are sampled from among the respondents reporting on monthly surveys.
Annual U.S. refinery capacity data are collected on the Form EIA- 820, “Annual Refinery Report.” The EIA-820 data are published in the annual “Refinery Capacity Report.”
B. Monthly Supply Survey Description and Methodology
(1.) Description of Surveys Forms
Copies of the survey forms and instructions can be found at: http://www.eia.doe.gov/oil_gas/petroleum/survey_forms/pet_survey_forms.html
The Form EIA-22M “Monthly Biodiesel Production Survey” collects data on biodiesel plant location, operating status, annual production capacity, monthly biodiesel and co-product production, stocks, input of feedstocks, alcohol, and catalysts, and biodiesel sales.
The Form EIA-810, “Monthly Refinery Report,” collects data on refinery input and capacity, sulfur content and API gravity of crude oil, and data on supply (beginning stocks, receipts, and production) and disposition (inputs, shipments, fuel use and losses, and ending stocks) of crude oil and refined products. Working and shell storage capacity for selected products is collected on a semi-annual basis.
The Form EIA-812, “Monthly Product Pipeline Report,” collects data on end-of-month stocks and movements of petroleum products transported by pipeline. Intermediate movements for pipeline systems operating in more than two PAD Districts are included. Product pipeline tank storage capacity for selected products is collected on a semi-annual basis.
The Form EIA-813, “Monthly Crude Oil Report,” collects data on end-of-month stock levels of crude oil held at pipeline and tank farms (associated with the pipelines) and terminals operated by the reporting company. Also, crude oil consumed by pipelines and on leases as pump fuel, boiler fuel, etc., is reported. Data are reported on a PAD District basis. Total Alaskan crude oil stocks in-transit by water (including stocks held at transshipment terminals between Alaska and the continental United States) to the 50 States, the District of Columbia, Puerto Rico, and the Virgin Islands are also reported by the transporting company having custody of the stocks. Inter- PAD District movements of crude oil by pipeline are collected by the shipping and receiving PAD District. Intermediate movements for pipeline systems operating in more than two PAD Districts

Energy Information Administration/Petroleum Supply Monthly, 129 April 2018
are not included. Crude oil storage capacity of tank farms is collected on a semi-annual basis.
The Form EIA-814, “Monthly Imports Report,” collects data on imports of crude oil and petroleum products (1) into the 50 States and the District of Columbia, (2) into Puerto Rico, the Virgin Islands, and other U.S. possessions (Guam, Midway Islands, Wake Island, American Samoa, and Northern Mariana Islands), and (3) from Puerto Rico, the Virgin Islands, and other U.S. possessions into the 50 States and the District ofColumbia. Imports into Foreign Trade Zones located in the 50 States and the District of Columbia are considered imports into the 50 States and the District of Columbia. The type of commodity, port of entry, country of origin, quantity (thousand barrels), sulfur percent by weight, API gravity, and name and location of the processing or storage facility are reported. Sulfur percent by weight is requested for crude oil, crude oil burned as fuel, and residual fuel oil only. API gravity is requested for crude oil only. The name and location of the processing or storage facility is requested for crude oil, unfinished oils, and gasoline blending components only.
The Form EIA-815, “Monthly Terminal Blender Report,” collects data on the operations of all bulk terminals located in the 50 States, District of Columbia, Puerto Rico, the Virgin Islands, Guam, and other U. S. possessions. Beginning and end-of-month stocks, receipts, inputs, production, shipments, and fuel use and losses during the month are collected from operators of terminals. Working and shell storage capacity is collected on a semi-annual basis.
The Form EIA-816, “Monthly Natural Gas Liquids Report,” collects data on the operations of natural gas processing plants and fractionators. Beginning and end-of-month stocks, receipts, inputs, production, shipments, and plant fuel use and losses during the month are collected from operators of natural gas processing plants. End-of-month stocks are collected from fractionators.
The Form EIA-817, “Monthly Tanker and Barge Movement Report,” collects data on the movements of crude oil and petroleum products between PAD Districts. Data are reported by shipping and receiving PAD District and sub-PAD District. Shipments to and from the Panama Canal are also included if the shipment was delivered to the Canal.
The Form EIA-819, “Monthly Oxygenate Report” collects facility-level data on oxygenate inputs, production, gasoline blending at ethanol plants, and end-of-month stocks. Data on end-of-month stocks are reported on a custody basis regardless of ownership. Fuel ethanol storage capacity is collected on a semi-annual basis.
(2.) Frame
EIA maintains complete lists of respondents to its monthly surveys. Each survey has a list of companies and facilities required to submit petroleum activity data. This list is known as the survey frame. Frame maintenance procedures are used to monitor the status of petroleum companies and facilities
currently contained in each survey frame as well as to identify new members to be added to the frame. As a result, all known petroleum supply organizations falling within the definition of “Who Must Submit” participate in the survey.
The activities for frames maintenance are conducted on an ongoing basis. Monthly frames maintenance procedures focus on examining industry periodicals that report changes in status (births, deaths, sales, mergers, and acquisitions) of petroleum facilities producing, transporting, importing, and/or storing crude oil and petroleum products. Augmenting these sources are articles in newspapers, notices from respondents, and information received from survey systems operated by other offices. Survey managers review these sources regularly to monitor changes in company operations and to develop lists of potential respondents. These activities assure coverage of the reporting universe and maintain accurate facility information on addresses and ownership.
Respondents to Form EIA-22M “Monthly Biodiesel Production Survey” include operators of plants that produce biodiesel meeting ASTM D 6751-07B specifications and used for commercial purposes.
Respondents to Form EIA-810, “Monthly Refinery Report” include operators of all operating and idle petroleum refineries located in the 50 States, the District of Columbia, Puerto Rico, the Virgin Islands, Guam and other U.S. possessions.
Respondents to Form EIA-812, “Monthly Product Pipeline Report” include all product pipeline companies that carry petroleum products (including interstate, intrastate, and intra-company pipelines) in the 50 States and the District of Columbia.
Respondents to Form EIA-813, “Monthly Crude Oil Report” include all companies which carry or store 1,000 barrels or more of crude oil. Included in this survey are gathering and trunk pipeline companies (including interstate, intrastate, and intra-company pipelines), crude oil tank farm operators, and companies transporting Alaskan crude oil by water (to U.S. ports) in the 50 States and the District of Columbia.
Respondents to Form EIA-814, “Monthly Imports Report” include each importer of record (or Ultimate consignee in some situations regarding Canadian imports) that import crude oil or petroleum products (1) into the 50 States and the District of Columbia, (2) into Puerto Rico, the Virgin Islands and other U.S. possessions (Guam, Midway Islands, Wake Island, American Samoa, and Northern Mariana Islands), (3) into Foreign Trade Zones located in the 50 States and the District of Columbia and (4) from Puerto Rico, the Virgin Islands and other U.S. possessions into the 50 States and the District of Columbia. A report is required only if there has been an import during the month unless the importer has been selected as part of a sample to report every month regardless of activity.
Respondents to Form EIA-815, “Monthly Terminal Blender Report” include operators of all bulk terminals located in the 50 States, District of Columbia, Puerto Rico, the Virgin Islands,

Energy Information Administration/Petroleum Supply Monthly,130 April 2018
Guam, and other U. S. possessions must report. A bulk terminal is primarily used for storage, marketing, and often blending of petroleum products and has a total bulk storage capacity of 50,000 barrels or more, and/or receives petroleum products by tanker, barge, or pipeline. Bulk terminal facilities associated with a product pipeline are included.
Respondents to Form EIA-816, “Monthly Natural Gas Liquids Report” include operators of all facilities that extract liquid hydrocarbons from a natural gas stream (natural gas processing plant) and/or separate a liquid hydrocarbon stream into its component products (fractionator).
Respondents to Form EIA-817, “Monthly Tanker and Barge Movement Report” include all companies that have custody of crude oil or petroleum products transported by tanker or barge between Petroleum Administration for Defense Districts and all companies that have custody of crude oil or petroleum products originating from a PAD District and transported to the Panama Canal with the intent that the crude oil or petroleum products be further transported to another PAD District.
For purposes of this report, custody is defined as physical possession of crude oil or petroleum products on a company- owned tanker or barge. Also, companies that lease vessels or contract for the movement of crude oil or petroleum products on a tanker or barge between PAD Districts are considered to have custody.
Respondents to Form EIA-819, “Monthly Oxygenate Report” include all operators of facilities that produce (manufacture or distill) oxygenates (including MTBE plants, petrochemical plants, and refineries that produce oxygenates as part of their operations located in the 50 States and the District of Columbia.)
(3.) Collection
Survey data for the MPSRS are collected by facsimile, email, Internet using secure file transfer, and electronic transmission. All respondents must submit their data by the 20th calendar day following the end of the report month. Receipt of the reports is monitored using an automated respondent mailing list. Telephone follow-up calls are made to nonrespondents prior to the publication deadline. Respondents who are chronically late (i.e., 3 consecutive months) are notified by EIA by certified letter.
(4.) Processing and Micro Editing
Upon receipt, all reported data are transformed into a standard format and sent through a log-in and prescreening process to validate respondent control information and resolve any discrepancies. The data are then processed using generalized edit and imputation procedures. Automated editing procedures check current data for consistency with past data and for internal consistency (e.g., totals equal to the sums of the parts). After the edit failures are resolved and imputation performed for nonrespondents, preliminary tables are produced and used to identify anomalies. These tables show U.S. and PAD District estimates for the current month and the prior 4 years. Anomalies
result in further review of respondent data which in turn may result in additional flagged data and imputation.
(5.) Estimation and Imputation
TThe nine monthly supply surveys are census surveys. As such, the estimates using these data are the sum of the edited, reported data. Imputation is performed for companies that fail to file Forms EIA-22M, 810, 812, 813, 815, 816, and 819. For these companies, previous monthly values and values reported on the weekly survey forms are used if available. Data for nonrespondents to the Forms EIA-814 and 817 are not imputed because respondent-level data for these surveys are highly variable.
Adjustments are made to aggregate data from time to time. For example, unusual industry conditions, including fuel transitions, business practice shifts, or hurricane dislocations, may generate reporting anomalies and require adjustments. Measurement error and frame deficiencies may occasionally result in inconsistencies when individual respondent data are aggregated to publication levels and require adjustment. Monthly supply data are reviewed throughout the year and some estimates may be replaced with newly available or resubmitted respondent data in the Petroleum Supply Annual (PSA).
(6.) Macro Editing
Monthly data are compared to weekly data on a regular basis. Discrepancies between weekly and monthly data are documented and respondents are called when discrepancies are either large (usually over 300 thousand barrels) or consistent (e.g., weekly data are always lower than monthly data). In addition, a comparison of the data collected on the PSRS with other similar data series from sources outside of the EIA is performed on an ongoing basis. Results of selected data comparisons are published once a year in the feature article, “Comparison of Independent Statistics on Petroleum Supply.” Additional comparisons are made between survey data and model results. Data reported in the Petroleum Supply Monthly and Petroleum Supply Annual are routinely imputed to correct for cases where comparison with other data suggests errors in survey data.
(7.) Dissemination
The PSM data are normally released within 60 days of the close of the reference month. The PSM is available on the web at:
http://www.eia.gov/petroleum/supply/monthly/
Much of the PSM data are available on the web product, Petroleum Navigator. Petroleum Navigator provides an interface for accessing a comprehensive set of EIA’s petroleum data. Features include: downloadable spreadsheets containing complete data history, data tables which “pivot” to present different perspectives, and selection boxes to easily change the product, area, process, period, and unit of measure. Petroleum Navigator can be accessed at: http://www.eia.gov/petroleum/data.cfm

Energy Information Administration/Petroleum Supply Monthly, 131 April 2018
C. Derived Data
Due to the time constraints in publishing monthly petroleum supply statistics and the desire to reduce industry response burden, some of the statistics published in the PSM are obtained from sources other than the monthly supply surveys. These other sources include models to data and data from supplemental sources such as the Bureau of the Census.
(1.) Domestic Crude Oil Production
The interim estimate of U.S., PAD District, and state oil production for the current reference month, published in Tables 1 through 26 of the PSM, are based on:
(a.) crude oil production data from state government agencies and the Department of the Interior, Bureau of Safety and Environmental Enforcement; (b.) crude oil production data reported on Form EIA-914, “Monthly Crude Oil, Lease Condensate, and Natural Gas Production Report.” For some states, EIA uses current reported data from the state (chiefly Alaska). For the states of Arkansas, California, Colorado, Kansas, Louisiana, Montana, New Mexico, North Dakota, Ohio, Oklahoma, Pennsylvania, Texas, Utah, West Virginia, Wyoming, and the Federal Gulf of Mexico, EIA calculates an estimate by modeling the relationship between final state-level data from DrillingInfo, a third-party vendor of well-level data collected by state agencies, and data reported on the EIA- 914 survey using weighted least squares (WLS) linear regression. Additional explanation of the WLS estimation methodology is available. Estimates have to be made for crude oil production because complete and correct data from states may take from several months to over two years.
(c.) first purchase data reported on Form EIA-182 “Domestic Crude Oil First Purchase Report.” For the remaining states and areas (Alabama, Arizona, Federal Pacific Offshore, Florida, Idaho, Illinois, Indiana, Kentucky, Maryland, Michigan, Mississippi, Missouri, Nebraska, Nevada, New York, Oregon, South Dakota, Tennessee, and Virginia) EIA calculates an estimate by using the average lagged ratio (ALR) of the state reported data to EIA-182 data, applied to the current EIA-182 data. Additional explanation of the ALR estimation methodology is available.
State-level production estimates are published in Table 26, “Production of Crude Oil by PAD District and State.” Table 26 contains estimates for crude oil production for state and federal offshore areas reported by state agencies and the Bureau of Safety and Environmental Enforcement or estimated by EIA using the ALR or WLS methods discussed above. Every month, the monthly crude oil production estimates are updated in Table 26 of the Petroleum Supply Monthly (http:// www.eia.gov/petroleum/supply/monthly/) using reports from state agencies and the Bureau of Safety and Environmental Enforcement. The estimates are reported in the Petroleum
Navigator and the Petroleum Supply Monthly roughly 60 days after the production month.
(2.) Exports
The U.S. Bureau of the Census compiles the official U.S. export statistics. Exporters are required to file a “Shipper’s Export Declaration Document” with the U.S. Census Bureau. Each month the EIA receives aggregated export statistics from the U.S. Bureau of the Census (EM-522 and EM-594). Census export statistics used in the PSM reflect both government and non-governmental exports of domestic and foreign merchandise from the United States (the 50 States and the District of Columbia) to foreign countries and U.S. possessions, without regard to whether or not the exportation involves a commercial transaction. The following types of transactions are excluded from the statistics:
• Merchandise shipped in transit through the United States from one foreign country to another, when documented as such with U.S. Customs.
• Bunker fuels and other supplies and equipment for use on departing vessels, planes, or other carriers engaged in foreign trade.
The country of destination is defined as the country of ultimate destination or the country where the goods are to be consumed, further processed, or manufactured, as known to the shipper at the time of exportation. If the shipper does not know the country of ultimate destination, the shipment is credited to the last country to which the shipper knows that the merchandise will be shipped in the same form as it was when exported.
(3.) Movements of crude oil by railroad
The volume of crude oil, ethanol, biodiesel, propane, propylene, normal butane, and isobutane moving by railroad is calculated using several data sources including Carload Waybill Sample (CWS) data from the U.S. Surface Transportation Board (STB), data from the National Energy Board of Canada (NEB), data in EIA’s Oil and Gas Supply Module (OGSM) within the National Energy Modeling system (NEMS) for data prior to 2015, the EIA-915 survey starting in January 2015, and an estimation procedure developed by EIA for months in which data these data are not available.
Once the data necessary for calculating rail movements become available, which may take as long as 60 days after the end of a calendar quarter, EIA will revise the estimates made.
Movements of crude oil, ethanol, biodiesel, propane, propylene, normal butane, and isobutane by rail are based on EIA analysis of carload data from the STB CWS. Additional data from the NEB, OGSM, and the EIA-915 are used for estimating factors for converting carloads to barrels of crude oil. Carloads of ethanol, biodiesel, propane, propylene, normal butane, and isobutane are converted to barrels using data from the CWS.

Energy Information Administration/Petroleum Supply Monthly,132 April 2018
Carload data from the STB are available approximately 60 days after the end of each quarter. For example, carload data for the first quarter of each year are typically available by about June 1. Therefore, recent-month rail movements reported by EIA in the Petroleum Supply Monthly and Petroleum Navigator are modeled based on historical rail movement averages, medians, or correlations of rail movements derived from actual carload data with other regional supply data collected by EIA or other sources including field production, imports, refinery and blender inputs, movements other than rail, exports, and supply adjustments.
Estimates of rail movements are subject to revision on a monthly basis as new, more complete, and more accurate data become available. Monthly revisions will typically affect data available through Petroleum Navigator on the EIA web site for the current year and up to two prior years. To the extent that revisions are needed to data more than 2 years in the past, these revisions will be made once a year at the time when Petroleum Navigator tables are updated with final data for a year from the Petroleum Supply Annual. Petroleum Supply Monthly and Petroleum Supply Annual tables released as PDF files will not be revised.
(4.) Stocks of Crude Oil held on Producing Sites (Lease Stocks)
The adjustment for lease stocks was discontinued beginning with PSM data for July 2016 released on September 30, 2016 because EIA discontinued reporting crude oil stocks held on producing sites (lease stocks). The lease stock adjustment remains in all historical EIA lease stocks data.
This adjustment corrects for incomplete survey coverage of companies that store crude oil on leases. Up until 1983, monthly state government data on lease stocks were substituted for EIA data wherever possible in order to rectify the understatement of lease crude oil stocks. State data were available from three states - Texas, New Mexico, and Montana. To calculate the “lease adjustment,” a comparison between EIA reported data and the state government data was made and the difference added to the EIA data for the respective states.
In 1983, the EIA modified the Form EIA-813 to eliminate state data on crude oil stocks and began collecting crude oil stock data by Petroleum Administration for Defense (PAD) District. With this change, the “lease adjustment” could no longer be calculated on a state basis and was changed to a PAD District level. To adjust for this incomplete coverage, 10,300 thousand barrels of crude oil are added to PAD District 3 stocks and 330 thousand barrels are added to PAD District 4 stocks.
(5.) Trans-Alaska Pipeline System (TAPS) Natural Gas Plant Liquids (NGPL Adjustment)
The TAPS-NGPL adjustment corrects for overstatement of crude oil receipts and input at refineries due to NGPL injection into Alaskan crude oil transported in TAPS. Natural gas
processing plants in Alaska produce substantial volumes of NGPL that are added to crude oil transported through TAPS. Refiners have been unable to separate the volume of NGPL from Alaskan crude oil when reporting crude oil receipts and inputs to EIA. The TAPS-NGPL adjustment subtracts Alaskan NGPL production reported by selected gas processing plant operators from crude oil receipts and inputs reported by refiners. Adjusted NGPL production is added to refinery receipts and inputs of NGPL. The adjusted NGPL barrels are allocated to PAD Districts based on the regional distribution of receipts of Alaskan crude oil. Data most affected by the TAPS- NGPL adjustment are receipts and inputs of crude oil in PAD District 5 and receipts, inputs, and product supplied of butane and pentanes plus also in PAD District 5.
NGPL injections into crude oil transported in the TAPS started in 1987. The TAPS-NGPL adjustment was first applied to revised data reported in the Petroleum Supply Annual (PSA) for 1988.
(6.) Finished Motor Gasoline Adjustment
Adjustment quantities for finished motor gasoline are the sum of motor gasoline blending components, fuel ethanol, and methyl tertiary butyl ether (MTBE) adjustments reclassified to finished motor gasoline. Finished motor gasoline adjustment quantities are assumed to reflect gasoline blending activity that was not reported on surveys.
Note on MTBE Adjustment: The MTBE portion of the gasoline adjustment described in this section was only applied to Petroleum Supply Monthly (PSM) data for 2009. The MTBE portion of the gasoline adjustment was discontinued after further examination of the issue made clear the MTBE adjustment was not helpful in forming an accurate statistical representation of U.S. and regional gasoline supplies. The MTBE adjustment was not applied to gasoline supply and disposition data in years prior to 2009, nor was it applied to revised data for 2009 published in the Petroleum Supply Annual or in years after 2009. This note only applies to MTBE adjustments. MTBE blending that was reported on EIA surveys is reflected in U.S. and regional gasoline supply and disposition data. Other adjustments to gasoline supply and disposition data to account for motor gasoline blending components and fuel ethanol remain as described in this section.
◦ Adjustment quantities for finished reformulated motor gasoline include adjustments for reformulated blendstock for oxygenate blending (RBOB) plus a percentage of gasoline treated as blendstock (GTAB), “other” motor gasoline blending components, fuel ethanol, and MTBE. The quantity of GTAB and “other” motor gasoline blending components adjustments reclassified to finished reformulated motor gasoline is based on the ratio of finished reformulated motor gasoline net production divided by total finished motor gasoline net production reported on surveys by refiners and blenders in each

Energy Information Administration/Petroleum Supply Monthly, 133 April 2018
PAD District. Motor gasoline blending components adjustments reclassified to finished reformulated motor gasoline are further classified as blended with alcohol (i.e. fuel ethanol), blended with ether (i.e. MTBE), or non-oxygenated during 2009. Starting with data for January 2010, motor gasoline blending component adjustment quantities were classified only as blended with fuel ethanol and “other”. During 2009, RBOB adjustment quantities were classified based on the product description that included reference to the oxygenate to be blended. Beginning with data for January 2010, all RBOB is reported in one product category without reference to specific oxygenates, and all RBOB adjustment quantities are assumed blended with fuel ethanol. During 2009, adjustment quantities for GTAB and “other” motor gasoline blending components reclassified to finished reformulated gasoline were further classified as blended with ether, blended with alcohol, or non-oxygenated based on the ratio of production of these products in reported survey data. After determining adjustment quantities of motor gasoline blending components reclassified to each type of finished reformulated motor gasoline, portions of the fuel ethanol and MTBE adjustments were reclassified to reformulated motor gasoline. The fuel ethanol quantity reclassified to finished reformulated motor gasoline was determined using the ratio of fuel ethanol blended into finished motor gasoline calculated from fuel ethanol blending data reported on survey forms by PAD District. For example, if the calculated volumetric fuel ethanol blend ratio was 10%, then a quantity of the fuel ethanol adjustment sufficient to make a 10% blend with the available motor gasoline blending components is reclassified to finished reformulated motor gasoline, but the quantity of fuel ethanol cannot exceed the total quantity of the fuel ethanol adjustment. During 2009, a similar process was followed for allocating the MTBE adjustment to reformulated motor gasoline except the blend ratio was assumed to be 12% in all PAD Districts. Starting with data for January 2010, the entire MTBE adjustment quantity is assumed to be blended with finished conventional motor gasoline.
◦ Adjustment quantities for finished conventional motor gasoline include adjustments for conventional blendstock for oxygenate blending (CBOB) plus the portion of GTAB, “other” motor gasoline blending components, fuel ethanol and MTBE adjustments that were not reclassified to finished reformulated motor gasoline. The total adjustment to finished conventional motor gasoline is further classified as finished conventional gasoline blended with fuel ethanol and “other” finished conventional motor gasoline. The quantity of the finished conventional motor gasoline adjustment reclassified as finished conventional motor gasoline blended with fuel ethanol is determined using the quantity of the fuel ethanol adjustment allocated
to finished conventional motor gasoline and the fuel ethanol blend ratio calculated from fuel ethanol blending reported on surveys by PAD District. For example, if the fuel ethanol blend ratio calculated from survey data was 10% in a PAD District, then the total adjustment quantity of finished conventional motor gasoline in that PAD District would be 10 times the fuel ethanol adjustment quantity allocated to finished conventional gasoline (i.e. the adjustment to finished conventional motor gasoline blended with fuel ethanol includes 10% fuel ethanol and 90% gasoline from the motor gasoline blending components adjustment). The MTBE adjustment allocated to finished conventional motor gasoline is simply added to the adjustment for “other” finished conventional motor gasoline.
◦ Fuel ethanol adjustment quantities frequently exceed the volume of fuel ethanol needed to achieve a blend ratio implied by blending activity reported by refiners and blenders on surveys when considering only the gasoline barrels available from the motor gasoline blending components adjustment. In this case, “other” finished conventional motor gasoline is reclassified by the adjustment to finished conventional motor gasoline blended with alcohol in order to maintain an ethanol blend ratio equal to the fuel ethanol blend ratio reported by refiners and blenders in each PAD District.
(7.) Motor Gasoline Blending Components Adjustment
Adjustment quantities for motor gasoline blending components at the U.S. level equal the sum of stock change, refinery and blender net input, and exports minus the sum of imports and renewable fuels and oxygenate plant net production (i.e. motor gasoline blending components use as denaturant for fuel ethanol production). Adjustment quantities by PAD District equal the sum of stock change, refinery and blender net input, and exports minus the sum of imports, renewable fuels and oxygenate plant net production, and net receipts. Motor gasoline blending components adjustments are calculated for reformulated blendstock for oxygenate blending (RBOB), conventional blendstock for oxygenate blending (CBOB), gasoline treated as blendstock (GTAB), and “other” motor gasoline blending components. Product supplied for motor gasoline blending components is assumed to always equal zero because there is no end-user demand for motor gasoline blending components as anything other than finished motor gasoline. Motor gasoline blending components adjustment quantities are assumed to reflect finished motor gasoline blending implied by the supply and disposition balance but not reported on surveys. Adjustment quantities for motor gasoline blending components are reclassified to finished motor gasoline and added to the finished motor gasoline adjustment.
(8.) Renewable Fuels including Fuel Ethanol Adjustment
Adjustment quantities for renewable fuels (including fuel ethanol) at the U.S. level equal the sum of stock change, refinery and blender net input, and exports minus the sum

Energy Information Administration/Petroleum Supply Monthly,134 April 2018
of renewable fuels and oxygenate plant net production and imports. Calculation of adjustment quantities by PAD District depends on the product. Individual products include fuel ethanol, biomass based diesel fuel (including biodiesel), “other” renewable diesel fuel, and “other” renewable fuels (e.g. bio-jet fuel). Product supplied for renewable fuels (including fuel ethanol) is assumed equal to zero. Adjustments for fuel ethanol and “other” renewable fuels are discussed separately below.
◦ Fuel ethanol adjustment quantities at the U.S. level equal the sum of stock change, refinery and blender net input, and exports minus the sum of renewable fuels and oxygenate plant net production and imports. There are no survey data available for rail movements of fuel ethanol between PAD Districts, and so allocation of fuel ethanol adjustments to PAD Districts is based on the ratio of fuel ethanol blending reported on surveys in each PAD District divided by fuel ethanol blending reported on surveys for the entire U.S. In this case, Fuel ethanol implied net receipts are calculated for each PAD District as the sum of stock change, refinery and blender net input, and exports minus the sum of renewable fuels and oxygenate plant net production, imports, and adjustments. Fuel ethanol implied net receipts are the balancing item between total supply and disposition in each PAD District. Fuel ethanol adjustment quantities are assumed to reflect blending of fuel ethanol into finished motor gasoline that is implied by the available supply of fuel ethanol but not reported on surveys. Fuel ethanol adjustment volumes are reclassified to finished reformulated motor gasoline and finished conventional motor gasoline through finished motor gasoline adjustments.
◦ The product category called “renewable fuels except fuel ethanol” includes biomass-based diesel fuel (including biodiesel), “other” renewable diesel fuel, and “other” renewable fuels (e.g. bio-jet fuel). For PSM data prior to January 2012, renewable fuels except fuel ethanol adjustment quantities at the U.S. and PAD District levels were calculated as the sum of stock change, refinery and blender net input, and exports minus imports. Data for production of Renewable Fuels except Fuel Ethanol was unavailable and was excluded from Renewable Fuels and Oxygenate Plant Net Production. Therefore the calculation of adjustments to Renewable Fuels except Fuel Ethanol caused production to be included in the adjustment. Similarly, the calculation caused net inter-PAD District movements (i.e. net receipts) by rail and truck to also be included in adjustments to renewable fuels except fuel ethanol.
◦ Beginning with PSM data for January 2012, production of biodiesel reported on Form EIA-22M was included under the heading of “renewable fuels and oxygenate plant net production” in petroleum
supply and disposition balances for “renewable fuels except fuel ethanol”. As a result, the adjustment for “renewable fuels except fuel ethanol” no longer includes production of biodiesel. This change will also be made to revised monthly data for January- December 2011 when the 2011 Petroleum Supply Annual is released.
◦ Biodiesel adjustment quantities at the U.S. level equal the sum of stock change, refinery and blender net input, and exports minus the sum of renewable fuels and oxygenate plant net production and imports. There are no survey data available for rail movements of biodiesel between PAD Districts, and so allocation of fuel biodiesel adjustments to PAD Districts is based on the ratio of biomass-based diesel blending reported on surveys in each PAD District divided by biomass- based diesel fuel blending reported on surveys for the entire U.S. Biodiesel implied net receipts are calculated for each PAD District as the sum of stock change, refinery and blender net input, and exports minus the sum of renewable fuels and oxygenate plant net production, imports, and adjustments. Biodiesel implied net receipts are the balancing item between total supply and disposition in each PAD District. Biodiesel adjustment quantities are assumed to reflect blending of biodiesel into distillate fuel oil that is implied by the available supply of biodiesel but not reported as input on surveys. Biodiesel adjustment volumes are reclassified to distillate fuel oil (15 ppm sulfur and under) through distillate fuel oil adjustments.
(9.) Distillate Fuel Oil Adjustment
Adjustment quantities for distillate fuel oil show reclassification by pipeline operators of distillate fuel oil with sulfur content of 15 ppm and under to distillate fuel oil with sulfur content greater than 15 ppm to 500 ppm (inclusive). Reclassification may occur when distillate product with sulfur content of 15 ppm and under becomes mixed with products having higher sulfur content during pipeline transportation, storage, or handling. Adjustment quantities are reported by pipeline operators on Form EIA-812 “Monthly Product Pipeline Report.” This adjustment was discontinued after publication of data for December 2010
Beginning with PSM data for January 2012, distillate fuel oil adjustments equal the opposite of biodiesel adjustments described above in section 7. Biodiesel adjustments are added to distillate fuel oil (15 ppm sulfur and under) and to total distillate fuel oil. Distillate fuel oil adjustment quantities are assumed to reflect biodiesel blending activity implied by biodiesel supply and disposition but not reported on surveys. Distillate fuel oil adjustments for biodiesel will also be added to revised data for January-December 2011 when the 2011 Petroleum Supply Annual is released.

Energy Information Administration/Petroleum Supply Monthly, 135 April 2018
(10.) Crude Oil Adjustment
Adjustment quantities for crude oil are derived to balance crude oil supply and disposition. Crude oil product supplied was equal to crude oil used directly as reported on Form EIA-813 “Monthly Crude Oil Report” in data through December 2009. Reporting crude oil used directly was discontinued on Form EIA-813 after collection of data for December 2009. Crude oil product supplied is assumed equal to zero beginning with data for January 2010. Undercounting crude oil imports in survey data is one example of a typical cause of crude oil adjustments. This results in a positive crude oil adjustment because crude oil disposition (i.e. the sum of stock change, refiner inputs, and exports) will exceed available supply (i.e. the sum of field production and imports) due to import undercounting. Crude oil losses are included in crude oil adjustment quantities. The crude oil adjustment was formerly called unaccounted-for crude oil. The name change was effective with data for January 2005.
(11.) Other Hydrocarbon Adjustment
Adjustment quantities for “other” hydrocarbons equal the sum of stock change, refinery and blender net inputs and exports minus imports. “Other” hydrocarbons product supplied is assumed equal to zero. Adjustment quantities account for “other” hydrocarbons produced outside of refineries. There are no movements data collected on surveys for “other” hydrocarbons. Therefore, adjustment quantities include any net receipts of “other” hydrocarbons resulting from inter-PAD District movements.
(12.) Hydrogen Adjustment
Adjustment quantities for hydrogen equal refinery and blender net input of hydrogen. Hydrogen product supplied is assumed equal to zero. Adjustment quantities account for hydrogen supplied to U.S. refineries from non-refinery sources. There are no movements data collected on surveys for hydrogen. Therefore, adjustment quantities at the PAD District level include any net receipts of hydrogen resulting from inter-PAD District movements.
(13.) Oxygenates (excluding fuel ethanol) Adjustment
Adjustment quantities for oxygenates (excluding fuel ethanol) equal the sum of stock change, refinery and blender net inputs, and exports minus the sum of renewable fuels and oxygenate plant net production and imports. Product supplied for oxygenates (excluding fuel ethanol) is assumed equal to zero. Methyl tertiary butyl ether (MTBE) is the single largest component of oxygenates (excluding fuel ethanol).
3. Quality
A. General Discussion
(1.) Response Rates
The response rate is generally 98 to 100 percent. Average response rates for the monthly and weekly surveys are published in the annual PSM article “Accuracy of Petroleum Supply Data.” Chronic nonrespondents and late filing respondents are contacted in writing and reminded of their requirement to report. Companies that file late or fail to file are subject to criminal fines, civil penalties, and other sanctions as provided by Section 13(i) of the Federal Energy Administration (FEA) Act.
(2.) Non-sampling Errors
TThere are two types of errors usually associated with data produced from a survey; sampling errors and nonsampling errors. Because the estimates for the monthly surveys are based on a complete census of the frame, there is no sampling error in the data presented. The data, however, are subject to non- sampling errors. Non-sampling errors may arise from a number of sources including: (1) the inability to obtain data from all companies in the frame (non-response) and the method used to account for non-response, (2) response errors, (3) differences in the interpretation of questions or definitions, (4) mistakes in recording or coding of the data obtained from respondents, and (5) other errors of collection, response, coverage, processing, and estimation.
(3.) Resubmissions
Throughout the year, EIA accepts data revisions of monthly data. If a revision to a monthly submission is made after the PSM has been published, it is referred to as a resubmission. The final monthly values for the previous year are published in the PSA. These values reflect all PSM resubmissions and other data corrections. The values contained in the PSA are EIA’s most accurate measure of petroleum supply activity.
(4.) Revision Policy
EIA will publish revised monthly crude oil production estimates going back to the Previously published Petroleum Supply Annual every month in the Petroleum Supply Navigator (http:// www.eia.gov/petroleum/supply/monthly/). Once a year with the release of the Petroleum Supply Annual, EIA will revise up to 10 years of historical production estimates in the Petroleum Supply Navigator.

Energy Information Administration/Petroleum Supply Monthly,136 April 2018
B. Data Assessment
The principal objective of the PSRS is to provide an accurate picture of petroleum industry activities and of the availability of petroleum products nationwide from primary distribution channels. The PSM preliminary monthly data serve as leading indicators of the final monthly data published in the PSA. The PSM monthly data are not expected to have the same level of accuracy as the final monthly data published in the PSA. However, the preliminary monthly data are expected to exhibit like trends and product flow characteristic of the final monthly data.
To assess the accuracy of monthly statistics, initial monthly estimates published in the PSM are compared with the final monthly aggregates published in the PSA. Although final monthly data are still subject to error, they have been thoroughly reviewed and edited, they reflect all revisions made during the year, and they are considered to be the most accurate data available. The mean absolute percent error provides a measure of the average revisions relative to the aggregates being measured for a variable. The mean absolute percent error for 2007 monthly data was less than 1 percent for 50 of the 66 major petroleum variables analyzed.
4. Provisions Regarding Disclosure of Information
All PSRS survey forms, with the exception of the Form EIA-814, “Monthly Imports Report,” have the same general disclosure information statement. The information reported on Form EIA-814 will be considered “public information” and may be publicly released in company or individually identifiable form, and will not be protected from disclosure in identifiable form.
TThe information reported on Forms EIA-810 through 813, 815 through 817, 819, and 820 will be protected and not disclosed to the
public to the extent that it satisfies the criteria for exemption under the Freedom of Information Act (FOIA), 5 U.S.C. §552, the Department of Energy (DOE) regulations, 10 C.F.R. §1004.11, implementing the FOIA, and the Trade Secrets Act, 18 U.S.C. §1905. The Federal Energy Administration Act requires the EIA to provide company-specific data to other Federal agencies when requested for official use. The information reported on this form may also be made available, upon request, to another DOE component; to any Committee of Congress, the Government Accountability Office, or other Federal agencies authorized by law to receive such information. A court of competent jurisdiction may obtain this information in response to an order. The information may be used for any nonstatistical purposes such as administrative, regulatory, law enforcement, or adjudicatory purposes.
Disclosure limitation procedures are not applied to the statistical data published from this survey’s information. Thus, there may be some statistics that are based on data from fewer than three respondents, or that are dominated by data from one or two large respondents. In these cases, it may be possible for a knowledgeable person to estimate the information reported by a specific respondent.
In addition to the use of the information by EIA for statistical purposes, the information may be made available, upon request, to other Federal agencies authorized by law to receive such information for any nonstatistical purposes such as administrative, regulatory, law enforcement, or adjudicatory purposes.
Company specific data are also provided to other DOE offices for the purpose of examining specific petroleum operations in the context of emergency response planning and actual emergencies.

Energy Information Administration/Petroleum Supply Monthly, 137 April 2018
Appendix D
Northeast ReservesReserves inventories are not considered to be in the commercial sector and are excluded from EIA’s commercial motor gasoline and distillate fuel oil supply and disposition statistics, such as those reported in the Weekly Petroleum Status Report, Petroleum Supply Monthly, and This Week In Petroleum.
Northeast Home Heating Oil Reserve classified as ultra-low sulfur distillate (15 parts per million)
Terminal Operator Location Thousand Barrels
Buckeye Partners LP Port Reading, NJ 300
Buckeye Partners LP Groton, CT 300
Global Companies LLC Revere, MA 400
Source: U. S. Energy Information Administration
Northeast Regional Refined Petroleum Product Reserve motor gasoline products
Terminal Operator Location Thousand Barrels
BP Products North America Carteret, NJ 200
Buckeye Terminals LLC Port Reading, NJ 0
Buckeye Terminals LLC Raritan Bay, NJ 500
Global Companies LLC Revere, MA 200
South Portland Terminal LLC South Portland, ME 99
Source: U. S. Energy Information Administration
Other reserves information from the U.S. Department of Energy, Office of Petroleum Reserves can be found at http://energy.gov/fe/services/petroleum-reserves/
State of New York’s Strategic Fuels Reserve ProgramState reserve inventories are also not considered to be in the commercial sector and are excluded from EIA’s commercial inventories and are excluded from supply and disposition statistics, such as those reported in the Weekly Petroleum Status Report, Petroleum Supply Monthly, and This Week In Petroleum.
Product Location Thousand Barrels
Motor Gasoline Blending Components NY 86
Fuel Ethanol NY 10
Distillate Fuel Oil, 15 ppm Sulfur and Under NY 34
Source: New York State Energy Research & Development Authority

Energy Information Administration/Petroleum Supply Monthly,138 April 2018
Alcohol. The family name of a group of organic chemical compounds composed of carbon, hydrogen, and oxygen. The series of molecules vary in chain length and are composed of a hydrocarbon plus a hydroxyl group; CH3-(CH2)n-OH (e.g., methanol, ethanol, and tertiary butyl alcohol).
Alkylate. The product of an alkylation reaction. It usually refers to the high octane product from alkylation units. This alkylate is used in blending high octane gasoline.
Alkylation. A refining process for chemically combining isobutane with olefin hydrocarbons (e.g., propylene, butylene) through the control of temperature and pressure in the presence of an acid catalyst, usually sulfuric acid or hydrofluoric acid. The product, alkylate, an isoparaffin, has high octane value and is blended with motor and aviation gasoline to improve the antiknock value of the fuel.
All Other Motor Gasoline Blending Components. See Motor Gasoline Blending Components.
API Gravity. An arbitrary scale expressing the gravity or density of liquid petroleum products. The measuring scale is calibrated in terms of degrees API; it may be calculated in terms of the following formula:
141.5131.5sp. gr. @ 60 FoDegrees API =
The higher the API gravity, the lighter the compound. Light crudes generally exceed 38 degrees API and heavy crudes are commonly labeled as all crudes with an API gravity of 22 degrees or below. Intermediate crudes fall in the range of 22 degrees to 38 degrees API gravity.
Aromatics. Hydrocarbons characterized by unsaturated ring structures of carbon atoms. Commercial petroleum aromatics are benzene, toluene, and xylene (BTX).
Asphalt. A dark-brown-to-black cement-like material containing bitumens as the predominant constituent obtained by petroleum processing; used primarily for road construction. It includes crude asphalt as well as the following finished products: cements, fluxes, the asphalt content of emulsions (exclusive of water), and petroleum distillates blended with asphalt to make cutback asphalts. Note: The conversion factor for asphalt is 5.5 barrels per short ton.
ASTM. The acronym for the American Society for Testing and Materials.
Atmospheric Crude Oil Distillation. The refining process of separating crude oil components at atmospheric pressure by heating to temperatures of about 600 degrees Fahrenheit to 750 degrees Fahrenheit (depending on the nature of the crude oil and desired products) and subsequent condensing of the fractions by cooling.
Aviation Gasoline (Finished). A complex mixture of relatively volatile hydrocarbons with or without small quantities of additives, blended to form a fuel suitable for use in aviation reciprocating
engines. Fuel specifications are provided in ASTM Specification D 910 and Military Specification MIL-G-5572. Note: Data on blending components are not counted in data on finished aviation gasoline.
Aviation Gasoline Blending Components. Naphthas which will be used for blending or compounding into finished aviation gasoline (e.g., straight-run gasoline, alkylate, reformate, benzene, toluene, and xylene). Excludes oxygenates (alcohols, ethers), butane, and pentanes plus. Oxygenates are reported as other hydrocarbons, hydrogen, and oxygenates.
Barrel. A unit of volume equal to 42 U.S. gallons.
Barrels Per Calendar Day. The amount of input that a distillation facility can process under usual operating conditions. The amount is expressed in terms of capacity during a 24-hour period and reduces the maximum processing capability of all units at the facility under continuous operation (see Barrels per Stream Day) to account for the following limitations that may delay, interrupt, or slow down production:
the capability of downstream facilities to absorb the output of crude oil processing facilities of a given refinery. No reduction is made when a planned distribution of intermediate streams through other than downstream facilities is part of a refinery’s normal operation;
the types and grades of inputs to be processed;
the types and grades of products expected to be manufactured;
the environmental constraints associated with refinery operations;
the reduction of capacity for scheduled downtime due to such conditions as routine inspection, maintenance, repairs, and turnaround; and
the reduction of capacity for unscheduled downtime due to such conditions as mechanical problems, repairs, and slowdowns.
Barrels Per Stream Day. The maximum number of barrels of input that a distillation facility can process within a 24-hour period when running at full capacity under optimal crude and product slate conditions with no allowance for downtime.
Benzene (C6H6). An aromatic hydrocarbon present in small proportion in some crude oils and made commercially from petroleum by the catalytic reforming of naphthenes in petroleum naphtha. Also made from coal in the manufacture of coke. Used as a solvent, in manufacturing detergents, synthetic fibers, and petrochemicals and as a component of high-octane gasoline.
Biomass-Based Diesel Fuel. Biodiesel and other renewable diesel fuel or diesel fuel blending components derived from biomass, but excluding renewable diesel fuel coprocessed with petroleum
Definitions of Petroleum Products and Other Terms(Revised May 2010)

Energy Information Administration/Petroleum Supply Monthly, 139 April 2018
feedstocks.
Blending Components. See Motor or Aviation Gasoline Blending Components.
Blending Plant. A facility which has no refining capability but is either capable of producing finished motor gasoline through mechanical blending or blends oxygenates with motor gasoline.
Bonded Petroleum Imports. Petroleum imported and entered into Customs bonded storage. These imports are not included in the import statistics until they are: (1) withdrawn from storage free of duty for use as fuel for vessels and aircraft engaged in international trade; or (2) withdrawn from storage with duty paid for domestic use.
BTX. The acronym for the commercial petroleum aromatics benzene, toluene, and xylene. See individual categories for definitions.
Bulk Station. A facility used primarily for the storage and/or marketing of petroleum products which has a total bulk storage capacity of less than 50,000 barrels and receives its petroleum products by tank car or truck.
Bulk Terminal. A facility used primarily for the storage and/or marketing of petroleum products which has a total bulk storage capacity of 50,000 barrels or more and/or receives petroleum products by tanker, barge, or pipeline.
Butane (C4H10). A normally gaseous straight-chain or branch-chain hydrocarbon extracted from natural gas or refinery gas streams. It includes normal butane and refinery-grade butane and is designated in ASTM Specification D1835 and Gas Processors Association Specifications for commercial butane.
Normal Butane (C4H10). A normally gaseous straight-chain hydrocarbon that is a colorless paraffinic gas which boils at a temperature of 31.1 degrees Fahrenheit and is extracted from natural gas or refinery gas streams.
Refinery-Grade Butane (C4H10). A refinery-produced stream that is composed predominantly of normal butane and/or isobutane and may also contain propane and/or natural gasoline. These streams may also contain significant levels of olefins and/or fluorides contamination.
Butylene (C4H8). An olefinic hydrocarbon recovered from refinery processes.
Captive Refinery Oxygenate Plants. Oxygenate production facilities located within or adjacent to a refinery complex.
Catalytic Cracking. The refining process of breaking down the larger, heavier, and more complex hydrocarbon molecules into simpler and lighter molecules. Catalytic cracking is accomplished by the use of a catalytic agent and is an effective process for increasing the yield of gasoline from crude oil. Catalytic cracking processes fresh feeds and recycled feeds.
Fresh Feeds. Crude oil or petroleum distillates which are being fed to processing units for the first time.
Recycled Feeds. Feeds that are continuously fed back for additional processing.
Catalytic Hydrocracking. A refining process that uses hydrogen and catalysts with relatively low temperatures and high pressures for converting middle boiling or residual material to high-octane gasoline, reformer charge stock, jet fuel, and/or high grade fuel oil. The process uses one or more catalysts, depending upon product output, and can handle high sulfur feedstocks without prior desulfurization.
Catalytic Hydrotreating. A refining process for treating petroleum fractions from atmospheric or vacuum distillation units (e.g., naphthas, middle distillates, reformer feeds, residual fuel oil, and heavy gas oil) and other petroleum (e.g., cat cracked naphtha, coker naphtha, gas oil, etc.) in the presence of catalysts and substantial quantities of hydrogen. Hydrotreating includes desulfurization, removal of substances (e.g., nitrogen compounds) that deactivate catalysts, conversion of olefins to paraffins to reduce gum formation in gasoline, and other processes to upgrade the quality of the fractions.
Catalytic Reforming. A refining process using controlled heat and pressure with catalysts to rearrange certain hydrocarbon molecules, thereby converting paraffinic and naphthenic type hydrocarbons (e.g., low-octane gasoline boiling range fractions) into petrochemical feedstocks and higher octane stocks suitable for blending into finished gasoline. Catalytic reforming is reported in two categories. They are:
Low Pressure. A processing unit operating at less than 225 pounds per square inch gauge (PSIG) measured at the outlet separator.
High Pressure. A processing unit operating at either equal to or greater than 225 pounds per square inch gauge (PSIG) measured at the outlet separator.
Charge Capacity. The input (feed) capacity of the refinery processing facilities.
Coal. A readily combustible black or brownish-black rock whose composition, including inherent moisture, consists of more than 50 percent by weight and more than 70 percent by volume of carbonaceous material. It is formed from plant remains that have been compacted, hardened, chemically altered, and metamorphosed by heat and pressure over geologic time.
Commercial Kerosene-Type Jet Fuel. See Kerosene-Type Jet Fuel.
Conventional Blendstock for Oxygenate Blending (CBOB). See Motor Gasoline Blending Components.
Conventional Gasoline. See Motor Gasoline (Finished).
Crude Oil. A mixture of hydrocarbons that exists in liquid phase in natural underground reservoirs and remains liquid at atmospheric pressure after passing through surface separating facilities. Depending upon the characteristics of the crude stream, it may also include:
Small amounts of hydrocarbons that exist in gaseous phase in natural underground reservoirs but are liquid at atmospheric pressure after being recovered from oil well (casinghead) gas in lease separators and are subsequently commingled

Energy Information Administration/Petroleum Supply Monthly,140 April 2018
with the crude stream without being separately measured. Lease condensate recovered as a liquid from natural gas wells in lease or field separation facilities and later mixed into the crude stream is also included;
Small amounts of nonhydrocarbons produced from oil, such as sulfur and various metals;
Drip gases, and liquid hydrocarbons produced from tar sands, oil sands, gilsonite, and oil shale.
Liquids produced at natural gas processing plants are excluded. Crude oil is refined to produce a wide array of petroleum products, including heating oils; gasoline, diesel and jet fuels; lubricants; asphalt; ethane, propane, and butane; and many other products used for their energy or chemical content.
Crude oil is considered as either domestic or foreign, according to the following:
Domestic. Crude oil produced in the United States or from its Aouter continental shelf’ as defined in 43 USC 1331.
Foreign. Crude oil produced outside the United States. Imported Athabasca hydrocarbons (tar sands from Canada) are included.
Crude Oil, Refinery Receipts. Receipts of domestic and foreign crude oil at a refinery. Includes all crude oil in transit except crude oil in transit by pipeline. Foreign crude oil is reported as a receipt only after entry through customs. Crude oil of foreign origin held in bonded storage is excluded.
Crude Oil Losses. Represents the volume of crude oil reported by petroleum refineries as being lost in their operations. These losses are due to spills, contamination, fires, etc. as opposed to refinery processing losses.
Crude Oil Production. The volume of crude oil produced from oil reservoirs during given periods of time. The amount of such production for a given period is measured as volumes delivered from lease storage tanks (i.e., the point of custody transfer) to pipelines, trucks, or other media for transport to refineries or terminals with adjustments for (1) net differences between opening and closing lease inventories, and (2) basic sediment and water (BS&W).
Crude Oil Qualities. Refers to two properties of crude oil, the sulfur content and API gravity, which affect processing complexity and product characteristics.
Delayed Coking. A process by which heavier crude oil fractions can be thermally decomposed under conditions of elevated temperatures and pressure to produce a mixture of lighter oils and petroleum coke. The light oils can be processed further in other refinery units to meet product specifications. The coke can be used either as a fuel or in other applications such as the manufacturing of steel or aluminum.
Desulfurization. The removal of sulfur, as from molten metals, petroleum oil, or flue gases. Petroleum desulfurization is a process that removes sulfur and its compounds from various streams during the refining process. Desulfurization processes include catalytic hydrotreating and other chemical/physical processes such
as adsorption. Desulfurization processes vary based on the type of stream treated (e.g., naphtha, distillate, heavy gas oil, etc.) and the amount of sulfur removed (e.g., sulfur reduction to 10 ppm). See Catalytic Hydrotreating.
Disposition. The components of petroleum disposition are stock change, crude oil losses, refinery inputs, exports, and products supplied for domestic consumption.
Distillate Fuel Oil. A general classification for one of the petroleum fractions produced in conventional distillation operations. It includes diesel fuels and fuel oils. Products known as No. 1, No. 2, and No. 4 diesel fuel are used in on-highway diesel engines, such as those in trucks and automobiles, as well as off-highway engines, such as those in railroad locomotives and agricultural machinery. Products known as No. 1, No. 2, and No. 4 fuel oils are used primarily for space heating and electric power generation.
No. 1 Distillate. A light petroleum distillate that can be used as either a diesel fuel or a fuel oil.
No. 1 Diesel Fuel. A light distillate fuel oil that has a distillation temperature of 550 degrees Fahrenheit at the 90-percent recovery point and meets the specifications defined in ASTM Specification D 975. It is used in high speed diesel engines generally operated under frequent speed and load changes, such as those in city buses and similar vehicles. See No. 1 Distillate.
No. 1 Fuel Oil. A light distillate fuel oil that has distillation temperatures of 400 degrees Fahrenheit at the 10-percent recovery point and 550 degrees Fahrenheit at the 90-percent recovery point and meets the specifications defined in ASTM Specification D 396. It is used primarily as fuel for portable outdoor stoves and portable outdoor heaters. See No. 1 Distillate.
No. 2 Distillate. A petroleum distillate that can be used as either a diesel fuel or a fuel oil.
No. 2 Diesel Fuel. A distillate fuel oil that has a distillation temperature of 640 degrees Fahrenheit at the 90-percent recovery point and meets the specifications defined in ASTM Specification D 975. It is used in high-speed diesel engines that are generally operated under uniform speed and load conditions, such as those in railroad locomotives, trucks, and automobiles. See No. 2 Distillate.
Low Sulfur No. 2 Diesel Fuel. No. 2 diesel fuel that has a sulfur level no higher than 0.05 percent by weight. It is used primarily in motor vehicle diesel engines for on-highway use.
High Sulfur No. 2 Diesel Fuel. No. 2 diesel fuel that has a sulfur level above 0.05 percent by weight.
No. 2 Fuel Oil (Heating Oil). A distillate fuel oil that has a distillation temperature of 640 degrees Fahrenheit at the 90-percent recovery point and meets the specifications defined in ASTM Specification D 396. It is used in

Energy Information Administration/Petroleum Supply Monthly, 141 April 2018
atomizing type burners for domestic heating or for moderate capacity commercial/industrial burner units. See No. 2 Distillate.
No. 4 Fuel. A distillate fuel oil made by blending distillate fuel oil and residual fuel oil stocks. It conforms to ASTM Specification D 396 or Federal Specification VV-F-815C and is used extensively in industrial plants and in commercial burner installations that are not equipped with preheating facilities. It also includes No. 4 diesel fuel used for low- and medium-speed diesel engines and conforms to ASTM Specification D 975.
No. 4 Diesel Fuel. See No. 4 Fuel.
No. 4 Fuel Oil. See No. 4 Fuel.
Electricity (Purchased). Electricity purchased for refinery operations that is not produced within the refinery complex.
Ending Stocks. Primary stocks of crude oil and petroleum products held in storage as of 12 midnight on the last day of the month. Primary stocks include crude oil or petroleum products held in storage at (or in) leases, refineries, natural gas processing plants, pipelines, tank farms, and bulk terminals that can store at least 50,000 barrels of petroleum products or that can receive petroleum products by tanker, barge, or pipeline. Crude oil that is in-transit by water from Alaska, or that is stored on Federal leases or in the Strategic Petroleum Reserve is included. Primary Stocks exclude stocks of foreign origin that are held in bonded warehouse storage.
ETBE (Ethyl tertiary butyl ether) (CH3 )3COC2H5 . An oxygenate blend stock formed by the catalytic etherification of isobutylene with ethanol.
Ethane (C2H6 ). A normally gaseous straight-chain hydrocarbon. It is a colorless paraffinic gas that boils at a temperature of - 127.48 degrees Fahrenheit. It is extracted from natural gas and refinery gas streams.
Ether. A generic term applied to a group of organic chemical compounds composed of carbon, hydrogen, and oxygen, characterized by an oxygen atom attached to two carbon atoms (e.g., methyl tertiary butyl ether).
Ethylene (C2H4 ). An olefinic hydrocarbon recovered from refinery processes or petrochemical processes. Ethylene is used as a petrochemical feedstock for numerous chemical applications and the production of consumer goods.
Exports. Shipments of crude oil and petroleum products from the 50 States and the District of Columbia to foreign countries, Puerto Rico, the Virgin Islands, and other U.S. possessions and territories.
Field Production. Represents crude oil production on leases, natural gas liquids production at natural gas processing plants, new supply of other hydrocarbons/oxygenates and motor gasoline blending components, and fuel ethanol blended into finished motor gasoline.
Flexicoking. A thermal cracking process which converts heavy
hydrocarbons such as crude oil, tar sands bitumen, and distillation residues into light hydrocarbons. Feedstocks can be any pumpable hydrocarbons including those containing high concentrations of sulfur and metals.
Fluid Coking. A thermal cracking process utilizing the fluidized-solids technique to remove carbon (coke) for continuous conversion of heavy, low-grade oils into lighter products.
Fresh Feed Input. Represents input of material (crude oil, unfinished oils, natural gas liquids, other hydrocarbons and oxygenates or finished products) to processing units at a refinery that is being processed (input) into a particular unit for the first time.
Examples:
(1.) Unfinished oils coming out of a crude oil distillation unit which are input into a catalytic cracking unit are considered fresh feed to the catalytic cracking unit.
(2.) Unfinished oils coming out of a catalytic cracking unit being looped back into the same catalytic cracking unit to be reprocessed are not considered fresh feed.
Fuel Ethanol (C2H5OH). An anhydrous alcohol (ethanol with less than 1% water) intended for gasoline blending as described in Oxygenates definition.
Fuels Solvent Deasphalting. A refining process for removing asphalt compounds from petroleum fractions, such as reduced crude oil. The recovered stream from this process is used to produce fuel products.
Gas Oil. A liquid petroleum distillate having a viscosity intermediate between that of kerosene and lubricating oil. It derives its name from having originally been used in the manufacture of illuminating gas. It is now used to produce distillate fuel oils and gasoline.
Gasohol. A blend of finished motor gasoline containing alcohol (generally ethanol but sometimes methanol) at a concentration of 10 percent or less by volume. Data on gasohol that has at least 2.7 percent oxygen, by weight, and is intended for sale inside carbon monoxide nonattainment areas are included in data on oxygenated gasoline. See Oxygenates.
Gasoline Blending Components. Naphthas which will be used for blending or compounding into finished aviation or motor gasoline (e.g., straight-run gasoline, alkylate, reformate, benzene, toluene, and xylene). Excludes oxygenates (alcohols, ethers), butane, and pentanes plus.
Gasoline Treated as Blendstock (GTAB). See Motor Gasoline Blending Components.
Gross Input to Atmospheric Crude Oil Distillation Units. Total input to atmospheric crude oil distillation units. Includes all crude oil, lease condensate, natural gas plant liquids, unfinished oils, liquefied refinery gases, slop oils, and other liquid hydrocarbons produced from tar sands, gilsonite, and oil shale.
Heavy Gas Oil. Petroleum distillates with an approximate boiling

Energy Information Administration/Petroleum Supply Monthly,142 April 2018
range from 651 degrees Fahrenheit to 1000 degrees Fahrenheit.
High-Sulfur Distillate Fuel Oil. Distillate fuel oil having sulfur content greater than 500 ppm.
Hydrogen. The lightest of all gases, occurring chiefly in combination with oxygen in water; exists also in acids, bases, alcohols, petroleum, and other hydrocarbons.
Idle Capacity. The component of operable capacity that is not in operation and not under active repair, but capable of being placed in operation within 30 days; and capacity not in operation but under active repair that can be completed within 90 days.
Imported Crude Oil Burned As Fuel. The amount of foreign crude oil burned as a fuel oil, usually as residual fuel oil, without being processed as such. Imported crude oil burned as fuel includes lease condensate and liquid hydrocarbons produced from tar sands, gilsonite, and oil shale.
Imports. Receipts of crude oil and petroleum products into the 50 States and the District of Columbia from foreign countries, Puerto Rico, the Virgin Islands, and other U.S. possessions and territories.
Isobutane (C4H10 ). A normally gaseous branch-chain hydrocarbon. It is a colorless paraffinic gas that boils at a temperature of 10.9 degrees Fahrenheit. It is extracted from natural gas or refinery gas streams.
Isobutylene (C4H8 ). An olefinic hydrocarbon recovered from refinery processes or petrochemical processes.
Isohexane (C6H14 ). A saturated branch-chain hydrocarbon. It is a colorless liquid that boils at a temperature of 156.2 degrees Fahrenheit.
Isomerization. A refining process which alters the fundamental arrangement of atoms in the molecule without adding or removing anything from the original material. Used to convert normal butane into isobutane (C4), an alkylation process feedstock, and normal pentane and hexane into isopentane (C5) and isohexane (C6), high-octane gasoline components.
Isopentane. See Natural Gasoline and Isopentane.
Kerosene. A light petroleum distillate that is used in space heaters, cook stoves, and water heaters and is suitable for use as a light source when burned in wick-fed lamps. Kerosene has a maximum distillation temperature of 400 degrees Fahrenheit at the 10-percent recovery point, a final boiling point of 572 degrees Fahrenheit, and a minimum flash point of 100 degrees Fahrenheit. Included are No. 1-K and No. 2-K, the two grades recognized by ASTM Specification D 3699 as well as all other grades of kerosene called range or stove oil, which have properties similar to those of No. 1 fuel oil. See Kerosene-Type Jet Fuel.
Kerosene-Type Jet Fuel. A kerosene-based product having a maximum distillation temperature of 400 degrees Fahrenheit at the 10-percent recovery point and a final maximum boiling point of 572 degrees Fahrenheit and meeting ASTM Specification D 1655 and Military Specifications MIL-T-5624P and MIL-T-83133D (Grades JP-5 and JP-8). It is used for commercial and military turbojet and turboprop aircraft engines.
Commercial. Kerosene-type jet fuel intended for use in commercial aircraft.
Military. Kerosene-type jet fuel intended for use in military aircraft.
Lease Condensate. A mixture consisting primarily of pentanes and heavier hydrocarbons which is recovered as a liquid from natural gas in lease separation facilities. This category excludes natural gas liquids, such as butane and propane, which are recovered at downstream natural gas processing plants or facilities. See Natural Gas Liquids.
Light Gas Oils. Liquid Petroleum distillates heavier than naphtha, with an approximate boiling range from 401 degrees Fahrenheit to 650 degrees Fahrenheit.
Liquefied Petroleum Gases (LPG). A group of hydrocarbon-based gases derived from crude oil refining or natural gas fractionation. They include: ethane, ethylene, propane, propylene, normal butane, butylene, isobutane, and isobutylene. For convenience of transportation, these gases are liquefied through pressurization.
Liquefied Refinery Gases (LRG). Liquefied petroleum gases fractionated from refinery or still gases. Through compression and/or refrigeration, they are retained in the liquid state. The reported categories are ethane/ethylene, propane/propylene, normal butane/butylene, and isobutane/isobutylene. Excludes still gas.
Low-Sulfur Distillate Fuel Oil. Distillate fuel oil having sulfur content greater than 15 ppm to 500 ppm. Low sulfur distillate fuel oil also includes product with sulfur content equal to or less than 15 ppm if the product is intended for pipeline shipment and the pipeline has a sulfur specification below 15 ppm.
Lubricants. Substances used to reduce friction between bearing surfaces or as process materials either incorporated into other materials used as processing aids in the manufacture of other products, or used as carriers of other materials. Petroleum lubricants may be produced either from distillates or residues. Lubricants include all grades of lubricating oils from spindle oil to cylinder oil and those used in greases.
Merchant Oxygenate Plants. Oxygenate production facilities that are not associated with a petroleum refinery. Production from these facilities is sold under contract or on the spot market to refiners or other gasoline blenders.
Methanol (CH3OH). A light, volatile alcohol intended for gasoline blending as described in Oxygenate definition.
Middle Distillates. A general classification of refined petroleum products that includes distillate fuel oil and kerosene.
Military Kerosene-Type Jet Fuel. See Kerosene-Type Jet Fuel.
Miscellaneous Products. Includes all finished products not classified elsewhere (e.g., petrolatum, lube refining byproducts (aromatic extracts and tars), absorption oils, ram-jet fuel, petroleum rocket fuels, synthetic natural gas feedstocks, and specialty oils). Note:

Energy Information Administration/Petroleum Supply Monthly, 143 April 2018
Beginning with January 2004 data, naphtha-type jet fuel is included in Miscellaneous Products.
Motor Gasoline (Finished). A complex mixture of relatively volatile hydrocarbons with or without small quantities of additives, blended to form a fuel suitable for use in spark-ignition engines. Motor gasoline, as defined in ASTM Specification D 4814 or Federal Specification VV-G-1690C, is characterized as having a boiling range of 122 to 158 degrees Fahrenheit at the 10 percent recovery point to 365 to 374 degrees Fahrenheit at the 90 percent recovery point. “Motor Gasoline” includes conventional gasoline; all types of oxygenated gasoline, including gasohol; and reformulated gasoline, but excludes aviation gasoline. Volumetric data on blending components, such as oxygenates, are not counted in data on finished motor gasoline until the blending components are blended into the gasoline. Note: E85 is included only in volumetric data on finished motor gasoline production and other components of product supplied.
Conventional Gasoline. Finished motor gasoline not included in the oxygenated or reformulated gasoline categories. Note: This category excludes reformulated gasoline blendstock for oxygenate blending (RBOB) as well as other blendstock.
Ed 55 and Lower. Finished conventional motor gasoline blended with a maximum of 55 volume percent denatured fuel ethanol.
Greater than Ed55. Finished conventional motor gasoline blended with denatured fuel ethanol where the volume percent of denatured fuel ethanol exceeds 55%.
OPRG. “Oxygenated Fuels Program Reformulated Gasoline” is reformulated gasoline which is intended for use in an oxygenated fuels program control area.
Oxygenated Gasoline (Including Gasohol). Oxygenated gasoline includes all finished motor gasoline, other than reformulated gasoline, having oxygen content of 2.0 percent or higher by weight. Gasohol containing a minimum 5.7 percent ethanol by volume is included in oxygenated gasoline. Oxygenated gasoline was reported as a separate product from January 1993 until December 2003 inclusive. Beginning with monthly data for January 2004, oxygenated gasoline is included in conventional gasoline. Historical data for oxygenated gasoline excluded Federal Oxygenated Program Reformulated Gasoline (OPRG). Historical oxygenated gasoline data also excluded other reformulated gasoline with a seasonal oxygen requirement regardless of season.
Reformulated Gasoline. Finished gasoline formulated for use in motor vehicles, the composition and properties of which meet the requirements of the reformulated gasoline regulations promulgated by the U.S. Environmental Protection Agency under Section 211(k) of the Clean Air Act. It includes gasoline produced to meet or exceed emissions performance and benzene content standards of federal-program reformulated gasoline even though the gasoline
may not meet all of the composition requirements (e.g., oxygen content) of federal-program reformulated gasoline. Note: This category includes Oxygenated Fuels Program Reformulated Gasoline (OPRG). Reformulated gasoline excludes Reformulated Blendstock for Oxygenate Blending (RBOB) and Gasoline Treated as Blendstock (GTAB).
Reformulated (Blended with Alcohol). Reformulated gasoline blended with an alcohol component (e.g., fuel ethanol) at a terminal or refinery to raise the oxygen content.
Reformulated (Blended with Ether). Reformulated gasoline blended with an ether component (e.g., methyl tertiary butyl ether) at a terminal or refinery to raise the oxygen content.
Reformulated (Non-Oxygenated). Reformulated gasoline without added ether or alcohol components.
Motor Gasoline Blending. Mechanical mixing of motor gasoline blending components, and oxygenates when required, to produce finished motor gasoline. Finished motor gasoline may be further mixed with other motor gasoline blending components or oxygenates, resulting in increased volumes of finished motor gasoline and/or changes in the formulation of finished motor gasoline (e.g., conventional motor gasoline mixed with MTBE to produce oxygenated motor gasoline).
Motor Gasoline Blending Components. Naphthas (e.g., straight-run gasoline, alkylate, reformate, benzene, toluene, xylene) used for blending or compounding into finished motor gasoline. These components include reformulated gasoline blendstock for oxygenate blending (RBOB) but exclude oxygenates (alcohols, ethers), butane, and pentanes plus. Note: Oxygenates are reported as individual components and are included in the total for other hydrocarbons, hydrogens, and oxygenates.
Conventional Blendstock for Oxygenate Blending (CBOB). Conventional gasoline blendstock intended for blending with oxygenates downstream of the refinery where it was produced. CBOB must become conventional gasoline after blending with oxygenates. Motor gasoline blending components that require blending other than with oxygenates to become finished conventional gasoline are reported as All Other Motor Gasoline Blending Components. Excludes reformulated blendstock for oxygenate blending (RBOB).
Gasoline Treated as Blendstock (GTAB). Non-certified Foreign Refinery gasoline classified by an importer as blendstock to be either blended or reclassified with respect to reformulated or conventional gasoline. GTAB was classified on EIA surveys as either reformulated or conventional based on emissions performance and the intended end use in data through the end of December 2009. Designation of GTAB as reformulated or conventional was discontinued beginning with data for January 2010. GTAB was reported as a single product beginning with data for January 2010. GTAB data for January 2010 and later months is presented as conventional

Energy Information Administration/Petroleum Supply Monthly,144 April 2018
motor gasoline blending components whenreported as a subset of motor gasoline blending components.
Reformulated Blendstock for Oxygenate Blending (RBOB). Specially produced reformulated gasoline blendstock intended for blending with oxygenates downstream of the refinery where it was produced. Includes RBOB used to meet requirements of the Federal reformulated gasoline program and other blendstock intended for blending with oxygenates to produce finished gasoline that meets or exceeds emissions performance requirements of Federal reformulated gasoline (e.g., California RBOB and Arizona RBOB). Excludes conventional gasoline blendstocks for oxygenate blending (CBOB).
RBOB for Blending with Alcohol. Motor gasoline blending components intended to be blended with an alcohol component (e.g., fuel ethanol) at a terminal or refinery to raise the oxygen content. RBOB product detail by type of oxygenate was discontinued effective with data for January 2010. Beginning with data for January 2010, RBOB was reported as a single product.
RBOB for Blending with Ether. Motor gasoline blending components intended to be blended with an ether component (e.g., methyl tertiary butyl ether) at a terminal or refinery to raise the oxygen content. RBOB product detail by type of oxygenate was discontinued effective with data for January 2010. Beginning with data for January 2010, RBOB was reported as a single product.
All Other Motor Gasoline Blending Components. Naphthas (e.g., straight-run gasoline, alkylate, reformate, benzene, toluene, xylene) used for blending or compounding into finished motor gasoline. Includes receipts and inputs of Gasoline Treated as Blendstock (GTAB). Excludes conventional blendstock for oxygenate blending (CBOB), reformulated blendstock for oxygenate blending, oxygenates (e.g. fuel ethanol and methyl tertiary butyl ether), butane, and pentanes plus.
MTBE (Methyl tertiary butyl ether) (CH3 )3COCH3 . An ether intended for gasoline blending as described in Oxygenate definition.
Naphtha. A generic term applied to a petroleum fraction with an approximate boiling range between 122 degrees Fahrenheit and 400 degrees Fahrenheit.
Naphtha Less Than 401o F. See Petrochemical Feedstocks.
Naphtha-Type Jet Fuel. A fuel in the heavy naphtha boiling range having an average gravity of 52.8 degrees API, 20 to 90 percent distillation temperatures of 290 degrees to 470 degrees Fahrenheit, and meeting Military Specification MIL-T-5624L (Grade JP-4). It is used primarily for military turbojet and turboprop aircraft engines because it has a lower freeze point than other aviation fuels and meets engine requirements at high altitudes and speeds. Note: Beginning with January 2004 data, naphtha-type jet fuel is included in Miscellaneous Products.
Natural Gas. A gaseous mixture of hydrocarbon compounds, the primary one being methane.
Natural Gas Field Facility. A field facility designed to process natural gas produced from more than one lease for the purpose of recovering condensate from a stream of natural gas; however, some field facilities are designed to recover propane, normal butane, pentanes plus, etc., and to control the quality of natural gas to be marketed.
Natural Gas Liquids. Those hydrocarbons in natural gas that are separated from the gas as liquids through the process of absorption, condensation, adsorption, or other methods in gas processing or cycling plants. Generally such liquids consist of propane and heavier hydrocarbons and are commonly referred to as lease condensate, natural gasoline, and liquefied petroleum gases. Natural gas liquids include natural gas plant liquids (primarily ethane, propane, butane, and isobutane; see Natural Gas Plant Liquids) and lease condensate (primarily pentanes produced from natural gas at lease separators and field facilities; see Lease Condensate).
Natural Gas Plant Liquids. Those hydrocarbons in natural gas that are separated as liquids at natural gas processing plants, fractionating and cycling plants, and, in some instances, field facilities. Lease condensate is excluded. Products obtained include ethane; liquefied petroleum gases (propane, butanes, propane-butane mixtures, ethane-propane mixtures); isopentane; and other small quantities of finished products, such as motor gasoline, special naphthas, jet fuel, kerosene, and distillate fuel oil.
Natural Gas Processing Plant. Facilities designed to recover natural gas liquids from a stream of natural gas that may or may not have passed through lease separators and/or field separation facilities. These facilities control the quality of the natural gas to be marketed. Cycling plants are classified as gas processing plants.
Natural Gasoline and Isopentane. A mixture of hydrocarbons, mostly pentanes and heavier, extracted from natural gas, that meets vapor pressure, end-point, and other specifications for natural gasoline set by the Gas Processors Association. Includes isopentane which is a saturated branch-chain hydrocarbon, (C5H12), obtained by fractionation of natural gasoline or isomerization of normal pentane.
Net Receipts. The difference between total movements into and total movements out of each PAD District by pipeline, tanker, and barge.
Normal Butane. See Butane.
OPEC. An intergovernmental organization whose stated objectiveis to coordinate and unify petroleum policies of member countries.It was created at the Baghdad Conference on September 10–14,1960. Current members (with years of membership) include Algeria(1969-present), Angola (2007-present), Ecuador (1973-1992 and2007-present), Gabon (1975-1994 and July, 2016-present), Indonesia(1962-2008 and January, 2016-November, 2016), Iran (1960-present), Iraq (1960-present), Kuwait (1960-present), Libya (1962-present), Nigeria (1971-present), Qatar (1961-present), Saudi Arabia (1960-present), United Arab Emirates (1967-present), and Venezuela (1960-present).

Energy Information Administration/Petroleum Supply Monthly, 145 April 2018
Operable Capacity. The amount of capacity that, at the beginning of the period, is in operation; not in operation and not under active repair, but capable of being placed in operation within 30 days; or not in operation but under active repair that can be completed within 90 days. Operable capacity is the sum of the operating and idle capacity and is measured in barrels per calendar day or barrels per stream day.
Operable Utilization Rate. Represents the utilization of the atmospheric crude oil distillation units. The rate is calculated by dividing the gross input to these units by the operable refining capacity of the units.
Operating Capacity. The component of operable capacity that is in operation at the beginning of the period.
Operating Utilization Rate. Represents the utilization of the atmospheric crude oil distillation units. The rate is calculated by dividing the gross input to these units by the operating refining capacity of the units.
Other Hydrocarbons. Materials received by a refinery and consumed as a raw material. Includes hydrogen, coal tar derivatives and gilsonite. Excludes natural gas used for fuel or hydrogen feedstock.
Other Oils Equal To or Greater Than 401o F. See Petrochemical Feedstocks.
Other Oxygenates. Other aliphatic alcohols and aliphatic ethers intended for motor gasoline blending (e.g., isopropyl ether (IPE) or n-propanol).
Oxygenated Gasoline. See Motor Gasoline (Finished).
Oxygenates. Substances which, when added to gasoline, increase the amount of oxygen in that gasoline blend. Fuel Ethanol, Methyl Tertiary Butyl Ether (MTBE), Ethyl Tertiary Butyl Ether (ETBE), and methanol are common oxygenates.
Fuel Ethanol. Blends of up to 10 percent by volume anhydrous ethanol (200 proof) (commonly referred to as the “gasohol waiver”).
Methanol. Blends of methanol and gasoline-grade tertiary butyl alcohol (GTBA) such that the total oxygen content does not exceed 3.5 percent by weight and the ratio of methanol to GTBA is less than or equal to 1. It is also specified that this blended fuel must meet ASTM volatility specifications (commonly referred to as the “ARCO” waiver).
Blends of up to 5.0 percent by volume methanol with a minimum of 2.5 percent by volume cosolvent alcohols having a carbon number of 4 or less (i.e., ethanol, propanol, butanol, and/or GTBA). The total oxygen must not exceed 3.7 percent by weight, and the blend must meet ASTM volatility specifications as well as phase separation and alcohol purity specifications (commonly referred to as the “DuPont” waiver).
MTBE (Methyl tertiary butyl ether). Blends up to 15.0 percent by volume MTBE which must meet the ASTM D4814 specifications. Blenders must take precautions that
the blends are not used as base gasolines for other oxygenated blends (commonly referred to as the “Sun” waiver).
Pentanes Plus. A mixture of hydrocarbons, mostly pentanes and heavier, extracted from natural gas. Includes isopentane, natural gasoline, and plant condensate.
Persian Gulf. The countries that comprise the Persian Gulf are: Bahrain, Iran, Iraq, Kuwait, Qatar, Saudi Arabia, and the United Arab Emirates.
Petrochemical Feedstocks. Chemical feedstocks derived from petroleum principally for the manufacture of chemicals, synthetic rubber, and a variety of plastics. The categories reported are “Naphtha Less Than 401o F” and “Other Oils Equal To or Greater Than 401o F.”
Naphtha Less Than 401o F. A naphtha with a boiling range of less than 401 degrees Fahrenheit that is intended for use as a petrochemical feedstock.
Other Oils Equal To or Greater Than 401o F. Oils with a boiling range equal to or greater than 401 degrees Fahrenheit that are intended for use as a petrochemical feedstock.
Petroleum Administration for Defense (PAD) Districts. Geographic aggregations of the 50 States and the District of Columbia into five districts by the Petroleum Administration for Defense in 1950. These districts were originally defined during World War II for purposes of administering oil allocation.
Petroleum Coke. A residue high in carbon content and low in hydrogen that is the final product of thermal decomposition in the condensation process in cracking. This product is reported as marketable coke or catalyst coke. The conversion is 5 barrels (of 42 U.S. gallons each) per short ton. Coke from petroleum has a heating value of 6.024 million Btu per barrel.
Catalyst Coke. In many catalytic operations (e.g., catalytic cracking) carbon is deposited on the catalyst, thus deactivating the catalyst. The catalyst is reactivated by burning off the carbon, which is used as a fuel in the refining process. This carbon or coke is not recoverable in a concentrated form.
Marketable Coke. Those grades of coke produced in delayed or fluid cokers which may be recovered as relatively pure carbon. This “green” coke may be sold as is or further purified by calcining.
Petroleum Products. Petroleum products are obtained from the processing of crude oil (including lease condensate), natural gas, and other hydrocarbon compounds. Petroleum products include unfinished oils, liquefied petroleum gases, pentanes plus, aviation gasoline, motor gasoline, naphtha-type jet fuel, kerosene-type jet fuel, kerosene, distillate fuel oil, residual fuel oil, petrochemical feedstocks, special naphthas, lubricants, waxes, petroleum coke, asphalt, road oil, still gas, and miscellaneous products.
Pipeline (Petroleum). Crude oil and product pipelines used to transport crude oil and petroleum products respectively, (including interstate, intrastate, and intracompany pipelines) within the 50 States and the District of Columbia.

Energy Information Administration/Petroleum Supply Monthly,146 April 2018
Plant Condensate. One of the natural gas liquids, mostly pentanes and heavier hydrocarbons, recovered and separated as liquids at gas inlet separators or scrubbers in processing plants.
Processing Gain. The volumetric amount by which total output is greater than input for a given period of time. This difference is due to the processing of crude oil into products which, in total, have a lower specific gravity than the crude oil processed.
Processing Loss. The volumetric amount by which total refinery output is less than input for a given period of time. This difference is due to the processing of crude oil into products which, in total, have a higher specific gravity than the crude oil processed.
Product Supplied, Crude Oil. Crude oil burned on leases and by pipelines as fuel.
Production Capacity. The maximum amount of product that can be produced from processing facilities.
Products Supplied. Approximately represents consumption of petroleum products because it measures the disappearance of these products from primary sources, i.e., refineries, natural gas processing plants, blending plants, pipelines, and bulk terminals. In general, product supplied of each product in any given period is computed as follows: field production, plus refinery production, plus imports, plus unaccounted for crude oil, (plus net receipts when calculated on a PAD District basis), minus stock change, minus crude oil losses, minus refinery inputs, minus exports.
Propane (C3H8 ). A normally gaseous straight-chain hydrocarbon. It is a colorless paraffinic gas that boils at a temperature of - 43.67 degrees Fahrenheit. It is extracted from natural gas or refinery gas streams. It includes all products designated in ASTM Specification D1835 and Gas Processors Association Specifications for commercial propane and HD-5 propane.
Propylene (C3H6 ). An olefinic hydrocarbon recovered from refinery processes or petrochemical processes.
Propylene (C3H6 ) (nonfuel use). Propylene that is intended for use in nonfuel applications such as petrochemical manufacturing. Nonfuel use propylene includes chemical-grade propylene, polymer-grade propylene, and trace amounts of propane. Nonfuel use propylene also includes the propylene component of propane/propylene mixes where the propylene will be separated from the mix in a propane/propylene splitting process. Excluded is the propylene component of propane/propylene mixes where the propylene component of the mix is intended for sale into the fuel market.
Refinery. An installation that manufactures finished petroleum products from crude oil, unfinished oils, natural gas liquids, other hydrocarbons, and oxygenates.
Refinery-Grade Butane. See Butane.
Refinery Input, Crude Oil. Total crude oil (domestic plus foreign) input to crude oil distillation units and other refinery processing units (cokers, etc.).
Refinery Input, Total. The raw materials and intermediate materials processed at refineries to produce finished petroleum products. They include crude oil, products of natural gas processing plants, unfinished oils, other hydrocarbons and oxygenates, motor gasoline and aviation gasoline blending components and finished petroleum products.
Refinery Production. Petroleum products produced at a refinery or blending plant. Published production of these products equals refinery production minus refinery input. Negative production will occur when the amount of a product produced during the month is less than the amount of that same product that is reprocessed (input) or reclassified to become another product during the same month. Refinery production of unfinished oils, and motor and aviation gasoline blending components appear on a net basis under refinery input.
Refinery Yield. Refinery yield (expressed as a percentage) represents the percent of finished product produced from input of crude oil and net input of unfinished oils. It is calculated by dividing the sum of crude oil and net unfinished input into the individual net production of finished products. Before calculating the yield for finished motor gasoline, the input of natural gas liquids, other hydrocarbons and oxygenates, and net input of motor gasoline blending components must be subtracted from the net production of finished motor gasoline. Before calculating the yield for finished aviation gasoline, input of aviation gasoline blending components must be subtracted from the net production of finished aviation gasoline.
Reformulated Blendstock for Oxygenate Blending (RBOB). See Motor Gasoline Blending Components.
Reformulated Gasoline. See Motor Gasoline (Finished).
Renewable Fuels (Other). Fuels and fuel blending components, except biomass-based diesel fuel, renewable diesel fuel, and fuel ethanol, produced from renewable biomass.
Residual Fuel Oil. A general classification for the heavier oils, known as No. 5 and No. 6 fuel oils, that remain after the distillate fuel oils and lighter hydrocarbons are distilled away in refinery operations. It conforms to ASTM Specifications D 396 and D 975 and Federal Specification VV-F-815C. No. 5, a residual fuel oil of medium viscosity, is also known as Navy Special and is defined in Military Specification MIL-F-859E, including Amendment 2 (NATO Symbol F-770). It is used in steam-powered vessels in government service and inshore power plants. No. 6 fuel oil includes Bunker C fuel oil and is used for the production of electric power, space heating, vessel bunkering, and various industrial purposes.
Residuum. Residue from crude oil after distilling off all but the heaviest components, with a boiling range greater than 1000 degrees Fahrenheit.
Road Oil. Any heavy petroleum oil, including residual asphaltic oil used as a dust palliative and surface treatment on roads and highways. It is generally produced in six grades from 0, the most liquid, to 5, the most viscous.

Energy Information Administration/Petroleum Supply Monthly, 147 April 2018
Shell Storage Capacity. The design capacity of a petroleum storage tank which is always greater than or equal to working storage capacity. Special Naphthas. All finished products within the naphtha boiling range that are used as paint thinners, cleaners, or solvents. These products are refined to a specified flash point. Special naphthas include all commercial hexane and cleaning solvents conforming to ASTM Specification D1836 and D484, respectively. Naphthas to be blended or marketed as motor gasoline or aviation gasoline, or that are to be used as petrochemical and synthetic natural gas (SNG) feedstocks are excluded.
Steam (Purchased). Steam, purchased for use by a refinery, that was not generated from within the refinery complex.
Still Gas (Refinery Gas). Any form or mixture of gases produced in refineries by distillation, cracking, reforming, and other processes. The principal constituents are methane, ethane, ethylene, normal butane, butylene, propane, propylene, etc. Still gas is used as a refinery fuel and a petrochemical feedstock. The conversion factor is 6 million BTU’s per fuel oil equivalent barrel.
Stock Change. The difference between stocks at the beginning of the reporting period and stocks at the end of the reporting period. Note: A negative number indicates a decrease (i.e., a drawdown) in stocks and a positive number indicates an increase (i.e., a buildup) in stocks during the reporting period.
Strategic Petroleum Reserve (SPR). Petroleum stocks maintained by the Federal Government for use during periods of major supply interruption.
Sulfur. A yellowish nonmetallic element, sometimes known as “brimstone.” It is present at various levels of concentration in many fossil fuels whose combustion releases sulfur compounds that are considered harmful to the environment. Some of the most commonly used fossil fuels are categorized according to their sulfur content, with lower sulfur fuels usually selling at a higher price. Note: No. 2 Distillate fuel is currently reported as having either a 0.05 percent or lower sulfur level for on-highway vehicle use or a greater than 0.05 percent sulfur level for off- highway use, home heating oil, and commercial and industrial uses. Residual fuel, regardless of use, is classified as having either no more than 1 percent sulfur or greater than 1 percent sulfur. Coal is also classified as being low-sulfur at concentrations of 1 percent or less or high-sulfur at concentrations greater than 1 percent.
Supply. The components of petroleum supply are field production, refinery production, imports, and net receipts when calculated on a PAD District basis.
TAME (Tertiary amyl methyl ether) (CH3 )2(C2H5 )COCH3 . An oxygenate blend stock formed by the catalytic etherification of isoamylene with methanol.
Tank Farm. An installation used by gathering and trunk pipeline companies, crude oil producers, and terminal operators (except refineries) to store crude oil.
Tanker and Barge. Vessels that transport crude oil or petroleum products. Data are reported for movements between PAD Districts; from a PAD District to the Panama Canal; or from the Panama Canal
to a PAD District.
TBA (Tertiary butyl alcohol) (CH3 )3COH. An alcohol primarily used as a chemical feedstock, a solvent or feedstock for isobutylene production for MTBE; produced as a co-product of propylene oxide production or by direct hydration of isobutylene.
Thermal Cracking. A refining process in which heat and pressure are used to break down, rearrange, or combine hydrocarbon molecules. Thermal cracking includes gas oil, visbreaking, fluid coking, delayed coking, and other thermal cracking processes (e.g., flexicoking). See individual categories for definition.
Toluene (C6H5CH3 ). Colorless liquid of the aromatic group of petroleum hydrocarbons, made by the catalytic reforming of petroleum naphthas containing methyl cyclohexane. A high-octane gasoline-blending agent, solvent, and chemical intermediate, base for TNT.
Ultra-Low Sulfur Distillate Fuel Oil. Distillate fuel oil having sulfur content of 15 ppm or lower. Ultra-low sulfur distillate fuel oil that will be shipped by pipeline must satisfy the sulfur specification of the shipping pipeline if the pipeline specification is below 15 ppm. Distillate fuel oil intended for pipeline shipment that fails to meet a pipeline sulfur specification that is below 15 ppm will be classified as low-sulfur distillate fuel oil.
Unaccounted for Crude Oil. Represents the arithmetic difference between the calculated supply and the calculated disposition of crude oil. The calculated supply is the sum of crude oil production plus imports minus changes in crude oil stocks. The calculated disposition of crude oil is the sum of crude oil input to refineries, crude oil exports, crude oil burned as fuel, and crude oil losses.
Unfinished Oils. All oils requiring further processing, except those requiring only mechanical blending. Unfinished oils are produced by partial refining of crude oil and include naphthas and lighter oils, kerosene and light gas oils, heavy gas oils, and residuum.
Unfractionated Streams. Mixtures of unsegregated natural gas liquid components excluding, those in plant condensate. This product is extracted from natural gas.
United States. The United States is defined as the 50 States and the District of Columbia.
Vacuum Distillation. Distillation under reduced pressure (less the atmospheric) which lowers the boiling temperature of the liquid being distilled. This technique with its relatively low temperatures prevents cracking or decomposition of the charge stock.
Visbreaking. A thermal cracking process in which heavy atmospheric or vacuum-still bottoms are cracked at moderate temperatures to increase production of distillate products and reduce viscosity of the distillation residues.
Wax. A solid or semi-solid material at 77 degrees Fahrenheit consisting of a mixture of hydrocarbons obtained or derived from petroleum fractions, or through a Fischer-Tropsch type process, in which the straight-chained paraffin series predominates. This includes all marketable wax, whether crude or refined, with a congealing point

Energy Information Administration/Petroleum Supply Monthly,148 April 2018
(ASTM D 938) between 80 (or 85) and 240 degrees Fahrenheit and a maximum oil content (ASTM D 3235) of 50 weight percent.
Working Storage Capacity. The difference in volume between the maximum safe fill capacity and the quantity below which pump suction is ineffective (bottoms).
Xylene (C6H4(CH3 )2 ). Colorless liquid of the aromatic group of hydrocarbons made the catalytic reforming of certain naphthenic petroleum fractions. Used as high-octane motor and aviation gasoline blending agents, solvents, chemical intermediates. Isomers are metaxylene, orthoxylene, paraxylene.