pharmacodynamics and drug-drug interactions in hcv/hiv - iapac
TRANSCRIPT

Pharmacodynamics and Drug-Drug
Interactions in HCV/HIV Co-Infected
Persons on Treatment with DAAs
Courtney V. Fletcher, Pharm.D.
Dean, College of Pharmacy
Professor, Department of Pharmacy Practice and Division of
Infectious Diseases
University of Nebraska Medical Center

Pharmacokinetics and Pharmacodynamics
- Lessons Learned from HIV -
Pharmacokinetics matter,
Pharmacodynamics (drug concentrations) matter,
Resistance matters,
Adherence matters, and
Convenience and tolerability matters.
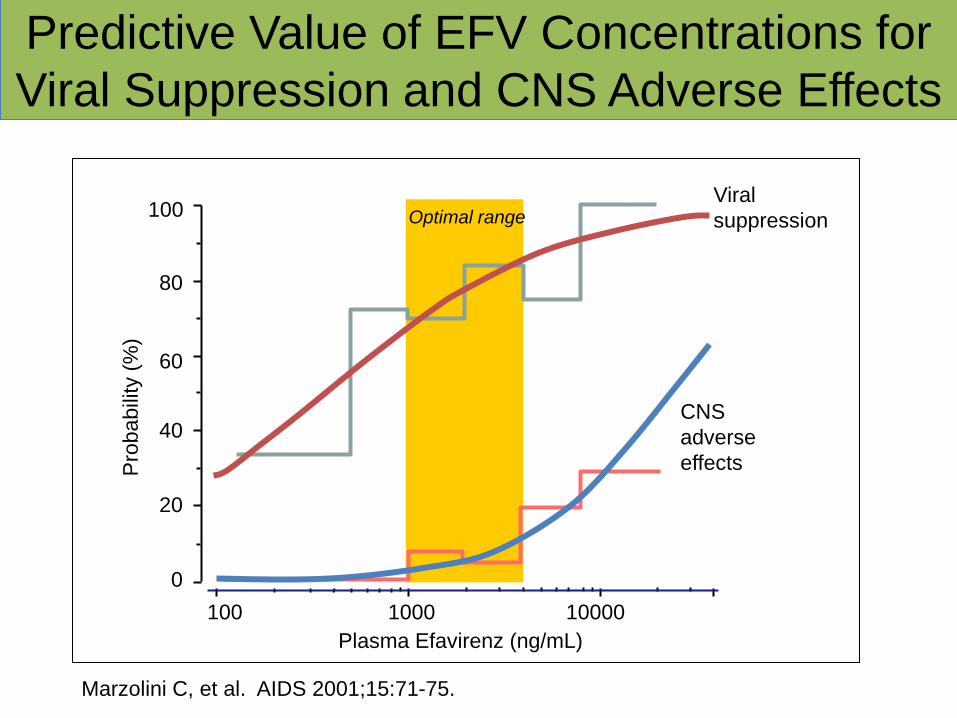
Predictive Value of EFV Concentrations for
Viral Suppression and CNS Adverse Effects
Viral
suppression
CNS
adverse
effects
Optimal range
Plasma Efavirenz (ng/mL)
10000 1000 100
0
60
80
100
40
20
Pro
babili
ty (
%)
Marzolini C, et al. AIDS 2001;15:71-75.

Boceprevir Exposure-Response
Relationships
Pro
bab
ilit
y o
f S
VR
Pro
bab
ilit
y o
f A
nem
ia
Wenning L, Flexner C, et al. AASLD 2012, Abstract 770.

Hemoglobin Decline and SVR with BOC/PR
0
10
20
30
40
50
60
70
80
≤ 1 >1-2 >2-3 >3-4 >4-5 >5
% S
VR
Maximum Hemoglobin Decline During Treatment (g/dL)
Sulkowski M, et al. Hepatology 2013;57:974-9

Telaprevir Exposure Response
Relationships
FDA. Telaprevir NDA Briefing Document.
TVR AUC24 at 750 q8h = 66,900 ± 26,100 ng*h/mL
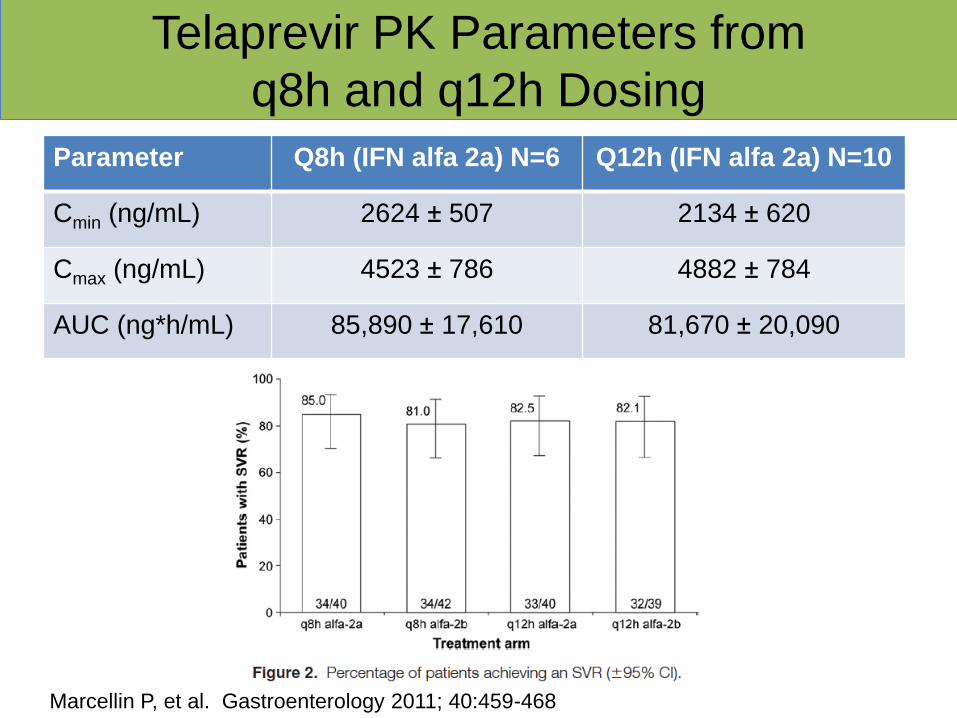
Telaprevir PK Parameters from
q8h and q12h Dosing
Parameter Q8h (IFN alfa 2a) N=6 Q12h (IFN alfa 2a) N=10
Cmin (ng/mL) 2624 ± 507 2134 ± 620
Cmax (ng/mL) 4523 ± 786 4882 ± 784
AUC (ng*h/mL) 85,890 ± 17,610 81,670 ± 20,090
Marcellin P, et al. Gastroenterology 2011; 40:459-468
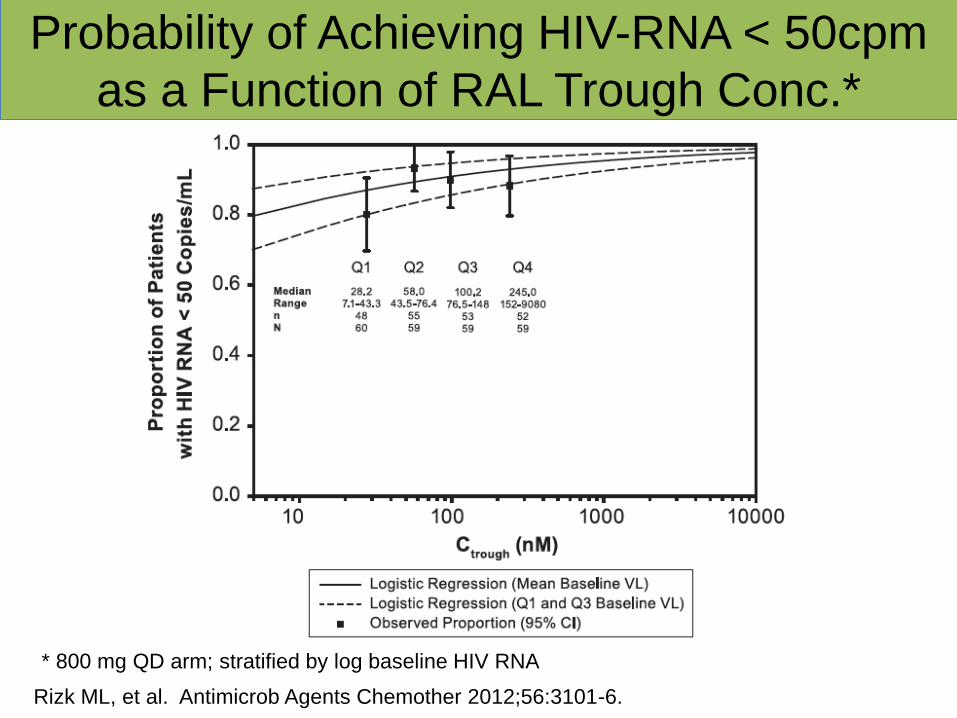
Probability of Achieving HIV-RNA < 50cpm
as a Function of RAL Trough Conc.*
Rizk ML, et al. Antimicrob Agents Chemother 2012;56:3101-6.
* 800 mg QD arm; stratified by log baseline HIV RNA

Raltegravir Once vs. Twice Daily
Eron JJ, et al. Lancet Infect Dis 2011;11:907-15

clinicaloptions.com/hepatitis
Highlights of AASLD 2012
SVR12 rates similar with TVR BID and q8h dosing regimens in all subgroups
Similar safety and tolerability profile in both treatment arms
OPTIMIZE: Efficacy of Telaprevir BID vs
Telaprevir q8h in GT1 HCV Infection
Buti M, et al. AASLD 2012. Abstract LB-8. Reproduced with permission.
TVR q8h/PR
TVR BID/PR
SV
R1
2 (
%)
0
20
40
60
80
100
CC CT TT
n/ N =
87 92
68 68 65 66
92/ 106
97/ 105
141/ 208
139/ 206
37/ 57
38/ 58
F0-2 F3/4
78 81
59 58
209/ 268
213/ 264
61/ 103
61/ 105
IL28B GT Liver Disease Status
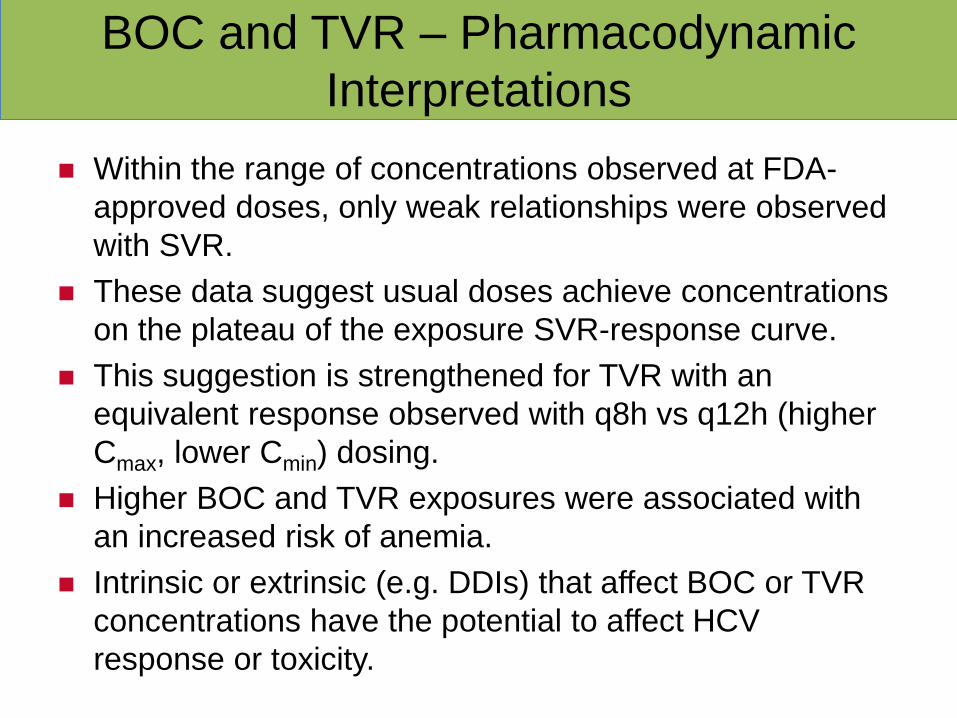
BOC and TVR – Pharmacodynamic
Interpretations
Within the range of concentrations observed at FDA-
approved doses, only weak relationships were observed
with SVR.
These data suggest usual doses achieve concentrations
on the plateau of the exposure SVR-response curve.
This suggestion is strengthened for TVR with an
equivalent response observed with q8h vs q12h (higher
Cmax, lower Cmin) dosing.
Higher BOC and TVR exposures were associated with
an increased risk of anemia.
Intrinsic or extrinsic (e.g. DDIs) that affect BOC or TVR
concentrations have the potential to affect HCV
response or toxicity.
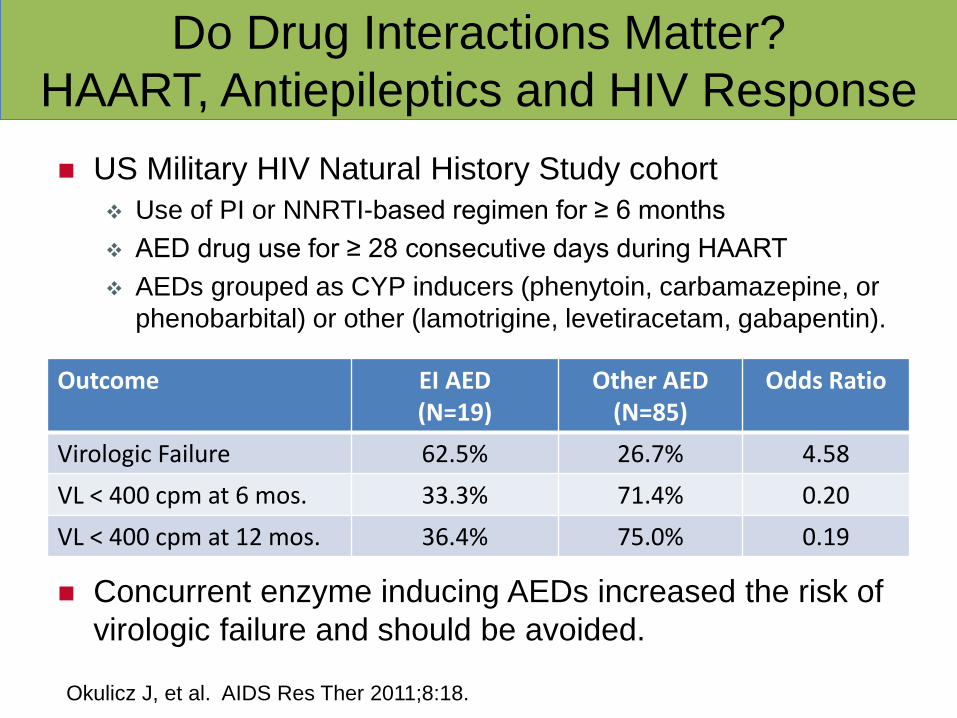
Do Drug Interactions Matter?
HAART, Antiepileptics and HIV Response
US Military HIV Natural History Study cohort
Use of PI or NNRTI-based regimen for ≥ 6 months
AED drug use for ≥ 28 consecutive days during HAART
AEDs grouped as CYP inducers (phenytoin, carbamazepine, or
phenobarbital) or other (lamotrigine, levetiracetam, gabapentin).
Concurrent enzyme inducing AEDs increased the risk of
virologic failure and should be avoided.
Outcome EI AED (N=19)
Other AED (N=85)
Odds Ratio
Virologic Failure 62.5% 26.7% 4.58
VL < 400 cpm at 6 mos. 33.3% 71.4% 0.20
VL < 400 cpm at 12 mos. 36.4% 75.0% 0.19
Okulicz J, et al. AIDS Res Ther 2011;8:18.

Drug-Drug Interactions: Management
Concepts
Some interactions are useful
Some interactions can be managed clinically
Some interactions are profound, and concomitant
administration is contraindicated
Some interactions affect both efficacy and toxicity
Some interactions have unclear clinical significance
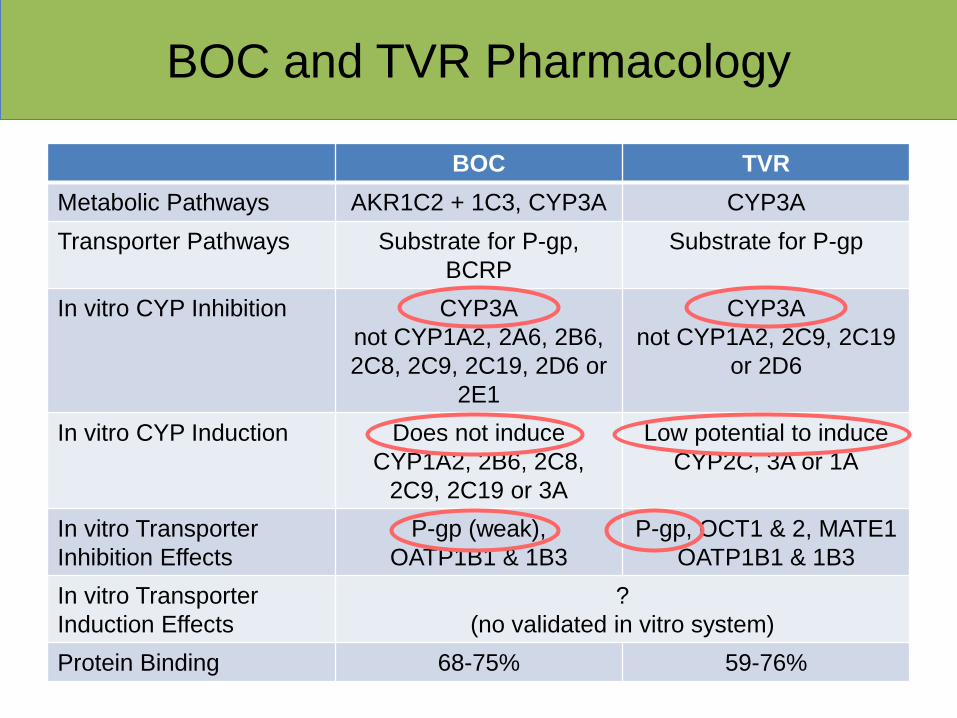
BOC and TVR Pharmacology
BOC TVR
Metabolic Pathways AKR1C2 + 1C3, CYP3A CYP3A
Transporter Pathways Substrate for P-gp,
BCRP
Substrate for P-gp
In vitro CYP Inhibition CYP3A
not CYP1A2, 2A6, 2B6,
2C8, 2C9, 2C19, 2D6 or
2E1
CYP3A
not CYP1A2, 2C9, 2C19
or 2D6
In vitro CYP Induction Does not induce
CYP1A2, 2B6, 2C8,
2C9, 2C19 or 3A
Low potential to induce
CYP2C, 3A or 1A
In vitro Transporter
Inhibition Effects
P-gp (weak),
OATP1B1 & 1B3
P-gp, OCT1 & 2, MATE1
OATP1B1 & 1B3
In vitro Transporter
Induction Effects
?
(no validated in vitro system)
Protein Binding 68-75% 59-76%
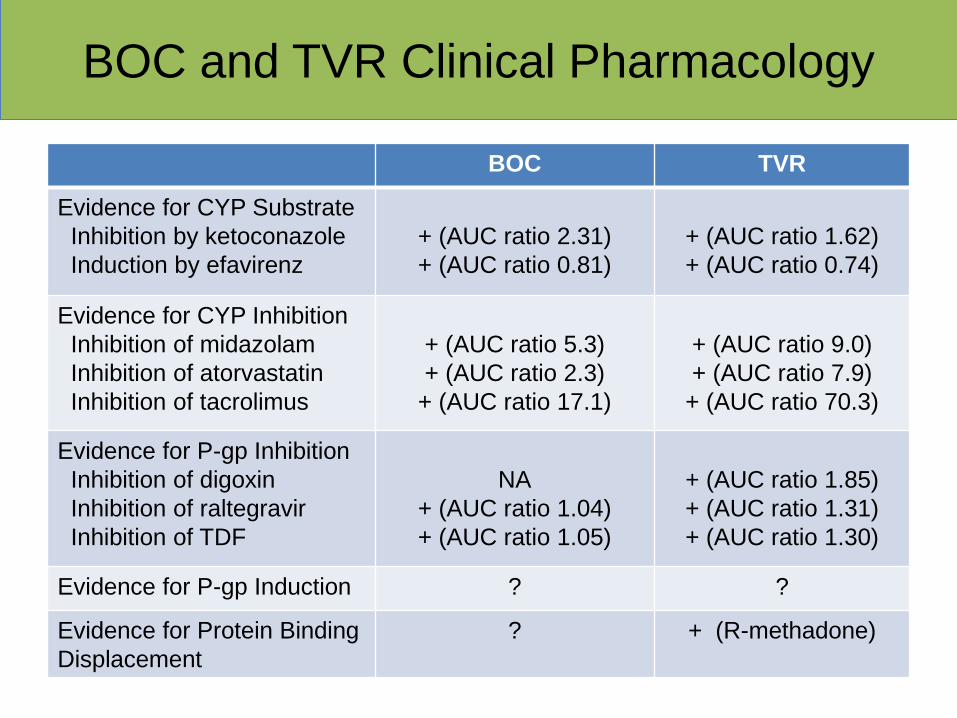
BOC and TVR Clinical Pharmacology
BOC TVR
Evidence for CYP Substrate
Inhibition by ketoconazole
Induction by efavirenz
+ (AUC ratio 2.31)
+ (AUC ratio 0.81)
+ (AUC ratio 1.62)
+ (AUC ratio 0.74)
Evidence for CYP Inhibition
Inhibition of midazolam
Inhibition of atorvastatin
Inhibition of tacrolimus
+ (AUC ratio 5.3)
+ (AUC ratio 2.3)
+ (AUC ratio 17.1)
+ (AUC ratio 9.0)
+ (AUC ratio 7.9)
+ (AUC ratio 70.3)
Evidence for P-gp Inhibition
Inhibition of digoxin
Inhibition of raltegravir
Inhibition of TDF
NA
+ (AUC ratio 1.04)
+ (AUC ratio 1.05)
+ (AUC ratio 1.85)
+ (AUC ratio 1.31)
+ (AUC ratio 1.30)
Evidence for P-gp Induction ? ?
Evidence for Protein Binding
Displacement
? + (R-methadone)
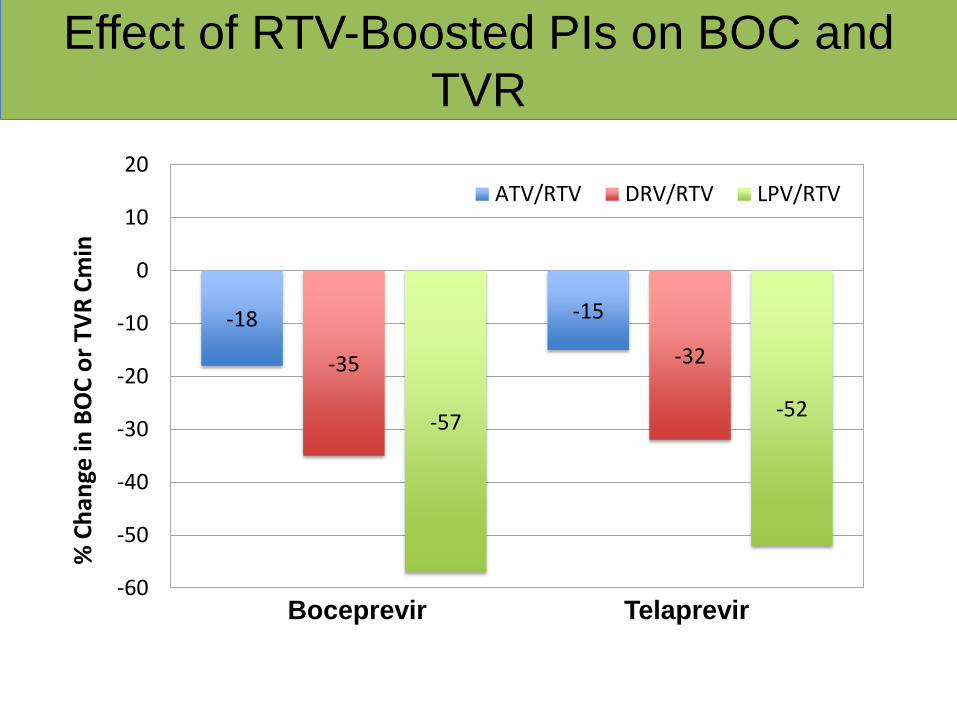
Effect of RTV-Boosted PIs on BOC and
TVR
-18 -15
-35 -32
-57 -52
-60
-50
-40
-30
-20
-10
0
10
20
% C
han
ge in
BO
C o
r TV
R C
min
ATV/RTV DRV/RTV LPV/RTV
Boceprevir Telaprevir

Effect of BOC and TVR on the RTV-Boosted
PIs, ATV, LPV and DRV
-49 -59 -43
85
-42
14
-80
-60
-40
-20
0
20
40
60
80
100
% C
han
ge in
PI C
min
BOC TVR
ATV/RTV DRV/RTV LPV/RTV

Effect of Tipranavir on RTV-boosted
Atazanavir, Amprenavir and Saquinavir
Walmsley S at al. JAIDS 2008;47:429-40.
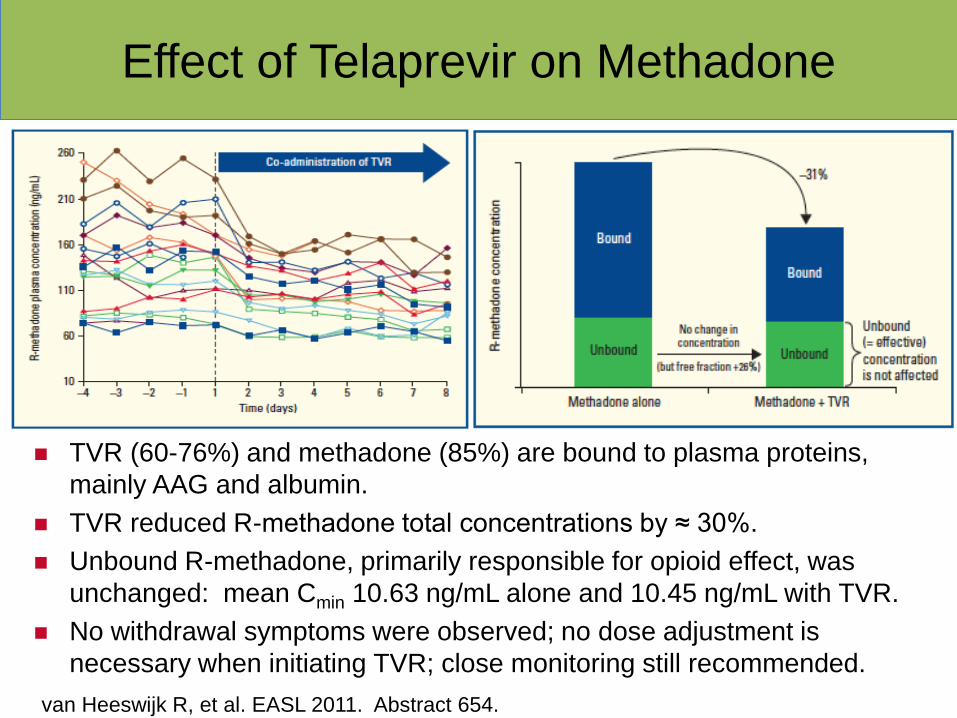
Effect of Telaprevir on Methadone
TVR (60-76%) and methadone (85%) are bound to plasma proteins,
mainly AAG and albumin.
TVR reduced R-methadone total concentrations by ≈ 30%.
Unbound R-methadone, primarily responsible for opioid effect, was
unchanged: mean Cmin 10.63 ng/mL alone and 10.45 ng/mL with TVR.
No withdrawal symptoms were observed; no dose adjustment is
necessary when initiating TVR; close monitoring still recommended.
van Heeswijk R, et al. EASL 2011. Abstract 654.

BOC and TVR with Etravirine and Rilpivirine
Combination Effect and Recommendation
BOC + ETR 1 ETR: AUC and Cmin ≈ 25%
BOC: AUC 10%; Cmin 12%
Rec: Combination not recommended
TVR + ETR 2 ETR: AUC and Cmin ≈ 6%
TVR: AUC 16%; Cmin 25%
Rec: Insufficient data for dose recommendation
(FDA, Feb 27); avoid coadministration at this time.
BOC + RPV 3 RPV: AUC 39%; Cmin 51%
BOC: AUC 6%; Cmin 4%
Rec: Coadministration should be OK (CVF).
TVR + RPV 2 RPV: AUC 78%; Cmin 93%
TVR: AUC 5%; Cmin 11%
Rec: Potential for RPV-associated QTc prolongation;
insufficient data for recommendation; avoid
coadministration at this time (CVF).
1. Hammond K, et al. JAIDS 2013;62:67-73. 2. Kakuda TN, et al. 13th International HIV Clinical Pharmacology
Workshop. Barcelona, Spain, April 2012. Abstract O-18. 3. Rhee E, et al. CROI 2013. Abstract 537.

Plasma and Intracellular Interactions with
Ribavirin (RBV)
Combination Effect and Recommendation
Abacavir and RBV 1 • Plasma RBV concentrations no different when RBV given alone or with ABC. • Intracellular RBV-triphosphate concentrations also not different. • No evidence for an interaction between ABC and RBV.
Telaprevir and RBV 2 • Dose adjusted RBV plasma concentrations were 1.54 higher in HCV-infected persons receiving TPV + PR vs PR only. • Intracellular RBV-MP, DP and TP concentrations in PBMCs were 2.5, 3 and 2-fold higher in TVR + PR vs. PR only. • Increased plasma and intracellular RBV exposure may contribute to the increased rates of anemia seen with TVR and RBV-containing HCV therapy.
1. Andrade A, et al. CROI 2013. Abstract 538. 2. Hammond K, et al. CROI 2013. Abstract 34.

Some Interesting Interaction Data from
AASLD 2012
Combination Effect and Recommendation
TVR and levothyroxine 1 4 patients treated with levothyroxine had increased
TSH after the start of TVR, which returned to
normal after TVR stopped. Mechanism uncertain;
more data needed; monitor.
BOC and ethinyl estradiol
norethindrone 2
AUC and Cmax of EE decreased 26% and 21%,
respectively. Cmax of NE decreased 17%. As long
as at least 1 mg of NE, interaction unlikely to be
clinically significant (FDA label 02/15/13).
BOC or TVR with CSA or
TAC 3,4,5,6,7
5 abstracts describing CSA and TAC dosing in
presence of BOC or TVR. CSA dose reductions
were from 0.5 to 1.5-fold reduction with BOC, and
up to 2.8-fold with TVR. TAC dose reductions were
6-fold for BOC and 25 to 40-fold with TVR.
Collectively provides evidence these interactions
may be manageable with close monitoring.
1. Abstract 1845. 2. Abstract 1901. 3-7. Abstracts 9, 10, 208, 209, 720.
AASLD Annual Meeting, Nov 2012. Boston.

The Future of HIV and HCV Drug-Drug
Interactions
Combination Effect
Sofosbuvir and CSA or TAC 1 CSA, 2% decrease in AUC.
TAC, 9% increase in AUC.
• No clinically relevant interaction.
Sofosbuvir and TDF/FTC/EFV,
RPV, DRV/RTV and RAL 2
HIV: TFV Cmax increased 25%; RAL AUC
decreased 27%.
SOF: Cmax decreased 20% with
TDF/FTC/EFV; RPV, DRV/RTV, RAL
increased AUC 21-45% but no effect on
major metabolite (GS-331007).
• No evidence for clinically relevant
interactions.
Sofusbuvir + ledipasvir + RBV 3 • Well tolerated and achieved potent antiviral
suppression, with a 100% SVR-12 in
treatment-naïve (25/25) and experienced
(9/9) HCV GT1 persons.
1. Abstract 1869; 2. Abstract 1877. AASLD, Nov 2012. Boston. 3. Abstract 41LB,
CROI 2013. Atlanta.

TVR Dynamics – Where Does the Risk of
Virologic Failure Increase?
EFV reduces TVR conc; AUC
decrease is 26%.
With EFV, expected AUC24 is
34,570 ± 11,062 ng*h/mL,
which is an exposure range less
than achieved with TVR usual
dose.
An increased dose of TVR to
1125 mg q8h is recommended
to manage this drug interaction.
Parameter TVR (750 q8h + EFV)
Cmax (ng/mL) 2297 ± 627 (9%)
Cmin (ng/mL) 745 ± 352 (47%)
AUC8 (ng*h/mL) 11,523 ± 3663 (26%)
TFV PK with EFV AUC24 of 34,500. Where
is the inflection point off
the plateau phase?

clinicaloptions.com/hepatitis
Highlights of AASLD 2012
Study 110: SVR24 With TVR + PegIFN/RBV
in HCV GT1/HIV-Coinfected Patients Higher SVR24 rate with TVR-based
therapy TVR plasma levels similar in
patients with or without ART
TVR dose increased to 1125 q8h if given with EFV
– EFV and ATV/RTV plasma levels similar in patients with or without TVR
No HIV breakthroughs in patients using ART during HCV treatment
Safety and tolerability similar to treatment in patients with HCV monoinfection
Sulkowski MS, et al. AASLD 2012. Abstract 54. Reproduced with permission.
Telaprevir + PR
Placebo + PR
74 71 69
80
45
33
50 50
0
20
40
60
80
100
28/ 38
10/ 22
5/ 7
2/ 6
11/ 16
4/ 8
12/ 15
4/ 8
SV
R2
4 (
%)
n/N =
Clinical Significance of Drug-Drug
Interactions
The clinical significance of a drug-drug interaction can
only be determined or confirmed through a clinical study.
In the absence of (or pending) clinical trial data, well
defined exposure-response data provide a basis to
predict the significance of a drug-drug interaction;
however, there will be settings where the existing data
are not informative as to PK and PD of the interaction.
Exercise a measure of caution in managing drug
interactions where no confirmatory clinical data exist.

Drug Interaction Resources
hivinsite.ucsf.edu Updated drug interaction database with references and interactive tool to assess drug interactions.
www.aidsinfo.nih.gov DHHS Guidelines for use of antiretroviral agents and updated drug interaction tables.
www.hiv-druginteractions.org www.hep-druginteractions.org Downloadable drug interaction charts; interactive tools to assess interactions; updated news on published abstracts and papers
www.hivmedicationguide.com Interactive drug interaction database
Micromedex: comprehensive drug database (subscription required); an app is available

Thank You


EXTRAs

Clinical Pharmacology
Major goals in clinical pharmacology are to describe,
quantitate and predict drug effects in humans.
Pharmacokinetics: the time course of a drug in humans
Pharmacodynamics: relationships between the dose or
concentration of drug in the body (exposure) and
measured effects
Pharmacogenetics: relationships among discrete
inherited traits related to drug absorption and disposition,
and response

Drug Interactions
Occur when either the pharmacokinetics or the
pharmacodynamics of one drug is altered by another
are a source of variability in drug response
are graded responses, that are dependent upon the
concentration of the interacting species, and on dose
and time
pharmacokinetic interactions may affect absorption
rate, availability, distribution, and hepatic or renal
clearance
pharmacodynamic interactions may be antagonistic,
synergistic, or additive

Effect of RTV-Boosted PIs on
Boceprevir, Telaprevir and Tenofovir
-18 -15
22
-35 -32
37
-57 -52
51
-60
-40
-20
0
20
40
60
% C
han
ge in
BO
C, T
VR
or
TDF
Cm
in
ATV/RTV DRV/RTV LPV/RTV
Boceprevir Telaprevir Tenofovir