phoenix sky harbor international aviation symposium - …€¦ · · 2018-03-30phoenix sky harbor...
TRANSCRIPT

© Oliver Wyman AVIATION, AEROSPACE & DEFENSE
Phoenix Sky Harbor International Aviation Symposium
APRIL 2–4, 2014
• How are traditional hubs affected by industry changes, such as the substitution of low-cost, short-haul feed partners; range improvements in small- and medium-sized aircraft; and introduction of the 787 and A350?
• How can airlines and airports position themselves for success in a world of changing flows?
• Is low-cost, long-haul transoceanic service becoming viable?
Panel 1
Hub 3.0

2 2 © Oliver Wyman
50 Longest 787 Routes The 50 longest 787 routes are concentrated in Asia. In August, airlines will operate 787s with 311 daily departures. The longest 787 flight is from Toronto to Addis Ababa, Ethiopia: 7,154 miles.
NRT – Tokyo Narita
LAX – Los Angeles
HND – Tokyo Haneda
ARN – Stockholm Arlanda
LHR – London Heathrow
MEX – Mexico City
YYZ – Toronto Pearson
CAN – Guangzhou, China
OSL – Oslo, Norway
PEK – Beijing (Capital)
SFO – San Francisco
Routes 10 6 5 4 4 4 4 3 3 3 3
Airports with the largest number of the 50 longest 787 routes

3 3 © Oliver Wyman
50 Longest A380 Routes The 50 longest A380 routes are concentrated in the Middle East and Europe. In August, airlines will operate A380s for 194 daily departures. The longest A380 flight is Dubai, UAE, to Los Angeles: 8,336 miles
DXB – Dubai, UAE
CDG – Paris de Gaulle
FRA – Frankfurt, Germany
LAX – Los Angeles
SIN – Singapore Changi
LHR – London Heathrow
ICN – Seoul, South Korea
HNK – Hong Kong
JFK – New York Kennedy
SYD – Sydney
Routes 14 11 9 8 7 6 5 4 4 4
Airports with the largest number of the 50 longest A380 routes
Source: PlaneStats.com > schedule > monthly operations for August 2014. Map generated by the Great Circle Mapper - copyright © Karl L. Swartz.

4 4 © Oliver Wyman
50 Longest 777 Routes The longest 777 routes are split among the US, Asia and Middle East. In August, airlines will operate 777 on 2,140 daily departures. The longest 777 route is Atlanta to Johannesburg: 8,449 miles
Airports with the largest number of the 50 longest 777 routes
DXB – Dubai, UAE.
LAX – Los Angeles
HKG – Hong Kong
AUH – Abu Dhabi, UAE.
DOH – Doha, Qatar
DFW – Dallas/ Fort Worth
EWR – New York Newark
JFK – New York Kennedy
ORD – Chicago O’Hare
SYD – Sydney
Routes 8 7 6 5 5 4 4 4 4 4 Source: PlaneStats.com > schedule > monthly operations for August 2014. Map generated by the Great Circle Mapper - copyright © Karl L. Swartz.
5 5 © Oliver Wyman
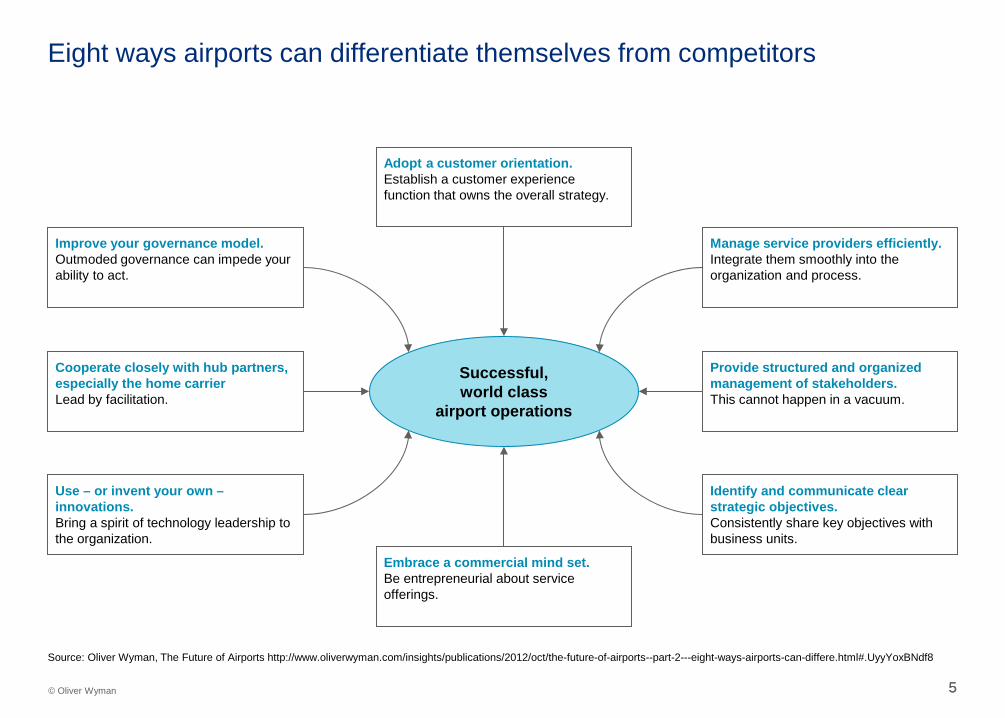
Eight ways airports can differentiate themselves from competitors
Successful, world class
airport operations
Embrace a commercial mind set. Be entrepreneurial about service offerings.
Manage service providers efficiently. Integrate them smoothly into the organization and process.
Provide structured and organized management of stakeholders. This cannot happen in a vacuum.
Use – or invent your own – innovations. Bring a spirit of technology leadership to the organization.
Identify and communicate clear strategic objectives. Consistently share key objectives with business units.
Adopt a customer orientation. Establish a customer experience function that owns the overall strategy.
Cooperate closely with hub partners, especially the home carrier Lead by facilitation.
Improve your governance model. Outmoded governance can impede your ability to act.
Source: Oliver Wyman, The Future of Airports http://www.oliverwyman.com/insights/publications/2012/oct/the-future-of-airports--part-2---eight-ways-airports-can-differe.html#.UyyYoxBNdf8

• Then and now: What are typical airline career trajectories? How have the economics and demographics changed over time? Are there shortages of pilots, mechanics, and others?
• Management career paths: What skills and experiences will be essential for airline executives in the future?
• Which industries will attract airline executives or provide new executives, and how will that shape the future of industry leadership?
Panel 2
The airline workforce – what will the labor
market provide?
7 7 © Oliver Wyman
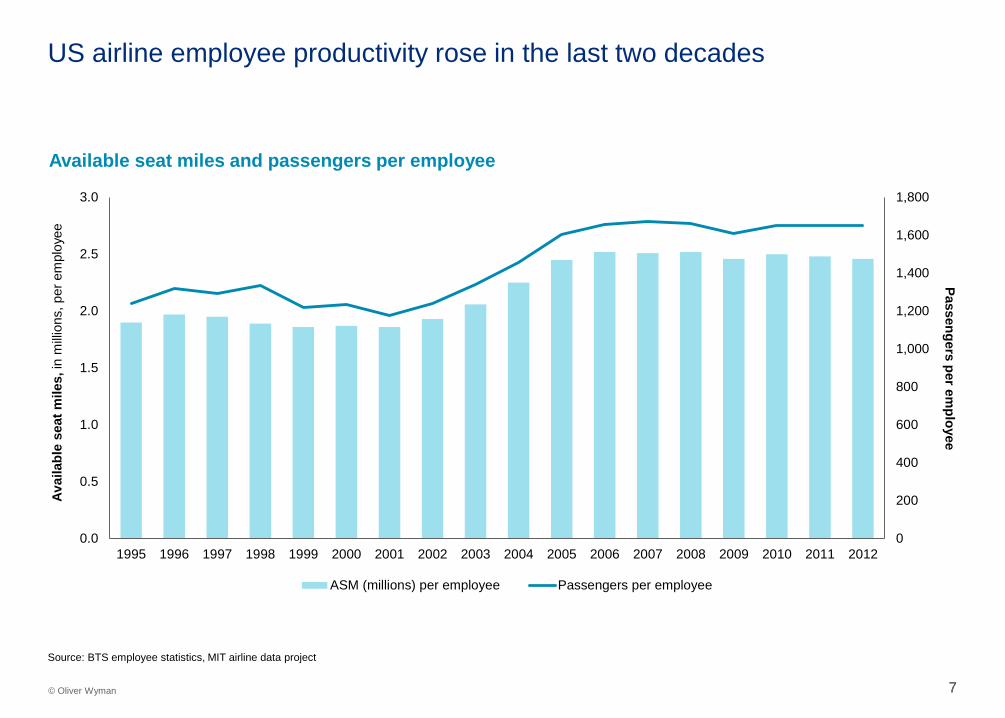
US airline employee productivity rose in the last two decades
0
200
400
600
800
1,000
1,200
1,400
1,600
1,800
0.0
0.5
1.0
1.5
2.0
2.5
3.0
1995 1996 1997 1998 1999 2000 2001 2002 2003 2004 2005 2006 2007 2008 2009 2010 2011 2012
ASM (millions) per employee Passengers per employee
Available seat miles and passengers per employee
Avai
labl
e se
at m
iles,
in m
illion
s, p
er e
mpl
oyee
Passengers per em
ployee
Source: BTS employee statistics, MIT airline data project

8 8 © Oliver Wyman
Total US airline employment declined in the last two decades
$0
$10,000
$20,000
$30,000
$40,000
$50,000
$60,000
$70,000
$80,000
0
50,000
100,000
150,000
200,000
250,000
300,000
350,000
400,000
450,000
500,000
1995 1996 1997 1998 1999 2000 2001 2002 2003 2004 2005 2006 2007 2008 2009 2010 2011 2012
Pilots/co-pilots Flight attendantsPassenger, cargo and aircraft handling Maintenance (in-house)Management/other Annual average wages and salaries
Total employees and average wages/salaries
Average wages/salaries
Tota
l em
ploy
ees
Source: BTS employee statistics, MIT airline data project

9 9 © Oliver Wyman
Asia pacific sees strongest demand for new pilots and technicians
Source: Boeing Current Market Outlook (2013-2032)
Pilot and technician outlook
New pilots by region 2013–2032
New technicians by region 2013–2032
39%
20%
17%
10%
8%
3% 3%
Region Pilots
Asia Pacific 192,300
Europe 99,700
North America 85,700
Latin America 48,600
Middle East 40,000
Africa 16,500
CIS 15,200
Total = 498,000
39%
19%
18%
9%
9%
3% 3%
Region Technicians
Asia Pacific 215,300
Europe 108,200
North America 97,900
Latin America 53,100
Middle East 47,600
Africa 18,000
CIS 15,900
Total = 556,000

• Have alliances delivered on the promise of seamless service? Is the customer experience closer to being truly seamless among joint venture partners with anti-trust immunity?
• What intra-alliance conflicts are emerging? How are the new bilateral carrier agreements impacting the traditional alliances?
• What degree of partnership between mainline and regional or low-cost feed providers is required to deliver benefits?
Panel 3
Alliances, partnerships, and the customer
experience

11 11 © Oliver Wyman
Alliance share of departures by region in August 2014
16%
25%
7%
52%
Global total Star 21.0%
SkyTeam 17.6%
Oneworld 13.8%
Other 47.6% 21%
21%
25%
33% 21%
15%
12%
52%
Asia US Europe
Source: PlaneStats.com > schedule > monthly operations for August 2014. US Airways will leave Star at the end of March 2014 and join oneworld as American’s affiliate.
Star SkyTeam Oneworld Other
VERSION 2
12 12 © Oliver Wyman
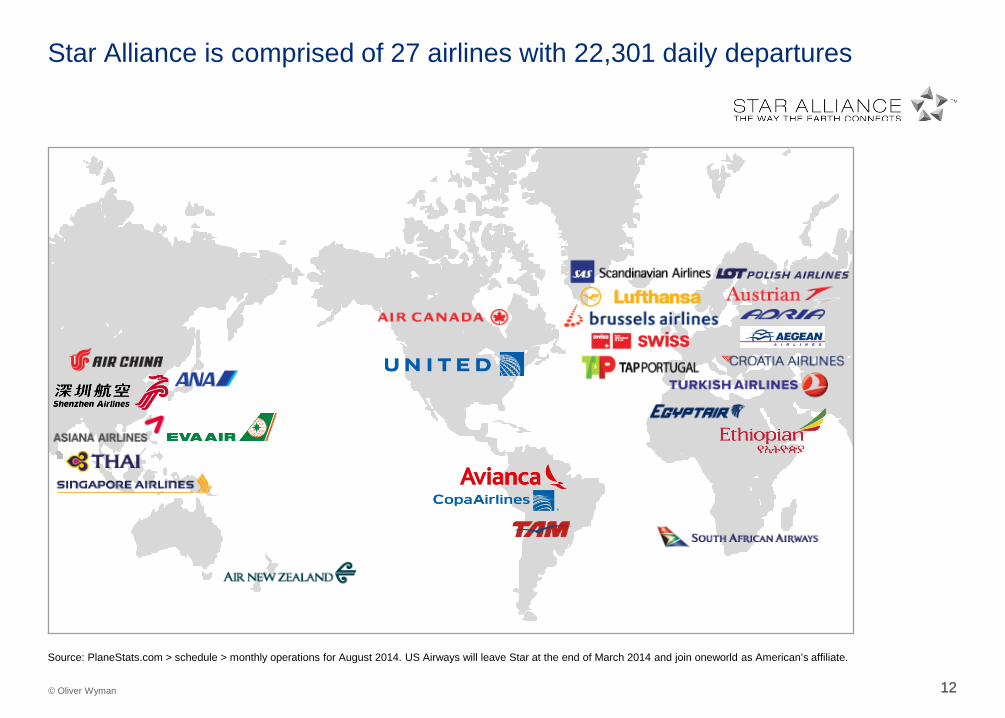
Source: PlaneStats.com > schedule > monthly operations for August 2014. US Airways will leave Star at the end of March 2014 and join oneworld as American’s affiliate.
Star Alliance is comprised of 27 airlines with 22,301 daily departures

13 13 © Oliver Wyman
Source: PlaneStats.com > schedule > monthly operations for August 2014
SkyTeam is comprised of 20 airlines with 16,283 daily departures

14 14 © Oliver Wyman
Oneworld is comprised of 14 airlines with 12,772 daily departures
Source: PlaneStats.com > schedule > monthly operations for August 2014. US Airways will leave Star at the end of March 2014 and join oneworld as American’s affiliate.

15 15 © Oliver Wyman
Source: PlaneStats.com > schedule > monthly operations for August 2014
Top 10 non-aligned airlines account for approximately 25.8% of total non-aligned departures

• How are consumers using technology to create better service environments and get more out of their travel experiences?
• What are the major battles being waged between airlines and third-party intermediaries? Will travelers ultimately own and manage their digital travel plans, or will these plans be held by travel partners?
• Who are the emerging key players in the digital battle for the customer? Which new entrants are gaining ground from outside the traditional industry set?
Panel 4
The digital age takes flight – battle
for the customer

17 17 © Oliver Wyman
Social media following doesn’t correlate to airline size The world’s largest airlines have dramatically different results on Facebook and Twitter
Airline Daily departures Facebook page likes Twitter followers
Delta 5,589 1,272,737 639,410
United 5,421 699,867 413,119
American 3,557 1,475,176 785,573
US Airways 3,115 135,269 410,979
Southwest 3,195 4,210,929 1,635,081
China Southern 1,988 NA 24,252
RyanAir 1,730 NA 64,044
Air Canada 1,657 842,816 180,570
China Eastern 1,612 NA 264
Lufthansa 1,470 1,577,491 143,195
easyJet 1,390 245,264 180,489
Turkish 1,239 3,674,096 418,888
ANA 1,233 544,097 142,901
Air China 1,165 66,243 3,701
British Airways 1,006 1,217,258 406,381
Air France 973 3,540,193 329,872
Alaska 934 395,931 105,813
jetBlue 894 898,335 1,804,185
GOL 879 1,802,040 284,030
Aeroflot 796 41,364 52,403
Notes: Source: PlaneStats.com departures for August 2014, Facebook.com and Twitter.com as of March 31.

• Are investors now expecting airlines to live by the criteria of 10 percent or greater return on invested capital? If so, how does this change future airline expansion decisions?
• What is the business case for new versus older aircraft in different fuel price environments?
• Is the airline investor profile changing from short-term trader to more typical fund manager?
Panel 5
The 10%+ ROIC world and its impact
on expansion, aircraft orders, and other
investments

19 19 © Oliver Wyman
3Q2013 Load factor: 86.1% Break-even load factor: 77.8%
Source: PlaneStats.com > form 41 financial > financial indicators for all network carriers, domestic entity
US network carriers generate profit on more domestic seats US network carriers’ domestic average load factor has reached 86 percent, while break-even load factor has dropped to less than 78 percent, generating a profit on 13 seats per departure
Covers cost Profit Revenue opportunity
20 20 © Oliver Wyman
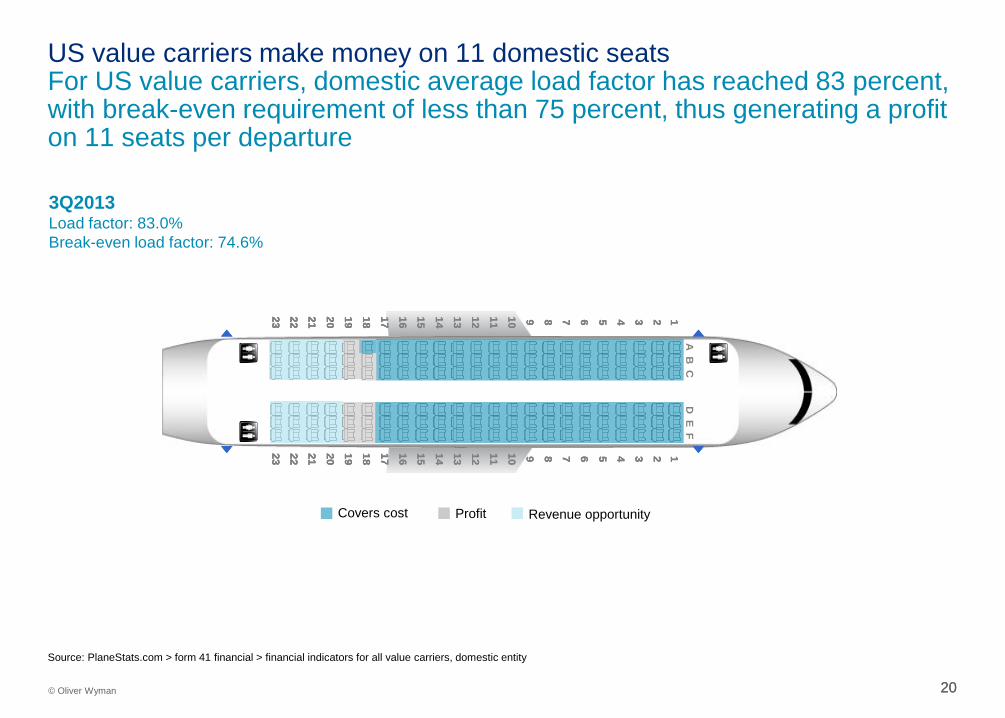
US value carriers make money on 11 domestic seats For US value carriers, domestic average load factor has reached 83 percent, with break-even requirement of less than 75 percent, thus generating a profit on 11 seats per departure
Source: PlaneStats.com > form 41 financial > financial indicators for all value carriers, domestic entity
3Q2013 Load factor: 83.0% Break-even load factor: 74.6%
11
22
33
44
55
66
77
88
99
1010
1111
1212
1313
1414
1515
1616
1717
1818
1919
2020
2121
2222
2323
A B
CD
E F1
12
22
2
33
33
44
44
55
55
66
66
77
77
88
88
99
99
1010
1010
1111
1111
1212
1212
1313
1313
1414
1414
1515
1515
1616
1616
1717
1717
1818
1818
1919
1919
2020
2020
2121
2121
2222
2222
2323
2323
A B
CD
E F
Covers cost Profit Revenue opportunity

• Electronic devices: Will cell phones be permitted?
• Expanded pre-check and other security improvements: Are more consumer protection regulations on the way?
• What is the cost and impact of recent regulations: tarmac delay rules and ancillary fee displays?
• How will regulations develop around requiring access to airline ancillary products for on-line and traditional travel agencies?
Panel 6
Regulatory changes ahead – good, bad,
and indifferent

22 22 © Oliver Wyman
US government regulations on airlines compared with other industries
Source: Airlines for America
Airlines Hotels Rental cars Cruises Amtrak Buses Cable Telecom
Service delivery reporting No No No No No No No
Full-fare advertising (incl. taxes) No No No No No No No
Ancillary revenue reporting No No No No No No No
24-hour purchase refund ability No No No No No No No
Detailed reporting of demand No No No No No No
Detailed reporting of cost No No No No
Reporting of average prices paid No No No No No
Operational contingency plans No
23 23 © Oliver Wyman
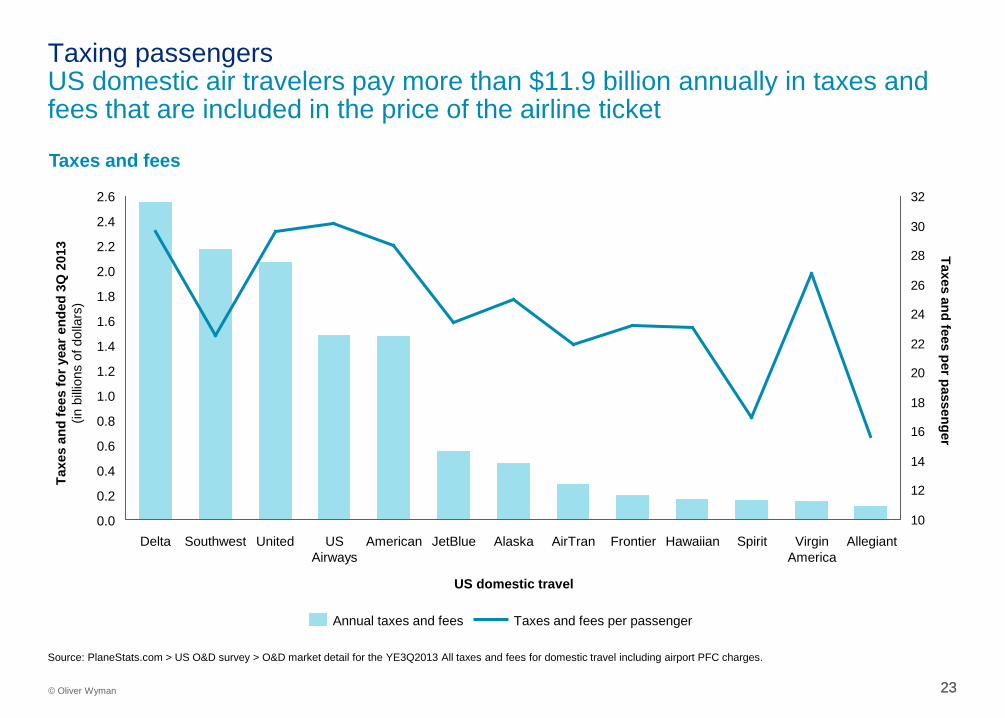
Source: PlaneStats.com > US O&D survey > O&D market detail for the YE3Q2013 All taxes and fees for domestic travel including airport PFC charges.
Taxe
s an
d fe
es fo
r yea
r end
ed 3
Q 2
013
(in
billi
ons
of d
olla
rs)
Taxing passengers US domestic air travelers pay more than $11.9 billion annually in taxes and fees that are included in the price of the airline ticket
10
12
14
16
18
20
22
24
26
28
30
32
0.0
2.6
2.4
2.2
2.0
1.8
1.6
1.4
1.2
1.0
0.8
0.6
0.4
0.2
US domestic travel
Allegiant Virgin America
Spirit Hawaiian Frontier AirTran Alaska American US Airways
United Southwest Delta JetBlue
Taxes and fees per passenger Annual taxes and fees
Taxes and fees per passenger
Taxes and fees

24 © Oliver Wyman 24
About PlaneStats.com
PlaneStats.com is powerful suite of analytical tools and enhanced aviation data that allows users to rapidly and intuitively craft custom analysis to make critical business decisions.
Inclusive of key industry and governmental data sets, paired with our own proprietary research and algorithms, it is easy to use and very flexible to analyze things like airline schedules, fleet composition, cost data, passenger loads and more.
For more information, please contact Peter Otradovec at [email protected] or see www.PlaneStats.com.