physical oceanography of the prydz bay region of antarctic...
TRANSCRIPT

Pergamon Dn,@<w Rrrmrclt I, Vol. 43, No. 5. pp. 603-641. 1996
Copyright :c~ 1996 Elsevier Science Ltd
PII: S0967-0637(96)00028-3 Printed in Great Britain. All rights reserved
OY67-0637;96 $IS.OO+O.Ofl
Physical oceanography of the Prydz Bay region of Antarctic waters
RICHARD A. NUNES VAZ* and GEOFFREY W. LENNONP
(Received 19 April 1995; in revisedjhm 23 October 1995; accepred 27 January 1996)
Abstract-Hydrographic data from four major Australian cruises to the Prydz Bay region are interpreted to show features of the large-scale circulation that remain consistent across a number of years. A large cyclonic gyre, extending from within the Bay to the Antarctic Divergence north-west of the Bay, is recognised in all of the data. It is associated with a relatively narrow coastal current that runs from the southern limits of Prydz Bay past the Amery Ice Shelf, and continues westward after leaving the Bay (becoming very strong, with currents exceeding 1 m s-i) along the MacRobertson Land shelf. Part of the current flows offshore near 63”E. while another (unknown) fraction continues westward. Data from a number of current-meter moorings deployed within the Bay and on the MacRobertson Land shelf lend support to the interpretation of gross features of the circulation. Coherences between different vertical levels show that the shelf waters respond barotropically to variations of a few days period or more. Little coherence with winds measured at Davis and Mawson stations was evident. Diurnal variations are strong near the shelf edge. and are associated with substantial encroachment of (modified) Circumpolar Deep Water over the shelf break. Dense water production within Prydz Bay appears to mimic processes occurring within the Weddell Sea, involving the intrusion of modified Circumpolar Deep Water over the shelf, and its mixing with High Salinity Shelf Water (and Ice Shelf Water) promoted by marginal or unstable conditions below the intrusions. No observations of dense plumes leaving Prydz Bay have been obtained. Instead, this paper tests the hypothesis, dynamically, that locally formed Antarctic Bottom Water observed near the foot of the continental slope at 62”E in 1974, had its origin in Prydz Bay. An integral model of the descent of a dense plume over a sloping boundary, also incorporating the fully non-linear equation of state of seawater, implies an origin either within Prydz Bay or to the west of the Bay. Copyright c 1996 Elsevier Science Ltd
INTRODUCTION
This paper considers the physical oceanography of Prydz Bay and its adjacent oceanic region based, primarily, on interpretation of hydrographic data from a number of cruises, with additional information from several current-meter deployments. The intention is to build upon the inferences of previously published accounts of Prydz Bay physical oceanography (Smith et al., 1984; Middleton and Humphries, 1989; Smith and Treguer, 1994) aiming (a) to determine the most consistent picture of the low-frequency circulation in the region, that is, the circulation over the shelf and its interaction with the adjacent oceanic region; and (b) to look at the characters and distributions of dense shelf waters as part of the issue of whether Prydz Bay contributes to the production of Antarctic Bottom Water.
*Department of Geography and Oceanography, University College, University of New South Wales. Australian Defence Force Academy, Campbell ACT, 2600, Australia.
t National Tidal Facility, Mark Oliphant Building, Science Park Adelaide, Laffer Drive, Bedford Park, 5042, South Australia.
603

604 R. &*Nunes Vaz and G. W. Lemon
Compared with the Weddell and Ross Seas, relatively little has been written about Prydz Bay. Wyrtki (1971) provides an overview of early expedition results in the region, and Smith et al. (1984) provide a comprehensive summary of major findings to 1980.
In earlier decades, pre-1970, there were a number of Soviet exploratory voyages in the oceanic region (the Ob voyages, Maksimov, 1958; Ledenev, 1964; Ostrekin, 1966) and over the shelf (Zverev, 1959, 1963; Izvekov, 1959). The early data lacked sufficient detail for dynamical purposes, but this was corrected in the later 06 voyages (Sen’ko, 1967; Savatiugin and Komova, 1971; Denisov and Myznhikova, 1978). At about the same time, vessels of the U.S.A. began to operate in the larger-scale region of the south-west Indian Ocean, i.e. the Eltanin, 1971-1972 along 88”E (Gordon and Molinelli, 1982) and the Conrad, 1974, from the Antarctic shelf at 62”E to the Crozet and Kerguelen Plateaus and South Africa (Jacobs and Georgi, 1977).
Australia’s involvement grew from its commitment to the First International BIOMASS (Biological Investigation Of Marine Antarctic Systems and Stocks) experiment (FIBEXl) of CCAMLR (Convention for the Conservation of Antarctic Marine Living Resources). FIBEXI was a program involving 12 vessels from 11 countries aimed at assessing the distribution and abundance of krill. There followed a number of similar, biologically- motivated cruises in the Prydz Bay region from early 1981 through the following summer seasons. Hydrographic data were obtained from the Nella Dan, operated by the Australian Antarctic Division. Specifically, those ANARE (Australian National Antarctic Research Expedition) voyages that involved the collection of physical oceanographic data are listed below.
Voyage acronym
FIBEX18 1 GEOSCI_82 ADBEXl_82 ADBEX2_84 SIBEX2_85 ADBEX3_85 AAMBER-
Voyage dates Casts Data report
Jan.-Mar. 1981 52 Kerry et al., 1987a Jan.-Mar. 1982 7 Woehler et al., 1987b Nov.-Dec. 1982 79 Kerry and Woehler, 1987 Jan.-Feb. 1984 22 Jan. 1985 64 Kerry et al., 1987b Sep.-Dec. 1985 50 Woehler et al., 1987a Feb.-Mar 1987 96 Woehler and Williams, 1988
The suffices to cruise names indicate the year of the cruise; they did not appear as parts of the original cruise acronyms.
Smith et 01. (1984) presented a detailed account of the FIBEXl81 data, making extensive comparisons with, and use of, Soviet material from the earlier expeditions in the area. Middleton and Humphries (1989) considered all of the above data, with the exception of AAMBER_87, to update the view of Prydz Bay oceanography, and to look, in more detail, at the processes of dense water formation. Neither study was conclusive on the issue of Bottom Water production, although the underlying tone of both was that Prydz Bay was unlikely to produce anything sufficiently dense. More recently, Smith and Treguer (1994) used ANARE and French physical and chemical data to argue against local formation, on the grounds that there is no detectable local contribution to bottom conditions in the Weddell-Enderby Basin somewhat to the north (at 6O”S, 66”E). This is a different issue from the question of whether Prydz Bay is a source of Antarctic Bottom Water (AABW), because the properties of bottom waters from both the Weddell Sea and Prydz Bay may be difficult to distinguish in this region. It must be stated that, in terms of relative quantities, any

Physical oceanography of Prydz Bay region 605
-67
-68
-69
68 70 72 74 76 78 80
-67
-69
-70
Fig. 1. Bathymetry of the Prydz Bay shelf region. The positions of current-meter moorings are indicated by the year of deployment and the mooring number.

606 R. A. Nunes Vaz and G. W. Lennon
GEOPOTENTIAL ANOMALY 50-500m ADBEX-1 NovlDec 1982 , I I I I I I 1 , I I
??I I
\ \ \ I I 6Davis
68’ E 70’ E I
72’ E I I I
>i 74’ E 76” E I I
78’ E I I I I
DEPTHS IN METRI
Fig. 2. Horizontal contoured distribution of the geopotential anomaly between SO m and 500 m within the Prydz Bay shelf zone, based on data from the ADBEX182 cruise, Nov./Dee. 1982.

Physical oceanography of Prydz Bay region 607
GEOPOTENTIAL ANOMALY (m’s”) 50-5OOm AAMBER Feb/Mar 1987
I ’ 1 I J , , , , I I , , I
MAC. ROBERTSON
PRINCESS
ELIZABETH
LAND
69’ E 70’ E 72” E , , 76’ E I I I I 78’ E
I I I I _I DEPTHS IN METRES
Fig. 3. Horizontal contoured distribution of the geopotential anomaly between 50 m and 500 m within the Prydz Bay shelf zone, based on data from the AAMBER- cruise, Feb./Mar. 1987.

608 R. A. Nunes Vaz and G. W. Lennon
GEOPOTENTIAL ANOMALY (m*s-2) 50-200m FIBEX Jan/Mar 1981
MAC. ROBERTSON LAND
?? ??
?? Y----l* I
ELIZABETH LAND
100 kllometres
Fig. 4. Horizontal contoured distribution of the geopotential anomaly between 50 m and 200 m within the Prydz Bay oceanic zone, based on data from the FIBEXl81 cruise, Jan./Mar. 1981.

Physical oceanography of Prydz Bay region 609
GEOPOTENTIAL ANOMALY (m’s”) 50-500m SIBEX-2 Jan 1985
DEPTHS IN METRES
Fig. 5. Horizontal contoured distribution of the geopotential anomaly between 50 m and 500 m within the Prydz Bay oceanic zone, based on data from the SIBEX2_85 cruise, Jan. 1985. The
diagram also indicates the position of mooring S/4.

610 R. A. Nunes Vaz and G. W. Lennon
GEOPOTENTIAL ANOMALY (m2r2) 50-500m COMPOSITE (1981,1982,1985 & 1987)
ELIZABETH LAND
100 kilometres
DEPTHS IN METRES
Fig. 6. Smoothed composite distribution of geopotential anomaly between SO m and 500 m, from all four major cruises (FIBEXI_Il, ADBEXl_82, SIBEX2_85 and AAMBER_87).

Physical oceanography of Prydz Bay region 611
ADBEXl_82 AND CONRADl7_74 DATA
91.5 ti.6 /
/’ / /
i.w:, /’ /’ x
I / / /’
,’ ,’
/ I
/’ I
I i , I
I.2 34.3 34.4 34.5 34.6 34.7 34.8 Salinity
Fig. 8. Temperature-salinity diagram identifying the relevant Antarctic shelf and oceanic water masses. ADBEXl_82 data are plotted as mid-grey (+) symbols, and CONRAD17_74 data are
shown as bold (*) symbols.

612 R. A. Nunes Vaz and G. W. Lennon
(a> MAXIMUM RECORDED SALINITY ADBEX-1 Nov/Dec 1982
ELIZABETH
68’ E 70’ E 72’ E 74’ E 76” E 78’ E I I I I I I 1 I I 1 I DEPTHS IN METRES
Fig. 9. (a) Horizontal contoured distribution of maximum recorded salinity, irrespective of depth, within the Prydz Bay shelf zone. Data from the ADBEXl_82 cruise, Nov./Dee. 1981. (b) Horizontal contoured distribution of potential temperature at the same depth as the salinity maximum indicated
in (a). Data from the ADBEX182 cruise, Nov./Dee. 1982.

Physical oceanography of Prydz Bay region 613
(b) POTENTIAL TEMPERATURE ON THE SALINITY MAXIMUM ADBEX-1 Nov/Dec 1982
I ’ I I I I I I I I I 1 I I
??
66’ E 70’ E 72’ E 76’ E 78’ E I I I I 1 I I , I I
DEPTHS IN METRES
Fig. 9(b).

614 R. A. Nunes Vaz and G. W. Lennon
AAMBER- - SHELF DOMAIN 2 I , f I
27.i I I 1 I
1.5- ./’ 4 /’
jsfh f
jr \ / /’ / /’
!’ /’ / /‘
/ / l- / /‘ /
/ / /
\ / /’ /’
/ ,
:i ----I
34.2 34.25 34.3 34.35 34.4 34.45 34.5 34.55 34.6 34.65 34.7 Salinity
Fig, 10. Temperature-salinity diagram from those AAMBER stations placed only within the shelf domain.

Physical oceanography of Prydz Bay region 615
MINIMUM VALUE OF (0 -T,) AAMBER FeblMar 1987
I ’ I I I 1 I I I I I I I I
MAC. ROBERTSON
ELIZABETH
DEPTHS IN METRE
Fig. 11. Horizontal contoured distribution of the minimum value of the potential temperature departure from the surface freezing temperature, Tr, i.e. (0 - Tr), irrespective of depth. Data from the
AAMBER- cruise, Feb./Mar. 1987.

616 R. A. Nunes Vaz and G. W. Lennon
MINIMUM RECORDED TEMPERATURE (“C) FIBEX Jan/Mar 1981
MAC. ROBERTSON LAND ELIZABETH LAND
100 kilometres
DEPTHS IN METRES
Fig. 12. Horizontal contoured distribution of minimum recorded temperature, irrespective of depth, in the Prydz Bay oceanic zone. Data from the FIBEXl_81 cruise, Jan./Mar. 1981.

Physical oceanography of Prydz Bay region 617
.: 6oOk &j. ‘_ j -;_ ”
-68.5 -
-69 -
-69.5 I -701 I I I I
68 70 72 74 76 78 80
ADBEXl_82 (028,030 & 031) AND CONRADl7_74 (240 & 242)
-54.2 34.25 34.3 34.35 34.4 34.45 34.5 34.55 34.6 34.65 34.7 Salinity
Fig. 13. Contoured distributions of potential temperature (b) and salinity (c) along a vertical section running offshore from the Amery Ice Shelf. as indicated in (a). Data from ADBEXl_82 Nov.,’ Dec. 1982. (d) Temperature-salinity diagram for ADBEXl_82 stations 028 (black *), 030 (solid line) and 03 1 (grey *), and CONRAD1 7-74 stations 240 and 242 (grey + ). Lines of constant in silu density are drawn. referenced to 200m (28.4-28.9) and 380m (29.3-29.7). The diagram shows marginal or
unstable conditions below the warm salty intrusions at station 030.

618 R. A. Nunes Vaz and G. W. Lemon
Fig. 13(b) and (c)

Physical oceanography of Prydz Bay region 619
-70’ I I I I ;4
I I 68 70 72 76 78 0
Fig. 14. Contoured distributions of potential temperature (b) and salinity (c) along a vertical section running around the Prydz Bay perimeter from west to east, as indicated in (a). Data from
AAMBER- Feb./Mar. 1987.

620 R. A. Nunes Vaz and G. W. Lemon
Fig. 14(b) and (c)

Physical oceanography of Prydz Bay region 621
contribution Prydz Bay might make to the total volume of AABW is likely to be inconsequential, although the issue that we attempt to resolve is whether the processes that might lead to bottom water formation occur within Prydz Bay.
In addition to the data considered by Smith et al. (1984) and Middleton and Humphries (1989), this study uses the AAMBER- data set (Woehler and Williams, 1988), together with the results from moored current meters (reported in Hodgkinson et al., 1988, 1991a, 1991b).
THE STUDY REGION
Prydz Bay (Fig. 1) is the third largest embayment in the Antarctic continent, and lies in the Indian Ocean sector. The continental shelf waters of the Antarctic are deep. Prydz Bay depths, like the Weddell and Ross Seas, are typically 500-600 m, with a deep basin in the inner part of the Bay, descending to 800 m in places, and to 1085 m adjacent to the Amery Ice Shelf. On moving offshore from within the Bay, the bed rises from approximately 800 m to a sill at 400-500-m depth along latitude 67”S-68”S, and then falls to 600 m at the edge of the continental slope, some 100 km seaward. The sill has a saddle point (500-m depth) at about 67”s latitude, 71”30’E longitude, where the bathymetry rises zonally and falls meridionally. There are relatively shallow banks rising to 200-m depth (Fram Bank to the west and Four Ladies Bank to the east), extending over much of the shelf width to either side of Prydz Bay so that deep connections between the ocean and the Bay are concentrated through a broad region situated at the central longitude of approximately 73”E (aligned north-west/south-east). There is a much narrower deep connection to the shelf waters of the West Ice Shelf region east of the Bay, along a trough in the inner part of the shelf north of Davis station.
The waters of the southwestern part of Prydz Bay come into direct contact with a large floating ice shelf, the Amery Ice Shelf, and in this respect, Prydz Bay is hydrographically similar to its larger counterparts, the Weddell and Ross Seas.
THE DATA
Hydrographic data, from the ANARE voyages, were not collected primarily for physical purposes. In reality, this means: that casts were not performed along a grid pattern (with one exception - SIBEX285); that there were few observations conducted in the vicinity of the continental slope or in locations of special physical interest; and that casts were infrequently made to below 600-1000 m in the oceanic domain.
The physical data were collected using a Neil Brown Mark III Conductivity- Temperature-Depth probe, but no coincident bottle samples or temperature measurements were made. Calibrations by the manufacturer before and after each cruise implied upperbound accuracies of 0.005”C in temperature and 0.01 in salinity (Middleton and Humphries, 1989). When combined these imply inaccuracies of geopotential anomaly of approximately + 0.3 m2 sV2 for a 50-m-deep column. Instrumental consistency should translate to relative errors that are substantially smaller than this, but absolute values of geopotential anomaly must be considered inaccurate to this degree.
Despite these potential limitations, there is much internal consistency in the gross oceanographic features that the data imply. This is true of data during one cruise, involving the repetition of profiles in similar geographic locations but separated in time by some

622 R. A. Nunes Vaz and G. W. Lennon
weeks, but also between different cruises. More specific differences point to seasonal and interannual variability for which we can gain a little insight.
We concentrate on data from four ANARE cruises, because others produced little data, or were conducted outside the Prydz Bay region. Of the four, ADBEXl_82 and AAMBER- were largely concentrated on the Prydz Bay shelf itself, and these provide the main source of detail about Bay processes. The other two, FIBEX181 and SIBEX285 were larger scale programs conducted in the Prydz Bay oceanic region with relatively few observations in shelf waters. These provide the larger scale context of Prydz Bay oceanography and its interaction with the oceanic domain and the Antarctic Circumpolar Current (ACC).
Supplementing the water property observations are a number of time series of currents and temperatures from moorings deployed in the Bay through 1985, 1986 and 1987 (Hodgkinson et al., 1988, 1991a, 1991b). Conductivity was also measured on a few of these instruments but seems to have provided little useful information.
HORIZONTAL CIRCULATION
Local scale patterns
During the relatively ice-free spring/summer period of the ANARE cruise measurements there is always a fresher, warmer surface layer over the shelf and the oceanic domain. This is the Antarctic Surface Water (ASW). It is formed by modification of Low Salinity Shelf Water (LSSW) in the shelf domain, and upwelled Circumpolar Deep Water (CDW) in the oceanic domain, by melting of ice and direct solar warming, and it constitutes a low-density cap over the water column. It has no specific core characteristics (Smith et al., 1984) and rarely extends below about 50 m. Conditions in this layer are highly variable in both space and time, but they bear little relevance to the more consistent properties of the remaining waters of the shelf and adjacent ocean. The influence of ASW is minimised by considering properties at depths greater than 50 m.
Figure 2 shows a contoured distribution of geopotential anomaly between 50 m and 500 m, from the ADBEXl_82 cruise data. Geostrophically-balanced currents run parallel to contours with high values to their left (in the Southern Hemisphere).
The distribution implies a circulation (of water at 50 m relative to that at 500 m) involving inflow to the Bay that crosses the shelf break slightly to the west of the central longitude of the Bay (at about 72”E-74”E). Flow is generally south-southeastward towards the southern Bay limits. The flow then turns westward along the face of the Amery Ice Shelf and, as indicated by the presence of waters colder than the surface freezing temperature, also beneath the ice shelf. The flow then leaves the Bay in the west. The circulation forms a clockwise or cyclonic gyre within the Bay, with some evidence of recirculation occurring within the Bay confines.
Geopotential anomalies for a shallower (50-200m) column (not shown) show very similar features. The distribution also suggests a contribution to the Bay (at shallower levels) from the shelf waters in the east.
Figure 3 is the equivalent geopotential anomaly distribution for 5&500m, from AAMBER- data. The clockwise gyre is, again, very evident, forming a single cell of dimensions similar to the entire Prydz Bay shelf. It includes a well-defined net westward coastal flow around the southern perimeter, whose width (approximately 50 km

Physical oceanography of Prydz Bay region 623
or less) is of similar order to the internal Rossby radius of deformation in the region (1s 20 km).
A substantial proportion of the inflow to the Bay is indicated to come from the north and west, both from the oceanic domain and from some re-circulation on the continental shelf to the north of the Amery Ice Shelf. Additional inflow is inferred to come from shelf regions to the east: more clearly indicated in the geopotential anomaly distribution (not shown) for a shallower column thickness (50-200 m). All waters apparently depart to the west and north (seen in the larger regional pictures discussed below).
Both data sets imply broad, significant agreement about the major features of the Bay circulation. They indicate a general cyclonic (clockwise) circulation throughout most of the depth of the Bay. This is consistent with the sighting of icebergs off Princess Elizabeth Land, which are observed to move south-west, and a significant proportion of those seen from Davis station are believed to move into the southern part of Prydz Bay. Those icebergs calved from the Amery Ice Shelf normally follow the western perimeter of Prydz Bay on their way northwards (Smith et al., 1984). An ICEX sea-ice buoy, deployed near the northeastern limit of Prydz Bay in early 1987 (Allison, 1989) close to the end of the AAMBER- cruise, followed a cyclonic path around the Bay perimeter, leaving the Bay near Fram Bank. It averaged approximately 0.24 m s- ’ for the 16-day period. Satellite tracked icebergs (Tchernia and Jeannin, 1980), and sea-ice buoys (Allison, 1989) on leaving Prydz Bay in the west, continued along the shelf past Mawson station, beyond 63”E.
Comparison between geopotential anomaly distributions for 50-200 m and 50-500 m suggests that, at greater depths (200-500 m), inflow to the Bay comes from offshore across the shelf break in the central and western Bay longitudes. At shallower levels (down to 200 m) flow is more associated with the Antarctic Coastal Current from the east, i.e. the vicinity of the West Ice Shelf (see Fig. 4).
The two data sets (ADBEXl_82 and AAMBER_87) differ with regard to circulation in the southeastern parts of the Bay, near Davis station. The ADBEXl_82 data has this as a confluence region for the inflows before they turn westward, while AAMBER- shows it to be a very well-defined coastal flow, which is continuous around the Bay. The differences may be seasonal (ADBEXl_82 data were obtained in springtime, while AAMBER- was a summer survey) or interannual. The continuous westward perimeter flow has support in the Soviet data, but both are largely consistent with iceberg observations.
Smith et al. (1984) obtained average geostrophic currents in the perimeter flow in the vicinity of the Amery Ice Shelf, of 0.03 m s-l, that were similar to those of Grigor’yev (I 967). The AAMBER geopotential anomaly gradients were significantly larger, implying currents in this region of up to 0.1 m s-i.
Regional scale patterns
Figure 4 shows the 50-200 m geopotential anomaly distribution from FIBEX18 1 data. Like the local-scale pictures, it indicates inflow to the Bay across the shelf break at the central longitude of the Bay, and also from the east (the latter being more prominent in the ADBEXl_82 and AAMBER- local scale geopotential anomaly distributions for the same depth intervals, which are not included here) along the shelf. Outflow from Prydz Bay is again very much concentrated on the western side, linking to the perimeter current of Figs 2 and 3. The outflow turns westward on leaving the Bay (skirting around the shallow Fram Bank, Fig. 1, rather than as indicated by the contours near the coast between 65”E and 70”E)

624 R. A. Nunes Vaz and G. W. Lennon
forming a relatively strong shelf current, a part of which recirculates offshore and is fed back to the Bay. Recirculation on the shelf is therefore seen as part of a larger closed circulation that extends into the oceanic domain, also reported by Grigor’yev (1967) and Savatiugin and Komova (1971).
The geopotential anomaly distribution for the 50-500-m column (not shown), suggests much the same picture. Both concur with the Bay-scale results that the Bay is primarily fed from the east, with a significant recirculated component coming directly onshore to the centre of the Bay.
The SIBEX2_85 50-200-m and 50-500-m geopotential anomalies are, again, quite similar to one another, and so only the deeper, 50-500-m distribution, is shown here (Fig. 5).
These distributions again indicate that the Bay gyre is part of a large coastal ocean system, involving significant recirculation in the western region.
The large cyclonic gyre within the Bay is due to the presence of a large, deep pool of cold water, forming a dynamical low of geopotential anomaly, centred on the shelf to the north of the Amery Ice Shelf. This pool owes its origin to interaction of Antarctic shelf waters with the Amery Ice Shelf (discussed below).
The transition from westward coastal flow near the Antarctic continental shelf, to the eastward flow of the Antarctic Circumpolar Current north of latitude 63”S, occurs at what is called the Antarctic Divergence. It is produced by the predominant continental (easterly) and oceanic (westerly) wind regimes. Zverev (1963) looking at the southern Indian Ocean sector of Antarctic waters (between 20”E and lOO”E), deduced that the shear zone of the Antarctic Divergence tends to break down into a series of gyres. Combining this tendency with the cyclonic circulation in the north-west of Prydz Bay seems to produce a semipermanent cyclonic gyre (between 60”E and 80”E) that extends from within Prydz Bay northwards encompassing the Divergence. It is also evident in the results of the Fine Resolution Antarctic Model (FRAM; Webb et al., 1991).
SIBEX2_85 data (Fig. 5) also indicate a contribution to outflow from the Bay towards the east, which appears to have a direct connection to the eastward Antarctic Circumpolar Current. This small anticyclonic gyre north of Davis station contrasts with the circulations inferred from FIBEXl_81 and AAMBER- data (ADBEXl_82 provided insufficient coverage in this area), and with the observations of a cyclonic gyre in this region by Grigor’yev (1967). Interannual variability appears to play a role here.
Looking further offshore, the Antarctic Circumpolar Current, which is clearly seen in Figs 4 and 5, follows a major northward deviation at about 80”E longitude. This is due to its tendency to conserve potential vorticity over the rising floor of the Kerguelen Plateau. This feature of the circumpolar flow is also reproduced in the FRAM results (Webb et al., 1991).
The consistent features of all cruises are illustrated in Fig. 6, which shows a smoothed composite geopotential anomaly distribution, between 50 m and 500 m, for all four data sets (FIBEXl81, ADBEXl_82, SIBEX2_85 and AAMBER_87). The large cyclonic gyre, centred on the shelf north of the Amery Ice Shelf, is clearly seen. The rather broken, eddy- like structure of the Antarctic Divergence is also apparent, together with the more organised structure of the Antarctic Circumpolar Current to the north (really only sampled during SIBEX2_85). Such an analysis does not attempt to conserve mass, nor can it account for the presence of shallow zones, which is why contours start and end near the Amery Ice Shelf. While these do indicate a coastal current near the Ice Shelf, such a current would complete the circuit around to the MacRobertson Land shelf after diverting around Fram Bank. Offshore flow near Mawson station is indicated, but there must be continuity between

Physical oceanography of Prydz Bay region 625
contour values > 1.55 m* SW2 near the Ice Shelf and hence a coastal current which continues westward beyond 60”E.
In summary, the consistent features of most data are that the Bay receives its input primarily from the east (except in SIBEX2_85) via a shelf flow from the vicinity of the West Ice Shelf. This is part of the general, wind-driven westward Antarctic coastal current. Prydz Bay receives a second, deeper inflow across the shelf break at its central longitude, comprising a mixture of recirculated Bay waters and warmer upwelled Circumpolar Deep Water (CDW).
Prydz Bay discharges principally via a coastal current that, on leaving the western exit of the Bay, turns westward along the MacRobertson Land shelf. It partially diverts offshore, at about 60”E, to join the eastward ACC, where some is recirculated inshore and the remainder continues eastward with the ACC. There are insufficient data to indicate what fraction of the shelf flow near Mawson station continues westward beyond 60”E along the inner part of the MacRobertson Land shelf, although there is clearly some continuity in this direction, as shown by the tracks of ICEX buoys (Allison, 1989).
MEASURED CURRENTS FROM MOORED INSTRUMENTS
Detailed presentations of processed data from current meters moored in the Prydz Bay region are given in the data reports of Hodgkinson et al. (1988, 1991a,b). Of the 12 moorings deployed during 3 years, 7 were recovered, producing useful currents from 20 of the 25 recovered instruments. All were Aanderaa meters, except for the lower meter at the mid-Bay station, which was an InterOcean S4.
Mooring locations are indicated in Figs 1 and 5. Moorings were placed in four regions: in the south-east of the Bay (85/3 in 1985, 86/3 in 1986 and 87/5 in 1987) at approximately 68.5”S, 76.5”E; in the Bay centre (87/2 in 1987) at approximately 67.8”S, 73.8’E; at the shelf edge seaward of the Amery Ice Shelf (85/l in 1985,86/l in 1986 and 1987: 1987 mooring not recovered), close to 66.6”S, 72.9”E; and near the shelf edge seaward of Mawson station (85/4 in 1985) at 66.7”S, 63.3”E. There were additional deployments in other locations, most notably at approximately 68S”S, 73”E, less than 50-km seaward of the Amery Ice Shelf (in 1985 and 1986), but none of these moorings was recovered.
Low-frequency currents
Low-pass filtered (half amplitude response at 7 days) current stick-plots from all instruments are presented in Fig. 7a (for south-east Prydz Bay), 7b (near the shelf-edge within Prydz Bay), 7c (in central Prydz Bay) and 7d (near the shelf-edge seaward of Mawson station). Concurrent stick plots of winds (the convention used for both currents and winds is “going to”) recorded at Davis station are shown in Fig. 7e, and those at Mawson station are included in Fig. 7d.
Considering first, the south-east part of the Bay (Fig. 7a), low-passed currents infrequently exceeded 0.1 m s-l. Directions were highly variable, showing no dominance of any particular direction. Rotary spectra of the (unfiltered hourly) currents show significant energy at 2-4-day periods, although the dominant peaks in the spectra fall within the diurnal and semi-diurnal tidal bands.
In all 3 years (1985, 1986 and 1987) the water column showed significant vector or rotary coherence across all pairs of meters at low frequencies (approximately 2-day periods and

626 R. A. Nunes Vaz and G. W. Lennon
South-East Prydz Bay 01 (a)
rns-1 0 1985 150m (in 640m) -0 1 01
m.-’ 0 1965 487111 (in 640m) 4.1
1986
1966
640m (in 640m)
210m (in 640m)
311m (in 640m)
633m (in 640m)
t 987188 419m (in 710m)
1967/88 567m (in 710m)
i987/8a 670m (in 710m)
I 1 I I I / / I , / I I I I
JAN PEB Mm APR MAY JUN JUL RUG SEP OUT WV DEC JAN FE0
Fig. 7. (a) Stick plots of low-pass filtered currents (half amplitude point at ‘I-day period) from the moorings placed in the south-east region of Prydz Bay during 1985 (85/3), 1986 (86/3) and 1987 (87/ 5). (b) Stick plots of low-pass filtered currents (half amplitude point at 7-day period) from the moorings placed close to the shelf edge of Prydz Bay during 1985 (85/l) and 1986 (86/l). (c) Stick plots of low-pass filtered currents (half amplitude point at ‘I-day period) from the mooring near the centre of Prydz Bay during 1987 (87/2). (d) Stick plots of low-pass filtered currents (half amplitude point at ‘J-day period) from the mooring near the shelf edge at 63”E, offshore from Mawson station during 1985 (85/4). Concurrent filtered winds, measured at Mawson station, are shown at the top. (e) Stick plots of low-pass filtered winds measured at Davis station during the 3 years of current-meter
moorings within the Bay.
longer), with some minor variability around this value for individual pairs of meters. In general, the water column at this site behaved barotropically at low frequencies.
Using the (3-hourly) wind observations from Davis station, little significant coherence with the current-meter records was evident, except for isolated small peaks above the 95% confidence level. The most consistent of these peaks occurred at 3-day periods, but rarely extended across two spectral estimates. Currents in the south-east part of the Bay do not seem to be reacting appreciably to the winds as recorded at Davis station (approximately 70 km away).
All of the geopotential anomaly distributions indicated a net southward component of motion (of the upper level relative to the lower) at the location of the south-east Prydz Bay moorings, including the SIBEX2_85 data (Fig. 5) which were obtained coincident with the 1985 mooring. Taking the mean of the low-pass filtered currents does show a net southward
Physical oceanography of Prydz Bay region 627
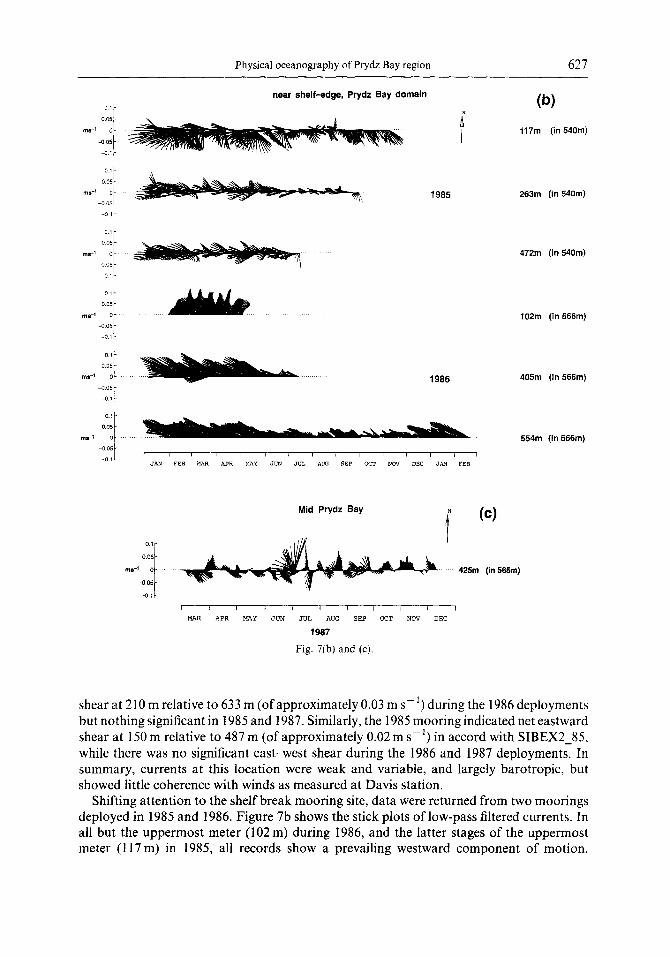
near shelf-edge, Prydz Bay domain w
w
t 117m (in 540m)
1985 263m (in 540m)
472m (in 540m)
102m (in 566m)
1986 405m (in 566m)
Mid Prydr Bay
O.lL I
0.05 -
m-’ o- 425m (in565m) -0.05 _
-I, _
I I I I 1 1 I I , , I
MAR APR MAY J”N JUL ALC SEP OCT NOV DEC
1987
Fig. 7(b) and (c).
shear at 210 m relative to 633 m (of approximately 0.03 m s-‘) during the 1986 deployments but nothing significant in 1985 and 1987. Similarly, the 1985 mooring indicated net eastward shear at 150 m relative to 487 m (of approximately 0.02 m s-i) in accord with SIBEX2_85, while there was no significant east-west shear during the 1986 and 1987 deployments. In summary, currents at this location were weak and variable, and largely barotropic, but showed little coherence with winds as measured at Davis station.
Shifting attention to the shelf break mooring site, data were returned from two moorings deployed in 1985 and 1986. Figure 7b shows the stick plots of low-pass filtered currents. In all but the uppermost meter (102 m) during 1986, and the latter stages of the uppermost meter (117 m) in 1985, all records show a prevailing westward component of motion.

628 R. A. Nunes Vaz and G. W. Lennon
Near Shelf-Edge, Yawson Station Region
(4 Winds at
Mawson Station
176m (in 630m)
325m (in 630m)
516m (in 630m)
620m (in 630m)
-CL+ , I I / I / I I 1 I I I 1
FEB MAR APR MAY J”N J”L A”0 SEP OCT NO” DEC JAN FEB
1965 1966
Fig. 7(d).
Although quite consistent in direction, the low-passed currents at this site remained weak, rarely exceeding 0.1 m s-‘. Most of the energy in the spectra (of unfiltered currents) was contained within the tidal bands, although there was considerable energy associated with peaks at 12 and 16 days in the case of the 1985 deployment, and 34 days for the 1986 deployment.
Coherence between the lower two meters in both years of deployment was significant for all periods longer than 16 h. The upper meter was coherent with those below only at the lowest resolvable frequencies (7-day to 16-day periods). Coherence between the shelf edge currents and winds recorded at Davis station rose only slightly above the 95% confidence level at a small number of isolated frequency values that were not consistent at different levels, nor across the 2 years of measurements. Currents at the shelf edge were consequently not associated with winds measured at Davis station.
The hydrographic data all indicated net southward motion near the surface relative to deeper levels at the shelf edge. The low-passed currents from the 1985 deployment also indicate southward shear (at 117 m relative to 472m) of approximately 0.04 m s-l. However, the shear between the uppermost meter and deeper levels, during 1986, was northward (of approximately 0.03 m s-t). A scatter plot of the data from the top instrument in 1986 (in Hodgkinson et al., 1991a) suggests considerable restriction of directional

Physical oceanography of Prydz Bay region 629
Winds at Davis Station
1986
ms-’ 0 I 1987 -10
t
I I I I I I I I I I I I 1 JAN FEB MAR APR MAY JUN JUL AUG SEP OCT NOV DEC
Fig. 7(e).
movement (with no recordings outside the sector 20”-50”) placing some doubt over the validity of these data.
The prevailing westward character of measured currents is not suggested in the geopotential anomaly distributions, although the sense of the vertical shear is consistent in both types of data, that is, eastward at the surface. Consequently, in order to put the geostrophic currents into an absolute reference frame, an additional westward component of the order of 0.05-O. 1 m s- ’ would need to be added, although such an adjustment would not be consistent with observations in the central and south-eastern parts of the Bay. The presence of a prevailing westward component implies a diminished contribution to the Prydz Bay gyre from waters that cross to the shelf at this central longitude, compared with contributions coming from the east.
Hodgkinson et al. (199 1 a) noted a correlation between diurnal temperature changes at the shelf-edge site (of approximately 1 “C) and diurnal currents. The spectrum of temperature at the deepest level (472 m in 540 m of water) during 1985 showed most energy to be contained in low frequency variations of period greater than 11 days, and within a second band peaking at the 0, tidal period. The relationship between north-south currents and temperatures recorded at this instrument shows significant coherence at long periods and very high coherence within the diurnal band, this latter with a 90” phase lag, indicating maximum temperatures were attained towards the end of a period of onshore flow. This is consistent with the onshore movement of Circumpolar Deep Water (or a modified variant) associated with diurnal shelf waves, as suggested by Middleton and Humphries (1989) and observed in the Weddell Sea by Foster et al. (1987). Significant coherences, though not as large, were seen in records from the top instrument (117 m) during 1985, and the bottom instrument (554 m) during 1986.

630 R. A. Nunes Vaz and G. W. Lennon
A single mooring was placed in the central part of Prydz Bay during 1987, consisting of two meters, at 123m and 425m, in 565m of water. Both exhibited similar behaviours (Hodgkinson et al., 1991b), although only the lower (425 m) data set is shown in Fig. 7c. Here, again, the low-pass filtered currents were very weak, rarely reaching 0.1 m s- ‘, and highly variable in direction.
Currents here did show significant coherence with the winds measured at Davis station at 5-day and 18-day periods, as well as at a number of isolated higher frequency peaks. Long- term mean currents were very weak, as were the inferred geostrophic currents, being associated with the central region of the Prydz Bay gyre.
Outside Prydz Bay, at the shelf break directly offshore from Mawson station (63”E), an individual mooring was deployed through most of 1985 (the location is indicated in Fig. 5). The mooring consisted of four instruments (at 178 m, 325 m, 516 m and 620 m, in 630 m of water). All instruments showed (Fig. 7d) relatively strong, steady unidirectional low- frequency flow, towards west-northwest with speeds up to 1.2 m s-i in the filtered data: a full order of magnitude stronger than currents recorded in the vicinity of Prydz Bay. Periods of substantially reduced current occurred at all depths in July and August (the upper instrument failed to record reliable data from this time onward), after which the currents returned to their former strengths and directions.
Most of the energy in the currents was contained within a broad band from a 3-day to 16- day period, with another minor band close to 35 h. Currents at different vertical levels were broadly coherent at periods longer than approximately 2-3 days, and significant coherence was also seen between all pairs of instruments at 35-h period. However, there was almost no significant coherence between the currents and the winds at Mawson station for any long period variations of more than 3-day period. Currents at the mooring location were therefore not reacting to the winds as measured at Mawson station.
Westward or north-westward flow over the shelf near Mawson station is very much consistent with the evidence from the geopotential anomaly distributions, although the strength of the currents cannot reliably be inferred from the hydrographic data. The current meters indicated consistently strong, almost unidirectional flow (at 0.6 m s-’ to the west, and 0.22 m s-i to the north) through nearly the full year of observations. An ICEX buoy (Allison, 1989) travelled east to west on the ocean side of the mooring site, coincidentally with the mooring operation during 1985. The buoy travelled at a mean westward speed of 0.12 m s-i from 72.1”E to 57.9”E between 2 March and 1 May. Similar buoys, deployed in 1987, travelled considerably faster, averaging 0.24ms-’ in one case, and 0.36m s-l in another, along approximately the same route.
Periodic motions
As a general statement, tidal components of motion decrease from the shelf break towards the inner part of the Bay. Strong tidal motions, predominantly of diurnal periods, with typical velocities of 0.25 m s-‘, were observed in 1985 and 1986 close to the shelf edge. The major axis of the tidal ellipse was aligned approximately north-south, except at the deepest level (554m in 1986) where southward motion was apparently topographically steered towards the south-west. Spring-neap variations are large at this site, due to the similar magnitudes of the dominant constituents, Oi and Ki.
At the south-east Prydz Bay site, tidal analysis revealed diurnal and semi-diurnal current velocity amplitudes of less than 0.01 m s-’ (Hodgkinson et al., 1991a, 1991 b).

Physical oceanography of Prydz Bay region 631
At the mid-Bay site, both tidal and residual components of motion were significant, although non-tidal currents (of order 0.1 m s-l) tended to dominate the tidal (of order 0.05 m s-‘) components.
At the MacRobertson Land shelf break site (63”E) tidal currents were of comparable magnitude to those at the shelf break in Prydz Bay, but these were completely masked by the large mean flows.
WATER MASS DISTRIBUTIONS
There are five principal water masses in the shelf and ocean domains (shown in Fig. 8, against a background of the ADBEXl_82 and CONRAD1 7-74 (Jacobs et al., 1980) temperature-salinity data). There are Shelf Waters (SW) which are generally close to the freezing temperature, Tf (where Tf= - 189°C at S= 34.4 andp = 0), but of varying salinity, divided into Low Salinity Shelf Water (LSSW) and High Salinity Shelf Water (HSSW) usually separated at a salinity of 34.6 (Smith et al., 1984). Smith and Treguer (1994) draw the boundary between these two types at a salinity of 34.5.
Ice Shelf Water (ISW) has a temperature below the surface freezing temperature. It is formed by contact with an ice shelf at depth (since the freezing temperature, Tf, is lowered with increasing pressure). LSSW, HSSW and ISW are shelf water types.
In contrast, the bulk of the circumpolar flow comprises relatively warm (T > 1 “C), and salty (S > 34.65) water, called Circumpolar Deep Water (CDW). It is overlain by a cold, low salinity mass above 200-m depth, called Winter Water (WW), which is formed by winter- time convection. Antarctic Surface Water (ASW) caps the Winter Water in a surface layer generally less than 50-m deep, formed when ice melting and solar heating are significant. ASW is also formed over the shelf.
In the vertical trace of salinity recorded at a single station, salinity reaches a local maximum at a particular depth, and this depth will vary from station to station. In the oceanic domain, the salinity maximum represents one core of the CDW. Over the inner shelf and Bay, where unmodified CDW is not normally present, it identifies the saltiest water produced as a result of brine rejection during sea-ice formation. The ADBEX182 temperature-salinity data (Fig. 8) indicate a decrease of maximum salinity in moving from CDW in the oceanic domain to the HSSW/LSSW over the shelf. The maximum salinity distribution is presented in Fig. 9a, but it does not indicate the location of the transition between water masses, simply a near-monotonic onshore decrease.
The distinction between water masses is made more apparent by presenting potential temperatures on the salinity maximum (Fig. 9b). Substantial temperature differences exist between oceanic and shelf water masses (Fig. 8) and the transition is seen to lie close to the shelf break. Most shelf stations belong to the cold, HSSW/LSSW categories, although north of 67.5”s there is the indication of a broad transition zone, involving some mixing, over the central outer shelf. The equivalent potential temperature on the salinity maximum distribution for AAMBER- cruise data looks similar and is not shown. It also indicates substantial mixing of LSSW and CDW over the central outer shelf, as can be seen in the 19 - S diagram of Fig. 10.
Ice Shelf Water, seen as points below the freezing point line in the ADBEXl_82 (December) 8-S diagram (Fig. 8) was present in greater quantities during the AAMBER- (February) cruise (Fig. 10). The fraction of Prydz Bay that was influenced by Ice Shelf Water during the AAMBER- cruise is illustrated in Fig. 11. Ice Shelf Water is

632 R. A. Nunes Vaz and G. W. Lennon
identified wherever local potential temperatures fall below the surface freezing temperature. Regardless of depth, the (potentially) coldest waters (referenced to the surface freezing temperature) are identified at each station and contoured in the figure. ISW occupied the inner south-western part of the Bay; its influence extending (to the zero contour) significantly north and north-eastwards of the Amery Ice Shelf. (A similar distribution was obtained from ADBEXl_82 data.) The extension of ISW influence close to Davis station may seem surprising in view of the earlier discussion regarding the prevailing current regime. However, the ISW at all of the sites in the southeastern regions of Prydz Bay occupied the deepest parts of the water column in what is essentially a deep inner basin within the Bay. Its greater density allowed it to remain within the basin at this time. In fact, ISW was found at, or near, the sea bed at all stations to the negative side of the zero contour, except that those satisfying (0 - Tr)min < - 0.08”C showed ISW throughout most of the water column, with the minimum occurring near 200-m depth.
The lowest temperatures, assumed to represent the core of Ice Shelf Water, were seen extending from the northwestern extremity of the Ice Shelf cavity (at (0 - Tr)min = - O.l6”C, at a depth of 220 m), continuing, in least contaminated form, due north to the shelf edge. Again, the distribution of (@-- Tr)min is consistent with earlier conclusions regarding the sense of the coastal flow around Prydz Bay.
Figure 12 shows the distribution of minimum recorded temperature (regardless of depth) from FIBEX81 data. Note the presence of Ice Shelf Water within the Bay, and the suggestion that a substantial fraction of the colder Bay waters leave to the north and then move westward along the MacRobertson Land shelf (in support of the contouring, the symbol for one hydrographic station lies hidden beneath the station symbol for Mawson). In association with the large regional cyclonic gyre, part of the westward coastal flow diverts offshore to return eastward. Again, it is not clear what fraction of the cold waters continue to the west.
The bifurcation of flow on the MacRobertson Land shelf into one arm that continues westward along the shelf, and another that diverts offshore, crossing the Divergence in association with the Prydz Bay gyre, and continuing eastward with the ACC, was very clearly illustrated in the tracks of sea-ice buoys, deployed in 1987, reported by Allison (1989).
HORIZONTAL DISTRIBUTIONS OF OTHER PARAMETERS
Distributions of four euphausiid species of larvae were presented by Hosie (199 1) for the Prydz Bay and adjacent region. These were obtained simultaneously with the SIBEX2_85 hydrographic data, and they show many of the features that would be expected if these animals were behaving as passive tracers discharged into the Prydz Bay region. For example, three of the four species, Thysunoessa macrura, Euphausia superba and Euphausia crystallorophias, suggest continuity between the waters of the Bay and those of the MacRobertson Land shelf (and adjacent offshore region) near Mawson station. This is evident in both the abundance distributions and the age index of the larvae (Hosie, 1991, Figs 2 and 3). In particular, the visual correlations between minimum recorded temperature during the same cruise and both the abundance and age of Euphausia crystallorophias are particularly high. The Euphausia superba distribution showed a south-west to north-east trend, similar to the inferred gyre structure and the convoluted arrangement of the Divergence in this region.
Physical oceanography of Prydz Bay region 633
Knowing the developmental rate of Euphausiu crystallorophias, Hosie (1991) estimated transport speeds, from the Bay to the shelf near Mawson station (62”E), of approximately 0.2 m s- ‘. These are similar to the drift speeds of icebergs (Tchernia and Jeannin, 1980) in the same location, and they lie between the magnitudes of currents recorded on the shelf at 73”E and those at 63”E. To a first approximation, the physical regime evidently governs the mean advection of certain larvae (Hosie, 1991).
VERTICAL STRUCTURE
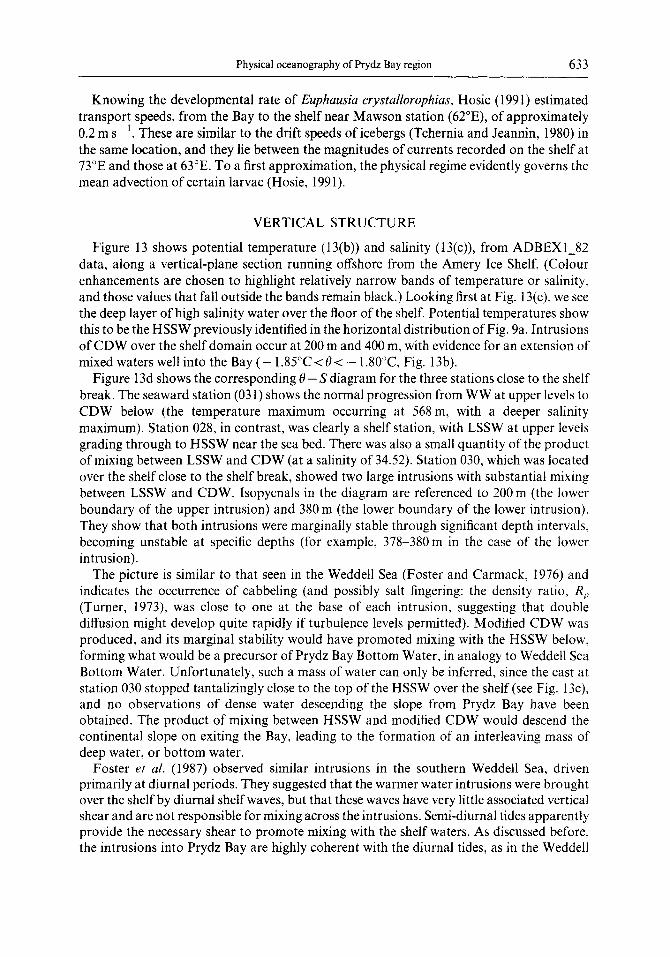
Figure 13 shows potential temperature (13(b)) and salinity (13(c)), from ADBEXl_82 data, along a vertical-plane section running offshore from the Amery Ice Shelf. (Colour enhancements are chosen to highlight relatively narrow bands of temperature or salinity. and those values that fall outside the bands remain black.) Looking first at Fig. 13(c), we see the deep layer of high salinity water over the floor of the shelf. Potential temperatures show this to be the HSSW previously identified in the horizontal distribution of Fig. 9a. Intrusions of CDW over the shelf domain occur at 200 m and 400 m, with evidence for an extension of mixed waters well into the Bay (- 1.85”C < 0 < - 180°C Fig. 13b).
Figure 13d shows the corresponding 0 - S diagram for the three stations close to the shelf break. The seaward station (03 1) shows the normal progression from WW at upper levels to CDW below (the temperature maximum occurring at 568 m, with a deeper salinity maximum). Station 028, in contrast, was clearly a shelf station, with LSSW at upper levels grading through to HSSW near the sea bed. There was also a small quantity of the product of mixing between LSSW and CDW (at a salinity of 34.52). Station 030, which was located over the shelf close to the shelf break, showed two large intrusions with substantial mixing between LSSW and CDW. Isopycnals in the diagram are referenced to 200m (the lower boundary of the upper intrusion) and 380 m (the lower boundary of the lower intrusion). They show that both intrusions were marginally stable through significant depth intervals, becoming unstable at specific depths (for example, 37%380m in the case of the lower intrusion).
The picture is similar to that seen in the Weddell Sea (Foster and Carmack, 1976) and indicates the occurrence of cabbeling (and possibly salt fingering: the density ratio, R,, (Turner, 1973) was close to one at the base of each intrusion, suggesting that double diffusion might develop quite rapidly if turbulence levels permitted). Modified CDW was produced, and its marginal stability would have promoted mixing with the HSSW below, forming what would be a precursor of Prydz Bay Bottom Water, in analogy to Weddell Sea Bottom Water. Unfortunately, such a mass of water can only be inferred, since the cast at station 030 stopped tantalizingly close to the top of the HSSW over the shelf (see Fig. 13c), and no observations of dense water descending the slope from Prydz Bay have been obtained. The product of mixing between HSSW and modified CDW would descend the continental slope on exiting the Bay, leading to the formation of an interleaving mass of deep water, or bottom water.
Foster et al. (1987) observed similar intrusions in the southern Weddell Sea, driven primarily at diurnal periods. They suggested that the warmer water intrusions were brought over the shelf by diurnal shelf waves, but that these waves have very little associated vertical shear and are not responsible for mixing across the intrusions. Semi-diurnal tides apparently provide the necessary shear to promote mixing with the shelf waters. As discussed before, the intrusions into Prydz Bay are highly coherent with the diurnal tides, as in the Weddell

634 R. A. Nunes Vaz and G. W. Lennon
Sea, but in the case of Prydz Bay, there is greater vertical shear in the diurnal than in the semi-diurnal tidal ellipses (Hodgkinson et al., 1991a).
Ice Shelf Water (0 < - 1.9”C, pink and white bands in Fig. 13b) flowed from beneath the Amery Ice Shelf between depths of 70 m and 400 m, with the core at approximately 200 m. Most was substantially less saline than the HSSW, although relatively high salinity ISW (S= 34.56) was seen at the deeper points of stations 018 and 023. Nost and Foldvik (1994) show that the 0-S relationship between ISW and its source (perhaps HSSW) forms a straight line on the 0 - S diagram, onto which all mixtures of ISW and source waters fall (provided no other sources are present to contribute to mixing). The 0-S relationship is defined by the source water properties, such that the gradient of the relationship is approximately 2.45”C per unit of salinity, or L/d, where L is the latent heat of fusion (3.35 x lo5 J kg-‘), c is the specific heat capacity of water (3990 J kg-’ IS-‘) and S is the salinity of the source (this ignores changes of temperature within the ice phase, and the small change of mass associated with melting or freezing: see Gade (1979) for the full relationship), as observed below the Ronne Ice Shelf by Nicholls et al. (1991) and Nicholls and Jenkins (1993), below the George VI Ice Shelf by Talbot (1988) and below the Amery Ice Shelf reported by Hellmer and Jacobs (1992). The result allows the characteristics of the source to be deduced from the ISW properties, for example, the core characteristics of the ISW at station 019 (0= - 1.962”C, S=34.421) may have been produced by transformation of LSSW at a depth of approximately 415 m (0 = - 1.87O”C, S= 34.458) from the same station. It is more likely, however, that the inflow and outflow cores were horizontally separated, but the example does demonstrate that this particular core of ISW was not the product of HSSW interacting with the Ice Shelf.
Considering the occurrence and distribution of Ice Shelf Water in more detail, since it is confirmed from tracer measurements to be a contributor to AABW in the Weddell Sea (Schlosser et al., 1990) Fig. 14 shows AAMBER- data along a vertical section skirting the perimeter of the Bay. Geopotential anomalies (Fig. 3) indicated relatively strong coastal flow from right to left through the section during this cruise. The diagram identifies a large body of ISW (0 < - l.90cC), with temperatures generally decreasing towards the west and north-west. Shallow cores of ISW (S= 34.41-34.45) were seen at 15&200-m depth at stations (017 and 018) towards the northern extremity of the Amery Ice Shelf and further northward (stations 020 and 023). Deeper cores of high salinity ISW (S=34.56) were identified at approximately 440 m and 620 m, at station 017. ISW was virtually absent at station 006, and substantially warmer waters occupied the entire depth at stations 005 and 034. Again, these features concur with the cyclonic sense of circulation around the Bay deduced earlier, and are analogous, though smaller in scale, to the east-west change of properties in the Weddell Sea.
Profiles obtained directly seaward of the Amery Ice Shelf show ISW filling the lower parts of the water column. All CTD casts were taken down close to the sea bed, indicating that inflow to the sub-ice shelf cavity (in the manner first described by Robin, 1979), which was responsible at least for the two lower ISW cores of station 017, was of recirculated ISW rather than shelf waters. This situation was encountered in the sub-ice shelf circulation model of Hellmer and Jacobs (1992) partly as a result of vertical turbulent mixing between the shelf water inflow and the ISW outflow. Hellmer and Jacobs inferred a substantial inflow core of LSSW at approximately 400m, although their conclusions were based on a composite of data collected over several decades rather than the extended “snapshot” of a single cruise as shown here. It may be that the summertime regime in Prydz Bay permits the

Physical oceanography of Prydz Bay region 635
establishment of a deep, partially closed circulation in the inner part of Prydz Bay and below the Ice Shelf.
Inflow to the sub-ice cavity, responsible for the upper cores of ISW, may be associated with the slightly warmer waters seen at stations 016 and 017 between 200 and 350 m. The upper cores of ISW at stations 017 and 020 were in fact supercooled, that is colder than the in situ freezing temperature (Fig. 15a). Penrose et al. (1994) reported what was termed a “plume” of supercooled water emerging, in early 199 1, from beneath the Amery Ice Shelf at depths down to 125 m, contained within very similar bounds to the core identified in Fig. 1 I, that is, northwards from the north-west extremity of the Ice Shelf. Quantities of supercooled water were substantially greater in 1991 than during the AAMBER- cruise.
0 a Salinity
34.4 34.45 34.5 34.55
-600
-I--
)
I I
‘i
AAMBEFi_87.017 -800
-2 -1.9 -1.8 -1.7 Pot. temperature
Salinity
34.35 34.4 34.45 34.5 7 - - -60 / -
I
I-- I
-80 / I
-lOO- I :‘-j I
-120- , I
-140- ,
r I g-160- ,’ cl
I -180- ,’
I
-200 -,’
I
::
6 -220 -
-240 -
-260 FjlBER_87.020
-2 -1.9 -1.6 -1.7 Pot. temperature
Fig. 15. (a) Vertical profiles of potential temperature and salinity (from 150m to 752 m) from station 017 of the AAMBER- cruise. The near-vertical grey line shows the potential temperature for freezing at the surface, demarcating ISW to the left. The oblique line at upper left shows the in sifu freezing temperature indicating a small pocket of supercooled water at 200 m, depth. (b) Vertical profiles of potential temperature and salinity (from 60m to 260 m) from station 020 of the AAMBER- cruise. The near-vertical grey line shows the potential temperature for freezing at the surface, demarcating ISW to the left. The dashed oblique line shows the in situ freezing temperature
indicating substantial supercooled water between 98-m and 140-m depth.

636 R. A. Nunes Vaz and G. W. Lennon
Figure 15a shows vertical profiles of potential temperature and salinity from AAMBER- station 017. Almost the entire water column below 200 m comprised ISW, with distinct, substantially colder cores present in narrow depth intervals. The profiles indicate that there are several sub-ice shelf circulation cells, generating a number of emerging cores of ISW (Jacobs et al., 1985; Hellmer and Olbers, 1989). However, the sources of water providing inflow to the cavity remain uncertain.
Supercooling at station 020 (Fig. 15b) extended continuously through 40 m of the water column (below 98 m), reaching a minimum temperature of 0.065”C below the in situ freezing temperature (an order of magnitude more supercooled than at station 017). The position of station 020, being so much further from the ice shelf, suggests that active uplift was responsible for the appearance of supercooled water here. Martin (1981) indicated that frazil ice formation occurs between 0.01 and 0.1 degrees of supercooling, provided that nuclei are available to seed its formation. Despite the extent of supercooling, very little frazil ice appears to have formed at station 020, so as to raise temperatures towards the pressure freezing point. The presence of a negative salinity anomaly at the top of the supercooled layer does, however, imply some frazil ice formation, since melting of the buoyant crystals would occur very close to the top of the supercooled layer (Jenkins and Bombosch, 1995).
DOES PRYDZ BAY CONTRIBUTE TO ANTARCTIC BOTTOM WATER FORMATION?
Precursors of bottom water formation similar to those seen in the Weddell Sea appear to occur in Prydz Bay. These are: the intrusion of CDW over the shelf and the production of unstable modified CDW; the presence of HSSW and the mixing product of both (which can only be inferred) forming Prydz Bay Bottom Water, which descends the continental slope to greater depth.
ISW of slightly lower salinity, but lower temperature, is also present within the Bay and may contribute to the production of PBBW (Foldvik et al., 1985; Jenkins, 1991; Hellmer and Jacobs, 1992). It is not clear to what extent both quantities and salinities of HSSW and ISW may rise during the winter months, thus raising the quantity and density of PBBW. Vertical profiles of temperature and salinity below a fast ice cover in Prydz Bay, spanning a full annual cycle (Allison, 1989) did show the progressive rise of Bay salinity from June to November, and its subsequent rapid fall in December.
Considering the path that a plume of dense water leaving Prydz Bay would take; only boundary friction interferes with the balance that develops between the downslope gravitational force and the opposing upslope Coriolis force generated by motion to the west. The extent of the frictional influence causes the plume to descend, though this angle of descent is commonly very shallow. The Mediterranean outflow (Smith, 1975; Baringer and Price, 1990) the Norwegian overflow (Smith, 1975) and Weddell Sea Bottom Water (Gill, 1973; Killworth, 1977), are just a few examples of the descent of dense plumes on slopes (see also Price and Baringer, 1994). We should look along the slope to the west of Prydz Bay for the signs of such outflows.
There are few measurements that show conditions over the continental slope west of Prydz Bay. Middleton and Humphries (1989) linked observations of a dense mass seen at approximately 1500 m over the continental slope off Enderby Land (50”E), from ADBEX3_85 data, with outflow from Prydz Bay. (They termed this mass Prydz Bay Bottom Water, again in analogy with Weddell Sea Bottom Water although, since it was not

Physical oceanography of Prydz Bay region 637
destined to reach the ocean floor, Jacobs (1991) applied the term Antarctic Slope Front Water, while Smith and Treguer (1994) preferred Modified Prydz Bay Shelf Water.)
Another set of observations (from CONRAD17-74 reported by Jacobs and Georgi, 1977) show a water mass which was destined to contribute to AABW, near the foot of the continental slope at 62”E, offshore from Mawson station. The core properties of this water were: potential temperature -0.76”C salinity 34.658, dissolved oxygen 6.10 ml l-‘, and silicate 105 PM 1-t (at CONRAD 17-74 station 242, depth 3682 m) from Jacobs et al. (1980). These properties mark it as of similar character to Weddell Sea AABW, but only that part that lies within the confines of the Weddell Sea itself. These properties led Jacobs and Georgi (1977) to conclude that the Bottom Water was not of Weddell or Ross Sea origins, but was formed locally along the Prydz Bay to Enderby Land coast. Figure 13d includes the 0 - S profiles of the two relevant CONRAD stations. The diagram does not, however, show any mixing products of HSSW with (modified) CDW or any hints to link HSSW to this AABW
Can the observation of a dense plume near the foot of the continental slope at 62”E be linked to an origin within Prydz Bay on dynamical grounds? Smith (1975) developed a streamtube model of dense plumes on bottom slopes, which he used to help understand the descents of the Mediterranean outflow and Norwegian overflow plumes. The model uses integral properties of the plume, which are modified by two adjustable parameters: the gross entrainment of plume properties to the exterior, and a measure of the bottom friction. Killworth (1977) modified the streamtube model to include the thermobaric effect (the temperature-dependent compressibility of seawater at great depth), deducing that, without this effect, AABW could not reach the ocean floor.
Such a model was used here to simulate the descent of a dense plume to 62”E, and hence to determine, dynamically, whether it could have come from Prydz Bay. The upper panel of Fig. 16 shows the depth of the modelled plume (which was started at a nominal shelf depth of 500 m) versus alongslope distance (model parameters are detailed in the figure caption). In this simulation, the plume descends to 3700 m, the approximate depth of the observed core of dense water reported by Jacobs and Georgi (1977) after travelling approximately 480 km, or 11” of longitude in this region. This particular simulation is consistent with an origin close to 73”E, or within the Prydz Bay region.
The lower panel illustrates how the plume properties vary during its descent, showing how the plume temperature is rapidly increased by entrainment, approaching the (changing) ambient temperature. Note also how the plume’s density excess initially increases, despite the erosion of temperature and salinity differences, and is due entirely to the change of the thermal expansion coefficient with depth. The model also indicated that the plume would take approximately 9 months to traverse the 48 km distance, which would imply that it left Prydz Bay in April/May of 1973.
The problem with models such as this, however, is that they are diagnostic and not predictive. While the model might support a Prydz Bay origin for the CONRAD17_74 bottom water, the existence of adjustable parameters in the form of entrainment and friction coefficients means that other solutions are also possible.
All streamtube plume simulations tend to follow two asymptotes. Initially, the plume behaves as though entrainment were zero, and a simple force balance develops such that the angle of descent is determined by the friction parameter, i.e. the crossing of isobaths implies ageostrophic behaviour, and the extent of ageostrophy is set by the friction. At a later stage, entrainment erodes the density contrast such that the plume trajectory asymptotes to being

638 R. A. Nunes Vaz and G. W. Lennon
-3000 -
-4000 I I I I I I I I I 0 50 100 150 200 250 300 350 400 450 500
(kg m-3) - 0.05
-2’ I I I I I I I I I 0 50 100 150 200 250 300 350 400 450 5oo”
Along-slope distance (km)
Fig. 16. Results from the streamtube model showing (upper panel) the depth of the plume (started at 500 m) with along-slope distance, and (lower) the changes of plume temperature associated with entrainment losses to the ambient fluid (the ambient temperature varied in a prescribed manner). The excess density of the plume relative to its surroundings is also shown in the lower panel, illustrating the effects of the compressibility of cold water at depth. (Model parameters were: shelf slope = IO-‘, initial plume cross-section = 10’ m*, initial plume velocity = 0.02 m s- ‘, initial plume temperature = - 1.85”C and salinity 34.62, with the ambient surroundings at 1.2”C and 34.68, the vertical stratification parameter of the ambient fluid was 5.0 x 10d6, an entrainment rate of 0.01 and
a friction parameter of I .5, see Killworth. 1977.)
parallel to isobaths. Large friction produces a steep descent and greater asymptotic depth, while large entrainment curtails the descent at an earlier stage.
For Weddell Sea plumes to descend to abyssal depths (Killworth, 1977) seems to require both large friction (a drag coefficient of 0.15) and small entrainment (7.5 x 10e5) compared with best-choice values in simulations (Smith, 1975) of the Mediterranean outflow (0.01 and 1 x 10e3, respectively) and the Norwegian overflow (0.15 and 6.5 x 10p4). For the Prydz Bay case, the relatively steep continental slope produces a steep descent and, while the asymptotic depth is reasonably insensitive to the parameter choices, this is not so with regard to the alongslope travel.
So few examples give no a priori indication of the appropriate parameter choices for Prydz Bay, but a range of values, involving slightly less friction and more entrainment than the Weddell Sea and Wilkes Land examples, suggests that the CONRAD17_74 dense core at 3700 m is compatible with an origin between Prydz Bay and the shelf region near Mawson station. On all other grounds, Prydz Bay would be the most likely source.

Physical oceanography of Prydz Bay region 639
It is worth noting that the dynamical arguments outlined above cast doubt over the link made by Middleton and Humphries (1989) between the dense water seen off Enderby Land and Prydz Bay itself. The dynamics of plume descent suggest that this mass was more likely to have come from a local part of the shelf, and not as far to the east as Prydz Bay.
DISCUSSION
Historical observations and ANARE hydrographic data collected through the 1980s all provide a reasonably consistent view of the horizontal circulation in the region of Prydz Bay. Current-meter measurements also lend support to the gross features of the regional scale circulation. The most consistent aspect of the circulation is a large cyclonic gyre centred on the mid- to western part of Prydz Bay, extending offshore and encompassing the Antarctic Divergence at about 65”s. Weak flows (< 0.1 m s- ‘) predominate within the Bay, but the shelf currents, as measured by instruments in 198.5, and inferred from hydrographic data, show strong westward flow, of the order of 1 m s-i, along the MacRobertson Land shelf near 63”E. The Bay is fed largely by the East Wind Drift from the vicinity of the West Ice Shelf, but also by recirculated waters from the Prydz Bay gyre.
That AABW is produced locally along the Prydz Bay to Enderby Land coast was concluded by earlier authors (Jacobs and Georgi, 1977). The evidence suggests that Prydz Bay mimics the Weddell Sea in the manner by which it produces dense water. This water is inferred to descend the continental slope, where it either interleaves as deep water or continues to become AABW. Unfortunately, there are no observations, as yet, to indicate how deep the PBBW goes.
In order to overcome this inadequacy, an attempt was made to link the observation of locally formed AABW at 62”E to a Prydz Bay origin on dynamical grounds. A streamtube model of a descending plume, which included the full non-linearities of the equation of state, was used to test the hypothesis. While the model offered support to the idea, results remain inconclusive in that the reasonable range of the model’s free parameters (entrainment and friction) allowed other possible solutions, implying a source to the west of Prydz Bay, if not within Prydz Bay itself.
Acknololedgemenrs-This work was supported by the Australian Antarctic Science Advisory Committee. We would also like to express our appreciation to members of the Australian Antarctic Division, in particular Dick Williams, Knowles Kerry, David Watts and Graham Hosie for their efforts in collecting, processing and provision of the data, and for subsequent discussions, and to the Victorian Institute of Marine Science for providing the current-meter data.
REFERENCES
Allison I. (1989) Pack-ice drift off east Antarctica and some implications. Annals of Glaciology, 12, 1-8. Baringer M. 0. and J. F. Price (1990) A simple model of the descending Mediterranean outflow plume. In: The
physical oceanography ojsea strairs, L. J. Pratt, editor, Kluwer, Dordrecht, pp. 537-544. Denisov A. S. and M. N. Myznhikova (1978) Osobennosti gidrologicheskogo rezhima v zalive Pruids (fevral’
1973 g). [Features of the oceanographic regime in Prydz Bay, February 19731. Trudy Sovetskoi Antarkticheskoi Ekspedirsii, 68, 100-105.
Foldvik A., T. Gammelsrod and T. Torresen (1985) Circulation and water masses on the southern Weddell Sea shelf. In: Oceanology of the Antarctic Continental Shelf, Antarctic Research Series, Vol. 43, S. S. Jacobs, editor, AGU, Washington, DC, pp. 5-20.
Foster T. D. and E. C. Carmack (1976) Frontal zone mixing and Antarctic Bottom Water formation in the southern Weddell Sea. Deep-Sea Research, 23, 301-317.

640 R. A. Nunes Vaz and G. W. Lennon
Foster T. D., A. Foldvik and J. H. Middleton (1987) Mixing and bottom water formation in the shelf break region of the southern Weddell Sea. Deep-Sea Research, 34, 1771-1794.
Gade H. G. (1979) Melting of ice in sea water: a primitive model with application to the Antarctic ice shelf and icebergs. Journal of Physical Oceanography, 9. 189-198.
Gill A. E. (1973) Circulation and bottom water formation in the Weddell Sea. Deep-Sea Research. 20, 11 I-140. Gordon A. L. and E. J. Molineili (1982) Southern Ocean Atlas: fhermohaline und chemical distrihukms and the
arks data set, Columbia University Press, New York, 111 pp., 233 plates. Grigor’yev Y. A. (1967) Circulation of the surface waters in Prydz Bay. Soviet Antarctic Expedition, 7, 74-76. Hellmer H. H. and S. S. Jacobs (1992) Ocean interactions with the base of the Amery Ice Shelf Antarctica. Journal
of Geophysical Research, 97(C12), 20,305-20,317. Hellmer H. H. and D. J. Olbers (1989) A two-dimensional model for the thermohaline circulation under an ice
shelf. Antarctic Science. 1, 325-336. Hodgkinson R. R., R. S. Colman, K. R. Kerry and M. S. Robb (1988) Water currents in Prydz Bay, Antarctica
during 1985. Australian National Antarctic Research Expedition. Research notes 59, Antarctic Division, Kingston, Tasmania, Australia. 127 pp.
Hodgkinson R. P., R. S. Colman, M. S. Robb and R. Williams (1991a) Current meter moorings in the region of Prydz Bay, Antarctica. 1986. Australian National Antarctic Research Expedition, Research notes 81. Antarctic Division, Kingston, Tasmania, Australia, 130 pp.
Hodgkinson R. P., R. S. Colman, M. S. Robb and R. Williams (1991b) Current meter moorings in the region of Prydz Bay, Antarctica, 1987. Australian National Antarctic Research Expedition, Research notes 82, Antarctic Division, Kingston, Tasmania, Australia, 68 pp.
Hosie G. W. (1991) Distribution and abundance of euphausiid larvae in the Prydz Bay region Antarctica. Antarctic Science, 3, 167-I 80.
Izvekov M. V. (1959) Results of observations on currents in the region of the West Ice Shelf. Soviet Antarck E.upedition, 2, 91-93.
Jacobs S. S. (1991) On the nature and significance of the Antarctic Slope Front. Marine Chemi.wy, 35, 9-24. Jacobs S. S.. R. G. Fairbanks and Y. Horibe (1985) Origin and evolution of water masses near the Antarctic
continental margin: evidence from H2 “O/HZ I60 ratios in seawater. Antarctic Research Series, 43, 59-85. Jacobs S. S. and D. T. Georgi (1977) Observations on the southwest Indian/Antarctic Ocean. In: A voyage y/’
rhcover~a, M. Angel, editor, G. E. Deacon 70th Anniversary Supplement to Deep-Sea Research, pp. 43-84. Jacobs S. S., D. T. Georgi and S. M. Patla (1980) Conrud 17: Hydrographic stutions, seafloor photogruph.r and
nephelonleter profiles in the southkvesr Indian-Antarctic Ocean, Jan-Apr 1974. Lamont-Doherty Geological Observatory CU-l-80-TRl, Palisades, New York, 213 pp.
Jenkins A. (1991) A one-dimensional model of ice shelf-ocean interaction. Journal of Geophysical Research. 96, 20,671-20.677.
Jenkins A. and A. Bombosch (1995) Modeling the effects of frazil ice crystals on the dynamics and thermodynamics of Ice Shelf Water plumes. Journal of Geophysical Research, 100, 6967-698 1.
Kerry K. R. and E. J. Woehler (1987) Oceanographic data: Prydz Bay region-Antarctic Division BIOMASS Experiment I, MV Nella Dan. November-December 1982. Australian National Antarctic Research Expedition, Research notes 52, Antarctic Division, Kingston, Tasmania, Australia, 166 pp.
Kerry K. R., E. J. Woehler, S. Wright and Z. Dong (1987a) Oceanographic data: Prydz Bay region-FIBEX, MV Nella Dan, January-March 1981. Australian National Antarctic Research Expedition. Research notes 49, Antarctic Division, Kingston, Tasmania, Australia, 114 pp.
Kerry K. R., E. J. Woehler and M. S. Robb (1987b) Oceanographic data: Prydz Bay region-SIBEX II. MV Nella Dan, January 1985. Australian National Antarctic Research Expedition, Research notes 53, Antarctic Division, Kingston. Tasmania, Australia, 122 pp.
Killworth P. D. (1977) Mixing on the Weddell Sea continental slope. Deep-Sea Research, 24, 42748. Ledenev V. G. (1964) Oceanographic investigation during the sixth voyage of the diesel-electric ship Ob. Soviet
Antarctic Expedition, 4, 54-56. Maksimov I. V. (1958) Oceanographic research of Soviet Antarctic Expeditions. Soviet Anrarctic E.xpedition, 1.6
8. Martin S. (1981) Frazil ice in rivers and oceans. Annual Review of Fluid Mechanics, 13, 379-397. Middleton J. H. and S. E. Humphries (1989) Thermohaline structure and mixing in the region of Prydz Bay
Antarctica. Deep-Sea Research, 36, 1255-1266. Nicholls K. W. and A. Jenkins (1993) Temperature and salinity beneath Ronne Ice Shelf Antarctica. Journal of
Geophysical Research, 98(Cl2), 22,553-22,568.

Physical oceanography of Prydz Bay region 641
Nicholls K. W., K. Makinson and A. V. Robinson (1991) Ocean circulation beneath the Ronne ice shelf. Narure, 354, 221-223.
Nost 0. A. and A. Foldvik (1994) A model of ice shelf-ocean interaction with application to the Filchner-Ronne and Ross Ice Shelves. Journal of Geophysical Research, 99(C7), 14,243-14,254.
Ostrekin M. Y. (1966) Results of the tenth seasonal Soviet Antarctic Expedition. Sovier Antarc/ic Expedition, 6, l-3.
Penrose J. D., M. Conde and T. J. Pauly (1994) Acoustic detection of ice crystals in Antarctic waters. Jaurnal of Geophysical Research, 99(C6), 12573-12.580.
Price J. F. and M. 0. Baringer (1994) Outflows and deep water production by marginal seas. Progress in Oceanography, 33, 16 I-200.
Robin G. de Q. (1979) Formation, flow, and disintegration of ice shelves. Journal of Glaciology, 24, 259-271. Savatiugin L. M. and V. V. Komova (1971) Gidrologicheskaia kharakteristica zaliva Priuds v fevral 1969 g.
[Hydrological features of Prydz Bay in February 19691. Trudy Sovetskoi Antarkticheskoi Ekspeditsii, 57, 99- 104.
Schlosser R., R. Bayer, A. Foldvik, T. Gammelsroed, G. Rohardt and K. 0. Muennich (1990) “0 and helium as tracers of ice shelf water and water/ice interaction in the Weddell Sea. Journal of Geophysical Research, 95, 3253-3264.
Sen’ko P. K. (1967) Seasonal work of the twelfth Soviet Antarctic Expedition (November 5, 1966May 1 I, 1967). Soviet Antarctic Expedition, 7, 53-58.
Smith N. R. and P. Treguer (1994) Physical and chemical oceanography in the vicinity of Prydz Bay, Antarctica. Southern ocean ecology>, the BIOMASS perspective, El-Sayed S., editor, Cambridge University Press, Cambridge, pp. 2541.
Smith N. R., D. Zhaoqian, K. R. Kerry and S. Wright (1984) Water masses and circulation in the region of Prydz Bay Antarctica. Deep-Sea Research, 31, 1121-l 147.
Smith P. C. (1975) A streamtube model for bottom boundary currents in the ocean. Deep-Sea Research, 22, 853- 873.
Talbot M. H. (1988) Oceanic environment of George VI Ice Shelf Antarctic Peninsula. Annals af Glaciology, 11, 161-164.
Tchernia P. and P. F. Jeannin (1980) Observations on the Antarctic East Wind drift using tabular icebergs tracked by satellite Nimbus F (1975-1977). Deep-Sea Research, 27, 467474.
Turner J. S. (1973) Buoyancy effects in fluids. Cambridge University Press. Cambridge, 368 pp. Webb D. J., P. D. Killworth, A. C. Coward and S. R. Thompson (1991) The FRAMatlas of the Southern Ocean.
Natural Environment Research Council, Swindon. Woehler E. J. and R. Williams (1988) Oceanographic data: Prydz Bay region-Australian Antarctic Marine
Biological Ecosystem Research 86/87, MV Nella Dan, February-April 1987. Australian National Antarctic Research Expedition, Research notes 63, Antarctic Division, Kingston, Tasmania, Australia, 136 pp.
Woehler E. J., K. R. Kerry, S. E. Humphries and M. S. Robb (1987a) Oceanographic data: Enderby Land region -~- Antarctic Division BIOMASS Experiment III, MV Nella Dan, September-December 1985. Australian National Antarctic Research Expedition, Research notes 54, Antarctic Division, Kingston, Tasmania, Australia, 111 pp.
Woehler E. J.. J. Shearer and K. R. Kerry (1987b) Oceanographic data: Prydz Bay region-geoscience cruise, MV Nella Dan, January-March 1982. Australian National Antarctic Research Expedition, Research notes 5 1, Antarctic Division, Kingston, Tasmania, Australia, 22 pp.
Wyrtki K. (1971) Oceanographic atlas qfthe International Indian Ocean Expedition. National Science Foundation, Washington, DC, 531 pp.
Zverev A. A. (1959) Anomalous seawater temperatures in Olaf Prydz Bay. Soviet Antarctic E.xpedi/ion, 1. 269- 271.
Zverev A. A. (1963) Currents in the Indian Ocean sector of the Antarctic. Trudv Sovetskoi Antarkticheskoi Ekspeditsii, 17, 144155.