physical properties affecting toilet paper disintegration … · physical properties affecting...
TRANSCRIPT

Physical Properties Affecting
Toilet Paper Disintegration Time
A Major Qualifying Project
Submitted to the Faculty of
WORCESTER POLYTECHNIC INSTITUTE
In partial fulfilment of the requirements for the
Degree of Bachelor of Science in Chemical Engineering
By
Kelly Knopp
Lauren Tice
Date:
6 March 2015
Report Submitted to:
Sponsor: Marie-Nöelle Pons
Advisor: Stephen Kmiotek

Page 1 of 70
Abstract
The goal of this study was to determine which properties affect the disintegration time of toilet
paper. The disintegration time was measured by performing spin tests on fourteen papers from
both France and the United States. The fiber density, turbidity, and roughness of each paper were
analyzed, and their relationship with disintegration time was studied. It was concluded that a toilet
paper with a high fiber density and smooth surface should have the fastest disintegration time.

Page 2 of 70
Acknowledgements
We would like to acknowledge Dr. Marie-Nöelle Pons at the École Nationale Supérieure des
Industries Chimiques (ENSIC) for allowing us to use her lab in the Reactions and Chemical
Engineering Laboratory to perform this research, as well as for her guidance and support
throughout the project. We would also like to thank Professor Stephen Kmiotek at Worcester
Polytechnic Institute (WPI) for his guidance, as well as the opportunity to complete our Major
Qualifying Project at ENSIC in Nancy, France.

Page 3 of 70
Table of Contents Abstract ........................................................................................................................................................................ 1
Acknowledgements ...................................................................................................................................................... 2
Summary of Figures .................................................................................................................................................... 4
Summary of Tables ...................................................................................................................................................... 4
Executive Summary ..................................................................................................................................................... 5
Introduction ............................................................................................................................................................... 10
Background ................................................................................................................................................................ 11
Consequences of Sewer Overflows ......................................................................................................................... 11
Health Consequences ......................................................................................................................................... 11
Environmental and Social Consequences .......................................................................................................... 11
Prevention of Sewer Overflows .............................................................................................................................. 11
Methodology ............................................................................................................................................................... 13
Toilet Papers Tested ................................................................................................................................................ 13
Spin Test ................................................................................................................................................................. 14
Turbidity Test ......................................................................................................................................................... 15
Fiber Density Test ................................................................................................................................................... 16
Light Percentage Calculations ............................................................................................................................ 17
SEM Microscope .................................................................................................................................................... 18
Results and Discussion .............................................................................................................................................. 19
Spin Test ................................................................................................................................................................. 19
Turbidity Test ......................................................................................................................................................... 22
Fiber Density Test ................................................................................................................................................... 24
SEM ........................................................................................................................................................................ 27
Error Analysis ............................................................................................................................................................ 31
Spin Tests................................................................................................................................................................ 31
Turbidity ................................................................................................................................................................. 31
Fiber Density .......................................................................................................................................................... 32
SEM Coefficient of Roughness .............................................................................................................................. 32
Conclusions and Recommendations ......................................................................................................................... 33
Nomenclature ............................................................................................................................................................. 35
References .................................................................................................................................................................. 36
Appendix A: Aqua Tube ™ Case Study .................................................................................................................. 37
Appendix B: Case Study on Additional Factors Affecting Turbidity ................................................................... 39
Appendix C: Raw Data ............................................................................................................................................. 41
Spin Test Data ......................................................................................................................................................... 41
Turbidity Test Data ................................................................................................................................................. 46
Fiber Density Test Data .......................................................................................................................................... 48
SEM Data................................................................................................................................................................ 62
Page 4 of 70
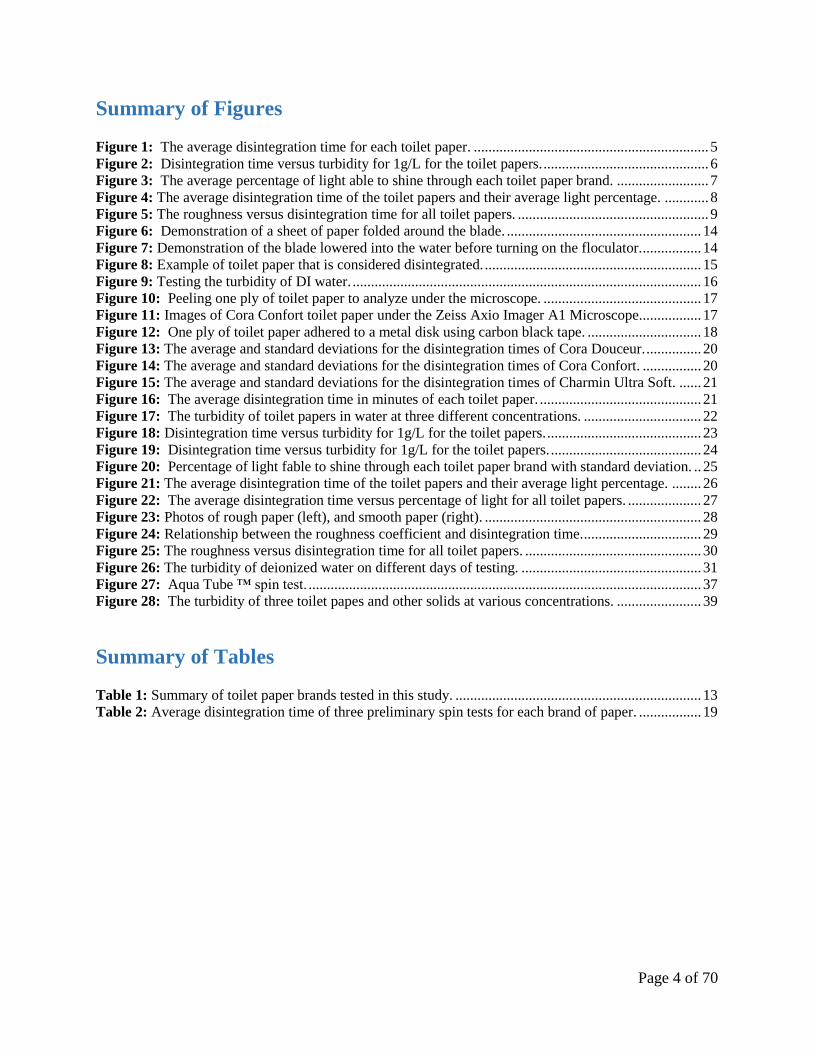
Summary of Figures Figure 1: The average disintegration time for each toilet paper. ................................................................ 5 Figure 2: Disintegration time versus turbidity for 1g/L for the toilet papers. ............................................. 6 Figure 3: The average percentage of light able to shine through each toilet paper brand. ......................... 7 Figure 4: The average disintegration time of the toilet papers and their average light percentage. ............ 8 Figure 5: The roughness versus disintegration time for all toilet papers. .................................................... 9 Figure 6: Demonstration of a sheet of paper folded around the blade. ..................................................... 14 Figure 7: Demonstration of the blade lowered into the water before turning on the floculator. ................ 14 Figure 8: Example of toilet paper that is considered disintegrated. ........................................................... 15 Figure 9: Testing the turbidity of DI water. ............................................................................................... 16 Figure 10: Peeling one ply of toilet paper to analyze under the microscope. ........................................... 17 Figure 11: Images of Cora Confort toilet paper under the Zeiss Axio Imager A1 Microscope................. 17 Figure 12: One ply of toilet paper adhered to a metal disk using carbon black tape. ............................... 18 Figure 13: The average and standard deviations for the disintegration times of Cora Douceur. ............... 20 Figure 14: The average and standard deviations for the disintegration times of Cora Confort. ................ 20 Figure 15: The average and standard deviations for the disintegration times of Charmin Ultra Soft. ...... 21 Figure 16: The average disintegration time in minutes of each toilet paper. ............................................ 21 Figure 17: The turbidity of toilet papers in water at three different concentrations. ................................ 22 Figure 18: Disintegration time versus turbidity for 1g/L for the toilet papers. .......................................... 23 Figure 19: Disintegration time versus turbidity for 1g/L for the toilet papers. ......................................... 24 Figure 20: Percentage of light fable to shine through each toilet paper brand with standard deviation. .. 25 Figure 21: The average disintegration time of the toilet papers and their average light percentage. ........ 26 Figure 22: The average disintegration time versus percentage of light for all toilet papers. .................... 27 Figure 23: Photos of rough paper (left), and smooth paper (right). ........................................................... 28 Figure 24: Relationship between the roughness coefficient and disintegration time. ................................ 29 Figure 25: The roughness versus disintegration time for all toilet papers. ................................................ 30 Figure 26: The turbidity of deionized water on different days of testing. ................................................. 31 Figure 27: Aqua Tube ™ spin test. ........................................................................................................... 37 Figure 28: The turbidity of three toilet papes and other solids at various concentrations. ....................... 39
Summary of Tables Table 1: Summary of toilet paper brands tested in this study. ................................................................... 13 Table 2: Average disintegration time of three preliminary spin tests for each brand of paper. ................. 19
Page 5 of 70
Executive Summary
Sanitary sewer overflows (SSOs) occur when the level of water in sewers rises during wet weather
conditions. If toilet paper does not disintegrate quickly enough, it is expelled from overflowing
sewers along with other untreated waste. This has a variety of health and environmental
consequences. Although toilet paper is not the only waste component of these overflows, this
study focuses on which properties influence the disintegration of toilet paper and compares various
brands.
Multiple tests were performed on fourteen different toilet papers from France and the United
States. First, the disintegration time of each toilet paper was measured by performing spin tests,
where a sheet of toilet paper was clipped to a blade rotating in water. Each toilet paper was tested
nine times, and the average disintegration time was calculated. The turbidity of one, two, and three
g/L of toilet paper in water was measured using a Hach Lange Sc1000 Transmetteur. In addition,
the fiber density of each toilet paper was analyzed under a Zeiss Axio Imager A1 Microscope.
Twenty pictures were taken of a single sheet of each type of toilet paper. Visilog 6 software was
then used to calculate the percentage of light that shone through the toilet paper from the
microscope. This percentage was inversely related to the fiber density. In addition, the three-
dimensional structures of the toilet papers were observed using a scanning electron microscope
(SEM). The texture was quantified using an image analysis software to calculate the roughness
coefficient, where a greater coefficient corresponded to a rougher surface. Finally, the correlations
between the disintegration time, fiber density, turbidity, and roughness coefficient were analyzed.
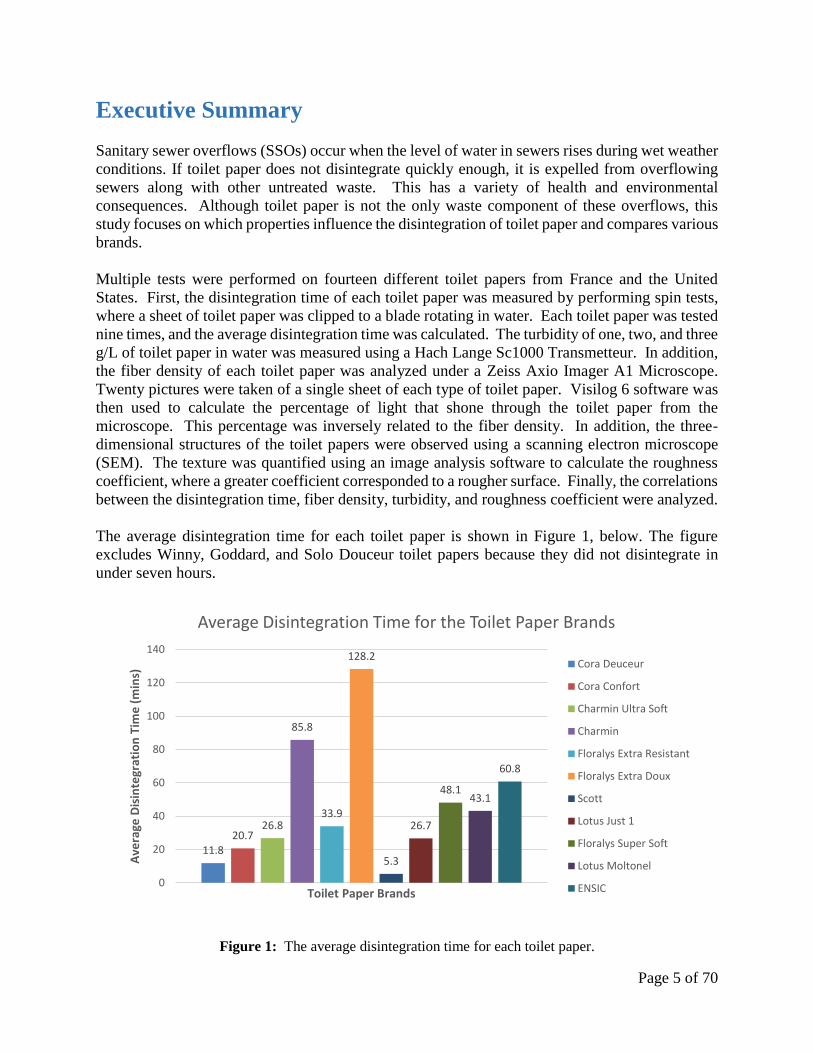
The average disintegration time for each toilet paper is shown in Figure 1, below. The figure
excludes Winny, Goddard, and Solo Douceur toilet papers because they did not disintegrate in
under seven hours.
Figure 1: The average disintegration time for each toilet paper.
11.820.7
26.8
85.8
33.9
128.2
5.3
26.7
48.143.1
60.8
0
20
40
60
80
100
120
140
Ave
rage
Dis
inte
grat
ion
Tim
e (
min
s)
Toilet Paper Brands
Average Disintegration Time for the Toilet Paper Brands
Cora Deuceur
Cora Confort
Charmin Ultra Soft
Charmin
Floralys Extra Resistant
Floralys Extra Doux
Scott
Lotus Just 1
Floralys Super Soft
Lotus Moltonel
ENSIC

Page 6 of 70
The turbidity of each toilet paper in water at three concentrations was measured and studied for
any trends. A summary of the results from seven of the brands is shown in Figure 2, below.
Figure 2: Disintegration time versus turbidity for 1g/L for the toilet papers.
Figure 2 does not illustrate any trends between the turbidity and disintegration time.
The fiber density was analyzed by calculating the percentage of light that shone through the toilet
paper from the microscope. A lower percentage of light indicates denser fibers, as less light is
able to shine through the paper. A summary of the percentage for each paper is shown in Figure
3, below, with the standard deviation shown above each bar.
0
50
100
150
200
250
0 20 40 60 80 100 120 140
Turb
idit
y
Disintegration Time (minutes)
Turbidity vs. Disintegration Time for 1g/L
Lotus Moltonel
Cora Confort
Floralys Extra Resistant
Lotus Just 1
Floralys Super Soft
Cora Douceur
Floralys Extra Doux
Scott
Charmin
Charmin Ultra Soft
ENSIC

Page 7 of 70
Figure 3: The average percentage of light able to shine through each toilet paper brand.
The ENSIC toilet paper had the highest percentage of light shining thorough and Cora Douceur
had the lowest. It is important to note that a higher percentage of light corresponds with lower
fiber density. A general trend was observed that denser fibers had faster disintegration times. This
relationship can be observed in Figure 4, below.

Page 8 of 70
Figure 4: The relationship between the average disintegration time of the toilet papers and their average
light percentage.
A scanning electron microscope was used to analyze the three-dimensional structure of the toilet
paper fibers. An image analysis software was used to calculate the roughness coefficient, where a
higher coefficient corresponded with rougher toilet paper. After graphing the roughness
coefficients versus disintegration time and fiber density, a slight positive correlation was observed.
Toilet papers with rough surfaces tended to disintegrate slower, as shown in Figure 5.
0
1
2
3
4
5
6
7
8
0 20 40 60 80 100 120 140
Ave
rage
Pe
rce
nta
ge o
f Li
ght
Average Disintegration Time (mins)
Disintegration Time vs. Percentage of Light Shining Through
Charmin Ultra Soft
Cora Douceur
Cora Confort
Charmin
Floralys ED
Floralys ER
Floralys SS
Lotus Just 1
Lotus Moltonel
Scott
ENSIC
Page 9 of 70
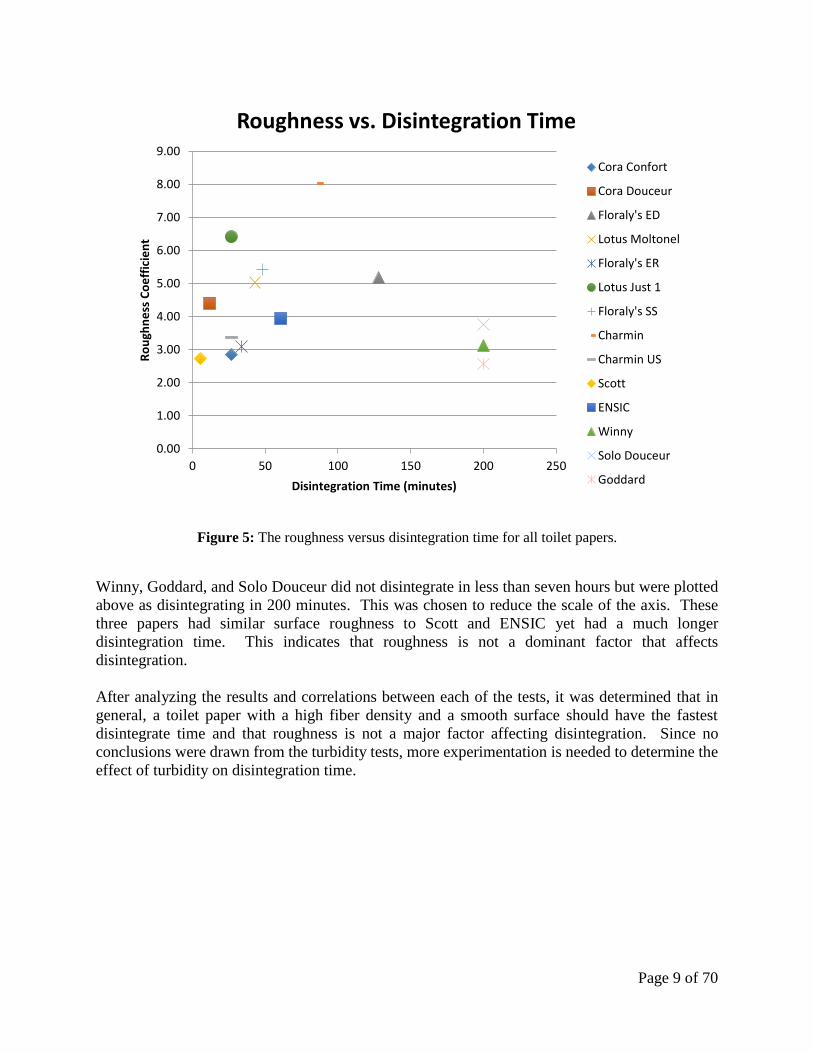
Figure 5: The roughness versus disintegration time for all toilet papers.
Winny, Goddard, and Solo Douceur did not disintegrate in less than seven hours but were plotted
above as disintegrating in 200 minutes. This was chosen to reduce the scale of the axis. These
three papers had similar surface roughness to Scott and ENSIC yet had a much longer
disintegration time. This indicates that roughness is not a dominant factor that affects
disintegration.
After analyzing the results and correlations between each of the tests, it was determined that in
general, a toilet paper with a high fiber density and a smooth surface should have the fastest
disintegrate time and that roughness is not a major factor affecting disintegration. Since no
conclusions were drawn from the turbidity tests, more experimentation is needed to determine the
effect of turbidity on disintegration time.
0.00
1.00
2.00
3.00
4.00
5.00
6.00
7.00
8.00
9.00
0 50 100 150 200 250
Ro
ugh
ne
ss C
oe
ffic
ien
t
Disintegration Time (minutes)
Roughness vs. Disintegration Time
Cora Confort
Cora Douceur
Floraly's ED
Lotus Moltonel
Floraly's ER
Lotus Just 1
Floraly's SS
Charmin
Charmin US
Scott
ENSIC
Winny
Solo Douceur
Goddard

Page 10 of 70
Introduction
The disintegration of toilet paper is essential to the proper function of modern day sewer systems.
If toilet paper does not disintegrate quickly enough and the sewer overflows, it can result in a
multitude of consequences. A sewer overflow can have negative impacts on both the environment
and health of the surrounding community. To mitigate the risk of a sewer overflow, it is necessary
to find a toilet paper that can disintegrate and move quickly through the sewer system.
There are a number of factors that may affect how quickly a specific toilet paper disintegrates.
Some of these factors include the fiber density and roughness of the toilet paper, as well as how
turbid the toilet paper is when dissolved in water. In this study, fourteen different brands of toilet
paper from both France and the United States were tested.
In addition to finding a toilet paper that disintegrates quickly, it is important to keep the consumer
in mind. Consumers prefer specific toilet paper qualities and they will not necessarily buy a toilet
paper that disintegrates more quickly if it does not have those qualities. The goal of this study was
to determine the ideal qualities that a toilet paper should have in order to disintegrate the fastest,
keeping in mind that the qualities may not appeal to consumers.

Page 11 of 70
Background
Consequences of Sewer Overflows Combined sewers collect both storm runoff and sanitary sewage. During dry weather conditions,
these sewers transport wastewater directly to sewage treatment centers. During wet weather
conditions, these sewers are designed to overflow into bodies of water if the level of wastewater
rises. This overflow, known as a sanitary sewer overflow (SSO), contains wastewater and
untreated human and industrial waste (Fleming & Slack, 2001). This industrial waste is partially
comprised of toilet paper fibers. Although toilet paper is not the singular component of SSOs, this
study only focused on toilet paper.
Ideally, toilet paper breaks down in a septic tank or sewer and travels smoothly through wastewater
infrastructure (InspectAPedia, 2014). If toilet paper does not disintegrate quickly enough and is
expelled from a sewer, there are multiple consequences. A major consequence of an SSO is that
the subsurface water carries solid waste containing pathogens into drinking water sources, leading
to community health issues. According to the United States Environmental Protection Agency
(USEPA), 40,000 SSOs occur each year, discharging pathogens into various bodies of water
(Arnone & Walling, 2007).
Health Consequences
The World Health Organization (WHO) estimates that waterborne infections cause 13 million
deaths each year. In the United States (US) alone, 900,000 cases of illnesses and 900 deaths occur
every year due to microbial contamination of drinking water. These pathogens can affect the body
through skin contact or ingestion. For example, Giardia and Cryptosporidium are two pathogens
that have been found to cause illness from drinking contaminated water. Effects of Giardia and
Cryptosporidium are diarrhea, nausea, indigestion, and can be fatal. SSOs are not only harmful to
human health, but they can also negatively impact the agriculture and aesthetics of an area.
Environmental and Social Consequences
Sewage damages the ecosystem in bodies of water such as lakes or streams. Sewer overflows kill
fish, devastate wildlife habitats, and ruin the aesthetic value of the land (Fleming & Slack, 2001).
Additionally, sewer overflows can greatly affect people’s wellbeing, as overflows can occur in
homes or buildings. Septic systems also have the potential to overflow into yards. This negatively
impacts the aesthetic of the area and requires time and financial resources to rectify the problem.
Using toilet paper that breaks down easily in sewers would contribute to fewer SSOs, thus
preserving ecosystems and the health and wellbeing of the community.
Prevention of Sewer Overflows Various qualities of toilet paper brands may make it disintegrate more quickly and therefore pose
less risk for SSOs and their associated consequences. However, creating an environmentally
friendly toilet paper can be complicated because it must be appealing for consumer use to make a
difference in sewer overflow problems. Studies have shown that other attempts to make toilet paper
more environmentally friendly, by including recycled materials, have not been successful.
In a study conducted by Hanyu et al, German and Japanese communities blindly tested recycled
versus virgin toilet paper products, and the virgin products received higher satisfaction ratings
(Hanyu, Kishino, Yamashita & Hayashi, 2007). The virgin products cause environmental harm

Page 12 of 70
because they are made from the fibers of standing trees rather than recycled paper products
(Kaufman, 2009). Of the German and Japanese participants rating the papers, only 30% and 15%,
respectively, stated that “good for the Earth” was an important quality that they considered when
buying toilet paper for their homes. Less than half of all people were willing to switch to a more
expensive brand, and most recycled products were pricier than their virgin counterparts.
People generally found the virgin products more desirable because they are softer than the recycled
papers. Despite their positive environmental impact, only 2% and 20% of commercial toilet papers
are made entirely of recycled components in the US and European Union (EU), respectively
(Kaufman, 2009). In Kaufman’s study on toilet paper use in the US and EU, it was determined
that people who claimed to be concerned about the environment still did not want to buy recycled
toilet paper because it was not soft enough (Kaufman, 2009).
It is evident that simply creating a toilet paper that degrades more quickly cannot solve the issue
of sewer backups. The toilet paper must degrade rapidly but also maintain the quality and price
that consumers expect. For this study, fourteen varieties of toilet paper from both the US and
France were tested to study qualities that affected the disintegration rate. It was necessary to study
the specific qualities of toilet papers on the market that lead to a faster rate of disintegration and
use that knowledge to find a balance.
Page 13 of 70
Methodology
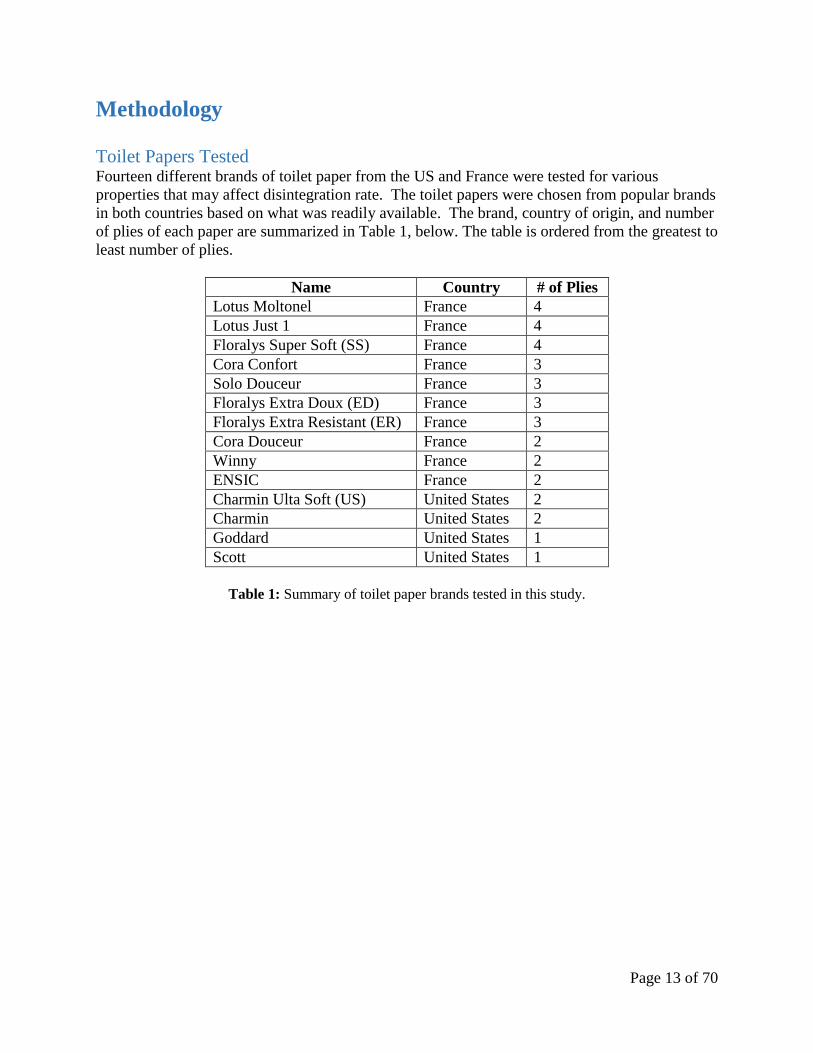
Toilet Papers Tested Fourteen different brands of toilet paper from the US and France were tested for various
properties that may affect disintegration rate. The toilet papers were chosen from popular brands
in both countries based on what was readily available. The brand, country of origin, and number
of plies of each paper are summarized in Table 1, below. The table is ordered from the greatest to
least number of plies.
Table 1: Summary of toilet paper brands tested in this study.
Name Country # of Plies
Lotus Moltonel France 4
Lotus Just 1 France 4
Floralys Super Soft (SS) France 4
Cora Confort France 3
Solo Douceur France 3
Floralys Extra Doux (ED) France 3
Floralys Extra Resistant (ER) France 3
Cora Douceur France 2
Winny France 2
ENSIC France 2
Charmin Ulta Soft (US) United States 2
Charmin United States 2
Goddard United States 1
Scott United States 1
Page 14 of 70
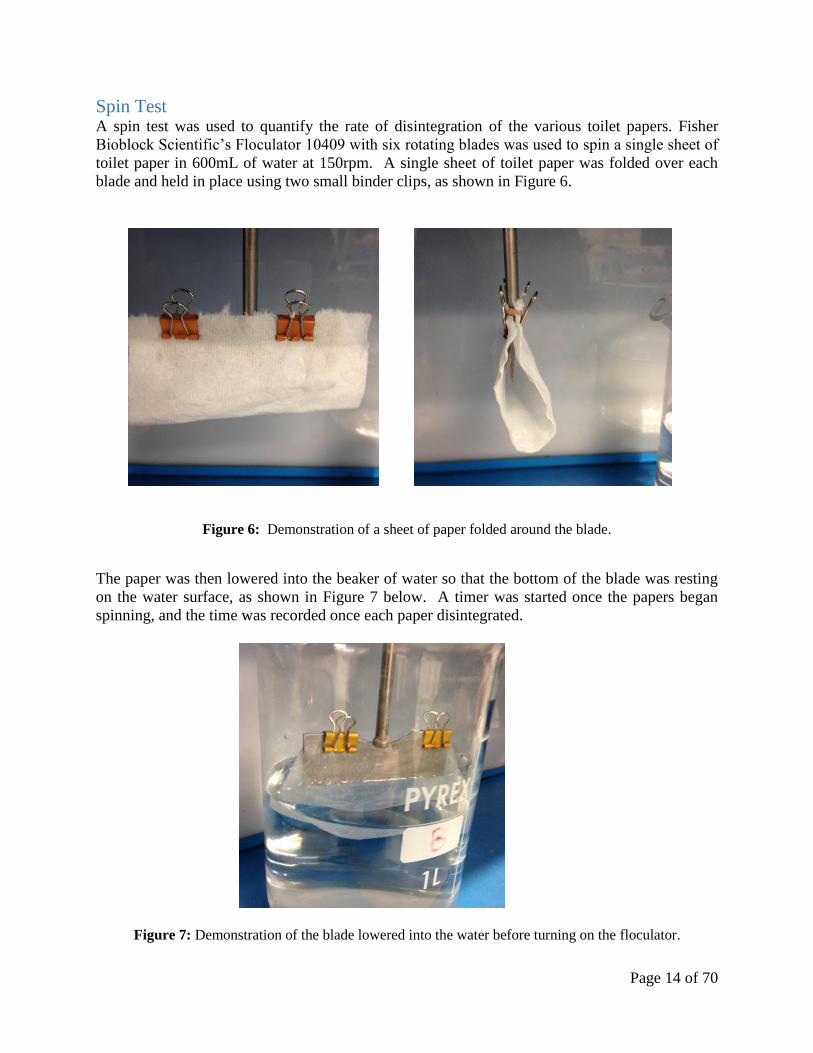
Spin Test A spin test was used to quantify the rate of disintegration of the various toilet papers. Fisher
Bioblock Scientific’s Floculator 10409 with six rotating blades was used to spin a single sheet of
toilet paper in 600mL of water at 150rpm. A single sheet of toilet paper was folded over each
blade and held in place using two small binder clips, as shown in Figure 6.
Figure 6: Demonstration of a sheet of paper folded around the blade.
The paper was then lowered into the beaker of water so that the bottom of the blade was resting
on the water surface, as shown in Figure 7 below. A timer was started once the papers began
spinning, and the time was recorded once each paper disintegrated.
Figure 7: Demonstration of the blade lowered into the water before turning on the floculator.
Page 15 of 70
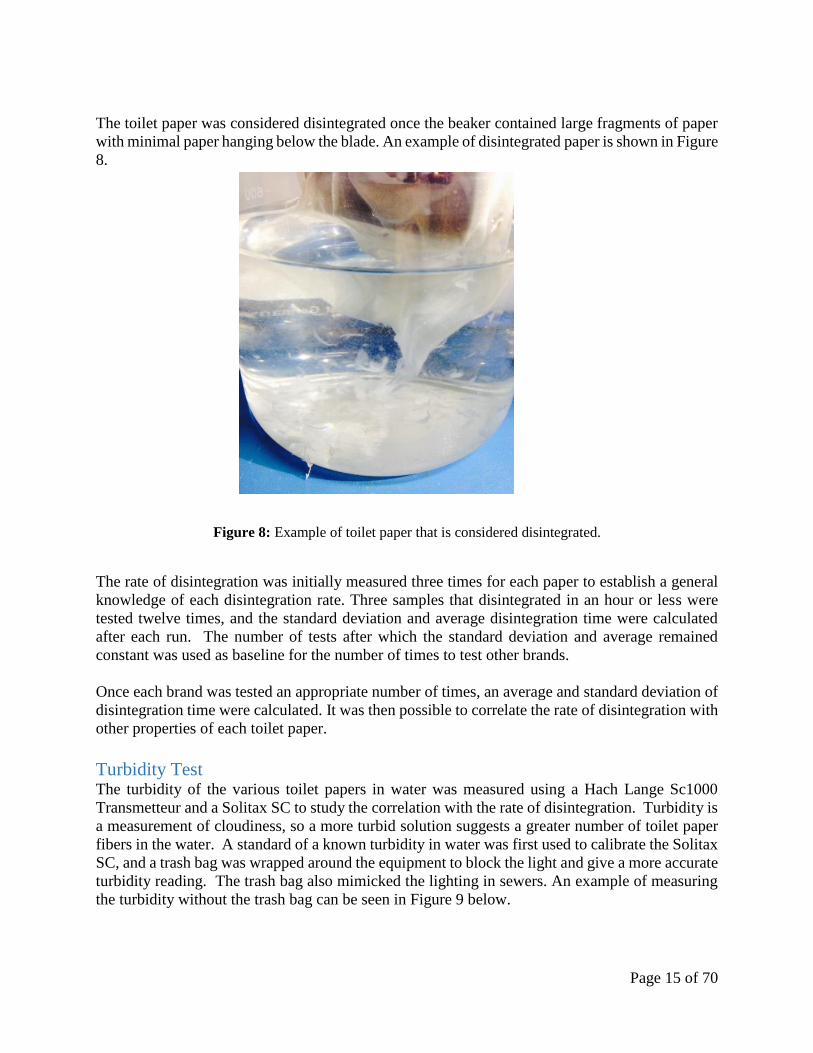
The toilet paper was considered disintegrated once the beaker contained large fragments of paper
with minimal paper hanging below the blade. An example of disintegrated paper is shown in Figure
8.
Figure 8: Example of toilet paper that is considered disintegrated.
The rate of disintegration was initially measured three times for each paper to establish a general
knowledge of each disintegration rate. Three samples that disintegrated in an hour or less were
tested twelve times, and the standard deviation and average disintegration time were calculated
after each run. The number of tests after which the standard deviation and average remained
constant was used as baseline for the number of times to test other brands.
Once each brand was tested an appropriate number of times, an average and standard deviation of
disintegration time were calculated. It was then possible to correlate the rate of disintegration with
other properties of each toilet paper.
Turbidity Test The turbidity of the various toilet papers in water was measured using a Hach Lange Sc1000
Transmetteur and a Solitax SC to study the correlation with the rate of disintegration. Turbidity is
a measurement of cloudiness, so a more turbid solution suggests a greater number of toilet paper
fibers in the water. A standard of a known turbidity in water was first used to calibrate the Solitax
SC, and a trash bag was wrapped around the equipment to block the light and give a more accurate
turbidity reading. The trash bag also mimicked the lighting in sewers. An example of measuring
the turbidity without the trash bag can be seen in Figure 9 below.

Page 16 of 70
Figure 9: Testing the turbidity of DI water.
The toilet paper suspensions were prepared in water, at concentrations of one, two, and three g/L.
A hand blender, the Proline Pied Mixeur, was used to grind the toilet paper to help it dissolve more
rapidly. The turbidity of each suspension was measured and used to study the correlation between
turbidity and disintegration rate.
Fiber Density Test All fourteen varieties of toilet paper were placed under a Zeiss Axio Imager A1 Microscope to
observe the fibers more closely. The purpose of this test was to measure the percentage of light
that shone through a sheet of toilet paper to study the fiber density. It was then determined whether
there was any correlation between fiber density and disintegration rate. For multi-ply papers, only
one ply was placed under the microscope, so the fibers could be easily distinguished, as shown in
Figure 10, below.

Page 17 of 70
Figure 10: Peeling one ply of toilet paper to analyze under the microscope.
A magnification lens of 2.5X was used for all samples, and the amount of light used varied
depending on the variety of toilet paper. The light was adjusted for each sample so that it was
possible to distinguish individual fibers against the light that was shining through from the
microscope. For each of the fourteen samples, twenty pictures were taken of different areas from
a single sheet because the fibers are not uniform throughout, as shown in Figure 11, below. Taking
multiple pictures from a variety of areas allowed for an average to be calculated so that the data
was more representative of the brand as a whole.
Figure 11: Two different images of Cora Confort toilet paper under the Zeiss Axio Imager A1
Microscope.
Light Percentage Calculations
The percentage of light from the microscope that shone through a single ply was calculated using
an image analysis software, Visilog 6. The threshold was a number that corresponded with a color
on the microscope image that would be considered “white” versus “black”. In this instance,
“white” would be spaces where light was shining through the paper, and “black” would be where
the fibers were blocking the light. The threshold was automatically set for each of the microscope
Page 18 of 70
images. The Visilog 6 software then calculated the total number of pixels in the image that were
considered to be “white”. This was the number of pixels that represented light shining through the
paper. The software also provided the dimensions of the image, which was the total number of
pixels in the image. Dividing the number of pixels under the threshold by the total number of
pixels resulted in the fraction of light shining through the sample. A larger percentage of light
shining through a sample meant that there were more spaces between fibers, so the fibers were less
dense. This data was later used to correlate the fiber density of each brand with its disintegration
time calculated from the spin tests.
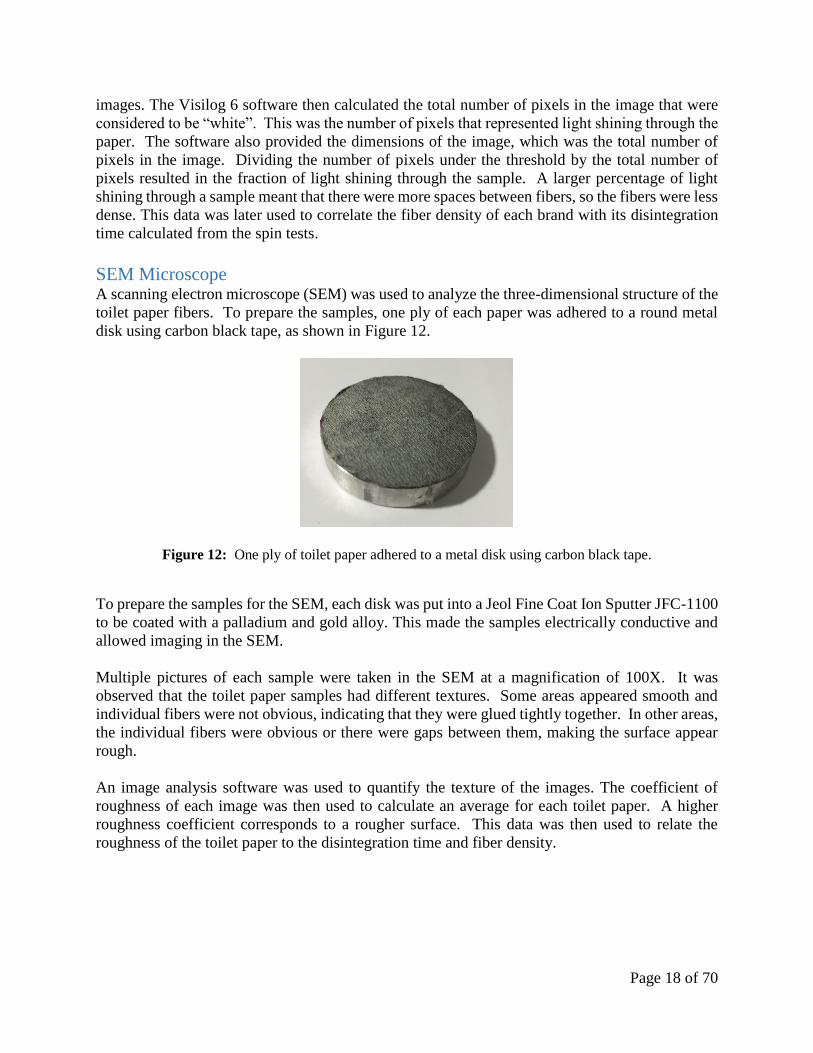
SEM Microscope A scanning electron microscope (SEM) was used to analyze the three-dimensional structure of the
toilet paper fibers. To prepare the samples, one ply of each paper was adhered to a round metal
disk using carbon black tape, as shown in Figure 12.
Figure 12: One ply of toilet paper adhered to a metal disk using carbon black tape.
To prepare the samples for the SEM, each disk was put into a Jeol Fine Coat Ion Sputter JFC-1100
to be coated with a palladium and gold alloy. This made the samples electrically conductive and
allowed imaging in the SEM.
Multiple pictures of each sample were taken in the SEM at a magnification of 100X. It was
observed that the toilet paper samples had different textures. Some areas appeared smooth and
individual fibers were not obvious, indicating that they were glued tightly together. In other areas,
the individual fibers were obvious or there were gaps between them, making the surface appear
rough.
An image analysis software was used to quantify the texture of the images. The coefficient of
roughness of each image was then used to calculate an average for each toilet paper. A higher
roughness coefficient corresponds to a rougher surface. This data was then used to relate the
roughness of the toilet paper to the disintegration time and fiber density.

Page 19 of 70
Results and Discussion
Spin Test The first step in conducting the spin tests was determining the appropriate number of times to test
each brand of paper. Each paper was preliminarily tested three times to find a baseline for how
long it took to dissolve. The preliminary testing for each brand is summarized in Table 2, below.
Name
Average
Disintegration
Time (min)
Lotus Moltonel 42
Lotus Just 1 102
Floralys Super Soft 66
Cora Confort 12
Solo Douceur 342
Floralys Extra Doux 48
Floralys Extra Resistant 90
Cora Douceur 30
Winny 420
Charmin Ultra Soft 60
Charmin 90
Goddard 420
Scott 48
Table 2: Average disintegration time of three preliminary spin tests for each brand of paper.
Using this baseline, three papers with shorter disintegration times were selected to be tested twelve
times each, and the average and standard deviation were plotted over the number of trials. This
information was then used to determine how many times the other papers should be tested. Cora
Douceur, Cora Confort, and Charmin Ultra Soft were selected because they each had average
disintegration times of one hour or less. It was important to choose papers with shorter
disintegration times to complete the testing more efficiently. Testing the shorter papers multiple
times was less time consuming than testing the longer papers.
The graphs of the average and standard deviation of the three chosen papers were used to determine
how many times subsequent brands should be tested. After a certain number of trials, it was
expected that the average and standard deviation would stop fluctuating and begin to remain
constant. The number of trials after which this occurred would be the number of trials conducted
on all other brands of toilet paper. Cutting down the number of trials on the brands that took longer
to disintegrate saved a significant amount of time. The results from the twelve trials on Cora
Douceur, Cora Confort, and Charmin Ultra Soft are summarized in Figures 13 - 15 below.

Page 20 of 70
Figure 13: The average and standard deviations for the disintegration times of Cora Douceur.
The Cora Douceur results showed a steady decrease in both the average and the standard deviation
of the disintegration time until trial seven. After this trial, the results begin to stabilize.
Figure 14: The average and standard deviations for the disintegration times of Cora Confort.
There is a sharp increase in the values until trial seven for Cora Confort, after which they begin to
stabilize.
3
5
7
9
11
13
15
3 4 5 6 7 8 9 10 11 12
Tim
e (
min
s)
Trial Number
Cora Douceur Disintegration Time
Average
Standard Deviation
5
7
9
11
13
15
17
19
21
3 4 5 6 7 8 9 10 11 12
Tim
e (
min
s)
Trial Number
Cora Confort Disintegration Time
Average
Standard Deviation
Page 21 of 70
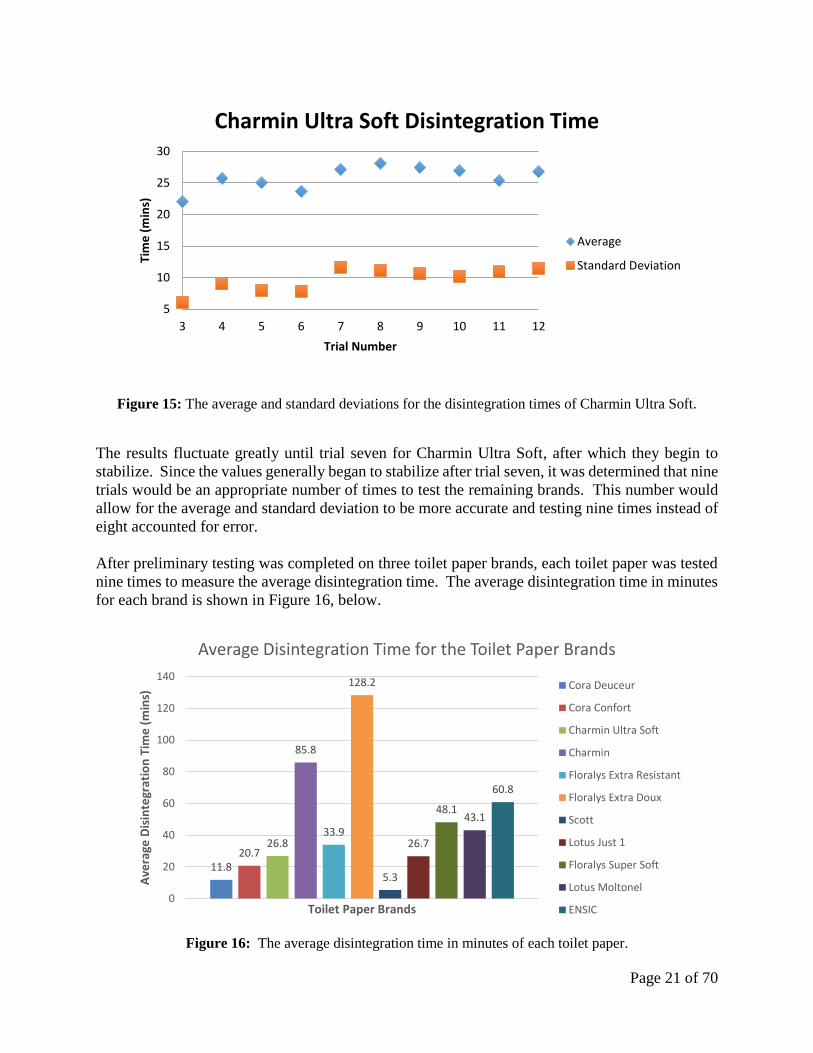
Figure 15: The average and standard deviations for the disintegration times of Charmin Ultra Soft.
The results fluctuate greatly until trial seven for Charmin Ultra Soft, after which they begin to
stabilize. Since the values generally began to stabilize after trial seven, it was determined that nine
trials would be an appropriate number of times to test the remaining brands. This number would
allow for the average and standard deviation to be more accurate and testing nine times instead of
eight accounted for error.
After preliminary testing was completed on three toilet paper brands, each toilet paper was tested
nine times to measure the average disintegration time. The average disintegration time in minutes
for each brand is shown in Figure 16, below.
Figure 16: The average disintegration time in minutes of each toilet paper.
5
10
15
20
25
30
3 4 5 6 7 8 9 10 11 12
Tim
e (
min
s)
Trial Number
Charmin Ultra Soft Disintegration Time
Average
Standard Deviation
11.820.7
26.8
85.8
33.9
128.2
5.3
26.7
48.143.1
60.8
0
20
40
60
80
100
120
140
Ave
rage
Dis
inte
grat
ion
Tim
e (
min
s)
Toilet Paper Brands
Average Disintegration Time for the Toilet Paper Brands
Cora Deuceur
Cora Confort
Charmin Ultra Soft
Charmin
Floralys Extra Resistant
Floralys Extra Doux
Scott
Lotus Just 1
Floralys Super Soft
Lotus Moltonel
ENSIC

Page 22 of 70
Goddard, Winny, and Cora Douceur were omitted from the figure above because they did not
disintegrate after seven hours of testing. As a result, they were not tested nine times. Figure 16
shows that Floralys Extra Doux had the slowest disintegration time of 128 minutes, and Scott had
the fastest disintegration time of 5 minutes. This data was then used to study the trends between
other properties and disintegration time to determine if there were any correlations.
Turbidity Test A suspension of toilet paper in water was made at concentrations of one, two, and three g/L for
each brand. The turbidity of each suspension was then measured using a Hach Lange Sc1000
Transmetteur that was wrapped in a trash bag to imitate sewer lighting. It was expected that as the
concentration increased, the turbidity of each brand would also increase because the water would
be cloudier with more toilet paper. A summary of the results from seven of the brands is shown
below in Figure 17. The seven brands were chosen at random to display to reduce the number of
data points on the graph. Showing seven brands rather than all fourteen allowed for trends to be
displayed more clearly.
Figure 17: The turbidity of toilet papers in water at three different concentrations.
It can be noted that the turbidity increases with increased concentration, but the amount by which
it increases varies greatly between brands. For example, the turbidity of Lotus Moltonel appears
0
100
200
300
400
500
600
700
800
900
1 2 3
Turb
idit
y
Concentration (g/L)
Turbidity of Paper in Water at Three Concentrations
Lotus Moltonel
Winny
Lotus Just 1
Floraly's SS
Solo Douceur
Scott
ENSIC

Page 23 of 70
to increase nearly linearly with each change in concentration, but Lotus Just 1 displays a sharp
increase in turbidity when the concentration is increased from two to three g/L. It can also be
noted that at a concentration of one g/L, the turbidity of each brand is very similar, and falls
between 50 and 200. As the concentration increases, there is much more variance between the
turbidity of each brand.
The turbidity measurements and the average disintegration time at various concentrations are
plotted together in Figure 18, below, to study the correlation between these two properties. Toilet
papers that did not disintegrate after seven hours were not included in these graphs to reduce the
axis scale and study the trends more clearly.
Figure 18: Disintegration time versus turbidity for 1g/L for the toilet papers.
At a concentration of one g/L, there is no obvious correlation between the disintegration time and
turbidity of each brand.
0
50
100
150
200
250
0 20 40 60 80 100 120 140
Turb
idit
y
Disintegration Time (minutes)
Turbidity vs. Disintegration Time for 1g/L
Lotus Moltonel
Cora Confort
Floralys Extra Resistant
Lotus Just 1
Floralys Super Soft
Cora Douceur
Floralys Extra Doux
Scott
Charmin
Charmin Ultra Soft
ENSIC

Page 24 of 70
Figure 19: Disintegration time versus turbidity for 1g/L for the toilet papers.
At a concentration of three g/L, there appears to be a negative correlation between half of the
points, but since the other half do not follow the trend, no conclusions can be drawn. From this
data it cannot be concluded whether the turbidity of a toilet paper brand has any effect on its
disintegration time. Additional testing was done to examine the effect of partial size and shape on
the turbidity measurements. This case study is discussed in Appendix B.
Fiber Density Test Once the percentage of light from the microscope shining through each sample was determined,
an average was calculated for each of the fourteen brands of toilet paper. A greater percentage of
light shining through the paper meant that there were more spaces between the fibers, so they were
less dense. Essentially, measuring the percentage of light shining through the paper was the
equivalent of measuring the percentage of empty spaces between the fibers. The purpose of
measuring this physical characteristic was to evaluate any correlation between the fiber density
and the disintegration time. The results for the average percentage of light shining through each
paper are shown in Figure 20, below, with the standard deviation shown above each bar. It is
important to note that the percentage of light shining through the paper is inversely related to fiber
density.
0
100
200
300
400
500
600
700
800
900
0 20 40 60 80 100 120 140
Turb
idit
y
Disintegration Time (minutes)
Turbidity vs. Disintegration Time for 3g/L
Lotus Moltonel
Cora Confort
Floralys Extra Resistant
Lotus Just 1
Floralys Super Soft
Cora Douceur
Floralys Extra Doux
Scott
Charmin
Charmin Ultra Soft
ENSIC

Page 25 of 70
Figure 20: The average percentage of light fable to shine through each toilet paper brand with the
standard deviation shown above each bar.
The toilet papers had a wide range of fiber densities. The percentage of light shining through each
paper ranged from 1.32% for Cora Douceur to 7.12% for ENSIC. Based on this measurement
alone, Cora Douceur has the greatest fiber density, and ENSIC has the most spaces and holes
between fibers.
An overall trend was observed between the fiber density and the disintegration time of each
sample, as shown in Figure 21, below. Winny, Goddard, and Solo Douceur are excluded from this
graph because they did not disintegrate in under seven hours. Eliminating these points
significantly reduces the scale of the axis, making the trend easier to study.
Page 26 of 70
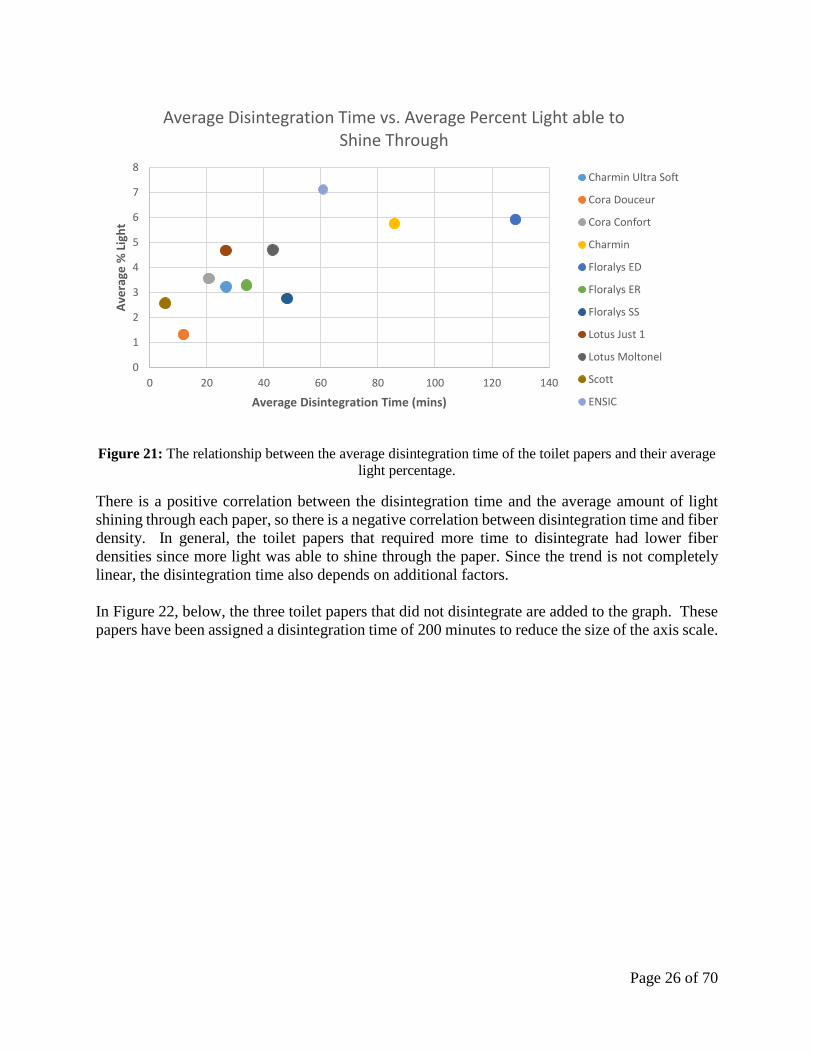
Figure 21: The relationship between the average disintegration time of the toilet papers and their average
light percentage.
There is a positive correlation between the disintegration time and the average amount of light
shining through each paper, so there is a negative correlation between disintegration time and fiber
density. In general, the toilet papers that required more time to disintegrate had lower fiber
densities since more light was able to shine through the paper. Since the trend is not completely
linear, the disintegration time also depends on additional factors.
In Figure 22, below, the three toilet papers that did not disintegrate are added to the graph. These
papers have been assigned a disintegration time of 200 minutes to reduce the size of the axis scale.
0
1
2
3
4
5
6
7
8
0 20 40 60 80 100 120 140
Ave
rage
% L
igh
t
Average Disintegration Time (mins)
Average Disintegration Time vs. Average Percent Light able to Shine Through
Charmin Ultra Soft
Cora Douceur
Cora Confort
Charmin
Floralys ED
Floralys ER
Floralys SS
Lotus Just 1
Lotus Moltonel
Scott
ENSIC

Page 27 of 70
Figure 22: The average disintegration time versus percentage of light for all toilet papers.
It can be noted that the points for Winny, Goddard, and Solo Douceur are nearly overlapping
because they have very similar fiber densities. They still follow the general trend that a greater
percentage of light able to shine through corresponds with a longer disintegration time. However,
the points for the three papers that did not disintegrate have lower percentages of light able to shine
through than some of the other papers tested. This suggests that after a certain point, there is a
maximum percentage of light that is able to shine through, or a minimum fiber density that is
reached.
SEM An SEM was used to take approximately twenty pictures of each of the fourteen toilet paper
brands. Using an image analysis software, the texture of the paper in each image was quantified
and assigned a coefficient of roughness. A paper with a higher coefficient has a rougher surface,
meaning that the fibers are less attached to one another. A lower coefficient of roughness means
that the paper surface is smoother, suggesting that the fibers are more thoroughly glued together.
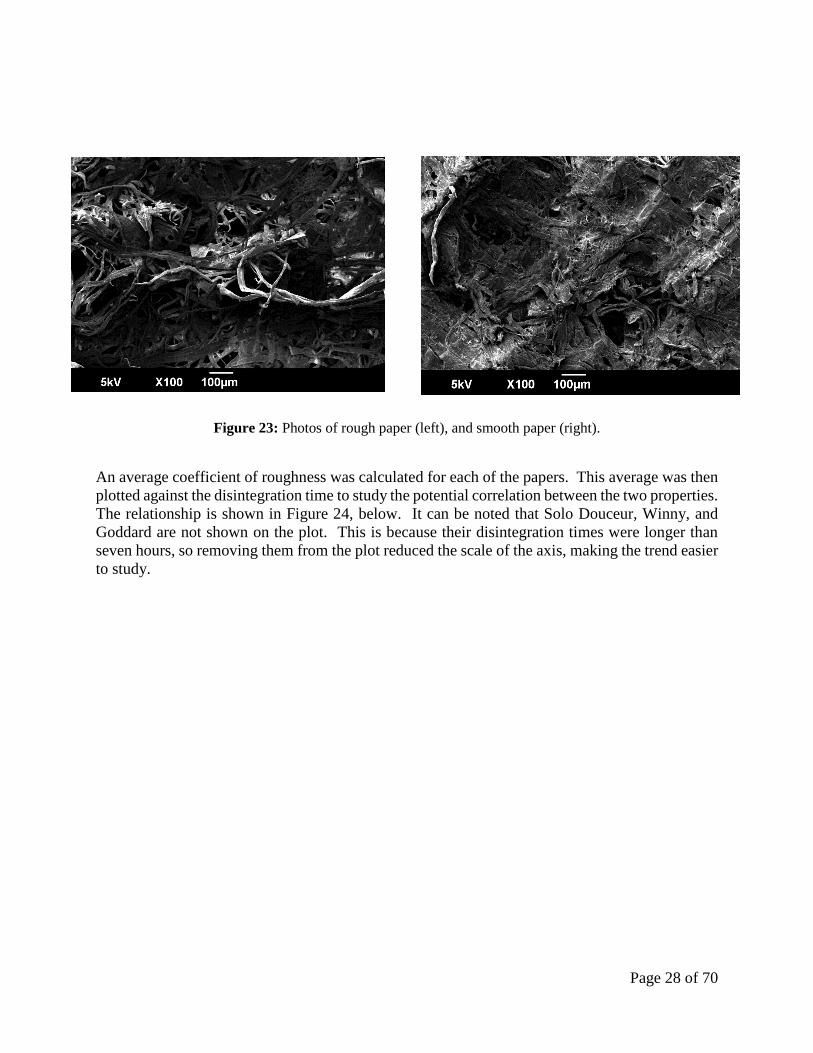
Examples of rough and smooth papers can be seen in Figure 23, below. The photo on the left
shows an image of Charmin that has a roughness coefficient of 8.03. The photo on the right shows
Goddard with a roughness coefficient of 2.56.
0
1
2
3
4
5
6
7
8
0 50 100 150 200 250
Ave
rage
% L
igh
t
Average Disintegration Time (mins)
Average Disintegration Time vs. Average Percent Light able to Shine Through
Charmin Ultra Soft
Cora Douceur
Cora Confort
Charmin
Floralys ED
Floralys ER
Floralys SS
Lotus Just 1
Lotus Moltonel
Scott
ENSIC
Goddard
Solo Douceur
Winny
Page 28 of 70
Figure 23: Photos of rough paper (left), and smooth paper (right).
An average coefficient of roughness was calculated for each of the papers. This average was then
plotted against the disintegration time to study the potential correlation between the two properties.
The relationship is shown in Figure 24, below. It can be noted that Solo Douceur, Winny, and
Goddard are not shown on the plot. This is because their disintegration times were longer than
seven hours, so removing them from the plot reduced the scale of the axis, making the trend easier
to study.

Page 29 of 70
Figure 24: Relationship between the roughness coefficient and disintegration time.
There is a slight positive correlation between the roughness coefficient and the disintegration time
of the toilet papers. This means that papers with rougher surfaces tend to take longer to
disintegrate. Therefore, the papers that are more glued together, with smoother surfaces,
disintegrate more quickly.
Figure 25, below, is the same plot including Winny, Goddard, and Solo Douceur. These papers
did not disintegrate in less than seven hours but were plotted below as disintegrating in 200
minutes, which was chosen to reduce the scale of the axis.
0.00
1.00
2.00
3.00
4.00
5.00
6.00
7.00
8.00
9.00
0 20 40 60 80 100 120 140
Ro
ugh
ne
ss C
oe
ffic
ien
t
Disintegration Time (minutes)
Roughness vs. Disintegration Time
Cora Confort
Cora Douceur
Floraly's ED
Lotus Moltonel
Floraly's ER
Lotus Just 1
Floraly's SS
Charmin
Charmin US
Scott
ENSIC

Page 30 of 70
Figure 25: The roughness versus disintegration time for all toilet papers.
These three toilet papers have similar roughness coefficients to Scott and ENSIC despite their
longer disintegration time. This indicates that roughness is not a dominant factor affecting the
disintegration time. In general, a smoother surface disintegrates more quickly, but there are other
properties that have a stronger effect on the disintegration. There were multiple sources of error
when analyzing the SEM data that may have skewed the roughness coefficient. These potential
errors are discussed later on.
0.00
1.00
2.00
3.00
4.00
5.00
6.00
7.00
8.00
9.00
0 50 100 150 200 250
Ro
ugh
ne
ss C
oe
ffic
ien
t
Disintegration Time (minutes)
Roughness vs. Disintegration Time
Cora Confort
Cora Douceur
Floraly's ED
Lotus Moltonel
Floraly's ER
Lotus Just 1
Floraly's SS
Charmin
Charmin US
Scott
ENSIC
Winny
Solo Douceur
Goddard

Page 31 of 70
Error Analysis
Spin Tests Throughout experimentation, there were various sources of error that may have skewed the data.
When conducting the spin tests, four different blades on the floculator were used simultaneously,
and it was noted that the paper on the first blade usually disintegrated first, and paper on the third
blade usually took the longest to disintegrate. This suggests that the different blades may have
been spinning at inconsistent speeds. The third blade also rocked back and forth slightly as it was
spinning which subjected that toilet paper to different movements compared to the other blades.
The blades would also occasionally sink into the water, so they would need to be lifted back into
position. This movement may have caused some of the samples to break off of the blade more
quickly than if they had been undisturbed.
Another source of error during the spin tests was that the water used in the beakers was not at a
consistent temperature. They were subjectively filled with room-temperature water, but the
temperature was not confirmed with a thermometer. The disintegration time may have been faster
or slower depending on the temperature of the water used during testing.
The various brands also had toilet paper sheets of different dimensions. In order to fit the toilet
paper into the beaker, the perforations were sometimes parallel and sometimes perpendicular to
the blade. It is possible that the uneven edges of the perforations being in different orientations
may have also had an effect on the disintegration times across brands.
Turbidity It is important to note that the Solitax SC reads turbidity at values between 0 and 4000. At the
beginning of each day, the turbidity of deionized water was measured, and it varied from day to
day. It was expected that the turbidity of water would be zero since it should be clear, but the
machine registered it inaccurately. A summary of the dates and deionized water turbidities is
displayed in Figure 26, below.
Figure 26: The turbidity of deionized water on different days of testing.
82
5748
83
33
52
0
20
40
60
80
100
Turb
idit
y
Date (month/day)
Turbidity of Deionized Water on Different Days
2/6
2/9
2/11
2/12
2/13
2/16
Page 32 of 70
Since the turbidity was measured on a scale of 0 to 4000 the variation shown in Figure 26 is
considered to be “noise”. There was sometimes a change of less than 100 between the turbidity
of toilet paper at different concentrations. It is unclear how much of that variation can be attributed
to “noise” versus an actual change in turbidity.
The size and shape of the fibers being measured may have also affected the turbidity
measurements. As previously mentioned, a case study on this effect can be found in Appendix B.
A trash bag was also used to block the light during the turbidity measurements, but this was not a
perfect method, and there may have been some light that skewed the sample readings.
Fiber Density A source of error when measuring the fiber density was that all twenty microscope pictures were
taken of the same sheet of toilet paper. Taking twenty pictures accounted for variation in different
areas of that specific sheet, but it did not account for variation throughout the roll. It is possible
that sheets from the beginning, middle, and end of the roll may have had different fiber densities,
so this was a source of error in measuring this property.
SEM Coefficient of Roughness The image analysis software was not perfect, and the measurements of roughness are highly
dependent on the clarity and lighting in the SEM images. Therefore, the image analysis software
itself was a source of error when calculating the roughness coefficient of each brand.
Page 33 of 70
Conclusions and Recommendations
The goal of this study was to determine how various properties impact the disintegration time of
toilet paper to reduce the consequences of sewer overflows. Spin tests were used to quantify the
rate of disintegration of fourteen brands of toilet paper from France and the US. This data was
used to study correlations between disintegration time, fiber density, turbidity, and roughness.
It was noted that there were various sources of error when conducting the spin tests, so in future
experiments there should be some improvements made to the testing method. Each of the blades
should be calibrated to ensure that the speed readout on the floculator matches the speed of each
individual blade. If time allowed, the accuracy of the disintegration time measurements could also
be improved by using the same blade for each trial. It is also recommended that the water
temperature be measured to ensure that it is consistent between spin test trials. Finally, it is
recommended that wider beakers be used so that the toilet paper can be folded over the blade with
the perforations in the same orientation each time. With these improvements, some outside factors
affecting the disintegration time would be eliminated, providing more accurate results.
As expected, there was an increase in turbidity for each brand as the concentration increased
because the water became cloudier as more toilet paper was added. At concentrations of one and
three g/L, there were no obvious trends between the disintegration time and turbidity of each brand
of paper. Therefore, no conclusions can be drawn without further testing.
Due to time constraints, each brand was tested at each concentration only once, so it is
recommended that more measurements be taken in future experiments. Taking an average of
multiple measurements would provide more accurate data. In order to further improve the
measurements, it is recommended that the Solitax SC be calibrated more thoroughly. The machine
displayed “noise” when measuring the turbidity of deionized water each day, so it was not a
reliable instrument when analyzing the toilet paper solutions. It is also recommended that the Hach
Lange Sc1000 Transmetteur be placed in a darkroom during future experimentation. Since light
skews the turbidity measurements, a trash bag was placed around the instrument, but a darkroom
would be a more effective method of blocking all light.
To measure the fiber density of each brand of toilet paper, the percentage of light able to shine
through a single ply was calculated using Visilog software. It was concluded that as the percentage
of light able to shine through the paper increased, the disintegration time also increased. Therefore,
toilet papers with greater fiber densities have lower disintegration times.
When measuring the percentage of light that shone through each toilet paper, the microscope
pictures were all from the same sheet. In future experiments it is recommended that the pictures
be taken from sheets from the beginning, middle, and end of the roll to account for variation.
The roughness coefficients of SEM photos were calculated using an image analysis software. It
was concluded that papers with rougher surfaces took longer to disintegrate. This means that
papers that are more glued together, and therefore have smoother surfaces, have faster
disintegration times. However, when studying the papers that did not disintegrate, it became clear
that roughness is not a dominant factor affecting disintegration time. In the future, additional

Page 34 of 70
properties should be studied to determine which properties have a stronger impact on
disintegration.
With the exception of the spin tests, the toilet paper plies had to be peeled apart for all experiments.
It was noted during sample preparation that some plies were easier to pull apart compared to other
toilet papers. It is possible that their ease of separation may have a significant contribution to
disintegration time. This was not quantified or analyzed in this study, but it may be a useful
property to examine in future experiments.
Overall, it was concluded that toilet papers with faster disintegration times generally have denser
fibers and smoother surfaces. Without further experimentation, there can be no conclusions made
regarding the turbidity. These properties coincide with what customers generally look for when
buying paper for their homes, so the potential for creating an environmentally friendly toilet paper
is promising.
Page 35 of 70
Nomenclature
Charmin US: Charmin Ultra Soft
ENSIC: Toilet paper taken from the École Nationale Supérieure des Industries Chimiques’s
bathroom
EU: European Union
Floraly’s ED: Floraly’s Extra Doux
Floraly’s ER: Floraly’s Extra Resistant
Floraly’s SS: Floraly’s Super Soft
Goddard: Toilet paper taken from the Goddard Hall building on the Worcester Polytechnic
Institute campus
SEM: Scanning Electron Microscope
SSO: Sanitary Sewer Overflow
US: United States
USEPA: United States Environmental Protection Agency
WHO: World Health Organization

Page 36 of 70
References
Arnone, R., & Walling, J. (2007). Waterborne pathogens in urban watersheds. Journal of Water
and Health, 5(1), 149-162.
Aqua Tube: the only flushable tube. (n.d.). Retrieved from aquatube.eu website:
http://www.aquatube.eu/eu/home.aspx
Bathroom tissue lab test: What happens to toilet paper in the septic tank?
(2014). Retrieved January 22, 2015, from InspectAPedia website:
http://inspectapedia.com/septic/Toilet_Tissue_Test.htm
Fleming, H., & Slack, D. (2001). Trends in sewer overflow management. Water Engineering &
Management, 148(2), 21. Retrieved from
http://ezproxy.wpi.edu/login?url=http://search.proquest.com/docview/214962648?accountid=291
20. The regulations for Combined Sewer Overflows and Stormwater Overflows are becoming
more stringent as awareness of the effects of water pollution increase.
Hanyu, K., Kishino, H., Yamashita, H., & Hayashi, C. (2000). Linkage between recycling and
consumption: a case of toilet paper in Japan. Resources, conservation and recycling, 30(3), 177-
199.
Kaufman, Leslie (2009, March 8). Bottom line: Fluffy toilet paper is rough on environment.
Providence journal (Providence, R.I.: 1998), p. C.6.
Strifling, D. (2003). Sanitary Sewer Overflows: Past, Present, and Future Regulation. Marquette
Law Review, 87.
Page 37 of 70
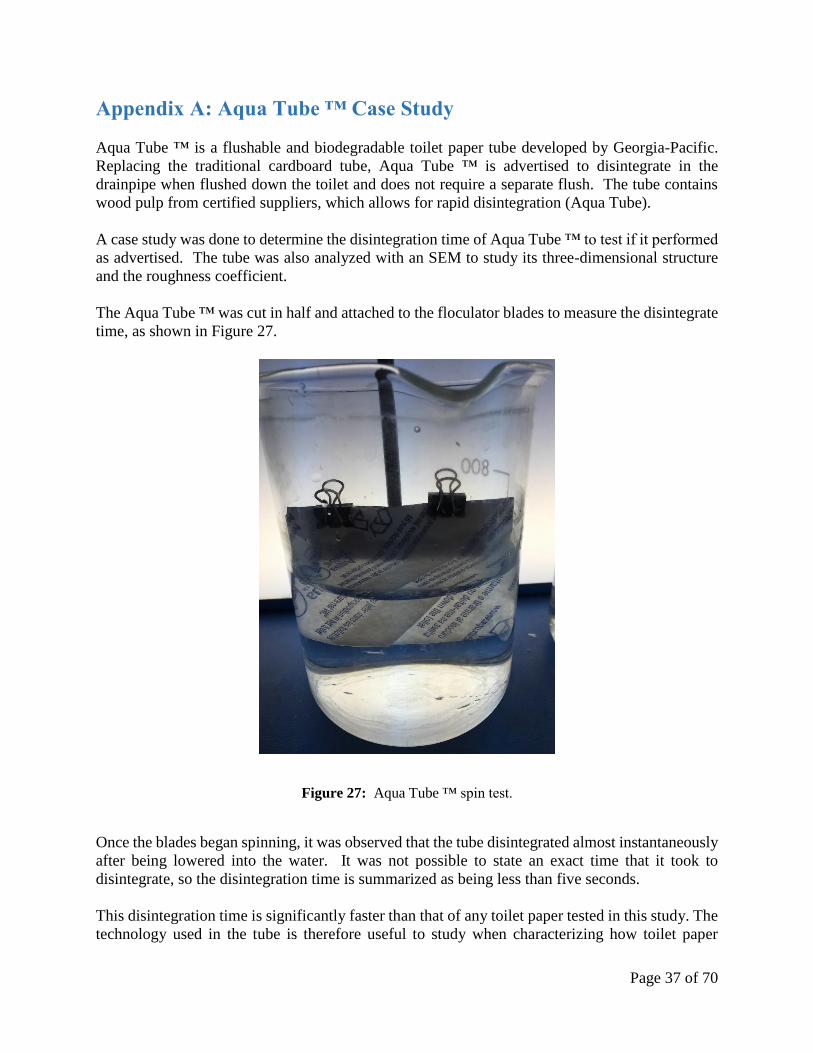
Appendix A: Aqua Tube ™ Case Study
Aqua Tube ™ is a flushable and biodegradable toilet paper tube developed by Georgia-Pacific.
Replacing the traditional cardboard tube, Aqua Tube ™ is advertised to disintegrate in the
drainpipe when flushed down the toilet and does not require a separate flush. The tube contains
wood pulp from certified suppliers, which allows for rapid disintegration (Aqua Tube).
A case study was done to determine the disintegration time of Aqua Tube ™ to test if it performed
as advertised. The tube was also analyzed with an SEM to study its three-dimensional structure
and the roughness coefficient.
The Aqua Tube ™ was cut in half and attached to the floculator blades to measure the disintegrate
time, as shown in Figure 27.
Figure 27: Aqua Tube ™ spin test.
Once the blades began spinning, it was observed that the tube disintegrated almost instantaneously
after being lowered into the water. It was not possible to state an exact time that it took to
disintegrate, so the disintegration time is summarized as being less than five seconds.
This disintegration time is significantly faster than that of any toilet paper tested in this study. The
technology used in the tube is therefore useful to study when characterizing how toilet paper

Page 38 of 70
properties affect disintegration. It was not possible to test the fiber density of the tube since it
does not have plies. Therefore, it was not possible to compare the density of the tube to see if it
followed the trend that denser fibers disintegrate more quickly. In the future, it is recommended
that a similar test be developed for testing the fiber density of the tube.
The turbidity of the tube in water was also not tested. There was no correlation between turbidity
and disintegration time found when testing the papers, so it was not useful to study this property
of the tube.
Finally, SEM pictures were taken of the tube, and the image analysis software was used to
determine that the average roughness coefficient was 3.45. This roughness coefficient falls on the
lower end compared to the toilet papers measured, adhering to the trend that a smoother surface
correlates with a lower disintegration time.
In the future it is recommended to further study the properties of the Aqua Tube ™ compared to
those of the toilet papers to determine other properties that may affect disintegration time. This
technology could be used to eventually create a new toilet paper that disintegrates more quickly in
sewer systems, preventing sewer overflows.

Page 39 of 70
Appendix B: Case Study on Additional Factors Affecting Turbidity
The turbidity of each brand of toilet paper was measured at concentrations of one, two, and three
g/L in water, and no conclusions were drawn from the collected data. As an additional case study,
the turbidity of four other solids were measured at the same three concentrations and compared to
the toilet papers. The purpose of this study was to examine the potential that other factors affect
the turbidity reading on the Hach Lange Transmetteur.
The turbidities of kieselguhr, corn starch, rice starch, and potato starch are shown at each
concentration in Figure 28, below. Three toilet papers were arbitrarily chosen to also be
represented on the graph as a basis of comparison. Only three papers are shown rather than all
fourteen to reduce the number of data points and make the trends easier to study. The three toilet
papers are represented by dotted lines, while the three starches and the kieselguhr are represented
by solid lines.
Figure 28: The turbidity of three toilet papes and other solids at various concentrations.
As the concentration of each substance increases, the turbidity is also expected to increase because
the water should be cloudier. The toilet papers, potato starch, and corn starch all follow this trend,
but the kieselguhr and rice starch do not. It can be noted that the turbidity of rice starch decreases
as the concentration increases from two to three g/L, and there is a similar phenomenon for the
kieselguhr between one and two g/L. This suggests that there is an additional factor affecting the
measurements because the results do not make physical sense.
0
200
400
600
800
1000
1200
1400
1600
1 1.5 2 2.5 3
Turb
idit
y
Concentration (g/L)
Turbidity at Various Concentrations
Corn Starch
Kieselguhr
Potato Starch
Rice Starch
Lotus Moltonel
Solo Douceur
ENSIC

Page 40 of 70
It can also be noted that the amount by which the turbidity changes between concentrations varies
greatly for each substance. A potential explanation for this observation is that the transmetteur
registers the turbidity differently for particles of different shapes and sizes.
It can be seen on the graph that the three toilet papers, represented by dotted lines, are closer to
each other than to the other solids on the graph. This could mean that the transmetteur registers the
toilet paper fibers in a different way than it registers other particles.
A possible explanation for the sharp changes between some of the concentrations, as well as the
fact that two data points show a decreased turbidity with increased concentration, is that particles
could be sticking to the sensor. If a particle sticks to the sensor or blocks it in some way, then the
transmitteur will not be able to accurately meaure the turbidity of the solution.
In the future it recommended that more experimentation to be done to further examine the
magnitude of these effects on the turbidity readings. A deeper understanding would allow for
alterations to be made to the testing method so that more accurate data could be collected and
conclusions could be drawn on the effect of turbidty on toilet paper disintegration time.
Page 41 of 70
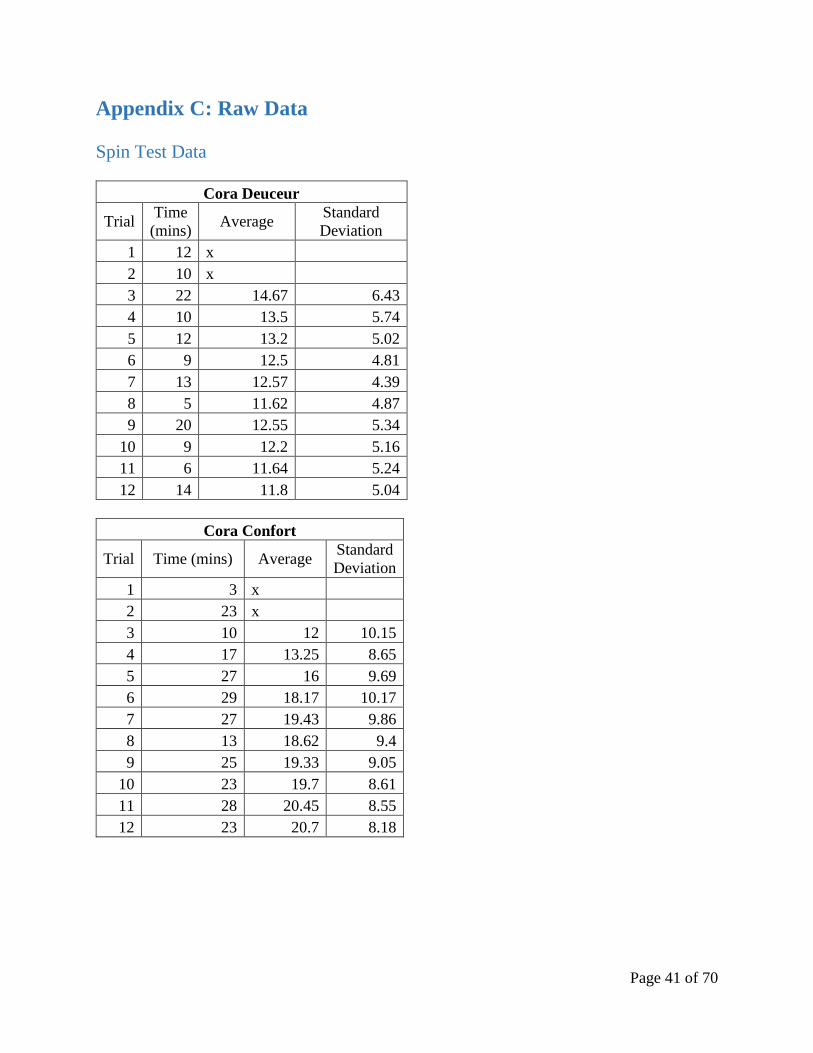
Appendix C: Raw Data
Spin Test Data
Cora Deuceur
Trial Time
(mins) Average
Standard
Deviation
1 12 x
2 10 x
3 22 14.67 6.43
4 10 13.5 5.74
5 12 13.2 5.02
6 9 12.5 4.81
7 13 12.57 4.39
8 5 11.62 4.87
9 20 12.55 5.34
10 9 12.2 5.16
11 6 11.64 5.24
12 14 11.8 5.04
Cora Confort
Trial Time (mins) Average Standard
Deviation
1 3 x
2 23 x
3 10 12 10.15
4 17 13.25 8.65
5 27 16 9.69
6 29 18.17 10.17
7 27 19.43 9.86
8 13 18.62 9.4
9 25 19.33 9.05
10 23 19.7 8.61
11 28 20.45 8.55
12 23 20.7 8.18
Page 42 of 70
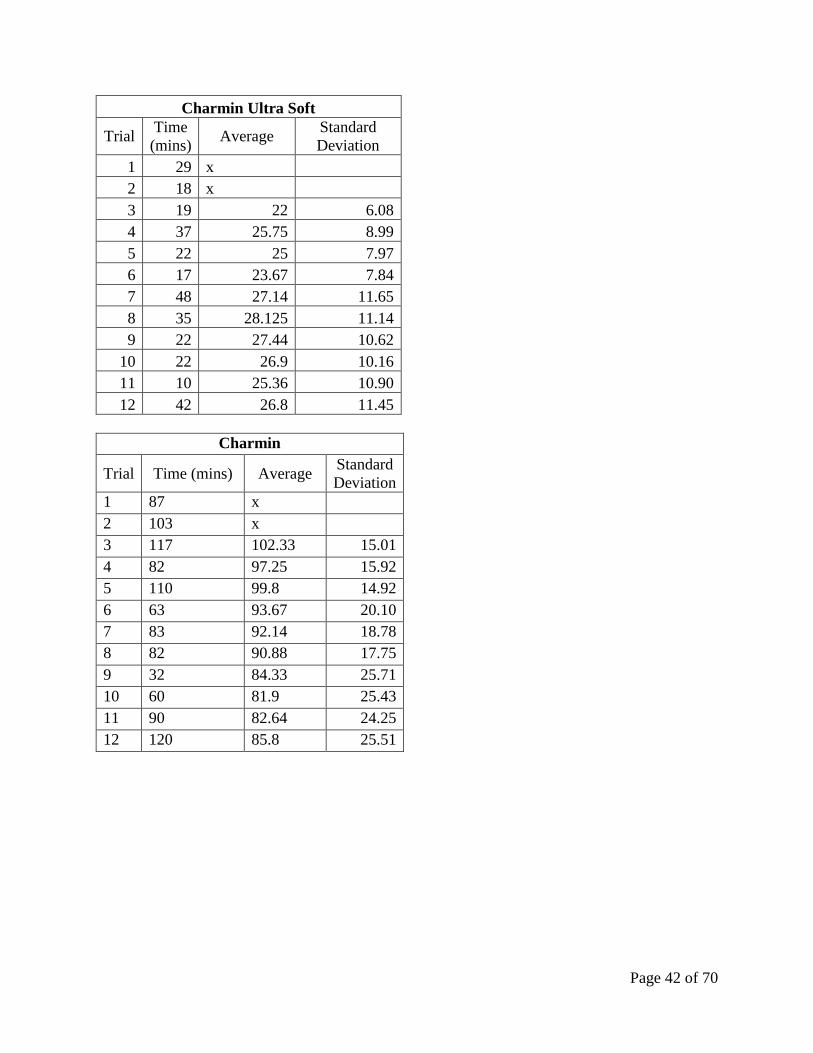
Charmin Ultra Soft
Trial Time
(mins) Average
Standard
Deviation
1 29 x
2 18 x
3 19 22 6.08
4 37 25.75 8.99
5 22 25 7.97
6 17 23.67 7.84
7 48 27.14 11.65
8 35 28.125 11.14
9 22 27.44 10.62
10 22 26.9 10.16
11 10 25.36 10.90
12 42 26.8 11.45
Charmin
Trial Time (mins) Average Standard
Deviation
1 87 x
2 103 x
3 117 102.33 15.01
4 82 97.25 15.92
5 110 99.8 14.92
6 63 93.67 20.10
7 83 92.14 18.78
8 82 90.88 17.75
9 32 84.33 25.71
10 60 81.9 25.43
11 90 82.64 24.25
12 120 85.8 25.51

Page 43 of 70
Floralys ER
Trial Time (mins) Average Standard
Deviation
1 3 x
2 5 x
3 29 12.33 14.47
4 9 11.5 11.93
5 5 10.2 10.73
6 43 15.67 16.48
7 26 17.14 15.54
8 9 16.12 14.67
9 10 15.44 13.87
10 180 31.9 53.66
11 30 31.73 50.91
12 58 33.9 49.12
Floralys ED
Trial Time (mins) Average Standard
Deviation
1 104 x
2 98 x
3 106 102.67 4.16
4 96 101 4.76
5 135 107.8 15.75
6 61 100 23.74
7 168 109.71 33.62
8 182 118.75 40.27
9 204 128.2 47.19
Page 44 of 70
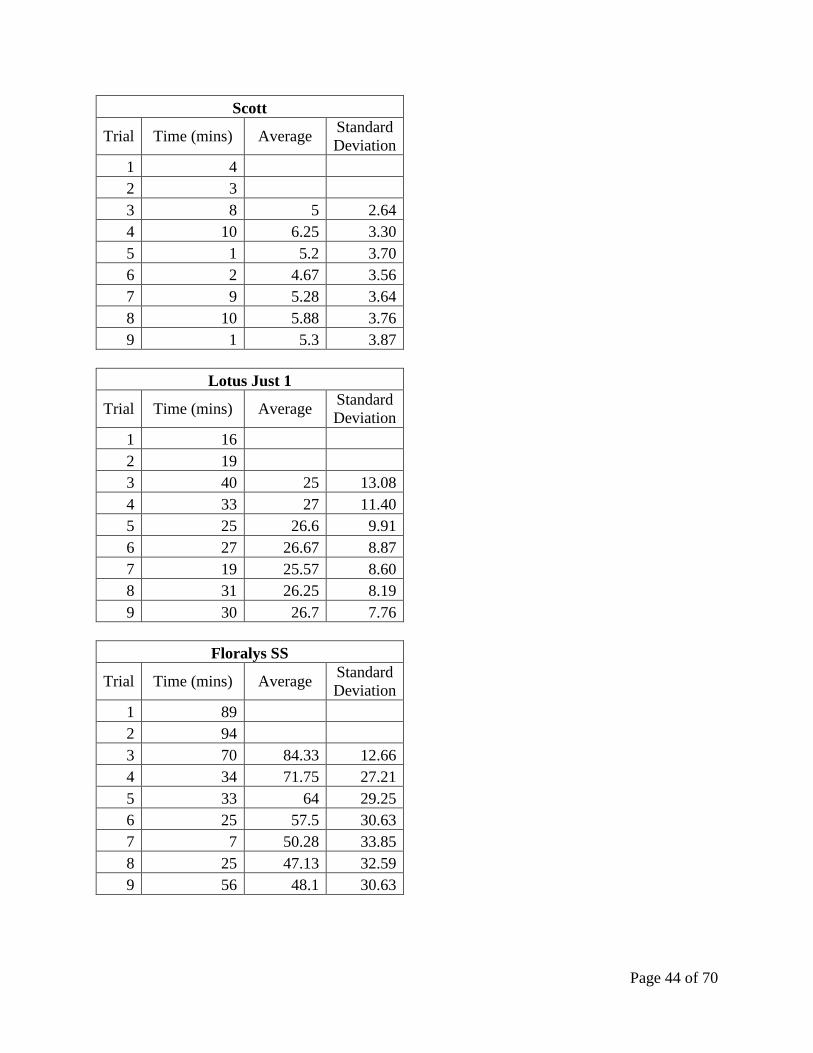
Scott
Trial Time (mins) Average Standard
Deviation
1 4
2 3
3 8 5 2.64
4 10 6.25 3.30
5 1 5.2 3.70
6 2 4.67 3.56
7 9 5.28 3.64
8 10 5.88 3.76
9 1 5.3 3.87
Lotus Just 1
Trial Time (mins) Average Standard
Deviation
1 16
2 19
3 40 25 13.08
4 33 27 11.40
5 25 26.6 9.91
6 27 26.67 8.87
7 19 25.57 8.60
8 31 26.25 8.19
9 30 26.7 7.76
Floralys SS
Trial Time (mins) Average Standard
Deviation
1 89
2 94
3 70 84.33 12.66
4 34 71.75 27.21
5 33 64 29.25
6 25 57.5 30.63
7 7 50.28 33.85
8 25 47.13 32.59
9 56 48.1 30.63
Page 45 of 70
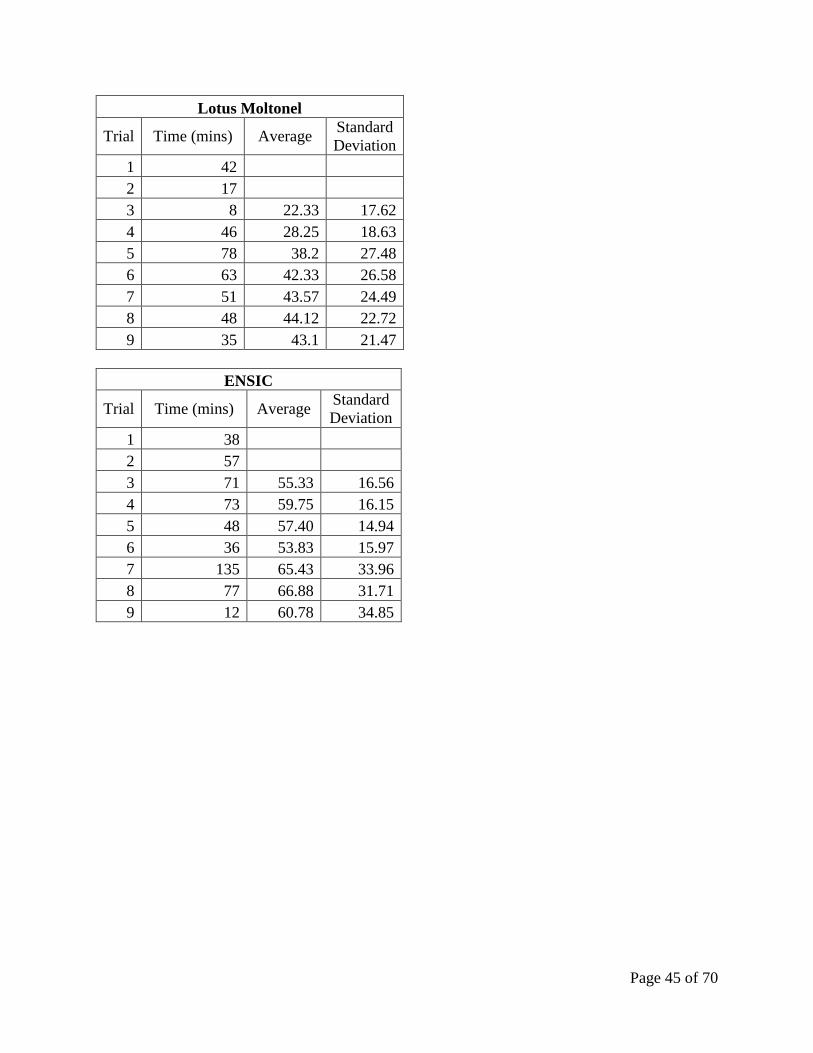
ENSIC
Trial Time (mins) Average Standard
Deviation
1 38
2 57
3 71 55.33 16.56
4 73 59.75 16.15
5 48 57.40 14.94
6 36 53.83 15.97
7 135 65.43 33.96
8 77 66.88 31.71
9 12 60.78 34.85
Lotus Moltonel
Trial Time (mins) Average Standard
Deviation
1 42
2 17
3 8 22.33 17.62
4 46 28.25 18.63
5 78 38.2 27.48
6 63 42.33 26.58
7 51 43.57 24.49
8 48 44.12 22.72
9 35 43.1 21.47

Page 46 of 70
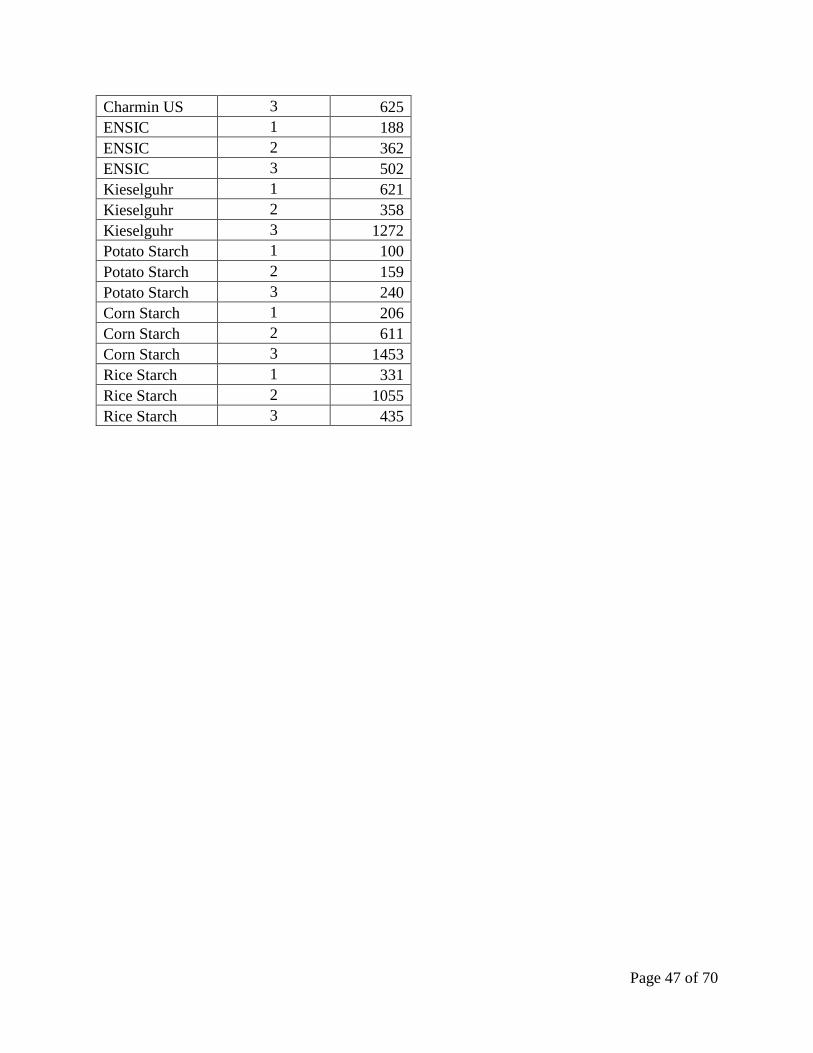
Turbidity Test Data
Brand Concentration
(g/L) Turbidity
Lotus Moltonel 1 171
Lotus Moltonel 2 387
Lotus Moltonel 3 600
Cora Confort 1 179
Cora Confort 2 338
Cora Confort 3 272
Floraly's ER 1 130
Floraly's ER 2 425
Floraly's ER 3 593
Winny 1 101
Winny 2 230
Winny 3 495
Lotus Just 1 1 95
Lotus Just 1 2 245
Lotus Just 1 3 850
Floraly’s SS 1 92
Floraly’s SS 2 213
Floraly’s SS 3 250
Cora Douceur 1 191
Cora Douceur 2 261
Cora Douceur 3 650
Floraly’s ED 1 99
Floraly’s ED 2 335
Floraly’s ED 3 620
Solo Douceur 1 122
Solo Douceur 2 202
Solo Douceur 3 576
Scott 1 74
Scott 2 135
Scott 3 168
Goddard 1 270
Goddard 2 230
Goddard 3 762
Charmin 1 107
Charmin 2 321
Charmin 3 405
Charmin US 1 171
Charmin US 2 296
Page 47 of 70
Charmin US 3 625
ENSIC 1 188
ENSIC 2 362
ENSIC 3 502
Kieselguhr 1 621
Kieselguhr 2 358
Kieselguhr 3 1272
Potato Starch 1 100
Potato Starch 2 159
Potato Starch 3 240
Corn Starch 1 206
Corn Starch 2 611
Corn Starch 3 1453
Rice Starch 1 331
Rice Starch 2 1055
Rice Starch 3 435

Page 48 of 70
Fiber Density Test Data
Charmin
# Threshold # of Blue Pixels %
Light
1 64 99839 6.92
2 67 112502 7.79
3 69 95285 6.60
4 67 110114 7.63
5 65 69053 4.78
6 68 114497 7.93
7 66 84865 5.88
8 70 76868 5.33
9 68 61687 4.27
10 57 68617 4.75
11 71 58661 4.06
12 65 72017 4.99
13 69 59904 4.15
14 70 14651 1.01
15 71 109729 7.60
16 62 68720 4.76
17 60 119052 8.25
18 70 84286 5.84
19 64 100523 6.96
20 66 80847 5.60
Average Light % 5.76

Page 49 of 70
Charmin Ultra Soft
# Threshold # of Blue Pixels %
Light
1 65 48571 3.36
2 68 64109 4.44
3 69 43167 2.99
4 78 38958 2.70
5 66 48868 3.39
6 69 31853 2.21
7 78 31780 2.20
8 67 43210 2.99
9 75 43183 2.99
10 86 29673 2.06
11 66 42698 2.96
12 65 49265 3.41
13 72 44819 3.10
14 73 39631 2.75
15 57 53260 3.69
16 70 66771 4.63
17 70 57878 4.01
18 66 595474 41.25
19 68 46842 3.24
20 71 46219 3.20
Average 5.08

Page 50 of 70
Cora Douceur
# Threshold # of Blue Pixels %
Light
1 72 19975 1.38
2 78 16928 1.17
3 75 22852 1.58
4 69 20957 1.45
5 68 18291 1.27
6 71 23037 1.60
7 76 18471 1.28
8 68 20571 1.43
9 81 22850 1.58
10 81 16637 1.15
11 78 17396 1.21
12 76 16379 1.13
13 72 19850 1.38
14 72 23082 1.60
15 80 16768 1.16
16 76 20908 1.45
17 79 17393 1.20
18 64 10345 0.72
19 75 18889 1.31
20 74 19266 1.33
Average 1.32

Page 51 of 70
Cora Confort
# Threshold # of Blue Pixels %
Light
1 61 50209 3.48
2 70 50687 3.51
3 69 56963 3.95
4 68 69076 4.79
5 69 57595 3.99
6 69 51142 3.54
7 66 46716 3.24
8 75 45536 3.15
9 84 38596 2.67
10 62 61340 4.25
11 67 62505 4.33
12 66 63208 4.38
13 56 46781 3.24
14 70 66938 4.64
15 65 55290 3.83
16 0.00
17 64 47753 3.31
18 61 30503 2.11
19 69 49799 3.45
20 65 79195 5.49
Average 3.57
Page 52 of 70
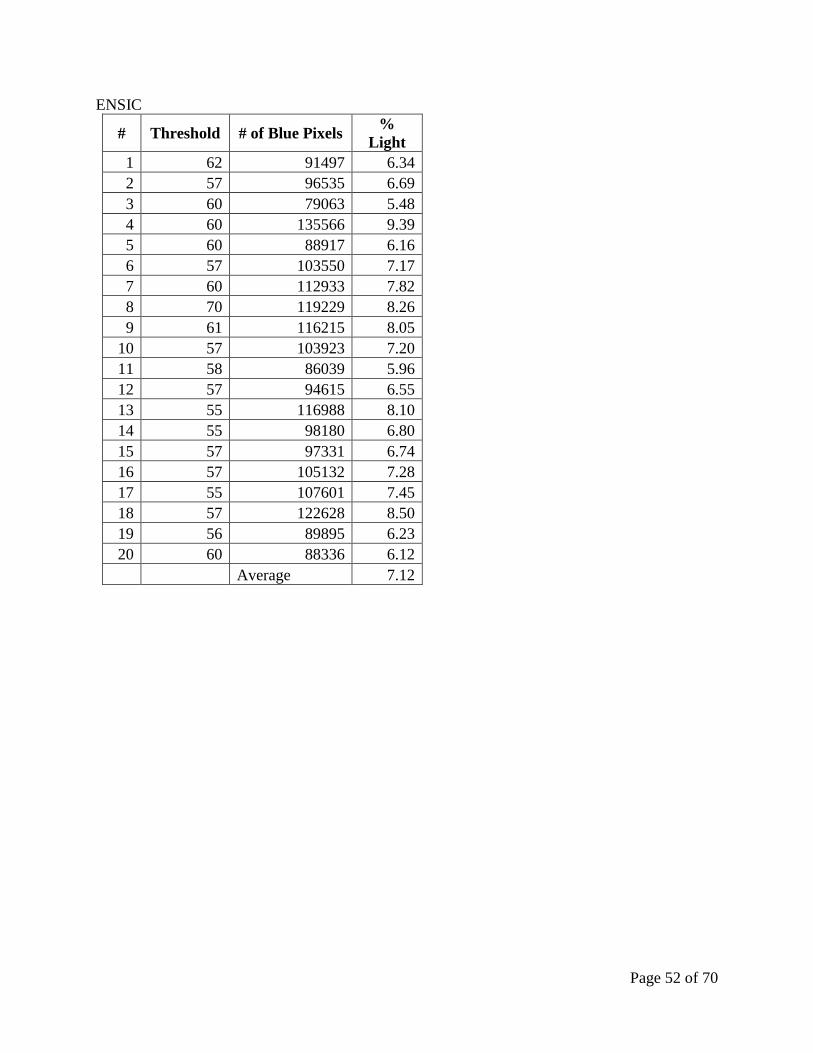
ENSIC
# Threshold # of Blue Pixels %
Light
1 62 91497 6.34
2 57 96535 6.69
3 60 79063 5.48
4 60 135566 9.39
5 60 88917 6.16
6 57 103550 7.17
7 60 112933 7.82
8 70 119229 8.26
9 61 116215 8.05
10 57 103923 7.20
11 58 86039 5.96
12 57 94615 6.55
13 55 116988 8.10
14 55 98180 6.80
15 57 97331 6.74
16 57 105132 7.28
17 55 107601 7.45
18 57 122628 8.50
19 56 89895 6.23
20 60 88336 6.12
Average 7.12
Page 53 of 70
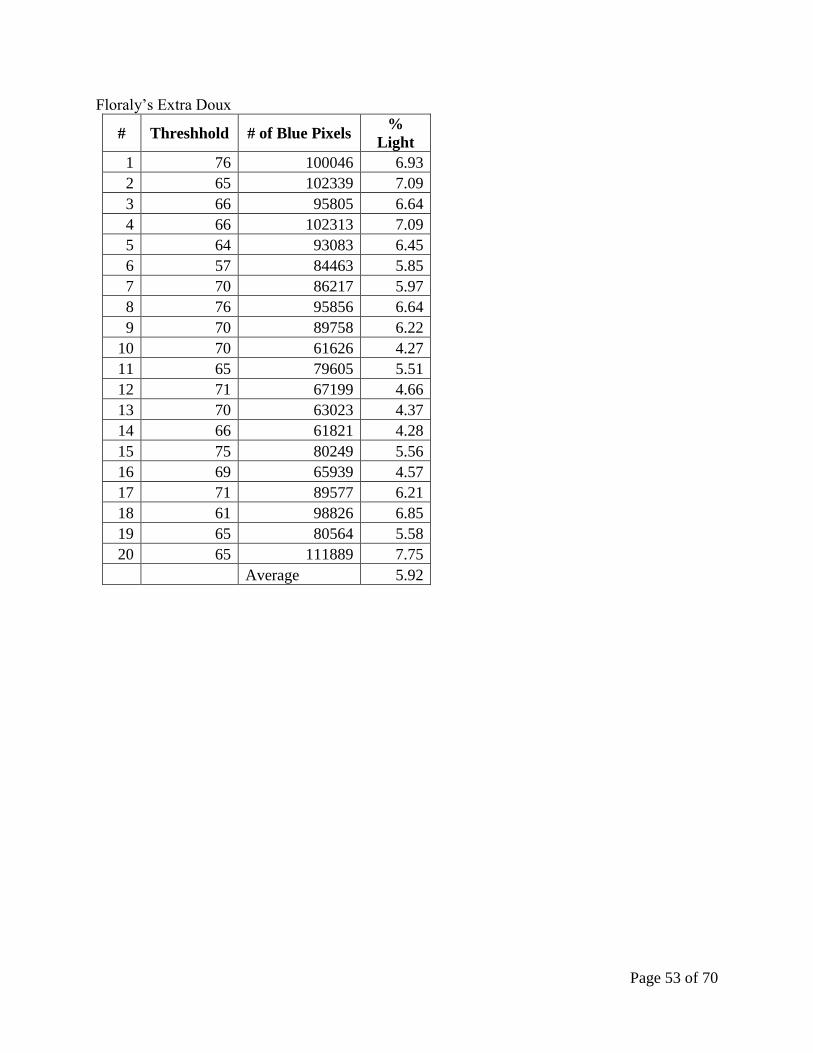
Floraly’s Extra Doux
# Threshhold # of Blue Pixels %
Light
1 76 100046 6.93
2 65 102339 7.09
3 66 95805 6.64
4 66 102313 7.09
5 64 93083 6.45
6 57 84463 5.85
7 70 86217 5.97
8 76 95856 6.64
9 70 89758 6.22
10 70 61626 4.27
11 65 79605 5.51
12 71 67199 4.66
13 70 63023 4.37
14 66 61821 4.28
15 75 80249 5.56
16 69 65939 4.57
17 71 89577 6.21
18 61 98826 6.85
19 65 80564 5.58
20 65 111889 7.75
Average 5.92
Page 54 of 70
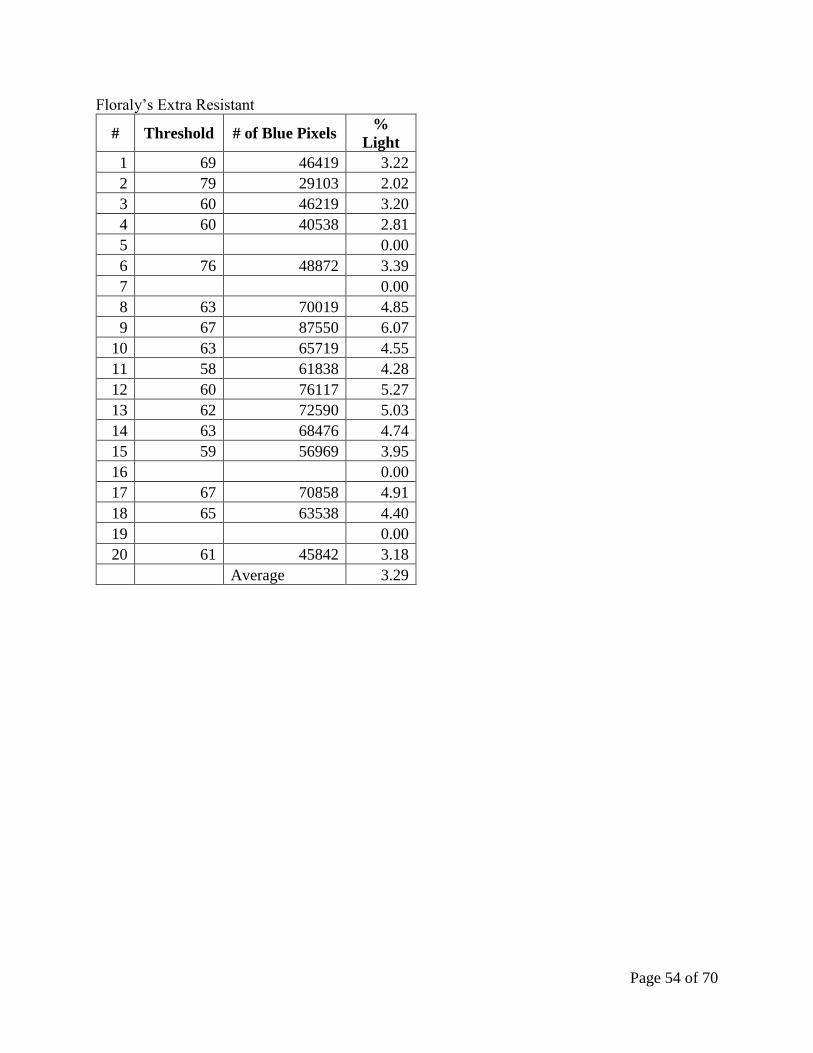
Floraly’s Extra Resistant
# Threshold # of Blue Pixels %
Light
1 69 46419 3.22
2 79 29103 2.02
3 60 46219 3.20
4 60 40538 2.81
5 0.00
6 76 48872 3.39
7 0.00
8 63 70019 4.85
9 67 87550 6.07
10 63 65719 4.55
11 58 61838 4.28
12 60 76117 5.27
13 62 72590 5.03
14 63 68476 4.74
15 59 56969 3.95
16 0.00
17 67 70858 4.91
18 65 63538 4.40
19 0.00
20 61 45842 3.18
Average 3.29

Page 55 of 70
Floraly’s Super Soft
# Threshold # of Blue Pixels %
Light
1 70 42814 2.97
2 68 33483 2.32
3 70 29236 2.03
4 69 38223 2.65
5 70 42827 2.97
6 67 52251 3.62
7 66 32993 2.29
8 67 39007 2.70
9 67 36586 2.53
10 65 44192 3.06
11 68 57741 4.00
12 69 47700 3.30
13 64 31228 2.16
14 67 36031 2.50
15 69 37933 2.63
16 68 46408 3.21
17 65 36061 2.50
18 70 34963 2.42
19 70 44334 3.07
20 67 34524 2.39
Average 2.77

Page 56 of 70
Goddard
# Threshold # of Blue Pixels %
Light
1 57 63497 4.40
2 67 61937 4.29
3 53 77030 5.34
4 68 58358 4.04
5 56 90703 6.28
6 67 56051 3.88
7 56 77239 5.35
8 54 108341 7.51
9 62 71817 4.98
10 65 86532 5.99
11 67 94755 6.56
12 64 57413 3.98
13 54 92725 6.42
14 57 71611 4.96
15 61 71583 4.96
16 55 79515 5.51
17 65 72405 5.02
18 67 61249 4.24
19 58 75245 5.21
20 58 70696 4.90
Average 5.19

Page 57 of 70
Lotus Just 1
# Threshold # of Blue Pixels %
Light
1 73 97239 6.74
2 71 80273 5.56
3 65 59570 4.13
4 64 72822 5.04
5 66 62381 4.32
6 72 82470 5.71
7 67 68380 4.74
8 71 66850 4.63
9 67 54953 3.81
10 66 70628 4.89
11 75 82660 5.73
12 68 80443 5.57
13 62 76678 5.31
14 63 75289 5.22
15 68 58520 4.05
16 76 36126 2.50
17 76 43642 3.02
18 69 66691 4.62
19 66 44996 3.12
20 64 72143 5.00
Average 4.69

Page 58 of 70
Lotus Moltonel
# Threshold # of Blue Pixels %
Light
1 60 85904 5.95
2 61 90519 6.27
3 68 78706 5.45
4 0.00
5 72 103854 7.19
6 63 87052 6.03
7 61 66489 4.61
8 68 126513 8.76
9 0.00
10 0.00
11 0.00
12 60 82351 5.70
13 66 57409 3.98
14 61 84891 5.88
15 65 72125 5.00
16 66 80881 5.60
17 63 85985 5.96
18 64 81486 5.64
19 65 76884 5.33
20 68 96477 6.68
Average 4.70
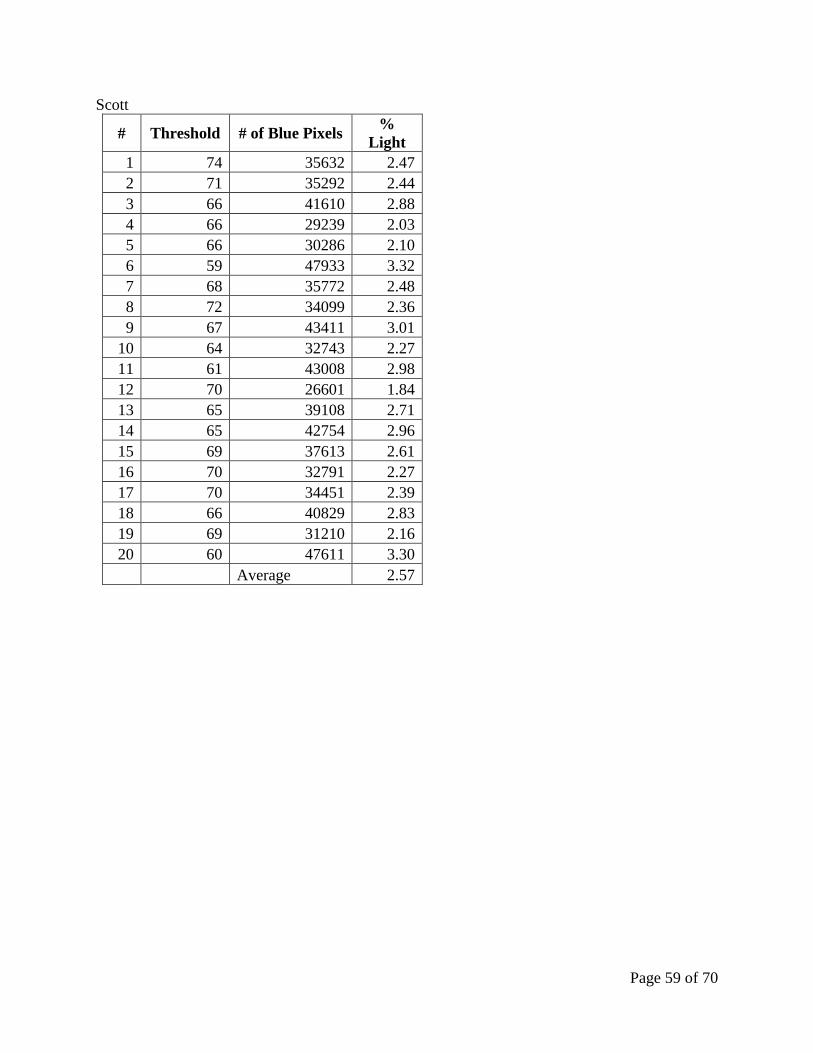
Page 59 of 70
Scott
# Threshold # of Blue Pixels %
Light
1 74 35632 2.47
2 71 35292 2.44
3 66 41610 2.88
4 66 29239 2.03
5 66 30286 2.10
6 59 47933 3.32
7 68 35772 2.48
8 72 34099 2.36
9 67 43411 3.01
10 64 32743 2.27
11 61 43008 2.98
12 70 26601 1.84
13 65 39108 2.71
14 65 42754 2.96
15 69 37613 2.61
16 70 32791 2.27
17 70 34451 2.39
18 66 40829 2.83
19 69 31210 2.16
20 60 47611 3.30
Average 2.57

Page 60 of 70
Solo Douceur
# Threshold # of Blue Pixels %
Light
1 75 87812 6.08
2 62 116842 8.09
3 59 93809 6.50
4 70 78892 5.47
5 67 76828 5.32
6 66 67276 4.66
7 64 81058 5.62
8 68 69667 4.83
9 57 78527 5.44
10 0.00
11 62 92708 6.42
12 58 71130 4.93
13 62 75225 5.21
14 60 76944 5.33
15 60 85922 5.95
16 65 67983 4.71
17 68 83732 5.80
18 0.00
19 59 82030 5.68
20 61 86251 5.98
Average 5.10

Page 61 of 70
Winny
# Threshold # of Blue Pixels %
Light
1 68 83511 5.79
2 69 66177 4.58
3 71 74369 5.15
4 66 72398 5.02
5 65 70101 4.86
6 64 59235 4.10
7 66 88274 6.12
8 61 84555 5.86
9 66 78199 5.42
10 72 69506 4.82
11 69 79922 5.54
12 66 83913 5.81
13 64 85765 5.94
14 67 60543 4.19
15 70 90442 6.27
16 67 85807 5.94
17 72 89595 6.21
18 68 72207 5.00
19 65 80414 5.57
20 66 67649 4.69
Average 5.34

Page 62 of 70
SEM Data
Charmin
No_Img Mean_Variation
1 13.77
2 9.49
3 11.09
4 10.71
5 9.20
6 7.34
7 6.75
8 6.67
9 7.10
10 6.86
11 6.41
12 5.88
13 6.58
14 6.47
15 6.11
Average 8.03
St. Dev. 2.31
Charmin Ultra Soft
No_Img Mean_Variation
1 4.98
2 5.48
3 5.30
4 4.87
5 5.14
6 4.73
7 4.22
8 4.27
9 3.01
10 2.19
11 2.66
12 2.47
13 2.01
14 2.08
15 2.25
16 2.16
17 2.59
18 2.44
19 2.30
20 2.32
Average 3.38
St. Dev. 1.30
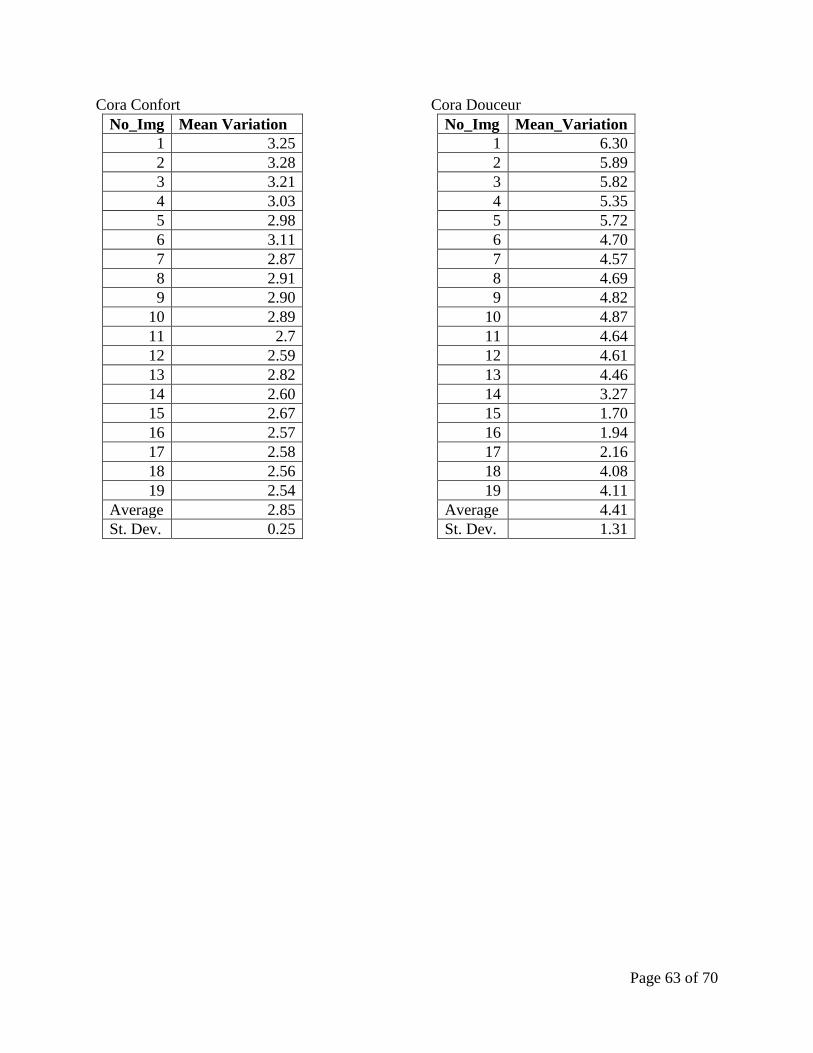
Page 63 of 70
Cora Confort
No_Img Mean Variation
1 3.25
2 3.28
3 3.21
4 3.03
5 2.98
6 3.11
7 2.87
8 2.91
9 2.90
10 2.89
11 2.7
12 2.59
13 2.82
14 2.60
15 2.67
16 2.57
17 2.58
18 2.56
19 2.54
Average 2.85
St. Dev. 0.25
Cora Douceur
No_Img Mean_Variation
1 6.30
2 5.89
3 5.82
4 5.35
5 5.72
6 4.70
7 4.57
8 4.69
9 4.82
10 4.87
11 4.64
12 4.61
13 4.46
14 3.27
15 1.70
16 1.94
17 2.16
18 4.08
19 4.11
Average 4.41
St. Dev. 1.31

Page 64 of 70
ENSIC
No_Img Mean_Variation
1 2.00
2 3.62
3 3.67
4 3.91
5 3.77
6 3.73
7 3.86
8 4.44
9 4.43
10 4.29
11 3.96
12 3.98
13 4.19
14 4.10
15 4.25
16 4.70
17 4.36
18 4.63
19 3.65
20 3.81
21 3.41
Average 3.94
St. Dev. 0.57
Floraly’s Extra Doux
No_Img Mean_Variation
1 7.19
2 6.93
3 6.31
4 6.43
5 5.54
6 5.53
7 5.68
8 5.65
9 4.59
10 4.49
11 5.03
12 3.81
13 2.92
14 3.38
15 4.52
16 4.82
Average 5.18
St. Dev. 1.22
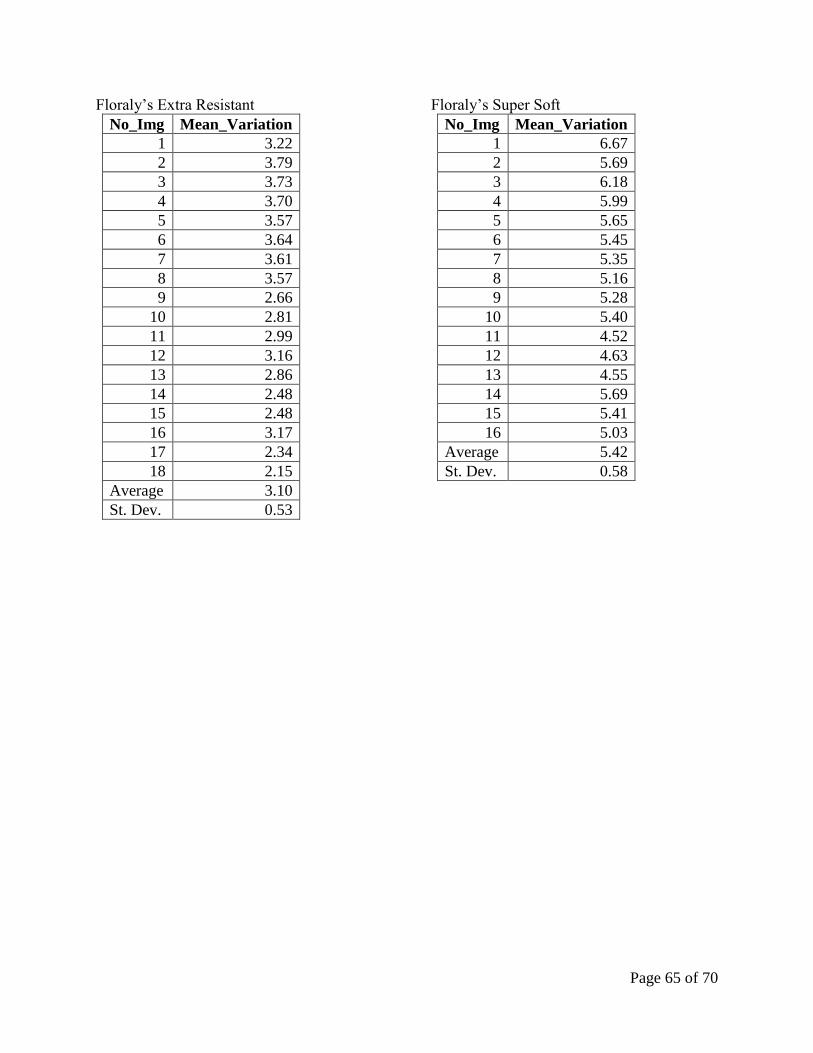
Page 65 of 70
Floraly’s Extra Resistant
No_Img Mean_Variation
1 3.22
2 3.79
3 3.73
4 3.70
5 3.57
6 3.64
7 3.61
8 3.57
9 2.66
10 2.81
11 2.99
12 3.16
13 2.86
14 2.48
15 2.48
16 3.17
17 2.34
18 2.15
Average 3.10
St. Dev. 0.53
Floraly’s Super Soft
No_Img Mean_Variation
1 6.67
2 5.69
3 6.18
4 5.99
5 5.65
6 5.45
7 5.35
8 5.16
9 5.28
10 5.40
11 4.52
12 4.63
13 4.55
14 5.69
15 5.41
16 5.03
Average 5.42
St. Dev. 0.58
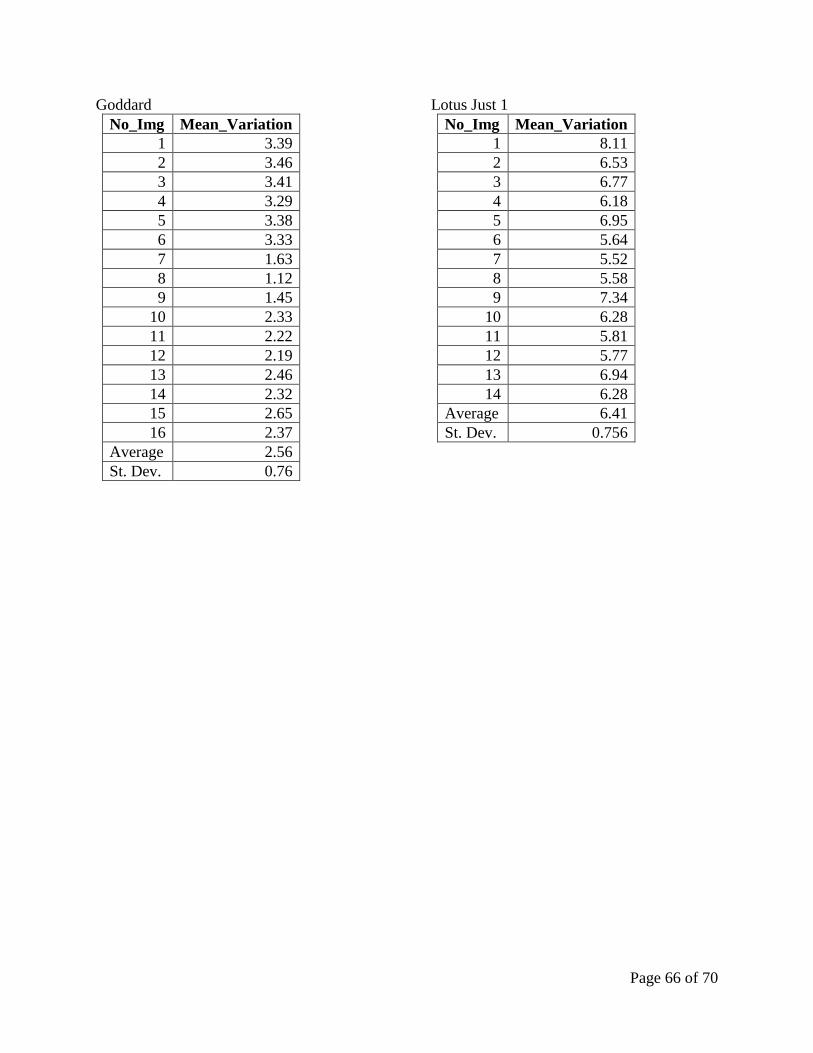
Page 66 of 70
Goddard
No_Img Mean_Variation
1 3.39
2 3.46
3 3.41
4 3.29
5 3.38
6 3.33
7 1.63
8 1.12
9 1.45
10 2.33
11 2.22
12 2.19
13 2.46
14 2.32
15 2.65
16 2.37
Average 2.56
St. Dev. 0.76
Lotus Just 1
No_Img Mean_Variation
1 8.11
2 6.53
3 6.77
4 6.18
5 6.95
6 5.64
7 5.52
8 5.58
9 7.34
10 6.28
11 5.81
12 5.77
13 6.94
14 6.28
Average 6.41
St. Dev. 0.756
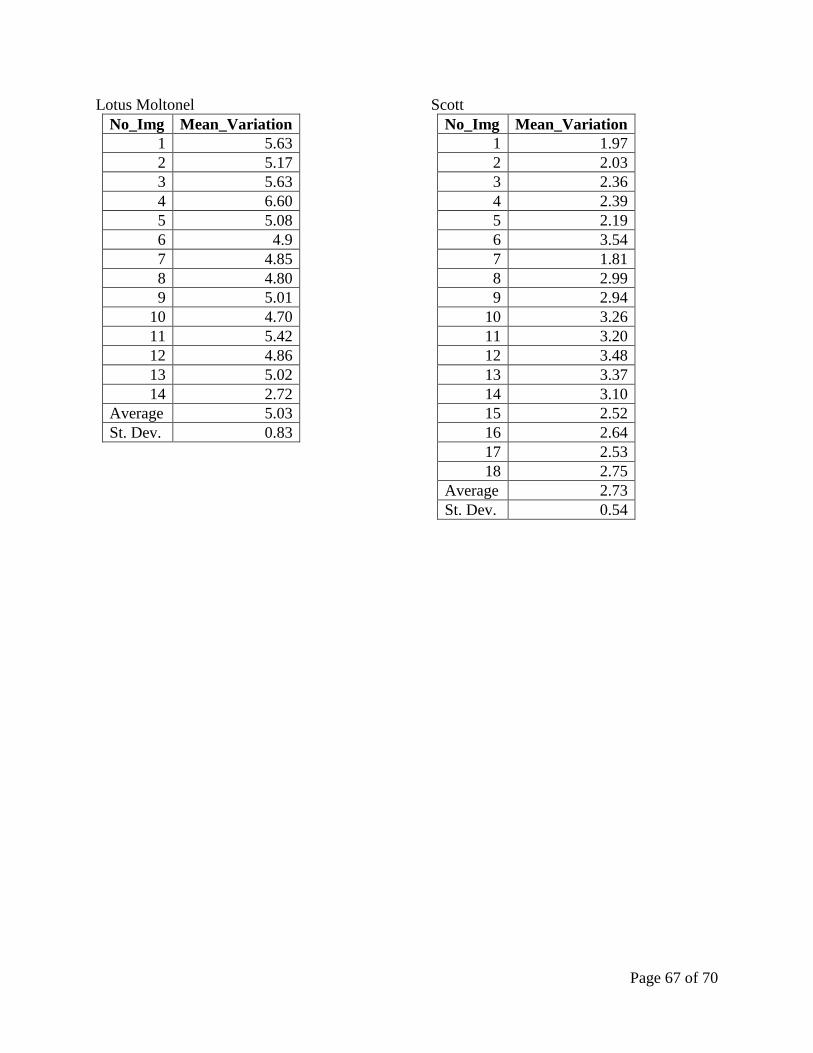
Page 67 of 70
Lotus Moltonel
No_Img Mean_Variation
1 5.63
2 5.17
3 5.63
4 6.60
5 5.08
6 4.9
7 4.85
8 4.80
9 5.01
10 4.70
11 5.42
12 4.86
13 5.02
14 2.72
Average 5.03
St. Dev. 0.83
Scott
No_Img Mean_Variation
1 1.97
2 2.03
3 2.36
4 2.39
5 2.19
6 3.54
7 1.81
8 2.99
9 2.94
10 3.26
11 3.20
12 3.48
13 3.37
14 3.10
15 2.52
16 2.64
17 2.53
18 2.75
Average 2.73
St. Dev. 0.54
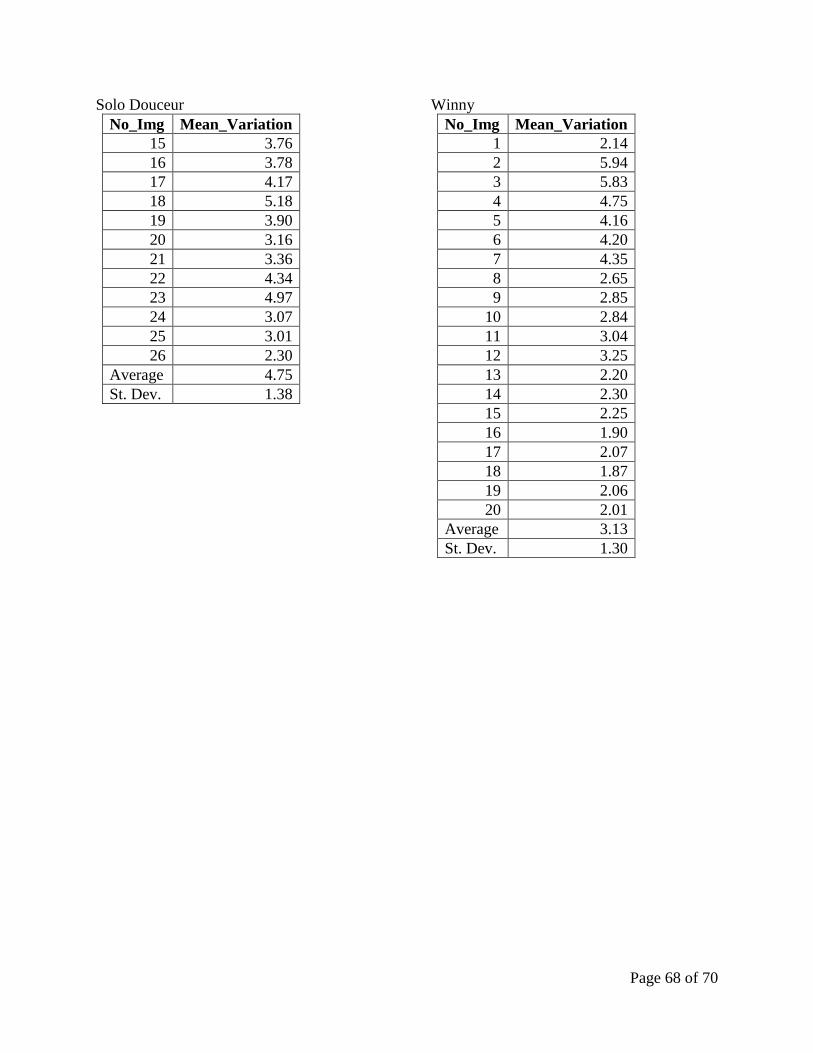
Page 68 of 70
Solo Douceur
No_Img Mean_Variation
15 3.76
16 3.78
17 4.17
18 5.18
19 3.90
20 3.16
21 3.36
22 4.34
23 4.97
24 3.07
25 3.01
26 2.30
Average 4.75
St. Dev. 1.38
Winny
No_Img Mean_Variation
1 2.14
2 5.94
3 5.83
4 4.75
5 4.16
6 4.20
7 4.35
8 2.65
9 2.85
10 2.84
11 3.04
12 3.25
13 2.20
14 2.30
15 2.25
16 1.90
17 2.07
18 1.87
19 2.06
20 2.01
Average 3.13
St. Dev. 1.30

Page 69 of 70
Aqua Tube ™
No_Img Mean_Variation
1 3.09
2 3.11
3 3.35
4 3.91
5 4.21
6 3.52
7 3.28
8 3.41
9 3.11
10 3.54
11 3.12
12 3.20
13 3.38
14 3.66
15 3.63
16 3.80
17 3.54
18 3.58
19 3.07
Average 3.45
St. Dev. 0.312