physical vapour deposition techniques for producing ...cdn.intechweb.org/pdfs/26355.pdf · 13...
TRANSCRIPT
13
Physical Vapour Deposition Techniques for Producing Advanced Organic Chemical Sensors
Michele Tonezzer1,2 and Gianluigi Maggioni3 1Università di Trento, Dip. Ingegneria dei Materiali e delle Tecnologie Industriali,
2Laboratori Nazionali di Legnaro - Istituto Nazionale di Fisica Nucleare, 3Università di Padova, Dip. Fisica at LNL - Istituto Nazionale di Fisica Nucleare,
Italy
1. Introduction
In the organic chemical sensors field, the main focus to date has been on the molecular design of the receptor as a function of the analyte to be detected. Nevertheless chemical sensing requires an integrated approach, where both the molecular and the material properties of the sensing layer must be finely tuned to achieve the desired properties. Despite its great influence on the ultimate performances of the sensors, the material side has been largely neglected.
In this respect, chemical sensing of gases and vapours performed via thin solid films represents a particular challenge, as the desired recognition events need to operate at the gas-solid interface. Taking into account that the analyte recognition is mediated by the layer properties of the coated receptors, precise control and accurate characterization of these properties (e.g., thickness, permeability, and morphology) are critical for developing advanced sensing materials.
In this chapter, a description of several different real cases is carried out by the authors to highlight the significant advantages introduced into the sensing field by a bottom-up approach in which molecules purposely developed for detecting a specific analyte are deposited in well-controlled and designed architectures. The production methods, the properties and the sensing capabilities of novel advanced organic sensing materials grown by Physical Vapour Deposition (PVD) techniques are described and compared to the conventional ones. In particular the results concerning organic sensors developed with two main deposition techniques will be detailed and discussed, namely:
- Glow-Discharge-induced Sublimation (GDS), a novel patented plasma-based deposition technique recently developed at the Materials & Detectors Laboratory of INFN National Laboratories of Legnaro (Padua), which has demonstrated to produce extremely competitive, thin sensing organic films;
- High Vacuum Evaporation (VE), a more standard technique rarely used in the production of organic films despite the very interesting results obtained in producing organic and metallo-organic sensing elements.
Specific cases related to the improvement of the sensing capabilities of different conventional organic sensors by using these two techniques are displayed. In particular the
www.intechopen.com
Advances in Chemical Sensors 280
chapter describes the production, the physical and chemical characterization and the sensing capabilities (by different transducing methods) of novel sensing materials based on three classes of macromolecular compounds: phthalocyanines, porphyrins and cavitands. Following the specific cases for each molecular class are reported:
• Phtahlocyanines. The physical and chemical features of copper (CuPc) and zinc (ZnPc) phthalocyanines thin solid films produced by GDS technique are reported. Their sensing capabilities towards several analytes (NO, NO2 and ethanol) are analysed by means of electrical and optical transducing methods.
• Porphyrins. Different porphyrin compounds have been deposited by VE and GDS and their physical properties and sensing capabilities are reported and discussed. As regards VE technique, three porphyrin compounds have been deposited: free- (H2TPP), cobalt- (CoTPP), and iron chloride- (Fe(TPP)Cl) 5,10,15,20 meso-tetraphenyl porphyrins. The chemical and morphological properties of VE samples have been analyzed by FT-IR and SEM images and their optical sensing capabilities towards different alcohol vapours (methanol, ethanol and iso-propanol) have been measured. As regards GDS technique, CoTPP and Fe(TPP)Cl samples have been produced and physically characterized. Moreover their optical responses towards ethanol vapours are discussed on the basis of their physical properties.
• Cavitands. VE deposition technique has been used for growing a novel supramolecular mass sensing film based on an ultimate insoluble receptor specifically designed for detecting short chain alcohols: the tetraphosphonate Tiiii [H, CH3, Ph] cavitand. Non-specific tetrathiophosphonate TSiiii [H, CH3, Ph] cavitand layers have been also deposited for comparison. The properties of deposited films were investigated by FT-IR analysis and their sensing capabilities were investigated by exposing Tiiii- and TSiiii-coated quartz crystal microbalances (QCMs) to ethanol in very low concentrations. Elovich kinetics were also used to analyze the sorption process occurring onto the different samples.
In order to underline the role of the molecular architectures on the final sensing capabilities of the samples, the sensing responses are explained on the basis of their physical properties. Moreover the authors, in order to point out the role of the deposition techniques on the final sensing capabilities of the new developed samples, compare in several cases their sesing performances with those of analogous samples produced by conventional methods.
2. Experimental
2.1 Film deposition
The organic chemical sensors were produced by Glow-Discharge-induced Sublimation (GDS), High Vacuum Evaporation (VE) and Spin Coating (SPIN).
2.1.1 Glow-Discharge-induced Sublimation (GDS)
The experimental setup used for the deposition of GDS films consists of a vacuum chamber evacuated by a turbomolecular pump to a base pressure of 10-4 Pa. The glow discharge is sustained by a 1-in. cylindrical magnetron sputtering source connected to a radio frequency power generator (600 W, 13.56 MHz) through a matching box. The organic powder is put on the surface of an aluminum target, placed on the sputtering source. The glow discharge feed gas is argon or helium (99.9999%), whose pressure inside the chamber is measured through a capacitance gauge. Typical values of rf power, target dc self-bias and working pressure are
www.intechopen.com
Physical Vapour Deposition Techniques for Producing Advanced Organic Chemical Sensors 281
10 to 40W, −20 to −500V and 5.00±0.05 Pa (Ar) and 20.0±0.1 Pa (He), respectively. A water cooled quartz crystal thickness sensor, placed close to the sample holder 7 cm above the source, has been used for measuring in real time the deposition rate of the organic layer.
2.1.2 High Vacuum Evaporation (VE)
The apparatus used for the evaporation of the organic films consisted of a stainless steel vacuum chamber equipped with a turbomolecular pump capable of base pressure of 10-4 Pa (Maggioni et al., 1997). The sample holder is a copper circular plate with a central aperture where a quartz crystal thickness sensor is located. The heater units are three copper crucibles: each of them is equipped with a thermocouple and a heating resistance so that temperatures up to 500°C can be reached and maintained within ±1°C. During the deposition the substrates were kept at room temperature.
2.1.3 Spin coating (SPIN)
Thin porphyrin films were produced by spin coating technique. Porphyrin solutions (0.1 wt.% of porphyrin powder in chloroform) were spun at 800 rpm for 30 s.
2.2 Physical and chemical characterization
The physical and chemical features of the samples were analyzed by Scanning Electron Microscopy (SEM), Atomic Force Microscopy (AFM), Infrared analysis (FT-IR), and UV-visible analysis (UV-Vis).
2.2.1 Scanning Electron Microscopy (SEM)
The surface morphology of the samples was investigated with a Philips XL-30 scanning electron microscope (SEM) at a working pressure of 10-3 Pa. SEM was also used for measuring the thickness of GDS samples through cross-section pictures.
2.2.2 Atomic Force Microscopy (AFM)
The surface morphology of the organic samples was investigated in air by a non-contact-mode atomic force microscope (AFM) model C-21 (Danish Micro Engineering), mounting a DualScope Probe Scanner 95-50. AFM measurements were also utilized to investigate the thickness of the samples by scratching a small area of the samples and acquiring an image of the borderline between the exposed substrate and the pristine film. The observations were performed with a Si3N4 pyramidal tip with a curvature radius lower than 50 nm.
2.2.3 Infrared analysis (FT-IR)
FT-IR spectra of the samples were recorded in the 4000-400 cm-1 range using a Jasco FT-IR 660 Plus spectrometer with a resolution of 16 cm-1. The sample cell and the interferometer were evacuated to remove the adsorption peaks of water and atmospheric gases.
2.2.4 UV-Visible spectroscopy (UV-Vis)
A Jasco V-570 dual-beam spectrophotometer was used to perform the UV-visible absorption measurements in the 200-800 nm range, with a resolution of 2 nm.
www.intechopen.com
Advances in Chemical Sensors 282
2.3 Sensing properties
The sensing capabilities of the different sensing thin films were analysed by Electrical, Optical and Piezo-electrical (QCM) transducing methods.
2.3.1 Electrical sensors
The electrical responses were measured on samples grown onto two interdigitated combs of 1301 gold electrodes (650 + 651) deposited on 30mm×30mm×1mm silica slides (Maggioni et al., 2008). The experimental setup used to evaluate the gas-sensing capabilities of the films is equipped with two mass flow controllers (MFCs): the former allows to control the flow rate of analytes and the latter, which controls the flow rate of pure nitrogen, is used to suitably dilute the gas mixture to the desired composition. After heating the samples up to 150 ◦C under a nitrogen flow, the electrical current at fixed voltage (1 V) was measured every 6 s after setting the flow of both controllers at the desired values. For all the measurements reported the total flow was 1000 sccm. The gas mixtures in the cylinders used for the measurements were N2 +NO2 (0.98±0.05) ppm and N2 +NO (98±3) ppm.
2.3.2 Optical sensors
The analysis chamber for the optical measurements of the CuPc samples to ethanol was the same used for the electrical measurements (Maggioni et al., 2008). The changes of reflectance upon ethanol vapour exposure was measured in the wavelength range 250-800 nm.
FT-IR response of the CuPc films was measured using a N2+NO2 500 ppm mixture. After the evacuation of the sample cell, the spectra were collected before gas admittance, after 10 min of gas exposure (105 Pa total pressure) and then after 15 h of cell evacuation.
The optical sensing performances of the porphyrin samples were measured in a purpose-built testing apparatus in which the sample chamber is placed inside a Jasco V-570 Spectrophotometer. The sample chamber is connected to two MFCs: the former (AERA FC-7800CD) allows to control the flow rate of the analyte mixture and the latter (AERA FC-7700CD) controls the flow rate of pure nitrogen. This apparatus allows to record both the whole 200-800 nm spectra and dynamic behaviours at fixed absorption wavelengths in different vapour concentration atmospheres.
2.3.3 Mass sensors (QCM)
Sensing measurements were performed using AT-cut quartzes with a fundamental frequency of 10 MHz and a crystal diameter of 8 mm. QCM sensors are mass transducers where the frequency of oscillation, for small increases of mass, linearly changes according to the Sauerbrey equation
Δf = k Δmq
where the Δf is the frequency variation and Δm the increase in mass. The quartz constant is experimentally estimated to be kq=-0.46 Hz ng-1. This value provides a nominal mass resolution of 1.6 ng Hz-1, considering a minimum reliable frequency measurement of 1 Hz. To control the amount of the deposited films, QCM frequency was monitored during the deposition process: a total frequency variation of Δf=-20 ± 0.5 kHz was obtained for all samples produced.
www.intechopen.com
Physical Vapour Deposition Techniques for Producing Advanced Organic Chemical Sensors 283
The measurement system (Gaslab 20.1; IFAK, Magdeburg) is equipped with a flow chamber, containing four coated quartz crystals, a reference quartz crystal and a thermocouple. The chamber was thermostatted at 20 ± 0.1 °C. The QCM chamber is connected with two mass-flow controllers (Brooks 5850S) for controlling the flow rate of analyte mixture and pure nitrogen, respectively. During the analyses QCM frequency was measured versus time every 1 s. The ethanol vapour and NO gas were supplied by SAPIO Srl in gas cylinders with a certified concentration of 504 ppm and 150 ppm, respectively.
3. Phthalocyanines
Despite the prolonged studies and applications of metal phthalocyanines (MPcs) during the last forty years, the scientific research on these organic semiconductors is still vivid owing to their unique properties, such as thermal stability, chemical inertness, and biocompatibility. MPcs are thus interesting for several applications, including chemical sensing, photoconducting agents, photovoltaic cell elements, nonlinear optics, and electrocatalysis. In the gas sensing field, MPcs are mainly used as electrical gas sensors, because of the conductivity changes induced by the adsorption of oxidizing or reducing gases such as NOx, halogens, and ammonia (Snow & Barger, 1989). More recently, MPcs have also been successfully tested as opto-sensing materials for the detection of volatile organic compounds (VOCs) (Spadavecchia et al., 2006).
The classical deposition methods of thin organic films such as spin coating, dip coating and
the sol-gel method cannot be easily applied to the production of MPc coatings owing to the
low solubility of these compounds in organic solvents. The most widely used deposition
method for MPcs is then become the high vacuum evaporation (VE), which allows to avoid
the drawbacks of the derivatization of MPcs aimed at improving their solubility. Plasma-
based deposition methods have been also reported to succeed in depositing MPc films for
gas sensing applications: plasma polymerized CuPc was deposited on piezoelectric quartz
crystals (Kurosawa et al., 1990) and plasma was also used for the activation of CuPc
molecules during the evaporation process (Choi et al., 1996).
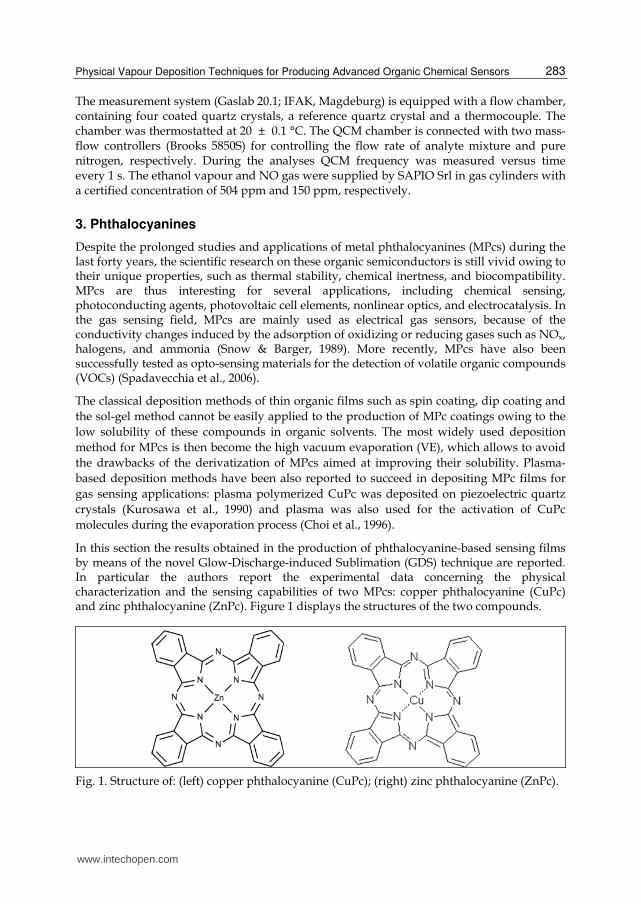
In this section the results obtained in the production of phthalocyanine-based sensing films by means of the novel Glow-Discharge-induced Sublimation (GDS) technique are reported. In particular the authors report the experimental data concerning the physical characterization and the sensing capabilities of two MPcs: copper phthalocyanine (CuPc) and zinc phthalocyanine (ZnPc). Figure 1 displays the structures of the two compounds.
Fig. 1. Structure of: (left) copper phthalocyanine (CuPc); (right) zinc phthalocyanine (ZnPc).
www.intechopen.com
Advances in Chemical Sensors 284
3.1 Copper phthalocyanine (CuPc) deposited by GDS technique
3.1.1 Physical and chemical properties
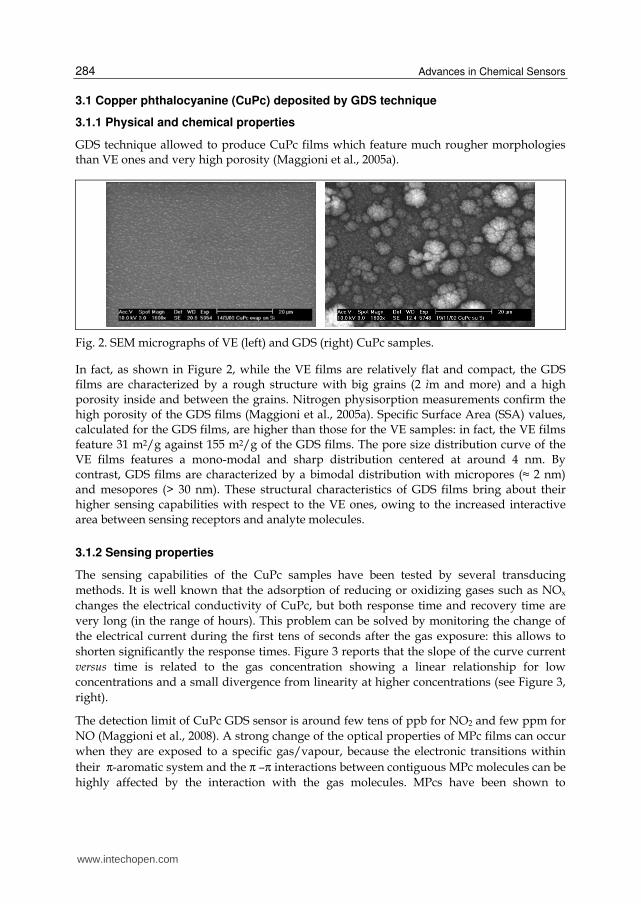
GDS technique allowed to produce CuPc films which feature much rougher morphologies than VE ones and very high porosity (Maggioni et al., 2005a).
Fig. 2. SEM micrographs of VE (left) and GDS (right) CuPc samples.
In fact, as shown in Figure 2, while the VE films are relatively flat and compact, the GDS films are characterized by a rough structure with big grains (2 ìm and more) and a high porosity inside and between the grains. Nitrogen physisorption measurements confirm the high porosity of the GDS films (Maggioni et al., 2005a). Specific Surface Area (SSA) values, calculated for the GDS films, are higher than those for the VE samples: in fact, the VE films feature 31 m2/g against 155 m2/g of the GDS films. The pore size distribution curve of the VE films features a mono-modal and sharp distribution centered at around 4 nm. By contrast, GDS films are characterized by a bimodal distribution with micropores (≈ 2 nm) and mesopores (> 30 nm). These structural characteristics of GDS films bring about their higher sensing capabilities with respect to the VE ones, owing to the increased interactive area between sensing receptors and analyte molecules.
3.1.2 Sensing properties
The sensing capabilities of the CuPc samples have been tested by several transducing
methods. It is well known that the adsorption of reducing or oxidizing gases such as NOx
changes the electrical conductivity of CuPc, but both response time and recovery time are
very long (in the range of hours). This problem can be solved by monitoring the change of
the electrical current during the first tens of seconds after the gas exposure: this allows to
shorten significantly the response times. Figure 3 reports that the slope of the curve current
versus time is related to the gas concentration showing a linear relationship for low
concentrations and a small divergence from linearity at higher concentrations (see Figure 3,
right).
The detection limit of CuPc GDS sensor is around few tens of ppb for NO2 and few ppm for
NO (Maggioni et al., 2008). A strong change of the optical properties of MPc films can occur
when they are exposed to a specific gas/vapour, because the electronic transitions within
their π-aromatic system and the π –π interactions between contiguous MPc molecules can be
highly affected by the interaction with the gas molecules. MPcs have been shown to
www.intechopen.com

Physical Vapour Deposition Techniques for Producing Advanced Organic Chemical Sensors 285
optically respond to alcohol vapours (Spadavecchia et al., 2006; Maggioni et al., 2007):
Figure 4 shows the changes of optical reflectance of a CuPc sample to ethanol vapours at a
wavelength in the Q band (λ=580nm). The responses are characterized by a fast signal
increase: t50 response time (defined as the time taken for the signal intensity to reach 50% of
its final saturated value) is 7 s; moreover, when the ethanol vapour stream is switched off,
the original signal yield is almost completely recovered after few tens of seconds (t50= 12 s).
Taking into account that the measurements are performed at room temperature, this
evidence becomes particularly interesting.
Fig. 3. (left) Electrical responses of a GDS CuPc film to NO2-containing mixtures in the sub-ppm range. Fitting lines are reported for each curve. (right) Slopes of the electrical responses of a GDS CuPc film as a function of NO2 concentration.
The slope of the calibration curve of this sensor (Figure 4, right) decreases at concentrations
higher than 7000 ppm, suggesting a progressive saturation of the sites available for the
analyte molecules. As the optical signal for a concentration of 1500 ppm is about 20 and the
corresponding noise is about ±1, the detection limit for the present experimental
configuration is around 200 ppm. This limit can be easily improved by changing some
experimental parameters such as the active film surface area. In order to investigate the
adsorption processes involved in the response of the CuPc sample to ethanol, the Langmuir
isotherm model has been adopted. The linear fit of the Langmuir adsorption (Figure 4, right,
red line) was done after neglecting the three data points at the higher concentrations.
Fig. 4. (left) Optical response of CuPc sample towards different ethanol vapour
concentrations at λ=580 nm. (right) Calibration curve and Langmuir plot of CuPc sample
towards ethanol at λ=580 nm.
www.intechopen.com
Advances in Chemical Sensors 286
The linear correlation is very good at low concentrations while a strong deviation is observed at increasing concentration. The good linear correlation obtained at low concentrations shows that the Langmuir adsorption model, even with its limited assumptions, provides a basic understanding of the ethanol/CuPc interaction process.
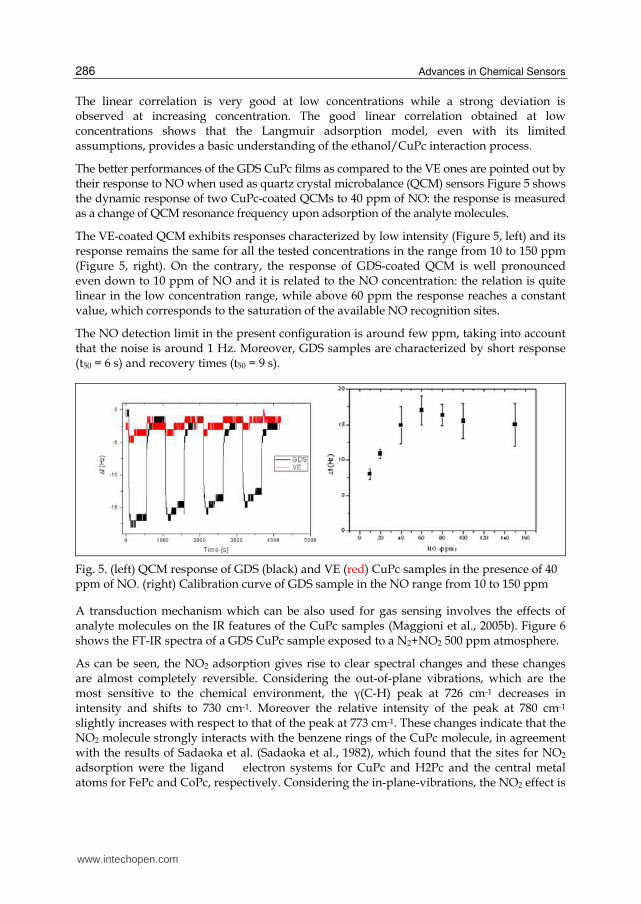
The better performances of the GDS CuPc films as compared to the VE ones are pointed out by their response to NO when used as quartz crystal microbalance (QCM) sensors Figure 5 shows the dynamic response of two CuPc-coated QCMs to 40 ppm of NO: the response is measured as a change of QCM resonance frequency upon adsorption of the analyte molecules.
The VE-coated QCM exhibits responses characterized by low intensity (Figure 5, left) and its response remains the same for all the tested concentrations in the range from 10 to 150 ppm (Figure 5, right). On the contrary, the response of GDS-coated QCM is well pronounced even down to 10 ppm of NO and it is related to the NO concentration: the relation is quite linear in the low concentration range, while above 60 ppm the response reaches a constant value, which corresponds to the saturation of the available NO recognition sites.
The NO detection limit in the present configuration is around few ppm, taking into account that the noise is around 1 Hz. Moreover, GDS samples are characterized by short response (t50 = 6 s) and recovery times (t50 = 9 s).
Fig. 5. (left) QCM response of GDS (black) and VE (red) CuPc samples in the presence of 40 ppm of NO. (right) Calibration curve of GDS sample in the NO range from 10 to 150 ppm
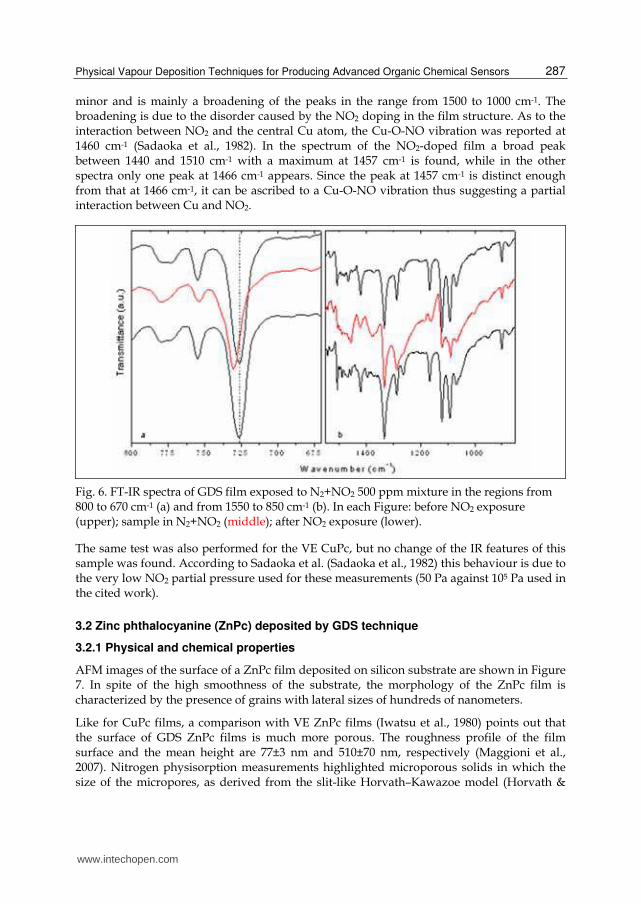
A transduction mechanism which can be also used for gas sensing involves the effects of analyte molecules on the IR features of the CuPc samples (Maggioni et al., 2005b). Figure 6 shows the FT-IR spectra of a GDS CuPc sample exposed to a N2+NO2 500 ppm atmosphere.
As can be seen, the NO2 adsorption gives rise to clear spectral changes and these changes are almost completely reversible. Considering the out-of-plane vibrations, which are the most sensitive to the chemical environment, the γ(C-H) peak at 726 cm-1 decreases in intensity and shifts to 730 cm-1. Moreover the relative intensity of the peak at 780 cm-1 slightly increases with respect to that of the peak at 773 cm-1. These changes indicate that the NO2 molecule strongly interacts with the benzene rings of the CuPc molecule, in agreement with the results of Sadaoka et al. (Sadaoka et al., 1982), which found that the sites for NO2 adsorption were the ligand � electron systems for CuPc and H2Pc and the central metal atoms for FePc and CoPc, respectively. Considering the in-plane-vibrations, the NO2 effect is
www.intechopen.com
Physical Vapour Deposition Techniques for Producing Advanced Organic Chemical Sensors 287
minor and is mainly a broadening of the peaks in the range from 1500 to 1000 cm-1. The broadening is due to the disorder caused by the NO2 doping in the film structure. As to the interaction between NO2 and the central Cu atom, the Cu-O-NO vibration was reported at 1460 cm-1 (Sadaoka et al., 1982). In the spectrum of the NO2-doped film a broad peak between 1440 and 1510 cm-1 with a maximum at 1457 cm-1 is found, while in the other spectra only one peak at 1466 cm-1 appears. Since the peak at 1457 cm-1 is distinct enough from that at 1466 cm-1, it can be ascribed to a Cu-O-NO vibration thus suggesting a partial interaction between Cu and NO2.
Fig. 6. FT-IR spectra of GDS film exposed to N2+NO2 500 ppm mixture in the regions from 800 to 670 cm-1 (a) and from 1550 to 850 cm-1 (b). In each Figure: before NO2 exposure (upper); sample in N2+NO2 (middle); after NO2 exposure (lower).
The same test was also performed for the VE CuPc, but no change of the IR features of this sample was found. According to Sadaoka et al. (Sadaoka et al., 1982) this behaviour is due to the very low NO2 partial pressure used for these measurements (50 Pa against 105 Pa used in the cited work).
3.2 Zinc phthalocyanine (ZnPc) deposited by GDS technique
3.2.1 Physical and chemical properties
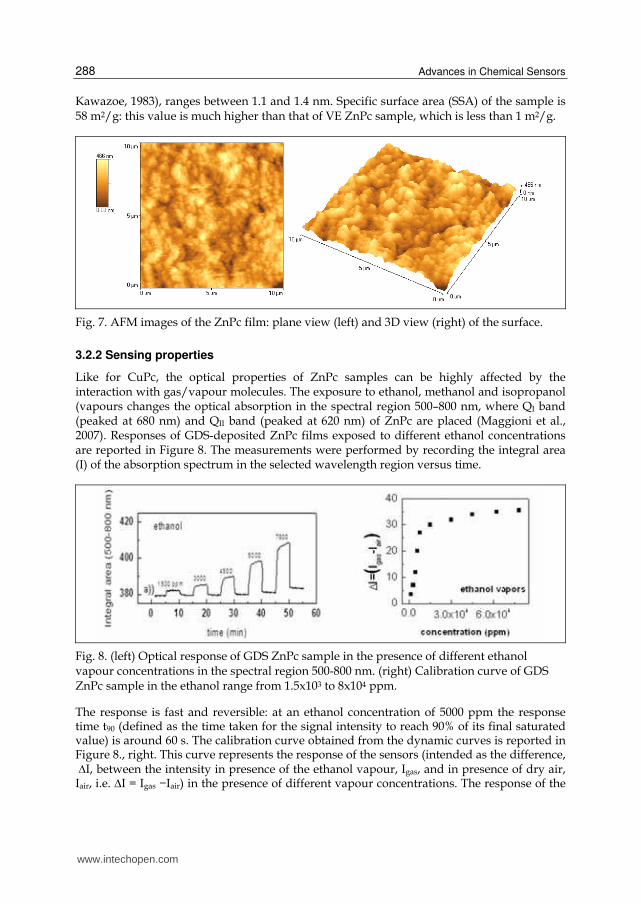
AFM images of the surface of a ZnPc film deposited on silicon substrate are shown in Figure 7. In spite of the high smoothness of the substrate, the morphology of the ZnPc film is characterized by the presence of grains with lateral sizes of hundreds of nanometers.
Like for CuPc films, a comparison with VE ZnPc films (Iwatsu et al., 1980) points out that the surface of GDS ZnPc films is much more porous. The roughness profile of the film surface and the mean height are 77±3 nm and 510±70 nm, respectively (Maggioni et al., 2007). Nitrogen physisorption measurements highlighted microporous solids in which the size of the micropores, as derived from the slit-like Horvath–Kawazoe model (Horvath &
www.intechopen.com
Advances in Chemical Sensors 288
Kawazoe, 1983), ranges between 1.1 and 1.4 nm. Specific surface area (SSA) of the sample is 58 m2/g: this value is much higher than that of VE ZnPc sample, which is less than 1 m2/g.
Fig. 7. AFM images of the ZnPc film: plane view (left) and 3D view (right) of the surface.
3.2.2 Sensing properties
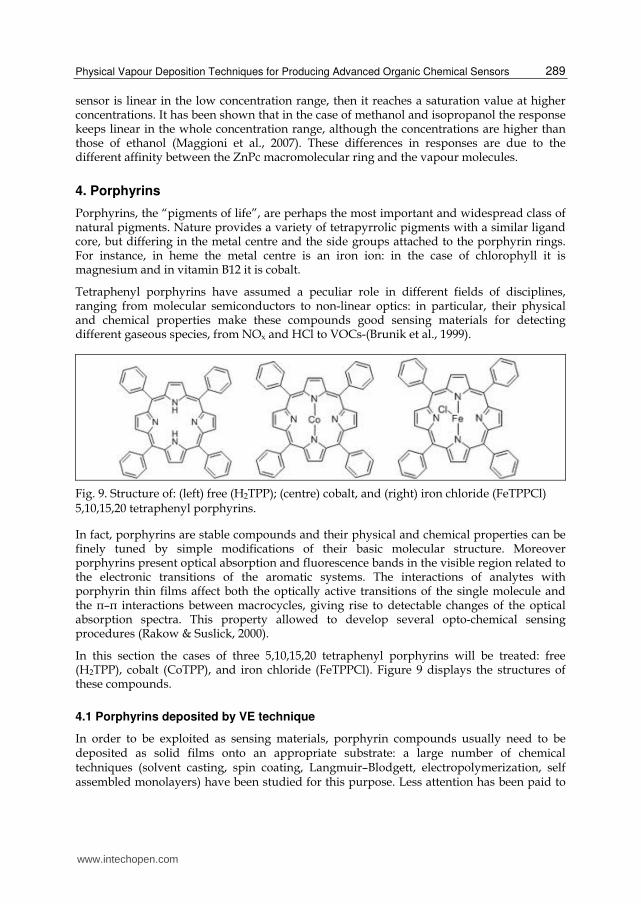
Like for CuPc, the optical properties of ZnPc samples can be highly affected by the interaction with gas/vapour molecules. The exposure to ethanol, methanol and isopropanol (vapours changes the optical absorption in the spectral region 500–800 nm, where QI band (peaked at 680 nm) and QII band (peaked at 620 nm) of ZnPc are placed (Maggioni et al., 2007). Responses of GDS-deposited ZnPc films exposed to different ethanol concentrations are reported in Figure 8. The measurements were performed by recording the integral area (I) of the absorption spectrum in the selected wavelength region versus time.
Fig. 8. (left) Optical response of GDS ZnPc sample in the presence of different ethanol vapour concentrations in the spectral region 500-800 nm. (right) Calibration curve of GDS ZnPc sample in the ethanol range from 1.5x10³ to 8x10⁴ ppm.
The response is fast and reversible: at an ethanol concentration of 5000 ppm the response time t90 (defined as the time taken for the signal intensity to reach 90% of its final saturated value) is around 60 s. The calibration curve obtained from the dynamic curves is reported in Figure 8., right. This curve represents the response of the sensors (intended as the difference, ∆I, between the intensity in presence of the ethanol vapour, Igas, and in presence of dry air, Iair, i.e. ∆I = Igas −Iair) in the presence of different vapour concentrations. The response of the
www.intechopen.com
Physical Vapour Deposition Techniques for Producing Advanced Organic Chemical Sensors 289
sensor is linear in the low concentration range, then it reaches a saturation value at higher concentrations. It has been shown that in the case of methanol and isopropanol the response keeps linear in the whole concentration range, although the concentrations are higher than those of ethanol (Maggioni et al., 2007). These differences in responses are due to the different affinity between the ZnPc macromolecular ring and the vapour molecules.
4. Porphyrins
Porphyrins, the “pigments of life”, are perhaps the most important and widespread class of natural pigments. Nature provides a variety of tetrapyrrolic pigments with a similar ligand core, but differing in the metal centre and the side groups attached to the porphyrin rings. For instance, in heme the metal centre is an iron ion: in the case of chlorophyll it is magnesium and in vitamin B12 it is cobalt.
Tetraphenyl porphyrins have assumed a peculiar role in different fields of disciplines, ranging from molecular semiconductors to non-linear optics: in particular, their physical and chemical properties make these compounds good sensing materials for detecting different gaseous species, from NOx and HCl to VOCs-(Brunik et al., 1999).
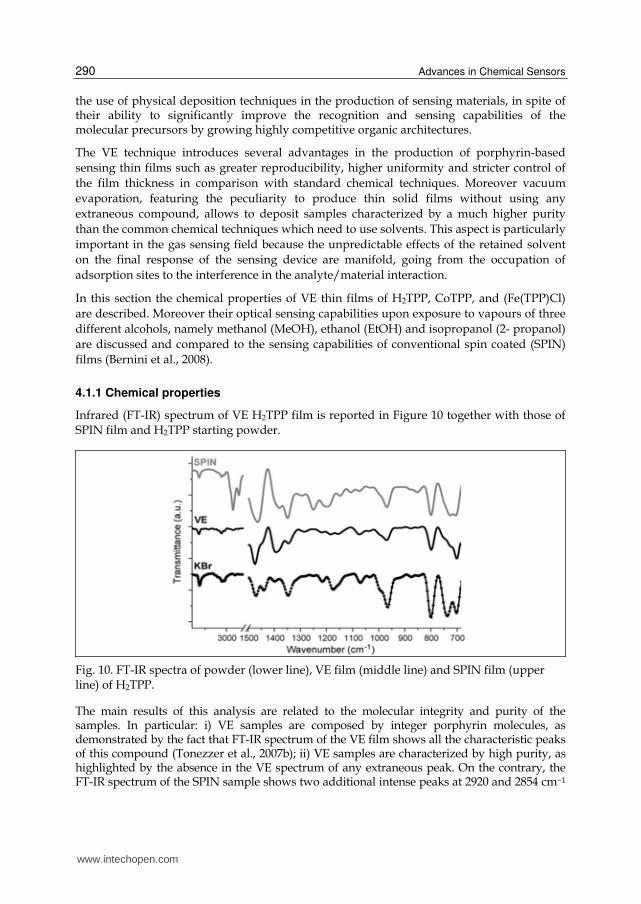
Fig. 9. Structure of: (left) free (H2TPP); (centre) cobalt, and (right) iron chloride (FeTPPCl) 5,10,15,20 tetraphenyl porphyrins.
In fact, porphyrins are stable compounds and their physical and chemical properties can be finely tuned by simple modifications of their basic molecular structure. Moreover porphyrins present optical absorption and fluorescence bands in the visible region related to the electronic transitions of the aromatic systems. The interactions of analytes with porphyrin thin films affect both the optically active transitions of the single molecule and the π–π interactions between macrocycles, giving rise to detectable changes of the optical absorption spectra. This property allowed to develop several opto-chemical sensing procedures (Rakow & Suslick, 2000).
In this section the cases of three 5,10,15,20 tetraphenyl porphyrins will be treated: free (H2TPP), cobalt (CoTPP), and iron chloride (FeTPPCl). Figure 9 displays the structures of these compounds.
4.1 Porphyrins deposited by VE technique
In order to be exploited as sensing materials, porphyrin compounds usually need to be deposited as solid films onto an appropriate substrate: a large number of chemical techniques (solvent casting, spin coating, Langmuir–Blodgett, electropolymerization, self assembled monolayers) have been studied for this purpose. Less attention has been paid to
www.intechopen.com
Advances in Chemical Sensors 290
the use of physical deposition techniques in the production of sensing materials, in spite of their ability to significantly improve the recognition and sensing capabilities of the molecular precursors by growing highly competitive organic architectures.
The VE technique introduces several advantages in the production of porphyrin-based
sensing thin films such as greater reproducibility, higher uniformity and stricter control of
the film thickness in comparison with standard chemical techniques. Moreover vacuum
evaporation, featuring the peculiarity to produce thin solid films without using any
extraneous compound, allows to deposit samples characterized by a much higher purity
than the common chemical techniques which need to use solvents. This aspect is particularly
important in the gas sensing field because the unpredictable effects of the retained solvent
on the final response of the sensing device are manifold, going from the occupation of
adsorption sites to the interference in the analyte/material interaction.
In this section the chemical properties of VE thin films of H2TPP, CoTPP, and (Fe(TPP)Cl)
are described. Moreover their optical sensing capabilities upon exposure to vapours of three
different alcohols, namely methanol (MeOH), ethanol (EtOH) and isopropanol (2- propanol)
are discussed and compared to the sensing capabilities of conventional spin coated (SPIN)
films (Bernini et al., 2008).
4.1.1 Chemical properties
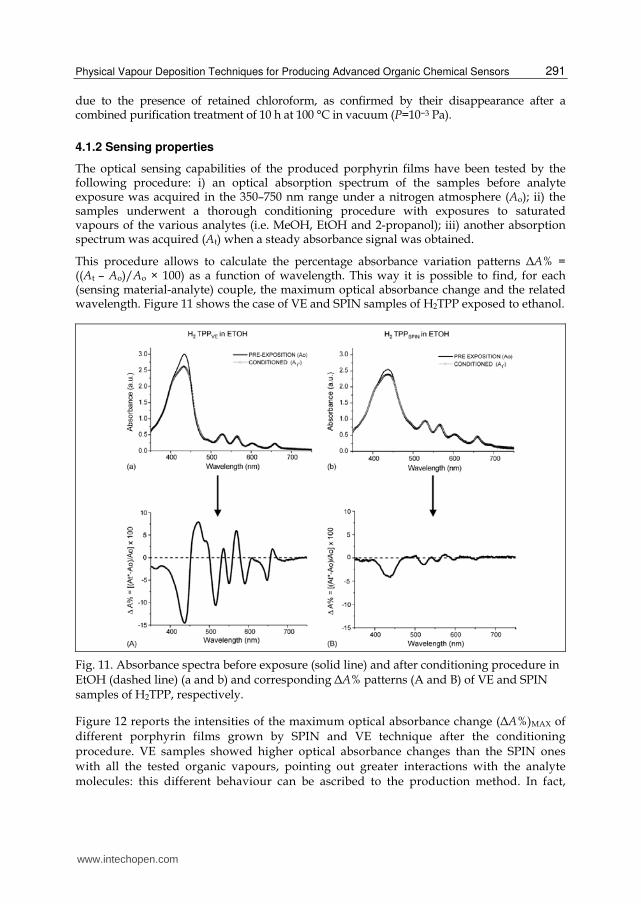
Infrared (FT-IR) spectrum of VE H2TPP film is reported in Figure 10 together with those of SPIN film and H2TPP starting powder.
Fig. 10. FT-IR spectra of powder (lower line), VE film (middle line) and SPIN film (upper line) of H2TPP.
The main results of this analysis are related to the molecular integrity and purity of the samples. In particular: i) VE samples are composed by integer porphyrin molecules, as demonstrated by the fact that FT-IR spectrum of the VE film shows all the characteristic peaks of this compound (Tonezzer et al., 2007b); ii) VE samples are characterized by high purity, as highlighted by the absence in the VE spectrum of any extraneous peak. On the contrary, the FT-IR spectrum of the SPIN sample shows two additional intense peaks at 2920 and 2854 cm−1
www.intechopen.com
Physical Vapour Deposition Techniques for Producing Advanced Organic Chemical Sensors 291
due to the presence of retained chloroform, as confirmed by their disappearance after a combined purification treatment of 10 h at 100 °C in vacuum (P=10−3 Pa).
4.1.2 Sensing properties
The optical sensing capabilities of the produced porphyrin films have been tested by the following procedure: i) an optical absorption spectrum of the samples before analyte exposure was acquired in the 350–750 nm range under a nitrogen atmosphere (Ao); ii) the samples underwent a thorough conditioning procedure with exposures to saturated vapours of the various analytes (i.e. MeOH, EtOH and 2-propanol); iii) another absorption spectrum was acquired (At) when a steady absorbance signal was obtained.
This procedure allows to calculate the percentage absorbance variation patterns ΔA% = ((At – Ao)/Ao × 100) as a function of wavelength. This way it is possible to find, for each (sensing material-analyte) couple, the maximum optical absorbance change and the related wavelength. Figure 11 shows the case of VE and SPIN samples of H2TPP exposed to ethanol.
Fig. 11. Absorbance spectra before exposure (solid line) and after conditioning procedure in EtOH (dashed line) (a and b) and corresponding ΔA% patterns (A and B) of VE and SPIN samples of H2TPP, respectively.
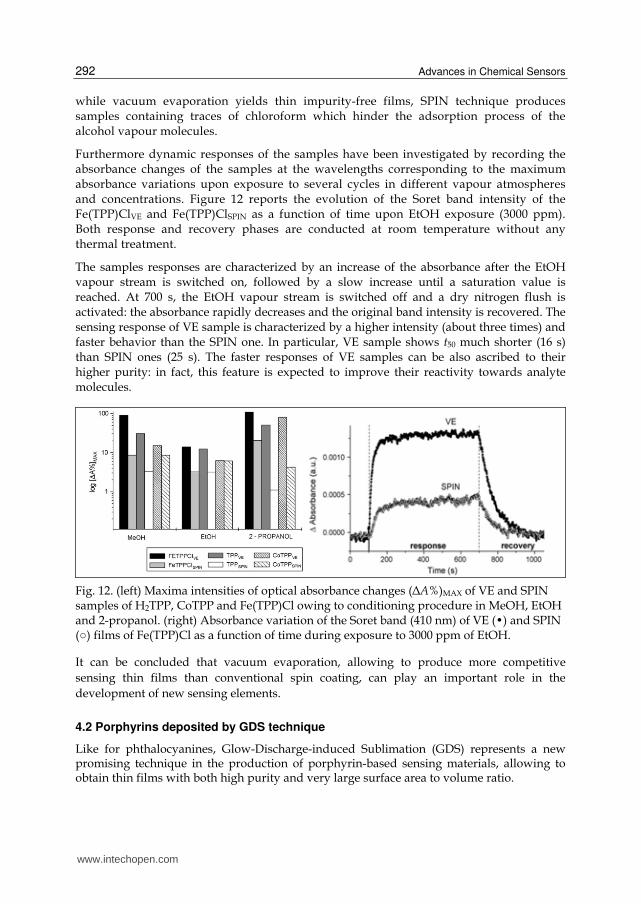
Figure 12 reports the intensities of the maximum optical absorbance change (ΔA%)MAX of different porphyrin films grown by SPIN and VE technique after the conditioning procedure. VE samples showed higher optical absorbance changes than the SPIN ones with all the tested organic vapours, pointing out greater interactions with the analyte molecules: this different behaviour can be ascribed to the production method. In fact,
www.intechopen.com
Advances in Chemical Sensors 292
while vacuum evaporation yields thin impurity-free films, SPIN technique produces samples containing traces of chloroform which hinder the adsorption process of the alcohol vapour molecules.
Furthermore dynamic responses of the samples have been investigated by recording the absorbance changes of the samples at the wavelengths corresponding to the maximum absorbance variations upon exposure to several cycles in different vapour atmospheres and concentrations. Figure 12 reports the evolution of the Soret band intensity of the Fe(TPP)ClVE and Fe(TPP)ClSPIN as a function of time upon EtOH exposure (3000 ppm). Both response and recovery phases are conducted at room temperature without any thermal treatment.
The samples responses are characterized by an increase of the absorbance after the EtOH vapour stream is switched on, followed by a slow increase until a saturation value is reached. At 700 s, the EtOH vapour stream is switched off and a dry nitrogen flush is activated: the absorbance rapidly decreases and the original band intensity is recovered. The sensing response of VE sample is characterized by a higher intensity (about three times) and faster behavior than the SPIN one. In particular, VE sample shows t50 much shorter (16 s) than SPIN ones (25 s). The faster responses of VE samples can be also ascribed to their higher purity: in fact, this feature is expected to improve their reactivity towards analyte molecules.
Fig. 12. (left) Maxima intensities of optical absorbance changes (ΔA%)MAX of VE and SPIN samples of H2TPP, CoTPP and Fe(TPP)Cl owing to conditioning procedure in MeOH, EtOH and 2-propanol. (right) Absorbance variation of the Soret band (410 nm) of VE (�) and SPIN (○) films of Fe(TPP)Cl as a function of time during exposure to 3000 ppm of EtOH.
It can be concluded that vacuum evaporation, allowing to produce more competitive
sensing thin films than conventional spin coating, can play an important role in the
development of new sensing elements.
4.2 Porphyrins deposited by GDS technique
Like for phthalocyanines, Glow-Discharge-induced Sublimation (GDS) represents a new promising technique in the production of porphyrin-based sensing materials, allowing to obtain thin films with both high purity and very large surface area to volume ratio.
www.intechopen.com
Physical Vapour Deposition Techniques for Producing Advanced Organic Chemical Sensors 293
In this section the chemical properties of GDS films of CoTPP and Fe(TPP)Cl are reported. Moreover their optical sensing capabilities upon exposure to ethanol vapours are discussed and compared to the sensing capabilities of VE and SPIN films.
4.2.1 Physical and chemical properties
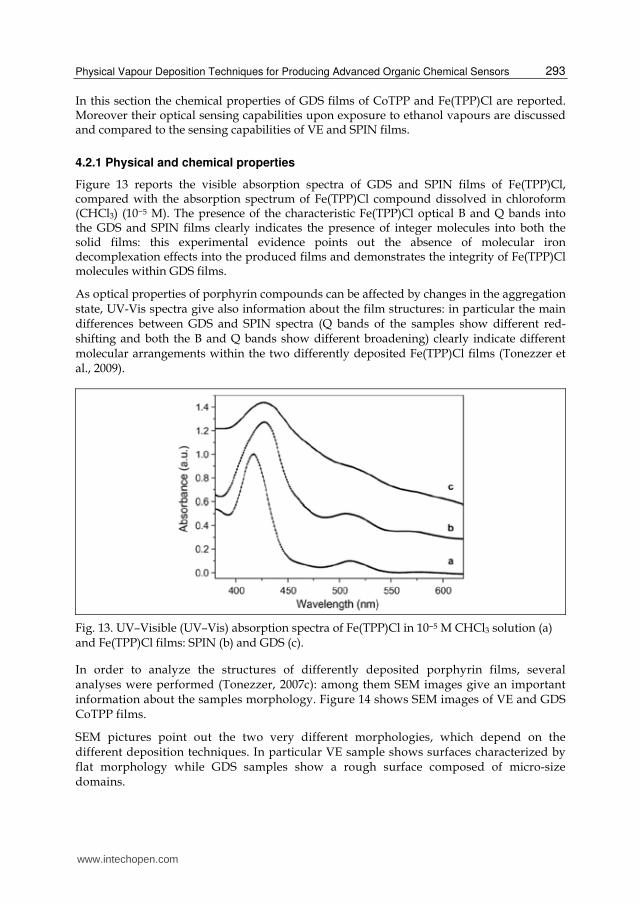
Figure 13 reports the visible absorption spectra of GDS and SPIN films of Fe(TPP)Cl, compared with the absorption spectrum of Fe(TPP)Cl compound dissolved in chloroform (CHCl3) (10−5 M). The presence of the characteristic Fe(TPP)Cl optical B and Q bands into the GDS and SPIN films clearly indicates the presence of integer molecules into both the solid films: this experimental evidence points out the absence of molecular iron decomplexation effects into the produced films and demonstrates the integrity of Fe(TPP)Cl molecules within GDS films.
As optical properties of porphyrin compounds can be affected by changes in the aggregation state, UV-Vis spectra give also information about the film structures: in particular the main differences between GDS and SPIN spectra (Q bands of the samples show different red-shifting and both the B and Q bands show different broadening) clearly indicate different molecular arrangements within the two differently deposited Fe(TPP)Cl films (Tonezzer et al., 2009).
Fig. 13. UV–Visible (UV–Vis) absorption spectra of Fe(TPP)Cl in 10−5 M CHCl3 solution (a) and Fe(TPP)Cl films: SPIN (b) and GDS (c).
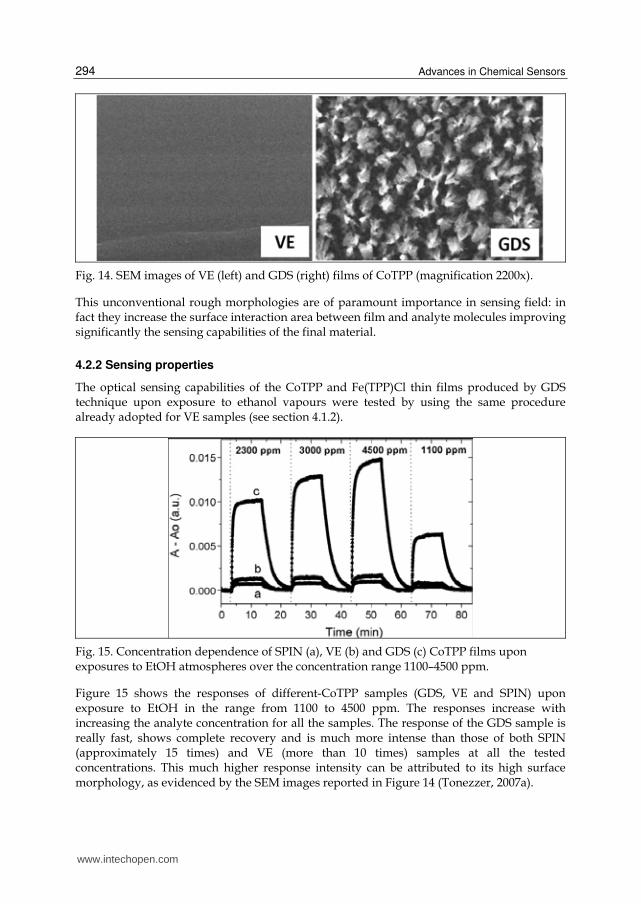
In order to analyze the structures of differently deposited porphyrin films, several analyses were performed (Tonezzer, 2007c): among them SEM images give an important information about the samples morphology. Figure 14 shows SEM images of VE and GDS CoTPP films.
SEM pictures point out the two very different morphologies, which depend on the different deposition techniques. In particular VE sample shows surfaces characterized by flat morphology while GDS samples show a rough surface composed of micro-size domains.
www.intechopen.com
Advances in Chemical Sensors 294
Fig. 14. SEM images of VE (left) and GDS (right) films of CoTPP (magnification 2200x).
This unconventional rough morphologies are of paramount importance in sensing field: in fact they increase the surface interaction area between film and analyte molecules improving significantly the sensing capabilities of the final material.
4.2.2 Sensing properties
The optical sensing capabilities of the CoTPP and Fe(TPP)Cl thin films produced by GDS technique upon exposure to ethanol vapours were tested by using the same procedure already adopted for VE samples (see section 4.1.2).
Fig. 15. Concentration dependence of SPIN (a), VE (b) and GDS (c) CoTPP films upon exposures to EtOH atmospheres over the concentration range 1100–4500 ppm.
Figure 15 shows the responses of different-CoTPP samples (GDS, VE and SPIN) upon exposure to EtOH in the range from 1100 to 4500 ppm. The responses increase with increasing the analyte concentration for all the samples. The response of the GDS sample is really fast, shows complete recovery and is much more intense than those of both SPIN (approximately 15 times) and VE (more than 10 times) samples at all the tested concentrations. This much higher response intensity can be attributed to its high surface morphology, as evidenced by the SEM images reported in Figure 14 (Tonezzer, 2007a).
www.intechopen.com
Physical Vapour Deposition Techniques for Producing Advanced Organic Chemical Sensors 295
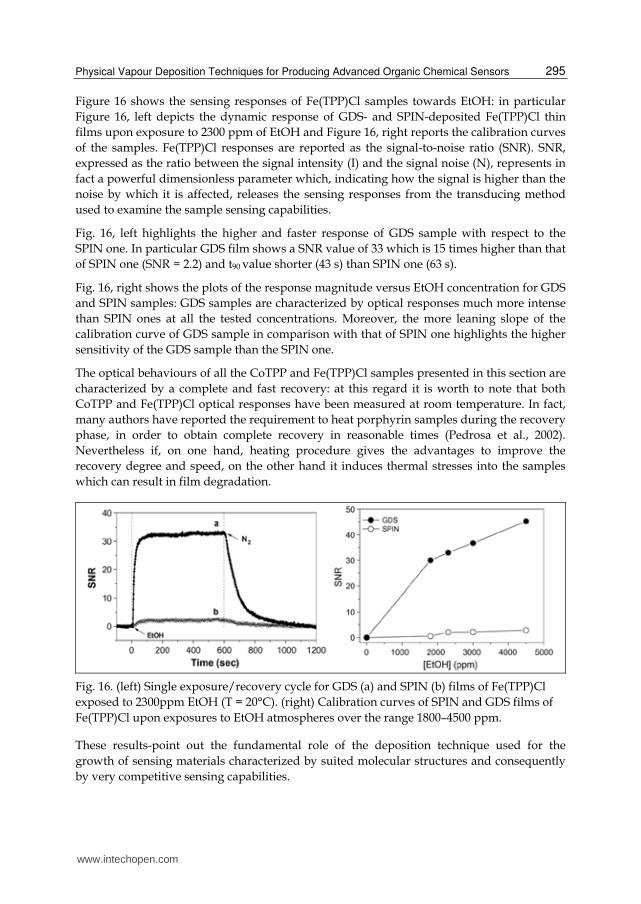
Figure 16 shows the sensing responses of Fe(TPP)Cl samples towards EtOH: in particular
Figure 16, left depicts the dynamic response of GDS- and SPIN-deposited Fe(TPP)Cl thin
films upon exposure to 2300 ppm of EtOH and Figure 16, right reports the calibration curves
of the samples. Fe(TPP)Cl responses are reported as the signal-to-noise ratio (SNR). SNR,
expressed as the ratio between the signal intensity (I) and the signal noise (N), represents in
fact a powerful dimensionless parameter which, indicating how the signal is higher than the
noise by which it is affected, releases the sensing responses from the transducing method
used to examine the sample sensing capabilities.
Fig. 16, left highlights the higher and faster response of GDS sample with respect to the
SPIN one. In particular GDS film shows a SNR value of 33 which is 15 times higher than that
of SPIN one (SNR = 2.2) and t90 value shorter (43 s) than SPIN one (63 s).
Fig. 16, right shows the plots of the response magnitude versus EtOH concentration for GDS
and SPIN samples: GDS samples are characterized by optical responses much more intense
than SPIN ones at all the tested concentrations. Moreover, the more leaning slope of the
calibration curve of GDS sample in comparison with that of SPIN one highlights the higher
sensitivity of the GDS sample than the SPIN one.
The optical behaviours of all the CoTPP and Fe(TPP)Cl samples presented in this section are
characterized by a complete and fast recovery: at this regard it is worth to note that both
CoTPP and Fe(TPP)Cl optical responses have been measured at room temperature. In fact,
many authors have reported the requirement to heat porphyrin samples during the recovery
phase, in order to obtain complete recovery in reasonable times (Pedrosa et al., 2002).
Nevertheless if, on one hand, heating procedure gives the advantages to improve the
recovery degree and speed, on the other hand it induces thermal stresses into the samples
which can result in film degradation.
Fig. 16. (left) Single exposure/recovery cycle for GDS (a) and SPIN (b) films of Fe(TPP)Cl
exposed to 2300ppm EtOH (T = 20°C). (right) Calibration curves of SPIN and GDS films of
Fe(TPP)Cl upon exposures to EtOH atmospheres over the range 1800–4500 ppm.
These results-point out the fundamental role of the deposition technique used for the
growth of sensing materials characterized by suited molecular structures and consequently
by very competitive sensing capabilities.
www.intechopen.com
Advances in Chemical Sensors 296
5. Cavitands
Molecular recognition of gases is an emerging area of chemistry (Rudkevich, 2004). Cavitands, together with cyclodextrins and calixarenes, are the most studied receptors for gas/vapor sensing because of their outstanding host-guest properties, which are tunable for recognizing different classes of analytes (Cram & Cram, 1994). Among them phosphonate cavitands represent a third-generation emerging class of synthetic receptors whose molecular recognition properties toward alcohols and water were thoroughly demonstrated at the molecular scale by several analytical techniques such as ESI-MS and X-ray crystallography (Melegari et. al., 2008).
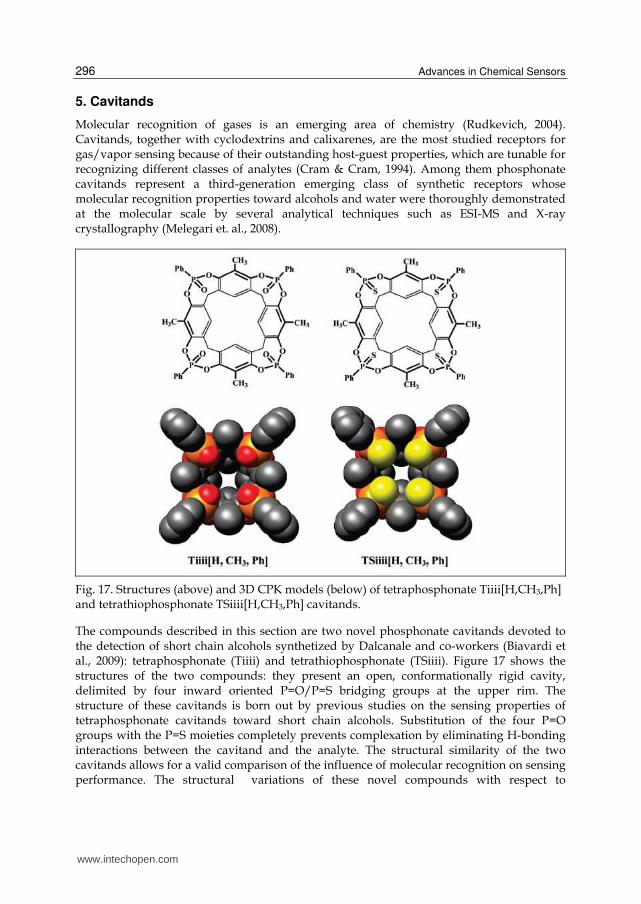
Fig. 17. Structures (above) and 3D CPK models (below) of tetraphosphonate Tiiii[H,CH3,Ph] and tetrathiophosphonate TSiiii[H,CH3,Ph] cavitands.
The compounds described in this section are two novel phosphonate cavitands devoted to the detection of short chain alcohols synthetized by Dalcanale and co-workers (Biavardi et al., 2009): tetraphosphonate (Tiiii) and tetrathiophosphonate (TSiiii). Figure 17 shows the structures of the two compounds: they present an open, conformationally rigid cavity, delimited by four inward oriented P=O/P=S bridging groups at the upper rim. The structure of these cavitands is born out by previous studies on the sensing properties of tetraphosphonate cavitands toward short chain alcohols. Substitution of the four P=O groups with the P=S moieties completely prevents complexation by eliminating H-bonding interactions between the cavitand and the analyte. The structural similarity of the two cavitands allows for a valid comparison of the influence of molecular recognition on sensing performance. The structural variations of these novel compounds with respect to
www.intechopen.com
Physical Vapour Deposition Techniques for Producing Advanced Organic Chemical Sensors 297
previously described ones (Melegari et al., 2008) are: (i) the four alkyl chains at the lower rim were removed, to minimize nonspecific interactions; (ii) four methyl groups were introduced in the apical positions to deepen the cavity and increase the strength of CH-π interactions.
5.1 Cavitands deposited by VE technique
In order to be exploited as sensing materials, cavitands are usually deposited as thin solid
films by wet deposition techniques; in particular, spin-coating method is commonly
employed (Feresenbet et al., 2004). Unfortunately wet deposition methods suffer from
several drawbacks such as inhomogeneous surface morphology and uncontrollable
thickness. Moreover, insoluble compounds cannot be deposited by such solution
techniques. To date, the most common method of depositing insoluble compounds by
solution techniques consists of decorating them with peripheral alkyl chains to improve
their solubility: nevertheless this molecular derivatization introduces dispersion
interactions that dilute the specific analyte response, thus significantly decreasing sensor
selectivity. As alternatives, Langmuir-Blodgett and Langmuir-Schafer deposition methods
provide ordered and reproducible monolayers: however, when a bulk response is
required by the sensing layer (like in QCM sensors), deposition of thicker permeable
coatings is mandatory.
In this section we report the employment of the VE technique for the deposition of Tiiii[H,
CH3, Ph] cavitand which represents the ultimate receptor for supramolecular mass
sensing of short chain alcohols. VE technique is also used for producing TSiiii[H, CH3,
Ph]-sensing coatings for comparison. In the case of the Tiiii and TSiiii cavitands, the
absence of alkyl chains at the lower rim implies a different film deposition method with
respect to the standard ones (spray- and –spin coating) owing to the high insolubility of
the two cavitands.
VE technique overcomes solubility problems, allowing for the direct formation of films from
solid materials. The lack of residual solvent during the deposition process assures the
formation of high purity films: this represents a basic requirement in the gas sensing field,
because of the unpredictable effects of the retained solvent on the final response of the
sensor, including occupation of adsorption sites and interference in analyte/material
interactions. Moreover, VE technique guarantees good reproducibility, high uniformity, and
homogeneity and provides accurate control over both the growth rate and the final
thickness of the samples.
5.1.1 Physical and chemical properties
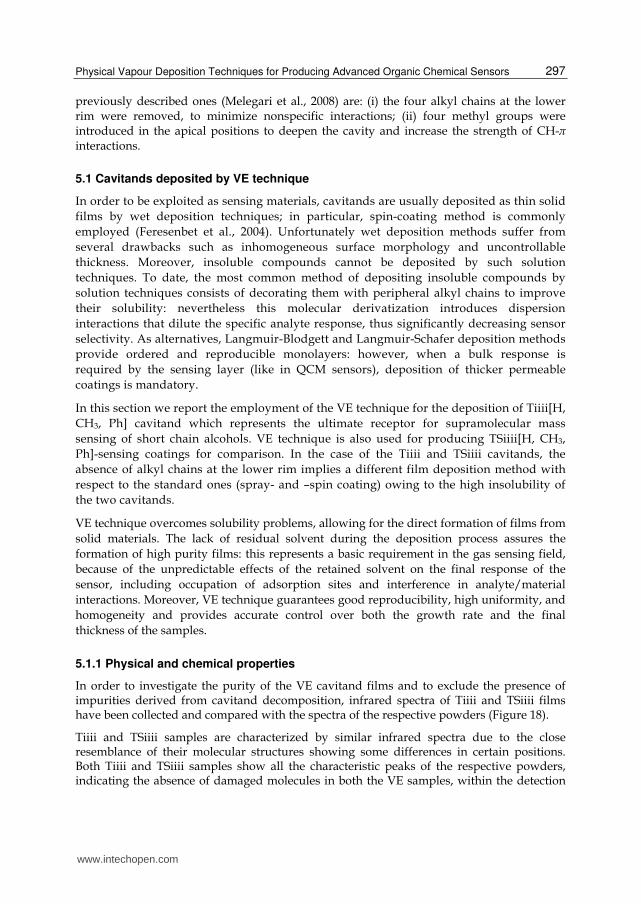
In order to investigate the purity of the VE cavitand films and to exclude the presence of impurities derived from cavitand decomposition, infrared spectra of Tiiii and TSiiii films have been collected and compared with the spectra of the respective powders (Figure 18).
Tiiii and TSiiii samples are characterized by similar infrared spectra due to the close resemblance of their molecular structures showing some differences in certain positions. Both Tiiii and TSiiii samples show all the characteristic peaks of the respective powders, indicating the absence of damaged molecules in both the VE samples, within the detection
www.intechopen.com
Advances in Chemical Sensors 298
limits of the employed technique. Moreover, the lack of any additional peaks in the FT-IR spectra excludes the presence of extraneous compounds, demonstrating the high purity of the samples (Tonezzer et al., 2008).
Fig. 18. FT-IR spectra of vacuum evaporated (VE) films of Tiiii (A) and TSiiii (B) cavitands.
The spectra of the corresponding starting powders pressed in KBr pellet (KBr) are also
reported as reference.
The integrity of the cavitand molecules into the sublimated films as well as the purity of the
samples demonstrate the viability of the VE technique for the deposition of thermally stable
molecular receptors. AFM measurements of the surface of the Tiiii and TSiiii films point out
their high uniformity and homogeneity. Moreover, the similar thickness of the two films
(350 nm for Tiiii and 355 nm for TSiiii), which were deposited with the same process
parameters, highlights the high reproducibility of the VE deposition process (Tonezzer,
2008).
5.1.2 Sensing properties
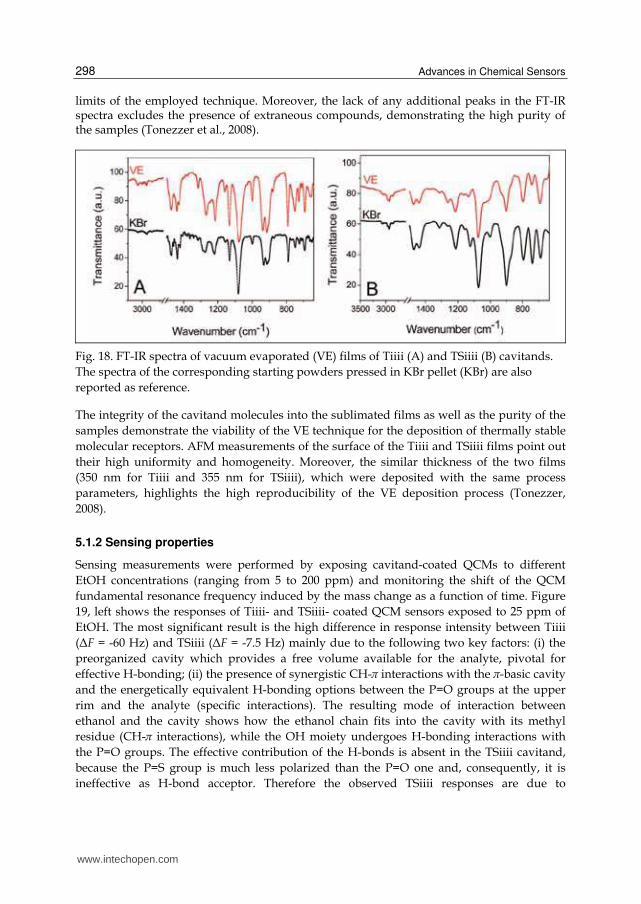
Sensing measurements were performed by exposing cavitand-coated QCMs to different
EtOH concentrations (ranging from 5 to 200 ppm) and monitoring the shift of the QCM
fundamental resonance frequency induced by the mass change as a function of time. Figure
19, left shows the responses of Tiiii- and TSiiii- coated QCM sensors exposed to 25 ppm of
EtOH. The most significant result is the high difference in response intensity between Tiiii
(ΔF = -60 Hz) and TSiiii (ΔF = -7.5 Hz) mainly due to the following two key factors: (i) the
preorganized cavity which provides a free volume available for the analyte, pivotal for
effective H-bonding; (ii) the presence of synergistic CH-π interactions with the π-basic cavity
and the energetically equivalent H-bonding options between the P=O groups at the upper
rim and the analyte (specific interactions). The resulting mode of interaction between
ethanol and the cavity shows how the ethanol chain fits into the cavity with its methyl
residue (CH-π interactions), while the OH moiety undergoes H-bonding interactions with
the P=O groups. The effective contribution of the H-bonds is absent in the TSiiii cavitand,
because the P=S group is much less polarized than the P=O one and, consequently, it is
ineffective as H-bond acceptor. Therefore the observed TSiiii responses are due to
www.intechopen.com
Physical Vapour Deposition Techniques for Producing Advanced Organic Chemical Sensors 299
nonspecific dispersion interactions between the organic layer and EtOH and the large
difference in the sensor responses can be attributed to the specific binding of EtOH by the
Tiiii cavitand (Tonezzer et al., 2008).
Fig. 19. (left) Change of the resonance frequency of VE Tiiii and TSiiii samples as a function of time during exposure to 25 ppm EtOH (T = 20 °C). (right) Change of the resonance frequency of SPIN Tiiii[C11H23, H, Ph] and VE Tiiii [H, CH3, Ph] samples at increasing amount of EtOH.
The superior sensing performances of VE Tiiii[H, CH3, Ph] sensor have been demonstrated
by comparing its responses to those of the spin-coated long chain analogue Tiiii[C11H23, H,
Ph], the best performer to date (Melegari, 2008). Figure 19, right shows that the combination
of Tiiii[H,CH3, Ph] receptor with VE deposition doubles the EtOH sensor sensitivity in the 5-
50 ppm range in which nonspecific extracavity adsorption becomes significant. This result is
remarkable, as it was obtained without altering the receptor site responsible for the alcohol
complexation at the gas-solid interface.
To investigate the interaction between EtOH and the VE films, the recovery phase of the
samples was analyzed by Elovich kinetics. According to this model, the surface uncovering
Θ during the recovery phase as a function of time is given by the following formula:
( ) ( )1Θ t = ln t + Kβ
where β and K are constants. This model is based on the assumption that the desorption
probability of an analyte molecule during surface purging decreases exponentially as a
function of the number of analyte molecules already desorbed. Thus, by assuming that the
change of resonance frequency (ΔF) is related only to the interaction between EtOH and
cavitand coatings, the value of Θ should be proportional to ΔF. Hence, by plotting ΔF as a
function of ln(t), a linear relationship should be obtained.
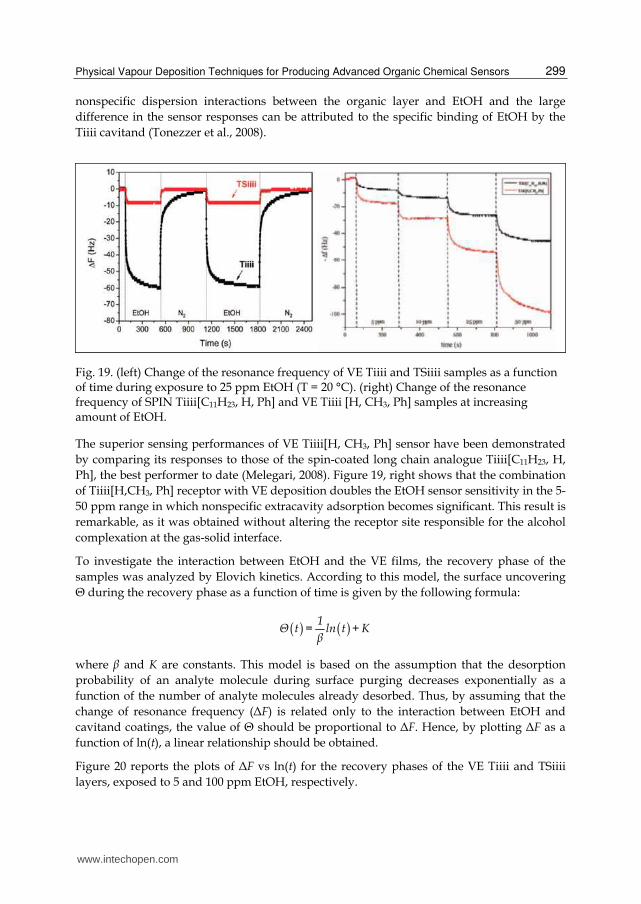
Figure 20 reports the plots of ΔF vs ln(t) for the recovery phases of the VE Tiiii and TSiiii
layers, exposed to 5 and 100 ppm EtOH, respectively.
www.intechopen.com
Advances in Chemical Sensors 300
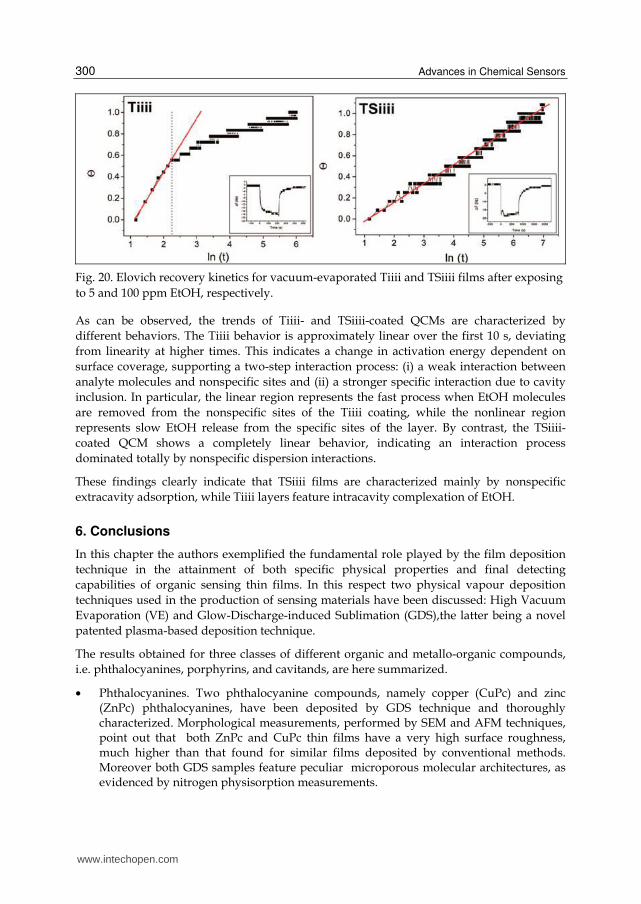
Fig. 20. Elovich recovery kinetics for vacuum-evaporated Tiiii and TSiiii films after exposing
to 5 and 100 ppm EtOH, respectively.
As can be observed, the trends of Tiiii- and TSiiii-coated QCMs are characterized by
different behaviors. The Tiiii behavior is approximately linear over the first 10 s, deviating
from linearity at higher times. This indicates a change in activation energy dependent on
surface coverage, supporting a two-step interaction process: (i) a weak interaction between
analyte molecules and nonspecific sites and (ii) a stronger specific interaction due to cavity
inclusion. In particular, the linear region represents the fast process when EtOH molecules
are removed from the nonspecific sites of the Tiiii coating, while the nonlinear region
represents slow EtOH release from the specific sites of the layer. By contrast, the TSiiii-
coated QCM shows a completely linear behavior, indicating an interaction process
dominated totally by nonspecific dispersion interactions.
These findings clearly indicate that TSiiii films are characterized mainly by nonspecific
extracavity adsorption, while Tiiii layers feature intracavity complexation of EtOH.
6. Conclusions
In this chapter the authors exemplified the fundamental role played by the film deposition
technique in the attainment of both specific physical properties and final detecting
capabilities of organic sensing thin films. In this respect two physical vapour deposition
techniques used in the production of sensing materials have been discussed: High Vacuum
Evaporation (VE) and Glow-Discharge-induced Sublimation (GDS),the latter being a novel
patented plasma-based deposition technique.
The results obtained for three classes of different organic and metallo-organic compounds,
i.e. phthalocyanines, porphyrins, and cavitands, are here summarized.
• Phthalocyanines. Two phthalocyanine compounds, namely copper (CuPc) and zinc (ZnPc) phthalocyanines, have been deposited by GDS technique and thoroughly characterized. Morphological measurements, performed by SEM and AFM techniques, point out that both ZnPc and CuPc thin films have a very high surface roughness, much higher than that found for similar films deposited by conventional methods. Moreover both GDS samples feature peculiar microporous molecular architectures, as evidenced by nitrogen physisorption measurements.
www.intechopen.com
Physical Vapour Deposition Techniques for Producing Advanced Organic Chemical Sensors 301
The sensing capabilities of CuPc samples have been investigated towards different analytes and by different transducing methods. As electrical sensors CuPc samples exhibit detection limits down to 0.1 ppm for NO2 (the standard attention level set by the European Union) and 10 ppm for NO and response times shorter than 30 s for 0.98 ppm NO2 and 98 ppm NO. CuPc films have been also tested as optical sensors towards ethanol vapours within 1500 - 34000 ppm concentration range highlighting high-speed responses (t50 = 7 s and t90 = 12 s) and fast recovery (t50 =12 s and t10 =38 s). It has been shown that CuPc-coated QCMs can be used for NO detection down to few ppm. ZnPc films, tested as optical sensors towards different alcohol vapours (methanol, ethanol and isopropanol) showed stable and reproducible signals.
• Porphyrins. Porphyrin thin films were grown both by high vacuum evaporation (VE) and Glow-Discharge-induced Sublimation (GDS). In particular, three different porphyrin-based films were produced by VE technique: free (H2TPP), cobalt (CoTPP), and iron chloride (Fe(TPP)Cl) 5,10,15,20 meso-tetraphenyl porphyrins. Their chemical properties and optical sensing capabilities towards different alcohol vapours (methanol, ethanol and isopropanol) have been analyzed and compared to those of conventional spin coated (SPIN) ones. FT-IR spectra pointed out that VE technique allows to produce samples characterized by a much higher purity than the SPIN ones and the study of the optical responses highlighted that their higher purity provide them with much larger sensitivity and much faster response times than the SPIN sensing elements. CoTPP and Fe(TPP)Cl films have been also produced by GDS technique: their chemical and physical features have been analyzed by FT-IR, UV-Vis and SEM analyses and their optical sensing capabilities towards ethanol have been measured. The chemical and physical characterization highlighted that GDS porphyrin films have a high purity, analogously to the VE samples, and feature an extremely large surface area to volume ratio, like the GDS phthalocyanine films. Optical sensing measurements confirmed that GDS technique allows to produce very competitive sensing films. In fact, both GDS CoTPP and Fe(TPP)Cl films feature much more intense response (up to 10 times) and much larger sensitivity with respect to conventional SPIN samples, high speed responses (t50 and t90 respectively of 10 s and 1 min approximately) and fast and complete recovery.
• Cavitands. VE deposition has been used for the first time in order to produce sensing thin films based on Tiiii[H, CH3, Ph] cavitand, an ultimate receptor for supramolecular sensing. The characterization of the Tiiii films highlighted that VE technique is particularly suitable for the deposition of supramolecular compounds: in fact, VE allows to grow thin films starting from compounds characterized by low solubility (a quite common feature of highly specific recognition molecules). As regard the sensing capabilities, Tiiii films have been tested towards very low concentration of ethanol vapours (5-50 ppm) demonstrating that VE technique provides a significant improvement of the performances of cavitand receptor as sensitive material in mass sensors. Moreover Elovich kinetics, used to elucidate the sorption processes occurring onto the layers, highlighted the high specificity of the Tiiii sensors, which reduces the incidence of aspecific adsorption.
Chemical sensing requires an integrated approach, where both the molecular and the materials properties of the sensing layer must be finely tuned to achieve the desired
www.intechopen.com
Advances in Chemical Sensors 302
properties. In this respect, thin film chemical sensors represents a particular challenge, taking into account that the analyte recognition is mediated by the layer properties of the coated receptors.
In this chapter, the authors describes different real cases in which significant advantages are introduced into the sensing field by a bottom-up approach in which recognition molecules are deposited in well-controlled and designed architectures by novel and accurate deposition techniques. The integrated approach used by the authors, where both the molecular and the materials properties of the sensing layers have been finely tuned, demonstrated to produce organic and metallo-organic sensors with improved performances over the existing ones.
This approach can be easily extended to many different classes of organic receptors, opening
the way for the rational design of sensor materials tailored for the analytes to be detected.
7. Acknowledgment
The authors thank the research group of Prof. Dalcanale of Industrial Chemistry at the
Department of Organic and Industrial Chemistry of Parma University (Italy) for providing
them Tiiii and TSiiiii cavitands. M.T. thanks personally Prof. Dalcanale for the helpful
discussions on supramolecular receptors. The research leading to these results has received
funding by Fondazione Cassa di Risparmio di Trento e Rovereto (CARITRO) within GREEN
project and from the European Community's Seventh Framework Programme FP7/2007-
2013 under grant Agreement Marie Curie 7th Framework Program - PCOFUND-GA-2008-
226070, acronomy “Progetto Trentino” within PHOTOFUTURE project.
8. References
Arai, T. & Kragic, D. (1999). Variability of Wind and Wind Power, In: Wind Power, S.M. Muyeen, (Ed.), 289-321, Scyio, ISBN 978-953-7619-81-7, Vukovar, Croatia
Bernini, R., Tonezzer, M., Mottola, F., Zeni, L., Quaranta, A., Maggioni, G., Carturan, S. & Della Mea, G. (2007). Volatile organic compounds detection using porphyrin-basedmetal-cladding leaky waveguides, Sens. Actuators B, Vol. 127, pp. 231-236
Biavardi, E., Favazza, M., Motta, A., Fragalà, I.L., Massera, C., Prodi, L., Montalti, M., Melegari, M., Condorelli, G.G. & Dalcanale, E. (2009). Molecular recognition on a cavitand-functionalized silicon surface, JACS, Vol. 131 (21), pp. 7447-7455.
Brunik, J.A.J., Di Natale, C., Campo dall’Orto, V., Macagnano, A., Angelaccio, A., Sgarlata, A., Hurst, J., Rezzano, I., Mascini, M. & D’Amico, A. (1999). Porphyrin thin films coated quartz microalances prepared by electropolymerization techniques, Thin Solid Films, Vol. 354, pp. 245–250.
Cram, D. J. & Cram, J. M. (1994). Container Molecules and Their Guests, The Royal Society of Chemistry, Cambridge, U.K.
Feresenbet, E.B., Dalcanale, E., Dulcey, C. & Shenoy, D.K. (2004) Optical sensing of the selective interaction of aromatic vapors with cavitands Sensors and Actuators B, Vol. 97 pp. 211–220.
Horvath, G. & Kawazoe, K. (1983). Method for the calculation of effective pore size distribution in molecular sieve carbon, J. Chem. Eng. Jpn., Vol. 16, pp. 470–475.
www.intechopen.com
Physical Vapour Deposition Techniques for Producing Advanced Organic Chemical Sensors 303
Iwatsu, F., Kobayashi, T. & Uyeda, N. (1980). Solvent effects on crystal growth and transformation of zinc phthalocyanine, J. Phys. Chem., Vol. 84, pp. 3223–3230.
Li, B.; Xu, Y. & Choi, J. (1996). Applying Machine Learning Techniques, Proceedings of ASME 2010 4th International Conference on Energy Sustainability, pp. 14-17, ISBN 842-6508-23-3, Phoenix, Arizona, USA, May 17-22, 2010
Maggioni, G., Carturan, S., Boscarino, D., Della Mea, G. & Pieri U. (1997). Polyimide and platinum containing polyimide thin films obtained by vapour deposition polymerization; effects of thermal treatments, Mater. Lett., Vol. 32, pp. 147-150.
Maggioni, G., Quaranta, A., Carturan, S., Patelli, A., Tonezzer, M., Ceccato, R. & Della Mea, G. (2005). Deposition of Copper Phthalocyanine Films by Glow-Discharge-induced Sublimation, Chem. Mater., Vol. 17, No. 7, pp. 1895-1904
Maggioni, G., Quaranta, A., Carturan, S., Patelli, A., Tonezzer, M., Ceccato, R. & Della Mea, G. (2005). Deposition of Copper Phthalocyanine Films by Glow-Discharge-induced Sublimation for Gas Sensing Applications, Surf. Coat. Technol., Vol. 200, pp. 476-480
Maggioni, G., Manera, M. G., Spadavecchia, J., Tonezzer, M., Carturan, S., Quaranta, A., de Julián Fernández, C., Rella, R., Siciliano, P., Della Mea, G., Vasanelli, L. & Mazzoldi, P. (2007). Optical response of plasma-deposited zinc phthalocyanine films to volatile organic compounds. Sens. Actuators B, Vol. 127, pp. 150-156.
Maggioni, G., Carturan, S., Tonezzer, M., Quaranta, A. & Della Mea, G. (2008). Plasma-deposited copper phthalocyanine: A single gas-sensing material with multiple responses, Sens. Actuators B, Vol. 131, pp. 496-503
Melegari, M., Suman, M., Pirondini, L., Moiani, D., Massera, C., Ugozzoli, F., Kalenius, E., Vainiotalo, P., Mulatier, J.C., Dutasta, J.-P. & Dalcanale, E. (2008). Supramolecular sensing with phosphonate cavitands, Chem. Eur. J., Vol 14 (19), pp. 5772-5779
Pedrosa, J.M. , Dooling, C.M., Richardson, T.H., Hyde, R.K., Hunter, C.A., Martin, M.T. & Camacho, L. (2002). The optical gas-sensing properties of an asymmetrically substituted porphyrin, J. Mater. Chem., Vol. 12, pp. 2659–2664.
Rakow, N.A. & Suslick, K.S. (2000). A colorimetric sensor array for odour visualization Nature, Vol. 406 (6797), pp. 710-713
Rudkevich, D.M., (2004). Emerging Supramolecular Chemistry of Gases, Angewandte Chemie - International Edition, Vol 43 (5), pp. 558-571.
Sadaoka, Y., Sakai, Y., Yamazoe, N. & Shiyama, T. (1982). Effect of adsorbed oxidative gases on electrical properties of evaporated films of phthalocyanine. Denki Kagaku, Vol. 50, No. 6, pp. 457-462.
Siegwart, R. (2001). Indirect Manipulation of a Sphere on a Flat Disk Using Force Information. International Journal of Advanced Robotic Systems, Vol.6, No.4, (December 2009), pp. 12-16, ISSN 1729-8806
Snow, A.W. & Barger, W.R. (1989) Phthalocyanines: properties and applications in C.C. Leznoff, A.B.P. Lever (Ed.), Vol. 1, pp. 341-392, VCH Publishers, Inc., New York, U.S.A.
Spadavecchia, J., Ciccarella, G., Valli, L. & Rella, R. (2006). A novel multisensing optical approach based on a single phthalocyanine thin films to monitoring volatile organic compounds, Sens. Actuators B, Vol. 113, pp. 516–525
Tonezzer, M., Maggioni, G., Quaranta, A., Carturan, S. & Della Mea, G. (2007). Optical sensing properties of CoTPP thin films deposited by glow-discharge-induced sublimation, Sens. Actuators B, Vol. 122, pp. 613-619
Tonezzer, M., Quaranta, A., Maggioni, G., Carturan, S. & Della Mea, G. (2007). Optical sensing responses of tetraphenyl porphyrins toward alcohol vapours: A comparison between vacuum evaporated and spin-coated thin films, Sens. Actuators B, Vol. 122, pp. 620-626
www.intechopen.com

Advances in Chemical Sensors 304
Tonezzer, M., (2007). Production, characterization and testing of solid organic and metallo-organic films for optical gas sensors, University of Trento, Trento, Italy
Tonezzer, M., Melegari, M., Maggioni, Milan, R., Della Mea, G. & Dalcanale, E. (2008). Vacuum-Evaporated Cavitand Sensors: Dissecting Specific from Nonspecific Interactions in Ethanol Detection, Chem. Mater., Vol. 20, pp. 6535–6542
Tonezzer, M., Maggioni, G., Quaranta, A., Carturan, S. & Della Mea, G. (2009). Growth, characterization and sensing capabilities of 5,10,15,20-meso-tetraphenyl iron (III) porphyrin chloride films obtained by means of a novel plasma-based deposition technique, Sens. Actuators B, Vol. 136, pp. 290-296
www.intechopen.com
Advances in Chemical SensorsEdited by Prof. Wen Wang
ISBN 978-953-307-792-5Hard cover, 358 pagesPublisher InTechPublished online 20, January, 2012Published in print edition January, 2012
InTech EuropeUniversity Campus STeP Ri Slavka Krautzeka 83/A 51000 Rijeka, Croatia Phone: +385 (51) 770 447 Fax: +385 (51) 686 166www.intechopen.com
InTech ChinaUnit 405, Office Block, Hotel Equatorial Shanghai No.65, Yan An Road (West), Shanghai, 200040, China
Phone: +86-21-62489820 Fax: +86-21-62489821
The chemical sensor plays an essential role in the fields of environmental conservation and monitoring,disaster and disease prevention, and industrial analysis. A typical chemical sensor is a device that transformschemical information in a selective and reversible way, ranging from the concentration of a specific samplecomponent to total composition analysis, into an analytically useful signal. Much research work has beenperformed to achieve a chemical sensor with such excellent qualities as quick response, low cost, small size,superior sensitivity, good reversibility and selectivity, and excellent detection limit. This book introduces thelatest advances on chemical sensors. It consists of 15 chapters composed by the researchers active in thefield of chemical sensors, and is divided into 5 sections according to the classification following the principles ofsignal transducer. This collection of up-to-date information and the latest research progress on chemicalsensor will provide valuable references and learning materials for all those working in the field of chemicalsensors.
How to referenceIn order to correctly reference this scholarly work, feel free to copy and paste the following:
Michele Tonezzer and Gianluigi Maggioni (2012). Physical Vapour Deposition Techniques for ProducingAdvanced Organic Chemical Sensors, Advances in Chemical Sensors, Prof. Wen Wang (Ed.), ISBN: 978-953-307-792-5, InTech, Available from: http://www.intechopen.com/books/advances-in-chemical-sensors/physical-vapour-deposition-techniques-for-producing-advanced-organic-chemical-sensors