vapour deposition: thermal characterization and
TRANSCRIPT

Vapour Deposition: Thermal Characterization and Application of
Metal Oxide Thin Films.
by
Adam P. Wells
A thesis submitted to the Faculty of Graduate and Postdoctoral
Affairs in partial fulfillment of the requirements for the degree of
Master of Science
in
Chemistry
Carleton University
Ottawa, Ontario
© 2014, Adam P. Wells

ii
Abstract
Three precursors of group 11 metals, gold(I) 1,3-diisopropyl-imidazolidin-2-
ylidene hexamethyldisilazide, gold(I) tert-butyl-imino-2,2-dimethylpyrrolidinate, silver(I)
tertbutyl-imino-2,2-dimethylpyrrolidinate were subjected to solution based NMR
thermolysis studies. Rates of decomposition and order of reactivity were gathered by
monitoring the disappearance of starting material.
Two novel antimony compounds, trimethyl phosphine antimony (III) chloride and
bistrimethyl phosphine antimony (III) chloride were subjected to thermal characterization
by TGA and CVD experiments in attempt to produce antimony or antimony oxide films.
Few experiments gave varying depositions but reproducible coatings were not achieved.
Protective coatings of alumina and bilayers of alumina and titania were deposited
on bronze and brass test tokens as well as on numismatic silver coins. Multiple tests
examined the efficacy of such films against physical and chemical wear. Silver coins
were compared to a traditional lacquer coating. The ALD coatings on test tokens
provided improved wear and chemical protection vs. unprotected coins. Final
numismatic coatings of alumina gave greatest adhesion, but did reveal small areas of
chemical penetration.

iii
Acknowledgements
There are many people that have provided much support and encouragement on
this journey in academia. First and foremost I would like to thank my supervisor, Dr.
Seán T. Barry for allowing me the opportunity to further my educational endeavors. He,
along with his excellent group, brings such valuable knowledge and guidance for which I
would like to express my gratitude.
For my friends and family, thank you.

iv
Table of Contents
Abstract .............................................................................................................................. ii
Acknowledgements .......................................................................................................... iii
Table of Contents ............................................................................................................. iv
List of Acronyms ............................................................................................................. vii
List of Tables .................................................................................................................. viii
List of Illustrations ............................................................................................................ x
List of Appendices .......................................................................................................... xiv
1 Chapter: Introduction ................................................................................................ 1
1.1 Chemical Vapour Deposition ......................................................................................... 1
1.2 Atomic Layer Deposition ............................................................................................... 5
2 Chapter: Thermolysis ................................................................................................. 8
2.1 Introduction .................................................................................................................... 8
2.1.1 Ligand Design ............................................................................................................ 9
2.2 Experimental Design .................................................................................................... 12
2.2.1 Precursors ................................................................................................................. 12
2.2.2 Boil-up Method ........................................................................................................ 13
2.2.3 NMR Spectra and Rate Determination Plots ............................................................ 14
2.3 Results and Discussion ................................................................................................. 16
2.3.1 P2Au ......................................................................................................................... 16
2.3.2 P2Au - Summary Conclusions ................................................................................. 18
2.3.3 Agttbip ..................................................................................................................... 21
2.3.4 Agttbip - Summary Conclusions .............................................................................. 23
2.3.5 Auttbip ..................................................................................................................... 29
2.3.6 Auttbip - Summary Conclusions .............................................................................. 31

v
2.4 Conclusions .................................................................................................................. 37
3 Chapter: CVD of Antimony Containing Films ...................................................... 39
3.1 Thermogravimetric Analysis ........................................................................................ 40
3.1.1 Experimental ............................................................................................................ 40
3.1.2 Results and Discussion ............................................................................................. 42
3.2 CVD trials ..................................................................................................................... 47
3.2.1 Experimental ............................................................................................................ 47
3.2.2 Results and Discussion for CVD Trials of 1 ............................................................ 49
3.2.3 Results and Discussion for CVD Trials of 2 ............................................................ 54
3.3 Conclusion .................................................................................................................... 55
4 Chapter: Royal Canadian Mint Contract Work.................................................... 57
4.1 Introduction .................................................................................................................. 57
4.1.1 Alumina .................................................................................................................... 57
4.1.2 Titania ...................................................................................................................... 59
4.1.3 Corrosion: Mechanical Characteristics of Coating Materials .................................. 61
4.2 Protection of Numismatic Silver .................................................................................. 62
4.3 Experimental................................................................................................................. 63
4.4 Results and Discussion ................................................................................................. 66
4.4.1 Numismatic Haze ..................................................................................................... 66
4.4.2 Tests of ALD Coatings on Numismatic Silver ......................................................... 70
4.4.3 Adhesion tests (Ag21 vs. Ag25) ............................................................................... 71
4.4.4 Humidity and Adhesion (tape and sulfur) ................................................................ 72
4.4.5 Brine solution and Adhesion .................................................................................... 73
4.4.6 New Tests ................................................................................................................. 74
4.4.7 Humidity Duration Test ........................................................................................... 75
4.4.8 Hydrogen Furnace and Final Products ..................................................................... 76

vi
4.5 Summary Conclusion - Numismatic ............................................................................. 80
4.6 Atomic Layer Deposition Coatings for Circulation Coins ........................................... 84
4.6.1 Experimental Procedure for ALD Coatings for Circulation Coins .......................... 84
4.6.2 Positional Coins ....................................................................................................... 85
4.6.3 Placement of Silicon Witness Sides ......................................................................... 86
4.6.4 Tests ......................................................................................................................... 86
4.6.5 Basket Depositions ................................................................................................... 87
4.7 Results and Discussion ................................................................................................. 88
4.7.1 Thickness Measurements ......................................................................................... 88
4.7.2 Sulfur Treatment ...................................................................................................... 93
4.8 Tumbler Tests ............................................................................................................... 95
4.9 Summary Conclusion - Circulation .............................................................................. 99
4.10 Conclusions and Future Directions............................................................................. 100
Appendices ..................................................................................................................... 101
Appendix A: NMR Spectra of Thermolysis Compounds. ....................................................... 101
Appendix B: Kinetic Decomposition for the Complete Dataset of Auttbip ............................ 104
Appendic C: Deposition Lists.................................................................................................. 106
Bibliography or References .......................................................................................... 108

vii
List of Acronyms
AFM- atomic force microscopy
Agttbip – silver (I) tert-butyl-imino-2,2-dimethylpyrrolidinate
ALD - atomic layer deposition
APCVD - atmospheric pressure chemical vapour deposition
Auttbip – gold (I) tert-butyl-imino-2,2-dimethylpyrrolidinate
CDI - carbodiimide de-insertion
CVD - chemical vapour deposition
E - Young's modulus
H – nanohardness
LPCVD - low pressure chemical vapour deposition
NHC - n-heterocyclic carbene
NMR – nuclear magnetic resonance
P2Au - 1,3-diisopropyl-imidazolidin-2-ylidene gold (I) hexamethyldisilazide
PVD - physical vapour deposition
TGA - thermogravimetric analysis
TMA - trimethyl alumina
TMS - tetramethyl silane
TTIP - titanium tetraisopropoxide
viii
List of Tables
Table 2.3.1: Order determination by fit parameters of P2Au when exposed to light. ...... 20
Table 2.3.2: Order determination by fit parameters of P2Au when protected from light. 20
Table 2.3.3: Summary of order determination by linear fit of Agttbip from triplet at 2.55
ppm when a) exposed to light and b) protected to light. ................................................... 27
Table 2.3.4: Summary of order determination by linear fit of Agttbip from triplet at 1.66
ppm when a) exposed to light and b) protected to light. ................................................... 28
Table 2.3.5: Summary of order determination by linear fit of Auttbip from triplet at 2.55
ppm when a) exposed to light and b) protected to light. ................................................... 35
Table 2.3.6: Summary of order determination by linear fit of Auttbip from singlet at 1.33
ppm when a) exposed to light and b) protected to light. ................................................... 36
Table 3.2.1: CVD trials attempted with precursor 1 ......................................................... 50
Table 3.2.2: CVD trials of 2.............................................................................................. 54
Table 4.3.1: Parameters for the triple-pulse program used to deposit alumina and titania
on bronze tokens. .............................................................................................................. 66
Table 4.7.1: Thickness measurements and coating parameters of the two first trials using
only alumina...................................................................................................................... 89
Table 4.7.2: Thickness measurements and coating parameters of the final two trials using
both alumina and titania. ................................................................................................... 90
Table 4.7.3: Increased pulse parameters for measure of film uniformity (B10) .............. 92
Table 4.10.1: Order determination by linear fit using all data points of Auttbip when
protected from light......................................................................................................... 105

ix
Table 4.10.2: List of depositions on baskets of bronze circulation tokens. .................... 106
Table 4.10.3: List of depositions on silver numismatic coins........................................ 107

x
List of Illustrations
Figure 1.1.1: A) cold wall reactor and B) hot wall reactor ................................................ 2
Figure 1.2.1: ALD cycle. A) Precursor is brought into reactor. B) The precursor reacts
with surface sites and forms a monolayer. There is no further reaction, excess precursor
and reaction by-products are purged from the reaction chamber. C) Secondary precursor
is brought into reaction chamber and D) reacts with surface sites to regenerate the
surface. Again excess precursor and by-products are removed. E) & F) Repetition of
cycles affords atomic control of thickness. ......................................................................... 6
Figure 2.1.1: Known thermolysis routes for copper guanidinates (amidinates follow
similar pathways). ............................................................................................................. 11
Figure 2.2.1: Precursors used in the thermolysis study, a) P2Au, b)Auttbip, c) Agttbip . 13
Figure 2.2.2: Example of P2Au decomposition over time. Decomposition is monitored
by following peak intensity over time via 1H NMR spectroscopy. .................................. 15
Figure 2.3.1: Fit parameters for the determination of order of decomposition for P2Au. 19
Figure 2.3.2: Linear fit graphs for the determination of order of decomposition for
Agttbip by triplet at 2.55 ppm. .......................................................................................... 25
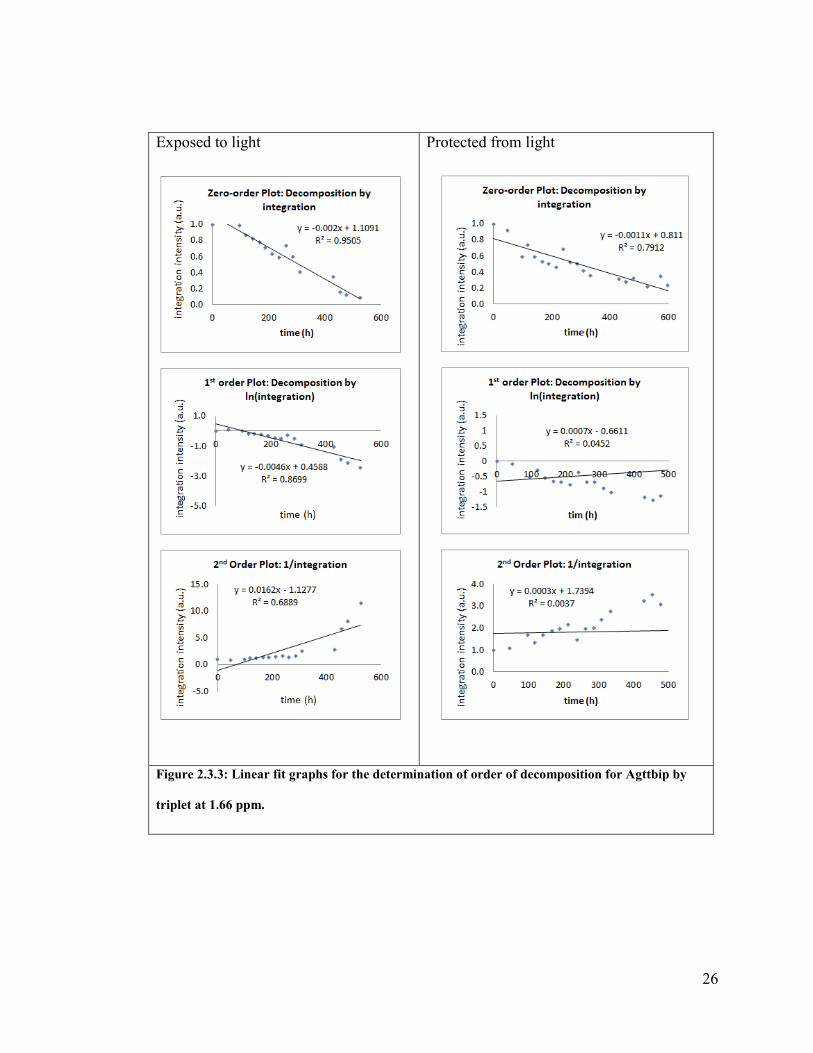
Figure 2.3.3: Linear fit graphs for the determination of order of decomposition for
Agttbip by triplet at 1.66 ppm. .......................................................................................... 26
Figure 2.3.4: Linear fit graphs for the determination of order of decomposition for
Auttbip by triplet at 2.55 ppm. .......................................................................................... 33
Figure 2.3.5: Linear fit graphs for the determination of order of decomposition for
Auttbip by triplet at 1.33 ppm. .......................................................................................... 34
Figure 2.4.1: 1, trichloro trimethyl phosphine antimony(III) ........................................... 40
xi
Figure 2.4.2: 2, trichloro bistrimethyl phosphine antimony(III) ...................................... 40
Figure 3.1.1: Mass loss vs. temperature of 1 by TGA ...................................................... 41
Figure 3.1.2: Mass loss vs. temperature of 2 by TGA ...................................................... 42
Figure 3.1.3: Onset of volatility for compounds 1, and 2. ................................................ 44
Figure 3.1.4: Residual mass from TGA trials with different mass loadings..................... 44
Figure 3.1.5: Derivative of weight change for 1 .............................................................. 46
Figure 3.1.6: Derivative of weight change for 2 .............................................................. 46
Figure 3.2.1: CVD apparatus design. ................................................................................ 49
Figure 3.2.2: Deposition on the bottom of Si and white deposition on glass slide ........... 50
Figure 3.2.3: composition of white film on glass slide from experiment CVD9 .............. 52
Figure 3.2.4: a) Silicon slide after three consecutive CVD depositions of trial 3, 4 and 5
with 1; b) SEM image of deposition; c)EDX compositional analysis of film. ................. 53
Figure 3.2.5: Silicon slide after experiment CVD13 with 2 ............................................. 54
Figure 4.4.1: Hydrogen sulfide tests show better protection by ALD as the coating is
intact and the coin un-tarnished. The lacquer on the coins show reactivity to the
hydrogen sulfide and the uncoated coins become much darker. ..................................... 70
Figure 4.4.2: Ag 21 cross hatch, tape and H2S. The scratched surfaces clearly indicates
corrosion from sulfur. ....................................................................................................... 72
Figure 4.4.3: Samples of ALD coated coins (Ag21, 200cycles alumina, 150°C) showing
variability in adhesion after 2 hour immersion in brine solution. ..................................... 74
Figure 4.4.4: Ag-37 coin with unusual sulfur damage...................................................... 75
Figure 4.4.5: Sample of coins after the first of the final sets of corrosion tests. A) 200H1
slight tarnish on edges, haze on mirrored portion. B) 300H1 slight tarnish on edges, haze

xii
on mirrored portion. C) Lacquered coin showing brown tarnish from sulfur. D) Ag-22
with black markings similar to other ALD coins. E) Uncoated coin with heavy sulfur
damage. ............................................................................................................................. 78
Figure 4.4.6: First trial of the final sets of corrosion tests showing tarnishing along edges.
........................................................................................................................................... 79
Figure 4.4.7: Trial 2 results with coins having longer hydrogen scrubbing times............ 80
Figure 4.6.1: Indentations on coins indicating location of positional coins in basket
batches............................................................................................................................... 85
Figure 4.7.1: Before (far left) and after sulfur treatment of ALD coatings of 150 Å of
alumina and 50 Å of titania. Notice there is no colour difference between ALD samples
(center) while the uncoated coins (right) appear darker. .................................................. 93
Figure 4.7.2: Circulation coins coated in laminates of 150 cycles alumina and 106 cycles
titania after sulfur treatment. The black marks left behind are indicated. ....................... 94
Figure 4.8.1:Image of both coated and uncoated coins before being placed in the tumbler
for 24 hours at 22 rpm. Note: the coins appear identical. ................................................ 96
Figure 4.8.2: After 24 hours in the tumbler the ALD coated coins show a dull-ness in the
coating brough about by many small indentations. The uncoated coins have the same
indentations, but absorb the soft plastic coating of the tumbler walls. ............................. 96
Figure 4.8.3: ALD (left) and uncoated (right) coins after tumbling the uncoated coins
first then the ALD coated coins without cleaning the tumbler between. The uncoated
coins pick up a similar amout of plastic. The ALD coins do show that some of the plastic
adheres to the coin, but not as much as uncoated. ............................................................ 97

xiii
Figure 4.8.4: Optical magnification (12.5x) of: ALD coatings appear unchanged after
cleaning with Sparkeleen paste whereas much of the plastic residue left behind from the
tumbler walls is removed from uncoated coins. After cleaning the uncoated coins appear
to have more of the smooth surface damaged or removed. .............................................. 98
Figure 4.10.1: Select NMR spectra taken of P2Au that had been A) exposed to light over
a period of 31 day and B) protected from light over 38 days. Monitored peak ............. 101
Figure 4.10.2: Select NMR spectra taken of Agttbip that had been A) exposed to light
over a period of 22 days of that had been A) protected from light for 25 days. Monitored
peaks are triplets at 2.5 and 1.6 ppm. .............................................................................. 102
Figure 4.10.3: Select NMR spectra taken of Auttbip that had been A) exposed to light
over a period of 15 days of that had been A) exposed to light for 26 days. Monitored
peaks are triplets at 2.1 and 1.5 ppm. .............................................................................. 103

xiv
List of Appendices
Appendix A: NMR Spectra of Thermolysis Compounds…………………………… 96
Appendix B: Kinetic Decomposition for the Complete Dataset of Auttbip.…………. 99
Appendix C: Numismatic Deposition List…………………………………………... 101

1
1 Chapter: Introduction
1.1 Chemical Vapour Deposition
Chemical vapour deposition (CVD) is a method to deposit nano to micro thick
layers through vapour phase chemistry. In its most basic form CVD utilizes thermally
controlled volatility of a metal containing precursor. The volatility enables for transport
to a substrate where the thermally driven reaction of the precursor, either through
decomposition to a reactive intermediate or direct reaction with the surface forms the
subsequent film.
Substrates are typically, but in no way limited to silicon or glass. Thermally
driven reactions are common1 but there also exist other methods to supply energy
required for reaction. Incorporation of other forms of energy such as plasma or laser light
can provide the energy needed to drive the reaction of precursor with the substrate.2,3
Other techniques utilize co-reactants. This could include a reductant gas, such as
hydrogen in a stream of precursor vapour4 or another molecular species that will react
with the initial metal-containing species.1 There exist two conventional experimental
constructions which employ thermally driven reactions (Figure 1.1.1): cold-walled and
hot-walled reactors. Each of these designs must deliver reactant gases to the reaction
chamber, supply adequate heat to effect the reaction and remove byproducts. Cold wall
reactors have a heated stage where the substrate sits. As the name implies the walls of
this type of reactor are not heated and therefore deposition occurs only on the heated
stage. The other deposition method uses a hot wall reactor whereby the reactor walls are
heated and the substrate sits in a tube furnace. Through this method all heated surfaces

2
are coated. Each reactor design brings about particular experimental considerations.
Hot-wall reactors can achieve high throughput through batch processes while cold-wall
reactors are typically of a single-wafer design. An advantage of a cold-wall reactor is a
greater deposition rate since precursor is not taken up by the reactor walls. Because
deposition occurs on all heated surfaces in a hot-wall reactor there is greater precursor
depletion and the reactor vessel needs to be cleaned regularly. Also, byproducts of these
reactions with the reactor walls could be a source of contamination.
Figure 1.1.1: A) cold wall reactor and B) hot wall reactor
3
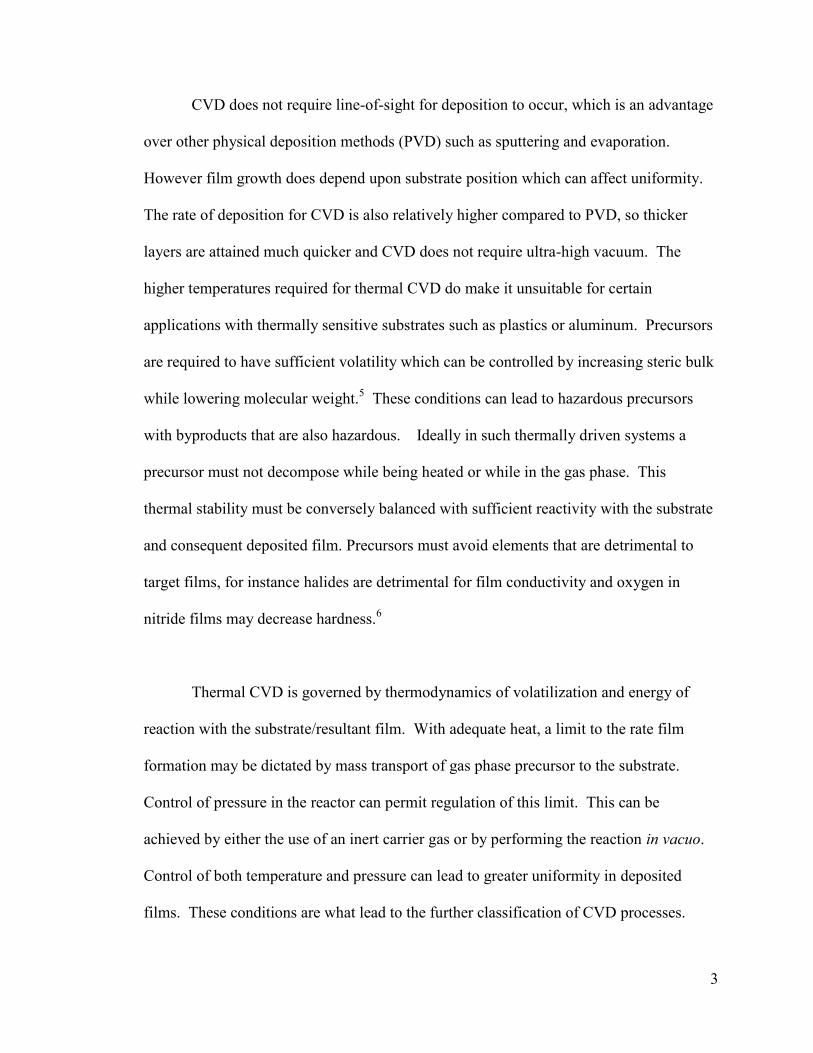
CVD does not require line-of-sight for deposition to occur, which is an advantage
over other physical deposition methods (PVD) such as sputtering and evaporation.
However film growth does depend upon substrate position which can affect uniformity.
The rate of deposition for CVD is also relatively higher compared to PVD, so thicker
layers are attained much quicker and CVD does not require ultra-high vacuum. The
higher temperatures required for thermal CVD do make it unsuitable for certain
applications with thermally sensitive substrates such as plastics or aluminum. Precursors
are required to have sufficient volatility which can be controlled by increasing steric bulk
while lowering molecular weight.5 These conditions can lead to hazardous precursors
with byproducts that are also hazardous. Ideally in such thermally driven systems a
precursor must not decompose while being heated or while in the gas phase. This
thermal stability must be conversely balanced with sufficient reactivity with the substrate
and consequent deposited film. Precursors must avoid elements that are detrimental to
target films, for instance halides are detrimental for film conductivity and oxygen in
nitride films may decrease hardness.6
Thermal CVD is governed by thermodynamics of volatilization and energy of
reaction with the substrate/resultant film. With adequate heat, a limit to the rate film
formation may be dictated by mass transport of gas phase precursor to the substrate.
Control of pressure in the reactor can permit regulation of this limit. This can be
achieved by either the use of an inert carrier gas or by performing the reaction in vacuo.
Control of both temperature and pressure can lead to greater uniformity in deposited
films. These conditions are what lead to the further classification of CVD processes.

4
Deposition can be achieved at atmospheric pressure (APCVD), which does not require a
vacuum pump.7 The particular drawback to APCVD is that deposition rates are low
unless a high partial pressure of reactant gas is used. Low pressure CVD (LPCVD) does
not require carrier gas, gives greater diffusivity and therefore more conformal deposition.
Also because of greater diffusivity the rate limiting effects of mass transport are reduced.
This makes the system more dependent on temperature to control reaction, and therefore
deposition rate. Substrate geometry in both AP and LP CVD reactors can influence film
uniformity.
Interest in films grown by CVD has led to the utilization of this technique in a
variety of applications. Common targets for films grown by CVD are metallic elements
such as gold for use in plasmonic applications8. The low resistivity of Ni
9, Cu
10 and Ag
10
make them viable for low resistivity circuits and electrical contacts in microelectronics.
Also transparent conductive films of InSnO11
, InGaAs12
are possible candidates for use in
liquid crystal displays. Other multi-component films are used as diffusion barriers13,14
and
high-k dielectrics15
(WN, TiN, TiO2, HfO2, ZrO2). Films crown by CVD have found use
in the semiconductor industry, particularly Si16
but also solar cells, LEDs, thin film
transistors, and other optical sensors . 17,18,19
Some films (TiO2, Al2O3, SiC, TiN) are
known for their hardness as protection from mechanical wear as well as films that protect
against corrosion.20,21,22
CVD of graphene grown on copper23,24
has been reviewed in
depth as graphene has very promising electronic properties.

5
1.2 Atomic Layer Deposition
ALD was developed in the 1970’s under the name atomic layer epitaxy, whereby
the growing film was intended to display the same crystalline face as the underlying
substrate.25
It can be considered a modification of the CVD process. Where, in CVD the
precursor flux is generally continuous, in ALD the precursors are pulsed in sequentially
with intermediate purge steps to inhibit gas-phase reactions (Figure 1.2.1). The
sequential pulsing is designed such that a precursor will chemisorb and form a self-
limiting monolayer on the substrate. Ideally it is self-limiting in that the chemical species
saturates reactive surface sites and further film growth is arrested. After a monolayer
forms there is no further reaction and excess precursor is removed from the reaction
chamber by a purge with inert gas. It is explained well by A+B chemistry where
chemical ‘A’ is pulsed into the reactor, forms a monolayer on a substrate and excess is
removed. After an adequate amount of purge time to ensure there is no gas-phase
reaction, precursor ‘B’ is pulsed, reacts with surface ‘A’ which again forms a monolayer
and excess precursor and byproducts are removed. This pulsing procedure is repeated
and proceeds layer-by-layer until a desired film thickness is achieved. Further layering
with multiple components is possible. This technique affords a high degree of thickness
control and excellent conformity over CVD. ALD films have found use in similar
applications as CVD, but where high conformity at great thickness control is required.
Initially developed for electroluminescent displays25
other applications include
conductive films in microelectronics,26
protective films,27
and further development of
semiconductors.28

6
Figure 1.2.1: ALD cycle. A) Precursor is brought into reactor. B) The precursor reacts with
surface sites and forms a monolayer. There is no further reaction, excess precursor and reaction
by-products are purged from the reaction chamber. C) Secondary precursor is brought into
reaction chamber and D) reacts with surface sites to regenerate the surface. Again excess
precursor and by-products are removed. E) & F) Repetition of cycles affords atomic control of
thickness.

7
For thermally driven ALD systems there can exist an optimal ALD temperature
range, or ALD window. Below this range there is no growth, above growth increases and
resembles CVD deposition. This technique also brings about another caveat to the
production of its precursors in that they must not react with each other in a way that
would disrupt monolayer formation. In terms of thin layer processing a drawback is
found in the increase in time processing films. This is due to the pulse and purge steps
required to prevent gas phase reaction where the growth of layers can be much slower
than CVD.

8
2 Chapter: Thermolysis
2.1 Introduction
Recently there has been an increased interest in gold and silver films. These
metal nanoparticles are known to possess surface plasmon resonances in the visible
region of the electromagnetic spectrum29
which has led to use in optical devices.30
Also
these films can be further modified since they exhibit tunablity of the plasmon resonance
similarly to metallic-core dielectric-shell nanostructures.31
Films of gold or silver
produced by various methods are also used extensively in catalytic applications.32
Herein
is described a novel ligand system to produce these films by vapour deposition.
New precursors for use by CVD are produced to improve on the deposition
characteristics of existing precursors, such as the morphology and function of the
deposited film. When designing precursors it is imperative that they are volatile and do
not decompose considerably before deposition. A primary method by which to
characterize volatility vs. decomposition of potential precursors is thermogravimetric
analysis (TGA). This apparatus measures a mass loss over a programmed temperature
sequence. It affords important data on thermally induced volatilization and possible
decomposition. Unfortunately this method does not directly allow identification of the
volatile species or decomposition products.
The determination of products and rates of decomposition in precursor design is
important in current vapour deposition chemistry, particularly in the fields of (CVD) and
(ALD).33
Products of decomposition can give important information about the

9
mechanism through which a precursor could react with a surface. This information can
help deduce reaction byproduct(s) that are most likely to form at particular temperatures
and is very useful when coupled with surface exposure experiments.34
The acquisition of
rates can help further characterize precursor stability at particular temperatures, and help
find proper handling temperatures if a precursor is deemed viable. Herein thermolysis
methods are described that help determine decomposition products and kinetics of
decomposition via solution based NMR techniques.
Products of the decomposition of ALD/CVD precursors can typically be observed
via 1H NMR. Flame-sealed NMR tubes with a known concentration of precursor in
deuterated benzene are placed in an oven. Rates can be obtained by following these
decomposition products of thermal reactions for weeks or even months by 1H NMR. The
intensity of the corresponding peaks can be integrated to determine concentration with
respect to time. Although solution based methods are not always truly indicative of gas
phase reactions because they are fundamentally different thermodynamic systems, results
from these experiments aid in the determination of rates and products. This method has
the potential to yield very useful results in the field of precursor design for vapour
deposition.
2.1.1 Ligand Design
Much work has previously gone into fabrication of the iminopyrrolidinate ligands
used herein.33
This work examined decomposition pathways of copper precursors and
led to precursors of greater thermal stability. Both copper guanidinate and amidinate

10
precursors have shown to decompose through two similar pathways: either through
carbodiimide deisertion or by abstraction of the ligand’s β-hydrogen by the metal center35
(Figure 2.1.1). Solution based NMR studies of gold amindinate precursors show
carbodiimide deinsertion (CDI) but parent compounds (amindinate ligand) do not.35
This
indicates that gold amidinates thermally decompose to the carbodiimide and not through
some intermediate. Calculations show this is not intuitive as more energy is required to
break a C-C bond rather than a N-C bond.36
The guanidinate family of ligands in these
solution NMR studies show products of de-insertion as well as non-oxidised parent
ligand.36
It should be noted that CDI products may be due to further decomposition of
the product of β-hydrogen abstraction which adds a level of complexity to interpretation
of thermolysis results. When the bridgehead moiety of the ligand is dimethyl amine, no
CDI products are seen by this method in either gold or silver analogues.36
Gas-phase
experiments with time-of-flight mass spectroscopy coupled with matrix isolation FTIR
show the dominant thermolysis species of gold dimethyl amine guanidinate as oxidised
ligand35
. This would follow the of β-hydrogen abstraction pathway. This particular
guanidinate affords improved thermal stability through the elimination of the
carbodiimide deisertion thermolysis pathway and lead to the formation of a new set of
precursors whereby the β-hydrogens were eliminated.

11
Figure 2.1.1: Known thermolysis routes for copper guanidinates (amidinates follow similar
pathways).
New precursors of iminopyrrolidinates, lacking β-hydrogens gave excellent
thermal stability.37
By TGA the residual mass of copper tert-butyl-imino-2,2-
dimethylpyrrolidinate in each trace of greater mass was below 2% while solution 1H
NMR studies showed no appreciable deterioration at 165°C after 21 days.38
This
particular iminopyrrolidinate did not exhibit thermolysis by β-hydrogen abstraction, but
underwent another mechanism of alkene elimination from the chelating nitrogen during
chemisorption after 275°C. This particular precursor was found to be thermally stable to
350°C. 34

12
Iminopyrrolidinate analogues of gold and silver were produced and characterized
by TGA. They did not afford the same thermal stability and decomposed at temperatures
above 170°C. These analogues were found to deposit nanoparticulate films of Ag and Au
by CVD on both silicon and silica slides.38
Characterization to further understand the
thermal characteristics was undertaken by solution NMR, similarly to the amidinates and
guanidinates and described herein.
Along with the characterization of the gold and silver iminopyrrolidinates,
another gold precursor was tested. Work in the field of catalysis has shown copper(I) n-
heterocyclic carbenes (NHC) as thermally stable and led to the production of novel NHC
compounds for vapour deposition of Group 11 metal films.39
A promising copper
carbene precursor, 1,3-diisopropyl-imidazolidin-2-ylidene copper(I) hexamethyldisilazide
demonstrated excellent thermally stability by TGA. It was employed as a precursor
whereby nanoparticulate films were produced by plasma-assisted ALD.40
Because of the
success of this precursor in the deposition of copper films a gold analogue was
synthesized. This work also describes the solution based NMR of 1,3-diisopropyl-
imidazolidin-2-ylidene gold(I) hexamethyldisilazide.
2.2 Experimental Design
2.2.1 Precursors
Three different precursors (Figure 2.2.1) were examined by thermal
decomposition: 1,3-diisopropyl-imidazolidin-2-ylidene gold(I) hexamethyldisilazide

13
(P2Au), gold(I) tert-butyl-imino-2,2-dimethylpyrrolidinate (Auttbip) and silver(I) tert-
butyl-imino-2,2-dimethylpyrrolidinate (Agttbip).
1,3-diisopropyl-imidazolidin-2-
ylidene gold(I)
hexamethyldisilazide
gold(I) tert-butyl-imino-2,2-
dimethylpyrrolidinate
silver(I) tert-butyl-imino-2,2-
dimethylpyrrolidinate
Figure 2.2.1: Precursors used in the thermolysis study, a) P2Au, b)Auttbip, c)
Agttbip
2.2.2 Boil-up Method
These experiments were performed in an inert atmosphere either in a drybox or
with a Schlenk line. Measured amounts of precursor, deuterated benzene and tetramethyl
silane (TMS) were placed in a thick-walled NMR tube. The solution was frozen in liquid
nitrogen and placed under vacuum to below 100 mTorr. The tube was then flame-sealed,
cooled and an initial NMR spectrum taken. For each precursor two tubes were prepared
whereby one was covered in aluminum foil for protection from light. Each tube was
placed in a preheated oven fitted with a 100 W light-bulb. The samples of P2Au and
Auttbip were kept at an oven temp of 100°C, but Agttbip proved to be more robust and
14
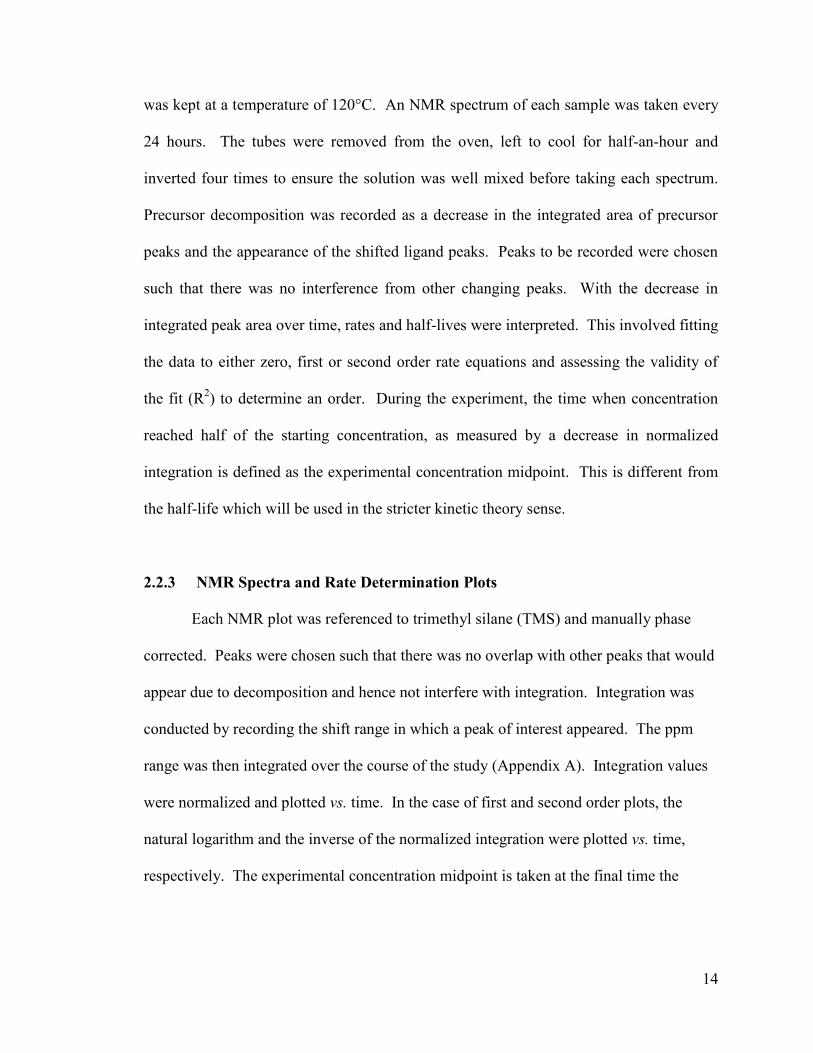
was kept at a temperature of 120°C. An NMR spectrum of each sample was taken every
24 hours. The tubes were removed from the oven, left to cool for half-an-hour and
inverted four times to ensure the solution was well mixed before taking each spectrum.
Precursor decomposition was recorded as a decrease in the integrated area of precursor
peaks and the appearance of the shifted ligand peaks. Peaks to be recorded were chosen
such that there was no interference from other changing peaks. With the decrease in
integrated peak area over time, rates and half-lives were interpreted. This involved fitting
the data to either zero, first or second order rate equations and assessing the validity of
the fit (R2) to determine an order. During the experiment, the time when concentration
reached half of the starting concentration, as measured by a decrease in normalized
integration is defined as the experimental concentration midpoint. This is different from
the half-life which will be used in the stricter kinetic theory sense.
2.2.3 NMR Spectra and Rate Determination Plots
Each NMR plot was referenced to trimethyl silane (TMS) and manually phase
corrected. Peaks were chosen such that there was no overlap with other peaks that would
appear due to decomposition and hence not interfere with integration. Integration was
conducted by recording the shift range in which a peak of interest appeared. The ppm
range was then integrated over the course of the study (Appendix A). Integration values
were normalized and plotted vs. time. In the case of first and second order plots, the
natural logarithm and the inverse of the normalized integration were plotted vs. time,
respectively. The experimental concentration midpoint is taken at the final time the

15
concentration is decreases below half of the initial concentration and no longer increases
above half of the initial concentration.
The concentrations of the metal precursors are; P2Au: 8.3mM, Auttbip: 1.8mM,
Agttbip: 1.6mM. Each sample was diluted in deuterated benzene NMR solvent. For the
kinetics calculations, each concentration was normalized to 1 through integration of
peaks with the first NMR spectra.
Figure 2.2.2: Example of P2Au decomposition over time. Decomposition is monitored by
following peak intensity over time via 1H NMR spectroscopy.

16
2.3 Results and Discussion
2.3.1 P2Au
The concentration of both ‘light’ and ‘dark’ samples was 8.3 mM. The septet
peak of the methine proton for the precursor, P2Au, was use to trace decomposition over
time (Figure 2.2.2). No other peaks were viable since decomposition lead to many
product peaks that interfered with integration. Decomposition data was taken over 31
days for the sample exposed to light and 38 days for the covered sample. This is because
the sample covered in aluminum foil took longer to decompose. The sample covered in
aluminum foil had a longer observed experimental concentration midpoint of 22 days
compared to the uncovered sample which was 12.5 days. Both samples plated-out a gold
film which grew over time on the inside of the NMR tube. Characteristic to this
experiment only, protection from light produced data sets that fluctuated less than those
exposed to light.
From Table 2.3.1 it appears that the first-order approximation for thermolysis of
P2Au when exposed to light is most valid. There was a great degree of fluctuation in
the data, particularly in the first few data points for the illuminated sample (Figure 2.3.1).
This is represented by the greatest fit parameter and corroborated by the experimental
midpoint matching closely with the half-life associated with first-order decomposition
kinetics. When protected from light the kinetic data is slightly ambiguous as the linear fit
parameter for first and second order kinetics are similar (Table 2.3.2). The calculated
half-life for the zero-order assumption matches more closely to the experimental
concentration midpoint.

17
Assigning first-order to the exposed sample and zero-order to the protected
sample is not necessarily contradictory or problematic. Gold atoms have a large atomic
radius, possess a low electronegativity and are thus easily polarizable. Therefore light
may provide enough energy to weaken these bonds through oscillation, depending on the
bond strength of ligands. It would appear that this compound is particularly sensitive to
light as the experimental concentration midpoint of the exposed sample (300 h) occurs
much sooner than the protected sample (525 h). It is expected that the light-induced
acceleration would taper off as metal plates out on the walls and eventually prevent
further interaction with light. This would make the reaction appear to take on first order
kinetics.
Along with the precursor, the carbene ligand appears to undergo thermolysis as
well. This is seen in the NMR spectra of the decomposing precursor (Appendix A,
Figure 4.9.1). There are a number of small peaks that appear over time that suggest that
the carbene is not free in solution, but decomposing. The number of peaks makes
identification of the carbene products difficult. The protonated HMDS ligand however
remains intact and appears slightly downfield to the TMS signal. Also, attempting to
monitor ratios of the growing products to the starting material is not entirely viable due to
overlap.

18
2.3.2 P2Au - Summary Conclusions
The sample of P2Au exhibited first-order decomposition when exposed to light
and zero-order decomposition when protected from light. This is indicated by highest fit
parameter and their consequent half-life values matching more closely to the experiment.
The order change is suspected to be due to the interaction with light on the Au-ligand
system. This is shown as the experimental concentration midpoints of the samples differ
greatly and the protected sample takes 200 h longer than the exposed sample. The first-
order decomposition of the exposed sample is likely due to accelerated decomposition by
light. This is eventually prevented as gold coats the walls.

19
P2Au exposed to light
P2Au Protected from light
Figure 2.3.1: Fit parameters for the determination of order of decomposition for P2Au.

20
Table 2.3.1: Order determination by fit parameters of P2Au when exposed to light.
Peak(ppm) septet
Order(R2) zero
(0.8863)
first
(0.9564)
second
(0.9059)
rate, k 0.0011 mM/s 0.0030/s 0.0106/mMs
t1/2,
theoretical
455 h 231 h 94 h
Experimental
midpoint
300 h 300 h 300 h
Table 2.3.2: Order determination by fit parameters of P2Au when protected from light.
Peak(ppm) septet
Order(R2) zero
(0.9654)
first
(0.9437)
second
(0.8855)
rate, k 0.0009 mM/s 0.0016/s 0.0033/mMs
t1/2,
theoretical
555 h 433 h 303 h
Experimental
midpoint
525 h 525 h 525 h

21
2.3.3 Agttbip
Two samples of Agttbip were prepared as above with a concentration of 7.8 mM.
For each sample two unadulterated NMR peaks (triplets at 2.55 ppm and 1.66 ppm) were
integrated over time to find the order of decomposition. They correspond to protons on
the backbone of the pyrrolidine ring. For the exposed sample, data was taken over a
period of 22 days. After this period the normalized peak integrations for the triplet peak
reached zero and the singlet peak stabilized around 0.1. Data for the protected sample
was recorded over 25 days. The normalized peak integration values never reached zero,
but began to fluctuate around 0.3 for each sample. Both triplets from the sample exposed
to light had an experimental concentration midpoint of about 12 days. This thermolysis
study was carried out at 120°C.
With the exposed sample, the graphs of both NMR peaks of both samples follow
the same trend. They both tend towards a zero-order rate of decomposition (Tables 2.3.3,
2.3.4). This is shown as the graphs of concentration vs. time have the fit parameters
which are considerably higher than the others. Unfortunately the fluctuation in the data
given by both triplet peaks does not yield great precision with the fit parameters
significantly below unity. Further indication of zero-order decomposition is attained
from the calculated half-lives. The half-life value calculated from the zero-order rate
approximation closely matches that of the experimental midpoint concentration. This is
true for both triplet NMR peaks in the sample.

22
For the sample that was protected from light, the data from the monitored triplet
peaks does not yield confident linear fit parameters. However, the trend that both
monitored peaks exhibit is similar to the exposed sample. The triplet at 2.55 ppm
indicates first-order decomposition kinetics with the greatest fit parameter value (R2 =
0.8087). This also produces a half-life value (19 d) that was closer to the experimental
concentration midpoint. Unfortunately the calculated value is still about 50% longer than
observed in the experiment. Although the confidence is poor in the first-order
assumption, the other plots yield data that is considerably worse.
The triplet at 1.66 ppm similarly indicates zero-order decomposition with
comparable confidence. The linear fit parameter value (R2 = 0.7912) is slightly lower
than for the triplet at 2.55ppm (R2 = 0.8087), but the calculated half-life is identical (19
d). Again the poor confidence in the zero-order assumption is boosted by the much
poorer data for the other kinetic assumptions.
The products of decomposition for both samples of Agttbip is protonated ligand.
There were no significant peaks in the NMR spectra that indicated other decomposition
products. The mechanism through which the precursor deposits silver on the tube wall is
not known. It is believed that there is a reaction with the silanol moieties on the glass
tube where the ligand exchanges the metal center with silanol hydrogens. The zero-order
rate likely arises from a high stability and an indifference to react with either the glass
NMR tube walls or the subsequent silver film. This also indicates a single thermolysis

23
pathway when either protected from light or when exposed, both requiring a temperature
of 120°C and available protons in solution.
Similar protons in similar chemical environments should lead to similar
conclusions regarding this experimental thermolysis. This is supported as monitored
peaks in within a sample are in close proximity and display the same trend in
decomposition order and calculated half-life. What is also evident is that light plays a
negligible role in the decomposition of this precursor. The experimental concentration
midpoints of either sample are close to each other, with the exposed sample decomposing
about one day faster. Even though the covered sample does not reach a zero
concentration decomposition appears to taper-off.
2.3.4 Agttbip - Summary Conclusions
All monitored peaks in both samples lead to the assumption of zero-order
decomposition kinetics (Figures 2.3.3, 2.3.4). The exposed sample had best confidence
with greater linear fit and half-life values closely matching the experimental
concentration midpoints. The covered sample does not share the same high confidence in
linear fit and calculated half-life values, but the trend in the data set indicates the same
zero-order decomposition kinetics. In this experiment the exposed sample decomposes
slightly faster than the protected, but does not greatly influence its decomposition. The
main products of decomposition are identifiable as protonated ligand. It is hypothesized

24
reduction is occurring with protons that originate from silanol moieties on the NMR tube
wall. This is evident as metallic films are seen growing over time.

25
Exposed to light
Protected from light
Figure 2.3.2: Linear fit graphs for the determination of order of decomposition for Agttbip by
triplet at 2.55 ppm.
26
Exposed to light
Protected from light
Figure 2.3.3: Linear fit graphs for the determination of order of decomposition for Agttbip by
triplet at 1.66 ppm.

27
a)
b)
Table 2.3.3: Summary of order determination by linear fit of Agttbip from triplet at 2.55 ppm
when a) exposed to light and b) protected to light.
Agttbip Exposed to Light
Peak(ppm) Triplet 2.55 ppm
Order(R2) zero
(0.9590)
first
(0.7656)
second
(0.3553)
rate, k 0.0021 mM/s 0.0069/s 0.0796/mMs
t1/2,
theoretical
238 h 100 h 13 h
Experimental
midpoint
290 h 290 h 290 h
Agttbip Protected from Light
Peak(ppm) Triplet at 2.55 ppm
Order(R2) zero
(0.8087)
first
(0.0123)
second
(0.0217)
rate, k 0.0011 mM/s 0.0004/s 0.0009/mMs
t1/2,
theoretical
455 h 1733 h 1111 h
Experimental
midpoint
260 h 260 h 260 h

28
a)
b)
Table 2.3.4: Summary of order determination by linear fit of Agttbip from triplet at 1.66 ppm
when a) exposed to light and b) protected to light.
Agttbip Exposed to Light
Peak(ppm) Triplet 1.66 ppm
Order(R2) zero
(0.9505)
first
(0.8699)
second
(0.6889)
rate, k 0.0020 mM/s 0.0046/s 0.0162/mMs
t1/2,
theoretical
250 h 151 h 62 h
Experimental
midpoint
290 h 290 h 286 h
Agttbip Protected from Light
Peak(ppm) Triplet 1.66 ppm
Order(R2) Zero
(0.7912)
first
(0.0452)
second
(0.0037)
rate, k 0.0011 mM/s 0.0007/s 0.0003/mMs
t1/2,
theoretical
455 h 990 h 3333 h
Experimental
midpoint
290 h 290 h 290 h

29
2.3.5 Auttbip
Monitoring decomposition was achieved by following the most deshielded triplet
peak from the pyrrol back bone and the singlet from the t-butyl group. Both triplets were
not used as the signal from products of decomposition, i.e. protonated ligand, interfered
with signal from the most shielded triplet. Similar to Agttbip, the products of
decomposition for both samples of Auttbip is protonated ligand. The mechanism is also
believed to require reaction with silanol moieties on the glass tube wall. For 15 days the
exposed sample was monitored before normalized integration values were calculated as
being negative. This is due to integration close to the baseline. These negative values
were not used in the rate-determining plots. The covered sample was monitored for 26
days, after which the normalized integration value did not yet reach zero. Unfortunately
the covered sample displayed large fluctuations which made kinetic decomposition order
assumptions difficult. The initial concentration was calculated to be 1.8mmol/L and
decomposition proceeded at a temperature of 100°C. Both NMR peaks indicate an
observed experimental concentration midpoint of 24 hours and gold metal was observed
plating out on the walls of the NMR tube.
The exposed sample shows strong first-order decomposition with respect to the
triplet peak. It has the largest fit parameter and is considerable greater than the other rate
assumptions (Table 2.3.5). The calculated half-life is more than twice the experimental
concentration midpoint, but again matches better than the others. Oddly this is not
corroborated with the monitored singlet peak. Considering the fit parameters for the

30
singlet when exposed to light, the second-order assumption has a slightly better fit (Table
2.3.6). The corresponding calculated half-lives again show a better fit for the second
order assumption as it very closely matches the experimental value. The mismatch
between the decomposition rates determined from these peaks does not necessarily mean
that one is incorrect. This data may indicate a decomposition mechanism that is complex.
With the samples that were protected from light the data set does not give much
confidence. The entire set of points in each rate assumption yields very poor linear fit
values and half-lives that are an order of magnitude larger than experimental observations
(Appendix B, Figure 4.9.4). The graphs strongly indicate an initial uniform
decomposition which begins to taper-off after an inflection at 120 h to decompose at a
much slower rate. This diminishing rate is not observed as significantly in other samples.
It could be assumed that as gold plates-out on the NMR tube, reactive surface hydroxyl
sites are being removed. This is effectively removing a reactive species from solution.
In this case the second order rate would be that of Auttbip reacting with the walls of the
NMR tube and not of the precursor’s decomposition. The following decay may be more
indicative of decomposition of only precursor, but the great fluctuation in these data
points makes that rate determination difficult.
Considering only the data before the inflection point (120 h), the graphs strongly
indicate second order decomposition in in both monitored peaks of the sample protected
from light (Tables 2.3.5, 2.3.6). The triplet peak has highest fit parameter (R2 =0.9872)
in second-order. The calculated half-life of 50 h is closest to experimental, but still about

31
twice as long. Linear fit parameters for the singlet (R2 =0.8334) and its half-life (63 h)
are not as confident, but imply the same second-order rate.
The sample that was exposed to light exhibited different decomposition orders
between peaks: first-order in the triplet peak and second-order in the singlet. Integration
of theses peaks approached closely to zero concentration with the singlet still indicating
about 5% remaining. For the covered sample, the decomposition was second-order in
both peaks and each did not reach zero concentration even after 26 days. Although the
half-life of each sample was similar, the samples that were exposed to light decomposed
to a greater extent in 15 days. Therefore light must provide additional energy for the
compounds to decompose/deposit gold on the walls of the NMR-tube. It then follows
that there is greater selectivity to deposit on glass than on gold film or the ligand does not
dissociate from the gold film when protected from light. With these assumptions it is
likely that the decomposition rate found by the triplet exposed to light may actually be
pseudo-first order. This is because the energy barrier preventing deposition can be
overcome therefore continually producing a surface to deposit.
2.3.6 Auttbip - Summary Conclusions
The order of decomposition found from the exposed sample was first-order in the
triplet peak and second-order in the singlet. The experimental concentration midpoint
was at 24 h. The calculated half-life for the triplet is 55 h while the singlet is 21 h. The
second order rate yields a half-life that is much closer to experimental. It is believed that
the rate found for the triplet peak is actually pseudo-first due to the accelerated and near

32
complete decomposition caused by interaction with light. The sample that was protected
from light exhibited second-order decomposition in both peaks. After removing highly
fluctuating data near the end of the plots, the data produce stronger second-order
assumption with half-lives that more closely match experimental concentration
midpoints. The rate slowed with removal of the reactive surface sites on the walls as
gold plated out. It is also possible that, under these conditions, gold has a greater
selectivity for depositing on glass walls than on the gold film or that, upon gold metal
deposition, the ligand does not leave the gold surface. The major decomposition product
is protonated ligand, which is believed to be from reaction with silanol moieties on the
tube walls, similar to Agttbip. The cause of the significant fluctuation in the data points
is unknown. The experimental midpoint of concentration is similar for both light and
dark samples.

33
Exposed to light 2.55 t
Protected from light 2.55 t
Figure 2.3.4: Linear fit graphs for the determination of order of decomposition for Auttbip by
triplet at 2.55 ppm.

34
Exposed to light 1.33 s
Protected from light 1.33 s
Figure 2.3.5: Linear fit graphs for the determination of order of decomposition for Auttbip by
triplet at 1.33 ppm.

35
a)
b)
Table 2.3.5: Summary of order determination by linear fit of Auttbip from triplet at 2.55 ppm
when a) exposed to light and b) protected to light.
Auttbip Exposed to Light
Peak(ppm) Triplet 2.55 ppm
Order(R2) Zero
(0.5995)
First
(0.9686)
Second
(0.5612)
rate, k 0.0062 mM/s 0.0141/s 0.0396/mMs
t1/2,
theoretical
278 h 55 h 2 h
Experimental
midpoint
24 h 24 h 24 h
Auttbip protected from Light
Peak(ppm) Triplet 2.55 ppm
Order(R2) Zero
(0.6775)
first
(0.8113)
second
(0.9872)
rate, k 0.0049 mM/s 0.0093/s 0.015/mMs
t1/2,
theoretical
102 h 76 h 67 h
Experimental
midpoint
24 h 24 h 24 h

36
a)
b)
Table 2.3.6: Summary of order determination by linear fit of Auttbip from singlet at 1.33 ppm
when a) exposed to light and b) protected to light.
Auttbip Exposed to Light
Peak(ppm) Singlet 1.33 ppm
Order(R2) Zero
(0.5896)
first
(0.9297)
second
(0.9691)
rate, k 0.0060 mM/s 0.0131/s 0.0345/mMs
t1/2,
theoretical
294 h 98 h 21 h
Experimental
midpoint
24 h 24 h 24 h
Auttbip protected from Light
Peak(ppm) Singlet 1.33 ppm
Order(R2) Zero
(0.6166)
first
(0.7222)
second
(0.8334)
rate, k 0.0045 mM/s 0.0081/s 0.0160/mMs
t1/2,
theoretical
111 h 86 h 63 h
Experimental
midpoint
24 h 24 h 24 h

37
2.4 Conclusions
For P2Au exposure to light increases the decomposition rate in the monitored
peak and is found to be first-order. This is exhibited as a large difference in the half-life
of illuminated P2Au which is 200 h shorter in experimental data and 324 h shorter in the
fitted data. The decomposition of P2Au when protected from light is found to be zero-
order as the rate does not change when decomposing on the walls of the NMR tube or on
the subsequent gold film. Illuminating the sample appears to quicken decomposition.
This occurs to the point where the NMR tube walls are covered with a gold film and light
can no longer interact with the solution. The rate then slows which produces a graph that
appears first-order. This indicates that decomposition begins on the NMR tube wall.
After saturation of silanol surface sites, the rate is determined by deposition of gold on
gold and/or removal of physisorbed precursor.
The silver precursor shows zero-order decomposition in all peaks and both
exposed/covered environments. This is seen as the highest linear fit parameter is for the
zero-order plots. There is a doubling in the rate of thermolysis when the sample is
exposed to light in both peaks in the fitted data. The experimental data does not wholly
corroborate this because the fluctuation in the data does not provide much precision when
determining the time for the experimental midpoint concentration. The rate order has
similar implications as P2Au whereby reduction at a surface is the rate limiting step and
there is no noticeable selectivity between glass and silver surfaces. The only substantial
product shown in NMR is protonated ligand.

38
The decomposition of Auttbip is second-order. This is observed in both peaks
when protected from light, but only one peak when exposed. Auttbip shows a three-fold
increase in decomposition rate with respect to the singlet. The triplet peak of Auttbip
also indicates faster thermolysis when illuminated but because of the rate difference they
cannot be objectively compared. The calculated half-life also shortens with the
illuminated sample. Comparable to the silver analogue, the experimental concentration
midpoint is not precise because of fluctuating data points. As light hastens
decomposition it also provides enough energy to almost complete decomposition. This
affects the calculated rate such that the triplet peak appears first order. The singlet peak
is also affected as there is less difference between first and second order assumptions.
The second-order rate must be caused by reaction with particular surface sites on the wall
of the NMR tube. The rate slows as it is dependent on the decreasing population of glass
surface sites. The ligand either does not dissociate from the surface or there exists
selectivity towards glass over the growing gold film.
Under these conditions the order of reactivity determined by decomposition time
for the gold precursors is: Agttbip < P2Au < Auttbip. Agttbip required a higher
temperature of 120°C before significant decomposition was observed. The fitted data
indicates that light accelerates decomposition of each precursor. The ttbip ligand
displays greater stability in solution than the carbene as the only discernable product in
the NMR of P2Au is the protonated HMDS ligand. The appearance of protonated ligand
in both iminopyrrolidinates must be due to reaction with silanol groups on the glass NMR
tube walls. The exact mechanism of this reaction is unknown.

39
3 Chapter: CVD of Antimony Containing Films
Antimony (III) oxide is used as a catalyst in the manufacturing of plastics41
and a
favourable component in fire retardant material.42
Antimony has found much use in V-
VI semiconductors such as Sb2Te3 films and wires which have desirable thermoelectric
properties.43
Other such semiconductor alloys of Sb2S3 and Sb2Se3 exhibit band gap
values that make them suitable for photovoltaic devices.44
Interest in transparent
conducting oxides has led to studying films of tin oxides doped with antimony by both
solution45
and vapour deposition methods.46
Antimony is shown to improve electrical
properties when used as a dopant in tin oxide as well as increasing the film’s physical
stability.47
Although routes to produce antimony containing thin films exist,48,49
other
potential antimony precursors may provide better deposition characteristics. These
characteristics could be lower temperature deposition, production of different crystalline
phases or perhaps films of fewer impurities. Two potential precursors were obtained
from the Burford Group from the University of Victoria;50
1 trichlorobistrimethyl
phosphine antimony (III) (Figure 2.4.1) and 2 trichlorotristrimethyl phosphine antimony
(III) (Figure 2.4.2). By XRD 1 is a networked solid while 2 is a crystalline powder.

40
Figure 2.4.1: 1, trichloro trimethyl phosphine
antimony(III)
Figure 2.4.2: 2, trichloro bistrimethyl
phosphine antimony(III)
3.1 Thermogravimetric Analysis
3.1.1 Experimental
Thermogravimetric analysis is a technique whereby mass loss is measured against
an increase in temperature. A mass of sample was placed on a tarred TGA pan. An auto-
sampler places the sample and pan on the balance which is enclosed by a furnace. The
furnace is then ramped at a rate of 10°C/min up to a temperature of 400°C. The mass
loss of sample is plotted against temperature. The program controlling the TGA and
recording data also calculates the derivative curve for the data. Volatility is taken as the
temperature where 0.5% mass is lost.
This method aids the development of volatile precursors with greater thermal
stability. By testing families of ligands on a metal center one can select a precursor with
sufficient volatility and stability. The same experiment has been employed to select the
ligands used in the previous chapter. Copper tertbutyl-imino-2,2-dimethylpyrrolidinate
proved to be more robust than others tested with a residual mass close to zero and no
increase in residual mass with greater initial mass loading.34
This lead to the silver and

41
gold analogues which displayed greater residual mass, but produced their respective films
by CVD.38
Furthermore, the copper equivalent of P2Au (1,3-diisopropyl-imidazolidin-2-
ylidene copper(I) hexamethyldisilazide) displayed a lower residual mass than a similar,
but unsaturated compound. The P2Cu precursor was able to produce films by plasma
enhanced ALD while the unsaturated compound did not.
Figure 3.1.1: Mass loss vs. temperature of 1 by TGA
0
10
20
30
40
50
60
70
80
90
100
0 100 200 300 400 500
Mas
s (%
)
Temperature(C)
A (8 mg)
B (21 mg)
C (37 mg)
D (43 mg)

42
Figure 3.1.2: Mass loss vs. temperature of 2 by TGA
3.1.2 Results and Discussion
Preliminary results by TGA were promising for both 1 and 2 as CVD precursors.
Each compound volatilized in a single event shown as a smooth curve in the TGA plot
(Figures 3.1.1, 3.1.2). The residual mass can serve to indicate whether the thermal event
is either volatility or decomposition. A zero residual mass suggests the precursor is
wholly volatile, while any other mass can indicate decomposition. A precursor is most
unsuitable when the residual mass obtained is on the order of the percent mass of the
metal intended for deposition. This suggests that the metal-containing species itself is not
volatile and the metal is left behind not able to volatilize. For each of the trials of 1 and 2
the residual mass is below the atomic percent of antimony in either precursor. This
indicates that the thermal event includes volatility of the metal center. Also, 2 displays a
0
10
20
30
40
50
60
70
80
90
100
0 100 200 300 400 500
Mas
s (%
)
Termperature
A (8 mg)
B (24 mg)
C (33 mg)
D (48 mg)

43
slower onset of mass loss as seen by the gradual slope of 2 (Figure 3.3.2) vs. that of 1
(Figure 3.3.1). This shows that volatilization of 2 has greater sensitivity to the
temperature ramp and therefore may afford greater control of volatilization with
temperature.
Performing multiple trials with increasing mass also helps determine thermal
stability. Since the temperature is ramped at a constant rate, greater initial sample masses
lead to more of the sample being exposed to higher temperatures for both compounds.
The TGA traces show an increase in remaining mass with increasing sample weight,
which is undesirable (Figure 3.1.4). This means that a greater percent of the initial
precursor sample will decompose at higher temperature when using a higher sample
mass. The trend for both compounds is similar, but the increase in residual mass of 2 is
not as great at higher temperatures. The greatest amount of 2, (46.69304 mg) shows a
residual mass of 4.8%; while a lower mass of 1(42.60509 mg) produced a larger residual
mass of 5.8%. This would suggest 2 is a better candidate for deposition because of its
lower residual mass. Figure 3.1.3 shows the onset of volatility of 2 for higher mass
loadings occurs at lower temperatures than for 1. The lower onset is beneficial as less
temperature is required for volatilization.

44
Figure 3.1.3: Onset of volatility for compounds 1, and 2.
Figure 3.1.4: Residual mass from TGA trials with different mass loadings.
70
80
90
100
110
120
130
0 10 20 30 40 50
Tem
pe
ratu
re (
°C)
Starting Mass (mg)
Onset of Volatility (0.5% mass loss)
1
2
0
1
2
3
4
5
6
7
0 10 20 30 40 50 60
Re
sid
ual
mas
s (%
)
Starting Mass (mg)
Residual mass
1
2

45
Figure 3.1.5 and 3.1.6 are graphs of the derivative of mass loss (with respect to
temperature) vs. temperature. The derivative of weight change curves of 1 can indicate
fragmentation or multi-step decomposition, highlighted as inflections or additional,
shallow peaks in these higher-order curves. Inspection of Figure 3.1.5 shows inflection
points before and after the absolute max for all curves becoming more pronounced with
larger mass samples. This is with exception to the lowest mass loading as it is quite small
and there is expected to be more uncertainty in its measurement. One can see upon
comparison, the graph of precursor 2 (Figure 3.1.6) also has inflection points near the
beginning of the traces, but appears smoother and decreases smoothly to zero after the
absolute maximum. The trace demonstrates the potential of 2 as a more suitable
precursor. Greater masses of 2 give similarly smooth traces and relates to a greater
thermal stability. As more of 2 is exposed to higher heat the thermal profile remains
since additional peaks do not appear. Additional peaks would suggest occurrence of a
different thermal event. This is not the case with 1 which exhibits change in curve shape
with greater sample masses.

46
Figure 3.1.5: Derivative of weight change for 1
Figure 3.1.6: Derivative of weight change for 2
0.0
0.5
1.0
1.5
2.0
2.5
3.0
25 125 225 325 425
Der
ivat
ive
Wei
ght
(%/°
C)
Temperature (°C)
A (8 mg)
B (18 mg)
C (37 mg)
D (43 mg)
-0.5
0.0
0.5
1.0
1.5
2.0
2.5
3.0
0 100 200 300 400
Der
ivat
ive
Wei
ght
(%/°
C)
Temperature (°C)
A (8 mg)
B (24 mg)
C (33 mg)
D (48 mg)

47
These precursors do not exhibit the excellent stability seen in previously
developed precursors of copper.40
However gold and silver precursors have displayed
greater residual mass and been used for successful deposition.38
The experiment with
antimony compounds 1 and 2 indicate fundamental properties that give the possibility of
a successful and more easily handled candidate for deposition. The residual mass from
both antimony compounds is below the atomic percent of antimony in the compound.
This indicated that some antimony is thermally promoted to the gas phase allowing for
transport to the deposition chamber. This along with the smooth derivative curve of 2
expresses the compounds thermal stability as it volatilizes in a single event with greater
mass.
3.2 CVD trials
3.2.1 Experimental
The CVD trials were performed both with and without entrainment of moist air.
Both experimental designs are depicted in Figure 3.2.1. A Variac potentiometer was used
to control heating tape to resistively heat the precursor container, or bubbler, through the
use of heating tape. The heating tape was wrapped around the bubbler while an attached
thermocouple was used to monitor its temperature. The deposition chamber was a steel
tube within a tube-furnace. The temperature of the tube-furnace was monitored by the
output on the furnace as well as a secondary thermocouple connected to the center of the
tube. It was found that with a bubbler temperature of 100°C much of the starting
precursor material was volatilized. Although no repeatable deposition was obtained, the

48
white film deposition was routinely found at furnace temperatures between 300°C and
400°C. Moist air was introduced by attaching a tube from a Schlenk adaptor of a 500 mL
round-bottom Schlenk flask to the bubbler. The round bottom flask was filled half-way
with distilled water and a rubber septum capped the round-bottom flask (Figure 3.2.1). A
metal needle was pierced through the rubber septum so that its tip was below the water
line. With the inclusion of moist air there was an attempt to keep the pressure around 100
mTorr through the Schlenk valve of the round-bottom and a ball valve between the
round-bottom and bubbler. Otherwise the system was reduced to below 10 mTorr by an
Edwards rotovane pump. Substrates in these trials consisted of glass and silicon slides
placed side by side, or just one of these substrates. Slides were prepared by sonicating in
isopropyl alcohol for thirty minutes, rinsing with deionized water and being placed in a
(4:1 of H2SO4:H2O2) piranha solution for twenty minutes. The slides were then rinsed
with deionized water, then hexanes and left in a 110°C oven until further use. The tube
furnace and slides were preheated to deposition temperature under low flow of nitrogen.
A measured amount of precursor in a vial was prepared in a dry box and quickly placed
in the attached bubbler under low flow of nitrogen. Heating tape was wrapped around the
bubbler, fixed with a type K thermocouple and the system placed under vacuum. The
trial began by quickly heating the bubbler to the selected temperature.

49
3.2.2 Results and Discussion for CVD Trials of 1
There were 10 CVD trials using 1 (Figure 3.2.1). Trials 5 thorough 9 produced a
deposition on the bottom of glass and silicon slides with moist air and without. Within
these trials slides closest to the bubbler showed evidence of some deposition. A white
film that was easily removed was observed only on glass slides placed close to the
bubbler while silicon slides appeared discoloured (Figure 3.2.2). This white film was
characterized for composition by EDX for trial 9 (Figure 3.2.3). The EDX spectrum
shows an amount of antimony that is less than 10% of the composition of the film. The
majority of the film was copper and chlorine. The chlorine content is likely precursor
contamination: 30% by mass of either compound. The copper seen by EDX is an artifact
originating from inadequate cleaning of the aluminum slide-holder which was used in a
previous deposition using a copper precursor.
Figure 3.2.1: CVD apparatus design.

50
Table 3.2.1: CVD trials attempted with precursor 1
Figure 3.2.2: Deposition on the bottom of Si and white deposition on glass slide

51
An atypical deposition was found after CVD trial 5. A silicon slide that was left
in the deposition chamber for CVD trials 3, 4 and 5 produced a rainbow pattern as seen in
Figure 3.2.4a. This slide likely fell off the slide-holder an onto the tube furnace during
trial 3. The rainbow-coloured deposit was characterized by SEM and EDX, Figure 3.2.4b
and 3.2.4c, respectively. Compositional analysis by EDX indicates a film of mainly
antimony with significant amounts of chlorine and oxygen. The SEM image shows
growth that is not continuous and appears to be island-like. The size and structure of the
deposits are unknown. The slide in Figure 3.2.4a had been exposed to multiple
experiments and displayed characteristics of a successful deposition. After the discovery
of this slide the amount of precursor used during deposition trials was thought to be too
low. This was further explored during depositions of 2.

52
Figure 3.2.3: composition of white film on glass slide from experiment CVD9

53
A)
B)
C)
Figure 3.2.4: a) Silicon slide after three consecutive CVD depositions of trial 3, 4 and 5 with 1; b)
SEM image of deposition; c)EDX compositional analysis of film.

54
3.2.3 Results and Discussion for CVD Trials of 2
Using deposition parameters similar to 1, CVD was attempted with compound 2.
These trials can be seen in Table 3.2.2. During these trials the amount of precursor was
increased to see if it would improve coverage. Unfortunately only 4 trials were
performed, of which only one trial produced a deposition seen in Figure 3.2.5. The slide
with the exhibited deposition was closest to the bubbler, as in the trials for 1.
Conversely, the area of deposition on this slide was furthest from the bubbler. This
deposition was not characterized.
Table 3.2.2: CVD trials of 2
Figure 3.2.5: Silicon slide after experiment CVD13 with 2

55
3.3 Conclusion
According to TGA traces, the thermally driven volatilization of compounds 1 and
2 show results that are acceptable for CVD precursors. They seemingly volatilize in a
single step whereby the TGA profile of 2 is most acceptable as it shows a slower onset of
volatilization that begins at a lower temperature. The residual mass gain with increasing
amounts of starting material of 2 is not ideal as it infers some thermal instability. This
can be acceptable as is appears that most of either compound is volatilizing and
successful depositions have occurred with precursors with much greater residual masses.
After multiple CVD trials these compounds have not provided practical nor
repeatable depositions. The white film on glass produced by experiment CVD9 was
characterized by EDX to contain antimony, but in amounts much lower than other
elements such as oxygen or chlorine. Following experiment CVD5 a film was obtained
that spanned most of the slide and contained greatest amount of antimony. This slide was
left in the furnace for trials CVD3-5 and thus did not properly represent film growth
characteristics of 1. Even after multiple trials the film was not continuous and indicated
poor nucleation capabilities on silicon by SEM. The inclusion of moist air did not aid in
producing any film with either precursor.
Through these trials, compounds 1 and 2 have not provided predictable
depositions of continuous films. Films that were produced by these compounds and
characterized exhibited high concentration of impurities, particularly chlorine. The
deposition temperatures used in these experiments may not have been suitable for
56
chemisorption of the antimony-containing precursor. Another possibility for poor film
growth may be a long nucleation delay on glass and silicon substrates. A long nucleation
delay may explain the results for the film recovered after CVD5. These compounds have
not provided film growth characteristics suitable for CVD precursors.

57
4 Chapter: Royal Canadian Mint Contract Work
4.1 Introduction
Work in this area had already been previously established.51
Deposition on
bronze circulation coins was initially achieved using a custom-built ALD tool and a
previously reported aluminum precursor.52
Thicknesses of alumina producing
interference colours were investigated by ellipsometry and film adhesion degradation was
related to cleanliness of the coins. Laminate films of alumina and titania were produced
and a ‘triple pulse’ program (discussed below) was created to increase film uniformity at
250°C. Thicknesses of 1200Å were found to produce coins that were indistinguishable to
uncoated coins by sight and feel. Results from this work were considered throughout the
following experiments.
4.1.1 Alumina
Crystalline alumina is known for its hardness and used as an insulating anti-wear
coating for microelectromechanical systems.53
Processes to grow alumina by ALD have
been explored thoroughly, leading to the benchmark process of trimethyl alumina (TMA)
and water. TMA is an excellent precursor for the deposition of alumina by ALD. It
reacts with water even below room temperature and is a viable ALD precursor until about
300°C.54
At this temperature TMA begins to decompose to carbon-rich aluminum
films.55
Although the film can be made crystalline by annealing the underlying substrate
may not endure the process. In considering the safety aspect of this potentially industrial
method, TMA can pose a high personal risk since it is pyrophoric. But proper handling
can limit this liability and thus industrial processes can exploit the benefits of this well-

58
known process. The high linear growth rate per cycle of alumina and its reproducibility
increases its value in application to industry. Another feature of alumina by ALD is the
low temperature of deposition. Although density is known to decrease with decreasing
temperature, alumina depositions have taken place on plastic substrates at 33°C and do
not deform or destroy this thermally sensitive substrate.56
Alumina ALD is well behaved
and a widely studied system.
The hardness of alumina films is generally characterized by nano-indentation.57
In this technique a particular type of atomic force microscope (AFM) tip made of very
hard material is pressed into the deposited layer. Two common tips are used: a
Berkovich tip, shaped like a three-sided pyramid or Vickers tip, a four-sided pyramid.
Surface displacement is measured against the loading force of the tip. Essentially
nominal hardness is defined as the maximum indentation load divided by the cross-
section area of the indenter at the maximum indentation depth.58
The hardness is
recorded as pressure at which the tip penetrates the surface. Young’s modulus (E) can be
determined from a nanoindentation test with the maximum indentation load and depth,
and the work done during loading and unloading processes.58
One may be able avoid
substrate effects by lowering depth of displacement, whereas some soft substrate effects
can be adjusted for mathematically.59
Very thin films of alumina with thicknesses of only 2-3nm grown on graphene via
TMA and water have exhibited Youngs modulus of 154 GPa.60
Films of 100 nm have
shown to have hardness (H) values of 6.79 GPa with Youngs modulus of 202.7 GPa.59
A

59
2006 literature survey57
identifies a Youngs modulus and nanohardness of 100<E<272
GPa and 8<H<9.6 GPa respectively for evaporated, chemical deposited, and vapor
deposited alumina. A recent study61
specific of ALD Al2O3 identified E and H values of
220 and 10.5 GPa, respectively, using an analytic model to account for the film/substrate
geometry. The modulus for ALD alumina is less than that of bulk because of its
amorphous nature.62
4.1.2 Titania
Deposition of titania is also another well studied process by ALD. A common
precursor is titanium (IV) tetrachloride. This precursor can react with water at reasonable
temperatures to form conformal thin films of titania. Unfortunately, lower temperature
depositions produce chlorine impurities at higher concentrations.63
A chlorine impurity
at as low as 3% can create an electron ‘sink’ and be detrimental to electronic
applications.28
Another disadvantage are hydrochloric byproducts with can corrode metal
substrates as well as the reactor. Another well-known precursor is titanium IV
isopropoxide. It is less thermally stable,64
but the carbon impurities are not corrosive
and better step coverage can be achieved.65
Titania can be deposited as an amorphous film or with crystalline domains of
anatase or rutile. Evidently the temperature range for each phase is also dependent on
precursor, alkoxide based precursors yield amorphous material while crystalline material
is produced at lower temperatures with halide based precursors.65
The phase and
morphology can be controlled by temperature.66
Generally with titanium tetrakis

60
(isopropoxide) (TTIP) and water, below 150°C smooth and continuous amorphous titania
is formed. At 200°C films are remain amorphous but decorated with tiny crystalline
domains of 2-3 nm. At 250°C the layer is rough and bumpy with increased intensity of
different characteristic planes of anatase. As deposited nanoparticles are crystalline and
mostly show anatase.
Other characteristics are controlled by temperature such as the grain size of
crystalline domains decrease with decreasing temperature. This also has an effect on
elastic modulus as it decreases with reduction of grain size. As grain size decreases below
20 nm, there is not a large decrease in elastic modulus. The decrement below grain sizes
about 10 nm, however, is relatively large. 67,27
Porosity of films also plays important part
on elasticity of titania films. Below 20 nm the effect of porosity on elastic modulus is
more dominant than grain size as lower porosity yields greater elastic moduli. The Hall-
Petch relation suggests that the yield strength of a material should increase with
decreasing grain size. 67

61
4.1.3 Corrosion: Mechanical Characteristics of Coating Materials
Note: all studies referenced in this section use titanium (IV) chloride as a titanium
precursor. Because of the corrosive nature of byproducts, it is not suggested as a
precursor to prevent corrosion.
Using ALD to deposit thin films of alumina and titania for protection against
mechanical and chemical attack is not novel. The protection of stainless steel is
important in industry. Studies have shown that ALD layers exhibit corrosion resistance
similar to or even better that conventional or thicker coatings.68
69
70
Alumina films alone show limited protection from chemical attack by
concentrated salt solutions.69
The porosity of alumina can contribute to poor resistance,
but increasing layer thickness decreases porosity.69
Unfortunately increasing layer
thickness also promotes delamination.69
Alumina is amphoteric as it is reactive with both
acid and base. This makes it unsuitable as a primary coating for resistance to this kind of
corrosion.71
An advantage of alumina is that it adheres well to steel substrates and only
shows delamination at higher loads.69
Titaina films of similar thickness to alumina show greater resistance to
concentrated salt solutions.69
Amorphous titania has been shown to afford better
protection than bare steel substrates72
while lower temperature deposition of amorphous
titania contains higher hydroxyl content and does not give greatest corrosion resistance.71

62
The weak points of corrosion for crystalline titania films lie in the grain boundaries and
films of titania do not adhere well to steel as they show higher instances of
delamination.69
Multilayers of both alumina and titania however exhibit corrosion and wear
characteristics that add the benefits of both films. Alumina serves as an adhesion layer
and also fills in grain boundaries of any previous titania deposition. Delamination occurs
to a lesser extent with multilayers. Multilayer films with similar overall thickness, but an
increased number of layers preform even better. Electrochemical corrosion testing also
points to the benefits of multilayers. These studies show better resistance than single
layers and greater amounts of layers with similar thickness yield greatest resistance. 69
4.2 Protection of Numismatic Silver
Silver is a precious metal which oxidizes to Ag2O in air (oxygen radicals) at
standard temperatures and pressures. It also corrodes in air due to the presence of sulfur.
This forms an undesirable black oxide finish that is aesthetically unappealing and
detrimental for the sale of silver. Over time some oxidation can be aesthetically pleasing
to consumers and is known as patina.
A process to protect silver from tarnishing has already been developed and is
currently used by the Royal Canadian Mint. It involves a thin coating of lacquer on
finished coins. The details of this coating are a trade secret, thus we knew only that it was
prone to incorporate defects that required stripping of the lacquer before re-coating. Thus

63
the vacuum and chemical nature of ALD would be ideal to coat silver coins while
minimizing defects and lowering rejection rates.
Much interest is invested into the ability to deposit coatings on metal surfaces.
These films would act as a passivation layer to protect the metal substrate. An ideal
coating would be clear, transparent and would not impact the visual appeal, feel or the
purpose of the coated material. The conformal nature of ALD as well as its high degree
of thickness control would afford minimal amount of coating. The ALD process and
transparent nature of alumina and titania thin films should produce defect-free substrates.
The goal of this project was to develop an industrial-level process to coat coins.
4.3 Experimental
Silver numismatic coins produced by the Mint contained 99.99% silver whereby
the remaining composition was not known. The tool used to perform depositions of
alumina and titania was a PicosunTM
P-series ALD system. The tool was modified to best
suit deposition on coins through utilization of racks. Thicknesses of deposited films were
measured ex-situ on silicon witness slides using a J. A. Woollam Co. Alpha-SE
ellipsometer. The refractive index used to output thickness values were n = 1.73 for
alumina and n = 2.45 for titania.
Three particular methods to clean the substrate coins were employed. For safety
reasons and to protect trade secrets the tools used were operated by Mint technicians
where details of the procedures were not disclosed. One such tool was the Ebner furnace.

64
The parameters were: 250°C for 30 minutes, program #2. Another was the Finnsonic
tool; an automated ultrasonic multi-solvent based cleaning apparatus. There was also a
method to clean coins via hydrogen scrubbing. This included a heated furnace that was
pressurized with 5% hydrogen in nitrogen. This technique effectively burns off organic
material and forms a chemically reduced surface on the substrate. Hydrogen scrubbing
was performed ex-situ for 1 or 2 hours at a temperature of 150°C. Coins were then
allowed to cool to less than 40°C before being removed where they were immediately
used or vacuum sealed for future use.
The general sulfur/adhesion test began by applying Scotch tape across the top
portion of the coin, pressing firmly then quickly removing the tape. The coins were then
placed on a rack, to keep the coins out of solution and held up-right in a glass desiccator.
The bottom of the desiccator was filled with approximately 500 mL of water and 0.14 g
disodium sulfide. To initiate generation of hydrogen sulfide: about 1 mL of diluted
hydrochloric acid was added to the solution below, the lid placed on the desiccator and
the solution was stirred by a magnetic sir bar. Coins were left in the desiccator for 2
hours. Glass slides were used as blanks by applying Scotch tape to see if residue from
the tape affected the glass. No such affect was seen.
The inspection protocol to select defect-free coins was performed by trained
quality control staff at the Mint. These inspections took place before deposition and after
to attain rejection rates. The method of inspection could be best described as a quick
glance of each face. The defects included but were not limited to scratching, haze and

65
any discolouration. Rejection rates could vary with the same inspector as well as with
other quality control staff. The process of doubly inspecting coins was implemented to
ensure pristine coins were used in depositions and that aesthetically defective coins did
not produce a false rejection rate. The process of doubly inspecting coins required
bringing separate trays of uncoated coins to a quality control staff member. When a
sufficient number of defect-free coins were selected for a single deposition, the coins
were collected on a single tray and brought back to the same inspector. This would
continue until each coin was inspected twice and enough coins to complete a deposition
were selected.
To ensure complete surface saturation and uniform coatings pulse parameters
were optimized for this application (Figure 4.3.1). Multiple short pulses give better
uniformity than longer pulses of equal time since the head-space in a bubbler is
regenerated in the purge step between subsequent pulses of the same precursor. The
standard triple pulse program to deposit alumina begins with two similar 0.1 s pulses of
the metal containing precursor, TMA, which are separated by a 0.5 s interval. This
particular tool utilizes a constant flow of nitrogen which acts to purge the precursor
molecules from the deposition chamber during this interval. The final metal precursor
pulse is of the same 0.1 s interval, but is followed by a 10 s purge. This long purge is to
prevent unwanted deposition as residual precursor may react in the gas-phase with the
next reactant gas. Water is then pulsed into the chamber in three similar pulses that
mirror the previous precursor. Bubblers for TMA and water were kept at room
temperature. The bubbler for TTIP was heated to 125°C and the lines leading to the

66
deposition chamber were heated to 160°C to prevent condensation. The growth rate of
alumina was previously determined to be 1.26 Å/cycle and titania 0.47 Å/cycle.
Table 4.3.1: Parameters for the triple-pulse program used to deposit alumina and titania on
bronze tokens.
4.4 Results and Discussion
4.4.1 Numismatic Haze
Since these coins are collectable there is a requirement for very low rejection rate
– less than 2%. ALD does not inherently cause defects due to deposition in vaccuo
although high purity silver (99.99% Ag) produced a ‘haze’ after deposition of 150 cycles
of TMA and water at 250°C. This was aesthetically undesirable and considered a reject.
The haze was not clearly characterized and was thought to be from oxidation or
contamination due to lack of cleaning. It was found from a ‘dry run’ such that the
precursor valves remained closed and no precursor was being introduced, that heating to
250°C caused the haze to form on the coins. Dust also was found to cause problems as
scratches on the mirror-like surface and sometimes as particles incorporated into films.

67
This is what led to greater scrutiny and the double inspection to select pristine coins
before deposition.
The determination of a rejection rate was carried out visually by inspection staff.
It was clear that inspection techniques needed to be learned and understood in order to
better understand the rejection process and what makes an acceptable coin. Because of
the subjective nature of a visual inspection process steps were taken to ensure coins were
considered defect-free before deposition. This would include previously self-inspecting
coins and working with only one inspector who would be required to double-check coins
before deposition. The double check was required as about 4% of coins that initially
passed would be rejected the second inspection. After deposition the same staff member
would be called upon to examine the coins.
Attempts to pre-clean coins in solvent were tried. First was sonication in acetone.
The purity of acetone was an issue as haze-like deposits formed on coins as the solvent
evaporated. This method was quickly discarded. Another procedure was to use the
Finnsonic tool, an automated ultrasonic solvent based cleaning apparatus. Even with this
sophisticated cleaning apparatus coins still produced haze after deposition. It could
therefore be stated that hazing of the coins was not produced by surface contaminants
which would be removed from this apparatus, such as the mineral oil used in stamping
the coin. Nitrogen gas ‘flushes’ were performed to help remove any residual oxygen or
water from the deposition chamber to prevent their oxidative effects. These nitrogen
flushes were undertaken by increasing the flow of nitrogen to the deposition chamber to a

68
set pressure then reducing this flow to achieve a <10 mbar pressure. This was performed
as the chamber was slowly heated. As well, an overnight bake-out whereby the chamber
was heated to 500°C for 18 hours was performed. These attempts had no effect on
preventing the haze from occurring. Three tests were then performed to determine the
cause of the haze and to prevent it from forming. As coins are pressed a mineral oil is
used on the die. A special set of coins were pressed where the oil from the die was
removed with isopropyl alcohol (Ag10). Regardless of this step, the subsequent coins
produced a haze after deposition. Another method (Ag11) to prevent haze was to pretreat
the coins in a separate furnace equipped with hydrogen gas, a so called hydrogen-scrub.
At first the coins were placed on the bottom of the furnace with one face down. After
deposition only one face of each coin had haze. Although it was not known which face
was up, it seemed apparent that the face-down side formed haze while the face-up was
free from haze after deposition (Ag14). Coins were placed in a rack so they stood on
edge and not on their face (Ag18). This produced coins that, after deposition of 150
cycles of alumina at 250°C were considered ‘borderline passable’. These hydrogen scrub
parameters were tried on future depositions. The third test (Ag11) used an Ebner furnace
was to pretreat the coins with parameters that were not completely disclosed: 250°C for
30 minutes, program 2. Regardless of this attempt haze still formed on the coins.
Since the appearance of haze seemed to be brought on by increased heat,
depositions at reduced temperatures were performed. Temperatures of 80°C were first
tried with normal 150 cycle coatings of alumina. It was observed by ellipsometry that
this did not change the thickness of deposition. Unfortunately coatings at this

69
temperature did not adhere well and failed the Scotch tape test. Temperatures of 150°C
provided results that were aesthetically pleasing (Ag17) and also passed adhesion tests.
Through further experimentation with deposition temperatures it was found that
temperatures above 227°C and extended flushing produced haze on 99.99% silver.
Depositions then were performed at temperatures of 220°C to prevent temperature over-
shoot, for greater adhesion, density and to prevent haze. To further insure this
temperature limit was not surpassed, a slow temperature ramp was used. There is an
unfortunate drawback to this approach to reduce haze. Lowering temperature of
deposition affects essential film characteristics that are important for most applications.
Properties such as adhesion and film density decrease with decreasing deposition
temperature which would directly affect wear of the coatings. A slower temperature
ramp would increase the deposition time which is not desirable in a time-constrained
industrial process. Also, the temperature of 250°C was initially selected as the precursor
pair of TTIP and water begins to form domains of crystalline anatase titania. The anatase
form of titania has the benefit of greater density and hardness over the amorphous phase.
Since high temperature was found to effect haze, and it was believed the haze was
the result of residual water or air in the deposition chamber, there was an attempt to
“bake-out” the chamber. This entailed loading the coins and opening the chamber to
vacuum with temperature set to 150°C overnight before deposition at 250°C (Ag29).
This proved to reduce the occurrence of haze, but with this particular deposition one was
considered ‘borderline hazy.’

70
4.4.2 Tests of ALD Coatings on Numismatic Silver
The corrosion tests show that ALD coatings protect coins and out-perform
lacquer. These trials began by comparing coated and unprotected coins exposed to
hydrogen sulfide. ALD coins of 150 cycles of alumina showed superior corrosion
resistance. The lacquer showed brown tarnishing that may be due to reaction of the
lacquer to the hydrogen sulfide. The uncoated coins became purple while the lacquered
coins became dark brown in appearance (Figure 4.4.1).
Figure 4.4.1: Hydrogen sulfide tests show better protection by ALD as the coating is
intact and the coin un-tarnished. The lacquer on the coins show reactivity to the
hydrogen sulfide and the uncoated coins become much darker.

71
4.4.3 Adhesion tests (Ag21 vs. Ag25)
To form a visual indication of film adhesion, a Scotch-tape adhesion test was
performed before coins were placed into the sulfur chamber. Some coins with the ALD
coating were scratched in a cross-hatched pattern with a diamond tipped pen (Figure
4.4.2). This was done to see if the resulting squares would be removed. Coatings of 150
cycles of alumina at 150°C (Ag21) showed some tarnishing in the form of small black
spots underneath where the tape had been. The scratches made with the diamond-tipped
pen also became black, but none of the resulting squares were removed. In these tests the
ALD coated coins out preformed lacquered and uncoated coins, although some of the
alumina was removed with tape. This is evident as tiny black spots on the coin under
where the tape had been. These spots were not due to tape residue as glass slides treated
similarly did not show any of the spots. All ALD coated coins showed black tarnishing
on the edges of the coins which was thought to be because they are handled at the edges
to prevent damage to the face.
A thicker coating Ag25 (200 cycles alumina, 150°C) showed better results. After
the sulfur chamber, the areas under where the tape had been had fewer black spots.
These coins still had tarnishing marks along the edges, possibly from handling. A bilayer
deposited at 220°C of 106 cycles of titania on top of 150 cycles of alumina was also
tested (Ag30). Results for adhesion of this bilayer were similar to coins without titania.
Unfortunately there were tests where almost all of the ALD coated coins (Ag37, 39)
failed adhesion tests. Experiments Ag37 (200 cycles alumina, 150 cycles titania 220°C)
and Ag39 (200 cycles alumina, 220°C) had most of the area under the tape blackened by

72
sulfur exposure indicating removal of the ALD layer(s). This is thought to be because of
a change in the tape used for this test and the likely possibility of low uniformity between
tape batches. Regardless this later resulted in not using tape to test for adhesion.
Figure 4.4.2: Ag 21 cross hatch, tape and H2S. The scratched
surfaces clearly indicates corrosion from sulfur.
4.4.4 Humidity and Adhesion (tape and sulfur)
In this study, adhesion and corrosion (as described above) were tested after the
coins were subjected to a humidity chamber to determine the durability of the ALD
coatings. The humidity chamber consisted of a large desiccator with water in the bottom
where coins would sit on a rack, above the water at room temperature for 24. The 24
hour test was performed on coins from Ag21 (150 cycles alumina 150°C). Results
showed slight signs of humidity exposure as small white spots. The humidity however
did not affect the adhesion test. The results for adhesion after humidity were similar as
the adhesion test alone on Ag21. Coins that had been subjected to cross-hatching, then
humidity/adhesion again did not have the square pieces removed from the tape. They

73
were tarnished at the scratches, which was likely because the cross-hatching procedure
inherently breaks the coating layer. Uncoated coins became a dark purple brown during
this test. The same minor black tarnishing was seen on the ribbed edges of the coins and
is again thought to be because of handling. The bilayer with titania (Ag30: 150 cycles
alumina 106 cycles titania, 220°C) performed worse. More of the area under the tape had
black spots indicating that parts of the coating had been removed. This may be cause by
a difference in applied pressure during the adhesion test.
4.4.5 Brine solution and Adhesion
This test was the most harsh and also showed greater variability of results (Figure
4.4.3). Coins from Ag21 (200 cycles alumina, 150°C) were placed in a 2% w/w NaCl
solution for 2 hours and then subjected to the adhesion test. The salt-water bath left
white deposits and left the mirrored sections of coins foggy. It also weakened the
alumina layer as much of the area under the tape was removed for some coins. After the
adhesion test, about half the coins had large areas under the tape removed which became
black with tarnish. While the remaining half resembled adhesion test results without brine
solution. The cross-hatching technique was also tried and the same results were obtained,
with half of the coins exhibited heavy tarnishing.

74
Figure 4.4.3: Samples of ALD coated coins (Ag21, 200cycles alumina, 150°C) showing variability
in adhesion after 2 hour immersion in brine solution.
These results led to producing coins at higher deposition temperatures in order to
achieve greater adhesion. A set of coins with the same thickness of 150 cycles of
alumina were produced at a temperature of 250°C (Ag29). They showed similar results
to previous adhesion tests which were not placed in brine solution, but were not suitable
because of the formation of haze at this temperature. Coins from Ag30 (150 cycles of
alumina and 106 cycles of titania, 220°C) showed similar results to Ag29 which is likely
due to similar deposition temperatures.
4.4.6 New Tests
The previous set of tests of humidity or brine solution with tape was considered
quite harsh by the Mint project manager. Further testing of coatings was not to include
tape before introducing coins to sulfur. The first of these new tests was to place coins in
the humidity chamber then expose them to sulfur. They were performed on Ag33 (200
cycles alumina, 220°C) and Ag35 (200 cycles alumina, 500 cycles titania, 220°C) and

75
Ag37 (200 cycles alumina, 150 cycles titania, 220°C). The differences in layer thickness
of titania was to see if it afforded any extra protection from tarnishing. Similar white
spots and smudging were observed on all coins. One particular coin of Ag37 (Figure
4.4.4) became unusually tarnished. Otherwise no straightforward conclusion could be
reached on the effect of layer thickness of titania on film appearance. These trials also
helped indicate the maximum deposition temperature before haze appeared. A deposition
temperature of 223°C for Ag34 was selected, but it overshot this temperature and haze
was observed. The bake out performed on Ag29 in attempt to deposit at higher
temperatures did not produce haze-free coins.
Figure 4.4.4: Ag-37 coin with unusual sulfur damage
4.4.7 Humidity Duration Test
The titania coins seemed to have a slightly greater instance of unappealing marks
after humidity testing. A humidity duration test was implemented where coins placed in

76
a humidity chamber were inspected after 8, 24, 48 and 72 hours. Coins used here were
Ag38, Ag40, Ag41 and uncoated coins.
The batch of Ag41 was coated with 200 cycles of alumina and 150 cycles of
titania at 220°C. The remaining coated coins had only alumina layers deposited at 220°C,
but Ag38 had 200cycles whereas Ag40 had 500. After 8 hours very few, but noticeable
white marks appeared on all coins. The uncoated coins showed brown tarnishing near the
contact points with the holder. After 24 hours more, haze and white marks visible on
mirrored parts of the coin on Ag38, Ag40 and Ag41. It was apparent that the uncoated
coins exhibited a greater amount of haze on the mirrored parts. The coins after 48 and 72
hours all followed the same trend, but one of Ag41 after 72 hours showed small brown
spots indicating a slight tarnish. All coins in this experiment showed some degree of
aesthetic degradation, with the uncoated coins and one of Ag41 showing effects of brown
tarnishing. This tarnishing along with variably poor results previously with titania in the
humidity chamber led to the exclusion of titania from future coatings because of its
apparent degredation under these conditions.
4.4.8 Hydrogen Furnace and Final Products
The hazing was found to not be part of any contamination on the silver surface,
and eliminated by lowering temperature. A cleaning process was devised whereby coins
would be put through the Finnsonic cleaning system to remove any residual oils then
subjected to a hydrogen scrub. The dual cleaning was to provide an ultimately clean

77
surface to test adhesion and quality of the coating. After being treated in the Finnsonic
the coins were placed for one hour in the hydrogen furnace at 150°C. Ten coins were
deposited with 200 cycles of alumina (200H1) and ten were deposited with 300 cycles
alumina (300H1). These coins were tested against lacquered and uncoated coins as well
as a previous deposition, Ag22 (150 cycles alumina 150°C). The corrosion tests involved
24 hours in the humidity chamber followed by 2 hours in the sulfur chamber (Figure
4.4.5).
The uncoated coins were badly tarnished across large areas of both faces.
Lacquered coins showed the characteristic brown colour from sulfur, again across large
areas of both faces. Both hydrogen scrubbed coins showed hazing and some tarnish at
the ribbed edges but no tarnishing on either face. The tarnishing on the edges is likely
due to handling. Ag22 showed slightly more tarnishing on the ribbed edges as well as
some on the face of the coin (Figure 4.4.6).

78
A)
B)
C)
D)
E)
Figure 4.4.5: Sample of coins after the first of the final sets of corrosion tests. A) 200H1
slight tarnish on edges, haze on mirrored portion. B) 300H1 slight tarnish on edges, haze on
mirrored portion. C) Lacquered coin showing brown tarnish from sulfur. D) Ag-22 with
black markings similar to other ALD coins. E) Uncoated coin with heavy sulfur damage.

79
Figure 4.4.6: First trial of the final sets of corrosion tests showing tarnishing along edges.
Although the ALD coated coins performed better than lacquered and uncoated
coins in the corrosion tests, the effect of hydrogen scrubbing was further investigated.
After Finnsonic treatment, coins were placed in the hydrogen furnace for two hours and
the same 200 cycle and 300 cycle alumina thicknesses were compared to the 1 hour
hydrogen scrub. Two further trials with 5 each of 200H1, 200H2, 300H1, 300H2 and
Ag-22 were performed and gave results identical to the previous trial (Figure 4.4.7). The
longer hydrogen furnace times indicate a reduction in tarnishing seen at the edges of the
coins. This demonstrates greater adhesion as the edges are where the coins are handled.

80
Figure 4.4.7: Trial 2 results with coins having longer hydrogen scrubbing times
Because of the reduced tarnishing provided by the hydrogen scrub, the original
adhesion test was attempted. Adhesion tests on the 2 hour hydrogen scrub (H2) coins
with tape showed variability with respect to how much tarnishing was observed. These
tests used the same tape as the tests where Ag-37 and Ag-39 failed. On average the
300H2 coins fared similarly to the original tests performed with Ag-21. They exhibited
similar amount of tarnished area and one of 300H2 failed. The 200H2 set fared better
than other sets overall. This may be due to delamination that could have occurred at
higher deposition thicknesses, but was otherwise unnoticed. Some of these coins had no
tarnish at all on either face of the coin.
4.5 Summary Conclusion - Numismatic
The subjective nature of the visual inspection process to determine an aesthetic
rejection rate initially hindered furthering of ALD coatings. Multiple inspections by the
same inspector on the same batch of coins gave a ‘base’ rejection rate of 4%. Attempts
were made to use the same inspector throughout the duration of the experiment, but this
inherent discrepancy was inevitable.

81
Haze appearing on 99.99% silver coins after deposition was a long standing issue.
It was found to be produced when heating the deposition chamber, possibly promoting
the formation of silver oxide. The exact nature of the haze is unknown. The heating
limit before haze formation was experimentally found to be approximately 227°C.
Subsequent depositions were performed at 220°C to prevent temperature overshoot. Use
of an ex-situ hydrogen scrub appeared to decrease the presence of haze at temperatures of
250°C. Because of the industrial nature of the project the hydrogen furnace was not
always available and required a separate operator. Only through an in-situ hydrogen
scrub could the effectiveness of the reducing atmosphere be fully assessed. The ALD tool
used in these experiments could be equipped with a hydrogen generator to create an in-
situ hydrogen scrub. The end goal was to have a hydrogen equipped tool for production,
but the Mint was unwilling to extend testing.
Adhesion tests displayed some variability. The variability is likely related to the
test not being standardized; pressure applied to the tape was not measured therefore not
exactly reproducible. Tape-based adhesion tests with the initial tape indicated that an
increase in layer thickness or deposition at higher temperatures performed better in the
following sulfur chamber as fewer tarnishing spots. After the change in tape, depositions
with higher temperatures and/or thicker layers clearly failed; however coins that were
exposed to the hydrogen scrub passed the adhesion test. Regardless of the inconsistent
results with ALD coatings the lacquer coating was never removed by this adhesion test.

82
The lacquer would however react with the sulfur and become dark brown to the point of
severe aesthetic degradation.
Results from coins placed in a humidity chamber revealed that humidity had no
effect on adhesion of alumina coatings; however the humidity seemed to produce
aesthetic flaws. These flaws occurred more often in coins coated with an outer layer of
titania. This led to titania coatings not being considered as an acceptable coating for this
application.
Soaking the coins in 2% sodium chloride solution was the harshest test and gave
variable results with coatings deposited at temperatures of 150°C. Coatings at higher
temperatures of 250°C proved more durable as did laminates of alumina and titania
deposited at a temperature of 220°C.
The final corrosion tests included humidity and sulfur experiments on coins
deposited with alumina after exposure to the ex situ hydrogen scrub. These tests did not
initially include adhesion tests using tape. The coins with the longer hydrogen scrubbing
times of two hours and thicker 300 cycle alumina depositions showed the greatest results.
These coins tarnished at a fewer points along the edges where they were handed than the
others coins with less time in the hydrogen furnace and thinner coatings. When subjected
to the original adhesion test using newer tape and 2 hour exposure in the sulfur chamber,
these coins showed less tarnishing than depositions without hydrogen scrubbing. Thicker
coatings provided greater corrosion resistance, but the thinner 200H2 coating yielded a

83
better result in the adhesion test. This is likely due to delamination occurring with thicker
coatings. The hydrogen scrubbing appeared to improve adhesion to the silver substrate.
The prevention of haze by lowering temperature is in conflict with the benefits of ALD
coatings at higher temperatures. Properties such as density, adhesion and formation of
crystalline anatase titania would increase wear resistance. Coatings deposited at higher
temperatures performed better than depositions at lower temperatures in all experiments
and is believed to be related to the aforementioned benefits. The qualitative testing did
not show an improvement when titania was added to form the bilayer. In some cases
with humidity, the outer titania layer showed greater aesthetic deterioration the cause of
which is unknown.
Baking out the deposition tool to remove condensed water reduced haze but was
very time intensive and not a realistic solution in a time constrained industrial
application. This study shows results similar to bake-outs with the Finnsonic cleaning
and the use of an ex-situ hydrogen scrub. It would be beneficial to explore the
capabilities of an in-situ hydrogen scrub as it also appears to increase film adhesion and
to see if the Finnsonic cleaning method is necessary. Clean substrates are crucial for
proper adhesion and this will be an on-going problem in this specific industrial setting.
Weak points of the ALD coatings appeared as black tarnish marks where the
coins were handled. Multilayers with crystalline titania may be able to withstand friction
as anatase titania is harder than its amorphous form. This would require substrate
temperatures of at least 250°C which were initially problematic due to the formation of

84
haze and not further studied because of the poor results with these films in the humidity
tests. Although coins coated by ALD protect from sulfur corrosion and do not change
colour as do the lacquer coatings, they show aesthetic degradation when exposed to long
periods of high humidity. There is an apparent flaw with the sulfur test as the lacquer
appears to react with it and produce a brown colour. It is unclear whether the sulfur
reaches and reacts with the silver underneath this coating. Regardless, the lacquer
coating is not removed by the tape during the adhesion test and otherwise holds up to all
other tests.
4.6 Atomic Layer Deposition Coatings for Circulation Coins
4.6.1 Experimental Procedure for ALD Coatings for Circulation Coins
Depositions were run on full baskets of 1500-1600 bronze tokens. Coins were
received as ‘sheets’ of 169 test tokens and 9 of these sheets were dumped into a single
basket for approximately 1,521 coins. Coins were dumped into an aluminum basket
which consisted of flat side panels and a wire mesh bottom. Depositions were carried out
250°C with two nitrogen flushes performed during the heating period which included a
stabilization time of 2 hours. Bubblers for TMA and water were kept at room
temperature. The bubbler for TTIP was heated to 125°C and the lines leading to the
deposition chamber were heated to 160°C to prevent condensation. The growth rate of
alumina was previously determined to be 1.26 Å/cycle and titania 0.47 Å/cycle. The
general triple-pulse recipe was discussed in the previous section and shown in Table
4.3.1.

85
4.6.2 Positional Coins
Positional coins were marked with a punch to indicate placement. The maple leaf
on the face of the coins formed a triangle with the orientation of the words on the coins
indicating the top of the coin. There were 8 depth positions in the basket: top, top
middle, middle, bottom middle and bottom, side top, side middle and side bottom.
Except for the ‘side’ positions, each of the positions has 5 coins in a pattern that
resembled the fifth side of a die. These coins were placed with their face parallel to the
floor. The six ‘side’ coins were placed perpendicular with respect to the other coins with
two coins up against each side of the basket. Although care was taken when placing the
coins, displacement from intended position was sometimes inevitable.
Figure 4.6.1: Indentations on coins indicating location of positional coins in basket
batches.

86
4.6.3 Placement of Silicon Witness Sides
Silicon witness slides for basket runs B1 and B2 included two silicon witness
slides which were initially placed with one on top of the coins in the basket and one in the
center. Basket runs B9 and B10 included six witness slides. These slides were placed
parallel to the basket floor through the center of the basket. They included a top, top
middle, bottom middle, bottom and two side positions. Both side positions were located
near the middle of the basket but one side position had the silicon facing the wall of the
aluminum basket while the other side had silicon facing inwards towards the coins.
4.6.4 Tests
Thicknesses of deposited films were measured in the same fashion as numismatic
coatings, i.e. ex-situ on silicon witness slides using a J. A. Woollam Co. Alpha-SE
ellipsometer. The refractive index used to output thickness values were n = 1.73 for
alumina and n = 2.45for titania.
Tumbler tests to gauge wear characteristics consisted of placing coins in a rock
tumbler. One coin in each of the 7 positions (top, top middle, middle, bottom middle and
bottom, side top and side bottom) were placed in the tumbler and run for 24 hours at ~22
rpm to simulate years of wear. Coatings of 150 Å alumina and 50 Å of titania were used
to compare with uncoated coins. ALD coins were run separately from uncoated coins.
Exposure to hydrogen sulfide to test for coverage was performed similar to silver
numismatic coins. This sulfur chamber consisted of a desiccator with cut plastic tubing

87
used to hold the coins up-right. Generation of hydrogen sulfide gas was achieved by
placing 0.14 g of disodium sulfide in a small vial and dropping the vial in approximately
500 mL of water in the bottom of the desiccator. A rack was used to keep the coins out
of solution and the coins placed in their plastic holders on the rack. About 1 mL of
diluted hydrochloric acid was added to the solution below, the lid placed on the
desiccator and the solution was stirred by a magnetic sir bar and left for 2 hours.
4.6.5 Basket Depositions
The first basket deposition (B1) consisted of 150 cycles of alumina only. A
silicon witness slide was placed on the center of the basket and another on the top of the
coins in the basket. Basket batch number two (B2) used the same coins as B1 and
differed by an additional leading pulse for a total of four pulses for each metal-oxide
layer. These initial tests were to assess penetration depth of the growing film on the
silicon slides only. The reused ‘dummy’ coins only served to fill the basket while
conserving the supply of coins. This batch also contained 2 silicon witness slides in
locations similar to B1. The third and fourth run included 106 cycles of titania in
addition to 150 cycles of alumina to form a laminate film. Previously coated dummy
coins from the previous batches were again used while uncoated coins in the 8
aforementioned positions were used in the tumbler and sulfur tests. In attempt to prevent
black lines from appearing after sulfur treatment, batch six (B6) consisted of an increase
in thickness of each metal-oxide layer by 20Å to 170 Å alumina and 70 Å titania. This
was calculated from the previously reported growth rates of 1.26 Å/cycle for alumina and
0.47 Å/cycle for titania. The dummy coins were again re-used with fresh positional coins

88
and a strong colour gradient was observed. Batch number seven (B7) used an entirely
fresh batch of coins and a thickness reduced to 160 Å alumina and 60 Å titania to remove
the colour gradient and prevent sulfur lines. No colour gradient was observed. The
eighth batch (B8) was to observe if increased pulse times, with the same thickness,
afforded a colour gradient. It consisted of increasing pulse time from 0.2 seconds to 0.4
seconds and 1.0 to 2.0 for each of the three pulses of TMA and TTIP, respectively. This
batch used all uncoated coins and pulsing was returned to 150 cycles alumina and 106
cycles titania. Batch number nine (B9) consisted entirely of uncoated coins and six
silicon witness slides in positions: top, top middle, bottom middle, bottom, side right and
side left. There was an increase to 300 cycles of alumina and 200 cycles of titania in
order to observe any colour gradient. The precursor pulsing times were kept as per B8.
The last batch of circulation coins, B10 were to improve on the deviation in coating
thickness. Cycles of each metal oxide were returned to 150 cycles of alumina and 106
cycles of titania, but pulse times were increased. Times were increased for alumina
deposition to 0.6 s for both TMA and water, while for titania the pulses for both TTIP
and water were increased to 3.0 s.
4.7 Results and Discussion
4.7.1 Thickness Measurements
These circulation tests were run to determine the effectiveness of coating brass
coins in batch processes were they were randomly assorted within a basket. These coins
were tested for coating efficiency qualitatively by observing a colour change or
quantitatively by measure of thickness. The thickness measurement was performed by

89
ellipseometry on the silicon witness slides. Other quality assessments included a tumbler
test for wear and a hydrogen sulfide chamber for chemical inertness.
Table 4.7.1: Thickness measurements and coating parameters of the two first trials using only
alumina.
The first coatings (B1, B2) were deposited to find parameters that would coat
each coin evenly. This began by using the triple pulse style settings to deposit 150 Å of
alumina only. These settings produced a thickness deviation of 18 Å on silicon witness
slides (Table 4.7.1). This comprises approximately 10% of the coating thickness and
would be a large enough deviation to affect reproducibility of the quality tests.
Increasing to a quadruple pulse provided only slightly better results with a thickness
deviation of 13 Å (Table 4.7.2). These, along with following tests, indicated the initial
triple pulse program did not allow for sufficient precursor penetration to coat such a large
and disorganized arrangement of coins. Either an increase in pulse time or number of
pulses would be required.

90
Table 4.7.2: Thickness measurements and coating parameters of the final two trials using both
alumina and titania.
Tests of laminate coatings were run with coins placed in certain positions and
marked with a punch to dictate their position when later removed from the basket. The
rest of the basket was filled with ‘dummy’ coins that were re-used in subsequent
depositions in order to have a reasonable mass and surface area to represent a full
production run. This was to reduce the amount of coins used per run (1500 coins) and to
facilitate locating positional coins among the darker coloured dummy coins. Issues of
coating uniformity soon followed as uncoated coins within the basket of dummy coins
displayed a colour gradient.
Deviations from uniformity were observed visually when coating thickness was
increased by about 20 Å for each layer of titania and alumina. Among the previously
coated ‘dummy’ coins, a change in colour in the positional coins was observed. The
positional coins near the top and bottom of the basket were darker in colour and the

91
positioned coins near the center did not change in colour. This would indicate greater
coating thickness at the top and bottom of the basket.
To examine the cause of the colour change a second deposition experiment was
undertaken with the same 20 Å increase of both alumina and titania but with a complete
basket of fresh coins and increased pulse times. This was an attempt to grade uniformity
by visual inspection. The pulse time (B8) for TMA was increased from 0.2 sec to 0.4 sec
and TTIP was increased from 0.5 sec to 1.0 sec. Purge times were not altered. This
produced coins that did not display a colour gradient which was unexpected. The
gradient produced in the previous deposition was a product of insufficient precursor
infiltration to the center of the basket. An insufficient number of pulses or pulse time
would not allow enough precursor into the deposition chamber and would reduce
precursor residence time and therefor infiltration into the basket’s center. This is due to
the random arrangement of coins in the basket causing a very torturous path for a
precursor to follow. The amount of precursor was found to be sufficient as the triple
pulse program used deposited a uniform coating on a greater number of bronze coins
(2744 coins) when they were arranged in racks.51
Because the only coins discoloured in
the previous run were on the top and bottom it is likely that precursor was not reaching
the middle of the basket. To be coated evenly a longer precursor resident time would be
required to form a saturated monolayer on the most buried of coins. This was provided
by increasing the amount of precursor pulse time. Also, the design of the basket
prevented flow of precursor to its center since the walls were solid and did not allow for
any precursor flow.

92
To produce a uniform, darker colour change a further increase of coating
thickness was deposited on a full basket of fresh coins. With the previous increase in
pulse time, approximately 300 Å of alumina and 100 Å of titania was deposited on a
fresh basket of coins (B9). These coins were visually uniform in colour as slightly more
orange than the coins before coating. Ellipsometry of silicon wafers placed in 6 different
locations within the basket gave an average coating of 110 Å with a standard deviation of
10 Å. With improved visual uniformity, the thickness was decreased to the initial 150 Å
alumina and 50 Å titania. Pulse times were increased again as well as purge times
according to Table 4.7.3.
Table 4.7.3: Increased pulse parameters for measure of film uniformity (B10)
The accuracy of ellipsometric measurements are questionable as they are much
larger than what is expected for the calculated growth rates. Nevertheless the deviation
in film thickness was very small with an average of 1145 Å and standard deviation of 2 Å
(Table 4.7.2). This was again measured from silicon wafers placed at six different

93
locations in the basket. In addition each of these pieces was measured six times at
different areas of the piece.
4.7.2 Sulfur Treatment
Laminate coatings of alumina and titania were produced to test wear and sulfur
corrosion against uncoated coins. Coatings with approximately 150 Å of alumina and 50
Å of titania would withstand 2 hours in the sulfur chamber without the drastic colour
change seen in the uncoated coins (Figure 4.7.1).
Figure 4.7.1: Before (far left) and after sulfur treatment of ALD coatings of 150 Å of
alumina and 50 Å of titania. Notice there is no colour difference between ALD
samples (center) while the uncoated coins (right) appear darker.

94
After sulfur treatment some of the ALD laminate coins would have black marks
or lines on the faces. The marks would leave a residue on Scotch tape. They appeared
only on the ALD coated coins where the plastic holder was in contact with the coin. In
attempt to prevent these lines from appearing, each metal oxide layer was increased by 10
Å. Even after the overall 20 Å increase of each the black marks were still produced after
H2S treatment and only on ALD coins.
B4: 4/7 coins with black lines.
B3:3/6 coins with black lines.
Figure 4.7.2: Circulation coins coated in laminates of 150 cycles alumina and 106 cycles titania
after sulfur treatment. The black marks left behind are indicated.
These sulfur tests showed reproduceable results throughout each deposition.
Uncoated coins would change colour to orange. The coins coated in laminates of
alumina and titania did not change colour, but did show black marks where the plastic
holders contacted the coins. The black marks were not characterized nor were they
avoided by increasing layer thickness. Since the black marks only appeared on ALD

95
coated coins there must have been a reaction between with the titania layer and the plastic
tube holders brought about by the hydrogen sulfide. By either adding a final layer of
alumina or not depositing titania may give insight into wheather or not the titania coating
is responsible for these marks.
4.8 Tumbler Tests
Upon visual inspection of coins after the tumbler: uncoated coins appeared darker
while the ALD coated coins do not change colour (Figure 4.8.2). It appears as though
the soft plastic of the tumbler is worn down and gently adheres to the sufrace of the
uncoated coins. The first trial consisted of running the ALD coated coins first then the
uncoated coins, without cleaning the tumbler. For the next trial the tumbler was wiped of
all remaining residue and the uncoated coins were run first, then the ALD coated coins
run after without cleaning. Similar results were observed as the uncoated coins were
considerably darkened by the plastic from the tumbler. The ALD coated coins also
showed some plastic residue but not nearly as much as the uncoated coins (Figure 4.8.3).

96
Figure 4.8.1:Image of both coated and uncoated coins before being placed in the tumbler for
24 hours at 22 rpm. Note: the coins appear identical.
Figure 4.8.2: After 24 hours in the tumbler the ALD coated coins show a dull-ness in the
coating brough about by many small indentations. The uncoated coins have the same
indentations, but absorb the soft plastic coating of the tumbler walls.

97
On both coated and uncoated coins many small indentations are seen on the
smooth areas. On the coin’s embossed face there was no discernable difference between
coated and uncoated coins when inspected by eye. Even with the possibilty of lack of
uniformity of coating throughout the basket there was no difference between basket
position and wear. To further this inspection both ALD coated and uncoated coins were
gently scrubbed with a paste made of Sparkleen cleaning powder and water to remove
residue on the coins. They were then examined with an optical microscope at 12.5x
magnification (Figure 4.8.4). The plastic residue left on the coins from the soft plastic
wall of the tumbler was removed from the uncoated coins where the coins with ALD
coatings appeared unchanged after cleaning. After cleaning the uncoated coins appeared
to have much of the bronze surface of the smooth parts removed.
Figure 4.8.3: ALD (left) and uncoated (right) coins after tumbling the
uncoated coins first then the ALD coated coins without cleaning the
tumbler between. The uncoated coins pick up a similar amout of
plastic. The ALD coins do show that some of the plastic adheres to the
coin, but not as much as uncoated.

98
The ALD coating did appear to afford some wear protection on bronze circulation
test coins. After cleaning the plastic debris from the tumbler, uncoated coins did appear
to have a larger area of the surface removed when examined under microscope (Figure
4.8.4). Also the coatings did appear to reduce the amout of residue left behind by the
tumbler. This may be a viable coating to keep part of the aestetic look and reduce
deterioration brough about by handling over time.
Before cleaning After cleaning
ALD
Uncoated
Figure 4.8.4: Optical magnification (12.5x) of: ALD coatings appear unchanged after cleaning
with Sparkeleen paste whereas much of the plastic residue left behind from the tumbler walls is
removed from uncoated coins. After cleaning the uncoated coins appear to have more of the
smooth surface damaged or removed.

99
4.9 Summary Conclusion - Circulation
The precision of ellipsometic measurements was not reliable between laminate
depositions, but they appeared to be accurate with respect to a particular deposition. This
is hopefully an indication that the final depositions with increased pulse times were of
greater uniformity with a final standard deviation of 1.87 Å. ALD coated positional coins
indicate similar results. Since the purge time was not changed from the original setting,
precursor trapped in interstitial space between coins would result in CVD growth.
Further optimization of number of pulses or pulse length or would be required. The
preceding sulfur and tumbler tests show that position did not appear to affect the coatings
as each positional coin provided identical results. Sulfur tests indicate protection from
chemical attack by the ALD coatings. The exception is the black lines produced after
placement in the sulfur chamber, the cause of which is unknown, but likely from contact
with the holder. The tumbler tests did indicate an improvement in wear protection after
ALD coatings through observation by optical microscope. Although greatest uniformity
was not achieved until the last coatings, the ALD laminate coatings produced similar
results that were markedly different from uncoated coins. Furthermore the ALD coating
appeared to lessen the amount of plastic debris adhered to the coin after the tumbler. This
may be a beneficial side-effect of these coatings since they could also be marketed for
this reason. The apparent wear protection would need to be further investigated since this
study only implemented one method to arrive at this conclusion.

100
4.10 Conclusions and Future Directions
For protective applications such as those required by the Mint, one should grow
alumina films with TMA at temperatures of 200°C or higher for the added benefit of
greater density. Titania layers should be grown at temperatures that show high anatase,
250°C or higher with TTIP, to benefit from the hardness of its crystallinity. Use of a
hydrogen scrub appears beneficial if not obligatory to produce a clean surface and allow
for an increase in deposition temperature. The cost of multilayers on circulation coins
must take into consideration the increase in wear resistance and the possible decrease
adhesion of particulates. Literature review reveals multilayers should be used for the
synergistic benefit of both layering materials, with alumina as the primary layer for
adhesion. Thickness should be kept to a minimum with each layer one the order of 10-
30nm. It is also very important to first find the optimal deposition of each layer
individually.

101
Appendices
Appendix A: NMR Spectra of Thermolysis Compounds.
Figure 4.10.1: Select NMR spectra taken of P2Au that had been A) exposed to light over a
period of 31 day and B) protected from light over 38 days. Monitored peak

102
Figure 4.10.2: Select NMR spectra taken of Agttbip that had been A) exposed to light over a
period of 22 days of that had been A) protected from light for 25 days. Monitored peaks are
triplets at 2.5 and 1.6 ppm.
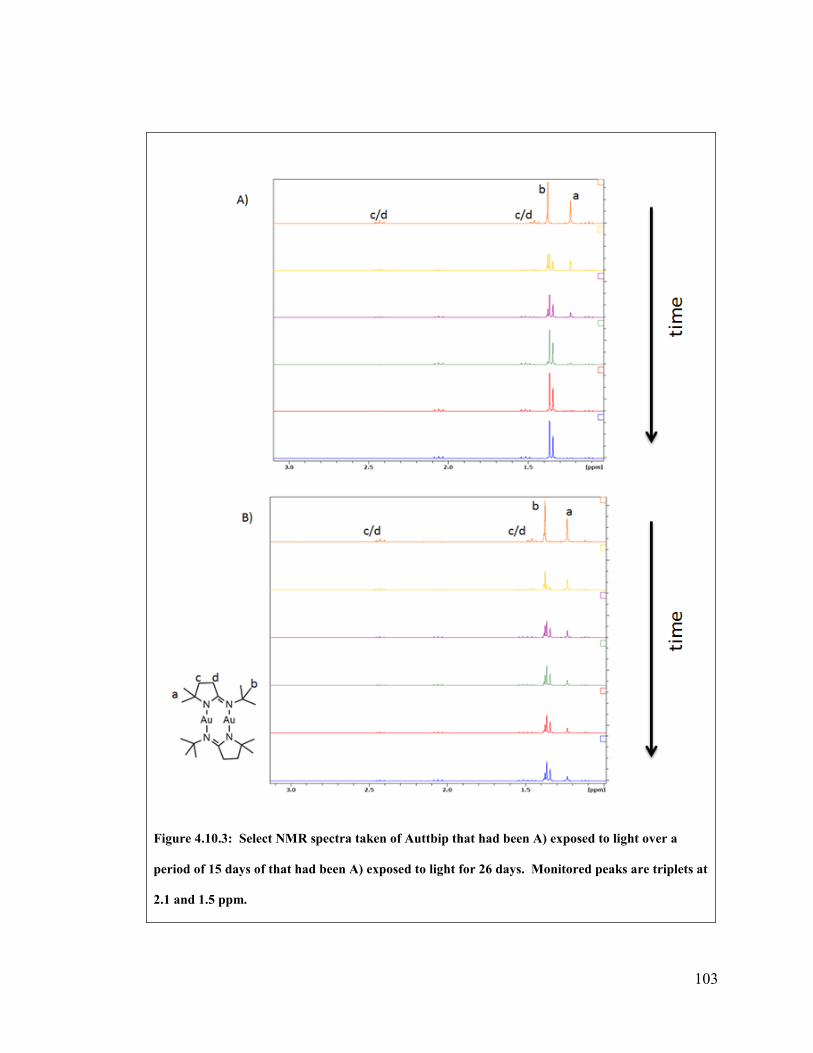
103
Figure 4.10.3: Select NMR spectra taken of Auttbip that had been A) exposed to light over a
period of 15 days of that had been A) exposed to light for 26 days. Monitored peaks are triplets at
2.1 and 1.5 ppm.

104
Appendix B: Kinetic Decomposition for the Complete Dataset of
Auttbip
Protected from light 2.55 t
Protected from light 1.33 s
Figure 4.10.4: Linear fit graphs for the sample that was protected from light. This data uses all
data points collected for the determination of order of decomposition for Auttbip.

105
Table 4.10.1: Order determination by linear fit using all data points of Auttbip when protected
from light.
Auttbip protected from Light
Peak(ppm) Triplet 2.55 ppm
Order(R2) Zero
(0.3966)
first
(0.5418)
second
(0.5520)
rate, k 0.0006 mM/s 0.0015/s 0.0042/mMs
t1/2,
theoretical
833 h 462 h 238 h
Experimental
midpoint
24 h 24 h 24 h
Auttbip protected from Light
Peak(ppm) Singlet 1.33 ppm
Order(R2) Zero
(0.3782)
first
(0.5180)
second
(0.5985)
rate, k 0.0005 mM/s 0.0014/s 0.0040/mMs
t1/2,
theoretical
1000 h 495 h 250 h
Experimental
midpoint
24 h 24 h 24 h

106
Appendic C: Deposition Lists
Trial Alumina Titania Pulse style Other Parameters
1 150 - triple 2 150 - quadruple 3 150 106 triple 4 150 106 triple
6 166 149 triple Produced orange coins initially believed to be from thickness.
7 158 127 triple Less coating for thickness investigation.
8 150 106 triple Doubled pulse length of metal precursors.
9 300 200 triple Similar pulse parameters as 8.
10 150 106 triple
Doubled pulse times again, water pulse increased to match preceeding metal precursor.
Table 4.10.2: List of depositions on baskets of bronze circulation tokens.

107
Ag trial
Alumina
Cycles
Titania
Cycles
Deposition
Temperature Other Parameters
9 150
250 Die cleaned with isopropyl alcohol
10 150
250 20 minute hydrogen scrub at 150°C
11 150
250
Ebner furnace 250°C for 30 minutes,
program 2
14 150
250 1 hour hydrogen scrub at 150°C
17 120
150
18 150
250 1 hour hydrogen scrub at 150°C
19 120
250
21 150
150
22 150
150
25 200
150
29 150
250 Bake out
30 150 106 220
33 200
220
34 200
220
35 200 500 220
37 200 150 220
38 200
220
39 200
220
40 500
220
41 200 150 220
44 200
220 hydrogen furnace
200H1 200
220 1 hour hydrogen scrub at 150°C
300H1 300
220 1 hour hydrogen scrub at 150°C
200H2 200
220 2 hour hydrogen scrub at 150°C
300H2 300
220 2 hour hydrogen scrub at 150°C
Table 4.10.3: List of depositions on silver numismatic coins.

108
Bibliography or References
(1) Choy, K. Prog. Mater. Sci. 2003, 48, 57–170.
(2) Meyyappan, M.; Delzeit, L.; Cassell, A.; Hash, D. Plasma Sources Sci. Technol.
2003, 12, 205–216.
(3) Ito, A.; You, Y.; Ichikawa, T.; Tsuda, K.; Goto, T. J. Eur. Ceram. Soc. 2014, 34,
155–159.
(4) Malesevic, A.; Vitchev, R.; Schouteden, K.; Volodin, A.; Zhang, L.; Tendeloo, G.
Van; Vanhulsel, A.; Haesendonck, C. Van. Nanotechnology 2008, 19, 305604.
(5) Wasslen, Y. a; Tois, E.; Haukka, S.; Kreisel, K. a; Yap, G. P. a; Halls, M. D.;
Barry, S. T. Inorg. Chem. 2010, 49, 1976–1982.
(6) Chappé, J.-M.; Martin, N.; Lintymer, J.; Sthal, F.; Terwagne, G.; Takadoum, J.
Appl. Surf. Sci. 2007, 253, 5312–5316.
(7) Yu, L.; Zhang, L.; Song, H.; Jiang, X.; Lv, Y. CrystEngComm 2014, 16, 3331–
3340.
(8) Zhou, W.; Mandia, D. J.; Gri, M. B. E.; Barry, T.; Albert, J. J. Phys. Chem. C
2014, 118, 670–678.
(9) Maruyama, T. Tago, T. J. Mater. Sci. 1993, 28, 5345–5348.
(10) Yuan, Z.; Dryden, N. H.; Li, X.; Vittal, J. J.; Puddephatt, R. J. 1995, 5, 303–307.
(11) Maruyama, T.; Fukui, K. Thin Solid Films 1991, 203, 297–302.
(12) Mickelson, A. R. Electron. Lett. 1982, 18, 3–4.
(13) Mcclain, K. R.; Donohue, C. O.; Koley, A.; Bonsu, R. O.; Abboud, K. A.; Revelli,
J. C.; Anderson, T. J.; Mcelwee-white, L. J. Am. Chem. Soc. 2014, 136, 1650–
1662.
(14) Raaijmakers, I. J. Thin Solid Films 1994, 247, 85–93.
(15) Smith, R. C.; Ma, T.; Hoilien, N.; Tsung, L. Y.; Bevan, M. J.; Colombo, L.;
Roberts, J.; Campbell, S. A.; Gladfelter, W. L. Av. Mater. Opt. Electron. 2000,
114, 105–114.

109
(16) Comfort, J. H.; Reif, R. J. Electrochem. Soc. 1989, 136, 2386–2398.
(17) Garje, S. S.; Ritch, J. S.; Eisler, D. J.; Afzaal, M.; O’Brien, P.; Chivers, T. J.
Mater. Chem. 2006, 16, 966.
(18) Chávez-Urbiola, I. R.; Chávez-Urbiola, E. a.; Ochoa-Landín, R.; Castillo, S. J.;
Vorobiev, Y. V.; Ramírez-Bon, R. Mater. Lett. 2014, 116, 254–257.
(19) Lee, P. W.; Omstead, T. R.; Mckenna, D. R.; Jensen, K. F. J. Cryst. Growth 1987,
85, 165–174.
(20) Choi, B. J.; Kim, D. R. J. Mater. Sci. Lett. 1991, 10, 860–862.
(21) Price, J. B.; Borland, J. O.; Selbrede, S. Thin Solid Films 1993, 236, 311–318.
(22) Kim, J. S.; Marzouk, A.; Reucroft, P. J.; Robertson, J. D.; Hamrin Jr., C. E. Thin
Solid Films 1993, 230, 156–159.
(23) Mattevi, C.; Kim, H.; Chhowalla, M. J. Mater. Chem. 2011, 21, 3324.
(24) Zhang, Y. I.; Zhang, L.; Zhou, C. Acc. Chem. Res. 2013, 26, 2329–2339.
(25) Sunolta, T.; Antson, J. United States Patent 4,058,430, 1977.
(26) Li, Z.; Rahtu, A.; Gordon, R. G. J. Electrochem. Soc. 2006, 153, C787.
(27) Hoivik, N. D.; Elam, J. W.; Linderman, R. J.; Bright, V. M.; George, S. M.; Lee,
Y. C. Sensors Actuators A Phys. 2003, 103, 100–108.
(28) Hwang, C. S.; Yoo, C. Y.; Gordon, R. G.; Elliott, S. D.; Kim, S. K.; Lee, S. W.;
Raoux, S.; Ritala, M.; Hoffmann-Eifert, S.; Wantanabe, T.; Park, T. J.; Han, J. H.;
Cho, M.; Delabie, A.; Kim, H.; Kim, S. H.; Lee, H.-B.-R.; Chu, S. Atomic Layer
Deposition for Semiconductors; Seong Hwang, C., Ed.; Springer US: Boston, MA,
2014; pp. 126–127.
(29) Shemeena Basheer, N.; Rajesh Kumar, B.; Kurian, A.; George, S. D. J. Lumin.
2013, 137, 225–229.
(30) Armelao, L.; Barreca, D.; Bottaro, G.; Gasparotto, A.; Gross, S.; Maragno, C.;
Tondello, E. Coord. Chem. Rev. 2006, 250, 1294–1314.
(31) Brahma, R.; Krishna, M. G. Phys. E Low-dimensional Syst. Nanostructures 2011,
43, 1192–1198.

110
(32) Armelao, L.; Barreca, D.; Bottaro, G.; Gasparotto, A.; Maccato, C.; Tondello, E.;
Lebedev, O. I.; Turner, S.; Van Tendeloo, G.; Sada, C.; Stangar, U. L.
Chemphyschem 2009, 10, 3249–3259.
(33) Barry, S. T. Coord. Chem. Rev. 2013, 257, 3192–3201.
(34) Coyle, J. P.; Pallister, P. J.; Kurek, A.; Sirianni, E. R.; Yap, G. P. a; Barry, S. T.
Inorg. Chem. 2013, 52, 910–917.
(35) Coyle, J. P.; Johnson, P. a; DiLabio, G. a; Barry, S. T.; Müller, J. Inorg. Chem.
2010, 49, 2844–2850.
(36) Whitehorne, T. J. J.; Coyle, J. P.; Mahmood, A.; Monillas, W. H.; Yap, G. P. a.;
Barry, S. T. Eur. J. Inorg. Chem. 2011, 2011, 3240–3247.
(37) Coyle, J. P.; Kurek, A.; Pallister, P. J.; Sirianni, E. R.; Yap, G. P. a; Barry, S. T.
Chem. Commun. (Camb). 2012, 48, 10440–10442.
(38) Coyle, J. P.; Gordon, P. G.; Wells, A. P.; Mandia, D. J.; Sirianni, E. R.; Yap, G. P.
A.; Barry, S. T. Chem. Mater. 2013, 25, 4566–4573.
(39) Barry, S. T.; Coyle, J. P.; Clark, T. J.; Hastie, J. J. M. United States Patent
Application. US 2012/0323008 A1, 2012.
(40) Coyle, J. P.; Dey, G.; Sirianni, E. R.; Kemell, M. L.; Yap, G. P. A.; Ritala, M.;
Leskela, M.; Elliott, S. D.; Barry, S. T. 2013.
(41) Tukur, A.; Sharp, L.; Stern, B.; Tizaoui, C.; Benkreira, H. J. Environ. Monit. 2012,
14, 1237–1247.
(42) Bajaj, P. Bull. Mater. Sci. 1992, 15, 67–76.
(43) Pinisetty, D.; Gupta, M.; Karki, a. B.; Young, D. P.; Devireddy, R. V. J. Mater.
Chem. 2011, 21, 4098.
(44) Ngo, T. T.; Chavhan, S.; Kosta, I.; Miguel, O.; Grande, H.-J.; Tena-Zaera, R. Appl.
Mater. interfaces 2014, 6, 2836–2841.
(45) Luo, L.; Bozyigit, D.; Wood, V.; Niederberger, M. Chem. Mater. 2013, 25, 4901–
4907.
(46) Remmington Jr., M. P. United States Patent. 6,521,295, 2003.
(47) Lin, Y.-Y.; Lee, H.-Y.; Ku, C.-S.; Chou, L.-W.; Wu, A. T. Appl. Phys. Lett. 2013,
102, 111912.

111
(48) Haycock, P. W.; Horley, G. a.; Molloy, K. C.; Myers, C. P.; Rushworth, S. a.;
Smith, L. M. Chem. Vap. Depos. 2001, 7, 191.
(49) Badaway, W. A. Thin Solid Films 1990, 186, 59–72.
(50) Chitnis, S. S.; Carpenter, Y.-Y.; Burford, N.; McDonald, R.; Ferguson, M. J.
Angew. Chem. Int. Ed. Engl. 2013, 52, 4863–4866.
(51) Gordon, P. G. Thin Film Precursors , Properties and Applications : Chemical
Vapour Deposition and Atomic Layer Deposition of Group 4 , 11 and 13 Elements
and Their Oxides, Carleton University, 2013, pp. 20–40.
(52) Brazeau, A. L.; Barry, S. T. Chem. Mater. 2008, 20, 7287–7291.
(53) Liu, Y.; Fischer, T. E.; Dent, A. Surf. Coatings Technol. 2003, 167, 68–76.
(54) George, S. M. Chem. Rev. 2010, 110, 111–131.
(55) Puurunen, R. L. J. Appl. Phys. 2005, 97, 121301.
(56) Groner, M. D.; Fabreguette, F. H.; Elam, J. W.; George, S. M. Chem. Mater. 2004,
639–645.
(57) Tripp, M. K.; Stampfer, C.; Miller, D. C.; Helbling, T.; Herrmann, C. F.; Hierold,
C.; Gall, K.; George, S. M.; Bright, V. M. Sensors Actuators A Phys. 2006, 130-
131, 419–429.
(58) Dejun, M. A.; Ong, C. W.; Jianmin, L. I. U.; Jiawen, H. E. Sci. China Ser. E Eng.
Mater. Sci. 2004, 47, 398–408.
(59) Miller, D. C.; Foster, R. R.; Jen, S.-H.; Bertrand, J. a.; Cunningham, S. J.; Morris,
A. S.; Lee, Y.-C.; George, S. M.; Dunn, M. L. Sensors Actuators A Phys. 2010,
164, 58–67.
(60) Wang, L.; Travis, J. J.; Cavanagh, A. S.; Liu, X.; Koenig, S. P.; Huang, P. Y.;
George, S. M.; Bunch, J. S. Nano Lett. 2012, 12, 3706–3710.
(61) Tapily, K.; Jakes, J. E.; Stone, D. S.; Shrestha, P.; Gu, D.; Baumgart, H.;
Elmustafa, a. a. J. Electrochem. Soc. 2008, 155, H545.
(62) Elam, J. W.; Groner, M. D.; George, S. M. Rev. Sci. Instrum. 2002, 73, 2981.
(63) Triani, G.; Campbell, J. a.; Evans, P. J.; Davis, J.; Latella, B. a.; Burford, R. P.
Thin Solid Films 2010, 518, 3182–3189.
(64) Niinisto, L.; Haussalo, P.; Ritala, M.; Leskela, M. Chem. Mater. 1993, 1174–1181.

112
(65) Jõgi, I.; Pärs, M.; Aarik, J.; Aidla, A.; Laan, M.; Sundqvist, J.; Oberbeck, L.;
Heitmann, J.; Kukli, K. Thin Solid Films 2008, 516, 4855–4862.
(66) Meng, X.; Geng, D.; Liu, J.; Li, R.; Sun, X. Nanotechnology 2011, 22, 165602.
(67) Kim, H. S.; Bush, M. B. Nanostructured Mater. 1999, 11, 361–367.
(68) Li, C. X.; Bell, T. Corros. Sci. 2006, 48, 2036–2049.
(69) Marin, E.; Guzman, L.; Lanzutti, a.; Ensinger, W.; Fedrizzi, L. Thin Solid Films
2012, 522, 283–288.
(70) Potts, S. E.; Schmalz, .; Fen er, M.; D az, B.; iato s a, J.; Maurice, .;
Se eu , a.; Marcus, P.; Radn czi, G.; T th, .; essels, . M. M. J. Electrochem.
Soc. 2011, 158, C132.
(71) Matero, R.; Ritala, M.; Leskela, M.; Salo, T.; Aromaa, J. J. Phys. IV Fr. 1999, 9.
(72) Shan, C. X.; Hou, X.; Choy, K.-L. Surf. Coatings Technol. 2008, 202, 2399–2402.