pinnacle foods inc. presentation to cagny
TRANSCRIPT

1 1
PINNACLE FOODS INC.
Presentation to CAGNY March 11, 2015
2 2
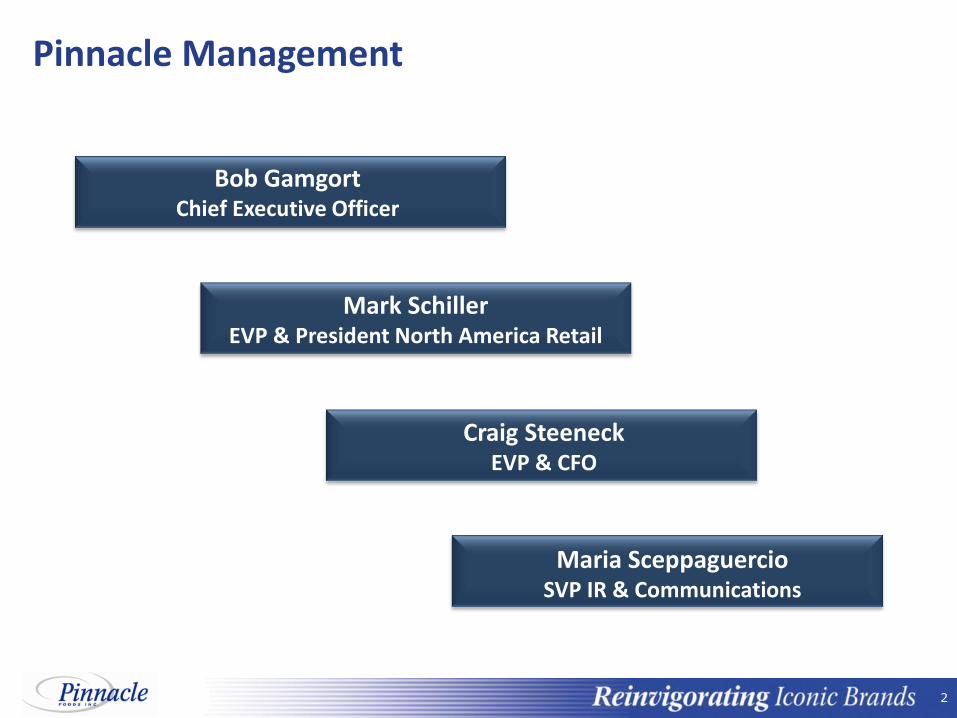
Bob Gamgort Chief Executive Officer
Craig Steeneck EVP & CFO
Maria Sceppaguercio SVP IR & Communications
Pinnacle Management
Mark Schiller EVP & President North America Retail
3 3
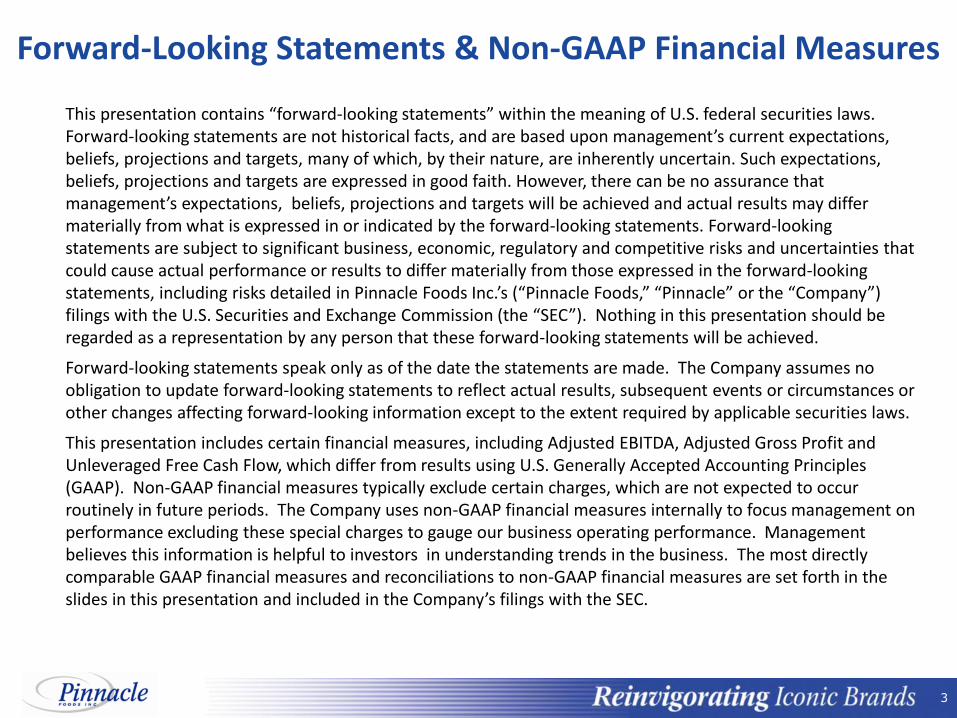
Forward-Looking Statements & Non-GAAP Financial Measures
This presentation contains “forward-looking statements” within the meaning of U.S. federal securities laws. Forward-looking statements are not historical facts, and are based upon management’s current expectations, beliefs, projections and targets, many of which, by their nature, are inherently uncertain. Such expectations, beliefs, projections and targets are expressed in good faith. However, there can be no assurance that management’s expectations, beliefs, projections and targets will be achieved and actual results may differ materially from what is expressed in or indicated by the forward-looking statements. Forward-looking statements are subject to significant business, economic, regulatory and competitive risks and uncertainties that could cause actual performance or results to differ materially from those expressed in the forward-looking statements, including risks detailed in Pinnacle Foods Inc.’s (“Pinnacle Foods,” “Pinnacle” or the “Company”) filings with the U.S. Securities and Exchange Commission (the “SEC”). Nothing in this presentation should be regarded as a representation by any person that these forward-looking statements will be achieved.
Forward-looking statements speak only as of the date the statements are made. The Company assumes no obligation to update forward-looking statements to reflect actual results, subsequent events or circumstances or other changes affecting forward-looking information except to the extent required by applicable securities laws.
This presentation includes certain financial measures, including Adjusted EBITDA, Adjusted Gross Profit and Unleveraged Free Cash Flow, which differ from results using U.S. Generally Accepted Accounting Principles (GAAP). Non-GAAP financial measures typically exclude certain charges, which are not expected to occur routinely in future periods. The Company uses non-GAAP financial measures internally to focus management on performance excluding these special charges to gauge our business operating performance. Management believes this information is helpful to investors in understanding trends in the business. The most directly comparable GAAP financial measures and reconciliations to non-GAAP financial measures are set forth in the slides in this presentation and included in the Company’s filings with the SEC.
4 4
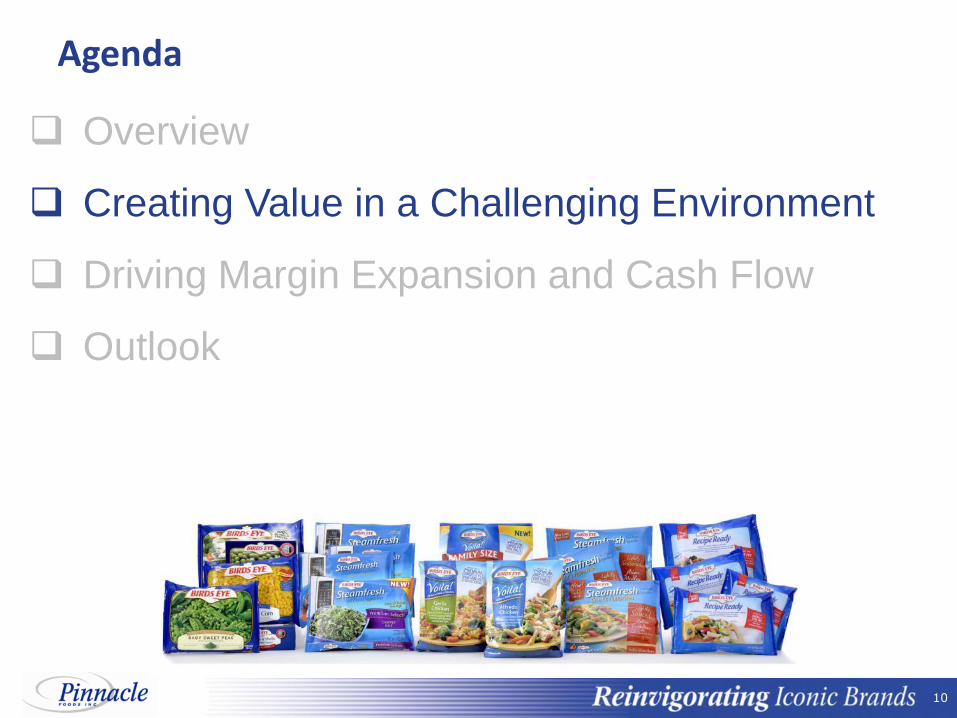
Agenda Overview
Creating Value in a Challenging Environment
Driving Margin Expansion and Cash Flow
Outlook
5 5
Other Private Label Food Service
Snacks
Canada Other
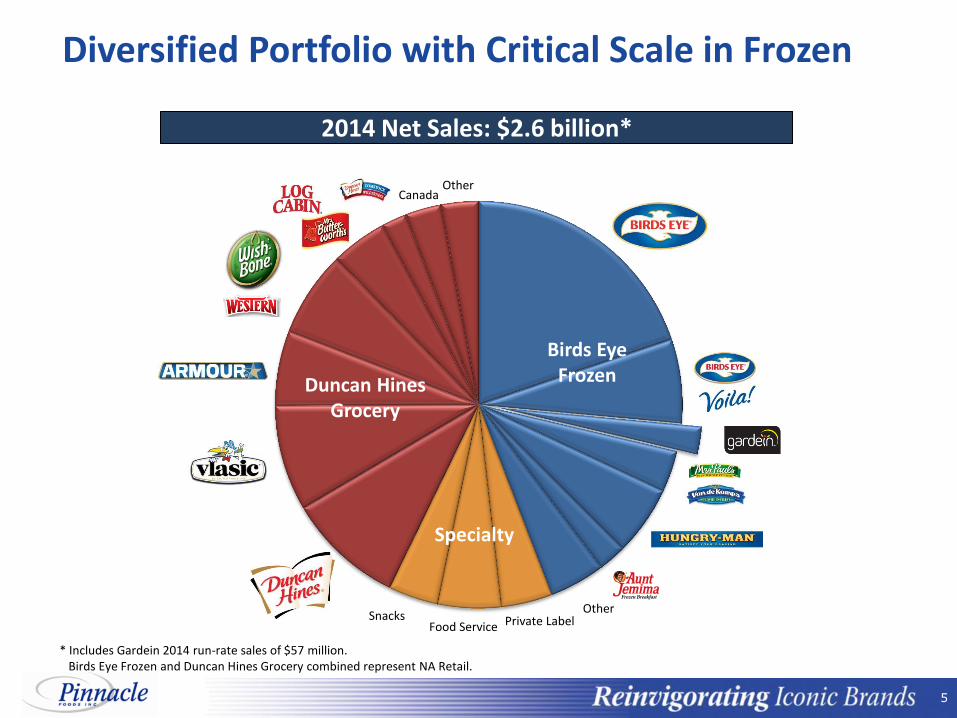
Diversified Portfolio with Critical Scale in Frozen
2014 Net Sales: $2.6 billion*
Birds Eye Frozen
Specialty
Duncan Hines Grocery
* Includes Gardein 2014 run-rate sales of $57 million. Birds Eye Frozen and Duncan Hines Grocery combined represent NA Retail.
6 6
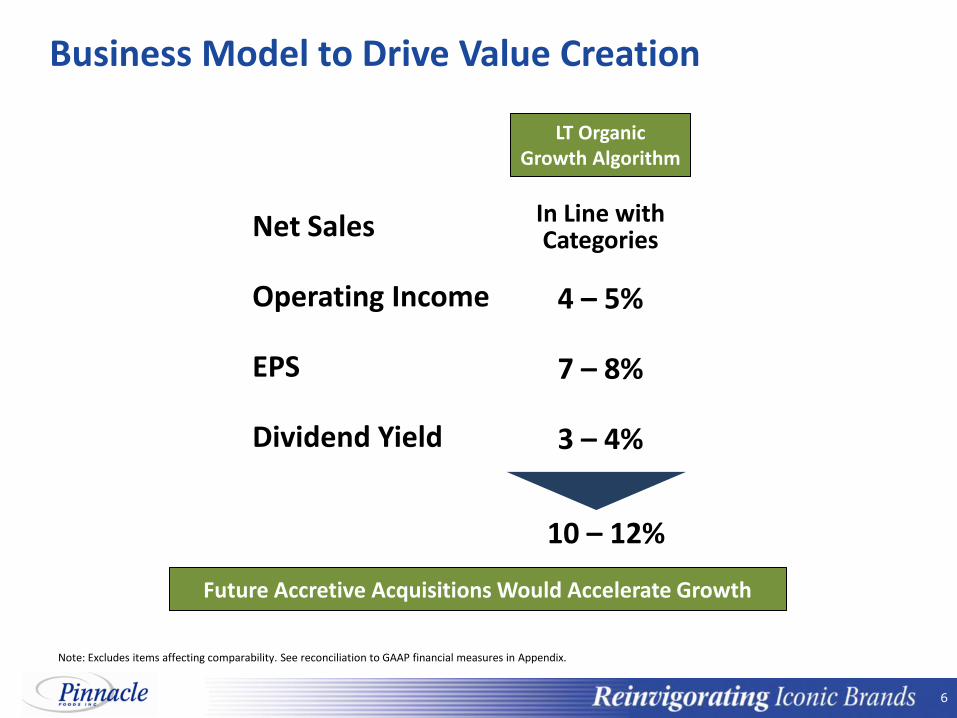
Business Model to Drive Value Creation
Net Sales
Operating Income
EPS
Dividend Yield
In Line with Categories
10 – 12%
4 – 5%
7 – 8%
3 – 4%
LT Organic Growth Algorithm
Future Accretive Acquisitions Would Accelerate Growth
Note: Excludes items affecting comparability. See reconciliation to GAAP financial measures in Appendix.
7 7
Portfolio Management Strategy
66% 72% 69% 76%
Net Sales
2013 2014 2013 2014
34% 28% 31%
24%
2013 2014 2013 2014
Invest in marketing to drive growth and share expansion
Focus on breakthrough innovation
Gross Profit Net Sales Gross Profit
Maintain stable sales/market position and cash flow
Focus on brand renovation
Leadership Brands Foundation Brands
(% of NA Retail) (% of NA Retail)
8 8
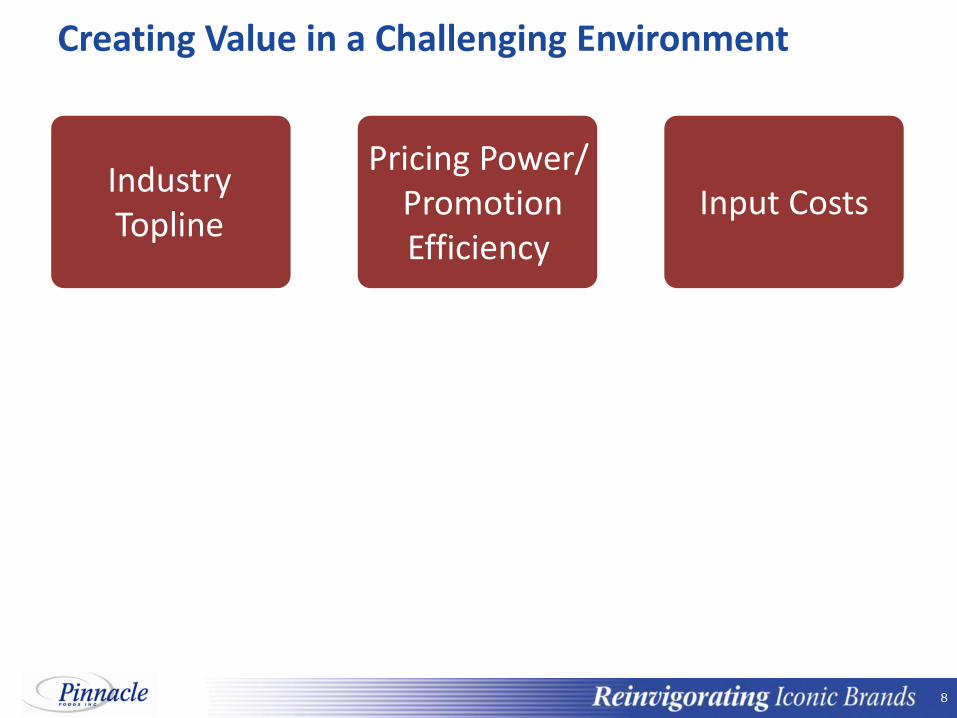
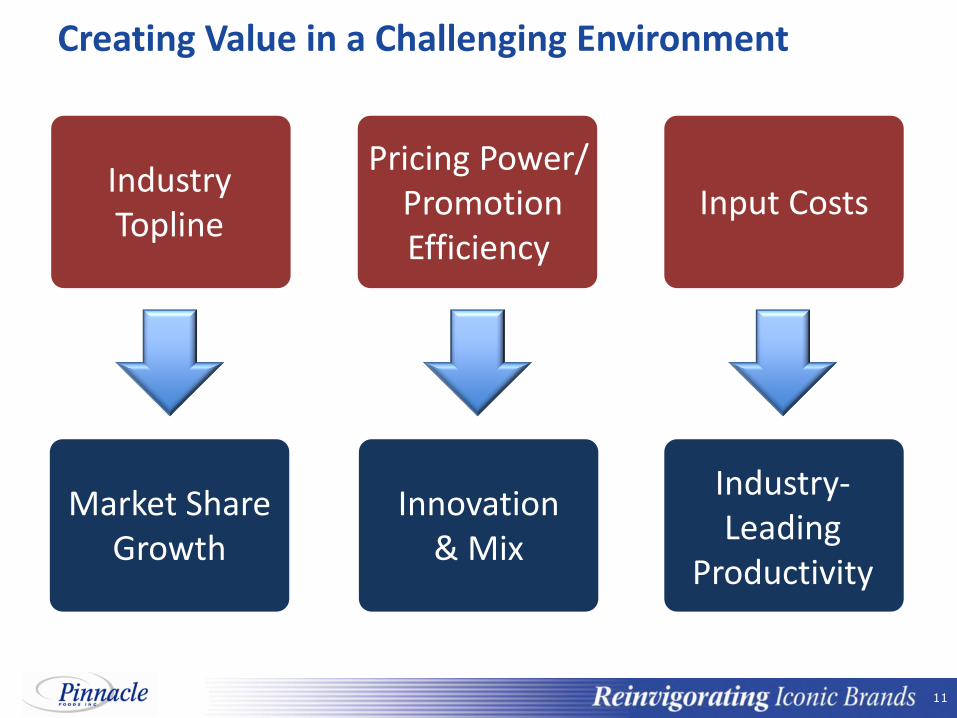
Creating Value in a Challenging Environment
Industry Topline
Input Costs Pricing Power/
Promotion Efficiency
9 9
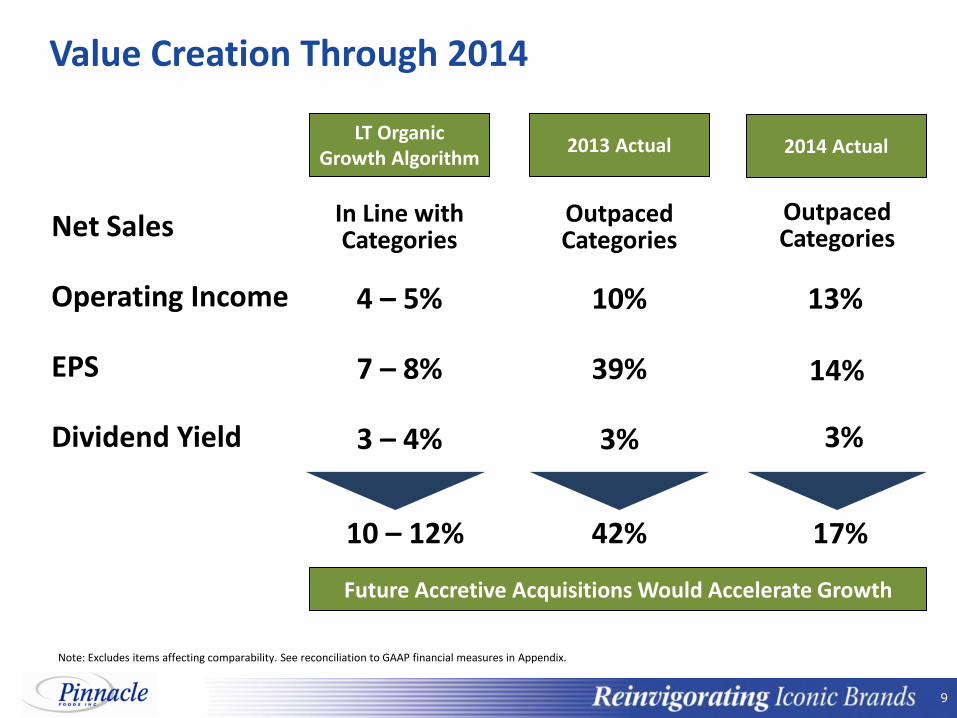
Value Creation Through 2014
Net Sales
Operating Income
EPS
Dividend Yield
In Line with Categories
10 – 12%
4 – 5%
7 – 8%
3 – 4%
LT Organic Growth Algorithm
10%
39%
3%
Outpaced Categories
42%
2013 Actual
17%
14%
2014 Actual
Outpaced Categories
3%
Future Accretive Acquisitions Would Accelerate Growth
Note: Excludes items affecting comparability. See reconciliation to GAAP financial measures in Appendix.
13%
10 10
Agenda Overview
Creating Value in a Challenging Environment
Driving Margin Expansion and Cash Flow
Outlook
11 11
Creating Value in a Challenging Environment
Industry Topline
Input Costs Pricing Power/
Promotion Efficiency
Market Share Growth
Industry- Leading
Productivity
Innovation & Mix

12 12
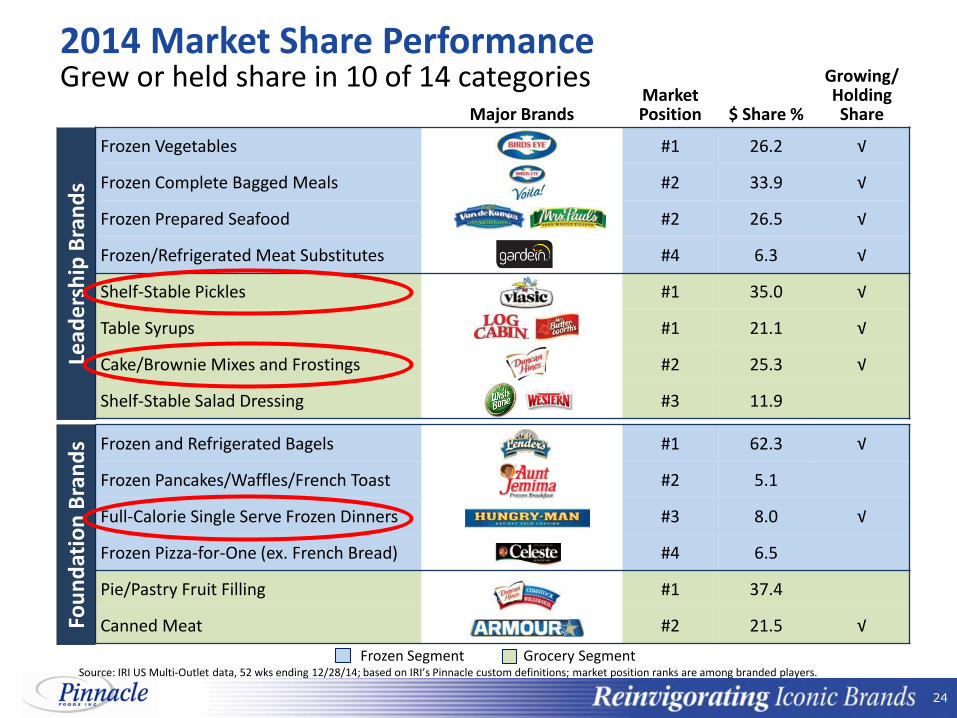
2014 Market Share Performance
Source: IRI US Multi-Outlet data, 52 wks ending 12/28/14; based on IRI’s Pinnacle custom definitions; market position ranks are among branded players.
Frozen Segment Grocery Segment
Major Brands Market Position $ Share %
Growing/ Holding Share
Frozen Vegetables #1 26.2 √
Frozen Complete Bagged Meals #2 33.9 √
Frozen Prepared Seafood #2 26.5 √
Frozen/Refrigerated Meat Substitutes #4 6.3 √
Shelf-Stable Pickles #1 35.0 √
Table Syrups #1 21.1 √
Cake/Brownie Mixes and Frostings #2 25.3 √
Shelf-Stable Salad Dressing #3 11.9
Frozen and Refrigerated Bagels #1 62.3 √
Frozen Pancakes/Waffles/French Toast #2 5.1
Full-Calorie Single Serve Frozen Dinners #3 8.0 √
Frozen Pizza-for-One (ex. French Bread) #4 6.5
Pie/Pastry Fruit Filling #1 37.4
Canned Meat #2 21.5 √ Fou
nd
atio
n B
ran
ds
Lead
ers
hip
Bra
nd
s Grew or held share in 10 of 14 categories

13 13
Birds Eye is a $1 Billion Health & Wellness Brand Poised to Capitalize on America’s Need to Eat More Vegetables
14 14
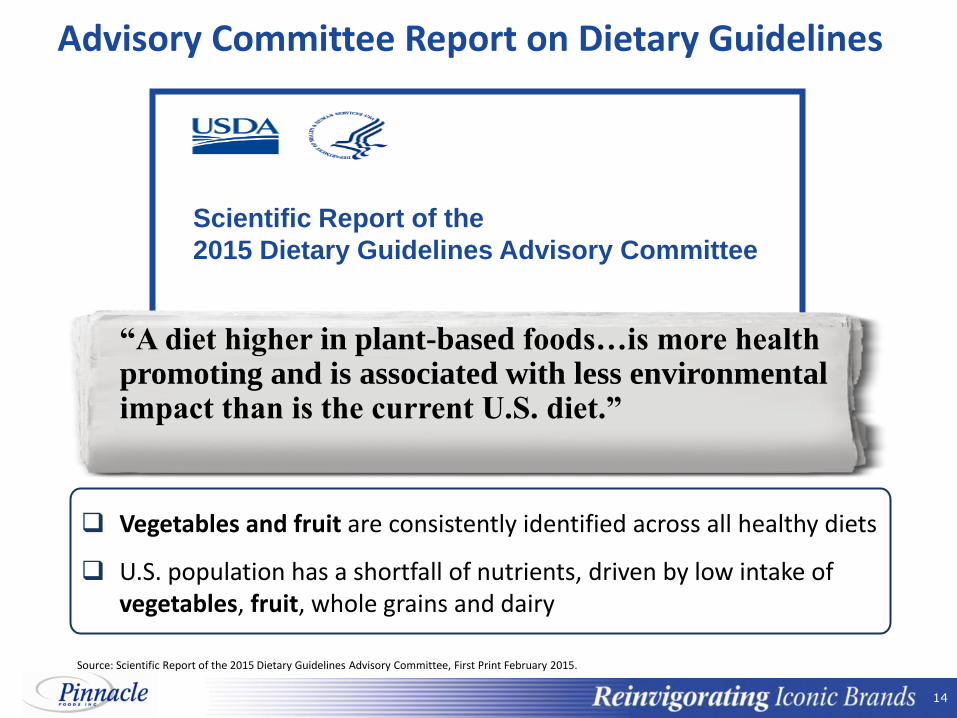
“A diet higher in plant-based foods…is more health promoting and is associated with less environmental impact than is the current U.S. diet.”
Advisory Committee Report on Dietary Guidelines
Vegetables and fruit are consistently identified across all healthy diets
U.S. population has a shortfall of nutrients, driven by low intake of vegetables, fruit, whole grains and dairy
Source: Scientific Report of the 2015 Dietary Guidelines Advisory Committee, First Print February 2015.
Scientific Report of the
2015 Dietary Guidelines Advisory Committee
15 15
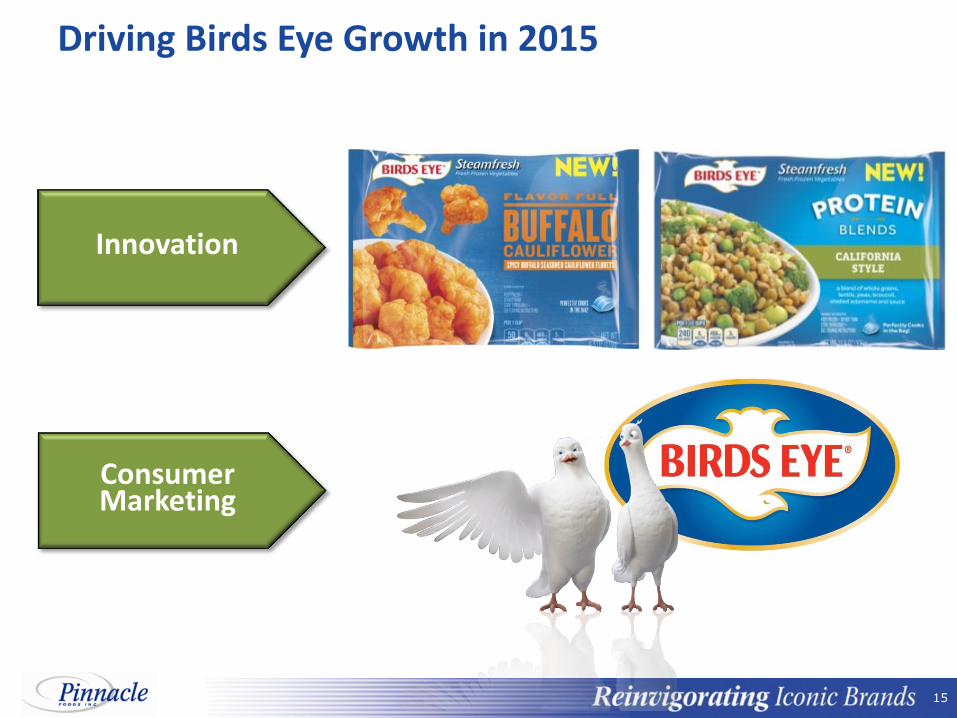
Driving Birds Eye Growth in 2015
Innovation
Consumer Marketing
16 16
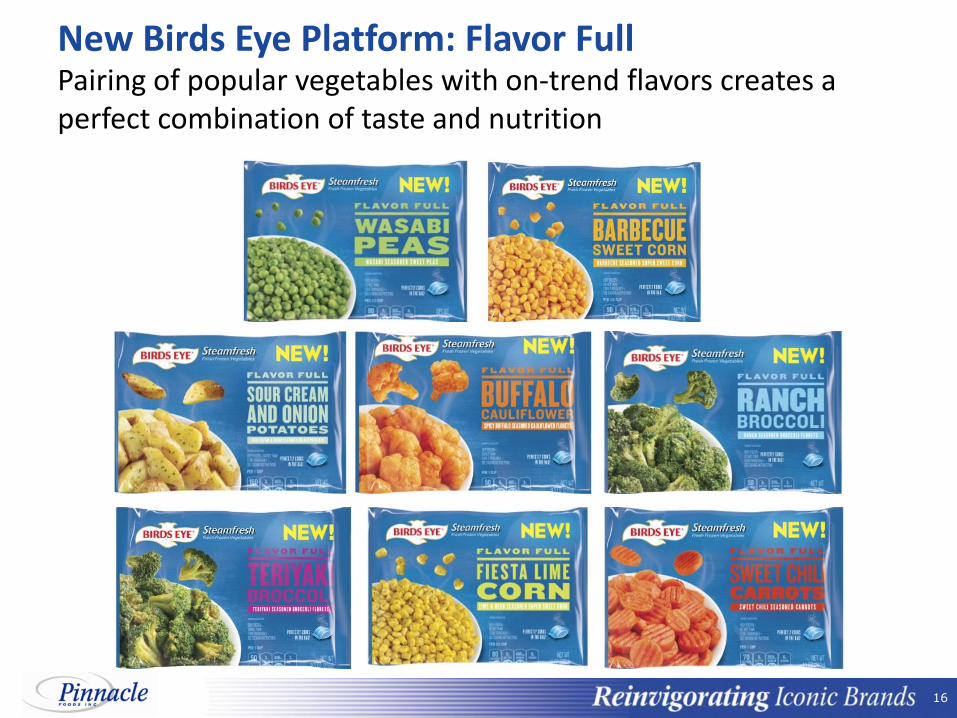
New Birds Eye Platform: Flavor Full Pairing of popular vegetables with on-trend flavors creates a perfect combination of taste and nutrition

17 17
New Birds Eye Platform: Protein Blends Delivering plant-based protein benefit through the power of nutrient-rich vegetables, beans and whole grains…
…with additional platforms planned for the 2nd half.
18 18
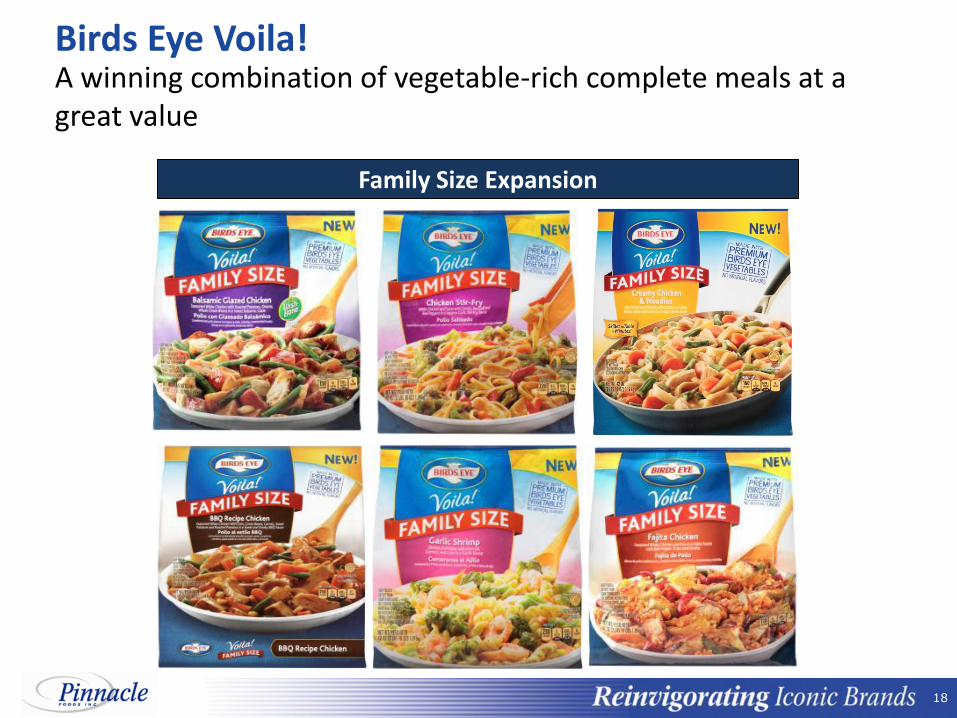
Birds Eye Voila! A winning combination of vegetable-rich complete meals at a great value
Family Size Expansion
19 19
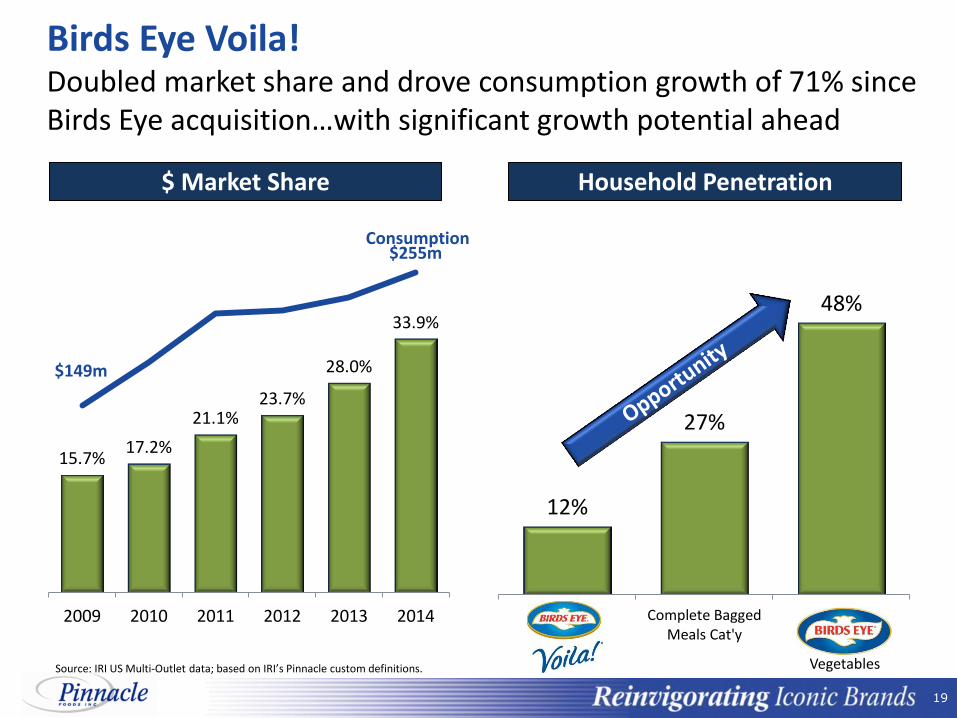
Birds Eye Voila!
15.7% 17.2%
21.1% 23.7%
28.0%
33.9%
2009 2010 2011 2012 2013 2014
Doubled market share and drove consumption growth of 71% since Birds Eye acquisition…with significant growth potential ahead
$ Market Share
Source: IRI US Multi-Outlet data; based on IRI’s Pinnacle custom definitions.
Consumption
$149m
$255m
12%
27%
48%
Voila! Complete BaggedMeals Cat'y
BE
Household Penetration
Vegetables
20 20
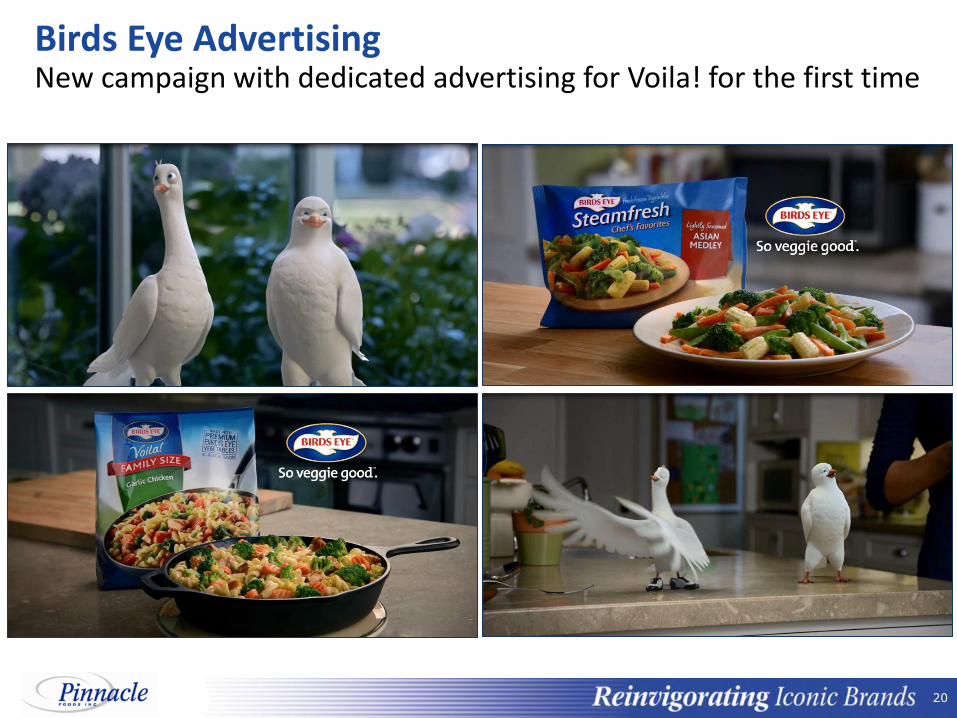
Birds Eye Advertising New campaign with dedicated advertising for Voila! for the first time
21 21
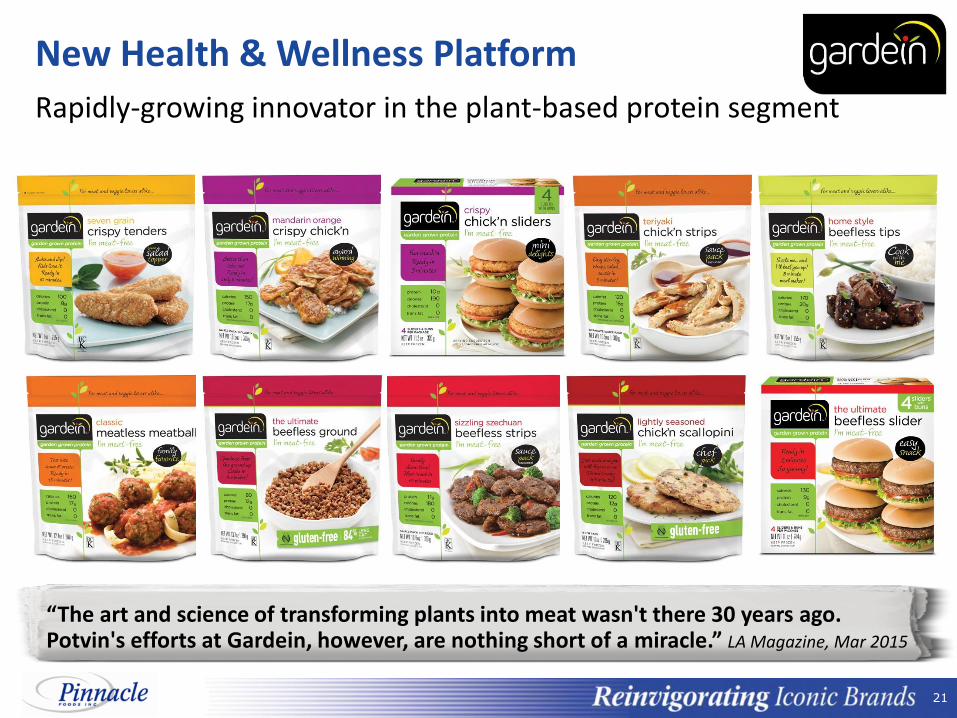
New Health & Wellness Platform
Rapidly-growing innovator in the plant-based protein segment
“The art and science of transforming plants into meat wasn't there 30 years ago. Potvin's efforts at Gardein, however, are nothing short of a miracle.” LA Magazine, Mar 2015
22 22
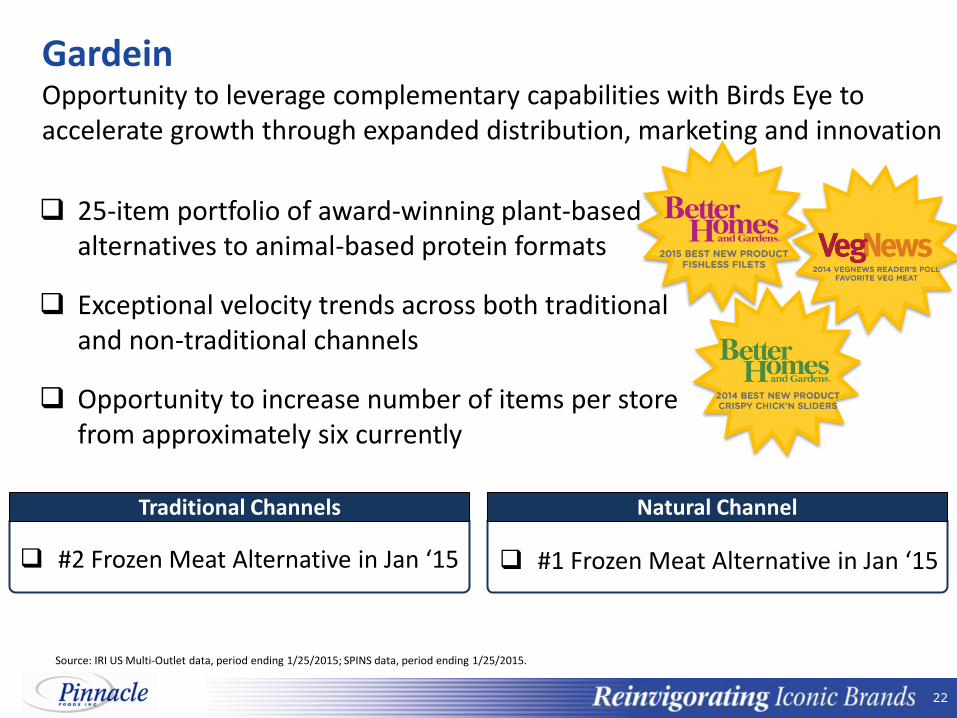
Gardein Opportunity to leverage complementary capabilities with Birds Eye to accelerate growth through expanded distribution, marketing and innovation
25-item portfolio of award-winning plant-based alternatives to animal-based protein formats
Exceptional velocity trends across both traditional and non-traditional channels
Opportunity to increase number of items per store from approximately six currently
#1 Frozen Meat Alternative in Jan ‘15 #2 Frozen Meat Alternative in Jan ‘15
Natural Channel Traditional Channels
Source: IRI US Multi-Outlet data, period ending 1/25/2015; SPINS data, period ending 1/25/2015.
23 23
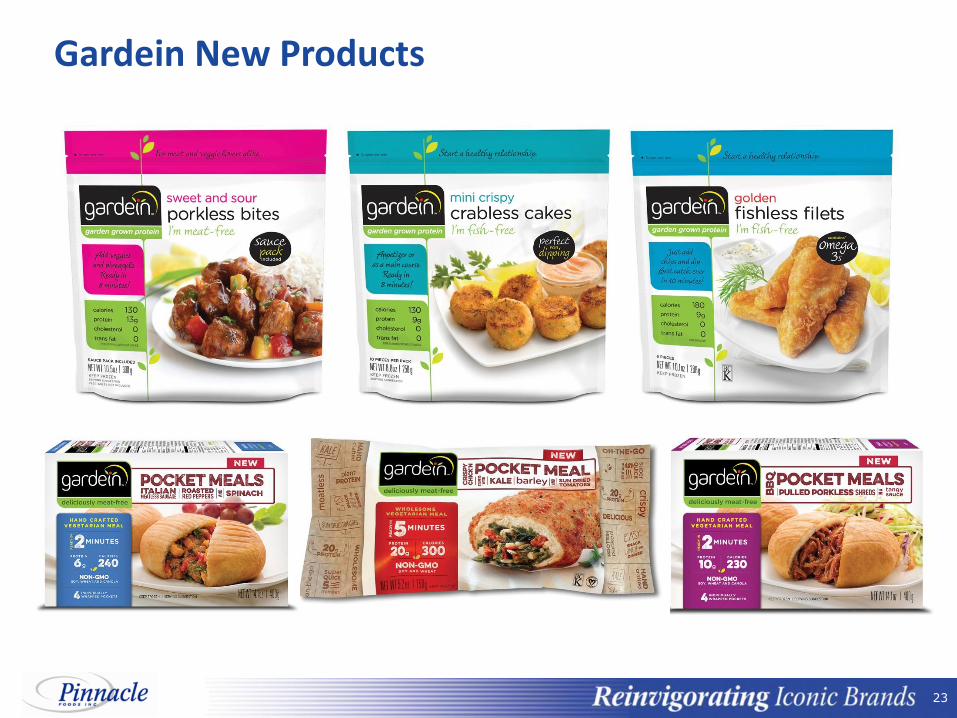
Gardein New Products
24 24
2014 Market Share Performance
Source: IRI US Multi-Outlet data, 52 wks ending 12/28/14; based on IRI’s Pinnacle custom definitions; market position ranks are among branded players.
Frozen Segment Grocery Segment
Major Brands Market Position $ Share %
Growing/ Holding Share
Frozen Vegetables #1 26.2 √
Frozen Complete Bagged Meals #2 33.9 √
Frozen Prepared Seafood #2 26.5 √
Frozen/Refrigerated Meat Substitutes #4 6.3 √
Shelf-Stable Pickles #1 35.0 √
Table Syrups #1 21.1 √
Cake/Brownie Mixes and Frostings #2 25.3 √
Shelf-Stable Salad Dressing #3 11.9
Frozen and Refrigerated Bagels #1 62.3 √
Frozen Pancakes/Waffles/French Toast #2 5.1
Full-Calorie Single Serve Frozen Dinners #3 8.0 √
Frozen Pizza-for-One (ex. French Bread) #4 6.5
Pie/Pastry Fruit Filling #1 37.4
Canned Meat #2 21.5 √ Fou
nd
atio
n B
ran
ds
Lead
ers
hip
Bra
nd
s Grew or held share in 10 of 14 categories
25 25
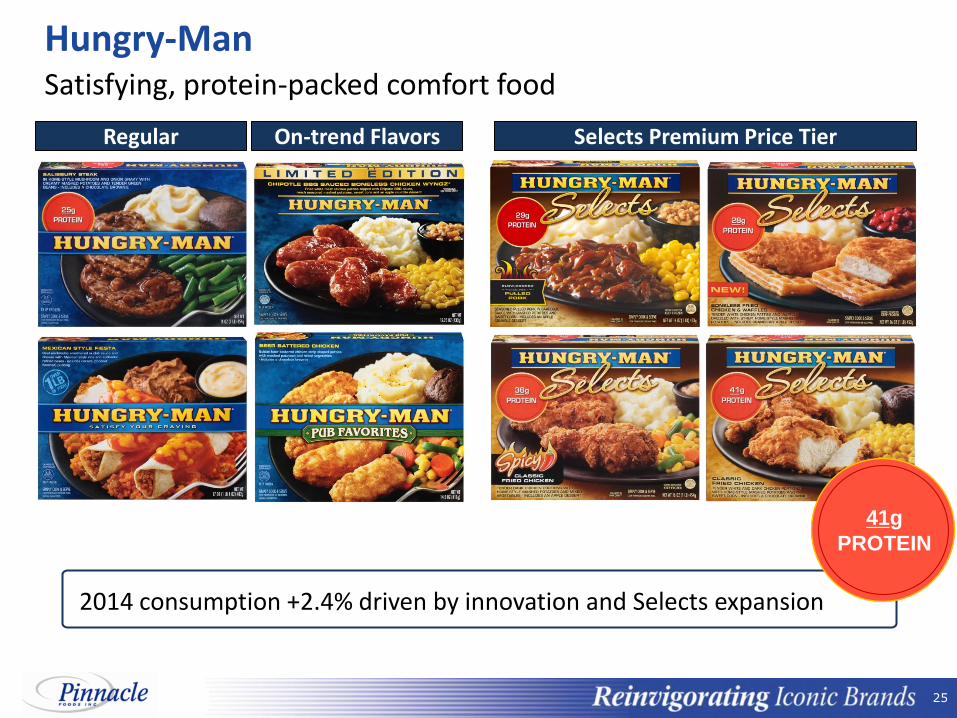
Hungry-Man Satisfying, protein-packed comfort food
Selects Premium Price Tier Regular On-trend Flavors
2014 consumption +2.4% driven by innovation and Selects expansion
41g
PROTEIN
26 26
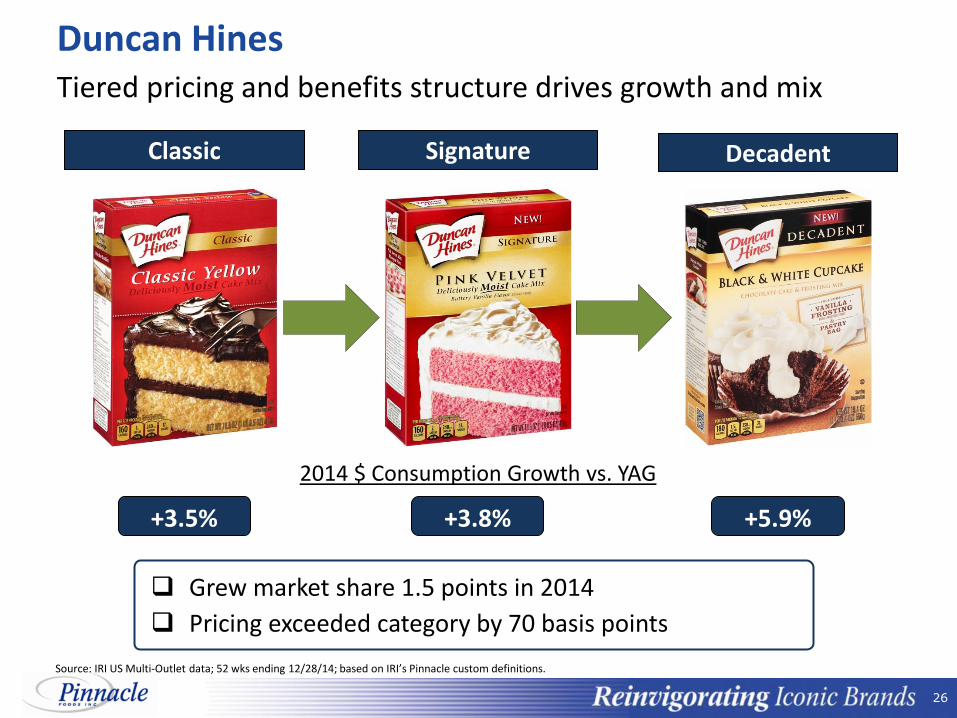
Duncan Hines Tiered pricing and benefits structure drives growth and mix
Signature Classic Decadent
+3.5%
2014 $ Consumption Growth vs. YAG
Grew market share 1.5 points in 2014
Pricing exceeded category by 70 basis points
+3.8% +5.9%
Source: IRI US Multi-Outlet data; 52 wks ending 12/28/14; based on IRI’s Pinnacle custom definitions.
27 27
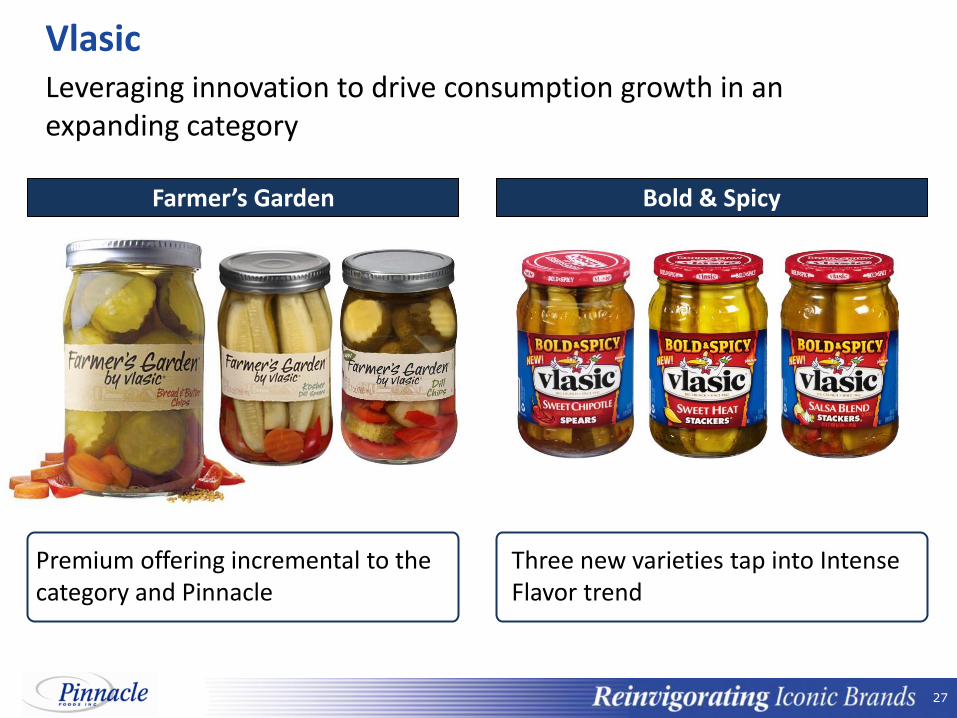
Vlasic Leveraging innovation to drive consumption growth in an expanding category
Premium offering incremental to the category and Pinnacle
Bold & Spicy Farmer’s Garden
Three new varieties tap into Intense Flavor trend
28 28
Agenda Overview
Creating Value in a Challenging Environment
Driving Margin Expansion and Cash Flow
Outlook
29 29
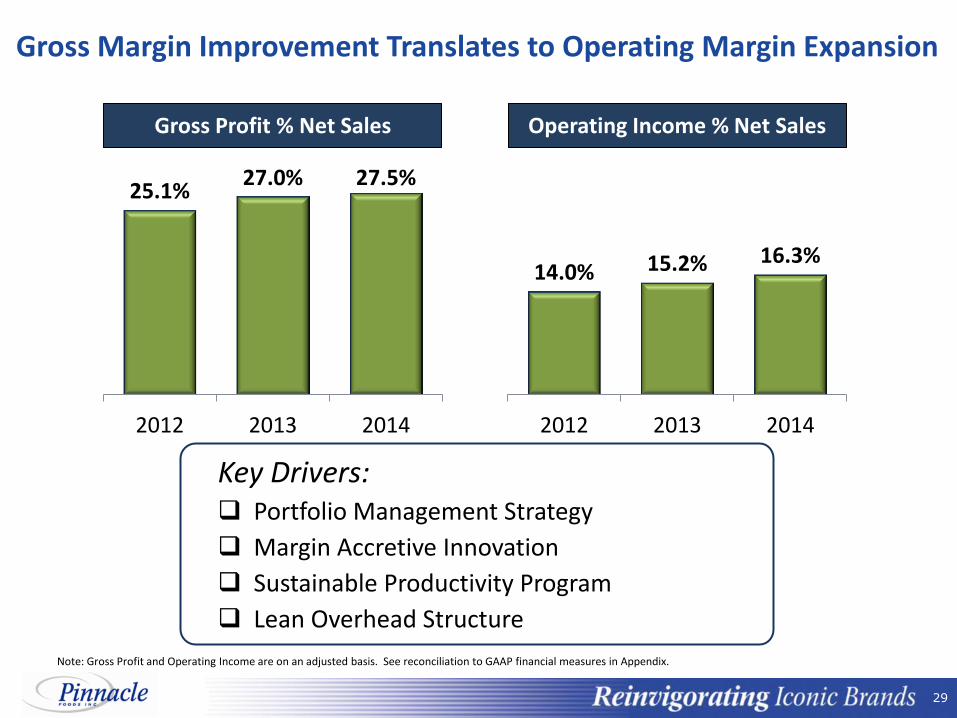
Gross Margin Improvement Translates to Operating Margin Expansion
25.1% 27.0% 27.5%
2012 2013 2014
Gross Profit % Net Sales
14.0% 15.2% 16.3%
2012 2013 2014
Operating Income % Net Sales
Note: Gross Profit and Operating Income are on an adjusted basis. See reconciliation to GAAP financial measures in Appendix.
Key Drivers: Portfolio Management Strategy
Margin Accretive Innovation
Sustainable Productivity Program
Lean Overhead Structure

30 30
Margin-Enhancing Innovation All innovation is targeted to be margin accretive to the portfolio

31 31
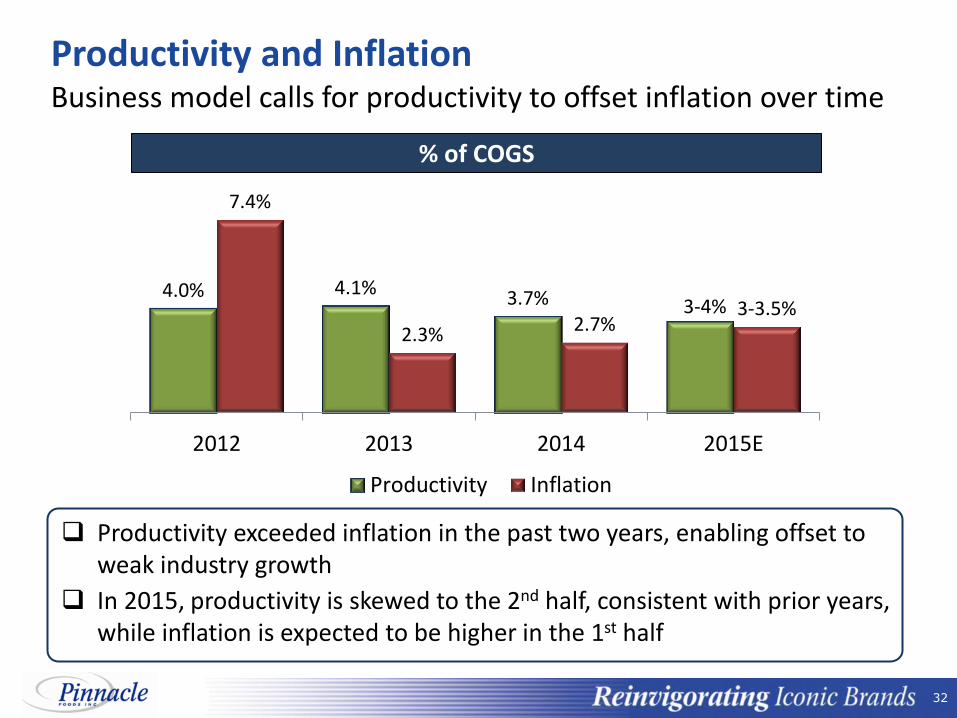
4.0% 4.1%
3.7% 3%-4%
Productivity
Maximizing Value through Productivity
2012 2013 2014 2015E
Sustainable ongoing program targets 3-4% annual savings in COGS
32 32
Productivity and Inflation
4.0% 4.1% 3.7% 3-4%
7.4%
2.3% 2.7% 3-3.5%
2012 2013 2014 2015E
Productivity Inflation
% of COGS
Productivity exceeded inflation in the past two years, enabling offset to weak industry growth
In 2015, productivity is skewed to the 2nd half, consistent with prior years, while inflation is expected to be higher in the 1st half
Business model calls for productivity to offset inflation over time
33 33
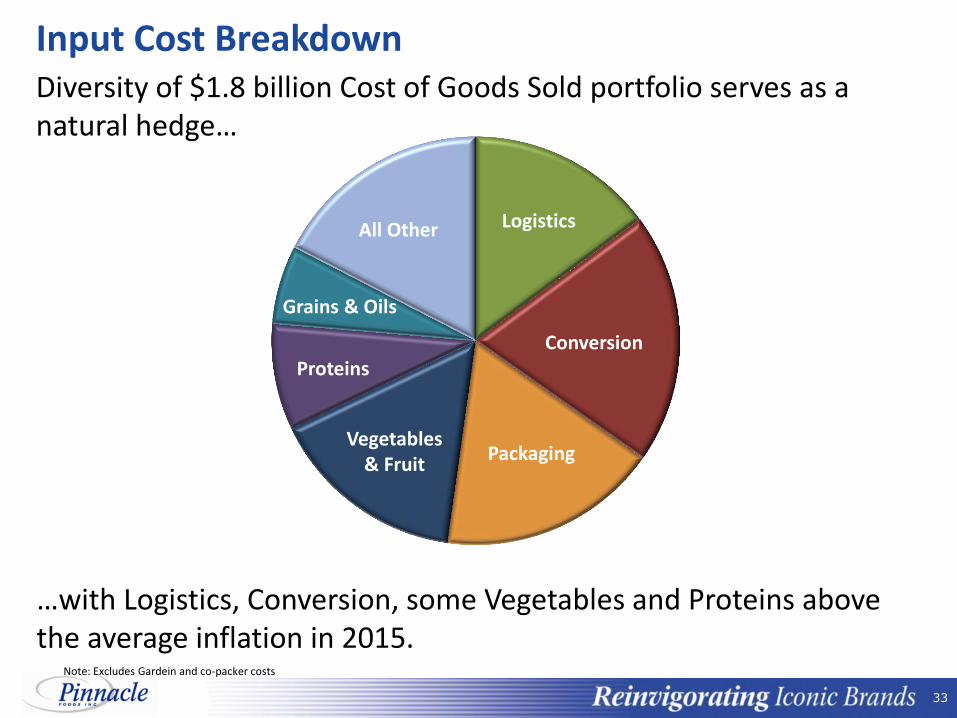
Input Cost Breakdown
Conversion
Logistics
Proteins
Grains & Oils
Packaging Vegetables
& Fruit
All Other
Note: Excludes Gardein and co-packer costs
…with Logistics, Conversion, some Vegetables and Proteins above the average inflation in 2015.
Diversity of $1.8 billion Cost of Goods Sold portfolio serves as a natural hedge…
34 34
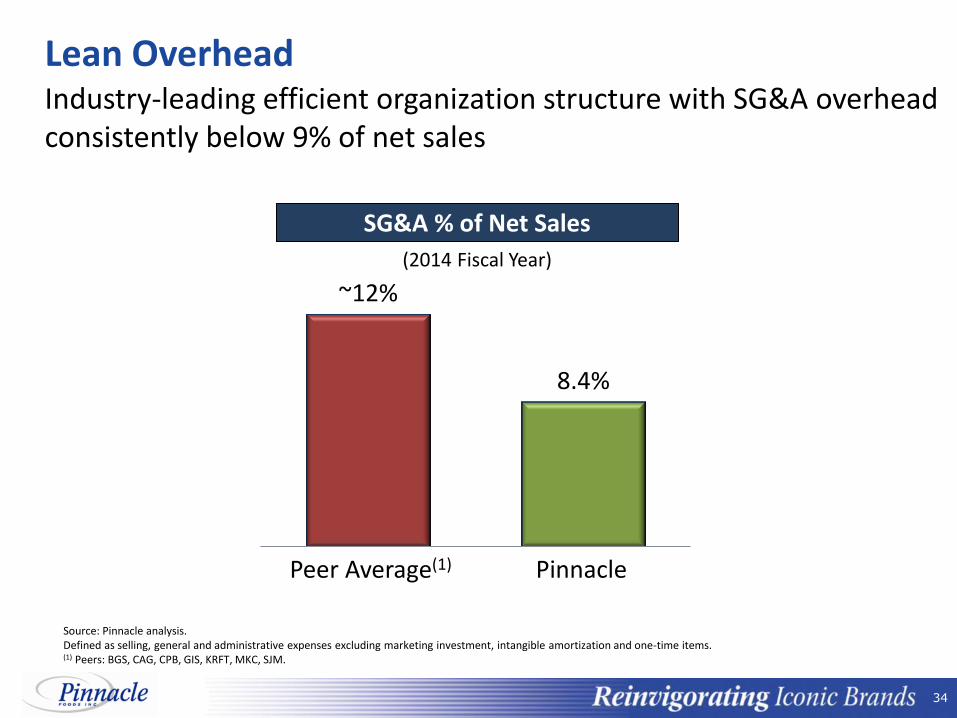
Source: Pinnacle analysis. Defined as selling, general and administrative expenses excluding marketing investment, intangible amortization and one-time items. (1) Peers: BGS, CAG, CPB, GIS, KRFT, MKC, SJM.
Lean Overhead Industry-leading efficient organization structure with SG&A overhead consistently below 9% of net sales
(2014 Fiscal Year)
SG&A % of Net Sales
~12%
8.4%
Peer Average(1) Pinnacle
35 35
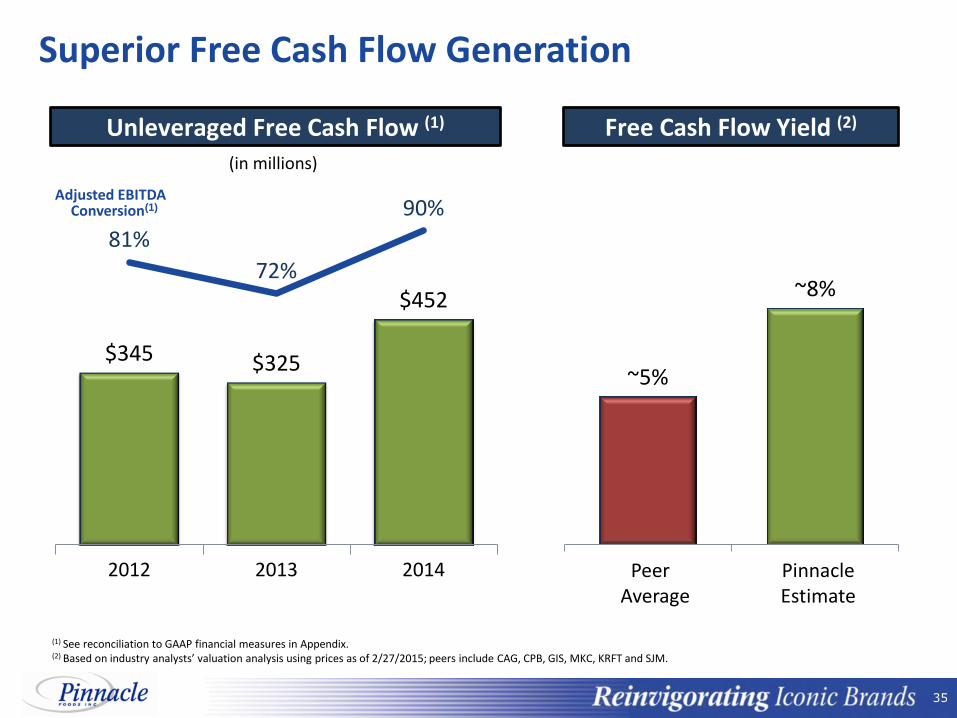
$345 $325
$452
81%
72%
90%
0%
25%
50%
75%
100%
$0
$100
$200
$300
$400
$500
$600
$700
2012 2013 2014
(1) See reconciliation to GAAP financial measures in Appendix. (2) Based on industry analysts’ valuation analysis using prices as of 2/27/2015; peers include CAG, CPB, GIS, MKC, KRFT and SJM.
Unleveraged Free Cash Flow (1)
Superior Free Cash Flow Generation
Adjusted EBITDA
Conversion(1)
Free Cash Flow Yield (2)
~5%
~8%
Peer Average
Pinnacle Estimate
(in millions)

36 36
Capital Allocation Strategy
Acquisition CAPEX
Significant cash of $628 million deployed to drive shareholder value through multiple actions
Debt Reduction
Share Repurchase
Strategic Acquisitions
Dividends Base
CAPEX
Note: $628m of cash deployed represents Net Cash Used in Investing Activities ($270m) plus Net Cash Used in Financing Activities ($358m)

37 37
A Disciplined Approach to M&A
North America focus
Existing or adjacent categories
Market leadership or line of sight to leadership
Synergy-rich transaction
Speed of integration

38 38
Acquisition Integration
State-of-the-art internal capacity on track for Q2 2015 start-up
Full synergy run-rate beginning in H2
Enabler to innovation
2014-2015 Acquisition CAPEX: ~$50 million
Wish-Bone Manufacturing
39 39
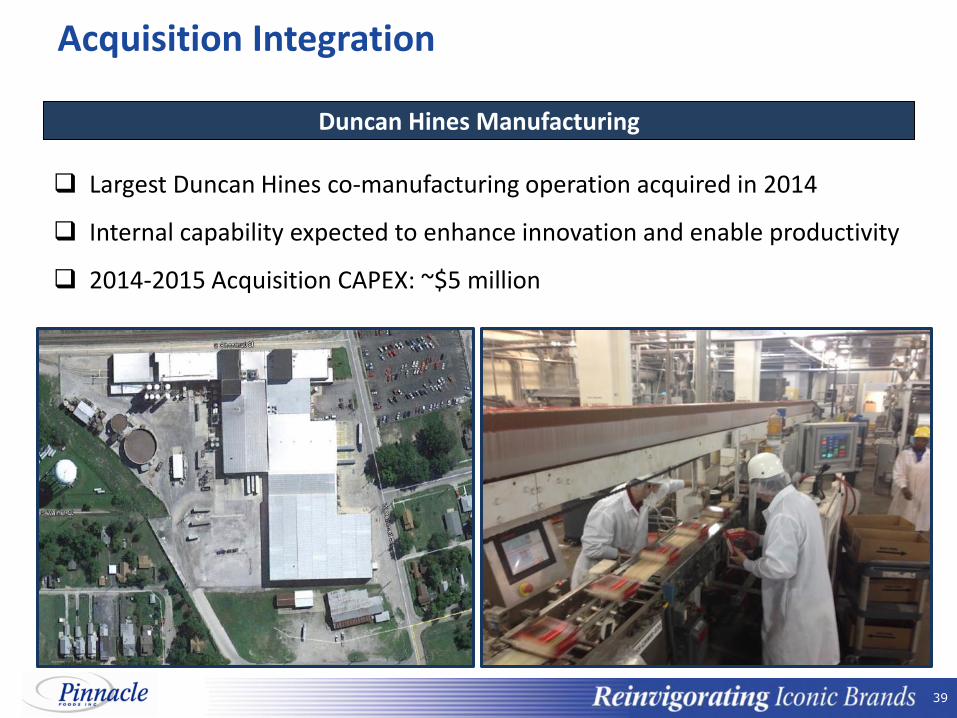
Acquisition Integration
Duncan Hines Manufacturing
Largest Duncan Hines co-manufacturing operation acquired in 2014
Internal capability expected to enhance innovation and enable productivity
2014-2015 Acquisition CAPEX: ~$5 million
40 40
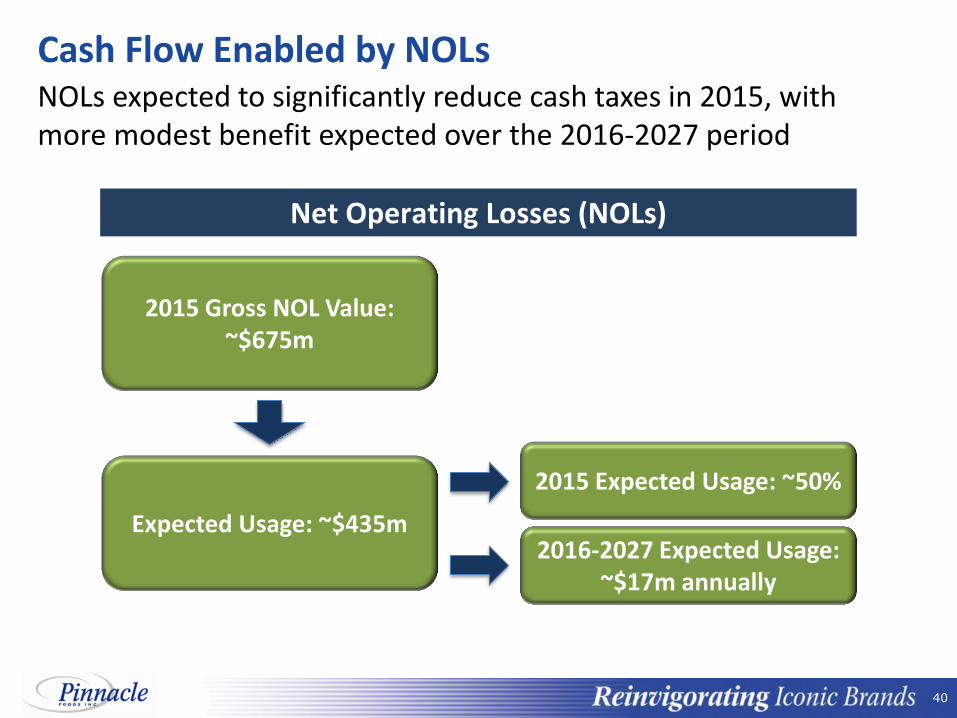
Cash Flow Enabled by NOLs NOLs expected to significantly reduce cash taxes in 2015, with more modest benefit expected over the 2016-2027 period
Net Operating Losses (NOLs)
2015 Gross NOL Value: ~$675m
Expected Usage: ~$435m
2015 Expected Usage: ~50%
2016-2027 Expected Usage: ~$17m annually

41 41
Tax-Related Cash Benefits Beyond 2015
Tax Shield
Cash Benefit
NOL tax benefit $17 $6
Wish-Bone & Gardein amortization 45 17
Effective Tax Rate Reduction* 4
Total Cash Tax Benefit $27
Future Cash Tax Benefits $m
Tax benefits continue beyond 2015 driven by residual NOLs, acquisition-related tax amortization and a lower effective tax rate
Duration of Benefit
12 years
13-14 years
Indefinite
*Reflects benefit of Domestic Manufacturing Deduction that is available upon becoming a full cash taxpayer, which Pinnacle will migrate to during 2015.
42 42
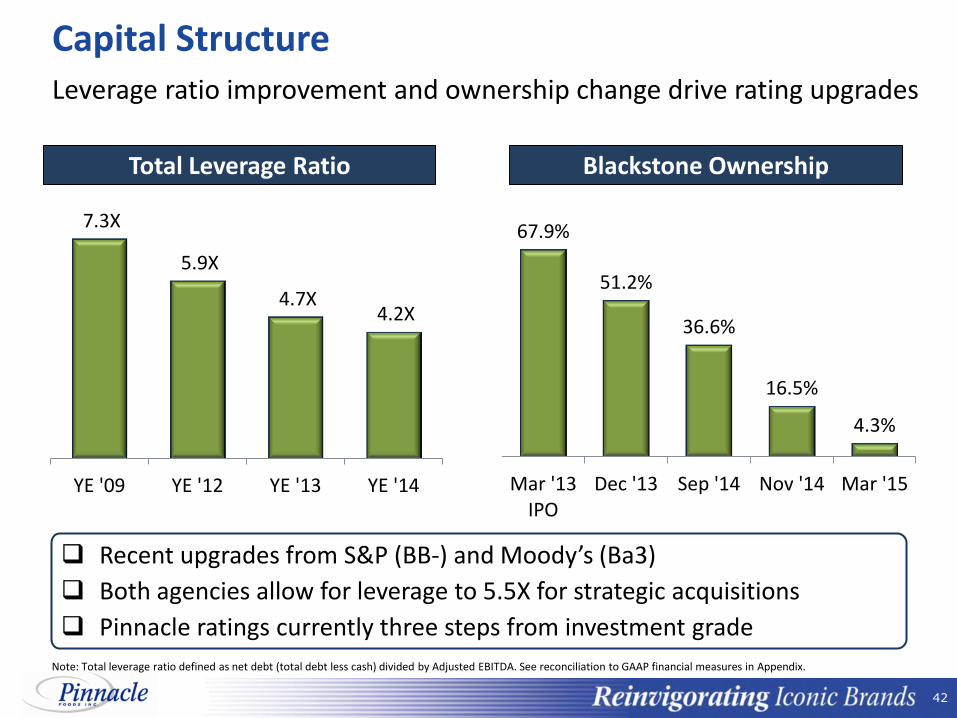
Capital Structure Leverage ratio improvement and ownership change drive rating upgrades
Note: Total leverage ratio defined as net debt (total debt less cash) divided by Adjusted EBITDA. See reconciliation to GAAP financial measures in Appendix.
Recent upgrades from S&P (BB-) and Moody’s (Ba3)
Both agencies allow for leverage to 5.5X for strategic acquisitions
Pinnacle ratings currently three steps from investment grade
67.9%
51.2%
36.6%
16.5%
4.3%
Mar '13IPO
Dec '13 Sep '14 Nov '14 Mar '15
Blackstone Ownership
7.3X
5.9X
4.7X 4.2X
YE '09 YE '12 YE '13 YE '14
Total Leverage Ratio

43 43
Dividends
$0.72 $0.72
$0.84 $0.84 $0.84 $0.94 $0.94
Jul-13 Oct-13 Jan-14 Apr-14 Jul-14 Oct-14 Jan-15
Annualized Dividend Per Share
Dividends payout ratio targeted at 50% of net earnings
44 44
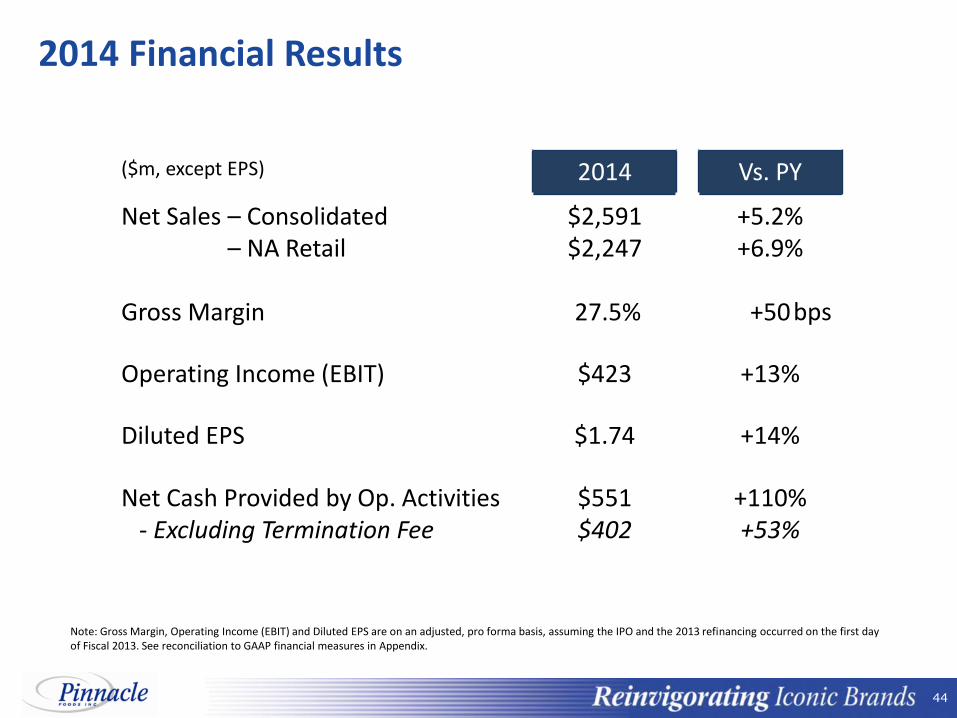
2014 Financial Results
($m, except EPS) 2014 Vs. PY
Net Sales – Consolidated Net Sales – NA Retail
$2,591 $2,247
+5.2% +6.9%
Gross Margin 27.5% +50
Operating Income (EBIT) $423 +13%
Diluted EPS $1.74 +14%
Net Cash Provided by Op. Activities - Excluding Termination Fee
$551 $402
+110% +53%
bps
Note: Gross Margin, Operating Income (EBIT) and Diluted EPS are on an adjusted, pro forma basis, assuming the IPO and the 2013 refinancing occurred on the first day of Fiscal 2013. See reconciliation to GAAP financial measures in Appendix.
45 45
Agenda Overview
Creating Value in a Challenging Environment
Driving Margin Expansion and Cash Flow
Outlook
46 46
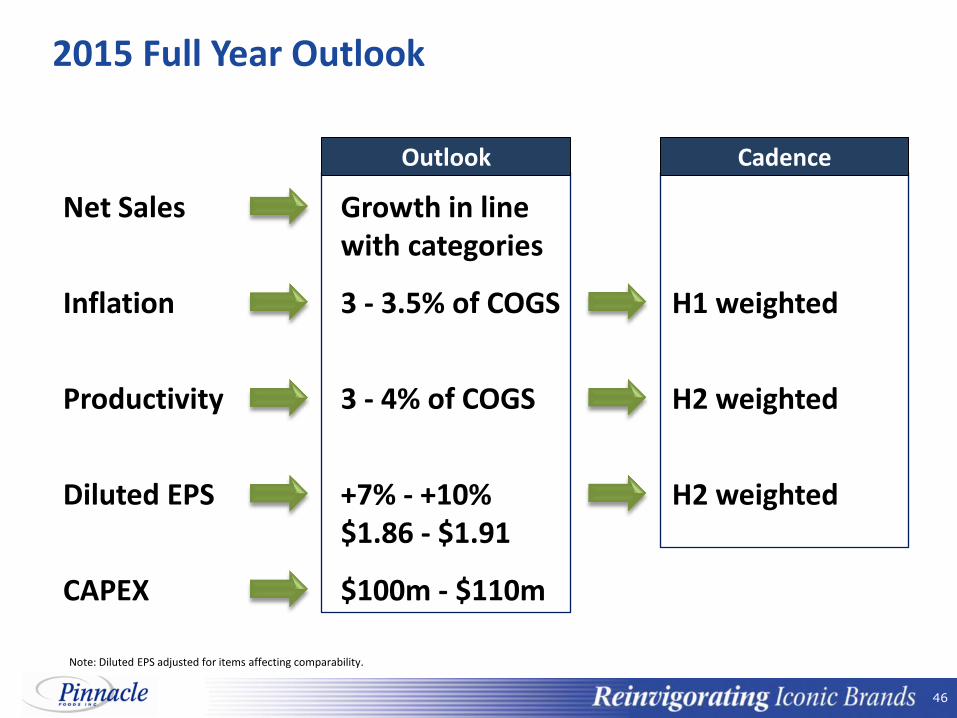
2015 Full Year Outlook
Net Sales Growth in line with categories
Inflation 3 - 3.5% of COGS Nm
Productivity 3 - 4% of COGS nm
Diluted EPS +7% - +10% $1.86 - $1.91
CAPEX $100m - $110m
Note: Diluted EPS adjusted for items affecting comparability.
Outlook Cadence
H1 weighted
H2 weighted
H2 weighted

47 47
Attractive Value Creation Potential
Long-Term Organic Growth Algorithm
Net Sales
Operating Income
EPS
Dividend Yield
Note: Excludes items affecting comparability.
In Line with Categories
10 – 12%
4 – 5%
7 – 8%
3 – 4%
Accretive acquisitions would accelerate growth further
Realistic organic growth targets
Sustainable productivity program
Strong FCF providing optionality
Disciplined M&A approach with demonstrated value creation

48 48
PINNACLE FOODS INC.
Appendix
49 49
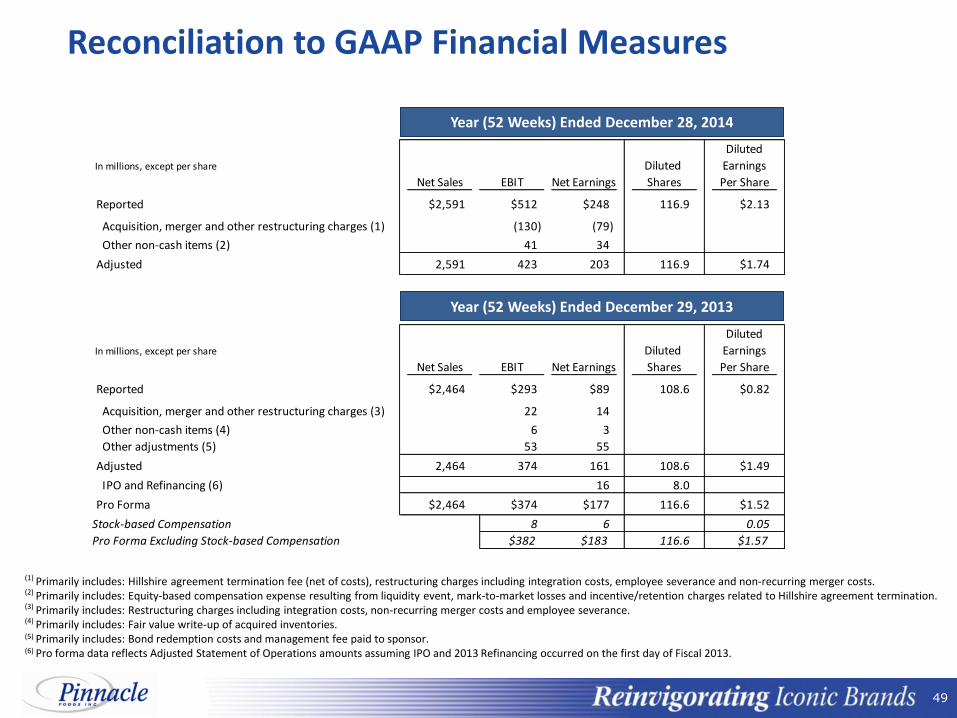
Reconciliation to GAAP Financial Measures
(1) Primarily includes: Hillshire agreement termination fee (net of costs), restructuring charges including integration costs, employee severance and non-recurring merger costs. (2) Primarily includes: Equity-based compensation expense resulting from liquidity event, mark-to-market losses and incentive/retention charges related to Hillshire agreement termination. (3) Primarily includes: Restructuring charges including integration costs, non-recurring merger costs and employee severance. (4) Primarily includes: Fair value write-up of acquired inventories. (5) Primarily includes: Bond redemption costs and management fee paid to sponsor. (6) Pro forma data reflects Adjusted Statement of Operations amounts assuming IPO and 2013 Refinancing occurred on the first day of Fiscal 2013.
Year (52 Weeks) Ended December 29, 2013
Diluted
In millions, except per share Diluted Earnings
Net Sales EBIT Net Earnings Shares Per Share
Reported $2,591 $512 $248 116.9 $2.13
Acquisition, merger and other restructuring charges (1) (130) (79)
Other non-cash items (2) 41 34
Adjusted 2,591 423 203 116.9 $1.74
Diluted
In millions, except per share Diluted Earnings
Net Sales EBIT Net Earnings Shares Per Share
Reported $2,464 $293 $89 108.6 $0.82
Acquisition, merger and other restructuring charges (3) 22 14
Other non-cash items (4) 6 3
Other adjustments (5) 53 55
Adjusted 2,464 374 161 108.6 $1.49
IPO and Refinancing (6) 16 8.0
Pro Forma $2,464 $374 $177 116.6 $1.52
Stock-based Compensation 8 6 0.05
Pro Forma Excluding Stock-based Compensation $382 $183 116.6 $1.57
Year (52 Weeks) Ended December 28, 2014

50 50
Reconciliation to GAAP Financial Measures
(1) Primarily includes: Accelerated depreciation from plant consolidations, restructuring charges including integration costs and employee severance. (2) Primarily includes: Mark-to-market gains / losses. (3) Primarily includes: Bond redemption costs. (4) Pro forma data reflects Adjusted Statement of Operations amounts assuming IPO occurred on the first day of Fiscal 2012.
Diluted
In millions, except per share Diluted Earnings
Net Sales EBIT Net Earnings Shares Per Share
Reported $2,479 $284 $53 86.5 $0.61
Acquisition, merger and other restructuring charges (1) 45 28
Other non-cash items (2) 0 0
Other adjustments (3) 21 23
Adjusted 2,479 350 104 86.5 $1.20
IPO (4) 30 30.9
Public company costs (4) (3) (2)
Pro Forma $2,479 $347 $132 117.4 $1.13
Year (53 Weeks) Ended December 30, 2012
51 51
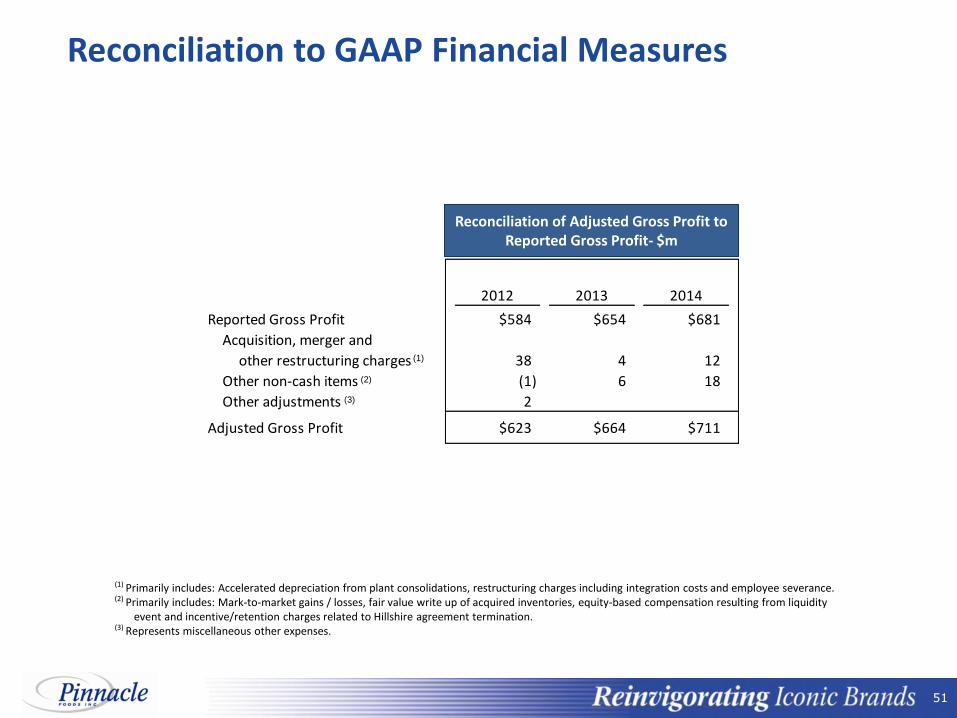
Reconciliation to GAAP Financial Measures
(1) Primarily includes: Accelerated depreciation from plant consolidations, restructuring charges including integration costs and employee severance. (2) Primarily includes: Mark-to-market gains / losses, fair value write up of acquired inventories, equity-based compensation resulting from liquidity
event and incentive/retention charges related to Hillshire agreement termination. (3) Represents miscellaneous other expenses.
Reconciliation of Adjusted Gross Profit to Reported Gross Profit- $m
2012 2013 2014
Reported Gross Profit $584 $654 $681
Acquisition, merger and
other restructuring charges 38 4 12
Other non-cash items (1) 6 18
Other adjustments 2
Adjusted Gross Profit $623 $664 $711
(1)
(2)
(3)
52 52
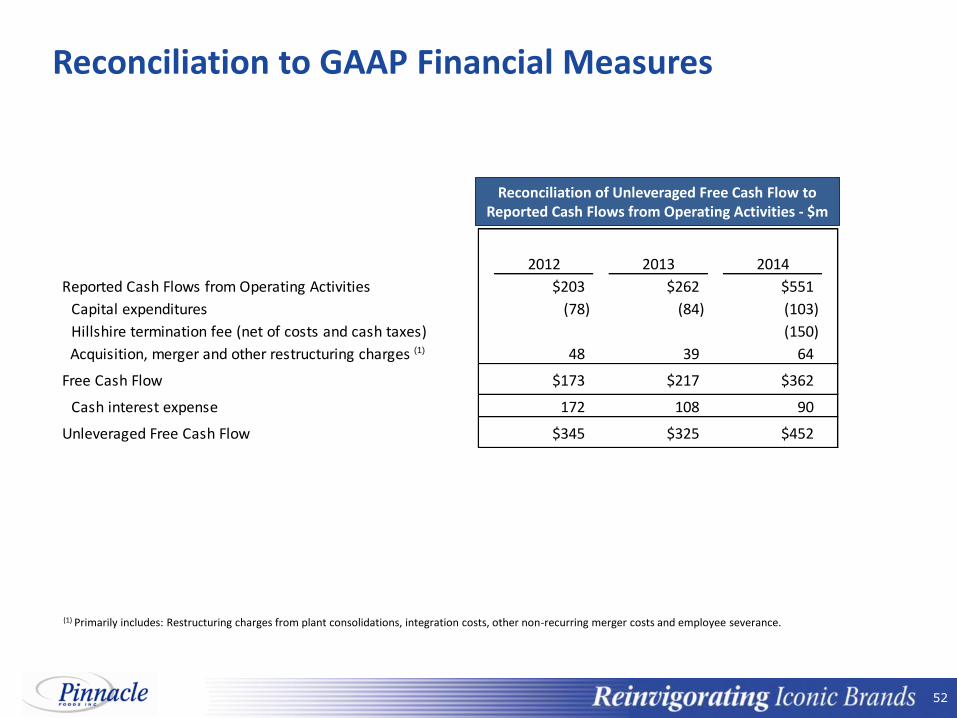
Reconciliation to GAAP Financial Measures
(1) Primarily includes: Restructuring charges from plant consolidations, integration costs, other non-recurring merger costs and employee severance.
2012 2013 2014
Reported Cash Flows from Operating Activities $203 $262 $551
Capital expenditures (78) (84) (103)
Hillshire termination fee (net of costs and cash taxes) (150)
Acquisition, merger and other restructuring charges 48 39 64
Free Cash Flow $173 $217 $362
Cash interest expense 172 108 90
Unleveraged Free Cash Flow $345 $325 $452
(1)
Reconciliation of Unleveraged Free Cash Flow to Reported Cash Flows from Operating Activities - $m
53 53
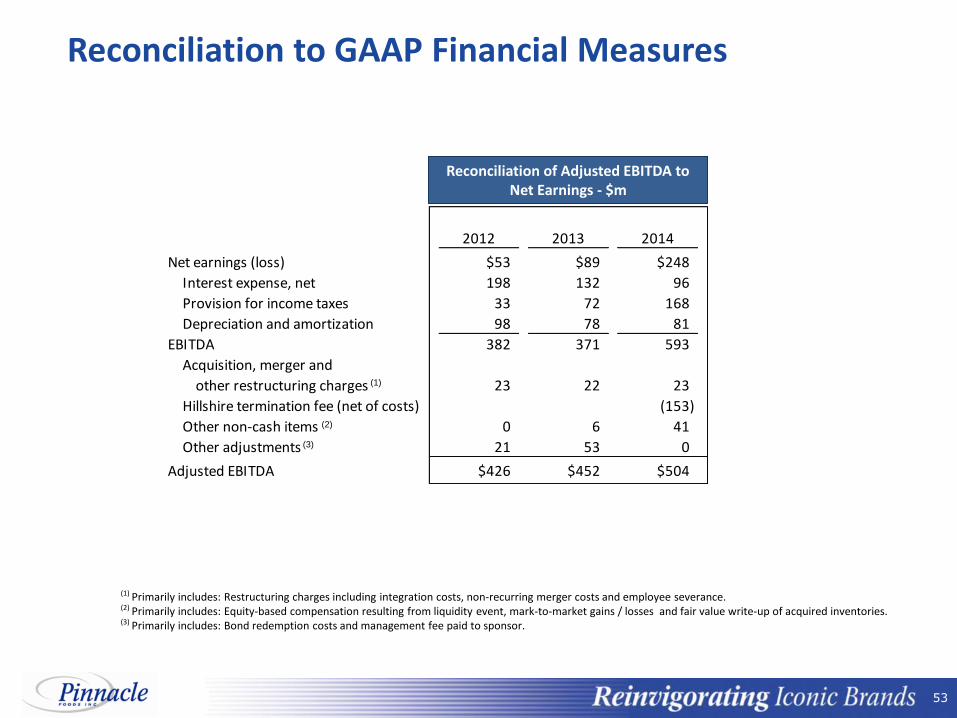
Reconciliation to GAAP Financial Measures
(1) Primarily includes: Restructuring charges including integration costs, non-recurring merger costs and employee severance. (2) Primarily includes: Equity-based compensation resulting from liquidity event, mark-to-market gains / losses and fair value write-up of acquired inventories. (3) Primarily includes: Bond redemption costs and management fee paid to sponsor.
2012 2013 2014
Net earnings (loss) $53 $89 $248
Interest expense, net 198 132 96
Provision for income taxes 33 72 168
Depreciation and amortization 98 78 81
EBITDA 382 371 593
Acquisition, merger and
other restructuring charges 23 22 23
Hillshire termination fee (net of costs) (153)
Other non-cash items 0 6 41
Other adjustments 21 53 0
Adjusted EBITDA $426 $452 $504
Reconciliation of Adjusted EBITDA to Net Earnings - $m
(3)
(1)
(2)