pjm manual 15
TRANSCRIPT

PJM Manual 15:Cost Development GuidelinesRevision: 2930Effective Date: May 15, 2017July 31, 2018
Prepared byCost Development SubcommitteePJM © 20172018

PJM Manual 15: Cost Development GuidelinesTable of Contents
Table of Contents
Table of Exhibits.........................................................................................8
Approval.....................................................................................................10
Current Revision.......................................................................................11
Section 1: Introduction............................................................................ 121.1 About PJM Manuals....................................................................................................121.2 How to Use This Manual............................................................................................ 121.3 The intended audiences for this Manual:....................................................................121.4 What is in this Manual?.............................................................................................. 121.5 Cost Development Subcommittee Mission................................................................. 121.6 Purpose of this Manual...............................................................................................13
1.6.1 Reason for Cost Based Offers: Market Power Mitigation...............................131.7 Components of Cost................................................................................................... 13
1.7.1 Generator offer curves................................................................................... 141.7.2 Start-up Cost.................................................................................................. 141.7.3 No Load Cost................................................................................................. 141.7.4 Incremental Cost............................................................................................ 141.7.5 Total Production Cost..................................................................................... 15
1.8 Cost Methodology and Approval Process...................................................................151.9 References.................................................................................................................. 15
Section 2: Policies for All Unit Types.................................................... 172.1 Heat Input and Rates..................................................................................................17
2.1.1 Heat Input andRate Policy............................................................................. 172.2 Performance Factors...................................................................................................18
2.2.1 Engineering Judgment in Performance Factors.............................................182.2.2 Higher Heating Value of Fuel.........................................................................182.2.3 Calculation Methods of Performance Factors................................................ 192.2.4 ‘Like’ Units for Performance Factors..............................................................19
2.3 Fuel Cost Policies and Guidelines..............................................................................192.3.1 Submission of and/or Modifications to Fuel Cost Policies..............................20
2.3.1.1 Annual Review...................................................................................202.3.1.2 Outside Annual Review/New Resource.............................................212.3.1.3 Revocation......................................................................................... 22
2.3.2 Fuel Cost Calculation..................................................................................... 222.3.3 Total Fuel Related Costs................................................................................232.3.4 Types of Fuel Costs....................................................................................... 232.3.5 Emission Allowances......................................................................................24
Revision: 2930, Effective Date: 05/15/201707/31/2018 PJM © 20172018 2

PJM Manual 15: Cost Development GuidelinesTable of Contents
2.3.6 Leased Fuel Transportation Equipment......................................................... 24................................................................................................................................. 242.3.7 Engineering Judgement in Fuel Cost Calculations........................................ 25
2.4 Start-up Cost............................................................................................................... 252.4.1 Start-up Cost Definitions................................................................................ 252.4.2 Engineering Judgment in Start Costs............................................................ 25
2.5 No Load.......................................................................................................................252.5.1 No-Load Definitions........................................................................................ 252.5.2 No-Load Fuel..................................................................................................262.5.3 No Load Calculation.......................................................................................26
2.6 Variable Maintenance Cost......................................................................................... 272.6.1 Escalation Index............................................................................................. 272.6.2 Maintenance Period........................................................................................282.6.3 Incremental Adjustment Parameter................................................................292.6.4 Equivalent Hourly Maintenance Cost............................................................. 292.6.5 Immature Units: Maintenance Costs.............................................................. 30................................................................................................................................. 32
2.7 Synchronized Reserve................................................................................................ 322.8 Regulation Service...................................................................................................... 32
Section 3: Nuclear Unit Cost Guidelines............................................... 383.1 Nuclear Heat Rate...................................................................................................... 383.2 Performance Factor.....................................................................................................383.3 Fuel Cost.....................................................................................................................38
3.3.1 Basic Nuclear Fuel Cost................................................................................ 383.3.2 Total Fuel-Related Costs for Nuclear Units....................................................38
3.4 Start-up Costs............................................................................................................. 383.4.1 Hot Start-up Cost........................................................................................... 393.4.2 Intermediate Start-up Cost............................................................................. 393.4.3 Cold Start-up Cost..........................................................................................393.4.4 Additional Components Applied to Hot, Intermediate and Cold Start-up
Costs....................................................................................................................393.5 No-Load Cost.............................................................................................................. 403.6 Maintenance Cost....................................................................................................... 40
3.6.1 Configuration Addition Maintenance Adder....................................................403.6.2 Calculation of the Configuration Addition Maintenance Adder:...................... 413.6.3 Reductions in Total Maintenance Costs.........................................................42
3.7 Synchronized Reserve Cost........................................................................................433.8 Regulation Cost...........................................................................................................43
Section 4: Fossil Steam Unit Cost Development.................................. 444.1 Heat Rate.................................................................................................................... 444.2 Performance Factor.....................................................................................................444.3 Fuel Cost.....................................................................................................................44
4.3.1 Total Fuel Related Cost..................................................................................44
Revision: 2930, Effective Date: 05/15/201707/31/2018 PJM © 20172018 3

PJM Manual 15: Cost Development GuidelinesTable of Contents
4.4 Start-up Cost............................................................................................................... 454.4.1 Hot Start-up Cost........................................................................................... 454.4.2 Intermediate Start-up Cost............................................................................. 464.4.3 Cold Start-up Cost..........................................................................................46
4.5 No-Load Cost.............................................................................................................. 474.6 Maintenance Cost....................................................................................................... 47
4.6.1 Configuration Addition Maintenance Adder....................................................484.6.2 Calculation of the Configuration Addition Maintenance Adder:...................... 484.6.3 Reductions in Total Maintenance Costs:........................................................49
4.7 Synchronized Reserve................................................................................................ 494.8 Regulation....................................................................................................................50
Section 5: Combined Cycle (CC) Cost Development............................515.1 Heat Rate.................................................................................................................... 515.2 Performance Factors...................................................................................................515.3 Fuel Cost.....................................................................................................................515.4 Start-up Cost............................................................................................................... 515.5 No-Load Cost.............................................................................................................. 525.6 Maintenance Cost....................................................................................................... 52
5.6.1 Combined Cycle / CT Long Term Service Contract Cost Recovery............... 535.6.2 Long Term Maintenance Expenses................................................................535.6.3 Equivalent service hours (ESH)..................................................................... 53
5.7 Synchronized Reserve................................................................................................ 545.8 Regulation....................................................................................................................55
Section 6: Combustion Turbine (CT) and Diesel Engine Costs........... 566.1 Combustion Turbine and Diesel Engine Heat Rate.................................................... 566.2 Performance Factor.....................................................................................................566.3 Fuel Cost.....................................................................................................................56
6.3.1 Combustion Turbine other Fuel-Related Costs.............................................. 576.3.2 Total Fuel Related Cost (TFRC) Equation for CTs.........................................57
6.4 Start-up Cost............................................................................................................... 576.5 No-Load Cost Calculation for CTs.............................................................................. 586.6 Maintenance Cost....................................................................................................... 58
6.6.1 Combustion Turbine Maintenance Adder Example........................................586.6.2 Combustion Turbine Long Term Service Contract Cost Recovery................. 596.6.3 Equivalent service hours................................................................................ 596.6.4 Diesel Incremental Maintenance Adder Calculation.......................................60
6.7 Synchronized Reserve: Costs to Condense............................................................... 606.8 Regulation Cost...........................................................................................................61
Section 7: Hydro.......................................................................................627.1 Pumping Efficiency (Pumped Storage Hydro Only)....................................................627.2 Performance Factors...................................................................................................637.3 Fuel Cost.....................................................................................................................63
Revision: 2930, Effective Date: 05/15/201707/31/2018 PJM © 20172018 4

PJM Manual 15: Cost Development GuidelinesTable of Contents
7.3.1 Total Energy Input Related Costs for Pumped Storage Hydro PlantGeneration...........................................................................................................63
7.4 Start-up Cost............................................................................................................... 637.5 No-Load Cost.............................................................................................................. 647.6 Maintenance................................................................................................................ 647.7 Synchronized Reserve: Hydro Unit Costs to Condense............................................. 647.8 Regulation Cost...........................................................................................................65
Section 8 : Demand Resource (DR)....................................................... 668.1 Demand Resource (DR) Cost to Provide Synchronous Reserves..............................66
Section 9: Wind Units.............................................................................. 679.1 Heat Rates.................................................................................................................. 679.2 Performance Factors...................................................................................................679.3 Fuel Cost.....................................................................................................................679.4 Start-up Cost............................................................................................................... 679.5 No-Load Cost.............................................................................................................. 679.6 Maintenance................................................................................................................ 679.7 Synchronized Reserve: Wind Unit Costs to Condense.............................................. 689.8 Regulation Cost...........................................................................................................68
Section 10: Solar Units............................................................................6910.1 Heat Rates................................................................................................................ 6910.2 Performance Factors.................................................................................................6910.3 Fuel Cost...................................................................................................................6910.4 Start-up Cost............................................................................................................. 6910.5 No-Load Cost............................................................................................................ 6910.6 Maintenance.............................................................................................................. 6910.7 Synchronized Reserve Cost......................................................................................7010.8 Regulation Cost.........................................................................................................70
Section 11: Energy Storage Resource................................................... 7111.1 Heat Rates.................................................................................................................7111.2 Performance Factors................................................................................................. 7111.3 Fuel Cost................................................................................................................... 7111.4 Start-up Cost............................................................................................................. 7111.5 No-Load Cost............................................................................................................ 7111.6 Maintenance.............................................................................................................. 7111.7 Synchronized Reserve Cost......................................................................................7111.8 Regulation Cost......................................................................................................... 72
Section 12: Energy Market Opportunity Cost and Non-RegulatoryOpportunity Cost Guidelines...............................................................73
Revision: 2930, Effective Date: 05/15/201707/31/2018 PJM © 20172018 5

PJM Manual 15: Cost Development GuidelinesTable of Contents
12.1 Opportunity Cost Policy............................................................................................ 7312.2 Basis for Opportunity Cost to be included in Cost Offers......................................... 73
12.2.1 Energy Market Opportunity Costs................................................................ 7312.2.2 Non-Regulatory Opportunity Cost: Physical Equipment Limitations:............7312.2.3 Non-Regulatory Opportunity Cost: Fuel Limitations..................................... 73
12.3 Calculation Method Options: Two Methodologies for calculating Opportunity Cost...7412.3.1 Long Term Method (greater than 30 days).................................................. 7412.3.2 Short Term Method (30 days or less).......................................................... 74
12.4 Definitions..................................................................................................................7412.5 Long Term Methodology........................................................................................... 75
12.5.1 Step 1: Derive Historical Monthly LMP Basis Differential between thegeneration bus and western hub........................................................................ 75
12.5.2 Step 2: Derive hourly volatility scalars to incorporate hourly volatility intothe LMP forecast.................................................................................................78
12.5.3 Step 3: Create three sets of hourly forecasted bus values.......................... 7912.5.4 Step 4: Create a daily fuel volatility scalar...................................................8012.5.5 Step 5: Create three daily delivered fuel forecasts...................................... 8112.5.6 Step 6: Create generating unit(s) cost for each of the three forecasts......... 82................................................................................................................................. 8412.5.7 Step 7: Calculate the margin for every hour in the three hourly forecasts....8412.5.8 Step 8: Determine the opportunity cost component..................................... 85
12.6 Short Term Methodology...........................................................................................8612.6.1 Step 1: Derive Historical Monthly LMP Basis Differential between the
generation bus and western hub........................................................................ 8612.6.2 Step 2: Derive hourly volatility scalars to incorporate hourly volatility into
the LMP forecast.................................................................................................8912.6.3 Step 3: Create three sets of hourly forecasted bus values.......................... 9012.6.4 Step 4: Fuel Price........................................................................................ 9112.6.5 Step 5: Create generating unit’s cost for each of the three forecasts...........9212.6.6 Step 6: Calculate the margin for every hour in the three hourly forecasts....9312.6.7 Step 7: Determine the opportunity cost adder............................................. 95
Attachment A: Applicable FERC System of Accounts......................... 96A.1 Balance Sheet Accounts............................................................................................ 96
A.1.1 FERC FORM 1 ACCOUNT 151: Fuel Stock (Major only)..............................96A.2 Expense Accounts...................................................................................................... 96
A.2.1 FERC FORM 1 ACCOUNT 501: Fuel........................................................... 96A.2.2. FERC FORM 1 ACCOUNT 509: Allowances............................................... 98A.2.3 FERC FORM 1 ACCOUNT 512: Maintenance of Boiler Plant (Major only)... 98A.2.4 FERC FORM 1 ACCOUNT 513: Maintenance of Electric Plant (Major only).. 98A.2.5 FERC FORM 1 ACCOUNT 518: Nuclear Fuel Expense (Major only)............98A.2.6 FERC FORM 1 ACCOUNT 530: Maintenance of Reactor Plant Equipment
(Major only)......................................................................................................... 99A.2.7 FERC FORM 1 ACCOUNT 531: Maintenance of Electric Plant (Major only).. 99A.2.8 FERC FORM 1 ACCOUNT 543: Maintenance of Reservoirs, Dams, and
Waterways (Major only)...................................................................................... 99
Revision: 2930, Effective Date: 05/15/201707/31/2018 PJM © 20172018 6

PJM Manual 15: Cost Development GuidelinesTable of Contents
A.2.9 FERC FORM 1 ACCOUNT 544: Maintenance of Electric Plant (Major only).. 99A.2.10 FERC FORM 1 ACCOUNT 553: Maintenance of Generating and Electrical
Equipment (Major only).......................................................................................99A.3 Operating Expense Instructions 2 and 3....................................................................99
A.3.1 OPERATING EXPENSE INSTRUCTION 2: Maintenance............................. 99A.3.2 OPERATING EXPENSE INSTRUCTION 3: Rents...................................... 100
Attachment B: NoLoad Calculation Examples.................................... 102B.1 No-Load Fuel............................................................................................................ 102B.2 Typical Steam Unit Example.................................................................................... 102B.3 Typical Combustion Turbine Example...................................................................... 104B.4 Typical 2 on 1 Combined Cycle with Duct Burning Example....................................107B.5 No-Load Cost Adjustments.......................................................................................110B.6 Combustion Turbine Zero No-Load Example........................................................... 115
Revision History..................................................................................... 117
Revision: 2930, Effective Date: 05/15/201707/31/2018 PJM © 20172018 7

PJM Manual 15: Cost Development GuidelinesTable of Exhibits
Table of Exhibits
Exhibit 1: Handy Whitman Index....................................................................................27
Exhibit 2: Example Calculation of Maintenance Adder for CT using a 10 yearMaintenance Period....................................................................................................30
Exhibit 3: VOM for all Hydro Units or Non-Hydro Units providing service for less than10 years......................................................................................................................33
Exhibit 4: Example of VOM for Non-Hydro Units providing Regulation for more than10 years......................................................................................................................34
Exhibit 5: Regulation Maximum Allowable Cost Adder Example................................... 37
Exhibit 6: Nuclear Unit’s Sample Formula of Maintenance Adder................................. 41
Exhibit 7: Nuclear Unit’s Formula of Start Maintenance Adder......................................41
Exhibit 8: Nuclear Unit’s Formula of Configuration Addition Maintenance Adder...........42
Exhibit 9: Fossil Steam Unit’s Sample Formula of Maintenance Adder......................... 47
Exhibit 10: Fossil Steam Unit’s Sample Formula of Start Maintenance Adder...............48
Exhibit 11: Fossil Unit’s Sample Formula of Configuration Addition MaintenanceAdder.......................................................................................................................... 49
Exhibit 12: Steam Unit Synchronized Reserve Example............................................... 50
Exhibit 13: Combined Cycle Unit Synchronized Reserve Example............................... 54
Exhibit 14: Combustion Turbine Maintenance Cost Adder Example..............................59
Exhibit 15: Three hourly basis differential ratios variables for the same hour in eachof three historical years..............................................................................................76
Exhibit 16: Monthly Peak Basis Differentials for the three historical periods..................77
Exhibit 17: Forecasted monthly bus prices for three historical periods.......................... 77
Exhibit 18: Forecasted bus LMPs for one hour for each of the three historical baseyears........................................................................................................................... 80
Exhibit 19: Three daily fuel volatility scalars values developed for June 3 in each ofthree historic years for a unit with a single fuel......................................................... 80
Exhibit 20: Create three daily delivered fuel forecasts from the volatilities of threehistoric years.............................................................................................................. 82
Revision: 2930, Effective Date: 05/15/201707/31/2018 PJM © 20172018 8
PJM Manual 15: Cost Development GuidelinesTable of Exhibits
Exhibit 21: Daily Unit Cost............................................................................................. 83
Exhibit 22: Calculating total margins with a minimum runtime of one hour (i.e. nominimum runtime restriction), using historical data from the past three calendaryears........................................................................................................................... 84
Exhibit 23: A unit with 700 run hours.............................................................................86
Exhibit 24: Three Hourly Basis Differential Ratios Values for the same hour in Eachof Three Historical Years............................................................................................87
Exhibit 25: Monthly Peak Basis Differentials for the Three Historical Periods................87
Exhibit 26: Forecasted Monthly Bus Prices for Three Historical Periods....................... 88
Exhibit 27: Daily Unit Cost............................................................................................. 93
Exhibit 28: Calculating Total Margins with a minimum run time of one hour (i.e. nominimum run time restriction), using historical data from the past three calendaryears........................................................................................................................... 94
Exhibit 29: A Unit with 700 run hours left...................................................................... 95
Revision: 2930, Effective Date: 05/15/201707/31/2018 PJM © 20172018 9

PJM Manual 15: Cost Development GuidelinesApproval
ApprovalApproval Date: 05/15/201707/31/2018Effective Date: 05/15/201707/31/2018Jeffrey R SchmittGlen Boyle, Chairman
Cost Development Subcommittee
Revision: 2930, Effective Date: 05/15/201707/31/2018 PJM © 20172018 10

PJM Manual 15: Cost Development GuidelinesCurrent Revision
Current RevisionRevision 30 (XX/XX/2018):
• Biennial Review
•
Revision 29 (5/15/2017):
• Fuel Cost Policy and Hourly Offers conforming changes:
o Section 1.8, 2.3, 2.3.1, 2.3.1.1, 2.3.1.2, 2.3.1.3
• Additional changes to require submission to PJM and MMU
• Removed references to Manual 35 as this has been retired
Revision: 2930, Effective Date: 05/15/201707/31/2018 PJM © 20172018 11
PJM Manual 15: Cost Development GuidelinesSection 1: Introduction
Section 1: Introduction
1.1 About PJM ManualsThe PJM Manuals are the instructions, rules, procedures, and guidelines established by PJM forthe operation, planning, and accounting requirements of PJM and the PJM Markets.
For a complete list of all PJM manuals, go to the Library section on PJM.com.
1.2 How to Use This ManualThe PJM Manual 15: Cost Development Guidelines is one in a series of the PJM Manuals.This Manual is maintained by the PJM Cost Development Subcommittee (CDS) under theauspices of the PJM Market and Reliability Committee (MRC).
To use this Manual, read sections one and two then go to the chapter for unit type for possibleadditional information.
All capitalized terms that are not otherwise defined herein shall have the same meaning asthey are defined in the Amended and Restated Operating Agreement of PJM Interconnection,L.L.C. (PJM Operating Agreement), PJM Open Access Transmission Tariff (PJM Tariff) or theReliability Assurance Agreement Among Load Serving Entities in the PJM Region. Throughoutthis manual, the term MMBtu is one million British Thermal Units (BTU).
1.3 The intended audiences for this Manual:• Market Seller
• PJM staff
• MMU
• Regulators
1.4 What is in this Manual?• A table of contents that lists two levels of subheadings within each of the sections
• An approval page that lists the required approvals and a brief outline of the currentrevision
• Sections containing the specific guidelines, requirements, or procedures including PJMactions and Market Seller actions
• Attachments
1.5 Cost Development Subcommittee MissionThe CDS reports to the MRC and is responsible for developing, reviewing, and recommendingprocedures for calculating the costs of products or services provided to PJM at a cost-basedrate for Market Sellers. CDS responsibilities can be found in the CDS’ charter.
Revision: 2930, Effective Date: 05/15/201707/31/2018 PJM © 20172018 12

PJM Manual 15: Cost Development GuidelinesSection 1: Introduction
1.6 Purpose of this ManualThis document details the standards recognized by PJM for determining cost components formarkets where products or services are provided to PJM at cost-based rates, as referenced inSchedule 1, Section 6 of the PJM Operating Agreement.
1.6.1 Reason for Cost Based Offers: Market Power MitigationThe following material is provided for background and should be used for information only.Structural market power is the ability of seller, or a group of sellers, to alter the market price ofa good or service for a sustained period. To mitigate the potential exercise of market power,market rules can offer cap units in various markets. The Three Pivotal Supplier (TPS) test isused to determine if structural market power exists in a given market. If structural market poweris found to exist, some Market Sellers may be mitigated to cost-based offers to prevent anyexercise of that market power.The TPS test is a test for structural market power. The test examines the concentration ofownership of the supply compared to the level of demand. The test does not examine thecompetitiveness of offers or other factors.The general concept of the TPS test is to control a constraint; a certain amount of MW of reliefis needed. If there are not enough MWs to satisfy the constraint without using the top twosuppliers’ output plus the output of the supplier being tested, then those three suppliers arejointly pivotal. According to the criteria utilized by the TPS test, because the supply can beconstrained by those three owners and the demand could potentially not be satisfied, they areconsidered to have structural market power. If any one supplier fails, then the top two suppliersalso fail.A test failure means that the ownership of the supply needed to meet is concentrated amongfew suppliers and therefore those suppliers have the potential to exercise market power orstructural market power. It does not mean those suppliers are attempting to exercise marketpower.A test failure triggers mitigation as a preventative step in the event of a concentration ofownership. If a generator is brought on for constraint control and its supplier fails a TPS test,then the unit is dispatched at the lower of the cost or price offer. The purpose of this Manual isto outline the development of the cost-based offer to ensure that PJM Members who own orcontrol a generating unit(s) with structural market power cannot exercise it.
1.7 Components of CostThis Manual is designed to instruct Market Sellers on how to develop their cost based offers. AMarket Seller who is required to submit a cost-based offer for a resource shall be responsible forthe development and accuracy of all information to support the calculation of a resource’s cost-based offer and shall provide such information to PJM or the MMU, either directly or indirectlythrough an agent or other entity, upon request or as required by applicable PJM market rules.These cost- based offers are used by PJM to schedule generation in cases in which structuralmarket power is found to exist. PJM uses the information provided from Market Sellers todetermine each unit’s production costs.
Revision: 2930, Effective Date: 05/15/201707/31/2018 PJM © 20172018 13

PJM Manual 15: Cost Development GuidelinesSection 1: Introduction
Production costs are the costs to operate a unit for a particular period. Several different costcomponents are needed to determine a generating unit's total production cost. The totalproduction cost includes:
• Start-up Cost
• No-Load Cost
• Incremental costs (energy cost per segment of output range)
Production costs have a direct impact on which units are scheduled by PJM. In general,generation will be scheduled to achieve the lowest possible overall costs to the system.
The following material is provided for background and should be used for information only.
1.7.1 Generator offer curvesGenerator offer curves are representations of a generator’s willingness to provide energy. Offercurves are used in determining incremental and total production costs. An offer curve can haveup to ten points defined. The first point describes the lowest MW amount offered for a unit. Theoffer curve may be a smooth line or a block curve depending on how the points between eachsegment are calculated. The Market Seller can determine how the slope of the offer curve isdefined; however, the slope must be monotonically increasing.
1.7.2 Start-up CostStart-up Costs are defined as the unit costs to bring the boiler, turbine and generatorfrom shutdown conditions to the point after breaker closure which is typically indicated bytelemetered or aggregated state estimator MWs greater than zero and is determined based onthe cost of start fuel, total fuel-related cost, performance factor, electrical costs (station service),start maintenance adder, and additional labor cost if required above normal station manning.Start-up Costs can vary with the unit offline time being categorized in three unit temperatureconditions: hot, intermediate and cold. Start-up Cost is a dollar cost and is incurred once eachtime the unit operates regardless of the period of operation. See Start-up Cost in Section 2.4.
1.7.3 No Load CostNo-Load Fuel (MMBtu/hour) is the total fuel to sustain zero net output MW at synchronousgenerator speed.No-Load Cost ($/hour) – The hourly cost required to create the starting point of a monotonicallyincreasing incremental offer curve for a generating unit. The calculated No-Load Cost may haveto be adjusted to ensure that the slope of the Generator Offer Curve is monotonically increasing.
1.7.4 Incremental CostHourly production cost is the cost per hour to operate a unit assuming a start has alreadyoccurred. It is calculated by summing all costs, which are incurred during one hour of operationincluding the hourly No-Load Cost and the incremental energy cost.The incremental energy cost is the cost per MWh to produce all of the energy segmentsabove the Economic Minimum level (minimum generation level with the unit available foreconomic dispatch). No-Load Costs are not included in the incremental costs. It is calculatedby summing the cost of each segment of energy in the unit’s incremental cost curve up to thegeneration level. This cost is a dollar per hour ($/MWh) rate.
Revision: 2930, Effective Date: 05/15/201707/31/2018 PJM © 20172018 14

PJM Manual 15: Cost Development GuidelinesSection 1: Introduction
1.7.5 Total Production CostTotal production cost is calculated by adding all of the costs associated with starting a unit andoperating it over a period. Total production costs include two categories of costs: Start-up Costsand hourly production costs.To determine the total production cost of a unit, the following formula is used:
Where x= Number of hours a unit is run at a certain MW levelIt is important to remember that PJM will schedule generation day-ahead based on the abovebut dispatch using the incremental (marginal) cost, as represented by its generation offer. Theincremental (marginal) cost will represent the cost to generate the next MW from the unit. SeeHeat Rate in Section 2.1, Performance Factor in Section 2.2, Performance Factors in Section2.2, and Fuel Cost in Section 2.3, No-Load Cost in Section 2.5 and 2.6 Maintenance Cost.
1.8 Cost Methodology and Approval ProcessA Market Seller which seeks to obtain an exemption, exception or change to any time frame,process, methodology, calculation or policy set forth in this Manual, or the approval of any costor methodology that is not specifically permitted by this Manual not related to the Fuel CostPolicy, shall submit a request to PJM and MMU for consideration and determination along withdocumentation supporting the request.
After receipt of such a request, PJM and MMU will review the request and PJM will notify theMarket Seller and MMU whether the request is approved no later than thirty (30) calendar daysafter submission of the request.
This process shall be referred to in this Manual as the “Cost Methodology and ApprovalProcess.”
1.9 ReferencesThe references to other documents that provide background or additional detail directly relatedto the PJM Manual for Cost Development Guidelines are:
• PJM Manual for Pre-Scheduling Operations (M-10)
• PJM Manual for Energy & Ancillary Services Market Operations (M-11)
• PJM Manual for Generator Operational Requirements (M-14D)
• PJM Manual for Open Access Transmission Tariff Accounting (M-27)
• PJM Manual for Operating Agreement Accounting (M-28)
• Markets Gateway User Guide
• Markets Database Dictionary
• Opportunity Cost Calculator
• A Review of Generation Compensation and Cost Elements in the PJM Markets
• Member Information Reporting Application (MIRA)
Revision: 2930, Effective Date: 05/15/201707/31/2018 PJM © 20172018 15

PJM Manual 15: Cost Development GuidelinesSection 1: Introduction
Revision: 2930, Effective Date: 05/15/201707/31/2018 PJM © 20172018 16

PJM Manual 15: Cost Development GuidelinesSection 2: Policies for All Unit Types
Section 2: Policies for All Unit TypesThis section contains information that is relevant for the development of a cost offer for all typesof units.
2.1 Heat Input and RatesHeat Input equals a point on the heat rateinput curve (in MW/MmMbtu/hr) describing theresource’s operational characteristics for converting the applicable fuel input (MMBtu) intoenergy (MWh). Heat Input curves are typically obtained via plant performance testing or fromthe original equipment manufacturer.
Heat Rate equals the MMBtu content of the heat input divided by the MWh of power output. Thesmaller the heat rate value the greater the efficiency. The heat rate can also be referred to asthe input-output function.
The Incremental heat rate is the relationship between an additional MW of output and the heatinput necessary to produce it. Graphically, the incremental heat rate can be determined fromthe ratio of the change in fuel input to the change in unit MW output; which is the slope of theinput/output curve. Mathematically, the incremental heat rate curve can be expressed as the firstderivative of the heat rate curve (input heat versus MW output).
Economic Minimum is the lowest level of energy in MW the unit can produce and maintain astable level of operation under normal operation.
Economic Maximum is the highest unrestricted level of energy, in MW, that the operatingcompany operates the unit under normal operation. This represents the highest output availablefrom the unit for economic dispatch.
2.1.1 Heat Input andRate PolicyAll Market Sellers shall develop Heat RatesInput curves. These heat rate input curves showheat input in MMBTU/hr from burning fuel versus MW output for each of their generating units.The heat rate input curves then serve as the basis for the theoretical incremental heat ratecurves for fuel consumption and performance factor development. A Market Seller is allowed touse either net or gross MW values in determination of the incremental heat rate curves as longas gross or net MW value consistency is maintained throughout the cost development process.Heat rate information provided to the Office of the Interconnection should be on a net MW basis.
• Heat rate input curves (one curve per fuel type for each operating mode) will be basedon design or comparable unit data modified by actual unit test data (when available).
• Data for the heat rate input curve development, ideally, should include EconomicMinimum and Economic Maximum MW points. The heat rate input curve will be fittedfrom available data.
Revision: 2930, Effective Date: 05/15/201707/31/2018 PJM © 20172018 17
PJM Manual 15: Cost Development GuidelinesSection 2: Policies for All Unit Types
• This heat rate input curve (or curves) will be used as the basis for incremental heat ratecurves, incremental costs and performance factor calculations.
2.2 Performance FactorsPerformance Factor is the calculated ratio of actual fuel burn to either theoretical fuel burn(design heat input) or other current tested heat input. Actual burn may vary from standard burndue to factors such as unit age or modification, changes in fuel properties, seasonal ambientconditions, etc.
The Performance Factor shall be calculated on either the total fuel consumed or a monthlyspot check test basis. The Performance Factor for nuclear and steam units shall be reviewed(and updated if changed) at least once every twelve months. The Performance Factors forcombustion turbine (“CT”), diesel units, and combined-cycle (“CC”) units shall be updated atleast once during:
• Twelve months, or
• The year in which a unit reaches 1,000 accumulated running hours since its lastPerformance Factor update, whichever represents a longer period, not to exceed fiveyears.
Requests for exemptions from these periods should be submitted to PJM and the MMU forevaluation pursuant to Section 2.3. The overall Performance Factor can be modified by aseasonal Performance Factor to reflect ambient conditions.
2.2.1 Engineering Judgment in Performance FactorsThe calculated performance factor may be superseded by estimates based on soundengineering judgment. If the period during which estimated performance factors are usedexceeds three months, documentation concerning reasons for the override must be maintainedand available for review.
2.2.2 Higher Heating Value of FuelHigher Heating Value of Fuel - the amount of heat released by a specified quantity once it iscombusted and the products have returned to an original temperature. Higher Heating Value(HHV) of fuel may be based on any of:
• As burned test• In stock test• As received test• As shipped test• Contract value• Seller's invoice• Seller's quote
Revision: 2930, Effective Date: 05/15/201707/31/2018 PJM © 20172018 18

PJM Manual 15: Cost Development GuidelinesSection 2: Policies for All Unit Types
• Nominal value based on Industry Standard
2.2.3 Calculation Methods of Performance FactorsThere are three options available for use in determining a unit’s performance factor:
1. Total Fuel2. Separate3. Fixed start approach
These three methods are described with their corresponding equations as follows:Performance Factors are used in calculating start fuel as well as operating fuel. When the (1)total fuel approach is used, the Performance Factor would represent the ratio:
With the total fuel approach, fuel quantities measured during start tests should be modified bythe Performance Factor in effect at the time of the test so that theoretical or standard start fuelquantities will be on the same basis as the standard operating fuel quantity.Conditions encountered during the start of certain units may make it preferable to assignseparate Performance Factors for start and operating fuel. If (2) separate PerformanceFactors are calculated for start fuel prior to calculating the "operating fuel" Performance Factor,this Operating Fuel Performance Factor will represent the ratio:
Due to the variability and difficulty in measuring actual start fuel, a Market Seller may choose toset a (3) fixed start Performance Factor of one, implicitly assigning all performance variationsto no-load and incremental loading costs. In order to account for all fuel actually consumed, theoperating fuel Performance Factor will represent the ratio:
Where total theoretical start fuel consumed = fuel quantity used in the Start-up Cost calculation
2.2.4 ‘Like’ Units for Performance FactorsAn average Performance Factor may be calculated and applied for groups of like units burningthe same type of fuel. Please see the Generation sections for further detail of ‘like’ units.
2.3 Fuel Cost Policies and GuidelinesA Market Seller may only submit a non-zero cost-based offer if it has a PJM-approved FuelCost Policy consistent with each fuel type on which the resource can operate in accordancewith Section 2.3.1 of this manual and Operating Agreement, Schedule 2. Resources that do notsubmit cost-based offers into the Energy Market, such as rRegulation only resources, do notrequire a Fuel Cost Policy. The Fuel Cost Policy will be submitted in MIRA, or other system(s)made available for submission of such data. Submission to MIRA, or other system(s) made
Revision: 2930, Effective Date: 05/15/201707/31/2018 PJM © 20172018 19

PJM Manual 15: Cost Development GuidelinesSection 2: Policies for All Unit Types
available is considered submission to PJM and the MMU. The lowest cost-based schedulemade available in Markets Gateway for each fuel type must be in accordance with the MarketSeller’s PJM-approved Fuel Cost Policy. Market Sellers that offer a schedule with more than onefuel type must ensure that the portion of the offer for each fuel type is in accordance with thePJM approved Fuel Cost Policy.
2.3.1 Submission of and/or Modifications to Fuel Cost Policies
2.3.1.1 Annual ReviewBy June 15 of each yearOn an annual basis, all Market Sellers will beare required to either:
• submit to PJM and the MMU an updated Fuel Cost Policy that complies with OperatingAgreement, Schedule 2 and this manual,
• or confirm that their currently effective and approved Fuel Cost Policy remains compliant.Market Sellers must submit such information by no later than June 15 of each year.
By no later than August 1,Tthe MMU shall review the Fuel Cost Policy, and shall consult withthe Market Seller, to determine whether the Fuel Cost Policy raises market power concerns and.The MMU shall provide the results of its review to PJM and the Market Seller, in writing,. by nolater than August 1. PJM shall consult with the MMU, and consider any input timely receivedfrom the Market Monitoring Unit, in its determination of whether to approve a Market Seller’supdated Fuel Cost Policy.By no later than November 1After it has completed its evaluation of the request, PJM shall notifythe Market Seller in writing, with a copy to the MMU, of its determination whether the updatedFuel Cost Policy is approved or rejected by no later than November 1. If PJM rejects a MarketSeller’s updated Fuel Cost Policy, in its written notification, PJM shall provide an explanation forwhy the Fuel Cost Policy was rejected. If a Market Seller desires to update its Fuel Cost Policy,or PJM determines either on its own or based on input received from the MMU, the MarketSeller must update its Fuel Cost Policy using the outside of the annual review process.The Market Seller shall follow the applicable processes and deadlines specified in OperatingAgreement, Schedule 2 and this manual. All PJM-approved Fuel Cost Policies will have aneffective date and will be in effect until superseded, expired, or revoked. PJM shall notify theMarket Seller as to the effective date and expiration date of the approved Fuel Cost Policy.During the annual review process, PJM and the MMU will review any policy submitted alongwith the supporting documentation. Market Sellers shall have five (5) Business Days to provideadditional documentation or information on any request from PJM or the MMU. If the MarketSeller does not believe it can provide the information within a (5) Business Day timeframe, itcan request an alternative deadline from PJM for submission of the data no later than one (1)Business Day before the due date of the request for additional data. If PJM consents to extendthe deadline, PJM will advise the Market Seller and the MMU of the new deadline. If the MMUadvises that the request should be subject to the PJM deadline, the MMU will inform PJM ofsuch request at the time it is made. Failure to meet a data request deadline may result in PJMrejecting the policy. If PJM rejects a Market Seller’s updated Fuel Cost Policy, PJM must includean explanation for why the Fuel Cost Policy was rejected in its written notification. PJM willestablish a deadline for all required updates to the policy. If the current policy under reviewis rejected, the Market Seller will continue to use the previously approved Fuel Cost Policy;
Revision: 2930, Effective Date: 05/15/201707/31/2018 PJM © 20172018 20

PJM Manual 15: Cost Development GuidelinesSection 2: Policies for All Unit Types
unless a previously approved policy does not exist in which case, a penalty will be assessed asdescribed in PJM’s Operating Agreement, Schedule 2.
2.3.1.2 Outside Annual Review/New ResourceFuel Cost Policy updates may also be submitted outside of the annual review period:
• If a Market Seller has an approved Fuel Cost Policy currently in place and needs to alterit in order to conform it to the provisions of this Manual or any applicable provisions ofPJM’s governing documents,
• If any action by a governmental or regulatory agency external to a Market Seller resultsin a need for the Market Seller to change its method of fuel cost calculation,
• If there are any material changes to Fuel Cost Policy,• If PJM requests a Market Seller to submit an updated Fuel Cost Policy, or• If a Market Seller will be offering a new resource into PJM’s energy markets.
The Market Seller shall notify PJM and the MMU that an update to an existing Fuel CostPolicy or the need for a Fuel Cost Policy for a new resource is required at the earliest possibleopportunity. If PJM requests the Market Seller to submit an updated Fuel Cost Policy, the MarketSeller shall provide the updated policy to PJM and the MMU within five (5) Business Days or analternative deadline agreed to by PJM:
• For new resources, follow the process delineated in Operating Agreement Schedule 2Section 2.2 (a).
• For resources transferred to another Market Seller, the new Market Seller shall submit aFuel Cost Policy to PJM and MMU for review 45 days prior to transfer or an alternativedate agreed to by PJM. The new Market Seller will be required to have a PJM-approvedFuel Cost Policy prior to entering non-zero cost-based offers.
• For existing resources, the Market Seller’s previously approved Fuel Cost Policy will beused for making cost-based offers while the requested update or new policy is underevaluation. Unless a previously approved policy does not exist for a resource that is notnew to PJM’s markets in which case a penalty will be assessed as described in PJM’sOperating Agreement Schedule 2.
Outside the annual review period, PJM and the MMU will have an initial 30 Business Daysfor review. PJM shall consult with the MMU, and consider any input timely received from theMarket Monitoring Unit, in its determination of whether to approve a Market Seller’s updatedFuel Cost Policy. Market Sellers shall have five (5) Business Days or an alternative deadlineagreed to by PJM, to provide additional documentation or information on any request from PJMor the MMU. If the Market Seller does not believe it can provide the information within a (5)Business Day timeframe, it can request from PJM an alternative deadline for submission ofthe data no later than one (1) Business Day before the due date of the request for additionaldata. If PJM consents to extend the deadline, PJM will advise the Market Seller and the MMU ofthe new deadline. If the MMU advises that the request should be subject to the PJM deadline,the MMU will inform PJM of such request at the time it is made. Failure to meet a data requestdeadline may result in PJM rejection of the policy. If additional documentation or informationhas been requested by PJM or the MMU, PJM has five (5) Business Days after the deadlinefor the Market Seller submittal of such additional information or documentation to notify the
Revision: 2930, Effective Date: 05/15/201707/31/2018 PJM © 20172018 21

PJM Manual 15: Cost Development GuidelinesSection 2: Policies for All Unit Types
Market Seller and MMU of its approval or rejection of the Fuel Cost Policy. If PJM rejects aMarket Seller’s updated Fuel Cost Policy, PJM must include an explanation for why the FuelCost Policy was rejected in its written notification and provide a deadline for providing anyadditional information or documentation to seek approval of updates to the policy. All approvedFuel Cost Policies will have an effective date indicated by PJM in its written notification to theMarket Seller and MMU and will be in effect until superseded or revoked.
2.3.1.3 RevocationIf, after having approved a Fuel Cost Policy, PJM determines, with input and advice timelyreceived from the MMU, that the Market Seller’s procurement practices or the method fordetermining other components of cost-based offers is no longer consistent with the approvedFuel Cost Policy, Operating Agreement, Schedule 2 or this manual, PJM may revoke itsapproval of the Fuel Cost Policy. The Market Seller shall be required to submit a new FuelCost Policy for approval pursuant to the process and deadlines set forth in Section 2.3.1. IfPJM revokes a Market Seller’s previously approved Fuel Cost Policy, PJM shall notify theMarket Seller in writing, with a copy to the Market Monitoring Unit, and include an explanationfor the revocation. Upon revocation of a Fuel Cost Policy, the penalty referenced in OperatingAgreement, Schedule 2 subsection 5(a) shall apply beginning on the day after PJM issues thewritten notification of revocation to the Market Seller, with no additional requirement for PJM toprovide any further notice to the Market Seller.Market Sellers who have a Fuel Cost Policy revoked by PJM will be provided a three (3)Business Day rebuttal period, starting from the date of revocation, to submit supportingdocumentation to PJM demonstrating that the revoked Fuel Cost Policy accurately reflects thefuel source, transportation cost, procurement process used, applicable adders, or commoditycost for such generation resource such that the Fuel Cost Policy accurately reflects the MarketSeller’s fuel procurement practices and methodology for pricing fuel. During the rebuttal period,if the Market Seller does not have a PJM-approved Fuel Cost Policy, it may not submit a non-zero cost-based offer. The penalty will still apply during the rebuttal period. However, if, uponreview of the Market Seller’s supporting documentation, PJM determines that the revoked policyaccurately reflects the Market Seller’s actual methodology used to develop the cost-based offerthat was submitted at the time of revocation and that the Market Seller has not violated its FuelCost Policy, then PJM will refund to the Market Seller the penalty payments and make whole theMarket Seller via uplift payments for the time period for which the applicable Fuel Cost Policyhad been revoked and the generation resource was mitigated to its cost-based offer.
2.3.2 Fuel Cost CalculationThe method of calculation of fuel cost may be updated by the Market Seller no more frequentlythan once every 12 months, on a rolling basis typically in the annual review process from June15 through November 1, unless required to be changed per Section 2.3.1.2.Each Market Seller must review and document its fuel costs in MIRA, or other system(s)made available for submission of such data, at minimum once per month (12 times per year).Additionally, each review must occur within forty (40) days of the preceding review. The resultsof this review will be used to determine whether a fuel cost update and subsequent change tothe Fuel Cost Policy is necessary.The method of calculation of fuel cost in MIRA, or other system(s) made available forsubmission of such data, may include the use of actual fuel prices paid, e.g. the contract pricepaid for fuel, or the spot price for fuel. The contract price for fuel must include the locational cost
Revision: 2930, Effective Date: 05/15/201707/31/2018 PJM © 20172018 22

PJM Manual 15: Cost Development GuidelinesSection 2: Policies for All Unit Types
of fuel for the generating unit. The source used for spot price for fuel must be publicly availableand reflect the locational cost of fuel for the generating unit. The locational cost of fuel shallinclude specification of any additional incremental costs of delivery for the generating unit.Each Market Seller will be responsible for establishing its own method of calculating deliveredfossil fuel cost, limited to inventoried cost, replacement cost or a combination thereof, whichreflects the way fuel is purchased or scheduled for purchase.The method of calculation will be consistent with the current effective Fuel Cost Policy and mayonly be changed by receipt of final approval pursuant to Section 2.3.1.2, outside the annualreview process. Fossil fuel cost adjustments compensating for previous estimate inaccuraciesshould not be considered when determining the basic fossil cost component of Total FuelRelated Cost.Units that co-fire more than one fuel shall weight average the cost of the fuel on a per MMBtubasis. Units that fire solid waste, bio-mass, or landfill gas shall include the cost of such fuelwhen calculating the average even when the cost of such fuel is negative. However, cost offersfor units that fire solid waste, biomass, or landfill gas are not required to be less than zero.
2.3.3 Total Fuel Related CostsTotal Fuel Related Cost is the sum of fuel costs, fuel related cost, emission allowance cost,and maintenance cost.
Escalation of previous year dollar amounts is permitted when the term of calculation exceedstwelve months. When used, escalation indexes will be the same as those developed forcalculation of incremental Maintenance Adders.The other fuel-related cost components of TFRC may be calculated based on a fixed or rollingaverage of values from one to five years in length, reviewed (and updated if changed) annually,or a rolling average from twelve to sixty months in length, reviewed (and updated if changed)monthly. Both the term and the frequency of the other fuel-related costs calculation shall beincluded in the Market Seller’s Fuel Cost Policy.
2.3.4 Types of Fuel CostsBasic Fuel Cost – The cost of fuel calculated as stated in the Market Sellers’ Fuel Cost Policy(excluding fixed lease expenses).
Note:Basic Fuel Cost for each unit type will be addressed in subsequent sections.
Incremental Energy Cost –The incremental heat or fuel required to produce an incrementalMWh at a specific unit loading level multiplied by the applicable Performance Factor, multipliedby the fuel cost plus the appropriate maintenance cost.Total Cost – The total theoretical heat input minus the no-load heat input at a specific unitloading level, multiplied by the applicable Performance Factor, multiplied by the fuel cost plusthe appropriate maintenance cost, plus the No-Load Cost.
Revision: 2930, Effective Date: 05/15/201707/31/2018 PJM © 20172018 23

PJM Manual 15: Cost Development GuidelinesSection 2: Policies for All Unit Types
2.3.5 Emission AllowancesEach unit that requires SO2 /CO2 /NOx emission allowances (EAs) to operate may include inthe unit's TFRC the cost ($/MMBtu) of the EAs as determined in the Market Seller's EmissionsPolicy.Each Market Seller must submit a policy that would state the method of determining the cost ofSO2 /CO2 /NOx EAs for evaluation pursuant to the Cost Methodology and Approval Process.An example of the calculation must be included in the policy. The method of calculation maybe changed only after evaluation pursuant to the Cost Methodology and Approval Process andshould be updated at least annuallyThe period used for determining the projected SO2 /CO2 /NOx discharge and the MMBtu’sburned must be included in the Market Seller's policy and may be based on historical orprojected data.For units that have dual fuel firing capability, a Market Seller should use different EA factorsbased on the SO2 /CO2 /NOx emitted for each particular fuel or fuel mix.NOx /CO2 emissions costs will be included in TFRC only during a NOx /CO2 complianceperiod and only by affected generating units. Details of the cost calculation methodology andexample calculations will be contained in each Market Seller’s Emissions policy. Compliancerequirements and dates may vary by geographic region.Emissions adder calculations must be submitted to PJM and the MMU for review annually, inaccordance with Operating Agreement Schedule 2 Section 3.
2.3.6 Leased Fuel Transportation EquipmentLeased Fuel Transportation Equipment Cost –Expenses incurred using leased equipmentto transport fuel to the plant gate. If expenses are fixed, they must be excluded from fuel costdetermination.When calculating the Total Fuel Related Costs, fixed charges for transportation equipment (e.g.,pipelines, train cars, and barges) should be excluded. Dollars that represent lease charges areconsidered fixed charges if the total amount to be paid over a period is fixed regardless of theamount of fuel transported. Should the terms of the lease agreement be such that there is afixed charge plus a charge for every unit of fuel delivered, the "charge per unit of fuel delivered"should be included in the Fuel on Board (FOB) delivered cost or in the calculation of the "otherfuel related costs" as per the documented Fuel Cost Policy.The above guideline applies when a unit, plant, or system is served totally by leased fueltransportation equipment. When fuel is supplied by both leased and common carrier fueltransportation systems, the common carrier rate should be included in the Fuel On Board(FOB) delivered cost or included in the calculation of the "other fuel related costs" as perthe documented Fuel Cost Policy of each Market Seller. This assumes that the leased fueltransportation equipment would serve base fuel requirements, while common carrier deliverieswould change, based on incremental generation changes.
Revision: 2930, Effective Date: 05/15/201707/31/2018 PJM © 20172018 24

PJM Manual 15: Cost Development GuidelinesSection 2: Policies for All Unit Types
2.3.7 Engineering Judgement in Fuel Cost CalculationsA Market Seller may apply engineering judgement to manufacturer’s data, operating data or theresults of start and run tests in order to derive the components of the total fuel cost. A recordof the results of these determinations shall be kept on file by each Market Seller for use as asingle, consistent basis for scheduling, operating, and accounting applications. These recordsshall be made available to PJM or the MMU upon request.
2.4 Start-up Cost
2.4.1 Start-up Cost Definitions• Start-up Cost ($) - The unit costs required to bring the boiler, turbine, and generator
from shut-down conditions to the point after breaker closure which is typically indicatedby telemetered or aggregated state estimator MWs greater than zero and is determinedbased on the cost of start fuel, total fuel-related cost, Performance Factor, electricalcosts (station service), start maintenance adder, and additional labor cost if requiredabove normal station manning levels.
• Station Service Rate – A $/MWh value based on the 12-month rolling average off-peakenergy prices updated quarterly by the Office of the Interconnection.
• Start Fuel - Fuel consumed from first fire of start process (initial reactor criticality fornuclear units) to breaker closing (including auxiliary boiler fuel) plus fuel expendedfrom breaker opening of the previous shutdown to initialization of the (hot) unit start-up,excluding normal plant heating/auxiliary equipment fuel requirements.
• Start Maintenance Adder – See Section 2.6• Start Additional Labor Cost – Additional labor costs for startup required above normal
station manning levels.
2.4.2 Engineering Judgment in Start CostsA Market Seller may apply engineering judgment to manufacturers' data, operational data, orthe results of start tests in order to derive the components of unit Start –up Cost. A record of theresults of these determinations shall be kept on file by each Market Seller for use as a single,consistent basis for scheduling, operating, and accounting applications. These records shall bemade available to the MMU or PJM upon request.
2.5 No Load
2.5.1 No-Load DefinitionsNo-Load Cost ($/hour) - The hourly cost required to create the starting point of a monotonicallyincreasing incremental offer curve for a generating unit.
Revision: 2930, Effective Date: 05/15/201707/31/2018 PJM © 20172018 25

PJM Manual 15: Cost Development GuidelinesSection 2: Policies for All Unit Types
2.5.2 No-Load FuelAll Market Sellers shall develop No-Load Costs for their units. The no-load heat input may bedetermined by collecting heat input values as a function of output and performing a regressionanalysis. The heat input values as a function of output may be either created from heat rate testdata or the initial design heat input curve for an immature unit.The minimum number of points to develop a heat input curve shall be 2 points for adispatchable unit with a variable output and 1 point for a unit with a fixed output.Sufficient documentation for each generating unit's no-load point in MMBtu’s (or fuel) per hourshall consist of a single contact person and/or document to serve as a consistent basis forscheduling, operating and accounting applications PJM and the MMU can verify calculationmethods used are in accordance with the currently approved Fuel Cost Policy and the elementsof Attachment B.
2.5.3 No Load CalculationThe initial estimate of a unit’s No-Load Cost ($/Hr) is the No-Load fuel Cost multiplied by thePerformance Factor, multiplied by the (Total Fuel-Related Cost (TFRC))
The unit’s generator offer curve must comply with PJM’s monotonically increasing curverequirement. In some instances, the calculated No-Load Cost may have to be adjusted toensure that the slope of the generator offer curve is monotonically increasing. The No-LoadCost adjustment is limited to a maximum difference of $1/MWh between the unit’s first andsecond incremental cost offers.
As an alternative to adjusting the No-Load Cost, No-Load Cost may also be calculated bysubtracting the incremental cost (unit’s Economic Minimum cost-offer value multiplied by MWvalue) at the unit’s Economic Minimum point from the total cost (from the heat input at EconomicMinimum value) at the unit’s Economic Minimum point.
Note that if the unit of Variable Operations and Maintenance (VOM) cost is in terms of dollarsper Equivalent Service Hours (ESH), the equation changes to:
When using No-Load Fuel to calculate No-Load Cost, the Market Seller must submit blockaverage cost and cannot select “Use Offer Slope” when entering cost information into MarketsGateway. When using the alternative incremental cost method to calculate No-Load Cost, theMarket Seller must submit incremental cost and select “Use Offer Slope” when entering costinformation into Markets Gateway.
Revision: 2930, Effective Date: 05/15/201707/31/2018 PJM © 20172018 26

PJM Manual 15: Cost Development GuidelinesSection 2: Policies for All Unit Types
2.6 Variable Maintenance CostVariable Maintenance cost is the parts and labor expenses of maintaining equipment andfacilities in satisfactory operating condition.
PJM and the MMU will review the Maintenance Adders for all units pursuant to the CostMethodology and Approval Process and Schedule 1, Section 6 of the Operating Agreement.
The Maintenance Adder is based on all available maintenance expense history for the definedMaintenance Period (See 2.6.3) regardless of unit ownership. Only expenses incurred as aresult of electric production qualify for inclusion. The Maintenance Adder should be reviewed(and updated if changed) at least annually. Maintenance Adders may be included as part ofthe start cost, no load, or incremental energy offer. Maintenance Adders may be specified as $/Start, $/Hour, $/MBtu, $/Equivalent Operating Hour (EOH), and/or $/MWh.
The Maintenance Adder must be submitted to PJM and the MMU for review annually, inaccordance with Operating Agreement Schedule 2 Section 4. Market Sellers may only use thePJM-approved Maintenance Adder in their unit’s cost-based offer. Approved Maintenance andEmissions adders expire December 31 of the year following acceptance.
If a Market Seller feels that a unit modification or required change in operating procedureswill affect the unit's Maintenance Adder, the revised Maintenance Adder must be submitted toPJM and the MMU for review and PJM-approval prior to use in cost-based offersconsiderationpursuant to the Cost Methodology and Approval Process.
2.6.1 Escalation IndexEscalation Index is the annual escalation index derived from the July 1 Handy - Whitman IndexTable E-1, line 6, “construction cost electrical plant”.
YEAR INDEX ESCALATION FACTOR
1998 383 1.927
1999 389 1.8971.878
2000 415 1.7781.760
2001 425 1.7371.719
Revision: 2930, Effective Date: 05/15/201707/31/2018 PJM © 20172018 27

PJM Manual 15: Cost Development GuidelinesSection 2: Policies for All Unit Types
YEAR INDEX ESCALATION FACTOR
2002 438 1.6851.668
2003 441 1.6741.656
2004 465 1.5871.571
2005 493 1.4971.482
2006 515 1.4331.418
2007 546 1.3521.338
2008 596 1.2381.226
2009 578 1.2771.264
2010 604 1.2221.209
2011 631 1.1701.158
2012 645 1.1441.132
2013 653 1.1301.119
2014 672 1.0981.087
2015 700 1.0541.043
2016 714 1.0341.023
2017 738 (est)711 1.0001.027
2018 730 (est) 1.000
Exhibit 1: Handy Whitman Index
2.6.2 Maintenance PeriodA unit must choose a rolling historical period based on calendar year. A unit may choosea 10-year or 20-year period for maintenance cost. Once a unit has chosen the historicalperiod length, the unit must stay with that period until a significant unit configuration change.Significant unit configuration change is defined as any change to the physical unit’s system thatsignificantly affects the maintenance cost for a period greater than 10 years. Examples of asignificant unit configuration may include but are not limited to:
• Flue Gas Desulfurization (FGD or scrubber)• Activated Carbon Injection (ACI)• Selective Catalytic NOx Reduction (SCR)• Selective Non-Catalytic NOx Reduction (SNCR)
Revision: 2930, Effective Date: 05/15/201707/31/2018 PJM © 20172018 28

PJM Manual 15: Cost Development GuidelinesSection 2: Policies for All Unit Types
• Low-NOx burners• Bag House addition• Long-term Fuel change (greater than 10 years)• Water injection for NOx control• Turbine Inlet Air Cooling
A maintenance period choice may also be given in circumstances of change in ownershipnecessitating a new Interconnection Service Agreement (ISA). Change of ownership within thesame holding company is not eligible to change the historical maintenance period.
Note:Total Maintenance Dollars must be calculated for the same historical period as EquivalentService Hours.
2.6.3 Incremental Adjustment ParameterIncremental Adjustment Parameter is defined as any variable cost incurred in the production ofenergy for PJM dispatch that is not included in the CDS guidelines for Total Fuel Related Costsor Maintenance Adder. This includes water injection costs, Title 5 emission fees, and any othervariable cost that has been previously approved pursuant to Cost Methodology and ApprovalProcess for inclusion. These records shall be made available to PJM and MMU upon request.
2.6.4 Equivalent Hourly Maintenance Cost• The hourly Maintenance Cost in dollars per hour. This is defined as total maintenance
dollars divided by equivalent service hours or total fuel, depending on unit type.
Or
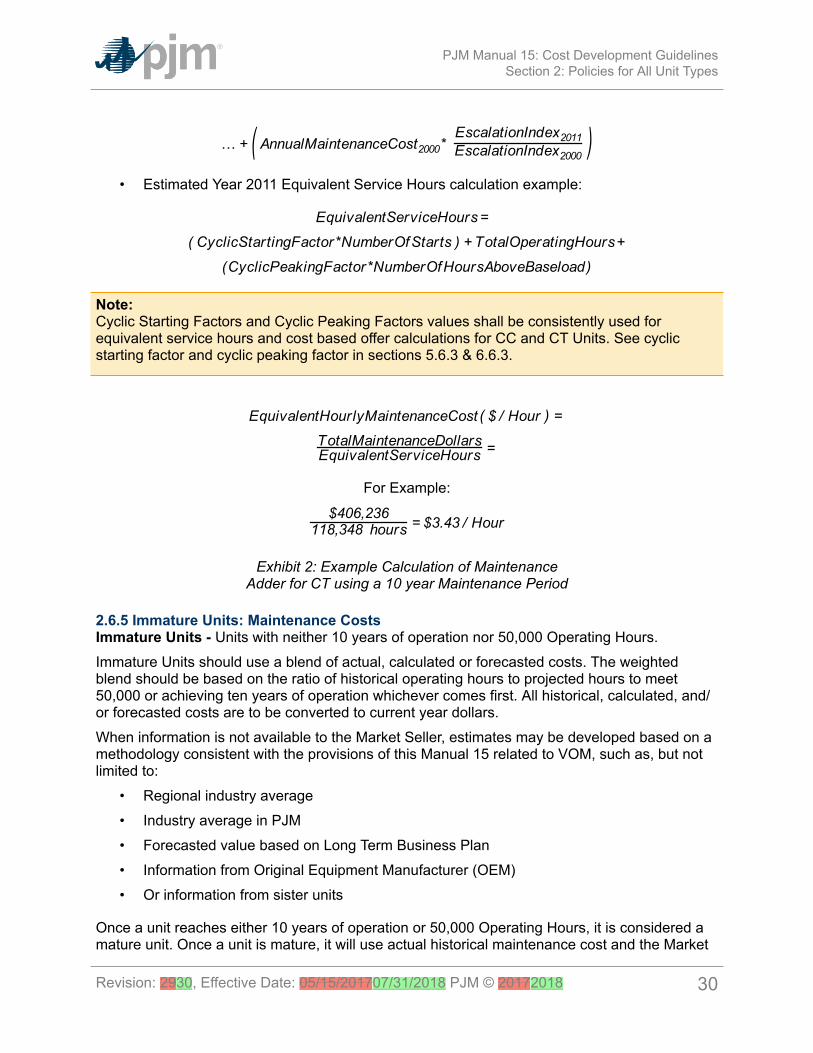
• Estimated Year 2011 Total Maintenance Cost calculation example for a CT:
Revision: 2930, Effective Date: 05/15/201707/31/2018 PJM © 20172018 29
PJM Manual 15: Cost Development GuidelinesSection 2: Policies for All Unit Types
• Estimated Year 2011 Equivalent Service Hours calculation example:
Note:Cyclic Starting Factors and Cyclic Peaking Factors values shall be consistently used forequivalent service hours and cost based offer calculations for CC and CT Units. See cyclicstarting factor and cyclic peaking factor in sections 5.6.3 & 6.6.3.
For Example:
Exhibit 2: Example Calculation of MaintenanceAdder for CT using a 10 year Maintenance Period
2.6.5 Immature Units: Maintenance CostsImmature Units - Units with neither 10 years of operation nor 50,000 Operating Hours.Immature Units should use a blend of actual, calculated or forecasted costs. The weightedblend should be based on the ratio of historical operating hours to projected hours to meet50,000 or achieving ten years of operation whichever comes first. All historical, calculated, and/or forecasted costs are to be converted to current year dollars.When information is not available to the Market Seller, estimates may be developed based on amethodology consistent with the provisions of this Manual 15 related to VOM, such as, but notlimited to:
• Regional industry average• Industry average in PJM• Forecasted value based on Long Term Business Plan• Information from Original Equipment Manufacturer (OEM)• Or information from sister units
Once a unit reaches either 10 years of operation or 50,000 Operating Hours, it is considered amature unit. Once a unit is mature, it will use actual historical maintenance cost and the Market
Revision: 2930, Effective Date: 05/15/201707/31/2018 PJM © 20172018 30

PJM Manual 15: Cost Development GuidelinesSection 2: Policies for All Unit Types
Seller will decide to use a 10 or 20 year history (See section 2.6.2). If a mature unit has lessmaintenance history than its elected historical period, the Market Seller will use all availablehistory to calculate VOM.Example: Immature UnitA CT with 5,000 operating hours after 10 years of operation with an unknown maintenancehistory.In this example, the Market Seller does not have the necessary information to computehistorical maintenance costs. This unit could use:
1. Regional industry average2. Industry average in PJM3. Forecasted value based on Long Term Business Plan4. Information from OEM5. Information from sister units
The Market Seller decides to use the forecasted value based on the Long Term Business Planof $25/ESH initially and a ten year maintenance history. In the following years, the unit’s VOMwould be calculated as follows:1
Immature Unit
Year CumulativeOH
VOM Calculation
1 6000 (Year 1 Total Actual Maintenance $ + (9*1000*$25/OH) ) / 10,000 OH
2 7000 (Year 1+2 Total Actual Maintenance + (8*1,000 $25/OH) ) / 10,000 OH
3 8000 (Year 1+2+3 Total Actual Maintenance + (7*1000* $25/OH) ) / 10,000 OH
4 9000 (Year 1+2+3+4 Total Actual Maintenance + (6*1000* $25/OH) ) / 10,000 OH
5 10000 (Year 1+2+3+4+5 Total Actual Maintenance + (5*1000* $25/OH) ) / 10,000OH
6 11000 (Year 1+2+3+4+5+6 Total Actual Maintenance + (4*1000*$25/OH) ) / 10,000OH
7 12000 (Year 1+2+3+4+5+6+7 Total Actual Maintenance + (3*1000*$25/OH) ) /10,000 OH
8 13000 (Year 1+2+3+4+5+6+7+8 Total Actual Maintenance + (2*1000*$25/OH) ) /10,000 OH
9 14000 (Year 1+2+3+4+5+6+7+8+9 Total Actual Maintenance + (1*1000*$25/OH) ) /10,000 OH
1 We are ignoring the effects of inflation and use of the Handy Whitman Index for simplicity.
Revision: 2930, Effective Date: 05/15/201707/31/2018 PJM © 20172018 31

PJM Manual 15: Cost Development GuidelinesSection 2: Policies for All Unit Types
Year CumulativeOH
VOM Calculation
10 15000 (Year 1+2+3+4+5+6+7+8+9+10 Total Actual Maintenance) / 10,000 OH
Unit is now Mature
2.7 Synchronized ReserveSynchronized Reserve is the capability that can be converted fully into energy within 10minutes or customer load that can be removed from the system within 10 minutes of the requestfrom the PJM dispatcher, and must be provided by equipment electrically synchronized to thesystem.
Market Sellers that request and receive reimbursement from PJM for the costs associated withoperating a generating unit in the condensing mode or for altering the output of a generatorat the request of PJM in order to provide Synchronized Reserves must maintain records todocument how those costs were calculated. These records shall be made available to PJMupon request.
2.8 Regulation ServiceRegulation is the capability of a specific resource with appropriate telecommunications, controland response capability to increase or decrease its output in response to a regulating controlsignal to control for frequency deviations
The cost-based regulation offer is split into two portions:
• The Regulation Capability portion consists of the fuel cost increase and unit specific heatrate degradation due to operating at lower loads and the margin risk adder;
• The Regulation Performance portion consists of the cost increase in VOM, costincrease due to heat rate increase during non-steady state operation and, whereapplicable, energy losses for energy storage devices. The $/MW value determined in theperformance offer will be converted to cost per mileage $/ΔMW by dividing the value bythe mileage ΔMW/MW for the applicable signal for that offer as described in Manual 11.
• Regulation Capability costs to provide Regulation Service from a unit shall include thefollowing components up to but not exceeding:
• Regulation Performance costs to provide Regulation Service from a unit shall include thefollowing components up to but not exceeding:
Revision: 2930, Effective Date: 05/15/201707/31/2018 PJM © 20172018 32

PJM Manual 15: Cost Development GuidelinesSection 2: Policies for All Unit Types
Fuel Cost Increase and Unit Specific Heat Rate Degradation due to Operating at lowerloadsThe costs (in $/MWh of Regulation) to provide Regulation Service from units shall not exceedthe fuel cost increase due to operating the unit at lower loads than at the optimal economicdispatch level load and the unit specific heat rate degradation from operating at lower loads,resulting from operating the unit at lower MW output incurred from the provision of Regulationover the entire generator MW range of providing Regulation Service.
Cost Increase due to Heat Rate increase during non-steady stateThe cost (in $/MWh of Regulation) increase due to the heat rate increase resulting fromoperating the unit at a non-steady-state condition. This heat rate loss factor rate shall notexceed 0.35% of the top Regulation load MW heat rate value.
Margin/Risk AdderMargin Risk Adder shall not exceed $12.00 per MWh of Regulation Service provided.
Energy Storage Unit LossesEnergy storage unit losses can only be greater than zero for energy storage type devices andcalculated in accordance with the guidance provided in section 11.8.
Cost increase in VOMThe cost increase (in $/MWh of Regulation) of variable operations and maintenance (VOM) costresulting from operating the unit at lower MW output incurred from the provision of Regulation.VOM costs shall be calculated by the following methods and shall not exceed those levelsbelow:
For non-hydro units that have been providing Regulation Service for less than 10 years, orall hydro units regardless of the historical years of Regulation Service, the following variableoperation and maintenance (VOM) costs can be applied by unit type up to the following:For anyunit that does not have a PJM approved Maintenance Adder, the following variable operationand maintenance (VOM) costs can be applied by unit type to the following:
Unit Type VOM
Super-critical Steam: $10.00 per MWh of Regulation
Sub-critical Steam: $3.50 per MWh of Regulation
Combined Cycle: $2.50 per MWh of Regulation
Combustion Turbine: $2.00 per MWh of Regulation
Hydro: $1.00 per MWh of Regulation
Revision: 2930, Effective Date: 05/15/201707/31/2018 PJM © 20172018 33

PJM Manual 15: Cost Development GuidelinesSection 2: Policies for All Unit Types
Unit Type VOM
Energy Storage: Based on OEM estimates initially and actual as history isavailable
Exhibit 3: VOM for all Hydro Units or Non-Hydro Units providing service for less than 10 years
For non-hydro units that have been providing Regulation Service for more than 10 years, theVOM rates above can be utilized only if the annual VOM dollar amounts resulting from thoserates and included in Regulation cost based offers, are subtracted from the escalated 10 or20 year historical total VOM accounts and the Regulation MWh based on the average of thelast three years.Any unit that has a PJM approved Maintenance Adder can use the VOM ratesabove if the annual VOM dollar amounts resulting from those rates included in Regulation costbased offers, are subtracted from the escalated 10 or 20 year historical total VOM accounts andthe Regulation MWh based on the average of the last three years.
Energy storage units that participate only in regulation Service shall include all their VOM Costincrease in VOM adder in Regulation cost offers.
For example, a 100 MW sub-critical coal fired steam unit that has been providing RegulationService for 30 years. The unit averaged 5,000 MWh of Regulation Service over the last threeyears and the escalated 20 year historical total VOM = $10,000,000.
Annual VOM Costs to Subtract
= ($3.50 per Regulation MWh * 5,000 MWh) * 20 years
= $17,500 per year * 20 years
= $350,000
20-year balance of historical total VOM accounts
= $10,000,000 - $350,000
= $ 9,650,000
Exhibit 4: Example of VOM for Non-Hydro Units providing Regulation for more than 10 years
Actual Regulation VOM incremental costs submitted and evaluated pursuant to the CostMethodology and Approval Process.
For Example for a Sub-critical Coal-Fired Steam Unit providing Regulation Service for the lastseven years:
Data Submitted by Participant Value Units
Fuel $1.50 $/MMBtu
Heat Rate @ EcoMax 9,000.00 MMBtu/KWh
Revision: 2930, Effective Date: 05/15/201707/31/2018 PJM © 20172018 34

PJM Manual 15: Cost Development GuidelinesSection 2: Policies for All Unit Types
Data Submitted by Participant Value Units
Heat Rate @ RegMin 12,5000.00 MMBtu/KWh
VOM $3.50 $/MW of Regulation
EcoMax 100.0 MW
RegMin 40.0 MW
Unit Reg Band 10.0 MW
Margin Adder $12.00 $/MW of Regulation
Heat Rate Adjustment(Operating Range)
Value Units
Unit Base Load Heat Rate FuelInput
360.0 MMBtu/Hr
Unit Reduced Load Heat RateFuel Input
500.0 MMBtu/Hr
Difference 140.0 MMBtu/Hr
Heat Rate Adjustment (Non-Steady State Operation)
Value Units
Total Operating Point Heat Rate 9,000.0 MMBtu/kWh
Heat Rate Loss Factor (Max per M15) 0.35%
Heat Rate Loss 3.15 MMBtu/Hr
Revision: 2930, Effective Date: 05/15/201707/31/2018 PJM © 20172018 35

PJM Manual 15: Cost Development GuidelinesSection 2: Policies for All Unit Types
(a) Heat Rate Adjustment(Operating Range)
Value Units
Fuel Cost Adder – Operating Range $3.50 $/Hr/MW of Regulation
For Example:
(b) Margin Risk Adder Value Units
Margin/Risk Adder $12.00 $/Hr/MW of Regulation
Maximum Capability Offer Value Units
Heat Rate Adjustment(Operating Range) + Margin Adder 15.5 $/Hr/MW ofRegulation
Historic Mileage Value
RegA 5
** This value is an example substitute for the average value for RegA.
(c) Heat Rate Adjustment(Non Steady-State Operation)
Value Units
Fuel Cost Adder – Non Steady-StateOperation
$0.50 $/Hr/MW of Regulation
For Example:
Revision: 2930, Effective Date: 05/15/201707/31/2018 PJM © 20172018 36

PJM Manual 15: Cost Development GuidelinesSection 2: Policies for All Unit Types
(d) VOM Adder Value Units
Regulation VOM Adder $3.50 $/Hr/MW of Regulation
Maximum Performance Offer Value Units
(c+d)/Historic Mileage $0.80 $/MW
Regulation Maximum Allowable Cost Adder Example:
Exhibit 5: Regulation Maximum Allowable Cost Adder Example
Revision: 2930, Effective Date: 05/15/201707/31/2018 PJM © 20172018 37
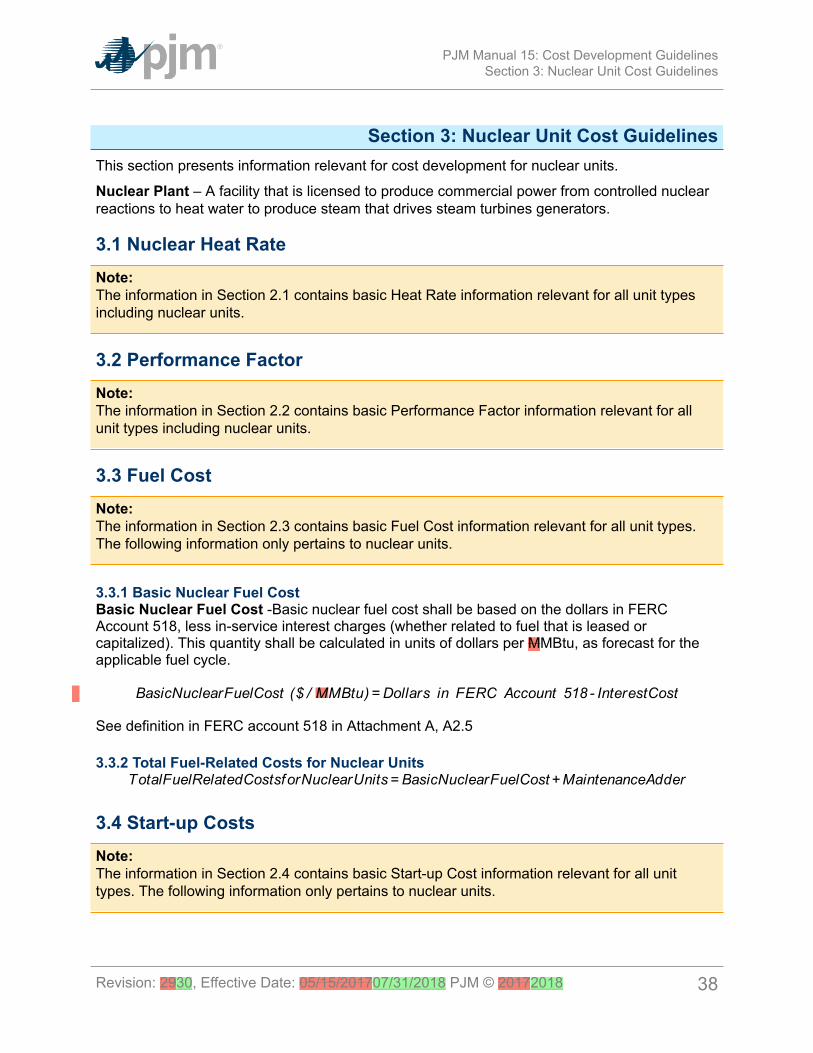
PJM Manual 15: Cost Development GuidelinesSection 3: Nuclear Unit Cost Guidelines
Section 3: Nuclear Unit Cost GuidelinesThis section presents information relevant for cost development for nuclear units.
Nuclear Plant – A facility that is licensed to produce commercial power from controlled nuclearreactions to heat water to produce steam that drives steam turbines generators.
3.1 Nuclear Heat RateNote:The information in Section 2.1 contains basic Heat Rate information relevant for all unit typesincluding nuclear units.
3.2 Performance FactorNote:The information in Section 2.2 contains basic Performance Factor information relevant for allunit types including nuclear units.
3.3 Fuel CostNote:The information in Section 2.3 contains basic Fuel Cost information relevant for all unit types.The following information only pertains to nuclear units.
3.3.1 Basic Nuclear Fuel CostBasic Nuclear Fuel Cost -Basic nuclear fuel cost shall be based on the dollars in FERCAccount 518, less in-service interest charges (whether related to fuel that is leased orcapitalized). This quantity shall be calculated in units of dollars per MMBtu, as forecast for theapplicable fuel cycle.
See definition in FERC account 518 in Attachment A, A2.5
3.3.2 Total Fuel-Related Costs for Nuclear Units
3.4 Start-up CostsNote:The information in Section 2.4 contains basic Start-up Cost information relevant for all unittypes. The following information only pertains to nuclear units.
Revision: 2930, Effective Date: 05/15/201707/31/2018 PJM © 20172018 38

PJM Manual 15: Cost Development GuidelinesSection 3: Nuclear Unit Cost Guidelines
Start-up Cost – The dollars per start as determined from start fuel, Total Fuel-Related Cost,Performance Factor, electrical costs, start maintenance adder, and additional labor cost, ifrequired above normal station manning levels.
Start Fuel – Fuel consumed from first fire of start process (initial reactor criticality for nuclearunits) to breaker closing and fuel expended from breaker opening of the previous shutdown toinitialization of the (hot) unit start-up, excluding normal plant heating/auxiliary equipment fuelrequirements.
3.4.1 Hot Start-up CostHot Start-up Cost is the expected cost to start a steam unit, which is in the "hot" condition.Hot conditions vary unit by unit, but in general, a unit is hot after an overnight shutdown.Components of hot start cost include:
• Total Fuel-Related Cost from first fire of start process (initial reactor criticality for nuclearunits) to breaker closing priced at the cost of fuel currently in effect
• And shutdown fuel cost defined as the cost of fuel expended from breaker opening ofthe previous shutdown to initialization of the (hot) unit start-up, excluding normal plantheating/auxiliary equipment fuel requirements.
3.4.2 Intermediate Start-up CostIntermediate Start-up Cost is the expected cost to start a steam unit during a period whereneither hot or cold conditions apply. Use of intermediate start cost is optional based on MarketSeller’s policy and physical machine characteristics. The only restriction is that once anintermediate Start-up Cost is defined for a unit, the cost must be used consistently in schedulingand accounting. Components of intermediate Start-up Cost include:
• Total Fuel-Related Cost from first fire (initial reactor criticality for nuclear units) to breakerclosing priced at the cost of fuel currently in effect
• And shutdown fuel cost defined as the cost of fuel expended from breaker opening of theprevious shutdown to initialization of the (intermediate) unit start-up, excluding normalplant heating/auxiliary equipment fuel requirements.
3.4.3 Cold Start-up CostCold Start-up Cost is the expected cost to start a steam unit that is in the "cold" condition. Coldconditions vary unit by unit, but in general, a unit is cold after a two or three-day shutdown.Components of cold Start-up Cost include:
• Total Fuel-Related Cost from first fire (initial reactor criticality for nuclear units) to breakerclosing priced at the cost of fuel currently in effect
• And shutdown fuel cost defined as the cost of fuel expended from breaker opening ofthe previous shutdown to shutdown of equipment needed for normal cool down of plantcomponents, excluding normal plant heating/auxiliary equipment fuel requirements.
3.4.4 Additional Components Applied to Hot, Intermediate and Cold Start-up CostsThese additional components for station service, labor and maintenance apply to all types ofstarts and should be added to the cost.
Revision: 2930, Effective Date: 05/15/201707/31/2018 PJM © 20172018 39

PJM Manual 15: Cost Development GuidelinesSection 3: Nuclear Unit Cost Guidelines
• Station service from initiation of start sequence to breaker closing (total station useminus normal base station use) priced at the Station Service rate.
• Station service after breaker opening during shutdown (station service during shutdownshould be that associated with the normal unit auxiliary equipment operated duringshutdown in excess of base unit use, this station service is not to include maintenanceuse or non-normal use) priced at the Station Service rate.
• Additional labor costs in excess of normal station manning requirements that areincurred when starting the unit.
• Start Maintenance Adder.
3.5 No-Load CostNote:The information in Section 2.5 contains basic No-Load Cost information relevant for all unittypes including nuclear units.
3.6 Maintenance CostNote:The information in Section 2.6 contains basic Maintenance Cost information relevant for all unittypes including nuclear units.
Nuclear Maintenance Adder - The dollars per unit of fuel (or heat) as derived from FERCAccounts 530 and 531 for nuclear steam units minus labor.
3.6.1 Configuration Addition Maintenance AdderFor units undergoing a significant system or unit Configuration Addition the use of an additional“Configuration Addition Maintenance Adder” may be included in the determination of the totalmaintenance adder. It is not intended to be used for upgrades to existing equipmentExamples of significant system or unit Configuration Additions may include but are not limited to:
• Conversion from open loop to closed loop circulation water systems
The specific system or unit configuration system change must be reviewed by PJM and theMMU for evaluation pursuant to the Cost Methodology and Approval Process prior to approvingthe use of a Configuration Addition Maintenance adder.To calculate Total Maintenance Dollars for 2011, this example assumes a maintenance period of10 years; please see section 2.6.3 for further explanation of Maintenance Periods.
Revision: 2930, Effective Date: 05/15/201707/31/2018 PJM © 20172018 40
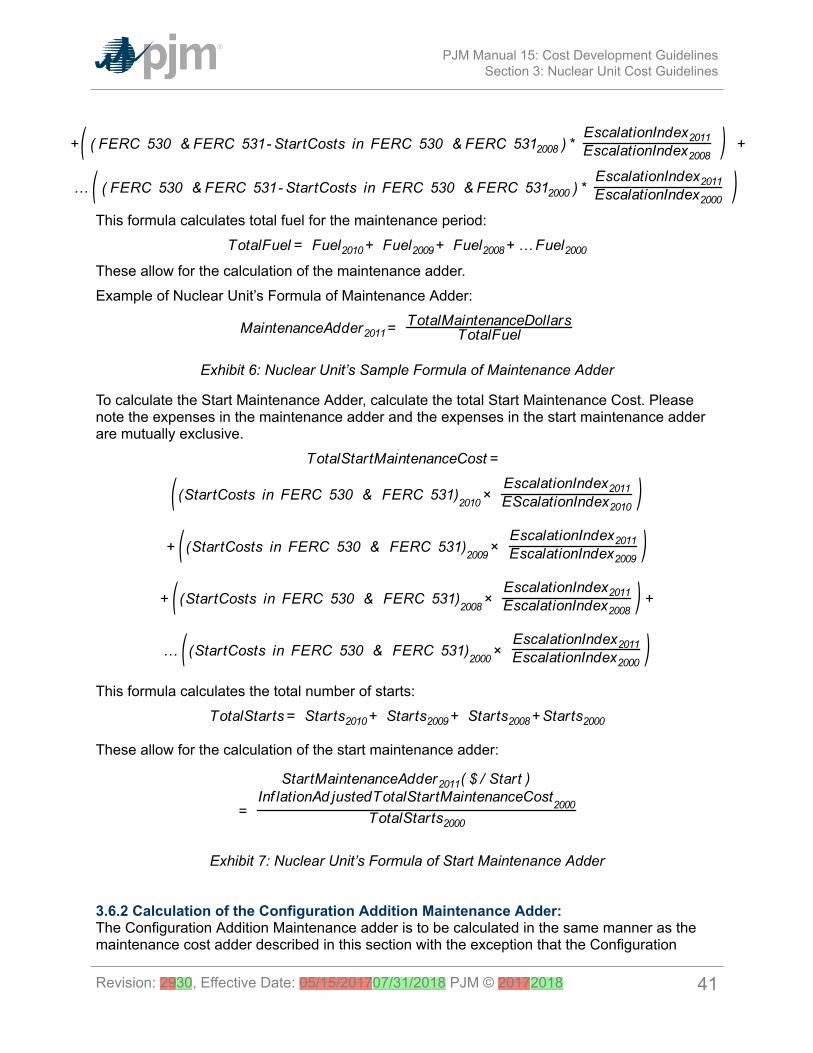
PJM Manual 15: Cost Development GuidelinesSection 3: Nuclear Unit Cost Guidelines
This formula calculates total fuel for the maintenance period:
These allow for the calculation of the maintenance adder.Example of Nuclear Unit’s Formula of Maintenance Adder:
Exhibit 6: Nuclear Unit’s Sample Formula of Maintenance Adder
To calculate the Start Maintenance Adder, calculate the total Start Maintenance Cost. Pleasenote the expenses in the maintenance adder and the expenses in the start maintenance adderare mutually exclusive.
This formula calculates the total number of starts:
These allow for the calculation of the start maintenance adder:
Exhibit 7: Nuclear Unit’s Formula of Start Maintenance Adder
3.6.2 Calculation of the Configuration Addition Maintenance Adder:The Configuration Addition Maintenance adder is to be calculated in the same manner as themaintenance cost adder described in this section with the exception that the Configuration
Revision: 2930, Effective Date: 05/15/201707/31/2018 PJM © 20172018 41

PJM Manual 15: Cost Development GuidelinesSection 3: Nuclear Unit Cost Guidelines
Addition Maintenance total maintenance dollars (CATMD) are only the incremental additionalcosts incurred because of the system or unit configuration change.As with the current maintenance adder calculation, the adder for year (Y) uses the actual costsbeginning with year (Y-1). Therefore, the first year of actual incremental additional expenses willbe captured by the CAMA in the second year.Following the initial year of use of the CAMA, each additional year’s Configuration AdditionMaintenance cost will be incorporated into the Configuration Addition Maintenance adder untilthe end of the historical maintenance cost period selected for the unit.To calculate the Configuration Addition Maintenance Adder, calculate the solely incrementalMaintenance Cost for the Configuration Change. Please note these expenses are purelyincremental.
Exhibit 8: Nuclear Unit’s Formula of Configuration Addition Maintenance Adder
3.6.3 Reductions in Total Maintenance CostsWhile it is expected that the Configuration Addition Maintenance adder will most often be usedto cover step increases in maintenance costs, it is also to be used to capture step decreasesin maintenance costs resulting from a significant system or unit configuration change thatresults in a significant reduction in maintenance costs. Any equipment that falls into disuse oris retired because of the configuration change must have its maintenance expenses removedfrom the historical record used to develop the maintenance adder. An example of a significantsystem or unit configuration change that may result in a step decrease in qualified maintenancecosts includes, but is not limited to, conversion from open loop to closed loop circulation watersystems.
Revision: 2930, Effective Date: 05/15/201707/31/2018 PJM © 20172018 42

PJM Manual 15: Cost Development GuidelinesSection 3: Nuclear Unit Cost Guidelines
3.7 Synchronized Reserve CostNote:The information in Section 2.7 contains basic Synchronized Reserve information relevant for allunit types including nuclear units where applicable.
3.8 Regulation CostNote:The information in Section 2.8 contains basic Regulation information relevant for all unit typesincluding nuclear units where applicable.
Revision: 2930, Effective Date: 05/15/201707/31/2018 PJM © 20172018 43
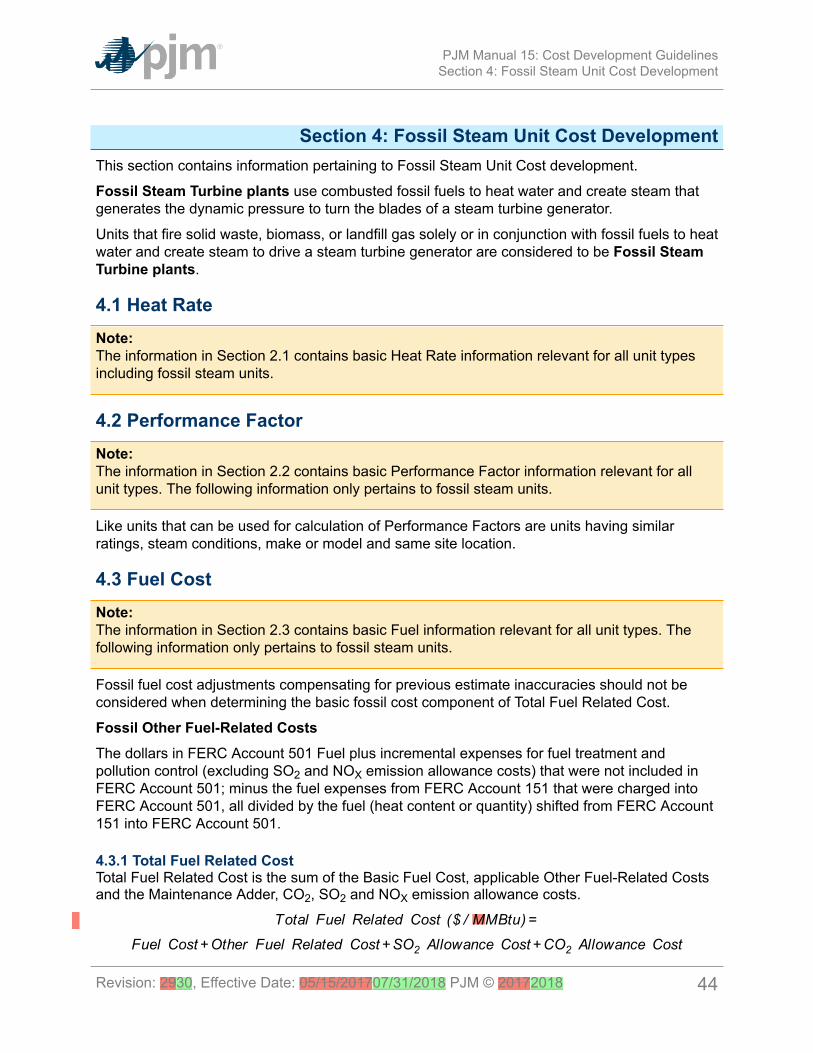
PJM Manual 15: Cost Development GuidelinesSection 4: Fossil Steam Unit Cost Development
Section 4: Fossil Steam Unit Cost DevelopmentThis section contains information pertaining to Fossil Steam Unit Cost development.
Fossil Steam Turbine plants use combusted fossil fuels to heat water and create steam thatgenerates the dynamic pressure to turn the blades of a steam turbine generator.
Units that fire solid waste, biomass, or landfill gas solely or in conjunction with fossil fuels to heatwater and create steam to drive a steam turbine generator are considered to be Fossil SteamTurbine plants.
4.1 Heat RateNote:The information in Section 2.1 contains basic Heat Rate information relevant for all unit typesincluding fossil steam units.
4.2 Performance FactorNote:The information in Section 2.2 contains basic Performance Factor information relevant for allunit types. The following information only pertains to fossil steam units.
Like units that can be used for calculation of Performance Factors are units having similarratings, steam conditions, make or model and same site location.
4.3 Fuel CostNote:The information in Section 2.3 contains basic Fuel information relevant for all unit types. Thefollowing information only pertains to fossil steam units.
Fossil fuel cost adjustments compensating for previous estimate inaccuracies should not beconsidered when determining the basic fossil cost component of Total Fuel Related Cost.
Fossil Other Fuel-Related CostsThe dollars in FERC Account 501 Fuel plus incremental expenses for fuel treatment andpollution control (excluding SO2 and NOX emission allowance costs) that were not included inFERC Account 501; minus the fuel expenses from FERC Account 151 that were charged intoFERC Account 501, all divided by the fuel (heat content or quantity) shifted from FERC Account151 into FERC Account 501.
4.3.1 Total Fuel Related CostTotal Fuel Related Cost is the sum of the Basic Fuel Cost, applicable Other Fuel-Related Costsand the Maintenance Adder, CO2, SO2 and NOX emission allowance costs.
Revision: 2930, Effective Date: 05/15/201707/31/2018 PJM © 20172018 44

PJM Manual 15: Cost Development GuidelinesSection 4: Fossil Steam Unit Cost Development
4.4 Start-up CostNote:The information in Section 2.4 contains basic Start-up Cost information relevant for all unittypes. The following information only pertains to fossil steam units.
Note:In some instances, a Steam Unit with a Start-up plus Notification time greater than 48 hoursmay enter a state called “Extended Cold Start” as defined in M10, M13, M14D and the MarketsGateway User Guide. Steam units in this state, calculate the Start Cost information associatedwith this state in accordance with the “Cold Start Cost” Section below and enter this value intothe “Cold Start Cost” field in Markets Gateway
4.4.1 Hot Start-up CostHot Start-up Cost is the expected cost to start a steam unit, which is in the "hot" condition.Hot conditions vary unit by unit, but in general, a unit is hot after an overnight shutdown.Components of hot Start-up Cost include:Total fuel-related cost are the costs from first fire of start process to breaker closing (includingauxiliary boiler fuel) priced at the cost of fuel currently in effect including shutdown fuel costdefined as the cost of fuel expended from breaker opening of the previous shutdown toinitialization of the (hot) unit start-up, excluding normal plant heating/auxiliary equipment fuelrequirements.Station Service from initiation of start sequence to breaker closing (total station use minusnormal base station use) priced at the Station Service rate and station service after breakeropening during shutdown (station service during shutdown should be that associated with thenormal unit auxiliary equipment operated during shutdown in excess of base unit use, thisstation service is not to include maintenance use or non-normal use) priced at the StationService rate.Additional labor costs in excess of normal station manning requirements that are incurredwhen starting the unit.Start Maintenance Adder - Section 2.6 contains information regarding calculation ofMaintenance Adder.
Revision: 2930, Effective Date: 05/15/201707/31/2018 PJM © 20172018 45

PJM Manual 15: Cost Development GuidelinesSection 4: Fossil Steam Unit Cost Development
4.4.2 Intermediate Start-up CostIntermediate Start-up Cost is the expected cost to start a steam unit during a period whereneither hot nor cold conditions apply. Use of intermediate Start-up Cost is optional based oncompany policy and physical machine characteristics. The only restriction is that once anintermediate Start-up Cost is defined for a unit, the cost must be used consistently in schedulingand accounting. Components of intermediate Start-up cost include:Total fuel-related cost is the cost from first fire to breaker closing (including auxiliary boiler fuel)priced at the cost of fuel currently in effect, and shutdown fuel cost defined as the cost of fuelexpended from breaker opening of the previous shutdown to initialization of the (intermediate)unit start-up, excluding normal plant heating/auxiliary equipment fuel requirements.Station Service from initiation of start sequence to breaker closing (total station use minusnormal base station use) priced at the Station Service rate and station service after breakeropening during shutdown (station service during shutdown should be that associated with thenormal unit auxiliary equipment operated during shutdown in excess of base unit use, thisstation service is not to include maintenance use or non-normal use) priced at the StationService rate.Additional labor costs in excess of normal station manning requirements that are incurredwhen starting the unit.Start Maintenance Adder - Section 2.6 contains information for calculation of the MaintenanceAdder.
4.4.3 Cold Start-up CostCold Start-up Cost is the expected cost to start a steam unit that is in the "cold" condition. Coldconditions vary unit by unit, but in general, a unit is cold after a two or three-day shutdown.Components of cold Start-up Cost include:Total fuel-related cost from first fire to breaker closing (including auxiliary boiler fuel) priced atthe cost of fuel currently in effect, and shutdown fuel cost defined as the cost of fuel expendedfrom breaker opening of the previous shutdown to shutdown of equipment needed for normalcool down of plant components, excluding normal plant heating/auxiliary equipment fuelrequirements.Station Service from initiation of start sequence to breaker closing (total station use minusnormal base station use) priced at the Station Service rate and station service after breakeropening during shutdown (station service during shutdown should be that associated with thenormal unit auxiliary equipment operated during shutdown in excess of base unit use, thisstation service is not to include maintenance use or non-normal uses) priced at the StationService rate.Additional labor costs in excess of normal station manning requirements that are incurredwhen starting the unit.Start Maintenance Adder - Section 2.6 contains information for calculation of the MaintenanceAdder.
Revision: 2930, Effective Date: 05/15/201707/31/2018 PJM © 20172018 46

PJM Manual 15: Cost Development GuidelinesSection 4: Fossil Steam Unit Cost Development
4.5 No-Load CostNote:The information in Section 2.5 contains basic No-Load Cost information relevant for all unittypes including fossil steam units.
4.6 Maintenance CostNote:The information in Section 2.6 contains basic Maintenance Cost information relevant for all unittypes. The following information only pertains to fossil steam units.
Fossil Steam - Maintenance Adder - is the dollars per unit of fuel (or heat) as derived fromFERC Accounts 512 and 513 for fossil steam units minus labor.
Note:Total Maintenance Dollars (TMD) plus (+) Total Start Maintenance Dollars (TSD) cannot exceedTotal Dollars in FERC Accounts 512 and 513.
Calculate total Maintenance Dollars for 2011, this example assumes a maintenance period of 10years; please see section 2.6.3 for further explanation of Maintenance Periods.
Calculate total fuel burned (heat input in MMBtuMBTU) for the maintenance period.
These allow for the calculation of the maintenance adder:
Exhibit 9: Fossil Steam Unit’s Sample Formula of Maintenance Adder
To Calculate the Start Maintenance Adder, Calculate the total Start Maintenance Cost. Pleasenote the expenses in the maintenance adder and the expenses in the start maintenance adderare mutually exclusive.
Revision: 2930, Effective Date: 05/15/201707/31/2018 PJM © 20172018 47

PJM Manual 15: Cost Development GuidelinesSection 4: Fossil Steam Unit Cost Development
This formula calculates the total number of starts:
These allow for the calculation of the start maintenance adder:
Exhibit 10: Fossil Steam Unit’s Sample Formula of Start Maintenance Adder
4.6.1 Configuration Addition Maintenance AdderFor units undergoing a significant system or unit Configuration Addition the use of an additional“Configuration Addition Maintenance Adder” may be included in the determination of the totalmaintenance adder. It is not intended to be used for upgrades to existing equipment (i.e.:replacement of a standard burner with a low NOx burner).Examples of significant system or unit Configuration Additions may include but are not limited to:
• Installation of Flue Gas Desulfurization (FGD or scrubber) systems• Activated Carbon Injection (ACI) or other sorbent injection systems• Installation of SCR or SNCR NOx removal systems• Conversion from open loop to closed loop circulation water systems• Bag House addition• Water injection for NOx control• Turbine Inlet Air Cooling
The specific system or unit configuration system change needs to be reviewed by PJM andthe MMU pursuant to the Cost Methodology and Approval Process and receive final approvalthereof prior to the use of a Configuration Addition Maintenance adder.
4.6.2 Calculation of the Configuration Addition Maintenance Adder:The Configuration Addition Maintenance adder is to be calculated in the same manner as themaintenance cost adder described in this section with the exception that the ConfigurationAddition Maintenance total maintenance dollars (CATMD) are only the incremental additionalcosts incurred because of the system or unit configuration change.
Revision: 2930, Effective Date: 05/15/201707/31/2018 PJM © 20172018 48

PJM Manual 15: Cost Development GuidelinesSection 4: Fossil Steam Unit Cost Development
As with the current maintenance adder calculation, the adder for year (Y) uses the actual costsbeginning with year (Y-1). Therefore, the first year of actual incremental additional expenses willbe captured by the CAMA in the second year.Following the initial year of use of the CAMA, each additional year’s Configuration Additionmaintenance cost will be incorporated into the Configuration Addition maintenance adder untilthe end of the historical maintenance cost period selected for the unit.To Calculate the Configuration Addition Maintenance Adder, Calculate the solely incrementalMaintenance Cost for the Configuration Change. Please note these expenses are purelyincremental and adhere to the requirements in section 3.8.1.
Exhibit 11: Fossil Unit’s Sample Formula of Configuration Addition Maintenance Adder
4.6.3 Reductions in Total Maintenance Costs:While it is expected that the Configuration Addition Maintenance adder will most often be usedto cover step increases in maintenance costs, it is also to be used to capture step decreases inmaintenance costs resulting from a significant system or unit configuration change that resultsin a significant reduction in maintenance costs. Any equipment that falls into disuse or is retiredbecause of the configuration change must have its maintenance expenses removed from thehistorical record used to develop the maintenance adder. An example of a significant systemor unit configuration change that may result in a step decrease in qualified maintenance costsincludes, but is not limited to, a fuel change from coal to gas fuel.
4.7 Synchronized ReserveNote:The information in Section 2.7 contains basic Synchronized Reserve Cost information relevantfor all unit types. The following information only pertains to fossil steam units.
Total costs to provide Tier 2 Synchronized reserve from a steam unit shall include the followingcomponents:
Revision: 2930, Effective Date: 05/15/201707/31/2018 PJM © 20172018 49

PJM Manual 15: Cost Development GuidelinesSection 4: Fossil Steam Unit Cost Development
Further information on Tier 1 and Tier 2 Synchronized Reserve can be found in PJM Manual 11.Heat Rate Increase is the incremental increase resulting from operating the unit at lower MWoutput resulting from the provision of Synchronized reserve service
Total Steam Unit offers must be expressed in dollars per hour per MW of Synchronized Reserve($/MWh) and must specify the total MW of Synchronized Reserve offered.
For Example:
Output Heat Rate
Steam Unit Full Load: 100 MW 9,000MMBtuMBTU/kWh
Steam Unit Reduced Load: 70 MW 9,500MMBtuMBTU/kWh
VOM Rate: $0.50/MMBtuMBTU
Heat Rate Penalty = (9,500 – 9,000)/9,000 = 5.56%
Adjusted VOM = $0.50 * 1.0556 = $0.5278/MMBtuMBTU
Steam Unit Reduced Load Heat Input = 9,500 * 70 /1000 = 665 MMBtuMBTU/Hr
Heat Rate VOM Penalty = ($0.5278/MMBtuMBTU - $0.50/MMBtuMBTU) * 665MMBtuMBTU/Hr = $18.487/Hr
Synchronized Reserve VOM Adder = $18.487/Hr / (100 MW – 70 MW) = $0.6162/Synchronized MW
Exhibit 12: Steam Unit Synchronized Reserve Example
4.8 RegulationNote:The information in Section 2.8 contains basic Regulation Cost information relevant for all unittypes including fossil steam units.
Revision: 2930, Effective Date: 05/15/201707/31/2018 PJM © 20172018 50

PJM Manual 15: Cost Development GuidelinesSection 5: Combined Cycle (CC) Cost Development
Section 5: Combined Cycle (CC) Cost DevelopmentThis section contains information pertaining to CC Cost development.
Combined Cycle - An electric generating technology in which electricity is generated by botha CT generator (the Brayton Cycle) and a steam turbine generator (the Rankine Cycle) hencethe name CC. The CT exhaust heat flows to a conventional boiler or to a heat recovery steamgenerator (HRSG) to produce steam for use by a steam turbine generator in the production ofelectricity.
Heat recovery steam generator (HRSG) – A CT exhaust feeds hot gas into a heat to steamexchanger installed on combined-cycle power plants designed to utilize the heat in the CTexhaust to produce steam to drive a conventional steam turbine generator.
5.1 Heat RateNote:The information in Section 2.1 contains basic Heat Rate information relevant for all unit typesincluding CC.
5.2 Performance FactorsNote:The information in Section 2.2 contains basic Performance Factor information relevant for allunit types including CC units.
5.3 Fuel CostNote:The information in Section 2.3 contains basic Fuel Cost information relevant for all unit typesincluding CC units.
5.4 Start-up CostNote:The information in Section 2.4 contains basic Start-up Cost information relevant for all unittypes. The following additional information only pertains to CC units.
Start-up Costs for Combined Cycle (CC) plants shall include only the following components andshall never be less than zero:
TFRC = Total Fuel Related Cost
Revision: 2930, Effective Date: 05/15/201707/31/2018 PJM © 20172018 51
PJM Manual 15: Cost Development GuidelinesSection 5: Combined Cycle (CC) Cost Development
Start Fuel Consumed Cost is the cost of start fuel (basic fuel cost plus fuel handling andother fuel-related costs) from first CT fire to breaker closing for the steam turbine generator,as measured during a normal start sequence, and the cost of shutdown fuel from last breakeropening to fuel valve closure. Additionally, this includes the cost of start fuel from CT first fire tothe point where heat recovery steam generator (HRSG) steam pressure matches steam turbineinlet pressure, for any CT unit/HRSG combinations started after synchronization of the steamturbine generator.
Station Service is included from initiation of start sequence of initial CT to breaker closing ofthe steam turbine generator (total station use minus normal base station use) priced at theStation Service Rate.
Add to this (+) station service after breaker opening of the last component when finishedoperating as a CC unit, priced at the Station Service rate. (Station service during shutdownshould be that associated with the normal unit auxiliary equipment operated during shutdown inexcess of base unit use. This station service is not to include maintenance use or non-normaluses.)
Minus (-) the integration of net generation from CT synchronization to steam turbine generatorsynchronization or to HRSG steam output at line pressure, priced at the actual cost of the unit.
Minus (-) the integration of net generation during the shutdown period, priced at the actual costof the unit.
Incremental labor costs in excess of normal station manning requirements (only whennecessary to start the CC unit).
Start Maintenance Adder. This quantity includes both the previously defined CT StartingMaintenance Cost
5.5 No-Load CostNote:The information in Section 2.5 contains basic Start-up Cost information relevant for all unit typesincluding CC units.
5.6 Maintenance CostNote:The information in Section 2.6 contains basic Maintenance Cost information relevant for all unittypes. The following additional information only pertains to CC units.
Combined Cycle Maintenance Adder – The dollars per unit of fuel (or heat) as derived fromFERC Accounts 512, 513, and 553. If submitting as a simple cycle CT, use total dollars fromFERC Account 553 divided by Equivalent Service Hours (ESH).
Revision: 2930, Effective Date: 05/15/201707/31/2018 PJM © 20172018 52

PJM Manual 15: Cost Development GuidelinesSection 5: Combined Cycle (CC) Cost Development
5.6.1 Combined Cycle / CT Long Term Service Contract Cost RecoveryA Market Seller that has a currently in effect Long Term Service Contract (LTSA) with a thirdparty vendor to provide overhaul and maintenance work on a CT either as part of a CC plantor as a stand-alone CT, may file with PJM and the MMU for inclusion of any variable long termmaintenance costs in cost based offer bids pursuant to the Cost Methodology and ApprovalProcess, if the following conditions are met:
• The included variable long-term maintenance costs are consistent with the definition ofsuch costs in the Cost Development Guidelines
• And the dollar value of each component of the variable long-term maintenance costs isset specifically in the LTSA.
•
5.6.2 Long Term Maintenance ExpensesLong Term Maintenance Expenses - CC Plant major inspection and overhaul expenses,after being previously evaluated and approved, may be included until June 1, 2015 in variablemaintenance expenses. Previously approved Long Term Maintenance Expenses will beremoved from maintenance history as of June 1, 2015.
5.6.3 Equivalent service hours (ESH)The estimated hours the unit will run based on history:
CC CTs shall use OEM supplied values for Cyclic starting factors and Cyclic peaking factorseven if the CT technology is no longer being built. In situations where cyclic starting factors orCyclic peaking factors are unknown or unavailable, CC CTs shall use:Cyclic starting factor = 5.0 for aircraft - type CTs and 10.0 for industrial - type CTsAndCyclic peaking factor = 3.0 for all CTs.WhereA Cyclic starting factor = 10.0 for an industrial – type CT forexample, the incremental maintenance charged to one start on an industrial - type CT isequivalent to the incremental maintenance attributable to ten hours of base load operation.And the Cyclic peaking factor = 3.0means that the additional incremental maintenance charged to the incremental energy betweenbase and peak loads is equivalent to the incremental maintenance attributable to three hours ofbase load operation.
Revision: 2930, Effective Date: 05/15/201707/31/2018 PJM © 20172018 53

PJM Manual 15: Cost Development GuidelinesSection 5: Combined Cycle (CC) Cost Development
5.7 Synchronized ReserveNote:The information in Section 2.7 contains basic Synchronized Reserve Cost information relevantfor all unit types. The following information only pertains to CC units.
Total costs to provide Synchronized reserve from a CC unit shall include the followingcomponents:
Heat Rate Increase is the incremental increase resulting from operating the unit at lower MWoutput resulting from the provision of Synchronized reserve service
Total CC Unit offers must be expressed in dollars per hour per MW of Synchronized Reserve ($/MWh) and must specify the total MW of Synchronized Reserve offered.
For Example:
Output Heat Rate
CC Unit Full Load: 450 MW 7,500MMBtuMBTU/kWh
CC Unit Reduced Load: 400 MW 7,800MMBtuMBTU/kWh
VOM Rate: $0.50/MMBtuMBTU
Heat Rate Penalty = (7,800 – 7,500)/7,500 = 4%
Adjusted VOM = $0.50 * 1.04 = $0.52/MMBtuMBTU
CC Unit Reduced Load Heat Input = 7,800 * 400 /1000 = 3,120 MMBtuMBTU/Hr
Heat Rate VOM Penalty = ($0.52/MMBtuMBTU - $0.50/MMBtuMBTU) * 3,120MBTU/Hr = $62.40/Hr
Synchronized Reserve VOM Adder = $62.40/Hr / (450 MW – 400 MW) = $1.248/Synchronized MW
Exhibit 13: Combined Cycle Unit Synchronized Reserve Example
Revision: 2930, Effective Date: 05/15/201707/31/2018 PJM © 20172018 54

PJM Manual 15: Cost Development GuidelinesSection 5: Combined Cycle (CC) Cost Development
5.8 RegulationNote:The information in Section 2.8 contains basic Regulation Cost information relevant for all unittypes including CC units.
Revision: 2930, Effective Date: 05/15/201707/31/2018 PJM © 20172018 55

PJM Manual 15: Cost Development GuidelinesSection 6: Combustion Turbine (CT) and Diesel Engine Costs
Section 6: Combustion Turbine (CT) and Diesel Engine CostsThis section details specific information for the cost development of units that are CTs or dieselengines.
Combustion Turbine Unit – A generating unit in which a natural gas or oil fired CT engine isthe prime mover for an electrical generator. CTs that fire landfill gas solely or in conjunction withfossil fuels as a prime mover for an electrical generator are considered to be a CombustionTurbine Unit.
Diesel Engine – A generating unit in which a diesel reciprocating engine is the prime mover foran electrical generator. Reciprocating engines that fire landfill gas solely or in conjunction withfossil fuels as a prime mover for an electrical generator are considered to be a Diesel Engine.
6.1 Combustion Turbine and Diesel Engine Heat RateNote:The information in Section 2.1 contains basic Heat Rate information relevant for all unit types.The following additional information only pertains to CT and diesel engine units.
For CT generating units, no-load fuel shall be the theoretical or actual fuel burn rate expressedin MMBtu/Hr at the point of electric bus synchronization.
6.2 Performance FactorNote:The information in Section 2.2 contains basic Performance Factor information relevant for allunit types. The following additional information only pertains to CT and diesel engine units.
‘Like’ CT Units - An average Performance Factor may be calculated and applied for groupsof like units burning the same type of fuel. Like includes same primary manufacturer notnecessarily engine or generator manufacturer, but one with overall system responsibility. Thefollowing are two examples:
• Worthington sells CT's with P&W engines and a GE generator. Worthington would beconsidered the primary manufacturer.
• Same general frame size - a manufacturer may modify a basic design to produce unitswith varying capabilities. Units built with such variations may be placed in a may beplaced in a single group.
6.3 Fuel CostNote:The information in Section 2.3 contains basic Fuel Cost information relevant for all unit types.The following additional information only pertains to CT and diesel engine units.
CT Maintenance Adder is included directly with the individual operating cost components on a $/hour basis.
Revision: 2930, Effective Date: 05/15/201707/31/2018 PJM © 20172018 56

PJM Manual 15: Cost Development GuidelinesSection 6: Combustion Turbine (CT) and Diesel Engine Costs
6.3.1 Combustion Turbine other Fuel-Related CostsThe dollars in FERC Account 547, plus incremental expenses for fuel treatment and pollutioncontrol excluding SO2 and NOX emission allowance costs that were not included in Account547; minus the fuel expenses from FERC Account 151 that were charged into Account 547, alldivided by the fuel (heat content or quantity) shifted from Account 151 into Account 547.
6.3.2 Total Fuel Related Cost (TFRC) Equation for CTs
Note:CT Maintenance Adder is included directly in start, no-load and peak segment components.
6.4 Start-up CostNote:The information in Section 2.4 contains basic Start-up Cost information relevant for all unittypes. The following additional information only pertains to CT and diesel engine units.
Start-up costs for all CTs and diesel units shall include only the following components:
Start Fuel Consumed * Total Fuel Related Cost (TRFC) * Performance Factor is the costof start fuel (basic fuel cost plus fuel handling and other fuel-related costs) from first fire to unitbreaker closing, Plus (+) cost of shutdown fuel from unit breaker opening to fuel valve closure(basic fuel cost plus fuel handling and other fuel-related costs).
Incremental labor costs are the costs in excess of normal station manning requirements (onlywhen necessary to start a CT unit).
Station Service * Station Service Rate from initiation of start sequence to breaker closing(total station use minus normal base station use) priced at the Station Service rate. Plus (+)station service after breaker opening during shutdown (station service during shutdown shouldbe that associated with the normal unit auxiliary equipment operated during shutdown in excessof base unit use, this station service is not to include maintenance use or non-normal uses)priced at the Station Service rate.
Note:Starting Maintenance Cost, please see section 6.6.3
Revision: 2930, Effective Date: 05/15/201707/31/2018 PJM © 20172018 57

PJM Manual 15: Cost Development GuidelinesSection 6: Combustion Turbine (CT) and Diesel Engine Costs
Reminder: CT Maintenance Adder is included directly in start, no-load and peak segmentcomponents.
6.5 No-Load Cost Calculation for CTsNote:The information in Section 2.5 contains basic No-Load Cost information relevant for all unittypes. The following additional information only pertains to CT and diesel engine units.
Note:CT Maintenance Adder is included directly in start, No-Load and peak segment components.
6.6 Maintenance CostNote:The information in Section 2.6 contains basic Maintenance Cost information relevant for all unittypes. The following additional information only pertains to CT and diesel engine units.
CT - Maintenance Adder – The total dollars from FERC Account 553 divided by EquivalentService Hours (ESH).
Industrial CT – This is a CT developed specifically for power generation.
Aircraft - Type CT – These are CTs originally designed for aircraft and modified for powergeneration.
Diesel - Maintenance Adder – The total dollars from FERC Account 553 divided by total fuelburned (in MMBtu’s).
Combustion Turbine Start – For calculating CT maintenance cost, only the number ofsuccessful starts to synchronization shall be used. Successful starts should include those at thedirection of PJM and for company tests.
Long Term Maintenance Expenses – CT Plant major inspection and overhaul expenses,after being previously evaluated and approved , may be included until June 1, 2015 in variablemaintenance expenses. Previously approved Long Term Maintenance Expenses will beremoved from maintenance history as of June 1, 2015.
6.6.1 Combustion Turbine Maintenance Adder Example
(Industrial Unit)
Peak Hours = 200 Hrs
Service Hours = 2000 Hrs
Revision: 2930, Effective Date: 05/15/201707/31/2018 PJM © 20172018 58

PJM Manual 15: Cost Development GuidelinesSection 6: Combustion Turbine (CT) and Diesel Engine Costs
No. of Starts = 300
Peak Pickup = 5 MW
Peak Hours are the hours run above base load temperature rating.Total Maintenance Dollars =$100,000(Actual historical maintenance data escalated to present value).Cyclic starting factor = 10, Cyclic peaking factor = 3 (Note: Cyclic starting factor = 5 for aircraftengine CT's).
Calculation of maintenance rates
Exhibit 14: Combustion Turbine Maintenance Cost Adder Example
6.6.2 Combustion Turbine Long Term Service Contract Cost RecoveryA Market Seller that has a currently effective LTSA with a third party vendor to provide overhauland maintenance work on a CT may file a request to PJM and the MMU for inclusion ofany variable long term maintenance costs in cost based offer bids, pursuant to the CostMethodology and Approval Process if the following conditions are met:
• The included variable long-term maintenance costs are consistent with the definition ofsuch costs in the Cost Development Guidelines
• And the dollar value of each component of the variable long-term maintenance costs isset specifically in the LTSA.
•
6.6.3 Equivalent service hoursThe estimated hours the unit will run based on history.
Revision: 2930, Effective Date: 05/15/201707/31/2018 PJM © 20172018 59

PJM Manual 15: Cost Development GuidelinesSection 6: Combustion Turbine (CT) and Diesel Engine Costs
CTs shall use OEM supplied values for cyclic starting factors and cyclic peaking factors evenif the CT technology is no longer being built. In situations where cyclic starting factors or cyclicpeaking factors are unknown or unavailable, CTs shall use:cyclic starting factor = 5.0 for aircraft - type CTs and cyclic starting factor= 10.0 for industrial -type CTsAndcyclic peaking factor = 3.0 for all CTsWhere:A cyclic starting factor = 10.0 for an industrial - type CTsfor example, the incremental maintenance charged to one start on an industrial - type CT isequivalent to the incremental maintenance attributable to ten hours of base load operation.And a cyclic peaking factor = 3.0means that the additional incremental maintenance charged to the incremental energy betweenbase and peak loads is equivalent to the incremental maintenance attributable to three hours ofbase load operation.
6.6.4 Diesel Incremental Maintenance Adder CalculationThe incremental Maintenance Adder for diesel units will be calculated and applied on a "perMMBtu (or other unit of fuel)" basis. The calculation will be based on actual operation andescalated maintenance expenses for all available history in the Maintenance Period.
6.7 Synchronized Reserve: Costs to CondenseNote:The information in Section 2.7 contains basic Synchronized Reserve Cost information relevantfor all unit types. The following additional information only pertains to CT and diesel engineunits.
Total synchronous condensing costs for CTs and diesel units shall include the followingcomponents:
• Start-up Costs if applicable, shall be applied when a unit moves from cold tocondensing operations and when a unit moves from condensing operations to energygeneration, but shall not be applied when a unit moves from energy generation tocondensing operations.
• Variable Operating and Maintenance cost (EHMC) in $/Hr divided by theSynchronized MW provided.
Revision: 2930, Effective Date: 05/15/201707/31/2018 PJM © 20172018 60
PJM Manual 15: Cost Development GuidelinesSection 6: Combustion Turbine (CT) and Diesel Engine Costs
• Actual cost of power consumed during condensing operations at real time bus LMPas determined by Market Settlements. MW consumed must be included in the offer.
• Margin up to $7.50 per MW of Synchronized Reserve service provided.
The CT condensing offers must be expressed in dollars per hour per MW of SynchronizedReserve ($/MWh) and must specify the total MW of Synchronized Reserve offered.
6.8 Regulation CostNote:The information in Section 2.8 contains basic Regulation Cost information relevant for all unittypes. The following additional information only pertains to CT and diesel engine units.
Revision: 2930, Effective Date: 05/15/201707/31/2018 PJM © 20172018 61

PJM Manual 15: Cost Development GuidelinesSection 7: Hydro
Section 7: HydroThis section contains information for the development of Hydro or Pumped Storage Hydro costoffers.
Hydro Units – Generating unit in which the energy of flowing water drives the turbine generatorto produce electricity. This classification includes pumped and run-of-river hydro.
Pumped Storage Hydro Unit – Hydroelectric power generation that stores energy in the formof water by pumping from a lower elevation source to a higher elevation reservoir, then allowingthe upper reservoir to drain turning the turbines to produce power.
7.1 Pumping Efficiency (Pumped Storage Hydro Only)Pumping Efficiency is the Pumped Storage Hydro Unit’s version of a heat rate. It measures theratio of generation produced to the amount of generation used as fuel.
Pumping Efficiency (PE) is calculated by dividing the MWh of generation produced whileoperating in generation mode by the MWh required to pump the water needed to produce thegeneration MWh.
For example, it requires 1,000 ft3 to produce one MWh of generation as water flows from thepond to the sink and it requires 1.4 MWh of pumping load to pump 1,000 ft3 of water from thesink to the pond. The resultant efficiency is:
In order to account for environmental and physical factors associated with the characteristicsof the pond and pumping operations that limit the accuracy of calculating short term pumpingefficiency, a seven day rolling total of pumping and generation MWh are utilized for pumpingefficiency calculations.
PE can be calculated by one of three methods. A Market Seller must make the choice of methodby December 31 prior to the year of operation and cannot change to another method for aperiod of one calendar year.
• Option 1: Twelve month calendar actual Pumping Efficiency.
o The previous 12-month calendar year average Pumping Efficiency based on actualpumping operations.
• Option 2: Three month rolling Pumping Efficiency.
o The previous three months rolling actual efficiency where the average monthlyavailability is 50% or greater. The calculation must be updated after each month.
• Option 3: The previous month actual Pumping Efficiency.
o The previous month actual efficiency where the availability is 50% or greater. Thecalculation must be updated monthly.
Revision: 2930, Effective Date: 05/15/201707/31/2018 PJM © 20172018 62

PJM Manual 15: Cost Development GuidelinesSection 7: Hydro
7.2 Performance FactorsNote:The information in Section 2.2 contains basic Performance Factor information relevant for allunit types. The following additional information only pertains to hydro units.
7.3 Fuel CostThe fuel costs for a run-of-river hydro Unit are equal to zero.
For a Pumped Storage Hydro Unit to be consistent with other PJM units within this manual theterm fuel cost is used to account for the energy necessary to pump from the lower reservoir tothe upper reservoir.
Note:The information in Section 2.3 contains basic Fuel Cost information relevant for all unit types.The following additional information only pertains to Pumped Storage Hydro Units.
If a Market Seller wishes to change its method of calculation of pumped storage TFRC, theMarket Seller shall notify PJM and the MMU in writing by December 31 prior to the year ofoperation, to be evaluated pursuant to the Cost Methodology and Approval Process before thebeginning of the cycle in which the new method is to become effective. The new cycle starts onFebruary 1st and continues for a period of one year
Basic Pumped Storage Fuel Cost – Pumped storage fuel cost shall be calculated on aseven (7) day rolling basis by multiplying the real time bus LMP at the plant node by the actualpower consumed when pumping divided by the pumping efficiency. The pumping efficiency isdetermined annually based on actual pumping operations or by OEM curves if annual data isnot available due to the immaturity of the unit. The following equations govern pumping storagefuel cost:
7.3.1 Total Energy Input Related Costs for Pumped Storage Hydro Plant GenerationTotal energy input-related costs for all pumped storage hydro units shall be defined as follows:
7.4 Start-up CostSee section 7.7 Condensing Start Costs.
Revision: 2930, Effective Date: 05/15/201707/31/2018 PJM © 20172018 63

PJM Manual 15: Cost Development GuidelinesSection 7: Hydro
7.5 No-Load CostHydro Units do not have No-Load Costs.
7.6 MaintenanceNote:The information in Section 2.6 contains basic Maintenance Cost information relevant for all unittypes. The following additional information only pertains to hydro units.
This account shall include the cost of labor, materials used and expenses incurred in themaintenance of plant, includible in Account 332 minus labor, Reservoirs, Dams, and Waterways.(See operating expense instruction 2.) However, the cost of labor materials used and expensesincurred in the maintenance of fish and wildlife, and recreation facilities, the book cost of whichis includible in Account 332, Reservoirs, Dams, and Waterways, shall be charged to Account545 minus labor, Maintenance of Miscellaneous Hydraulic Plant. Further, Pumped StorageHydro Units scheduled by the Office of the Interconnection pursuant to the hydro optimizationtool in the Day-ahead Energy Market may not include maintenance costs in their offers becausesuch offers may not exceed an energy offer price of $0.00/MWh.
7.7 Synchronized Reserve: Hydro Unit Costs to CondenseNote:The information in Section 2.7 contains basic Synchronized Reserve Cost information relevantfor all unit types. The following additional information only pertains to hydro units if applicable.
Some Hydro Units have the ability to purge the turbines of water and run backwards effectivelycreating a capacitor. This method of operation of the machine is referred to as operating theHydro unit in synchronous condensing mode.
Total synchronous condensing costs for Hydro units shall include the following components:
Condensing Start costs if applicable, start costs shall be applied when a unit moves fromcold to condensing operations and when a unit moves from condensing operations to energygeneration, but shall not be applied when a unit moves from energy generation to condensingoperations.
In addition (+) identified variable Operating and Maintenance cost in $/Hr. divided by theSynchronized MW provided. These costs shall be totaled over the Maintenance Period anddivided by total MWh generated over the maintenance period. These variable Operating andMaintenance costs shall include:
• Maintenance of Electric Plant as derived from FERC Account 544
• Maintenance of Reservoirs as derived from FERC Account 543
Revision: 2930, Effective Date: 05/15/201707/31/2018 PJM © 20172018 64

PJM Manual 15: Cost Development GuidelinesSection 7: Hydro
In addition (+) margin up to $7.50 per MW of Synchronized Reserve service provided.
Total hydro condensing offers must be expressed in dollars per hour per MW of SynchronizedReserve ($/MWh) and must specify the total MW of Synchronized Reserve offered.
7.8 Regulation CostNote:The information in Section 2.8 contains basic Regulation Cost information relevant for all unittypes.
Revision: 2930, Effective Date: 05/15/201707/31/2018 PJM © 20172018 65

PJM Manual 15: Cost Development GuidelinesSection 8 : Demand Resource (DR)
Section 8 : Demand Resource (DR)Demand Resource – DR means a resource that has the capability to provide a reduction inload.
8.1 Demand Resource (DR) Cost to Provide Synchronous ReservesThe cost to provide synchronous reserves from DR resources shall be equal to the margin up to$7.50 per MWh of reserves provided.
Demand Resource shutdown costs shall be zero. Any exceptions to this rule are covered underthe Cost Methodology and Approval Process.
Revision: 2930, Effective Date: 05/15/201707/31/2018 PJM © 20172018 66

PJM Manual 15: Cost Development GuidelinesSection 9: Wind Units
Section 9: Wind UnitsThis section contains information for the development of Wind unit cost offers.
Wind Units – Generating unit in which the energy of blowing wind drives the turbine generatorto produce electricity.
9.1 Heat RatesWind units do not burn fuel so heat rates are not applicable.
9.2 Performance FactorsNote:The information in Section 2.2 contains basic Performance Factor information relevant for allunit types. The following additional information only pertains to Wind units.
Wind units do not burn fuel so Performance Factors are equal to 1.0.
9.3 Fuel CostNote:The information in Section 2.3 contains basic Fuel Cost information relevant for all unit types.The following additional information only pertains to wind units.
"Fuel Cost Policy" will be provided to PJM and the MMU annually pursuant to Section 2.3.1. TheFuel Cost Policy should include how the generator intends to account for Renewable EnergyCredits (RECs) and Production Tax Credits (PTCs).
9.4 Start-up CostNote:The information in Section 2.3 contains basic Start-up Cost information relevant for all unittypes. The following additional information only pertains to wind units.
Start-up cost for a wind unit is station service cost.
9.5 No-Load CostWind Units do not have No-load costs.
9.6 MaintenanceNote:The information in Section 2.6 contains basic Maintenance Cost information relevant for all unittypes. The following additional information only pertains to wind units.
Revision: 2930, Effective Date: 05/15/201707/31/2018 PJM © 20172018 67

PJM Manual 15: Cost Development GuidelinesSection 9: Wind Units
Maintenance Cost includes short run Wear and Tear on the Unit (including preventative andscheduled; not including capital). Rolling twelve-month historic maintenance cost divided byMWh for the same period.
9.7 Synchronized Reserve: Wind Unit Costs to CondenseNote:The information in Section 2.7 contains basic Synchronized Reserve Cost information relevantfor all unit types. The following additional information only pertains to wind units if applicable.
9.8 Regulation CostThe information in section 2.8 contains basic Regulation Cost information relevant for all unittypes.
Revision: 2930, Effective Date: 05/15/201707/31/2018 PJM © 20172018 68

PJM Manual 15: Cost Development GuidelinesSection 10: Solar Units
Section 10: Solar UnitsThis section contains information for the development of solar unit cost offers.
Solar Units – Solar units use photovoltaic cell collectors made from semiconductors to convertsolar radiation directly to electricity.
10.1 Heat RatesSolar units do not burn fuel so heat rates are not applicable.
10.2 Performance FactorsNote:The information in Section 2.2 contains basic Performance Factor information relevant for allunit types. The following additional information only pertains to solar units.
Solar units do not burn fuel so Performance Factors are equal to 1.0.
10.3 Fuel CostNote:The information in Section 2.3 contains basic Fuel Cost information relevant for all unit types.The following additional information only pertains to solar units.
Solar unit’s fuel costs are equal to zero.
10.4 Start-up CostNote:The information in Section 2.3 contains basic Start-up Cost information relevant for all unittypes. The following additional information only pertains to solar units.
Solar unit’s Start Fuel and Total Fuel Related Costs are equal to zero.
10.5 No-Load CostSolar units do not have No-Load Costs.
10.6 MaintenanceNote:The information in Section 2.6 contains basic Maintenance Cost information relevant for all unittypes. The following additional information only pertains to solar units.
Revision: 2930, Effective Date: 05/15/201707/31/2018 PJM © 20172018 69

PJM Manual 15: Cost Development GuidelinesSection 10: Solar Units
10.7 Synchronized Reserve CostNote:The information in Section 2.7 contains basic Synchronized Reserve Cost information relevantfor all unit types.
10.8 Regulation CostNote:The information in Section 2.8 contains basic Regulation Cost information relevant for all unittypes.
Revision: 2930, Effective Date: 05/15/201707/31/2018 PJM © 20172018 70

PJM Manual 15: Cost Development GuidelinesSection 11: Energy Storage Resource
Section 11: Energy Storage ResourceThis section contains information for the development of Energy Storage Resource cost offers. .
11.1 Heat RatesEnergy Storage Resources do not burn fuel so heat rates are not applicable.
11.2 Performance FactorsNote:The information in Section 2.2 contains basic Performance Factor information relevant for allunit types. The following additional information only pertains to Energy Storage Resources.
Energy Storage Resources do not burn fuel so Performance Factors are equal to 1.0.
11.3 Fuel CostNote:The information in Section 2.3 contains basic Fuel Cost information relevant for all unit types.The following additional information only pertains to Energy Storage Resources:
Energy Storage Resource’s fuel costs are equal to zero.
11.4 Start-up CostEnergy Storage Resource’s Start Fuel and Total Fuel Related Costs are equal to zero.
11.5 No-Load CostEnergy Storage Resources do not have No-load costs.
11.6 MaintenanceNote:The information in Section 2.6 contains basic Maintenance Cost information relevant for all unittypes. The following additional information only pertains to Energy Storage Resources.
11.7 Synchronized Reserve CostNote:The information in Section 2.7 contains basic Synchronized Reserve Cost informationrelevant for all unit types. The following additional information only pertains to Energy StorageResources if applicable.
Revision: 2930, Effective Date: 05/15/201707/31/2018 PJM © 20172018 71

PJM Manual 15: Cost Development GuidelinesSection 11: Energy Storage Resource
11.8 Regulation CostNote:The information in Section 2.8 contains basic Regulation Cost information relevant for all unittypes. The following additional information only pertains to Energy Storage Resources.
Energy Storage Resources shall calculate Energy Storage Unit Losses in accordance withthe equation below. The “Cost Increase due to Heat Rate Increase during non-steady stateoperation” and the “Fuel Cost Increase and Unit Specific Heat Rate Degradation due toOperating at lower loads” shall be equal to zero.
If a Market Seller wishes to change its method of calculating these losses, the Market Sellershall submit a request to change its Fuel Cost Policy to PJM and the MMU pursuant to Section2.3.1. The approved method of calculation may be implemented upon approval and may beupdated no more frequently than once every 12 months. If any action by a government orregulatory agency that results in a need for the Market Seller to change its method of costcalculation, the affected Market Seller may submit a request, or notification as appropriate, toPJM and the MMU for evaluation, pursuant to Section 2.3.1.
Energy Storage Unit Losses ($/MW) – shall be the calculated average of seven (7) days ofrolling hourly periods where the real time bus LMP ($/MWh) at the plant node is multiplied by thenet energy consumed (MWh) when regulating divided by the regulation offer (MW). The seven(7) days of rolling hourly periods shall consist of the unit’s last 168 hour periods with acceptedregulation offers. The following equation governs energy storage unit’s fuel cost increase:
Revision: 2930, Effective Date: 05/15/201707/31/2018 PJM © 20172018 72

PJM Manual 15: Cost Development GuidelinesSection 12: Energy Market Opportunity Cost and Non-Regulatory Opportunity
Cost Guidelines
Section 12: Energy Market Opportunity Cost and Non-RegulatoryOpportunity Cost Guidelines
12.1 Opportunity Cost PolicyOpportunity Cost may be a component of cost under certain circumstances.
• Specific business rules for Opportunity Costs have been defined in the OperatingAgreement for various products including energy and regulation.
• Requests for recovery of Opportunity Costs not defined in the Operating Agreementshould be submitted to PJM and the MMU pursuant to the Cost Methodology andApproval Process.
12.2 Basis for Opportunity Cost to be included in Cost OffersThere are three reasons for the application of Opportunity Costs as contained in this section.
12.2.1 Energy Market Opportunity CostsEnergy Market Opportunity Costs associated with an externally imposed environmental run-hour restriction on a generation unit. Examples would include a limit on emissions for the unitimposed by a regulatory agency or legislation, a direct run hour restriction in the operatingpermit, or a heat input limitation defined by a regulatory decision or operating permit.
12.2.2 Non-Regulatory Opportunity Cost: Physical Equipment Limitations:Physical Equipment Limitations must have supporting evidence submitted by the MarketSeller. Documentation such as an OEM recommendation or bulletin and/or insurance carrierrestrictions would meet this criterion. Only limitations that cause the unit to experience arestriction in the number of starts or run hours would be eligible for Non-Regulatory OpportunityCost.
12.2.3 Non-Regulatory Opportunity Cost: Fuel LimitationsFuel Limitations are eligible for Non-Regulatory Opportunity Costs for a fuel supply limitation, forup to one year, resulting from an event of force majeure.Force Majeure is defined as: Any cause beyond the control of the affected Interconnection Partyor Construction Party, including but not restricted to, acts of God, flood, drought, earthquake,storm, fire, lightning, epidemic, war, riot, civil disturbance or disobedience, labor dispute, labor ormaterial shortage, sabotage, acts of public enemy, explosions, orders, regulations or restrictionsimposed by governmental, military, or lawfully established civilian authorities, which, in any ofthe foregoing cases, by ,.exercise of due diligence such party could not reasonably have beenexpected to avoid, and which, by the exercise of due diligence, it has been unable to overcome.Force Majeure does not include (i) a failure of performance that is due to an affected party’sown negligence or intentional wrongdoing; (ii) any removable or remediable causes (other thansettlement of a strike or labor dispute) which an affected party fails to remove or remedy within areasonable time; or (iii) economic hardship of an affected party.
Revision: 2930, Effective Date: 05/15/201707/31/2018 PJM © 20172018 73

PJM Manual 15: Cost Development GuidelinesSection 12: Energy Market Opportunity Cost and Non-Regulatory Opportunity
Cost Guidelines
12.3 Calculation Method Options: Two Methodologies for calculatingOpportunity CostMarket Sellers may opt to follow one of the two following methodologies; the difference betweenthe methodologies being the applicable time period. Market Sellers may develop alternativemethods specific to their units and submit those methods for approval. Requests for recoveryof opportunity costs using other methods not defined in the Operating Agreement should besubmitted to PJM and the MMU for evaluation under the Cost Methodology and ApprovalProcess and shall receive PJM’s approval prior to using the alternative method
Energy Market Opportunity Costs and Non-Regulatory Opportunity Costs are a distinctcomponent of the cost-based offer. As is the case with any computation of the cost-based offerin Manual 15, Market Sellers may elect to enter their cost-based offer at a value less than thecomputed cost-based offer. However, they may not exceed the computed value.
12.3.1 Long Term Method (greater than 30 days)This method uses monthly forward prices as the basis for forecasts of fuel and electricity costsin the future. Opportunity costs calculated with this method will change frequently. Given thatelectricity and fuel futures can change daily, the opportunity costs computed can likewisechange daily. Market Sellers who include opportunity costs in their cost-based offers mustrecalculate their long-term opportunity cost no less frequently than once per every 7 days.
12.3.2 Short Term Method (30 days or less)This method uses daily forward prices as the basis for forecasts of fuel and electricity costsin the future. Market Sellers who include opportunity costs in their cost-based offers mustrecalculate their short term opportunity cost every day.
12.4 DefinitionsVALUE DEFINITION
N number of hours in the month (on-peak/off-peak)
Y Year
m month
d day of the month
h hour
t Number of hours remaining in the compliance period
Peak off-peak hours only or on-peak hours only
FY future year
BUSLMP LMP at the unit’s bus
Revision: 2930, Effective Date: 05/15/201707/31/2018 PJM © 20172018 74

PJM Manual 15: Cost Development GuidelinesSection 12: Energy Market Opportunity Cost and Non-Regulatory Opportunity
Cost Guidelines
VALUE DEFINITION
PJMWHLMP PJM Western Hub LMP
PJMWHFRP PJM Western Hub Forward Price
DAPJMWHFRP Day Ahead PJM Western Hub Forward Price
Trading Day In respect of a particular futures market aday on which that Market open for trading
Dm Delivery Month; Month the commodity contractis to deliver the commodity in the future.
Base year one of the three historical years used tocreate volatility in the fuel and power forecasts
Peak Peak hours are from 7:00 AM to 11:00 PM (the hour ending 0800 to the hourending 2300) prevailing local time. Peak days are Mondays through Fridays,excluding North American Electric Reliability Corporation (NERC) holidays.
Off-peak Off-peak hours are from midnight to 7:00 AM (the hour ending0100 to the hour ending 0700) and 11:00 PM to midnight (the hour
ending 2400) Mondays through Fridays; also, all day Saturdaysand Sundays (the hour ending 0100 to the hour ending 2400)and North American Electric Reliability Corporation holidays
Frequentlymitigated unit (FMU)
A unit that was offer-capped for more than a defined proportion of its real-time run hours in the most recent 12-month period. FMU thresholds are 60percent, 70 percent and 80 percent of run hours. Such units are permitted a
defined adder to their cost-based offers in place of the usual 10 percent adder.
Unit Cost Cost of Dispatch without Start-up Cost
Unit Dispatch Cost Cost of Dispatch with Start-up Cost Included
All inputs use prevailing width preserving decimal precision of historical record.
12.5 Long Term Methodology
12.5.1 Step 1: Derive Historical Monthly LMP Basis Differential between the generationbus and western hub
Inputs required for STEP 1: Platts-ICE Forward Curvefor “PJM west” from the recent trading day, Three yearsof historical hourly real-time LMPs at the generationbus, and Three years of historical hourly real-time PJMWestern Hub LMPs
Revision: 2930, Effective Date: 05/15/201707/31/2018 PJM © 20172018 75
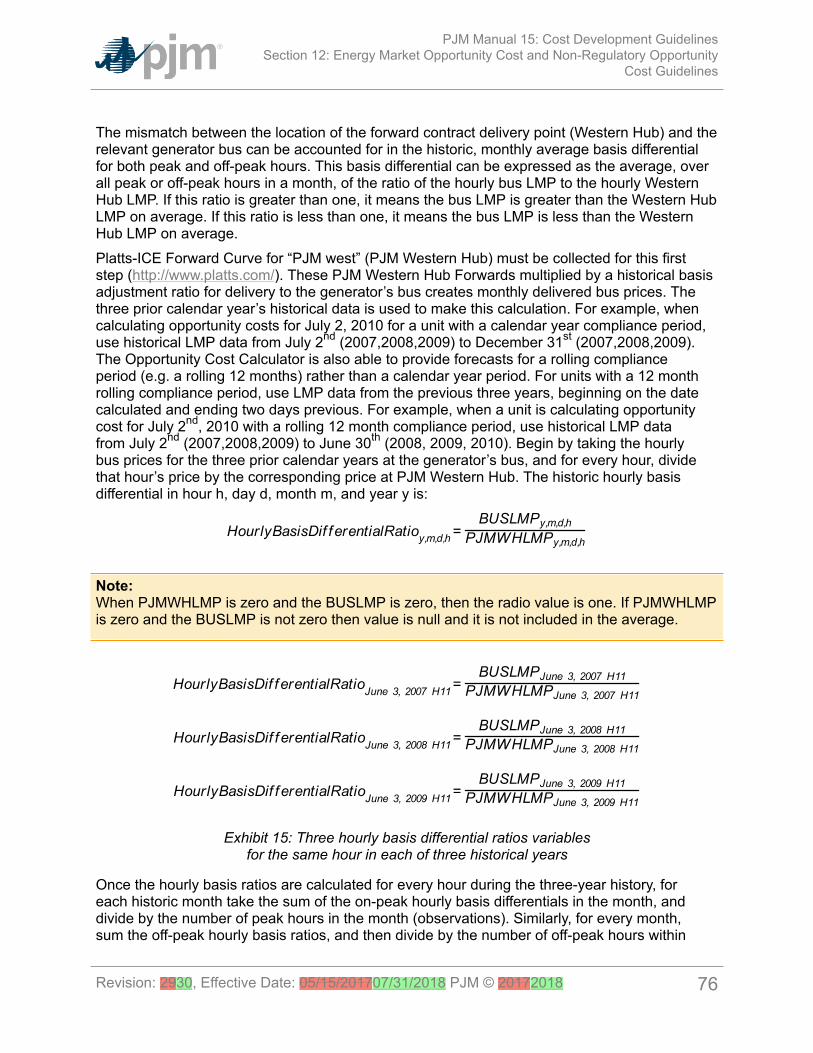
PJM Manual 15: Cost Development GuidelinesSection 12: Energy Market Opportunity Cost and Non-Regulatory Opportunity
Cost Guidelines
The mismatch between the location of the forward contract delivery point (Western Hub) and therelevant generator bus can be accounted for in the historic, monthly average basis differentialfor both peak and off-peak hours. This basis differential can be expressed as the average, overall peak or off-peak hours in a month, of the ratio of the hourly bus LMP to the hourly WesternHub LMP. If this ratio is greater than one, it means the bus LMP is greater than the Western HubLMP on average. If this ratio is less than one, it means the bus LMP is less than the WesternHub LMP on average.Platts-ICE Forward Curve for “PJM west” (PJM Western Hub) must be collected for this firststep (http://www.platts.com/). These PJM Western Hub Forwards multiplied by a historical basisadjustment ratio for delivery to the generator’s bus creates monthly delivered bus prices. Thethree prior calendar year’s historical data is used to make this calculation. For example, whencalculating opportunity costs for July 2, 2010 for a unit with a calendar year compliance period,use historical LMP data from July 2nd (2007,2008,2009) to December 31st (2007,2008,2009).The Opportunity Cost Calculator is also able to provide forecasts for a rolling complianceperiod (e.g. a rolling 12 months) rather than a calendar year period. For units with a 12 monthrolling compliance period, use LMP data from the previous three years, beginning on the datecalculated and ending two days previous. For example, when a unit is calculating opportunitycost for July 2nd, 2010 with a rolling 12 month compliance period, use historical LMP datafrom July 2nd (2007,2008,2009) to June 30th (2008, 2009, 2010). Begin by taking the hourlybus prices for the three prior calendar years at the generator’s bus, and for every hour, dividethat hour’s price by the corresponding price at PJM Western Hub. The historic hourly basisdifferential in hour h, day d, month m, and year y is:
Note:When PJMWHLMP is zero and the BUSLMP is zero, then the radio value is one. If PJMWHLMPis zero and the BUSLMP is not zero then value is null and it is not included in the average.
Exhibit 15: Three hourly basis differential ratios variablesfor the same hour in each of three historical years
Once the hourly basis ratios are calculated for every hour during the three-year history, foreach historic month take the sum of the on-peak hourly basis differentials in the month, anddivide by the number of peak hours in the month (observations). Similarly, for every month,sum the off-peak hourly basis ratios, and then divide by the number of off-peak hours within
Revision: 2930, Effective Date: 05/15/201707/31/2018 PJM © 20172018 76
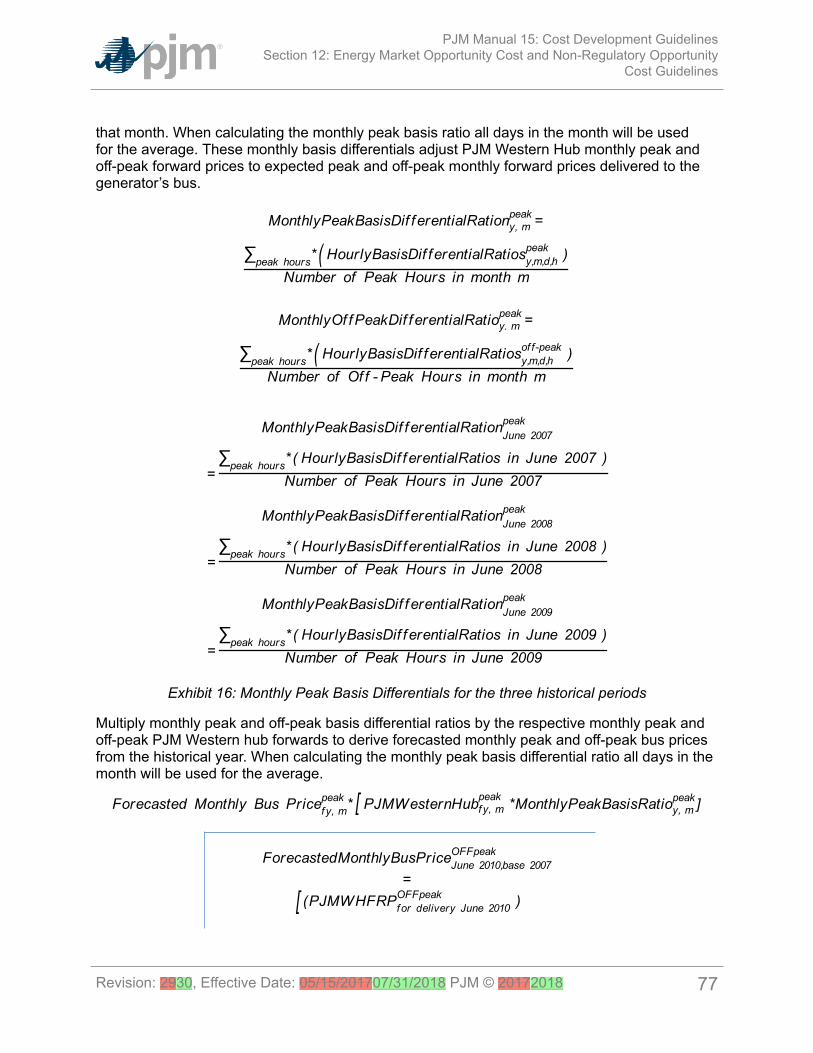
PJM Manual 15: Cost Development GuidelinesSection 12: Energy Market Opportunity Cost and Non-Regulatory Opportunity
Cost Guidelines
that month. When calculating the monthly peak basis ratio all days in the month will be usedfor the average. These monthly basis differentials adjust PJM Western Hub monthly peak andoff-peak forward prices to expected peak and off-peak monthly forward prices delivered to thegenerator’s bus.
Exhibit 16: Monthly Peak Basis Differentials for the three historical periods
Multiply monthly peak and off-peak basis differential ratios by the respective monthly peak andoff-peak PJM Western hub forwards to derive forecasted monthly peak and off-peak bus pricesfrom the historical year. When calculating the monthly peak basis differential ratio all days in themonth will be used for the average.
Revision: 2930, Effective Date: 05/15/201707/31/2018 PJM © 20172018 77

PJM Manual 15: Cost Development GuidelinesSection 12: Energy Market Opportunity Cost and Non-Regulatory Opportunity
Cost Guidelines
Exhibit 17: Forecasted monthly bus prices for three historical periods
Outputs required for STEP 1: Three peak and off-peakmonthly BUS LMP forecasts for each month remaining inthe compliance period.
12.5.2 Step 2: Derive hourly volatility scalars to incorporate hourly volatility into the LMPforecast
Inputs required for STEP 2: Three years of historicalhourly real-time LMPs at the generation bus
The monthly futures prices quoted only consider the average peak and off-peak prices for themonth and do not consider hourly LMP volatility. Step 2 derives will develop an hourly volatilityscalar. This scalar will later be multiplied against the forecast in Step 1 to derive an hourlybus LMP forecast that incorporates historic hourly peak and off-peak LMP volatility as well asmonthly peak and off-peak basis differentials from the historical year with PJM Western Hub.First, for each historic month compute the average peak and off-peak price at the unit’s bus foreach remaining month in the compliance period. When calculating the monthly average busLMP all days in the month will be used for the average.
Next, for every hour, take the hourly bus LMP divided by the relevant monthly average peak oroff-peak bus LMP computed above. If the hour is an on-peak hour, divide by the average peakLMP for the month.
Revision: 2930, Effective Date: 05/15/201707/31/2018 PJM © 20172018 78

PJM Manual 15: Cost Development GuidelinesSection 12: Energy Market Opportunity Cost and Non-Regulatory Opportunity
Cost Guidelines
If the hour is off-peak, divide that hour by the monthly off-peak average price for thecorresponding month.
Example 2.1: Volatility scalar for the each of the three historical years:
Outputs from STEP 2: Three ratio values per hour foreach of the historical years used for volatility.
12.5.3 Step 3: Create three sets of hourly forecasted bus values
Inputs to STEP 3: Output from STEP 1: On-peak/off-peak monthly bus LMP Forecast Output from STEP 2:Hourly volatility scalars
Step 3 creates three hourly forecasts from the volatility scalars developed in step 2 and themonthly bus LMP forecasts developed in Step 1. Multiply the hourly volatility scalars developedin step 2 by the corresponding peak or off-peak from the historical year forecasted monthly busprice calculated in Step 1.The expected or forecasted LMP for hour h, day d, month m, based on year y that is a peakhour is:
The expected or forecasted LMP for hour h, day d, month m, based on year y that is an off-peakhour is:
Assume that it is April 5, 2010. To create the set of three forecasted prices for each hour of June3, 2010:
Revision: 2930, Effective Date: 05/15/201707/31/2018 PJM © 20172018 79

PJM Manual 15: Cost Development GuidelinesSection 12: Energy Market Opportunity Cost and Non-Regulatory Opportunity
Cost Guidelines
Exhibit 18: Forecasted bus LMPs for one hour for each of the three historical base years
Outputs from STEP 3: Three hourly bus LMP forecastsfor each hour remaining in the compliance period
12.5.4 Step 4: Create a daily fuel volatility scalar
Inputs to STEP 4: Three years historical hourly dailyfuel prices at the generator bus ($/MMBtu) Fuel Weights ifdual fuel
Step 4 creates a daily fuel volatility scalar using historic daily delivered fuel prices (as used todevelop a unit’s TFRC) from the previous three calendar years. Take each daily bus-deliveredfuel price and divide it by the monthly average bus delivered fuel price to create a ratio for everyday in the three-year history. In calculating monthly average bus price, all days in the month willbe used for the average. For units that have dual fuels; the daily delivered fuel prices need tobe multiplied by their respective weights and then added together. Nm is the number of days inmonth m.Units with Single Fuel Type:
Units with Duel Fuel:
Revision: 2930, Effective Date: 05/15/201707/31/2018 PJM © 20172018 80
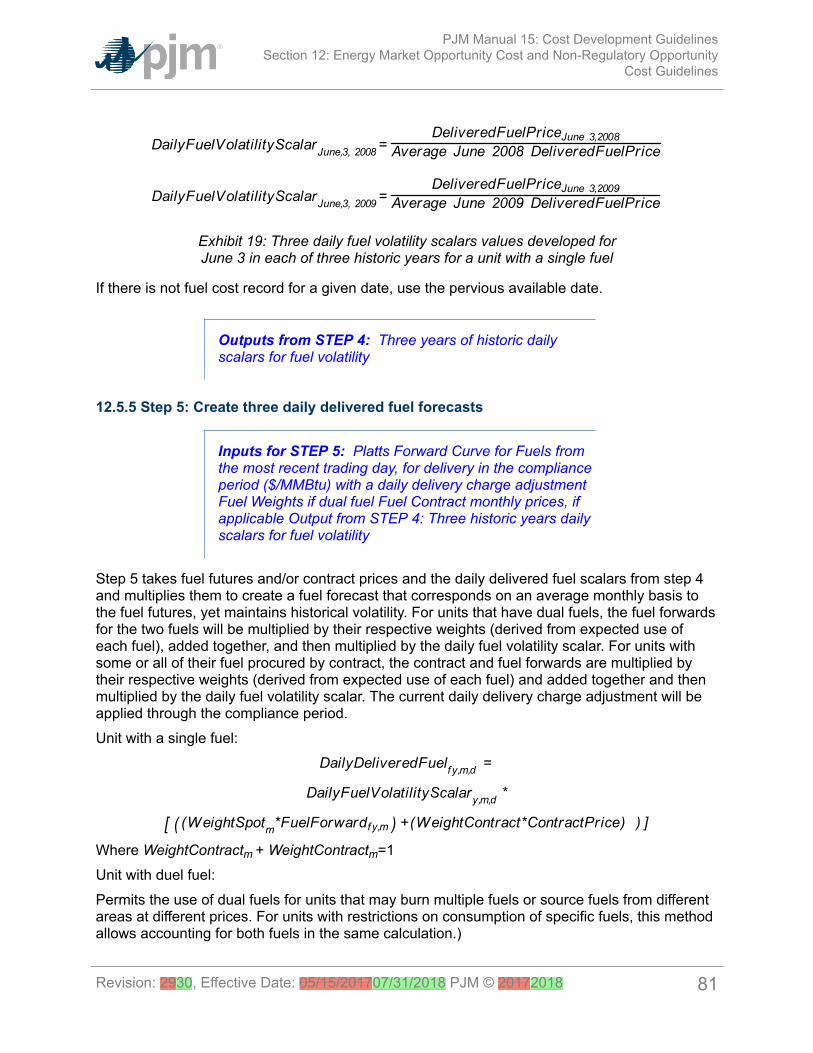
PJM Manual 15: Cost Development GuidelinesSection 12: Energy Market Opportunity Cost and Non-Regulatory Opportunity
Cost Guidelines
Exhibit 19: Three daily fuel volatility scalars values developed forJune 3 in each of three historic years for a unit with a single fuel
If there is not fuel cost record for a given date, use the pervious available date.
Outputs from STEP 4: Three years of historic dailyscalars for fuel volatility
12.5.5 Step 5: Create three daily delivered fuel forecasts
Inputs for STEP 5: Platts Forward Curve for Fuels fromthe most recent trading day, for delivery in the complianceperiod ($/MMBtu) with a daily delivery charge adjustmentFuel Weights if dual fuel Fuel Contract monthly prices, ifapplicable Output from STEP 4: Three historic years dailyscalars for fuel volatility
Step 5 takes fuel futures and/or contract prices and the daily delivered fuel scalars from step 4and multiplies them to create a fuel forecast that corresponds on an average monthly basis tothe fuel futures, yet maintains historical volatility. For units that have dual fuels, the fuel forwardsfor the two fuels will be multiplied by their respective weights (derived from expected use ofeach fuel), added together, and then multiplied by the daily fuel volatility scalar. For units withsome or all of their fuel procured by contract, the contract and fuel forwards are multiplied bytheir respective weights (derived from expected use of each fuel) and added together and thenmultiplied by the daily fuel volatility scalar. The current daily delivery charge adjustment will beapplied through the compliance period.Unit with a single fuel:
Where WeightContractm + WeightContractm=1Unit with duel fuel:Permits the use of dual fuels for units that may burn multiple fuels or source fuels from differentareas at different prices. For units with restrictions on consumption of specific fuels, this methodallows accounting for both fuels in the same calculation.)
Revision: 2930, Effective Date: 05/15/201707/31/2018 PJM © 20172018 81

PJM Manual 15: Cost Development GuidelinesSection 12: Energy Market Opportunity Cost and Non-Regulatory Opportunity
Cost Guidelines
Unit with a single fuel:
Exhibit 20: Create three daily delivered fuel forecasts from the volatilities of three historic years
Outputs from STEP 5: Daily generator-bus deliveredfuel forecast
12.5.6 Step 6: Create generating unit(s) cost for each of the three forecasts
Inputs for STEP 6: Expected future full load seasonal(May-September/October-April) heat rate for thecompliance period Fuel Prices output from STEP 5 UnitSO2, CO2 and NOx Emission Rates (lbs/MMBtu) –Futures prices for SO2, CO2 and NOx from EvolutionMarkets ($/ton) modified to $/lb Maintenance Adder, VOMand FMU, as defined in Manual 15
In step 6, take the unit characteristics, future emission allowance prices, the three daily fuelforecasts and create a daily unit cost for the three forecasts using the appropriate heat rate forthe forecast day. Unit costs do not include Start-up Costs will be added later in the calculation of
Revision: 2930, Effective Date: 05/15/201707/31/2018 PJM © 20172018 82

PJM Manual 15: Cost Development GuidelinesSection 12: Energy Market Opportunity Cost and Non-Regulatory Opportunity
Cost Guidelines
Unit Dispatch Cost. For each day in the three fuel forecasts, a unit dispatch cost is calculated asfollows:
Unit Heat Rate 10.35 MMBtu/MWHUnit NOx Emission Rate 0.328 lbs/MMBtuUnit SO2 Emission Rate 1.2 lbs/MMBtuUnit CO2 Emission Rate 117 lbs/MMBtuDailyDeliveredFuelForecast $5.56/MMBtuCombined NOx Allowance cost $1375/tonSO2 Allowance cost $200/tonCO2 emission cost $8.00/tonVOM & Maintenance Adder $2.22/MWhFMU $0.00/MWh
Exhibit 21: Daily Unit Cost
Outputs for STEP 6: Three forecasts based on historicyear factors for daily generator unit cost
Revision: 2930, Effective Date: 05/15/201707/31/2018 PJM © 20172018 83

PJM Manual 15: Cost Development GuidelinesSection 12: Energy Market Opportunity Cost and Non-Regulatory Opportunity
Cost Guidelines
12.5.7 Step 7: Calculate the margin for every hour in the three hourly forecasts
Inputs for STEP 7: Daily Generator Unit Cost fromSTEP 6 Hourly Generator bus LMP forecast from STEP3 All future maintenance outage information Unit-specificminimum runtime parameter restriction Unit-specific Start-up costs (cold Start-up Costs for CC and CT units and hotStart-up Costs for steam units) Unit economic maximum
Step 7 calculates the hourly margin the generator would receive by comparing the cost offerdeveloped in step 6 against the hourly forecasted bus LMPs developed in step 3. To removeplanned outages, for any future date that the unit will be offline, set the outage hours tounavailable for all three forecasts.For Units with minimum run time restrictions, this step calculates the total margins in blocksof adjacent hours, based on the sum of the margins of each block and the minimum runtimeparameter restriction of the unit. Blocks may include additional incremental hours, if thesehours are found to be more valuable than the additional block, up to double the unit’s minimumruntime. Adjacent hour blocks with equal or greater number of hours than double a unit’sminimum run time will be split into multiple blocks (however, adjacent blocks do not use anadditional Start-up Cost). For units with Start-up Costs, the value of the unit’s Start-up Costdivided by economic maximum will be subtracted from the total margin of each block thatcontains a new start, but not from each subsequent incremental hour added to the block, inorder to correctly value hours that do not incur Start-up Costs. Calculate the total margins for allblocks of hours in the three forecasts.
**MRT = Minimum Run Time*** Unit Dispatch Cost include Start-up cost when applicableWhere the block ranges from one to
and y(t),m(t), d(t), h(t) are the year, month, day and hour corresponding to the overall hour of thetime period spanning from the date calculated to the end of the compliance period forecasted.
The Total Number of Hours variable represents the number of hours left inthe compliance period to be forecasted, and is based on the date calculated and whether or notthe unit has a rolling 12 month run-hour restriction.This example uses block # 3788:
Revision: 2930, Effective Date: 05/15/201707/31/2018 PJM © 20172018 84

PJM Manual 15: Cost Development GuidelinesSection 12: Energy Market Opportunity Cost and Non-Regulatory Opportunity
Cost Guidelines
=
=
Similarly,
And,
Exhibit 22: Calculating total margins with a minimum runtime of one hour (i.e. nominimum runtime restriction), using historical data from the past three calendar years
At this point, the blocks of hours would be ranked according to the value of their totalmargins.
Outputs from STEP 7: Three sets of ranked blocksof total margin forecasts including each hour in thecompliance period, adjusted to include Start-up Costs foreach block that contains a new start, with all future outagehours removed.
12.5.8 Step 8: Determine the opportunity cost component
Inputs to STEP 8: Three sets of ranked blocks of totalmargin forecasts
For each of the three years, the opportunity cost component for that year will be the averagetotal margin of the lowest value block added before the run hour limit was reached. The threeopportunity costs will then be averaged to get the opportunity cost component available to thegenerator. If the final opportunity cost component is less than zero then the opportunity costcomponent will be set to zero.
Revision: 2930, Effective Date: 05/15/201707/31/2018 PJM © 20172018 85

PJM Manual 15: Cost Development GuidelinesSection 12: Energy Market Opportunity Cost and Non-Regulatory Opportunity
Cost Guidelines
The average value of the block which includes the
The average value of the block which includes the
The average value of the block which includes the
700th hour opportunity cost component =
Exhibit 23: A unit with 700 run hours
Outputs from STEP 8: Maximum Opportunity CostComponent that can be included in an environmentallyrun limited generator’s cost offer
12.6 Short Term MethodologyShort Term Opportunity Costs are of limited duration where the event lasts 30 days or less.The Short Term Method modifies the method in Section 12.5 to capture intra-month pricemovements in fuel and electricity markets on a daily basis. The proposal requires Market Sellersto recalculate opportunity costs every day during the short-term episode, using daily forwardprices for both fuel and electricity costs instead of monthly forwards.
12.6.1 Step 1: Derive Historical Monthly LMP Basis Differential between the generationbus and western hub
Inputs required for STEP 1: Platts-ICE Forward Curvefor “PJM west” from the recent trading day, Three yearsof historical hourly real-time LMPs at the generationbus, and Three years of historical hourly real-time PJMWestern Hub LMPs
As before with Opportunity Costs, PJM Western Hub (Western Hub) is a liquid trading pointfor forward LMP prices. The mismatch between the location of the forward contract deliverypoint Western Hub and the relevant generator bus can be accounted for in the historic monthlyaverage basis differential for peak and off-peak hours. The basis differential is an average forthe peak or off-peak hours intra-month of the hourly bus LMP to the hourly Western Hub LMP.The result is a ratio of the bus to the hub by time. If this ratio is greater than one, it means thebus LMP is greater than the Western Hub LMP. If this ratio is less than one, it means the bus
Revision: 2930, Effective Date: 05/15/201707/31/2018 PJM © 20172018 86

PJM Manual 15: Cost Development GuidelinesSection 12: Energy Market Opportunity Cost and Non-Regulatory Opportunity
Cost Guidelines
LMP is less than the Western Hub LMP on average. The resultant ratio can be applied to thePJM Western Hub to shape it into the specific generator bus.Platts-ICE Forward Curve for “PJM west” (PJM Western Hub) must be collected for this firststep (http://www.platts.com/). The PJM Western Hub daily forward prices are multiplied by thehistorical basis adjustment ratio or shaping factor at the generator’s bus to approximate theintra-month delivered bus prices.Begin by taking the hourly intra-month bus prices for the three prior calendar years at thegenerator’s bus, and for every hour, divide that hour’s price by the corresponding price at PJMWestern Hub. The historic hourly basis differential in hour h, day d, month m, and year y is:
Note:When PJMWHLMP is zero and the BUSLMP is zero, then the ratio value is one. If PJMWHLMPis zero and the BUSLMP is not zero then value is null and it is not included in the average.
Exhibit 24: Three Hourly Basis Differential Ratios Valuesfor the same hour in Each of Three Historical Years
Once the hourly basis ratios are calculated for every hour in the historic period take the sum ofthe on-peak hourly basis differentials, and divide by the number of peak hours. Similarly sum theoff-peak hourly basis ratios, for the month then divide by the number of off-peak hours. Whencalculating the intra-month peak basis differential ratio, all days in the month will be used for theaverage. The intra-month basis differentials adjust PJM Western Hub daily peak and off-peakDA prices to expected peak and off-peak daily forward prices delivered to the generator’s bus.
Revision: 2930, Effective Date: 05/15/201707/31/2018 PJM © 20172018 87
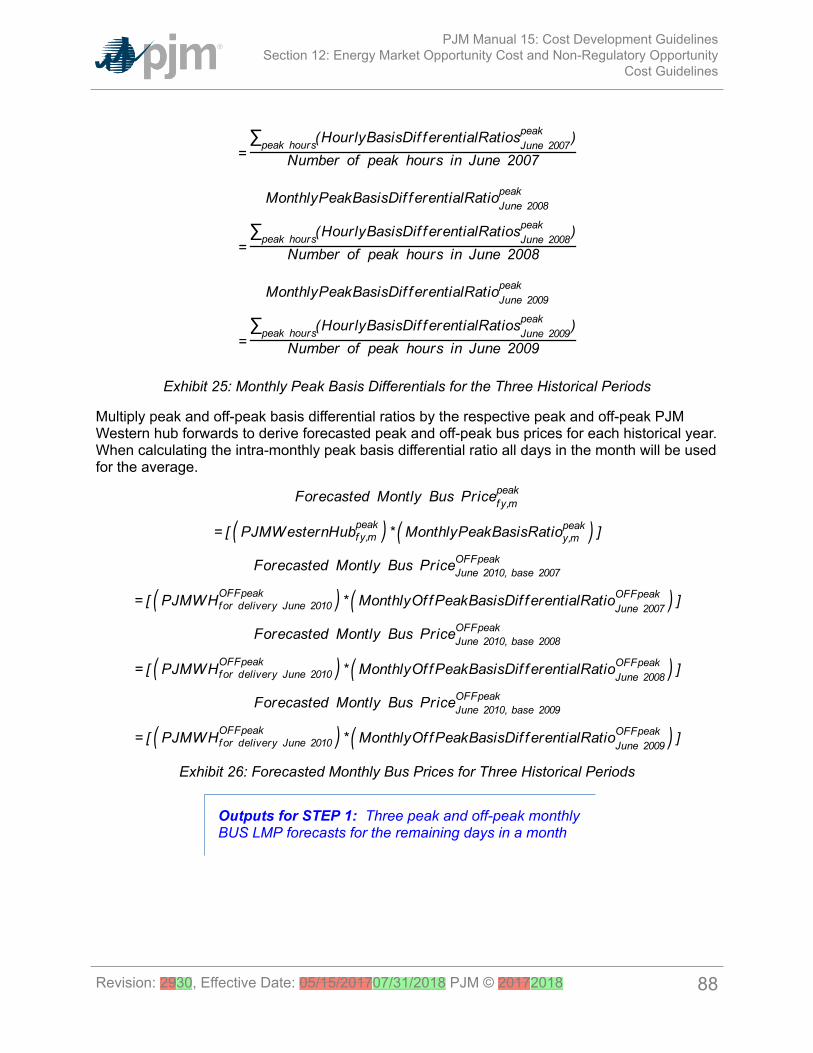
PJM Manual 15: Cost Development GuidelinesSection 12: Energy Market Opportunity Cost and Non-Regulatory Opportunity
Cost Guidelines
Exhibit 25: Monthly Peak Basis Differentials for the Three Historical Periods
Multiply peak and off-peak basis differential ratios by the respective peak and off-peak PJMWestern hub forwards to derive forecasted peak and off-peak bus prices for each historical year.When calculating the intra-monthly peak basis differential ratio all days in the month will be usedfor the average.
Exhibit 26: Forecasted Monthly Bus Prices for Three Historical Periods
Outputs for STEP 1: Three peak and off-peak monthlyBUS LMP forecasts for the remaining days in a month
Revision: 2930, Effective Date: 05/15/201707/31/2018 PJM © 20172018 88

PJM Manual 15: Cost Development GuidelinesSection 12: Energy Market Opportunity Cost and Non-Regulatory Opportunity
Cost Guidelines
12.6.2 Step 2: Derive hourly volatility scalars to incorporate hourly volatility into the LMPforecast
Inputs required for STEP 2: Three years historicalhourly real-time LMPs at the generation bus
Daily forward prices are the average peak and off-peak prices for the next day and do notinclude hourly LMP volatility. Step 2 derives an hourly volatility scalar. This scalar will later bemultiplied against the forecasted prices in Step 1 to develop an hourly bus LMP forecast thatincorporates historic hourly peak and off-peak LMP volatility.First, for each historic month compute the average peak and off-peak price at the unit’s bus forthe intra-month. When calculating the monthly average bus LMP all days in the month will beused for the average.
Next, for every hour, take the hourly bus LMP divided by the relevant monthly average peak oroff-peak bus LMP computed above. If the hour is an on-peak hour, divide by the average peakLMP for the month.
If the hour is off-peak, divide that hour by the monthly off-peak average price for thecorresponding month.
Example 10.1: Volatility scalar for the each of the three historical years:
Revision: 2930, Effective Date: 05/15/201707/31/2018 PJM © 20172018 89

PJM Manual 15: Cost Development GuidelinesSection 12: Energy Market Opportunity Cost and Non-Regulatory Opportunity
Cost Guidelines
Outputs from STEP 2: Three ratio values per hour foreach of the historical years used for volatility.
12.6.3 Step 3: Create three sets of hourly forecasted bus values
Inputs required for STEP 3: Output from Step 1: On-peak/off-peak monthly bus LMP Forecast Output fromStep 2: Hourly volatility scalars
Step 3 creates three hourly forecasts from the volatility scalars developed in step 2 and themonthly bus LMP forecasts developed in Step 1. Multiply the hourly volatility scalars developedin step 2 by the corresponding peak or off-peak from the historical year forecasted monthly busprice calculated in Step 1.The expected or forecasted LMP for hour h, day d, month m, based on year y that is a peakhour is:
The expected or forecasted LMP for hour h, day d, month m, based on year y that is an off-peakhour is:
Example 11.1: Forecasted bus LMPs for one hour for each of the three historical baseyears:To create the set of three forecasted prices for each hour of June 3, 2010:
Revision: 2930, Effective Date: 05/15/201707/31/2018 PJM © 20172018 90
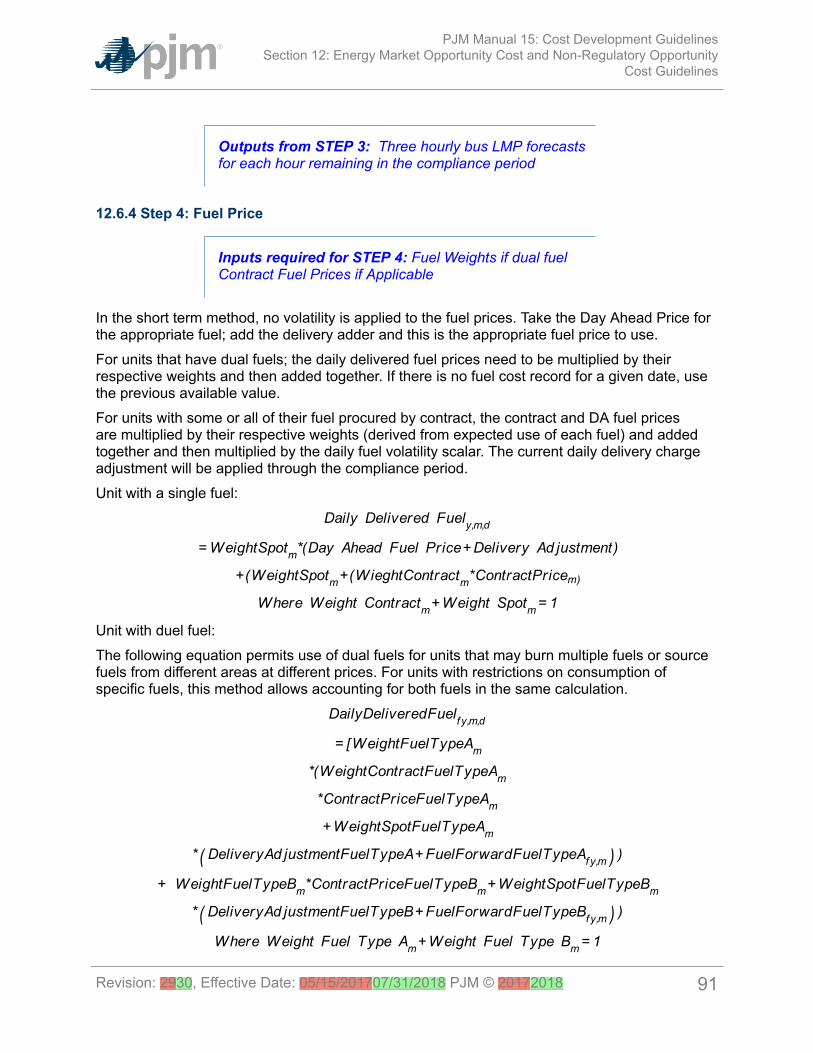
PJM Manual 15: Cost Development GuidelinesSection 12: Energy Market Opportunity Cost and Non-Regulatory Opportunity
Cost Guidelines
Outputs from STEP 3: Three hourly bus LMP forecastsfor each hour remaining in the compliance period
12.6.4 Step 4: Fuel Price
Inputs required for STEP 4: Fuel Weights if dual fuelContract Fuel Prices if Applicable
In the short term method, no volatility is applied to the fuel prices. Take the Day Ahead Price forthe appropriate fuel; add the delivery adder and this is the appropriate fuel price to use.For units that have dual fuels; the daily delivered fuel prices need to be multiplied by theirrespective weights and then added together. If there is no fuel cost record for a given date, usethe previous available value.For units with some or all of their fuel procured by contract, the contract and DA fuel pricesare multiplied by their respective weights (derived from expected use of each fuel) and addedtogether and then multiplied by the daily fuel volatility scalar. The current daily delivery chargeadjustment will be applied through the compliance period.Unit with a single fuel:
Unit with duel fuel:The following equation permits use of dual fuels for units that may burn multiple fuels or sourcefuels from different areas at different prices. For units with restrictions on consumption ofspecific fuels, this method allows accounting for both fuels in the same calculation.
Revision: 2930, Effective Date: 05/15/201707/31/2018 PJM © 20172018 91

PJM Manual 15: Cost Development GuidelinesSection 12: Energy Market Opportunity Cost and Non-Regulatory Opportunity
Cost Guidelines
Output from STEP 4: Daily generator-bus delivered fuelforecast
12.6.5 Step 5: Create generating unit’s cost for each of the three forecasts
Inputs required for STEP 5: Expected future full heatrate intra-month Fuel Prices output from Step 4 Unit SO2,CO2, and NOx Emission Rates (lbs/MBTU) (Note that theCO2 adder is in effect only for incurring carbon emissioncharges) Futures prices for SO2, CO2 and NOx fromEvolution Markets ($/ton) modified to $/lb MaintenanceAdder, VOM and FMU as defined in Manual 15
In Step 5, take the unit characteristics, future emission allowance prices, the three daily fuelforecasts and create a daily unit cost for the three forecasts using the appropriate heat rate forthe forecast day. Unit costs do not include Start-up Costs, Start-up Costs will be added later inthe calculation of Unit Dispatch Cost. For each day in the three fuel forecasts, a unit dispatchcost is calculated as follows:
Unit heat rate=10.345 MMBtu/MWhUnit NOX emission rate =0.328 lbs/MMBtuUnit SO2 emission rate=1.2 lbs/MMBtuUnit CO2 emission rate=117 lbs/MMBtuDailyDeliveredFuelForecast=$3.01/MMBtuCombined NOx Allowance cost=$1375/ton
Revision: 2930, Effective Date: 05/15/201707/31/2018 PJM © 20172018 92

PJM Manual 15: Cost Development GuidelinesSection 12: Energy Market Opportunity Cost and Non-Regulatory Opportunity
Cost Guidelines
SO2 Allowance cost=$200/tonCO2 emission cost = $8/tonVOM & Maintenance Adder=$2.22/MWhFMU= $0.00/MWh
Exhibit 27: Daily Unit Cost
Outputs from STEP 5: Three forecasts based on historicyear factors for daily generator unit cost
12.6.6 Step 6: Calculate the margin for every hour in the three hourly forecasts
Inputs required for STEP 6: Daily Generator Unit CostHourly Generator bus LMP forecast from Step 3 Unit-specific minimum run-time parameter restriction Unit-specific Start-up Costs (cold Start-up costs for CC andCT units and hot Start-up Costs for steam units) Uniteconomic maximum
Step 6 calculates the hourly margin the generator would receive by comparing the cost offerdeveloped in step 5 against the hourly forecasted bus LMPs developed in step 3.For units with minimum run time restrictions, this step calculates total margins in blocks ofadjacent hours, based on the sum of the margins of each block and the minimum run timeparameter restriction of the unit. Blocks may include additional incremental hours, if these hoursare found to be more valuable than an additional block, up to double a unit’s minimum run time.Adjacent hour blocks with equal or greater number of hours than double a unit’s minimum runtime will be split into multiple blocks (however adjacent blocks do not use an additional Start-upCost). For units with Start-up Costs, the value of the unit’s Start-up Cost divided by economicmaximum will be subtracted from the total margin of each block that contains a new start, butnot from each subsequent incremental hour added to the block, in order to correctly value hoursthat do not incur Start-up Costs. Calculate the total margins for all blocks of hours in the threeforecasts:
Revision: 2930, Effective Date: 05/15/201707/31/2018 PJM © 20172018 93
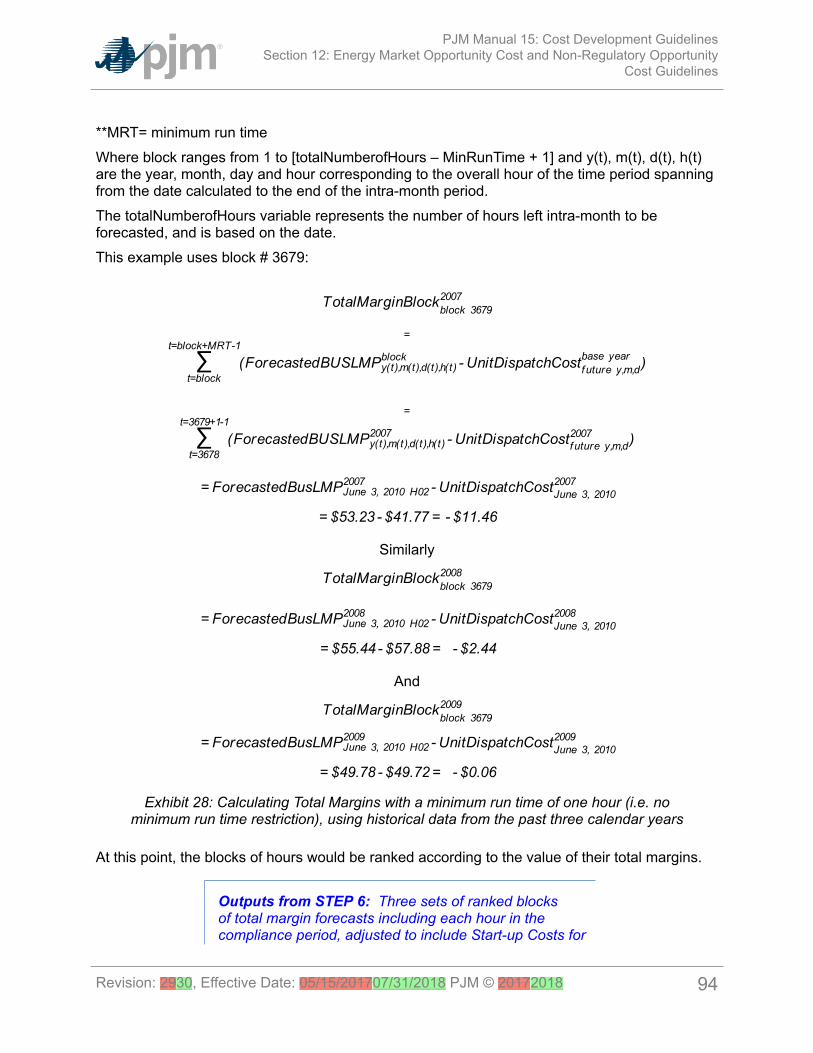
PJM Manual 15: Cost Development GuidelinesSection 12: Energy Market Opportunity Cost and Non-Regulatory Opportunity
Cost Guidelines
**MRT= minimum run timeWhere block ranges from 1 to [totalNumberofHours – MinRunTime + 1] and y(t), m(t), d(t), h(t)are the year, month, day and hour corresponding to the overall hour of the time period spanningfrom the date calculated to the end of the intra-month period.The totalNumberofHours variable represents the number of hours left intra-month to beforecasted, and is based on the date.This example uses block # 3679:
=
=
Similarly
And
Exhibit 28: Calculating Total Margins with a minimum run time of one hour (i.e. nominimum run time restriction), using historical data from the past three calendar years
At this point, the blocks of hours would be ranked according to the value of their total margins.
Outputs from STEP 6: Three sets of ranked blocksof total margin forecasts including each hour in thecompliance period, adjusted to include Start-up Costs for
Revision: 2930, Effective Date: 05/15/201707/31/2018 PJM © 20172018 94

PJM Manual 15: Cost Development GuidelinesSection 12: Energy Market Opportunity Cost and Non-Regulatory Opportunity
Cost Guidelines
each block that contains a new start, with all future outagehours removed
12.6.7 Step 7: Determine the opportunity cost adder
Inputs required for STEP 7: Three sets of ranked blocksof total margin forecasts
For each of the three years, the opportunity cost for that year will be the average total marginof the lowest value block added before the run hour limit was reached. The three opportunitycosts will then be averaged to get the opportunity cost adder available to the generator. If theopportunity cost adder is less than 0, the opportunity cost adder will be set to 0.
Exhibit 29: A Unit with 700 run hours left
Output from STEP 7: Maximum Opportunity CostComponent that can be added to an environmentally runlimited generator’s cost offer.
Revision: 2930, Effective Date: 05/15/201707/31/2018 PJM © 20172018 95

PJM Manual 15: Cost Development GuidelinesAttachment A: Applicable FERC System of Accounts
Attachment A: Applicable FERC System of AccountsThe information included in this Attachment A provides the descriptions and definitions ofseveral account numbers and Operating Expenses Instructions as they appear in the FERCSystem of Accounts and named in this document.
The FERC System of Accounts was created when a predominant amount of the nation’selectrical generating resources were “utility owned”. Although many of those resources arenow owned by non-vertically integrated entities, such as, Independent Power Producers (IPPs)and Generating Companies (GENCOs), the descriptions of the accounts are the importantconcepts.
Accounting Principal Regarding FERC System of Accounts
Whenever there is reference in this manual to a FERC Account, it is implicitly understood thatthe FERC System of Accounts may be replaced by any other accounting method mapped backto the current FERC System of Accounts (see Attachment B) if approved for use by the MMU.The accounts named in this document provide the information to allow the development of costbased bids for submission to PJM.
A.1 Balance Sheet Accounts
A.1.1 FERC FORM 1 ACCOUNT 151: Fuel Stock (Major only).This account shall include the book cost of fuel on hand.Items
• Invoice price of fuel less any cash or other discounts.• Freight, switching, demurrage and other transportation charges, not including, however,
any charges for unloading from the shipping medium.• Excise taxes, purchasing agents’ commissions, insurance and other expenses directly
assignable to cost of fuel.• Operating, maintenance and depreciation expenses and ad valorem taxes on utility-
owned transportation equipment used to transport fuel from the point of acquisition to theunloading point.
• Lease or rental costs of transportation equipment used to transport fuel from the point ofacquisition to the unloading point.
A.2 Expense Accounts
A.2.1 FERC FORM 1 ACCOUNT 501: Fuel• This account shall include the cost of fuel used in the production of steam for the
generation of electricity, including expenses in unloading fuel from the shipping mediaand handling thereof up to the point where the fuel enters the first boiler plant bunker,hopper, bucket, tank or holder of the boiler-house structure. Records shall be maintainedto show the quantity, MMBtu content and cost of each type of fuel used.
Revision: 2930, Effective Date: 05/15/201707/31/2018 PJM © 20172018 96
PJM Manual 15: Cost Development GuidelinesAttachment A: Applicable FERC System of Accounts
• The cost of fuel shall be charged initially to Account 151, Fuel Stock (for Non-majorutilities, appropriate fuel accounts carried under Account 154, Plant Materials andOperating Supplies), and cleared to this account on the basis of the fuel used. Fuelhandling expenses may be charged to this account as incurred or charged initially toAccount 152, Fuel Stock Expenses Undistributed (for Non-major utilities, an appropriatesub account of Account 154, Plant Materials and Operating Supplies). In the latter event,they shall be cleared to this account based on the fuel used. Respective amounts of fuelstock and fuel stock expenses shall be readily available.
ItemsLabor:
• Supervising purchasing and handling of fuel.• All routine fuel analysis.• Unloading from shipping facility and putting in storage.• Moving of fuel in storage and transferring fuel from one station to another.• Handling from storage or shipping facility to first bunker, hopper, bucket, tank or holder of
boiler-house structure.• Operation of mechanical equipment, such as locomotives, trucks, cars, boats, barges,
cranes, etc.
Materials and expenses:• Operating, maintenance and depreciation expenses and ad valorem taxes on utility-
owned transportation equipment used to transport fuel from the point of acquisition to theunloading point (Major only).
• Lease or rental costs of transportation equipment used to transport fuel from the point ofacquisition to the unloading point (Major only).
• Cost of fuel including freight, switching, demurrage and other transportation charges.• Excise taxes, insurance, purchasing commissions and similar items.• Stores expense to extent applicable to fuel.• Transportation and other expenses in moving fuel in storage.• Tools, lubricants and other supplies.• Operating supplies for mechanical equipment.• Residual disposal expenses less any proceeds from sale of residuals.
Note:Abnormal fuel handling expenses occasioned by emergency conditions shall be charge toexpense as incurred.
Revision: 2930, Effective Date: 05/15/201707/31/2018 PJM © 20172018 97

PJM Manual 15: Cost Development GuidelinesAttachment A: Applicable FERC System of Accounts
A.2.2. FERC FORM 1 ACCOUNT 509: AllowancesThis account shall include the cost of allowances expensed concurrent with the monthlyemission of sulfur dioxide.
A.2.3 FERC FORM 1 ACCOUNT 512: Maintenance of Boiler Plant (Major only)• This account shall include the cost of labor, materials used and expenses incurred in
the maintenance of steam plant, the book cost of which is includible in Account 312,Boiler Plant Equipment. (See operating expense instruction 2; which can be found in thismanual, Attachment A.3.1)
• For the purposes of making charges hereto and to Account 513, Maintenance of ElectricPlant, the point at which steam plant is distinguished from electric plant is defined asfollows:o Inlet flange of throttle valve on prime mover.o Flange of all steam extraction lines on prime mover.o Hotwell pump outlet on condensate lines.o Inlet flange of all turbine-room auxiliaries.o Connection to line side of motor starter for all boiler-plant equipment.
A.2.4 FERC FORM 1 ACCOUNT 513: Maintenance of Electric Plant (Major only)This account shall include the cost of labor, materials used and expenses incurred in themaintenance of electric plant, the book cost of which is includible in Account 313, Engines andEngine-Driven Generators, Account 314, Turbogenerator Units, and Account 315, AccessoryElectric Equipment. (See operating expense instruction 2, which can be found in this manual,Attachment A.3.1and paragraph B of Account 512.which can be found above in A.2.3)
A.2.5 FERC FORM 1 ACCOUNT 518: Nuclear Fuel Expense (Major only)• This account shall debit and Account 120.5, Accumulated Provision for Amortization of
Nuclear Fuel Assemblies, credited for the amortization of the net cost of nuclear fuelassemblies used in the production of energy. The net cost of nuclear fuel assembliessubject to amortization shall be the cost of the nuclear fuel assemblies plus or less theexpected net salvage of uranium, plutonium, and other byproducts and unburned fuel.The utility shall adopt the necessary procedures to assure that charges to this accountare distributed according to the thermal energy produced in such periods.
• This account shall also include the costs involved when fuel is leased.• This account shall also include the cost of other fuels, used for ancillary steam facilities,
including superheat.• This account shall be debited or credited as appropriate for significant changes in
the amounts estimated as the net salvage value of uranium, plutonium, and otherbyproducts contained in Account 157, Nuclear Materials Held for Sale and the amountrealized upon the final disposition of the materials. Significant declines in the estimatedrealizable value of items carried in Account 157 may be recognized at the time of marketprice declines by charging this account and crediting Account 157. When the declining
Revision: 2930, Effective Date: 05/15/201707/31/2018 PJM © 20172018 98

PJM Manual 15: Cost Development GuidelinesAttachment A: Applicable FERC System of Accounts
change occurs while the fuel is recorded in Account 120.3, Nuclear Fuel Assemblies inReactor, the effect shall be amortized over the remaining life of the fuel.
A.2.6 FERC FORM 1 ACCOUNT 530: Maintenance of Reactor Plant Equipment (Majoronly)This account shall include the cost of labor, materials used and expenses incurred in themaintenance of reactor plant, the book cost of which is includible in Account 322, Reactor PlantEquipment.
A.2.7 FERC FORM 1 ACCOUNT 531: Maintenance of Electric Plant (Major only)This account shall include the cost of labor, materials used and expenses incurred in themaintenance of electric plant, the book cost of which is includible in Account 323, Turbo-generator Units, and account 324, Accessory Electric Equipment.
A.2.8 FERC FORM 1 ACCOUNT 543: Maintenance of Reservoirs, Dams, and Waterways(Major only)This account shall include the cost of labor, materials used and expenses incurred in themaintenance of plant, includible in Account 332, Reservoirs, Dams, and Waterways. (Seeoperating expense instruction 2, which can be found in this manual, Attachment A.3.1.)However, the cost of labor materials used and expenses incurred in the maintenance of fish andwildlife, and recreation facilities, the book cost of which is includible in Account 332, Reservoirs,Dams, and Waterways, shall be charged to Account 545, Maintenance of MiscellaneousHydraulic Plant.
A.2.9 FERC FORM 1 ACCOUNT 544: Maintenance of Electric Plant (Major only)This account shall include the cost of labor, materials used and expenses incurred in themaintenance of plant includible in Account 333, Water Wheels, Turbines and Generators, andAccount 334, Accessory Electric Equipment. (See operating expense instruction 2, which canbe found in this manual, Attachment A.3.1.)
A.2.10 FERC FORM 1 ACCOUNT 553: Maintenance of Generating and ElectricalEquipment (Major only)This account shall include the cost of labor, materials used and expenses incurred in themaintenance of plant, the book cost of which is includible in Account 343, Prime Movers,Account 344, Generators, and Account 345, Accessory Electric Equipment.
A.3 Operating Expense Instructions 2 and 3
A.3.1 OPERATING EXPENSE INSTRUCTION 2: Maintenance• The cost of maintenance chargeable to the various operating expense and clearing
accounts includes labor, materials, overheads and other expenses incurred inmaintenance work. A list of work operations applicable generally to utility plant isincluded hereunder. Other work operations applicable to specific classes of plant arelisted in functional maintenance expense accounts.
• Materials recovered in connection with the maintenance of property shall be credited tothe same account to which the maintenance cost was charged.
Revision: 2930, Effective Date: 05/15/201707/31/2018 PJM © 20172018 99

PJM Manual 15: Cost Development GuidelinesAttachment A: Applicable FERC System of Accounts
• If the book cost of any property is carried in Account 102, Electric Plant Purchasedor Sold, the cost of maintaining such property shall be charged to the accounts formaintenance of property of the same class and use, the book cost of which is carried inother electric plant in service accounts. Maintenance of property leased from others shallbe treated as provided in operating expense instruction 3.
Items
• Direct field supervision of maintenance• Inspecting, testing, and reporting on condition of plant specifically to determine the need
for repairs, replacements, rearrangements and changes and inspecting and testing theadequacy of repairs that have been made
• Work performed specifically for the purpose of preventing failure, restoring serviceabilityor maintaining life of plant
• Rearranging and changing the location of plant not retired• Repairing for reuse materials recovered from plant• Testing for locating and clearing trouble• Net cost of installing, maintaining, and removing temporary facilities to prevent
interruptions in service• Replacing or adding minor items of plant that do not constitute a retirement unit (See
electric plant instruction 10)
Note:ELECTRIC PLANT INSTRUCTION 10 Rents includes amounts paid for the use of constructionquarters and office space occupied by construction forces and amounts properly includible inconstruction costs for such facilities jointly used.
A.3.2 OPERATING EXPENSE INSTRUCTION 3: Rents• The rent expense accounts provided under the several functional groups of expense
accounts shall include all rents, including taxes paid by the lessee on leased property,for property used in utility operations, except (1) minor amounts paid for occasional orinfrequent use of any property or equipment and all amounts paid for use of equipmentthat, if owned, would be includible in plant Accounts 391 and 398, inclusive, whichshall be treated as an expense item and included in the appropriate functional accountand (2) rents which are chargeable to clearing accounts, and distributed there from/tothe appropriate account. If rents cover property used for more than one function, suchas production and transmission, or by more than one department, the rents shall beapportioned to the appropriate rent expense or clearing accounts of each department onan actual, or if necessary, an estimated basis.
• When a portion of property or equipment rented from others for use in connection withutility operations is subleased, the revenue derived from such subleasing shall becredited to the rent revenue account in operating revenues; provided, however, that incase the rent was charged to a clearing account, amounts received from subleasing theproperty shall be credited to such clearing account.
Revision: 2930, Effective Date: 05/15/201707/31/2018 PJM © 20172018 100

PJM Manual 15: Cost Development GuidelinesAttachment A: Applicable FERC System of Accounts
• The cost, when incurred by the lessee, of operating and maintaining leased property,shall be charged to the accounts appropriate for the expense if the property were owned.
• The cost incurred by the lessee of additions and replacements to electric plant leasedfrom others shall be accounted for as provided in electric plant instruction.
Revision: 2930, Effective Date: 05/15/201707/31/2018 PJM © 20172018 101

PJM Manual 15: Cost Development GuidelinesAttachment B: NoLoad Calculation Examples
Attachment B: NoLoad Calculation ExamplesThe information included in this Attachment B provides guidance for calculating No-Load Costsfor various types of generating units.
B.1 No-Load FuelAll Market Sellers shall use No-Load Fuel to develop No-Load Costs for their units. Sincegenerating units cannot normally be run stable at zero net output, the no-load fuel may bedetermined by:
Collecting heat input values as a function of output and performing a regression analysis,
Using heat input values as provided by OEM and performing a regression analysis,
Using the initial design heat input curve for an immature unit and performing a regressionanalysis
Determining the measured value of fuel consumed at zero net output from test data (moment ofgenerator output breaker closure).
B.2 Typical Steam Unit ExampleAn example of collecting heat input values as a function of unit’s output and performing aregression analysis on the data to obtain the no-load fuel for a typical fossil steam unit is shownbelow:
Each diamond in the graph above indicates one hourly heat input data point calculated fromplant instrumentation during operations. A regression analysis was performed on the datacollected to obtain the unit’s Heat Input curve as a function of unit’s output with oil as a fuel:
Then the No-Load Fuel at zero output is
The initial estimate of a unit’s No-Load Cost ($/Hr) is:
Performance Factor = 1.02
Total Fuel related Cost (TFRC) = $14.00 MMBtu
The unit’s Cost Curve must be developed to determine if adjustments are needed for the unit’sNo-Load Cost. The Heat Input Curve Equation is used to determine the units heat input atvarious outputs. Total Operating Cost is calculated by:
Revision: 2930, Effective Date: 05/15/201707/31/2018 PJM © 20172018 102

PJM Manual 15: Cost Development GuidelinesAttachment B: NoLoad Calculation Examples
VOM = $0.15/MMBtu
Output (MW) Heat Input (MMBtu/hr) Total Operating Cost ($/hr)
50 795.12 11,476
160 1897.08 27,381
310 3460.75 49,949
410 4542.29 65,559
525 5824.73 84,068
550 6109.00 88,171
The unit’s Incremental Cost ($/MWh) at various outputs can be determined arithmetically by thefollowing equation:
Output (MW) Incremental Cost ($/MWh)
50 141.91
160 144.59
310 150.46
410 156.10
525 160.95
550 164.11
When calculating the first increment, MW1 is zero and the Total Operating Cost MW1 is the No-Load Cost. Since the Incremental Costs are monotonically increasing, no adjustment to the No-Load Cost is required.
The unit’s Incremental Cost ($/MWh) at various output levels can also be determined by usingthe derivative of the Heat Input Curve:
Revision: 2930, Effective Date: 05/15/201707/31/2018 PJM © 20172018 103

PJM Manual 15: Cost Development GuidelinesAttachment B: NoLoad Calculation Examples
Output (MW) Incremental Cost ($/MWh)
50 142.10
160 147.07
310 153.84
410 158.36
525 163.55
550 164.68
The No-Load Cost is calculated by subtracting the incremental cost (unit’s economic minimumcost-offer value multiplied by MW value) at the unit’s economic minimum point from the totalcost (from the heat input at economic minimum value) at the unit’s economic minimum point.
Differences in the calculated No-Load Cost between the two methods are due to the differencesin using a block average cost offer method versus a sloped derivative cost offer. When usingthe derivative method, user must select “Use Sloped Offer” when entering cost information intoMarkets Gateway.
B.3 Typical Combustion Turbine ExampleAn example of using the design heat input curve and performing a regression analysis to obtainthe no-load fuel for a simple cycle CT with peak firing is shown below:
Revision: 2930, Effective Date: 05/15/201707/31/2018 PJM © 20172018 104
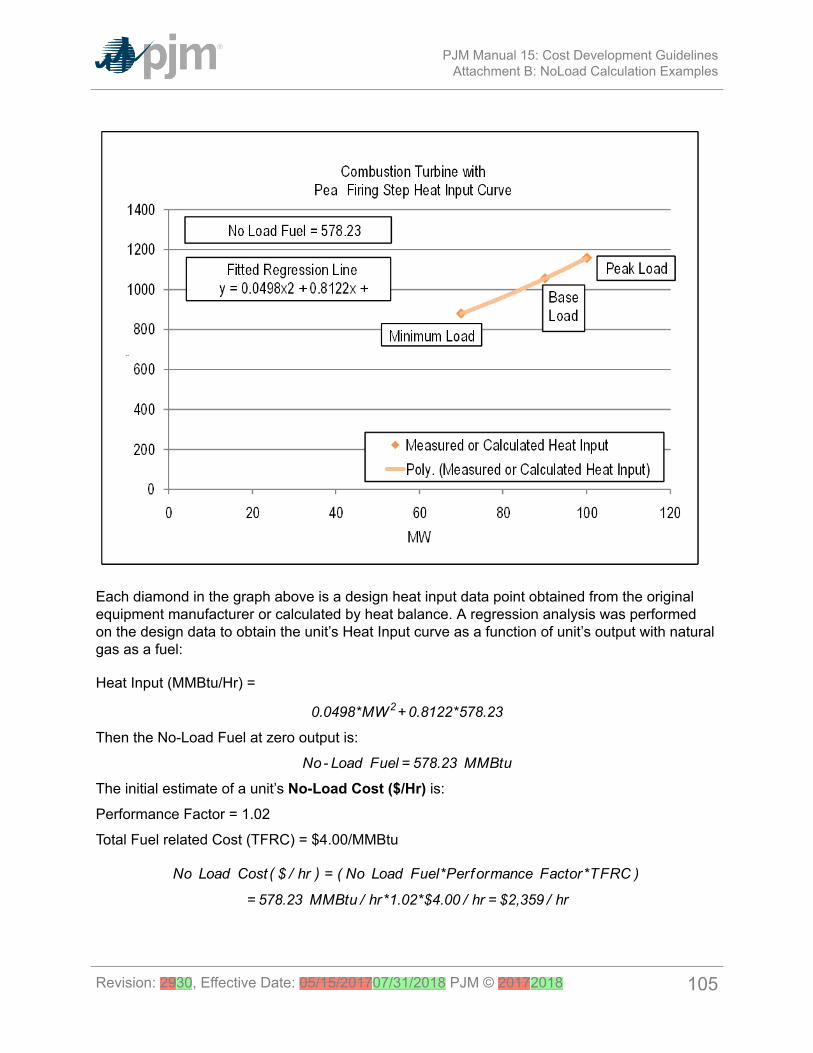
PJM Manual 15: Cost Development GuidelinesAttachment B: NoLoad Calculation Examples
Each diamond in the graph above is a design heat input data point obtained from the originalequipment manufacturer or calculated by heat balance. A regression analysis was performedon the design data to obtain the unit’s Heat Input curve as a function of unit’s output with naturalgas as a fuel:
Heat Input (MMBtu/Hr) =
Then the No-Load Fuel at zero output is:
The initial estimate of a unit’s No-Load Cost ($/Hr) is:
Performance Factor = 1.02
Total Fuel related Cost (TFRC) = $4.00/MMBtu
Revision: 2930, Effective Date: 05/15/201707/31/2018 PJM © 20172018 105

PJM Manual 15: Cost Development GuidelinesAttachment B: NoLoad Calculation Examples
The unit’s Cost Curve must be developed to determine if adjustments are needed for the unit’sNo-Load Cost. The Heat Input Curve Equation is used to determine the unit’s heat input atvarious unit output levels. Total Operating Cost is calculated by:
Maintenance Factor = 1.0 for Minimum & Base (= 3.0 for Peak)
VOM = $75.00/ESH
Output (MW) Heat Input (MMBtu/hr) Total Operating Cost ($/hr)
70 879.02 3,662
90 1054.57 4,378
100 1157.28 5,022
The unit’s Incremental Cost ($/MWh) at various unit output levels can be determinedarithmetically by the following equation:
Output (MW) Incremental Cost ($/MWh)
70 18.61
90 35.82
100 64.42
When calculating the first increment, MW1 is zero and the Total Operating Cost MW1 is the No-Load Cost. Since the Incremental Costs are monotonically increasing, no adjustment to the No-Load Cost is required.
The unit’s Incremental Cost ($/MWh) at various unit output levels can also be determined byusing the derivative of the Heat Input Curve:
Since VOM is in the units of $/hr it can only be added to the first incremental and anyincremental where the maintenance factor changes.
Revision: 2930, Effective Date: 05/15/201707/31/2018 PJM © 20172018 106

PJM Manual 15: Cost Development GuidelinesAttachment B: NoLoad Calculation Examples
Output (MW) Incremental Cost ($/MWh)
70 32.83
90 39.89
100 66.45
The No-Load Cost is calculated by subtracting the incremental cost (unit’s economic minimumcost-offer value multiplied by MW value) at the unit’s economic minimum point from the totalcost (from the heat input at economic minimum value) at the unit’s economic minimum point.
Differences in the calculated No-Load Cost between the two methods are due to the differencesin using a block average cost offer method versus a sloped derivative cost offer. When usingthe derivative method, user must select “Use Sloped Offer” when entering cost information intoMarkets Gateway.
B.4 Typical 2 on 1 Combined Cycle with Duct Burning ExampleAn example of using the design heat input curve and performing a regression analysis of thedata to obtain the no-load fuel for a two on one CC with duct burners is shown below:
Revision: 2930, Effective Date: 05/15/201707/31/2018 PJM © 20172018 107

PJM Manual 15: Cost Development GuidelinesAttachment B: NoLoad Calculation Examples
Each diamond in the graph above is a design heat input data point obtained from the originalequipment manufacturer or calculated by heat balance. A regression analysis was performedon the design data to obtain the unit’s Heat Input curve as a function of unit output levels withnatural gas as a fuel:
Then the No-Load Fuel at Zero output is:
The initial estimate of a unit’s No-Load Cost ($/hr) is:
Performance Factor = 1.02
Total Fuel related Cost (TFRC) = $4.00/MMBtu
The unit’s Cost Curve must be developed to determine if adjustments are needed for the unit’sNo-Load Cost. The Heat Input Curve Equation is used to determine the units heat input atvarious unit output levels. Total Operating Cost is calculated by:
Revision: 2930, Effective Date: 05/15/201707/31/2018 PJM © 20172018 108

PJM Manual 15: Cost Development GuidelinesAttachment B: NoLoad Calculation Examples
Maintenance Factor = 1.0
VOM = $75.00/ESH
Output (MW) Heat Input (MMBtu/hr) Total Operating Cost ($/hr)
105 872.58 3,635
135 1064.23 4,417
270 2100.41 8,720
300 2369.28 9,817
The unit’s Incremental Cost ($/MWh) at various unit output levels can be determinedarithmetically by the following equation:
Output (MW) Incremental Cost ($/MWh)
105 22.48
135 26.06
270 31.87
300 32.72
When calculating the first increment, MW1 is zero and the Total Operating Cost MW1 is the No-Load Cost. Since the Incremental Costs are monotonically increasing, no adjustment to the No-Load Cost is required.
The unit’s Incremental Cost ($/MWh) at various unit output levels can also be determined byusing the derivative of the Heat Input Curve:
Since VOM is in the units of $/hr it can only be added to the first incremental and anyincremental where the maintenance factor changes.
Output (MW) Incremental Cost ($/MWh)
105 25.82
Revision: 2930, Effective Date: 05/15/201707/31/2018 PJM © 20172018 109

PJM Manual 15: Cost Development GuidelinesAttachment B: NoLoad Calculation Examples
Output (MW) Incremental Cost ($/MWh)
135 27.02
270 36.17
300 37.52
The No-Load Cost is calculated by subtracting the incremental cost (unit’s economic minimumcost-offer value multiplied by MW value) at the unit’s economic minimum point from the totalcost (from the heat input at economic minimum value) at the unit’s economic minimum point.
Since VOM is in the units of $/hr it can only be added to the first incremental and anyincremental where the maintenance factor changes.
Differences in the calculated No-Load Cost between the two methods are due to the differencesin using a block average cost offer method versus a sloped derivative cost offer. When usingthe derivative method, user must select “Use Sloped Offer” when entering cost information intoMarkets Gateway.
B.5 No-Load Cost AdjustmentsThe calculated No-Load Cost may need to be adjusted to allow for the first incrementalpoint of the unit’s generator offer curve to comply with PJM’s monotonically increasing curverequirement.
An example of adjusting the No-Load Cost for a typical natural gas fired Steam Unit aftercalculation is as follows. Heat input values as a function of various unit output levels werecollected for a typical fossil steam and a regression analysis was performed to obtain the No-Load Cost.
Revision: 2930, Effective Date: 05/15/201707/31/2018 PJM © 20172018 110
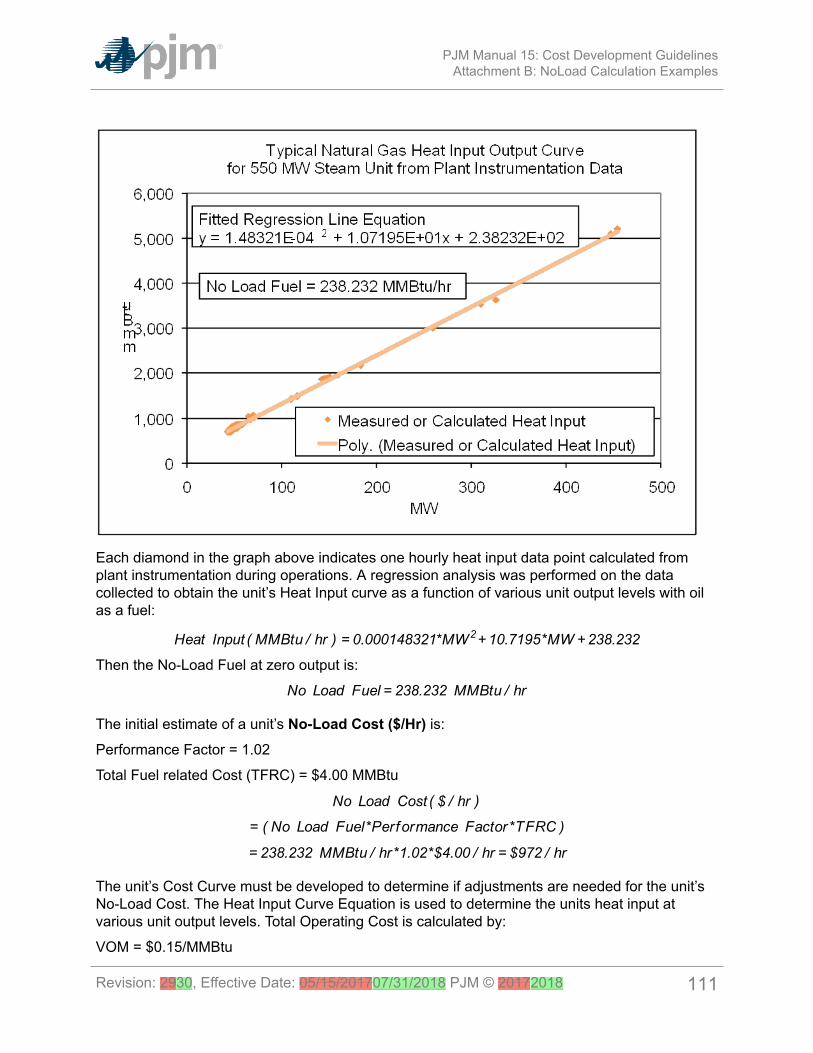
PJM Manual 15: Cost Development GuidelinesAttachment B: NoLoad Calculation Examples
Each diamond in the graph above indicates one hourly heat input data point calculated fromplant instrumentation during operations. A regression analysis was performed on the datacollected to obtain the unit’s Heat Input curve as a function of various unit output levels with oilas a fuel:
Then the No-Load Fuel at zero output is:
The initial estimate of a unit’s No-Load Cost ($/Hr) is:
Performance Factor = 1.02
Total Fuel related Cost (TFRC) = $4.00 MMBtu
The unit’s Cost Curve must be developed to determine if adjustments are needed for the unit’sNo-Load Cost. The Heat Input Curve Equation is used to determine the units heat input atvarious unit output levels. Total Operating Cost is calculated by:
VOM = $0.15/MMBtu
Revision: 2930, Effective Date: 05/15/201707/31/2018 PJM © 20172018 111

PJM Manual 15: Cost Development GuidelinesAttachment B: NoLoad Calculation Examples
Output (MW) Heat Input (MMBtu/hr) Total Operating Cost ($/hr)
50 774.58 3,279
160 1957.15 8,285
310 3575.53 15,135
410 4658.16 19,718
525 5906.85 25,004
550 6178.82 26,155
The unit’s Incremental Cost ($/MWh) at various unit output levels can be determinedarithmetically by the following equation:
Output (MW) Incremental Cost ($/MWh)
50 46.14
160 45.51
310 45.67
410 45.83
525 45.96
550 46.05
When calculating the first increment, MW1 is zero and the Total Operating Cost MW1 is the No-Load Cost. However due to the quality of the heat input data, the first increment of the cost offerwas greater than the second increment. This is shown in the graph below:
Revision: 2930, Effective Date: 05/15/201707/31/2018 PJM © 20172018 112
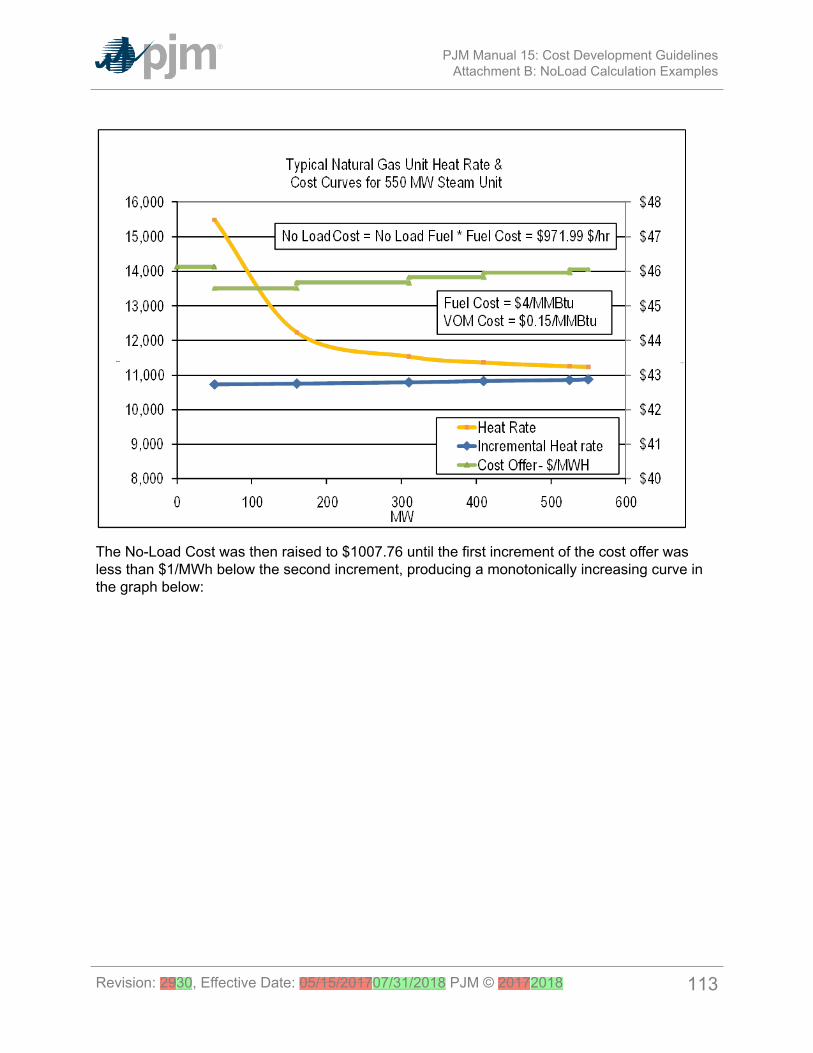
PJM Manual 15: Cost Development GuidelinesAttachment B: NoLoad Calculation Examples
The No-Load Cost was then raised to $1007.76 until the first increment of the cost offer wasless than $1/MWh below the second increment, producing a monotonically increasing curve inthe graph below:
Revision: 2930, Effective Date: 05/15/201707/31/2018 PJM © 20172018 113

PJM Manual 15: Cost Development GuidelinesAttachment B: NoLoad Calculation Examples
To avoid making adjustments to the No-Load Cost, first calculate the unit’s Incremental Cost ($/MWh) at various outputs using the derivative of the Heat Input Curve:
Output (MW) Incremental Cost ($/MWh)
50 45.43
160 45.58
310 45.76
410 45.89
525 46.03
550 46.06
The No-Load Cost is calculated by subtracting the incremental cost (unit’s economic minimumcost-offer value multiplied by MW value) at the unit’s economic minimum point from the totalcost (from the heat input at economic minimum value) at the unit’s economic minimum point.
Revision: 2930, Effective Date: 05/15/201707/31/2018 PJM © 20172018 114

PJM Manual 15: Cost Development GuidelinesAttachment B: NoLoad Calculation Examples
Differences in the calculated No-Load Cost between the two methods are due to the differencesin using a block average cost offer method versus a sloped derivative cost offer. When usingthe derivative method, user must select “Use Sloped Offer” when entering cost information intoMarkets Gateway.
B.6 Combustion Turbine Zero No-Load ExampleA zero No-Load example for a simple cycle combustion turbine with a single offer block isshown below:
Each diamond in the graph above is a design heat input data point obtained from the originalequipment manufacturer or calculated by heat balance. A regression analysis can be performedon the design data to obtain the unit’s Heat Input curve as a function of various unit output levelswith natural gas as a fuel:
Revision: 2930, Effective Date: 05/15/201707/31/2018 PJM © 20172018 115
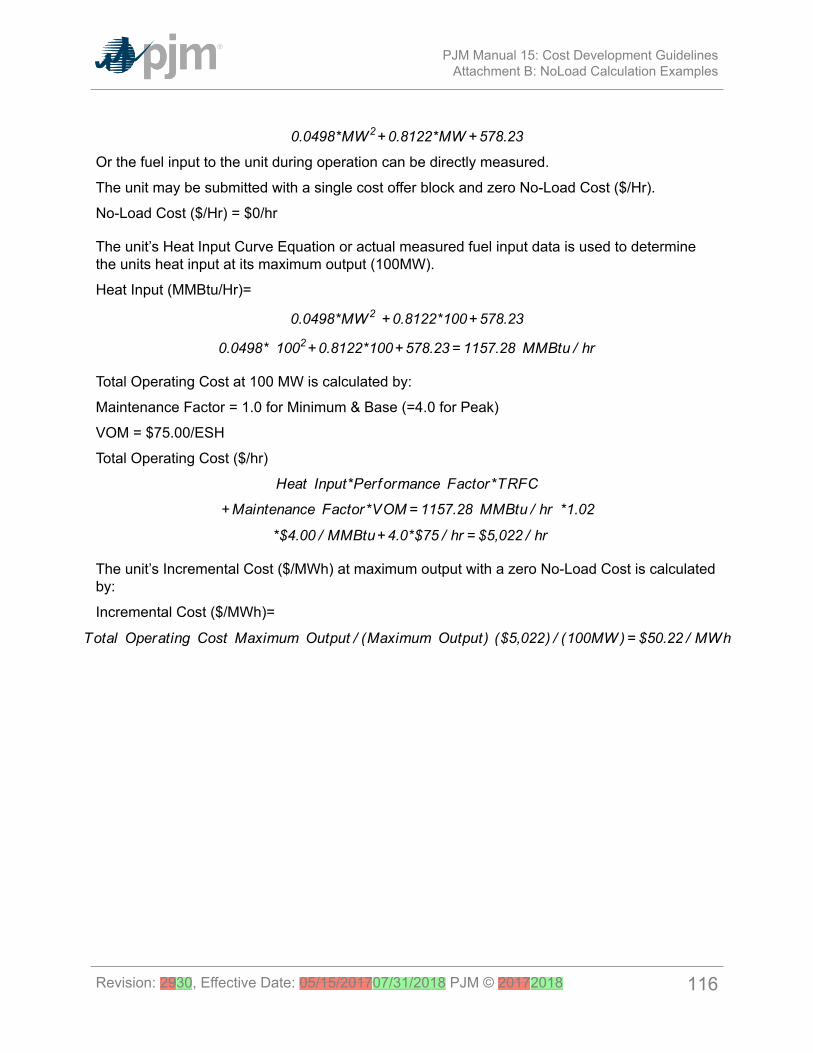
PJM Manual 15: Cost Development GuidelinesAttachment B: NoLoad Calculation Examples
Or the fuel input to the unit during operation can be directly measured.
The unit may be submitted with a single cost offer block and zero No-Load Cost ($/Hr).
No-Load Cost ($/Hr) = $0/hr
The unit’s Heat Input Curve Equation or actual measured fuel input data is used to determinethe units heat input at its maximum output (100MW).
Heat Input (MMBtu/Hr)=
Total Operating Cost at 100 MW is calculated by:
Maintenance Factor = 1.0 for Minimum & Base (=4.0 for Peak)
VOM = $75.00/ESH
Total Operating Cost ($/hr)
The unit’s Incremental Cost ($/MWh) at maximum output with a zero No-Load Cost is calculatedby:
Incremental Cost ($/MWh)=
Revision: 2930, Effective Date: 05/15/201707/31/2018 PJM © 20172018 116

PJM Manual 15: Cost Development GuidelinesRevision History
Revision HistoryRevision 29 (5/15/2017):
• Fuel Cost Policy and Hourly Offers conforming changes:
o Section 1.8, 2.3, 2.3.1, 2.3.1.1, 2.3.1.2, 2.3.1.3
• Additional changes to require submission to PJM and MMU
• Removed references to Manual 35 as this has been retired
Revision 28 (10/18/2016):
Biennial Review and Administrative Changes:
• Unit Owner changed to Market Seller
• Capitalization, Abbreviations, Grammar
• Pumped Storage Hydro
• Demand Resource
Revision 27 (04/20/2016):
Administrative Changes:
• Updated references eMKT to Markets Gateway
• Operating Parameter Definition Updates
Revision 26 (11/05/2014):
• Correct Mileage Ratio in Section 2.8 to Mileage
Revision 25 (07/28/2014):
• Update to the Handy Whitman Index numbers chart in section 2.6.1
Revision 24 (03/01/2014):
• Cyclic peaking and starting factors for combined cycle and combustion turbines insections 2.6.4, 4, 5, and 6 were updated to reflect how to use OEM values. A referencewas added for extended cold start.
Revision 23 (08/01/2013):
• Regulation Cost Based Offer update shifting manual language from Manual 11 to Manual15
• Updated Section 2.8 related to Regulation cost based offers and 11.8 for Energy Storageunits and Regulation
Revision 22 (06/01/2013):
• Update to the Handy Whitman Index numbers chart in section 2.6.1
Revision: 2930, Effective Date: 05/15/201707/31/2018 PJM © 20172018 117
PJM Manual 15: Cost Development GuidelinesRevision History
Revision 21 (04/01/2013):
• Added sections for hydro, energy storage, wind, solar and biofuel powered generationresources.
• Added shutdown cost language for DSR resources participating in synchronous reserve.
• Modified the Cost Development and Approval process to include more than generationresources.
Revision 20 (11/01/2012):
• Added section 2.6.5 to define maintenance cost calculation for immature units
• Updated Long Term Maintenance Cost language for Combustion Turbines andCombined Cycles for additional clarity
Revision 19 (06/01/2012):
• Updated Handy Whitman Index with actual for 2011 and estimate for 2012.
Revision 18 (02/08/2012):
• Removes overhaul costs for Combined Cycles and (CCs) Combustion Turbines (CTs)from Variable Operation and Maintenance Cost (VOM). Section 5.6, 5.6.2 and 6.2
• Adds clarity to the development of No Load Costs. Section 1.7.3, 2.1 and Attachment B
• Updates Manual 15 to be consistent with the tariff with respect to Non-Regulatory andEnergy Market Opportunity Costs. Section 9
Revision 17 (06/01/2011): Handy Whitman Update
• Section 2.6.1, Exhibit 1: Updated Handy Whitman Index Numbers for the year 2011.
• Section 9: Opportunity Cost Guideline is updated per the informational filing submitted byPJM on May 12, 2011, in Docket No. EL08-47-005.
Revision 16 (04/06/2011): Rewrite of entire Manual 15
• This revision improves readability and addresses changes as a result of FERC Order719 (Docket Nos. ER09-1063-000 and ER09-1063-001) requirements).
Revision 15 (10/27/2010):
• Modifies Section 8: Opportunity Cost Guidelines to conform to FERC Order EL08-47-005allowing for the inclusion of Opportunity Costs for Energy or Environmental Limitation
Revision 14 (06/01/2010):
• Section 5: Updated Chronology of Maintenance Adder Escalation Index Numbers for theyear 2010.
Revision 13 (05/07/2010):
Revision: 2930, Effective Date: 05/15/201707/31/2018 PJM © 20172018 118

PJM Manual 15: Cost Development GuidelinesRevision History
• Section 5: Updated Maintenance Period for the choice of 20 years or 10 years andadded Unit Configuration Addition Maintenance Adder language
Revision 12 (02/23/2010):
• Section 9: Updated Regulation Cost Guidelines approved 8/25/2009
Revision 11 (12/02/2009):
• Section 4: Updated Fuel Cost Policy Guidelines
Revision 10 (06/01/2009):
• Section 5: Updated Chronology of Maintenance Adder Escalation Index Numbers for theyear 2009.
Revision 09 (01/23/2009):
• Section 4: Added CO2 emission allowance cost to TFRC calculation. Updates to theTFRC cost equation reflect addition of CO2 emission allowance cost.
• Section 5L: Updated Chronology of Maintenance Adder Escalation Index Numbers forthe year 2008.
• Attachment A: TFRC equation updated to reflect addition of CO2 emission allowancecost.
Revision 08 (10/16/2007):
• Exhibit 1 — Updated Chronology of Maintenance Adder Escalation Index Numbers forthe year 2007.
• Section 9 — Modified the components of cost to supply Regulation Service.
Revision 07 (08/03/2006):
• Exhibit 1—Updated to include the new Manual 30: Alternative Collateral Program.
• Section 4—Added definition for Total Fuel-Related Costs for Pumped Storage HydroPlant Generation.
• Section 5—Added guidelines for Long Term Service Contract Cost Recovery.
• Exhibit 2—Updated Chronology of Maintenance Adder Escalation Index Numbers for theyear 2006.
• Section 7—Modified terminology for Spinning Synchronized Reserve.
Revision 06 (03/02/2006):
• Added guidelines for no-load fuel costs for Combustion Turbines to Section 1 andSection 2.
• Added “Long Term Maintenance Expenses” definition for Combustion Turbine andCombined Cycle Plants to Section 5.
Revision: 2930, Effective Date: 05/15/201707/31/2018 PJM © 20172018 119

PJM Manual 15: Cost Development GuidelinesRevision History
• Revisions were made on the following pages: 8, 9, and 20-22.
Revision 05 (08/18/2005):
• Updated Exhibit 1 to include new PJM Manuals.
• Updated Exhibit 2, Chronology of Maintenance Adder Escalation Index Numbers, for theyear 2005.
Revision 04 (09/01/2004):
• Insert new section nine into the CDS Manual
Revision 03 (06/01/2004):
• Revised table "Chronology of Maintenance Adder Escalation Index Numbers" in Section5 to reflect figures for the year 2004.
• Reformatted to reflect the new PJM format and style.
• Updated list of PJM Manuals to reflect title changes and additional Manuals
Revision 02 (06/01/2003):
• Revised table in Section 5.6, “Chronology of Maintenance Adder Escalation IndexNumbers”, for the year 2003
Revision 01 (12/01/2002):
• This revision incorporates changes to Section 7: Spinning Cost Guidelines. Thesechanges reflect the rules associated with the new PJM Spinning Reserve Market.
Revision 00 (12/01/2002):
• This revision is the preliminary draft of the PJM Manual for Cost DevelopmentGuidelines (M-15). Prior to Revision 00 of this Manual, a document with this nameexisted under direction of the PJM Operating Committee. Revision 00 was the firstissuance of this Manual under the approval of the PJM Board of Directors, pursuant toSchedule 2 of the Operating Agreement of the PJM Interconnection, L.L.C.
Revision: 2930, Effective Date: 05/15/201707/31/2018 PJM © 20172018 120