pjm manual 19
TRANSCRIPT

PJM Manual 19:Load Forecasting and AnalysisRevision: 31Effective Date: June 1, 2016
Prepared byResource Adequacy PlanningPJM © 2017
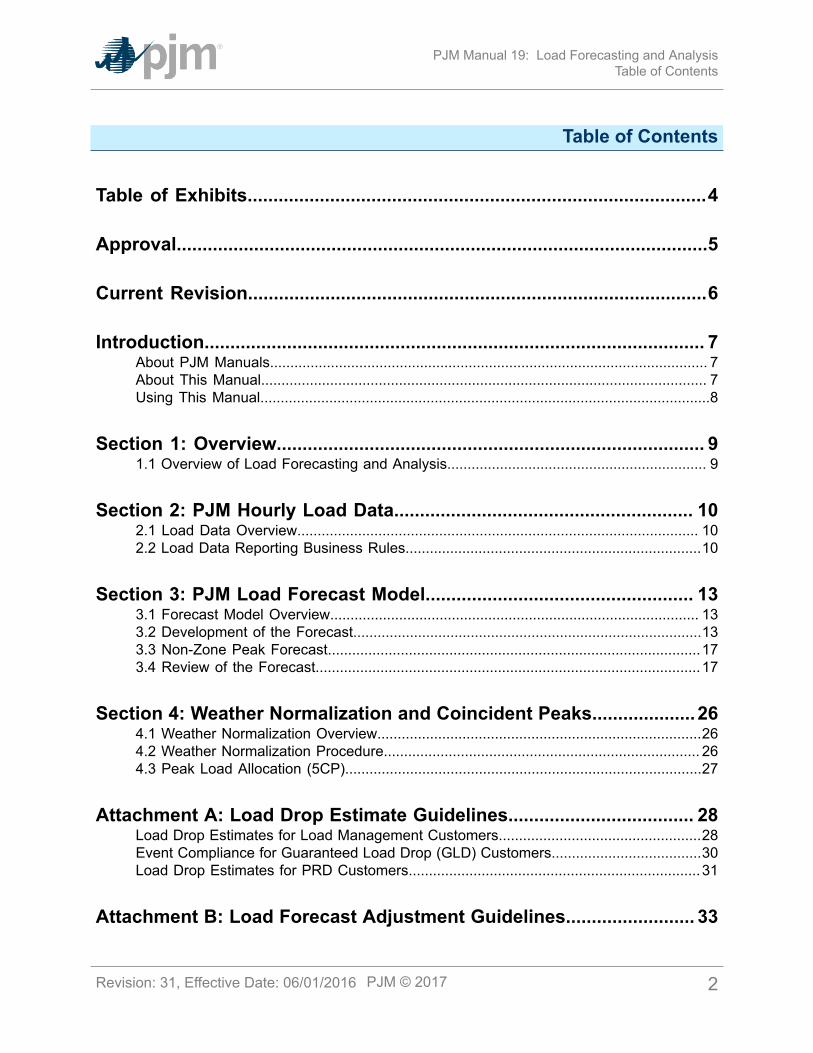
PJM Manual 19: Load Forecasting and AnalysisTable of Contents
Table of Contents
Table of Exhibits.........................................................................................4
Approval.......................................................................................................5
Current Revision.........................................................................................6
Introduction................................................................................................. 7About PJM Manuals............................................................................................................ 7About This Manual.............................................................................................................. 7Using This Manual...............................................................................................................8
Section 1: Overview................................................................................... 91.1 Overview of Load Forecasting and Analysis................................................................ 9
Section 2: PJM Hourly Load Data.......................................................... 102.1 Load Data Overview................................................................................................... 102.2 Load Data Reporting Business Rules.........................................................................10
Section 3: PJM Load Forecast Model.................................................... 133.1 Forecast Model Overview........................................................................................... 133.2 Development of the Forecast......................................................................................133.3 Non-Zone Peak Forecast............................................................................................173.4 Review of the Forecast...............................................................................................17
Section 4: Weather Normalization and Coincident Peaks.................... 264.1 Weather Normalization Overview................................................................................264.2 Weather Normalization Procedure.............................................................................. 264.3 Peak Load Allocation (5CP)........................................................................................27
Attachment A: Load Drop Estimate Guidelines.................................... 28Load Drop Estimates for Load Management Customers..................................................28Event Compliance for Guaranteed Load Drop (GLD) Customers.....................................30Load Drop Estimates for PRD Customers........................................................................31
Attachment B: Load Forecast Adjustment Guidelines......................... 33
Revision: 31, Effective Date: 06/01/2016 PJM © 2017 2

PJM Manual 19: Load Forecasting and AnalysisTable of Contents
Attachment C: Residential Non-Interval Metered Guidelines...............36
Revision History....................................................................................... 42
Revision: 31, Effective Date: 06/01/2016 PJM © 2017 3

PJM Manual 19: Load Forecasting and AnalysisTable of Exhibits
Table of Exhibits
Exhibit 1: Model Variable Definitions..............................................................................22
Exhibit 2: Assignment of Weather Stations to Zones.....................................................23
Exhibit 3: Assignment of Metropolitan Areas, Census Divisions and States to Zones... 24
Revision: 31, Effective Date: 06/01/2016 PJM © 2017 4

PJM Manual 19: Load Forecasting and AnalysisApproval
ApprovalApproval Date: 05/02/2016Effective Date: 06/01/2016
Thomas A. Falin, Manager
Resource Adequacy Planning Department
Revision: 31, Effective Date: 06/01/2016 PJM © 2017 5

PJM Manual 19: Load Forecasting and AnalysisCurrent Revision
Current RevisionRevision 31 (06/01/2016):
• Section 3: Corrected formulas in the End-Use/Weather Variables section
• Attachment B: Removed due to expiration of load research guidelines. The formerAttachments C and D have been re-lettered.
Revision: 31, Effective Date: 06/01/2016 PJM © 2017 6

PJM Manual 19: Load Forecasting and AnalysisIntroduction
IntroductionWelcome to the PJM Manual for Load Forecasting and Analysis. In this Introduction you willfind the following information:
• What you can expect from the PJM Manuals in general (see “About PJM Manuals”).
• What you can expect from this PJM Manual (see “About This Manual”)
• How to use this manual (see “Using This Manual”).
About PJM ManualsThe PJM Manuals are the instructions, rules, procedures, and guidelines established by thePJM Office of the Interconnection for the operation, planning, and accounting requirementsof the PJM RTO and the PJM Energy Market. The manuals are grouped under the followingcategories:
• Transmission
• PJM Energy Market
• Generation and transmission interconnection
• Reserve
• Accounting and billing
• PJM administrative services
• Miscellaneous
For a complete list of all PJM manuals, go to the Library section on PJM.com.
About This ManualThe PJM Manual for Load Forecasting and Analysis is one of a series of manuals within theReserve group of manuals. This manual focuses on load-related topics. This manual describesthe data input requirements, the processing performed on the data, computer programs involvedin processing the data, and the reports that are produced. It then describes processes used toanalyze load data and produce a long-term planning forecast.
The PJM Manual for Load Forecasting and Analysis consists of four sections. Thesesections are listed in the table of contents beginning on page 2.
Intended AudienceThe intended audiences for the PJM Manual for Load Forecasting and Analysis are:
• Electric Distribution Company (EDC) planners — The EDC planners are responsiblefor supplying historical load data in the required format, for using coincident peaks toallocate normalized peaks, and for input data verification.
• Load Serving Entity (LSE) planners — LSEs use allocated peaks and the LoadManagement systems to determine their capacity obligations.
Revision: 31, Effective Date: 06/01/2016 PJM © 2017 7

PJM Manual 19: Load Forecasting and AnalysisIntroduction
• PJM staff — PJM is responsible for the calculation of hourly PJM loads, normalizing PJMseasonal peaks, forecasting RTO and zonal peaks for capacity obligations, compiling thePJM Load Forecast Report, and administering Load Management. This information isused in calculating the capacity obligations.
• Planning Committee members — The Planning Committee is responsible for thestakeholder review of the peak forecasts and techniques for their determination.
• Reliability Assurance Agreement Signatories — The Markets Reliability Committeeis involved in the review of rules, methods and parameters associated with LoadForecasting and Analysis.
ReferencesThere are several references to other documents that provide background or additional detail.The PJM Manual for Load Forecasting and Analysis does not replace any informationin these reference documents. The following documents are the primary source of specificrequirements and implementation details:
• Power Meter documentation• eLRS documentation• PJM Load Forecast Report• PJM Manual for Emergency Operations (M-13)• Reliability Assurance Agreement• Behind-the-Meter Generation Business Rules (in Manual M-14D)• Deemed Savings Estimates for Legacy Air Conditioning and Water Heating Direct Load
Control Programs in PJM Region
Using This ManualWe believe that explaining concepts is just as important as presenting the procedures. Thisphilosophy is reflected in the way we organize the material in this manual. We start each sectionwith an overview. Then, we present details, procedures or references to procedures found inother PJM manuals. The following provides an orientation to the manual’s structure.
What You Will Find In This Manual• A table of contents that lists two levels of subheadings within each of the sections.• An approval page that lists the required approvals and a brief outline of the current
revision.• Sections containing the specific guidelines, requirements, or procedures including PJM
actions and PJM Member actions.• Attachments that include additional supporting documents, forms, or tables in this PJM
Manual.• A section at the end detailing all previous revisions of this PJM manual.
Revision: 31, Effective Date: 06/01/2016 PJM © 2017 8

PJM Manual 19: Load Forecasting and AnalysisSection 1: Overview
Section 1: OverviewWelcome to the Overview section of the PJM Manual for Load Forecasting and Analysis. Inthis section you will find the following information:
• An overview of the Load Forecasting and Analysis (see “Overview of Load Forecastingand Analysis”)
1.1 Overview of Load Forecasting and AnalysisLoad Forecasting and Analysis utilizes the PJM Power Meter load data, Load Management,PJM Load Forecast Model, and Weather Normalization and Peak Allocation.
PJM Hourly Load Data — After-the-fact hourly load data are entered by EDCs and used by PJMfor deriving seasonal load profiles, weather normalization factors, 1CP zonal load contributionsfor Network Service billing, charts contained in the PJM Load Forecast Report, and the MonthlyOperations Report.
PJM Load Forecast Model — PJM staff produces an independent forecast of monthly andseasonal peak load and load management, for each PJM zone, region, the RTO, and selectedcombinations of zones. The PJM Load Forecast Report includes tables and charts presentingthe results.
Weather Normalization and Peak Allocation — PJM uses approved techniques for weather-normalizing historical summer and winter zonal peaks, and determining RTO unrestrictedcoincident peaks.
Revision: 31, Effective Date: 06/01/2016 PJM © 2017 9
PJM Manual 19: Load Forecasting and AnalysisSection 2: PJM Hourly Load Data
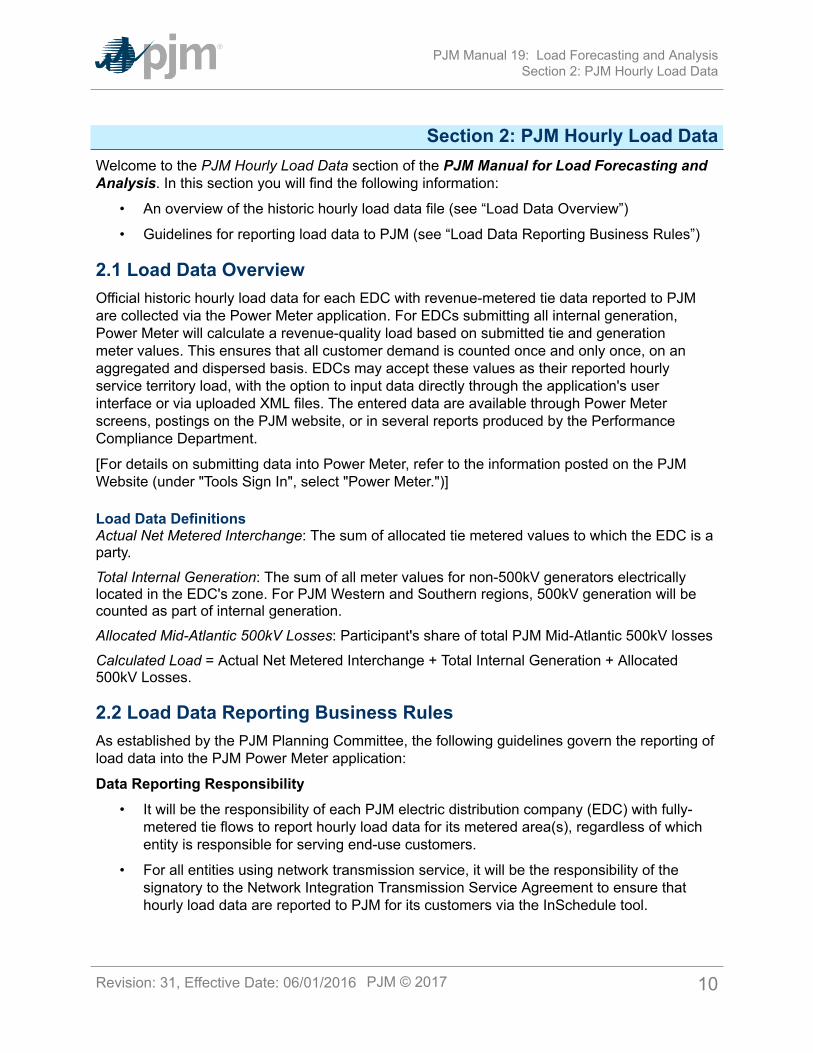
Section 2: PJM Hourly Load DataWelcome to the PJM Hourly Load Data section of the PJM Manual for Load Forecasting andAnalysis. In this section you will find the following information:
• An overview of the historic hourly load data file (see “Load Data Overview”)
• Guidelines for reporting load data to PJM (see “Load Data Reporting Business Rules”)
2.1 Load Data OverviewOfficial historic hourly load data for each EDC with revenue-metered tie data reported to PJMare collected via the Power Meter application. For EDCs submitting all internal generation,Power Meter will calculate a revenue-quality load based on submitted tie and generationmeter values. This ensures that all customer demand is counted once and only once, on anaggregated and dispersed basis. EDCs may accept these values as their reported hourlyservice territory load, with the option to input data directly through the application's userinterface or via uploaded XML files. The entered data are available through Power Meterscreens, postings on the PJM website, or in several reports produced by the PerformanceCompliance Department.
[For details on submitting data into Power Meter, refer to the information posted on the PJMWebsite (under "Tools Sign In", select "Power Meter.")]
Load Data DefinitionsActual Net Metered Interchange: The sum of allocated tie metered values to which the EDC is aparty.Total Internal Generation: The sum of all meter values for non-500kV generators electricallylocated in the EDC's zone. For PJM Western and Southern regions, 500kV generation will becounted as part of internal generation.Allocated Mid-Atlantic 500kV Losses: Participant's share of total PJM Mid-Atlantic 500kV lossesCalculated Load = Actual Net Metered Interchange + Total Internal Generation + Allocated500kV Losses.
2.2 Load Data Reporting Business RulesAs established by the PJM Planning Committee, the following guidelines govern the reporting ofload data into the PJM Power Meter application:
Data Reporting Responsibility• It will be the responsibility of each PJM electric distribution company (EDC) with fully-
metered tie flows to report hourly load data for its metered area(s), regardless of whichentity is responsible for serving end-use customers.
• For all entities using network transmission service, it will be the responsibility of thesignatory to the Network Integration Transmission Service Agreement to ensure thathourly load data are reported to PJM for its customers via the InSchedule tool.
Revision: 31, Effective Date: 06/01/2016 PJM © 2017 10

PJM Manual 19: Load Forecasting and AnalysisSection 2: PJM Hourly Load Data
• Curtailment Service Providers (CSPs) are responsible for providing information toestimate load management impacts as detailed in Attachment A.
Data Specifications• Load data supplied to Power Meter will reflect each entity’s total impact to the system,
counting all customer demand once and only once, and will therefore need to properlyaccount for system losses and flows. PJM will adjust loads for their assigned shareof Extra High Voltage losses. LSEs providing load management impact estimateswill adjust loads for system losses. Data are accepted in Power Meter in 0.001 MWhincrements.
Reporting Schedule• The data for each day should initially be entered within the following ten calendar days,
except during peak periods, when the data must be entered daily. PJM contacts EDCswhen daily reporting is needed.
• Edits to load data should be made by the tenth calendar day of the following month.
• PJM will adjust submitted load data, as necessary, to reflect additional load that isdetermined by PJM after-the-fact, resulting from third-party supply of generator stationpower requirements.
• EDC ability to submit loads via Power Meter is subject to a reporting window thatincludes the current month and three previous months. For example, in April, values forApril, March, February, and January can be freely edited. For updates to months olderthan three full months prior, the participant must have PJM make the submission ontheir behalf. PJM may be contacted at [email protected] to arrange forassistance.
• Failure to report data to PJM in a timely and complete manner will subject responsibleparties to Data Submission Charges, as outlined in Schedule 13 of the ReliabilityAssurance Agreement and the PJM West Reliability Assurance Agreement.
EDC/ CSP Actions• Enter Hourly Load Data — PJM EDCs submit aggregate hourly load values into Power
Meter, as required. CSPs provide resource-specific settlements data to quantify LoadManagement impacts into the eLRS application. (See Attachment A).
• Edit the Data as necessary — All hourly load value changes for a given month must beentered and edited by the 10th of the following month.
• Notify PJM of All Changes — Without this notification, PJM can only determine thatchanges have been made but cannot readily identify specific changes which were made.
PJM Actions• Allocate Extra High Voltage Losses: — 500kV losses in the PJM Mid-Atlantic region
are calculated as the total 500kV system energy injections minus withdrawals. Hourly500kV losses are allocated to each PJM Mid-Atlantic EDC with revenue metered tieflows reported to Power Meter, in proportion to their real-time load ratio share.
Revision: 31, Effective Date: 06/01/2016 PJM © 2017 11

PJM Manual 19: Load Forecasting and AnalysisSection 2: PJM Hourly Load Data
• Distribute Reports: — By the 10th of each month, PJM makes reports of load data fromthe previous month available to the EDCs. These data include a summary Daily LoadReport for each day of the month, showing daily peak loads and the monthly energy totalfor each LSE and for the PJM RTO. A monthly summary report also is provided.
• Post Zonal Data: — PJM will publish zonal load data in an electronic format on a monthlybasis.
• Data Usage: — PJM uses the hourly load data for operational analysis, for calculatingseasonal load factors, developing weather normalization curves, for allocating the PJMweather normalized seasonal peaks, and for preparing various charts and tables in thePJM Load Forecast Report, and for reporting to regulatory and other authorities.
Revision: 31, Effective Date: 06/01/2016 PJM © 2017 12

PJM Manual 19: Load Forecasting and AnalysisSection 3: PJM Load Forecast Model
Section 3: PJM Load Forecast ModelWelcome to the PJM Load Forecast Model section of the PJM Manual for Load Forecastingand Analysis. In this section you will find the following information:
• An overview of the PJM Load Forecast Model (see “Forecast Model Overview”).
• A description of the methodology used to produce the PJM forecast (see “Developmentof the Forecast”).
• A description of the forecast review and approval process (see “Review and Approvalthe Forecast”).
3.1 Forecast Model OverviewThe PJM Load Forecast Model produces 15-year monthly forecasts of unrestricted peaksassuming a range of weather conditions for each PJM zone, locational deliverability area(LDA) and the RTO. The model uses trends in equipment and appliance usage, anticipatedeconomic growth and historical weather patterns to estimate growth in peak load and energyuse. It is used to set the peak loads for capacity obligations, for reliability studies, and tosupport the Regional Transmission Expansion Plan. Net energy forecasts are used in reportingrequirements of FERC and NERC, and for market efficiency studies. The forecast is producedby PJM and released prior to each Planning Period, typically in January.
3.2 Development of the ForecastThe PJM Load Forecast employs econometric multiple regression models to estimate daily peakload for each PJM zone (the non-coincident peak), the zone’s contribution to the daily RTO peak(the coincident peak), and monthly net energy for load. Definitions of each model variable arepresented in Exhibit 1. The variables included are:
Dependent Variable - LoadHourly metered load data are supplemented with estimated load drops (as outlined inAttachment A) and estimated distributed solar generation to obtain unrestricted hourly loads.For the non-coincident models, the maximum value for each day is used in the regressions. Forthe coincident models, the zone’s contribution to the daily RTO/LDA unrestricted peak load isused in the regressions. For the net energy models, the sum of each day’s hourly loads is usedin the regressions.
Calendar EffectsDays of the week, month of the year, holiday, and Daylight Saving Time impacts are includedin the model using binary variables. Holiday seasonal lighting load is reflected using a trendvariable.
Weather DataWeather is included in the models using different variables for heating, cooling and shoulderseasons. Weather variables are specified as splines over defined ranges. For the heating andshoulder seasons (January, February, March, April, October, November and December), theWinter Weather Parameter is defined as:
Revision: 31, Effective Date: 06/01/2016 PJM © 2017 13

PJM Manual 19: Load Forecasting and AnalysisSection 3: PJM Load Forecast Model
Where:
WIND Wind velocity, in miles per hour
WWP Wind speed adjusted dry bulb temperature
DB Dry bulb temperature (oF)
For the cooling and shoulder seasons (March, April, May, June, July, August September,October and November), Temperature-Humidity Index (THI) is used as the weather variable:
Where:
THI Temperature humidity index
DB Dry bulb temperature (oF)
HUM Relative Humidity (where 100% = 1)
Additionally, measures of heating and cooling degree days are included, using the currentand previous day’s weather. Weather data for each PJM zone are calculated according to themapping presented in Exhibit 2.
Economic DriversMeasures of economic and demographic activity are included in the forecast models,representing total U.S., state, or metropolitan areas, depending upon their predictive value.Economic drivers for states and metropolitan areas are assigned to each PJM zone accordingto the mapping presented in Exhibit 3. Models for each PJM zone share the same generalspecification.
End-Use TrendsMeasures of the stock and efficiency of various electrical equipment and appliances used inresidential and commercial settings are included in the forecast models, grouped by heating,cooling, and other. End-use variables for each PJM zone are applied by Census Division, aspresented in Exhibit 3. End-use variables are weighted by the Residential and Commercialsales of each zone, per FERC Form 1 filings.
Load Adjustments
Revision: 31, Effective Date: 06/01/2016 PJM © 2017 14

PJM Manual 19: Load Forecasting and AnalysisSection 3: PJM Load Forecast Model
In cases where a zone has experienced or is anticipated to experience a significant load changethat may not be captured in the load forecast, PJM may elect to apply a load forecast in one oftwo ways: 1) for identified changes that have not yet occurred, by an explicit adjustment to themodeled forecast; and 2) for changes that have already occurred, by the introduction of a binaryvariable into the affected zone’s model specification.
In cases where the load change has not yet occurred, PJM will base any adjustment oninformation received from EDC load forecasters in response to PJM’s annual request for detailson large load changes that are known to the EDC. PJM will handle these requests on a case-by-case basis and perform (or have performed) whatever analysis is required to establish thedegree of certainty and magnitude of the load change. Attachment C provides load forecastadjustment guidelines.
In cases where a zone has experienced a large, sudden shift in load (or following the use of amanual load adjustment in a prior forecast), a load adjustment dummy (binary) variable maybe added to the zone’s model specification. The resulting model coefficient must satisfy thefollowing criteria:
• Be explained by an identifiable occurrence (such as the migration of load from anotherservice territory, factory shutdown, or a price shock);
• Be statistically significant;
• Have a sign in the expected direction;
• Have a magnitude that is consistent with the expected load shift;
• Have a magnitude, relative to the zone’s metered peak, large enough to make adiscernible difference in the forecast; and
• Make an appreciable improvement to model fit statistics.
Non-Coincident Base and 90/10 ScenariosFor each PJM zone, a distribution of non-coincident peak (NCP) forecasts is produced using aMonte Carlo simulation process. Monte Carlo simulation is useful for simulating a phenomenon(in this case, electrical load) with significant uncertainty with regard to one or more of itsdriving influences (in this case, the weather conditions that will occur in the future). Using theMonte Carlo approach, load forecasts are developed for each zone using the actual weatherpatterns that were observed in that zone over many years. The simulation process producesa distribution of monthly forecast results by selecting the 12 monthly peak values per forecastyear for each weather scenario. For each year, by weather scenario, the maximum daily NCPload for a zone over each season is found. For each zone and year, a distribution of zonal NCPby weather scenario is developed. From this distribution, the median values are used to shapethe monthly profile within each season.
The median result is used as the base (50/50) forecast; the values at the 10th percentile and90th percentile are assigned to the 90/10 weather bands.
RTO and Coincident ForecastsTo obtain the RTO/LDA peak forecast, the solution for each of the zonal coincident peak (CP)models are summed by day and weather scenario to obtain the RTO/LDA peak for the day. Byweather scenario, the maximum daily RTO/LDA value for the season is found. For the RTO/
Revision: 31, Effective Date: 06/01/2016 PJM © 2017 15

PJM Manual 19: Load Forecasting and AnalysisSection 3: PJM Load Forecast Model
LDA, a distribution of the seasonal RTO/LDA peak vs. weather scenario is developed. Fromthis distribution, the median result is used as the base (50/50) forecast; the values at the 10thpercentile and 90th percentile are assigned to the 90/10 weather bands.
To determine the final zonal RTO/LDA-coincident peak (CP) forecasts, a methodology similarto the process for deriving zonal NCPs is applied. By weather scenario, the maximum daily CPload for a zone over the summer season is found. For each zone a distribution of zonal CP vs.weather scenario is developed. From this distribution the median value is selected. The medianzonal CPs are summed and this sum is then used to apportion the forecasted RTO/LDA peak toproduce the final zonal CP forecasts.
Net Energy for Load ForecastsFor each PJM zone, a distribution of forecasts is produced using a Monte Carlo simulationprocess. The weather distributions are developed using observed historical weather data. Thesimulation process produces a distribution of monthly forecast results by summing the dailyvalues per forecast year for each weather scenario.
Load Management, Energy Efficiency, Price Responsive Demand and Behind-the-MeterGenerationPJM incorporates assumptions of load management, energy efficiency, price responsivedemand and behind-the-meter generation to supplement the base, unrestricted forecast.
For Demand Resources (DR), forecasted values for each zone are computed based on thefollowing procedure. The forecast is based on the PJM final summer season Committed DRamount, where the Committed DR means all DR that has committed through RPM, BaseResidual Auction and all Incremental Auctions, or a Fixed Resource Requirement plan.
1. Compute the final amount of Committed DR for each of the most recent three DeliveryYears. Express the Committed DR amount as a percentage of the zone’s 50/50 forecastsummer peak from the January Load Forecast Report immediately preceding therespective Delivery Year.
2. Compute the most recent three year average Committed DR percentage for each zone.
3. The DR forecast for each zone shall be equal to the zone’s 50/50 forecast summer peakmultiplied by the result from Step 2.
The impact of price responsive demand equals the amount subscribed through the RPMprocess. The amount subscribed for the last RPM auction year is held constant for theremainder of the forecast.
The total amount of behind-the-meter solar generation will be forecasted separately from theload forecast model. This forecasted amount will be used to adjust the unrestricted load of eachzone.
Note:More information on behind-the-meter generation can be found in the Behind-the-MeterGeneration Business Rules in the PJM Manual for Generator Operational Requirements(M-14D) posted on PJM.com.
Revision: 31, Effective Date: 06/01/2016 PJM © 2017 16

PJM Manual 19: Load Forecasting and AnalysisSection 3: PJM Load Forecast Model
3.3 Non-Zone Peak ForecastFor use in the Reliability Pricing Model (RPM), PJM staff develops summer peak forecasts ofthe recognized non-zone loads. These forecasts are produced separately from the PJM LoadForecast Model, and utilize methods appropriate for each situation. Non-zone forecasted loadsare added to the associated PJM zone for RPM purposes only.
3.4 Review of the ForecastThe PJM Load Forecast is reviewed by the Load Analysis Subcommittee and the PlanningCommittee.
A member of the Planning Committee may submit an appeal (detailing the issue and outlininga solution) for a review of part or all of the forecast, which will be forwarded by the Chair of thePlanning Committee to PJM, upon a vote of the Committee.
Calendar Data
Variable Name Type/Formula Description
Day of week
Monday Binary Day of the Week
Tuesday Binary Day of the Week
Wednesday Binary Day of the Week
Thursday Binary Day of the Week
Friday Binary Day of the Week
Saturday Binary Day of the Week
Holiday
MartinLutherKingDay Fuzzy MLK Day Holiday
PresidentsDay Fuzzy President’s DayHoliday
GoodFriday Binary Good Friday ReligiousHoliday
MemorialDay Fuzzy Memorial Day Holiday
July4th Fuzzy Independence Day andsurrounding days
LaborDay Fuzzy Labor Day Holiday
Thanksgiving Binary Thanksgiving Holiday
Revision: 31, Effective Date: 06/01/2016 PJM © 2017 17

PJM Manual 19: Load Forecasting and AnalysisSection 3: PJM Load Forecast Model
Variable Name Type/Formula Description
FridayAfterThanksgiving Fuzzy Friday AfterThanksgiving Holiday
XMasWkB4 Fuzzy Week Before Christmas
ChristmasEve Fuzzy Christmas Eve (valuedepends on day ofweek)
ChristmasDay Binary Christmas Day
XMasWk Fuzzy Week after ChristmasHoliday
NewYearsEve Fuzzy New Years Eve(valuedepends on day ofweek)
NewYearsDay Binary New Years Day Holiday
XMasLights Trend Christmas Lights/RetailOperations Trend
Month
January Binary Month of the Year
February Binary Month of the Year
March Binary Month of the Year
April Binary Month of the Year
May Binary Month of the Year
June Binary Month of the Year
July Binary Month of the Year
August Binary Month of the Year
September Binary Month of the Year
October Binary Month of the Year
November Binary Month of the Year
Other
DLSav_EPA2005 Binary Daylight Saving Timeconversion
Revision: 31, Effective Date: 06/01/2016 PJM © 2017 18

PJM Manual 19: Load Forecasting and AnalysisSection 3: PJM Load Forecast Model
Note:Binary – A variable which has a value of 1 for the indicated characteristic, otherwise the value is0.
Fuzzy – A variable which has a conditional value for the indicated characteristic, otherwise thevalue is 0.
Trend - A variable which has a value with increasing then decreasing value for the indicatedcharacteristic, otherwise the value is 0.
End-Use/ Weather Variables
S1_THI IF (month ≥ 5 & month ≤ 9)
THEN MaxTHI1
ELSE 0
Cool_S2_THI IF (month ≥ 5 & month ≤ 9)
AND Spline2 Threshold < MaxTHI
THEN Cool * (MaxTHI – Spline2 Threshold)
ELSE 0
Cool_S3_THI IF (month ≥ 5 & month ≤ 9)
AND Spline3 Threshold < MaxTHI
THEN Cool * (MaxTHI – Spline3 Threshold)
ELSE 0
Cool_S4_THI IF (month ≥ 5 & month ≤ 9)
AND MaxTHI > Spline4 Threshold
THEN Cool * (MaxTHI – Spline4 Threshold)
ELSE 0
Where:
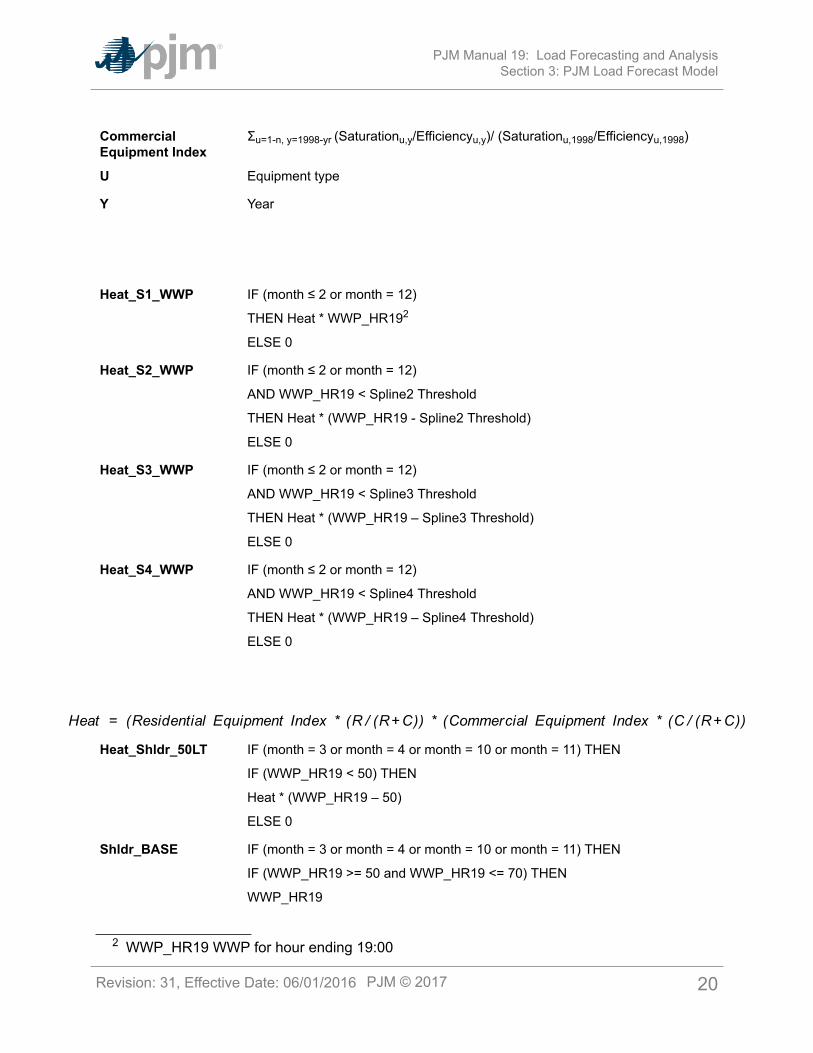
R Residential sector electricity sales
C Commercial sector electricity sales
ResidentialEquipment Index
Σu=1-n, y=1998-yr (Saturationu,y/Efficiencyu,y)/ (Saturationu,1998/Efficiencyu,1998)
1 Intermediate Calculations: MaxTHI Maximum THI over 24 hours
Revision: 31, Effective Date: 06/01/2016 PJM © 2017 19
PJM Manual 19: Load Forecasting and AnalysisSection 3: PJM Load Forecast Model
CommercialEquipment Index
Σu=1-n, y=1998-yr (Saturationu,y/Efficiencyu,y)/ (Saturationu,1998/Efficiencyu,1998)
U Equipment type
Y Year
Heat_S1_WWP IF (month ≤ 2 or month = 12)
THEN Heat * WWP_HR192
ELSE 0
Heat_S2_WWP IF (month ≤ 2 or month = 12)
AND WWP_HR19 < Spline2 Threshold
THEN Heat * (WWP_HR19 - Spline2 Threshold)
ELSE 0
Heat_S3_WWP IF (month ≤ 2 or month = 12)
AND WWP_HR19 < Spline3 Threshold
THEN Heat * (WWP_HR19 – Spline3 Threshold)
ELSE 0
Heat_S4_WWP IF (month ≤ 2 or month = 12)
AND WWP_HR19 < Spline4 Threshold
THEN Heat * (WWP_HR19 – Spline4 Threshold)
ELSE 0
Heat_Shldr_50LT IF (month = 3 or month = 4 or month = 10 or month = 11) THEN
IF (WWP_HR19 < 50) THEN
Heat * (WWP_HR19 – 50)
ELSE 0
Shldr_BASE IF (month = 3 or month = 4 or month = 10 or month = 11) THEN
IF (WWP_HR19 >= 50 and WWP_HR19 <= 70) THEN
WWP_HR19
2 WWP_HR19 WWP for hour ending 19:00
Revision: 31, Effective Date: 06/01/2016 PJM © 2017 20

PJM Manual 19: Load Forecasting and AnalysisSection 3: PJM Load Forecast Model
ELSE 0
Cool_Shldr_THI IF (month = 3 or month = 4 or month = 10 or month = 11) THEN
IF (Heat_Shldr_50LT = 0 and Shldr_BASE = 0) THEN
Cool * MaxTHI
ELSE 0
End-Use/Economic/Weather Data
Variable Name Formula Description
Cool_IN2_CDD Cool*DailyEconIndex*CDD Cooling equipment indexinteracted with
degree days and economicindex.
Cool_IN2_LAG1CDD Cool *DailyEconIndex*CDD_LAG3
Cooling equipment index
Interacted with lagged degreedays and economic index.
Heat_IN2_HDD Heat *DailyEconIndex *HDD HDD Heating equipment indexinteracted with
degree days and economicindex.
Heat_IN2_LAG1 HDD Heat*DailyEconIndex*HDD_LAG4 Heating equipment indexinteracted with
degree days and economicindex.
End-Use/Economic Data
Variable Name Formula Description
Other_IN2 Other * DailyEconIndex Other equipment indexinteracted with economicindex.
Economic Data
3 CDD_LAG Cooling degree days from prior day
4 HDD_LAG Heating degree days from prior day
Revision: 31, Effective Date: 06/01/2016 PJM © 2017 21

PJM Manual 19: Load Forecasting and AnalysisSection 3: PJM Load Forecast Model
Variable Name Description
DailyEconIndex Economic index quarterly values converted to daily.
Where:
ResWt is the residential sector sales percentage to total zonal electric sales in year (y)
HH is the number of households in year (y) and month (m)
Pop is the population in year (y) and month (m)
PInc is the value of total real personal income in year (y) and month (m)
ComWt is the commercial sector sales percentage to total zonal electric sales in year(y)
NMEmp is the number of non-manufacturing employees in the metro area(s) in year (y)and month (m)
GDP is the value of total real gross domestic product in the United States in year (y)and month (m)
GMP is the value of total real gross metropolitan product in the metro area(s) in year(y) and month (m)
IndWt is industrial sector sales percentage to total zonal electric sales in year (y)
And base indexes the base year
Load Adjustment
Variable Name Type/Formula Description
LA_<yy> Binary Adjustment for year 20yyforward
Exhibit 1: Model Variable Definitions
Revision: 31, Effective Date: 06/01/2016 PJM © 2017 22

PJM Manual 19: Load Forecasting and AnalysisSection 3: PJM Load Forecast Model
Zone Weather
Station
Airport Name Weight
AE ACY Atlantic City International 1
AEP CAK Akron-Canton Regional Airport 0.151
AEP CMH Columbus Port Columbus International 0.234
AEP CRW Charleston Yeager Airport 0.226
AEP FWA Fort Wayne International Airport 0.227
AEP ROA Roanoke Regional Airport 0.162
APS IAD Washington Dulles 0.3
APS PIT Pittsburgh International 0.7
ATSI CAK Akron-Canton Regional Airport 0.465
ATSI CLE Cleveland Hopkins Airport 0.3
ATSI TOL Toledo Express Airport 0.15
ATSI PIT Pittsburgh International Airport 0.085
BGE BWI Baltimore Washington International 1
COMED ORD Chicago O'Hare International 1
DAY DAY Cox-Dayton International 1
DEOK CVG Cincinnati Northern KY Airport 1
DLCO PIT Pittsburgh International 1
DOM IAD Washington Dulles 0.3333
DOM ORF Norfolk International 0.3333
DOM RIC Richmond International 0.3334
DPL ILG Wilmington New Castle County Airport 0.7
DPL WAL Wallops Island Flight Center 0.3
EKPC CVG Cincinnati Northern KY Airport 0.25
EKPC LEX Blue Grass Airport 0.49
EKPC SDF Louisville International Airport 0.26
JCPL EWR Newark International 0.75
Revision: 31, Effective Date: 06/01/2016 PJM © 2017 23

PJM Manual 19: Load Forecasting and AnalysisSection 3: PJM Load Forecast Model
Zone Weather
Station
Airport Name Weight
JCPL ACY Atlantic City International 0.25
METED PHL Philadelphia International 0.5
METED ABE Allentown Lehigh Valley International 0.5
PECO PHL Philadelphia International 1
PENLC ERI Erie International 0.5
PENLC IPT Williamsport Regional 0.5
PEPCO DCA Washington Reagan National 1
PL ABE Allentown Lehigh Valley International 0.25
PL AVP Wilkes-Barre Scranton International 0.25
PL IPT Williamsport Regional 0.25
PL MDT Harrisburg International 0.25
PS EWR Newark International 1
RECO EWR Newark International 1
UGI AVP Wilkes-Barre Scranton International 1
Exhibit 2: Assignment of Weather Stations to Zones
Zone State(s) Metro Area Name(s) Census Division
AE NJ Atlantic City-Hammonton NJ, Ocean City NJ,Vineland-Bridgeton NJ
Middle Atlantic
AEP OH, WV,VA, IN
Elkhart-Goshen IN, Fort Wayne IN, Muncie IN, SouthBend-Mishawaka IN-MI, Niles-Benton Harbor MI,Canton-Massillon OH, Columbus OH, Lima OH,Kingsport-Bristol TN, Blacksburg-Christiansburg-Radford, VA, Lynchburg VA, Roanoke VA, Beckley,WV, Charleston WV, Huntington-Ashland WV-KY-OH, Weirton-Steubenville WV-OH
East North Central
APS PA, OH, WV Cumberland MD-WV, Hagerstown-MartinsburgMD-WV, Chambersburg-Waynesboro PA, StateCollege PA, Winchester VA-WV, Morgantown WV,Parkersburg-Vienna WV
South Atlantic
Revision: 31, Effective Date: 06/01/2016 PJM © 2017 24

PJM Manual 19: Load Forecasting and AnalysisSection 3: PJM Load Forecast Model
Zone State(s) Metro Area Name(s) Census Division
ATSI PA, OH Akron OH, Cleveland-Elyria OH, Mansfield OH,Springfield OH, Toledo OH, Youngstown-Warren-Boardman OH-PA, Pittsburgh PA
East North Central
BGE MD Baltimore-Columbia-Towson MD South Atlantic
COMED IL Chicago-Naperville-Arlington Heights IL, Elgin IL,Kankakee IL, Lake County-Kenosha County IL-WI,Rockford IL
East North Central
DAY OH Dayton OH East North Central
DEOK OH Cincinnati OH-KY-IN East North Central
DLCO PA Pittsburgh PA Middle Atlantic
DOM VA Charlottesville VA, Harrisonburg VA, Richmond VA,Roanoke VA, Staunton-Waynesboro VA, VirginiaBeach-Norfolk-Newport News VA,
South Atlantic
DPL DE Dover DE, Wilmington DE-MD-NJ, Salisbury MD-DE South Atlantic
EKPC KY Cincinnati OH-KY-IN, Louisville/Jefferson County KY-IN, Elizabethtown-Fort Knox KY, Bowling Green KY,Lexington-Fayette KY, Huntington-Ashland WV-KY-OH
East South Central
JCPL NJ Camden NJ, Newark NJ-PA, Trenton NJ Middle Atlantic
METED PA Allentown-Bethlehem-Easton PA-NJ, EastStroudsburg PA, Gettysburg PA, Lebanon PA,Reading PA, York-Hanover PA,
Middle Atlantic
PECO PA Montgomery County-Bucks County-Chester CountyPA, Philadelphia PA
Middle Atlantic
PENLC PA Altoona PA, Erie PA, Johnstown PA Middle Atlantic
PEPCO MD Washington D.C., California-Lexington Park MD South Atlantic
PL PA Allentown-Bethlehem-Easton PA, Bloomsburg-Berwick PA, East Stroudsburg PA, Harrisburg-Carlisle PA, Lancaster PA, Scranton-Wilkes-Barre-Hazleton PA, Williamsport PA
Middle Atlantic
PS NJ Camden NJ, Newark NJ-PA, Trenton NJ Middle Atlantic
RECO NJ Newark NJ-PA Middle Atlantic
UGI PA Scranton-Wilkes-Barre-Hazleton PA Middle Atlantic
Exhibit 3: Assignment of Metropolitan Areas, Census Divisions and States to Zones
Revision: 31, Effective Date: 06/01/2016 PJM © 2017 25

PJM Manual 19: Load Forecasting and AnalysisSection 4: Weather Normalization and Coincident Peaks
Section 4: Weather Normalization and Coincident PeaksWelcome to the Weather Normalization and Coincident Peaks section of the PJM Manual forLoad Forecasting and Analysis. In this section you will find the following information:
• An overview of the weather normalization process (see “Weather NormalizationOverview”).
• A description of the weather normalization procedure (see “Weather NormalizationProcedure”).
• A description of the identification and calculation of PJM unrestricted coincident peaks(see “Peak Load Allocation (5CP)”).
4.1 Weather Normalization OverviewPJM performs load studies on summer and winter loads, for both coincident and non-coincidentpeaks, according to the procedures described below. The weather normalized (W/N) coincidentpeaks are used by EDCs to determine capacity peak load shares for wholesale and retailcustomers. W/N non-coincident peaks are provided by PJM for use by stakeholders in reviewingthe PJM load forecast.
4.2 Weather Normalization ProcedureFor non-coincident weather-normalized seasonal peaks, daily zonal peak loads on non-holidayweekdays for a three-year period (the study year and two prior years) are regressed against aseasonal weather variable. The seasonal weather variables are those used in the load forecastmodel (as described in Section 3.2). Regressions only include days in the heating/coolingrange (summer > 74 WTHI, winter < 45 WWP). A binary adjustment is applied for each of thetwo earlier years, to allow for load growth. The resulting regression equation is solved at eachzone’s weather standard, which is the average of the extreme seasonal weather variable valueson non-holiday weekdays for a period consistent with the load forecast.
To determine coincident zonal weather-normalized seasonal peaks, the results of the non-coincident process described above are adjusted by each zone’s average annual diversity to thePJM RTO seasonal peak over available history. The zonal values are summed to determine thePJM RTO seasonal weather-normalized peak.
EDC/ CSP Actions• Enter hourly load data into Power Meter as described in Section 2 of this manual.
• Provide resource-specific settlements data to quantify Load Management impacts intothe eLRS application
• Submit voltage reduction and loss of Load Drop Estimates as described in Attachment Aof this manual.
• Participate in review of seasonal load studies, through the Load Analysis Subcommittee.
PJM Actions• Obtain weather observations
Revision: 31, Effective Date: 06/01/2016 PJM © 2017 26

PJM Manual 19: Load Forecasting and AnalysisSection 4: Weather Normalization and Coincident Peaks
• Produce voltage reduction load drop estimates, as described in Attachment A of thismanual.
• Weather-normalize the zonal RTO-coincident winter and summer peak loads.
4.3 Peak Load Allocation (5CP)Zonal weather-normalized RTO-coincident summer peak loads are allocated to the wholesaleand retail customers in the zones using EDC-specific methodologies that typically employ thecustomer’s shares of RTO actual peaks. The resulting Peak Load Contributions are then used inthe determination of capacity obligations.
PJM establishes and publishes information, referred to as the 5CP, to aid EDCs in thecalculation of Peak Load Contributions (also known as “tickets”). For each summer:
• Hourly metered load and load drop estimate data are gathered for the period June 1through September 30
• RTO unrestricted loads are created by adding load drop estimates to metered load
• From the unrestricted values, the five highest non-holiday weekday RTO unrestricteddaily peaks (5CP) are identified
5CP data are typically released in mid-October.
Revision: 31, Effective Date: 06/01/2016 PJM © 2017 27

PJM Manual 19: Load Forecasting and AnalysisAttachment A: Load Drop Estimate Guidelines
Attachment A: Load Drop Estimate Guidelines
GeneralLoad Drop Estimates (also referred to as addbacks) are produced for three types ofoccurrences:
1. Curtailment of load for customers registered in the PJM emergency or pre-emergencyprogram either as a Load Management resource (Demand Resource) or an Emergency– Energy Only resource, or customers registered to meet a Price Responsive Demand(PRD) commitment for either the Reliability Pricing Model (RPM) or the FRR Alternative.
2. Voltage Reductions implemented by PJM or an EDC3. Significant losses of load.
PJM is responsible for producing Load Management/Emergency/Pre-Emergency load dropestimates, from CSP and EDC input into the appropriate PJM system. EDCs are responsible forreporting the estimated impact of voltage reductions (optional) or significant losses of load ontheir systems.PJM is responsible for producing PRD load drop estimates, from PRD Provider input into theappropriate PJM system. For purposes of 5CP identification, PRD Providers that registeredprice responsive demand to satisfy a PRD commitment for either RPM or FRR Alternative mustprovide PJM with meter data for a set of high load days to be identified by PJM by the end ofeach September. Meter data is entered at the site level; load drop estimates will be calculatedat the registration level. Load drop estimates will only be applied for Maximum EmergencyGeneration hours as well as for any 5CP hours when there was no Maximum EmergencyGeneration event.Load drop estimates are used to construct unrestricted loads used in the PJM Load ForecastModel, weather normalization of PJM seasonal peaks, and to calculate the unrestricted PeakLoad Contributions used in formulating capacity obligations.These rules also apply to Non-Retail Behind-the-Meter Generation as provided in Section G ofSchedule 6 to the Reliability Assurance Agreement.
Load Drop Estimates for Load Management CustomersThe table below summarizes the requirements for producing load drop estimates for customersregistered as a Demand Resource, or in the Emergency– Energy Only option, or as Economicload response, depending upon the cause of the load curtailment. Following the table aredescriptions of the methods used by PJM to calculate load drop estimates for each loadmanagement type (Legacy Direct Load Control, Firm Service Level, and Guaranteed LoadDrop).
Requirements for Production of Load Drop Estimates
Revision: 31, Effective Date: 06/01/2016 PJM © 2017 28

PJM Manual 19: Load Forecasting and AnalysisAttachment A: Load Drop Estimate Guidelines
Reason forLoad Drop
PJM-Initiated Emergencyor Pre-Emergency
or CSP-Initiated Test
Economic EDC- or CSP-Initiated
Emergency/Pre-Emergency Full(DR) or Emergency/Pre-EmergencyCapacity Only (DR)
Load Drop Estimatesmust be produced for anyinterruptions from June 1through September 30.
Load Drop Estimatesmust be produced for anysettled interruptions fromJune 1 through September30.
No Load DropEstimates required.
Emergency EnergyOnly
Load Drop Estimatesmust be producedfor any interruptionsduring Emergency/Pre-Emergency hours fromJune 1 through September30.
No Load Drop Estimatesrequired.
No Load DropEstimates required.
ProgramRegistration
Economic No Load Drop Estimatesrequired.
No Load Drop Estimatesrequired.
No Load DropEstimates required.
Actual Emergency and Pre-Emergency Load Response and Economic Load Response loadreductions for Load Management resources registered as Emergency Full or EmergencyCapacity Only resources which occur from June 1 through September 30, will be added back forthe purpose of calculating peak load for capacity for the following Delivery Year and consistentwith the load response recognized for capacity compliance as set forth in the Manual.
Non-Interval Metered Customers Including Legacy Direct Load ControlPrior to June 1, 2016: the nominated quantity (MW) of Load Management provided by non-interval metered customers * Loss Factor will be the estimated load drop added back tothe zone for a load management emergency, pre-emergency or test event. If the resourceparticipates as an economic resource, then the hourly MW settled under the economic programwill be used for the load drop that is added back to the zone. Non-interval metered customersmay not participate in Load Management under Legacy Direct Load Control (LDLC) after May31, 2016
Contractually InterruptibleThe estimated load drop for Firm Service Level and Guaranteed Load Drop customers iscalculated as follows unless it is for DR Capacity Performance, Base or Economic resourcefor non-summer period (October 1 through May 31 of following year). Non-summer capacityperformance will be determined for such resources and time period based on the economic CBLas described in Manual 11, section 10.
For Guaranteed Load Drop end-use customers, the lesser of (a) comparison load used tobest represent what the load would have been if PJM did not declare a Load Managementevent or the CSP did not initiate a test as outlined in the PJM Manuals, minus the metered load(“Load”) and then multiplied by the loss factor (“LF”) or (b) the current Delivery Year peak loadcontribution (“PLC”) minus the metered load multiplied by the loss factor (“LF”). A load reduction
Revision: 31, Effective Date: 06/01/2016 PJM © 2017 29

PJM Manual 19: Load Forecasting and AnalysisAttachment A: Load Drop Estimate Guidelines
will only be recognized for capacity compliance if the metered load multiplied by the loss factoris less than the current Delivery Year peak load contribution.
The calculation is represented by:
For Firm Service Level end-use customers the current Delivery Year peak load contribution(“PLC”) minus the metered load (“Load”) multiplied by the loss factor (“LF”).
The calculation is represented by:
Note:When Generation interval meter data is provided to determine test or event compliance, andinterval metering on load is available, the interval metered load data should be provided toensure load drop is below the PLC. It is expected that interval load data will be available for allcustomers that have a PLC > 0.5 MW. If no interval meter load data exists, such Generationinterval meter data multiplied by loss factor will be used as the estimated load drop.
Event Compliance for Guaranteed Load Drop (GLD) CustomersFor purposes of determining compliance with a PJM-initiated Load Management event or testfor Guaranteed Load Drop customers, several options are available to estimate comparisonloads. The method used should result in the best possible estimate of what load level wouldhave occurred in the absence of an emergency, pre-emergency or test event.
The CSP will be responsible for supplying all necessary load data to PJM in order to calculatethe load reduction for each registered end use customer. PJM will calculate the load dropamount unless otherwise indicated below or approved by PJM. The amount of load datarequired will depend on the GLD method selected where the minimum amount shall be 24 hoursfor one full calendar day.
Comparable Day: The customer’s actual hourly loads on one of the prior 10 calendar daysbefore the test or emergency or pre-emergency event day selected by the CSP which bestrepresents what the load level would have been absent the emergency or pre-emergency ortest event. The CSP may request use of an alternative day for extenuating circumstances withsupporting documentation that clarifies why the alternative day should be utilized. PJM mustapprove the use of any alternative day. CSP must provide usage data for all 10 days such thatPJM may validate an appropriate day was selected.
Same Day (Before/After Event): The customer’s average hourly integrated consumption fortwo full hours prior to notification of an emergency or pre-emergency event or prior to one fullhour before a test and for two full hours after skipping first full hour after the event or test. Thisoption is appropriate for high load factor customers with no weather sensitivity.
Customer Baseline: The Customer’s estimated baseline used to calculate load drops for PJMeconomic demand resources as defined on the applicable PJM economic registration.
Regression Analysis: The customer’s estimated hourly loads from a regression analysis of thecustomer’s actual loads versus weather. This option is appropriate for customers with significant
Revision: 31, Effective Date: 06/01/2016 PJM © 2017 30

PJM Manual 19: Load Forecasting and AnalysisAttachment A: Load Drop Estimate Guidelines
weather sensitivity. The CSP will perform the regression analysis and provide results includingsupporting information to PJM. The information should include all load and weather data andassociated regression statistics used to estimate the load impact on the event or test day.
Generation: The hourly integrated output from a generator used to provide Guaranteed LoadDrop. This method may only be utilized if the generation would not have otherwise beendeployed on the emergency or pre-emergency event or test day and must comply with theprovisions contained in the PJM Manuals.
Load Drop Estimates for PRD CustomersLoad Drop Estimates are applicable to price responsive demand registrations that are used tosatisfy a PRD commitment for either RPM or FRR Alternative. Load Drop Estimates are notapplicable to Energy Only PRD registrations.
For Maximum Emergency Generation hour or a 5CP hour without Maximum EmergencyGeneration:
Where:
Expected Peak Load PLC * Final Zonal Peak Load ForecastDY / Zonal Weather Normalized PeakDY-1
PLC Peak Load Contribution for the registration
DY Delivery Year
Missing DataIf an end use customer meter malfunctions during a Load Management test, retest oremergency or pre-emergency event and the end use customer performed the required loadreduction activity and no interval meter data is available to use for purposes of measuringcapacity compliance or to determine applicable energy settlements, then PJM may allow CSPone of the following two remedies, otherwise the end use customer will be considered to havetaken no load reduction actions during such period:
1. CSP may provide supporting information to quantify the load reduction amount whichincludes an engineering analysis or meter data from a comparable site that reduced loadbased on the same actions during a comparable time, or;
2. CSP may perform a separate test for the end use customer(s) to quantify the loadreduction that will be used for the test, retest or event time period compliance and, asappropriate, energy settlement(s). The test will need to be performed at comparable timeand conditions to when the test, retest or emergency or pre-emergency event occurred.
Remedies will only be considered if the CSP and associated metering entity followed GoodUtility Practice as outlined in the OATT, no interval load data is available from the EDC, and theCSP can provide supporting information, such as building automation system logs, to verify theload reduction action was taken during the test, or retest or emergency or pre-emergency eventwhen the meter malfunctioned. CSP must also provide evidence that the meter did malfunction.
PJM must approve any remedy and CSP must meet appropriate load data submission deadline.
Revision: 31, Effective Date: 06/01/2016 PJM © 2017 31

PJM Manual 19: Load Forecasting and AnalysisAttachment A: Load Drop Estimate Guidelines
Voltage ReductionWhenever a part of the PJM system experiences a voltage reduction, whether it is PJM- orlocally initiated, the distribution companies involved are to estimate its impact on hourly loadlevels. The estimated impact of a 5% voltage reduction will be 1.7% of the load in the affectedarea at the time of the voltage reduction. Variances from this guideline are acceptable in caseswhere a thorough analysis was performed. In such cases, a written explanation of the estimatemust accompany the reported values.
Loss of LoadWhenever a part of the PJM system experiences a loss of load event (beyond the level ofnominal localized outages), the Distribution Company involved is to estimate its impact onhourly load levels. The method used to estimate the impact of the loss of load event will varyby the circumstances involved, but the outcome of the estimation should represent the bestapproximation of the actual hourly loads that would have occurred if the loss of load event hadnot occurred. A written explanation of the loss of load event and how its impact was estimated isto accompany the report.
Revision: 31, Effective Date: 06/01/2016 PJM © 2017 32

PJM Manual 19: Load Forecasting and AnalysisAttachment B: Load Forecast Adjustment Guidelines
Attachment B: Load Forecast Adjustment GuidelinesThe intention of these guidelines is to ensure that any adjustments made to PJM’s load forecastmodel are properly identified, estimated, and reviewed prior to incorporation into the forecast.
Issue Identification• PJM annually solicits information from its member Electric Distribution Companies (EDC)
for large load shifts (either positive or negative) which are known to the EDC but may beunknown to PJM. PJM will send the request in mid-July with responses expected in timefor any proposed adjustments to be reviewed with the Load Analysis Subcommittee inOctober/November.
• Any other load changes which are brought to PJM’s attention.
Issue Verification – verify that identified issue is real and significant, using the followingmethods:
• Determine if the load change has been publically acknowledged through the media,press release, regulatory process, etc.
• Verify that requesting EDC has adjusted its own financial/planning forecast
• Ascertain that the load shift is related to a single site or a limited number of related sites(not a systemic cause)
• Discuss with economic forecast vendor(s) whether or not the load shift is reflected inits/their economic forecast(s). Also, determine if the requested load adjustment’s loadimpact is consistent with its economic impact. Additionally, determine if the requestedload adjustment is tied to any of the metro areas that PJM uses to define the economicvariable of a zone.
• Verify that any behind-the-meter generation adjustment has complied with PJM’s behind-the-meter process
• Determine adjustment’s significance, either by sheer magnitude or percentage of azone’s load.
Adjustment Estimation - for each identified and verified issue, estimate its impact on peak loadusing the following methods (which may be combined):
• Acquire load history for the load that has/will change and produce analysis to isolate theimpact (e.g., forecast runs with and without the load involved, trend analysis)
• Acquire any contracted amounts of load changes
• For any after-the-fact adjustments, review the zone’s forecast model’s residual pattern
• Review any available independent analysis of the impact of the load change.
Adjustment Review – each proposed load forecast adjustment will be reviewed with the LoadAnalysis Subcommittee prior to inclusion in the load forecast. The final decision on any loadadjustment is made by PJM.
Revision: 31, Effective Date: 06/01/2016 PJM © 2017 33

PJM Manual 19: Load Forecasting and AnalysisAttachment B: Load Forecast Adjustment Guidelines
Example 1: Loss of a Single Industrial LoadIssue Identification – in response to PJM’s annual solicitation for information regarding largeload shifts, a member EDC notified PJM that it was losing a large industrial load, which was aplant scheduled to shut down in a few months (and prior to the release of the next load forecast)Issue Verification – PJM reviewed the EDC’s request and through conference calls, e-mailexchanges, an EDC-provided case statement, and PJM independent investigation it wasdetermined that:
• The plant closing was widely reported in local media as well as by a press release fromthe end-use customer;
• The EDC had adjusted its own financial and planning forecasts to reflect a closure at theplant;
• The affected load was confined to one site/customer account.• The customer’s peak load was approximately 500 MW.
Additionally, PJM consulted with its economic forecast supplier and determined that theforecasts of metropolitan areas within the affected zone were not adjusted to reflect the plantclosure. Based on these findings, PJM concluded that the load shift was factual and material.Adjustment Estimation – PJM requested and received historical load data for the end-use customer. An attempt was made to separately model the zone’s peak load without thecustomer’s load in order to draw a comparison to the forecast of the zone’s full load. While themodel produced a reasonable result for the first forecast year (-370MW), the difference quicklyshrank and eventually became negative. As an alternative, the average daily peak over themodel’s estimation was computed. This value (-369 MW) was essentially equal to the differencebetween the two models in the first forecast years. PJM notified the EDC and members that thezone’s load forecast would be lowered by 370MW.
Example 2: Accelerating LoadIssue Identification – a member EDC proactively notified PJM that it was in the early stages ofpreparing to integrate a large amount of accelerating load associated with one industry through2023 and requested a face-to-face meeting to discuss the issue.Issue Verification – PJM met with the EDC and through follow-up conference calls, e-mailexchanges and PJM independent investigation it was determined that:
• The load in question was associated with greenfield construction and was confined to acluster of sites in one small area of the zone.
• The EDC had adjusted its own financial and planning forecasts to reflect the increasedload;
• The new load sites have the characteristic of an extremely low number of employees persite, and therefore have a peak load impact out of proportion to their economic impact.
• Expected growth in the next three years was already underway and contracts with theEDC, construction companies, and suppliers were in place.
PJM consulted with its economic forecast supplier to verify the claim that the new load wouldinvolve very little employment increases or other economic impact and that the forecasts ofmetropolitan areas within the affected zone were not adjusted to reflect the activity associated
Revision: 31, Effective Date: 06/01/2016 PJM © 2017 34

PJM Manual 19: Load Forecasting and AnalysisAttachment B: Load Forecast Adjustment Guidelines
with expected construction and on-going business. Based on these findings, PJM concludedthat the matter merited further review.Adjustment Estimation – the requesting EDC provided PJM with a third-party consultant’sreport analyzing the expected load expansion. The report detailed how the electric load in theindustry had expanded within the EDC zone and how the consultants had extrapolated thatgrowth to estimate the amount of peak load already incorporated into the PJM load forecast.Separately, a set of four forecast scenarios were generated to estimate the total industry load inthe zone’s subarea, representing 1) continuation of the historical trend established in the area;2) continuation of growth at a reduction of 15% from the historical trend established in the area;3) continuation of growth at the average industry expectation; and 4) continuation of growth at a45% reduction in historical trends. The estimated amount of peak load already contained in thePJM forecast was netted from each scenario forecast to derive the amount of load growth notcaptured in the PJM forecast.PJM was given access to the consultants who prepared the report, and through phone ande-mail reviewed the report and supplied questions to the consultants. PJM requested andreceived the detailed data used to generate the report’s analysis and replicated it. PJM staffthen reviewed the report and forecasts with PJM management. It was decided that the scenariobased on the 15% reduction from the historical trend was most likely and it was used asadjustments to the PJM forecast.
Revision: 31, Effective Date: 06/01/2016 PJM © 2017 35

PJM Manual 19: Load Forecasting and AnalysisAttachment C: Residential Non-Interval Metered Guidelines
Attachment C: Residential Non-Interval Metered GuidelinesStatistical sampling for residential customersResidential customers without interval metering may participate in the Synchronized Reserve,Capacity, and Energy markets using a statistical sample extrapolated to the population todetermine compliance and energy settlements. The sample data must be from the same timeinterval as the event being settled.
QualificationsA registration may participate using statistical sampling to determine compliance and energysettlements under the following conditions, and subject to PJM approval:
• The registration consists entirely of residential customers.
• Locations can be sampled to accurately reflect the population load data.
• Curtailment at each location uses Direct Load Control Technology.
• Synchronized Reserve: Locations otherwise qualify for participation in the SynchronizedReserve Market. Locations do not have meters that record load data at a period of 1minute or shorter.
• Economic Energy: Locations otherwise qualify for participation in the Economic EnergyMarkets. Locations do not have meters that record load data at a period of 1 hour orshorter.
• Load Management: Locations otherwise qualify for Load Management. Locations do nothave meters that record load data at a period of 1 hour or shorter.
Sample DesignSamples must be designed to achieve a maximum error of 10% at 90% confidence. Thelocations in the sample must be randomly selected from all the locations in the population group(a population group is a group of registrations that can share a sample based on the criterialisted below). The sample must be stratified by control device size (minimum of 2 strata) andgeographic location, unless otherwise approved by PJM.
For Load Management registrations that participate in the energy market, a sample is requiredfor each combination of EDC, CSP, end-use device (such as air conditioner or water heater) ordevice grouping, curtailment algorithm and switch vintage if there is substantial variation amonginstalled switch capability.
For economic registrations that participate in the Energy Markets, a sample is required for eachcombination of dispatch group or registration, end-use device or device grouping, curtailmentalgorithm, and switch vintage if switch capability is substantially different. For economicregistrations that participate in the Synchronized Reserve market, a sample is required for eachcombination of SR subzone, dispatch group or registration, end-use device or device grouping,curtailment algorithm, and switch vintage if switch capability is substantially different.
Sample Size DeterminationA variance study is used to determine the initial sample size. Interval data must be collectedfrom at least 75 randomly selected and stratified customers during the season the end use
Revision: 31, Effective Date: 06/01/2016 PJM © 2017 36

PJM Manual 19: Load Forecasting and AnalysisAttachment C: Residential Non-Interval Metered Guidelines
device is in use in order to determine the variance of the load data for the sample. SynchronizedReserves: At least 2 weeks of continuous meter data collected at a period of 1 minute orsmaller.
Load Management and Economic Energy: At least 4 weeks of continuous meter data collectedat a period of 1 hour or smaller.
The number of locations in the sample is then calculated as follows, unless otherwise approvedby PJM:
Calculate the mean and variance of the meter data across all customers for each interval:
Calculate the sample size necessary to get 10% error at 90% confidence for each interval:
Where
Take the average sample size across all intervals to determine M, the sample size:
Where T is the total number of intervals. T should be at least 20,160 for SR (2 weeks of 1minute intervals) and 672 for economic energy and Load management (4 weeks of hourlyintervals).
Alternate calculations may be used subject to PJM approval.
Sample RecalibrationThe sample must be recalibrated annually as follows:
1. The sample size must be recalculated using the same method listed above using datafrom all locations in the sample.
2. If the population was expanded in a non-random manner, the sample must be expandedappropriately, so that the sample is representative of the population.
Revision: 31, Effective Date: 06/01/2016 PJM © 2017 37
PJM Manual 19: Load Forecasting and AnalysisAttachment C: Residential Non-Interval Metered Guidelines
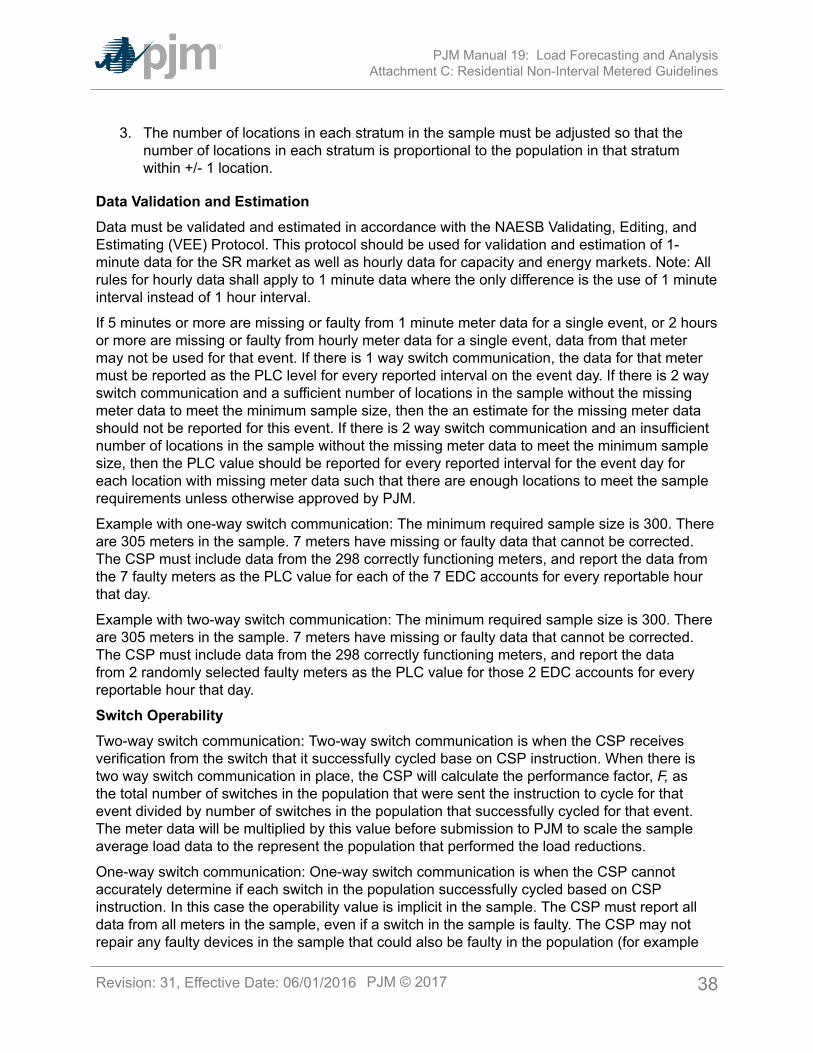
3. The number of locations in each stratum in the sample must be adjusted so that thenumber of locations in each stratum is proportional to the population in that stratumwithin +/- 1 location.
Data Validation and EstimationData must be validated and estimated in accordance with the NAESB Validating, Editing, andEstimating (VEE) Protocol. This protocol should be used for validation and estimation of 1-minute data for the SR market as well as hourly data for capacity and energy markets. Note: Allrules for hourly data shall apply to 1 minute data where the only difference is the use of 1 minuteinterval instead of 1 hour interval.
If 5 minutes or more are missing or faulty from 1 minute meter data for a single event, or 2 hoursor more are missing or faulty from hourly meter data for a single event, data from that metermay not be used for that event. If there is 1 way switch communication, the data for that metermust be reported as the PLC level for every reported interval on the event day. If there is 2 wayswitch communication and a sufficient number of locations in the sample without the missingmeter data to meet the minimum sample size, then the an estimate for the missing meter datashould not be reported for this event. If there is 2 way switch communication and an insufficientnumber of locations in the sample without the missing meter data to meet the minimum samplesize, then the PLC value should be reported for every reported interval for the event day foreach location with missing meter data such that there are enough locations to meet the samplerequirements unless otherwise approved by PJM.
Example with one-way switch communication: The minimum required sample size is 300. Thereare 305 meters in the sample. 7 meters have missing or faulty data that cannot be corrected.The CSP must include data from the 298 correctly functioning meters, and report the data fromthe 7 faulty meters as the PLC value for each of the 7 EDC accounts for every reportable hourthat day.
Example with two-way switch communication: The minimum required sample size is 300. Thereare 305 meters in the sample. 7 meters have missing or faulty data that cannot be corrected.The CSP must include data from the 298 correctly functioning meters, and report the datafrom 2 randomly selected faulty meters as the PLC value for those 2 EDC accounts for everyreportable hour that day.
Switch OperabilityTwo-way switch communication: Two-way switch communication is when the CSP receivesverification from the switch that it successfully cycled base on CSP instruction. When there istwo way switch communication in place, the CSP will calculate the performance factor, F, asthe total number of switches in the population that were sent the instruction to cycle for thatevent divided by number of switches in the population that successfully cycled for that event.The meter data will be multiplied by this value before submission to PJM to scale the sampleaverage load data to the represent the population that performed the load reductions.
One-way switch communication: One-way switch communication is when the CSP cannotaccurately determine if each switch in the population successfully cycled based on CSPinstruction. In this case the operability value is implicit in the sample. The CSP must report alldata from all meters in the sample, even if a switch in the sample is faulty. The CSP may notrepair any faulty devices in the sample that could also be faulty in the population (for example
Revision: 31, Effective Date: 06/01/2016 PJM © 2017 38

PJM Manual 19: Load Forecasting and AnalysisAttachment C: Residential Non-Interval Metered Guidelines
an air conditioner cycling switch cannot be repaired/replaced but a 1-minute meter could berepaired/replaced) unless the CSP repairs/replaces those same devices that are faulty in thepopulation. Switch failure in the sample must be reported to PJM within 2 business days.
Converting sample data to meter data
Note:Note that the sample data must be from the same time interval being settled.
Xi,t is the meter reading for customer i during interval t after VEE protocol isapplied per this manual
B is the set of EDC accounts in sample that are to be included in estimation (aftersubject to rules in this manual
Ms is the sample size (number of EDC accounts in B)
Mc is the population of Cycled customers
F is the operability factor, calculated subject to this manual (1 for one way switchcommunication)
The meter data value to be submitted to PJM for interval t is Yt:
Measurement and Verification PlanThe CSP must submit a Measurement and Verification (M&V) plan to PJM before theregistration is submitted. The M&V plan must be approved by PJM before the registration issubmitted. CSP is to resubmit an updated M&V plan annually to continue participation in thePJM markets.
The M&V plan must include details on: how the variance study was conducted and sample sizewas determined; sample selection and stratification; meter qualification and quality assurance;data validation and error correction protocol; and how sample meter data will be converted topopulation meter data. A template of the M&V plan is to be published on pjm.com.
Churn and Customer Documentation
Note:Parts of this section apply to interval metered residential customers, as indicated below.
Applicable to all residential customer registrations (interval metered and non-interval metered):
• CSP to submit initial list of customers to PJM at time of registration, including all EDCaccount numbers PLCs and zip codes. Where legal or regulatory conditions prohibitprovision of EDC account number as personally identifiable customer information theEDC may use unique identifying numbers for EDC account numbers, through 5/31/16or as otherwise approved by PJM. EDC is responsible to maintain list of EDC account
Revision: 31, Effective Date: 06/01/2016 PJM © 2017 39

PJM Manual 19: Load Forecasting and AnalysisAttachment C: Residential Non-Interval Metered Guidelines
numbers and associated unique identifying numbers when used. EDC may need tocheck for duplicate as approved by PJM.
• Replacement allowed for customer who moves from their premises or customerterminates contract with CSP.
• CSP must maintain list of all replacement and furnish to PJM within 2 business days ofrequest.
• CSP must maintain list of customers who were cycled during an event.
• All customer lists, meter data, and documentation must be furnished to PJM within 2business days of request and be maintained by CSP for 2 years.
Applicable to interval-metered Load Management:
• CSP to submit list of PLC values for each EDC account at time of registration.
• Replacement customers must be selected to maintain PLC and load drop.
• CSP must maintain list of customers for each event and maintain for 2 years from eventdate.
• CSP may not add/remove customers (other than replacement). If number of customersfalls below registered number, CSP must report to PJM within 2 business days and issubject to RPM Resource Deficiency Charges if applicable.
Applicable to non-interval metered Load Management:
• CSP to submit list of PLC values for each EDC account at time of registration.
• Replacement customers must be randomly selected to maintain integrity of strata, and ifapplicable PLC and load drop.
• CSP must maintain list of customers for each event and maintain for 2 years from eventdate.
• CSP may not add/remove customers (other than replacement). If the number ofcustomers falls below registered number, CSP must report to PJM within 2 businessdays and is subject to RPM Resource Deficiency Charges if applicable.
Applicable to interval metered Economic Energy and Synchronized Reserve:
• There are no restrictions on replacement customers since actual meter data issubmitted.
• CSP must maintain list of customers for each offer for 2 years from date of offer.
• CSP may add/remove customers at any time, but must maintain documentation andupdate the value on the location in eLRS. This value must be accurate every day anoffer is submitted.
• List of offered customers must be finalized at time of offer. Number of offered customerscannot exceed number of customers on location.
Applicable to non-interval metered Economic Energy and Synchronized Reserve:
Revision: 31, Effective Date: 06/01/2016 PJM © 2017 40

PJM Manual 19: Load Forecasting and AnalysisAttachment C: Residential Non-Interval Metered Guidelines
• Replacement customers must be randomly selected to maintain the integrity of thestrata.
• CSP must maintain list of customers for each offer for 2 years from date of offer.
• CSP may add/remove customers at any time, if it can be done such that the sampleremains representative of the population. CSP must maintain documentation and updatethe value on the location in eLRS. This value must be accurate every day an offer issubmitted.
• If CSP offers partial list of customers to market, then such customers must be randomlyassigned from pool of all registered customers. List of offered customers must befinalized at time of offer. Number of offered customers cannot exceed number ofcustomers on location.
Revision: 31, Effective Date: 06/01/2016 PJM © 2017 41

PJM Manual 19: Load Forecasting and AnalysisRevision History
Revision HistoryRevision 30 (12/01/2015):
• Added the following changes that were endorsed at the MRC on 12/01/2015 but wereomitted from the final version:
o Section 3 - distributed solar generation is now reflected in the historical load used forzonal models and a separate solar forecast is used to adjust zonal forecasts.
Revision 29 (12/01/2015):• Section 3: This extensive revision incorporates changes to the load forecast model to
add variables to account for trends in appliance usage and energy efficiency, revisions inweather variables, and the introduction of an autoregressive error correction. It also addsassignment of Census Divisions to zones and updates the assignments of economicregions and weather stations to zones. Section 4: the weather normalization procedureused for coincident and non-coincident peaks has been revised. This revision serves asthe required periodic review of the Manual.
Revision 28 (08/03/2015):• Conforming revisions for FERC Order ER15-1849, accepted on 7/23/15 and effective
8/3/15, to improve measurement and verification procedures for CSPs with ResidentialDemand Response Customers. Direct Load Control is re-defined as Legacy Direct LoadControl and is only effective through May 31, 2016. Statistical sampling may be usedinstead of customer-specific measurement and verification information for residentialcustomers without interval metering, as outlined in Attachment D of this manual.
Revision 27 (03/26/2015):• Section 3.2: Revised DR forecast methodology
Revision 26 (11/01/2014):• Section 3: Revised to clarify the current process of applying adjustments to load
forecasts.
• Attachment C: Added to provide guidelines for load forecast adjustments and examples.
Revision 25 (06/01/2014):• Conforming revisions for FERC Order ER14-822, accepted on 05/09/2014, and effective
on 06/01/2014 for various DR operational changes.
• Attachment A updated for new distinction between Emergency and Pre-Emergency DR.
Revision 24 (04/11/2014):• Two of the eSuite Applications have been renamed. Moving forward EES will be known
as ExSchedule and eMTR will be known as Power Meter.
Revision 23 (6/1/2013):
Revision: 31, Effective Date: 06/01/2016 PJM © 2017 42

PJM Manual 19: Load Forecasting and AnalysisRevision History
• Section 3: Exhibits 2 and 3 revised to reflect updated economic and weather stationmappings. The definition of winter load management is revised.
• Attachment B; added specific requirements for load management switch operabilitystudies.
Revision 22 (2/28/2013):• Administrative Change: update all references of “eSchedule” to “InSchedule”
Revision 21 (10/01/2012):• Attachment A revised to add guidelines for load drop estimates for Price Responsive
Demand participants.
Revision 20 (06/28/2012):• Attachment A updated based on PJM Interconnection, L.L.C., Docket No. ER11-3322
(Capacity measurement and verification). This tariff and RAA update specifically requiresGLD to provide reductions below the PLC and aligns any recognized reductions used todetermine capacity compliance with add back process.
Revision 19 (02/23/2012):• Attachment A changed to update Comparable Day definition, clarify data required if
Generation data is used to substantiate load reduction and have PJM perform thecompliance calculation.
Revision 18 (11/16/2011):• Section 3: Revisions reflect adoption of Itron, Inc recommendations regarding the
economic driver used in the load forecast model. References to the now-defunctInterruptible Load for Reliability option of Load Management were removed.
Revision 17 (07/14/2011):• Attachment A: 24 hour data submission required and additional clarification for use of
generation data to substantiate compliance (FERC Docket #: ER11-2898-000, 4/18/11).Also added revisions concerning how add backs are applied to DLC as approved by theMRC.
Revision 16 (04/01/2011):• Section 3: Integrated the description of the net energy forecast model into the general
model description.
• Revised Exhibits 2 and 3 to reflect updated economic and weather station mappings.
• Attachment A: Revised load drop estimate guidelines based on Load Management TaskForce proposal approved at November 2010 Markets and Reliability Committee andJanuary 2011 Members Committee. Corresponding tariff language changes were filedwith FERC under Docket ER11-2898-000.
Revision: 31, Effective Date: 06/01/2016 PJM © 2017 43

PJM Manual 19: Load Forecasting and AnalysisRevision History
Revision 15 (10/01/2009):• Attachment A: Revised load drop estimate guidelines to reflect the FERC-approved
business rules. Section 3: added price responsive demand to the adjustments made tothe load forecast.
Revision 14 (12/01/2008):• Section 3: Revised load forecast model specification to allow for a load adjustment
dummy variable. Clarified the review and approval process for the Load Forecast Report.
• Section 4: Revised the Weather Normalization approval process to clarify that Boardapproval is not required.
Revision 13 (06/01/2008):• A new Exhibit 1 was added, presenting definitions of variables used in the load forecast
model. Other exhibits were re-numbered.
• Exhibit 2 was revised to reflect a new weather station assignment for the DAY zone.
• Section 4: Removed note from Weather Normalization Procedure description (theprocess is finalized).
• Attachment A: Revised to reflect that the guidelines apply to both capacity- and energy-related load drop estimates.
Revision 12 (06/01/2007):• Removed Section 3 and moved content to Manual 18.
• Removed Section 7 and moved content to Manual 18.
Revision 11 (06/01/07):• This extensive revision incorporates changes to Load Data Systems due to the
implementation of the Reliability Pricing Model (RPM). Sections on Active LoadManagement and Qualified Interruptible Load have been replaced with a new LoadManagement section. The Zonal Scaling Factor section reflects a revised calculation.The Load Forecast Model section has been updated for enhancements made to themodel specification as well as revised coincident peak forecast method. The WeatherNormalization section was revised to reflect that seasonal peaks are now normalizedusing the load forecast model.
Revision 10 (06/01/06):• Exhibit 1—Updated to include the new Manual 30: Alternative Collateral Program.
• Section 3—Revised to reflect changes in the handling of outlier observations in weathernormalization of seasonal peaks.
• Section 4—Revised to incorporate the addition of the Full Emergency option of LoadResponse.
• Updated the penalties/rewards section under Compliance.
Revision: 31, Effective Date: 06/01/2016 PJM © 2017 44

PJM Manual 19: Load Forecasting and AnalysisRevision History
Revision 09 (01/01/06):• This revision includes a complete revision to Section 6 to detail the PJM-produced load
forecast which will be used for capacity and system planning purposes. The previousSection 3 (PJM Load Forecast Report) has been removed since Member input is nolonger required for its production.
Revision 08 (06/01/05):• Updated Exhibit 1 to include new PJM Manuals.
• This revision includes changes to Section 3 to reflect reporting requirements for sub-Zones. Section 4 was completely revised to reflect a new weather normalization methodand revised basis for calculating 5CPs. Section 8 has been modified to reflect revisedrelease dates for Zonal Scaling Factors.
Revision 07 (07/01/04):• This revision includes changes to Section 2, to reflect that 500kV generation will be
treated differently in the PJM Western and Southern regions than the Mid-AtlanticRegion. Section 4 was revised to reflect that peak load allocation will be impactedfor market integration. Section 5 has been modified to reflect that the Active LoadManagement program has been fully incorporated into the eCapacity application.
Revision 06 (10/01/03):• This revision incorporates a new presentation format. Substantive changes were
made to Section 4, to reflect changes in peak normalization procedures. Section 5and Attachment B were revised to reflect the change in load research requirements forcycling programs to a five year cycle. The previous Section 6 (Forecast Peak PeriodLoad) has been deleted. The section on Qualified Interruptible Load now reflects that itis the same as Active Load Management. New sections have been added for the PJMEntity Forecast and Zonal Scaling Factors. Attachment A includes an additional loaddrop estimate technique, Customer Baseline. Throughout the document, changes weremade to reflect the new committee structure, and the Board of Managers enhancedauthority.
• Changed all references from “PJM Interconnection, L.L.C.” to “PJM.”
• Changed all references from “the PJM OI” to “PJM.”
• Renamed Exhibits to consecutive numbering.
• Reformatted to new PJM formatting standard.
• Renumbered pages to consecutive numbering.
Revision 05 (01/01/03):• This revision contains changes to Section 2, which was revised to reflect that hourly load
data are reported through the new Power Meter application. Section 5 was revised toclarify wording on existing Active Load Management rules and procedures.
Revision: 31, Effective Date: 06/01/2016 PJM © 2017 45

PJM Manual 19: Load Forecasting and AnalysisRevision History
Revision 04 (06/01/02):• This revision contains changes to Section 3, which was revised to reflect a new reporting
format for the PJM Load Forecast Report. Section 7 was revised to incorporate firm levelcustomers into the Qualified Interruptible Load program.
Revision 03 (01/01/02):• This revision incorporates changes resulting from the addition of PJM West into the
Interconnection. Section 4 was revised to add a description of the peak normalizationprocess for PJM West. Sections 6 (Qualified Interruptible Load) and 7 (Forecast PeriodPeak Load) were added.
Revision 02 (10/01/00):• This revision contains changes to Section 4 to include a clarification of the weather
normalization overview, and revises the summer season weather normalization to reflectthe newly adopted PJM summer weather parameter. Also, the removal of AttachmentA: Definitions and Abbreviations. Attachment A is being developed into a ‘new’ PJMManual for Definitions and Abbreviations (M-35). Attachments B, C, and D have beenrenamed A, B, and C respectively. Also, changes to the ‘new’ Attachment A: ALM LoadDrop Estimate Guidelines (previously listed as Attachment B) have been in effect since6/01/00; however, they are now being addressed in this revision.
Revision 01 (06/01/00):• This revision contains changes to Sections 3, 4, and 5, to reflect the influence of retail
choice, including the creation of a peak allocation, revamped Active Load Managementrules and procedures, and revamped PJM Load Forecast Report. Also, it details arevised weather normalization procedure.
Revision 00 (07/15/97):• This revision is the complete draft of the PJM Manual for Load Data Systems.
Revision: 31, Effective Date: 06/01/2016 PJM © 2017 46