p.k. champati ray and r.c. lakhera indian institute of ...adpc.net/casita/university...
TRANSCRIPT
1
Spatial Predictive Models for Landslide Hazard Assessment using Geographic Information System
and Remote Sensing Techniques
P.K. Champati ray and R.C. LakheraIndian Institute of Remote Sensing 4-Kalidas Road, Dehradun-248001
CASITA, 18 March 2003
Most popularly, “Natural hazard” is defined as the probability of occurrence of a potentially damaging phenomena within a given area and in a given period of time (Varnes, 1984).
It incorporates three components: magnitude, gepgraphical location and time
Zonation – The division of land into homogeneous areas or domains and their ranking according to degrees of actual/potential hazard caused by mass movements (Varnes, 1984).
Landslide hazard is typically depicted on maps which show spatial distribution of hazard classes, or “landslide hazard zonations.”
Demarcation or mapping of these zones requires knowledge of the processes active in the area and factors (geologic and triggering) causing landslides.
Landslide hazard assessment – Definition and Scope
2
Normally, a slope instability hazard zonation consists of two different aspects (van Westen, 1993, 1994):
• the assessment of the susceptibility of the terrain for landslides, expressing the likelihood that a landslide might occur under thegiven terrain conditions or parameters.
• the determination of the probability that a triggering event occurs, such as major rainfall events or earthquakes. A relation is made between the magnitude and return period of the triggering event and the occurrence of landslides, either through historical studies or through physical models.
Therefore, the term landslide hazard map refers to a quantitative prediction of the spatial distribution of landslides (all types) and slopes which are likely to be site of failures; which may occur within a time period defined from information that is not directly incorporated in the model
Landslide hazard assessment – Definition and Scope
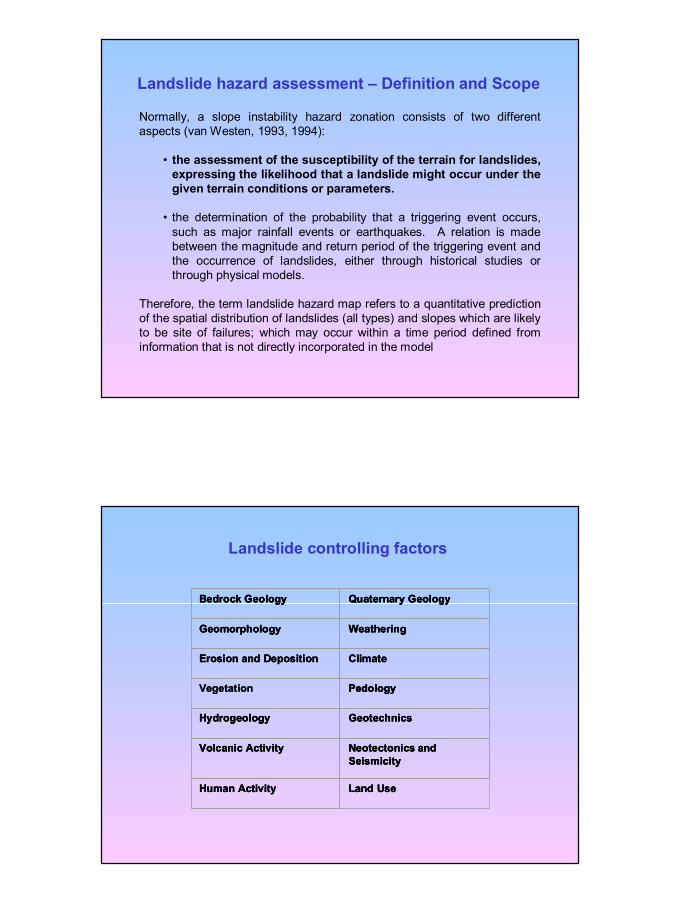
Landslide controlling factors
Bedrock Geology Quaternary Geology
Geomorphology Weathering
Erosion and Deposition Climate
Pedology
Hydrogeology Geotechnics
Volcanic Activity Neotectonics andSeismicity
Human Activity Land Use
Bedrock GeologyBedrock Geology Quaternary GeologyQuaternary Geology
GeomorphologyGeomorphology WeatheringWeathering
Erosion and DepositionErosion and Deposition ClimateClimate
VegetationVegetation PedologyPedology
HydrogeologyHydrogeology GeotechnicsGeotechnics
Volcanic ActivityVolcanic Activity Neotectonics andSeismicityNeotectonics andSeismicity
Human ActivityHuman Activity Land UseLand Use
3
Methods for Landslide Hazard Zonation
Direct MethodDirect Method
Knowledge driven
Multivariatetechniques
Weights of evidence
Indirect MethodIndirect Method
Information value method
Data driven(statistical)
Geomorphologicalmapping
Fuzzy logic
Certainty factor
Landslide distribution
analysis
Analytical Hierarchy Process
Deterministic Modelling
NEWMARK
SHALSTAB
Dempster-ShaferBelief Theory
Index overlay
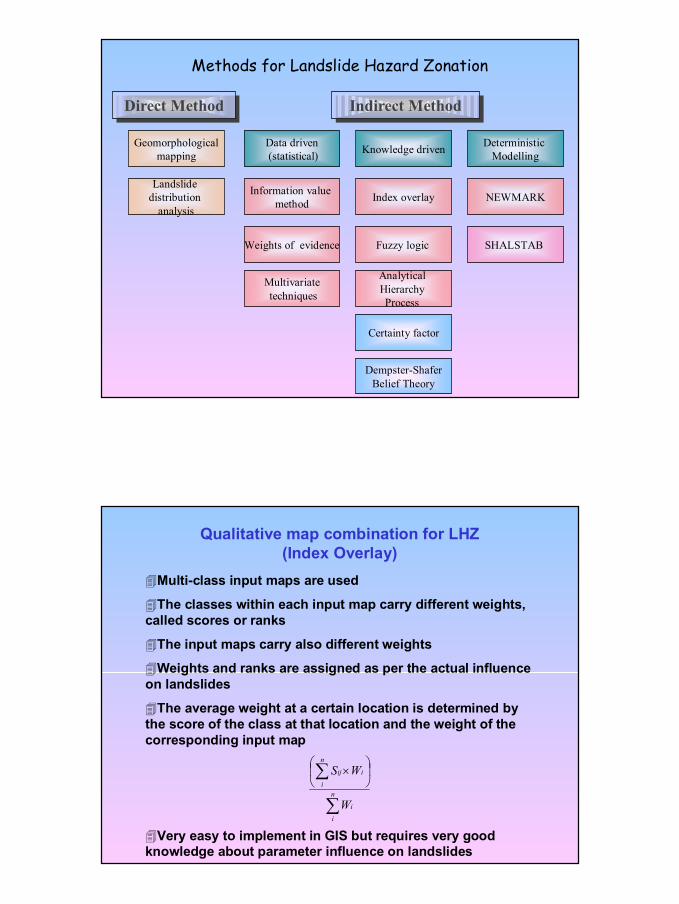
Qualitative map combination for LHZ(Index Overlay)
Multi-class input maps are used
The classes within each input map carry different weights, called scores or ranks
The input maps carry also different weights
Weights and ranks are assigned as per the actual influence on landslides
The average weight at a certain location is determined by the score of the class at that location and the weight of the corresponding input map
Very easy to implement in GIS but requires very good knowledge about parameter influence on landslides
∑
∑
×
n
i
i
n
i
iij
W
WS
4
Information Value Method
• nmap = total number of pixels in the map• nslide = total number of landslide pixels• nclass = number of pixels in each class• nslclass = number of pixels with landslides in a class
• Positive values indicate strong correlation with landslides• Negative values indicate negative correlation with landslides• Values around 0 indicate uncertainty or no evidence• Simplistic method, very easy to implement in GIS• Unsuitable for areas lacking known landslides
Prior probability = nslide / nmapInformation value = log((nslclass / nclass) / Pr. prob.)
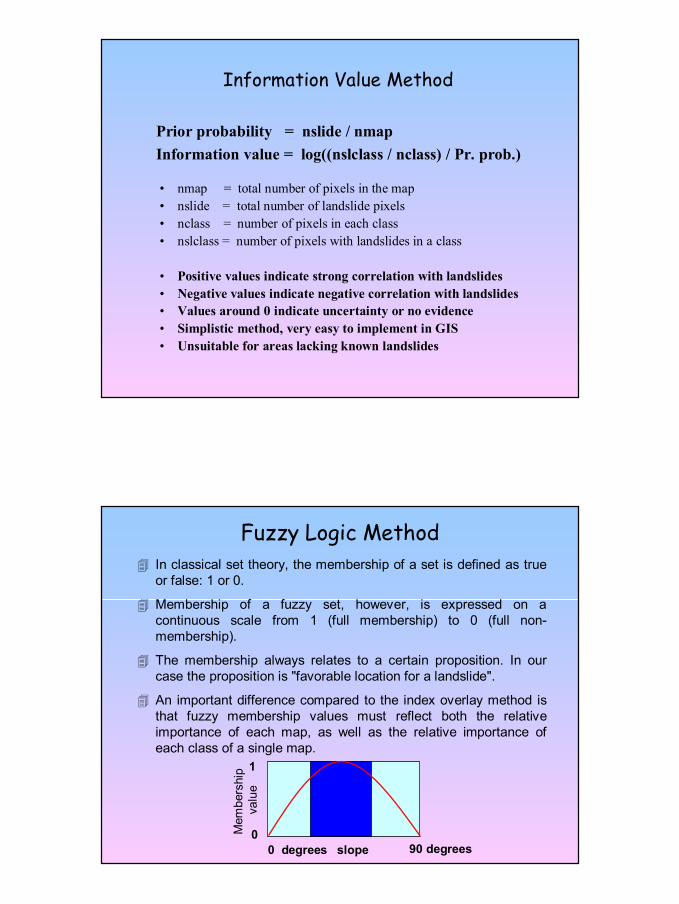
In classical set theory, the membership of a set is defined as true or false: 1 or 0.
Membership of a fuzzy set, however, is expressed on a continuous scale from 1 (full membership) to 0 (full non-membership).
The membership always relates to a certain proposition. In our case the proposition is "favorable location for a landslide".
An important difference compared to the index overlay method is that fuzzy membership values must reflect both the relative importance of each map, as well as the relative importance of each class of a single map.
Fuzzy Logic Method
0
1
0 degrees slope 90 degrees
Mem
ber s
hip
valu
e
5
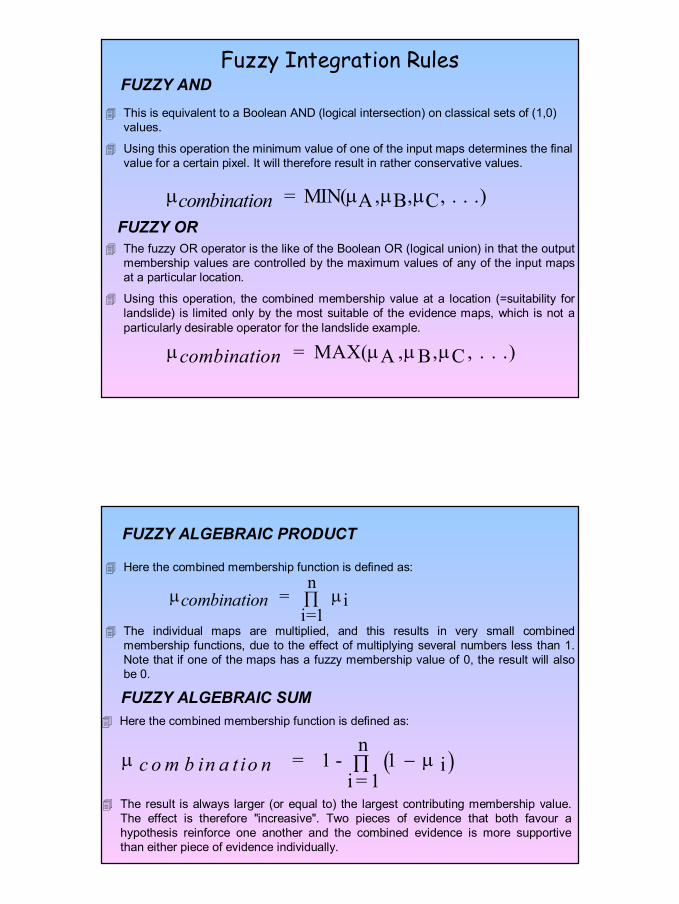
This is equivalent to a Boolean AND (logical intersection) on classical sets of (1,0) values.
Using this operation the minimum value of one of the input maps determines the final value for a certain pixel. It will therefore result in rather conservative values.
Fuzzy Integration Rules
combinationµ µ µ µ= MIN( A, B, C, . . .)
FUZZY AND
FUZZY ORThe fuzzy OR operator is the like of the Boolean OR (logical union) in that the output membership values are controlled by the maximum values of any of the input maps at a particular location.
Using this operation, the combined membership value at a location (=suitability for landslide) is limited only by the most suitable of the evidence maps, which is not a particularly desirable operator for the landslide example.
combinationµ µ µ µ= MAX( A , B, C , . . .)
Here the combined membership function is defined as:
FUZZY ALGEBRAIC PRODUCT
The individual maps are multiplied, and this results in very small combined membership functions, due to the effect of multiplying several numbers less than 1. Note that if one of the maps has a fuzzy membership value of 0, the result will also be 0.
combinationµ µ = i=1
n i∏
Here the combined membership function is defined as:
The result is always larger (or equal to) the largest contributing membership value. The effect is therefore "increasive". Two pieces of evidence that both favour a hypothesis reinforce one another and the combined evidence is more supportive than either piece of evidence individually.
( )c o m b in a t io nµ 1 − µ = 1 -i = 1
ni ∏
FUZZY ALGEBRAIC SUM
6
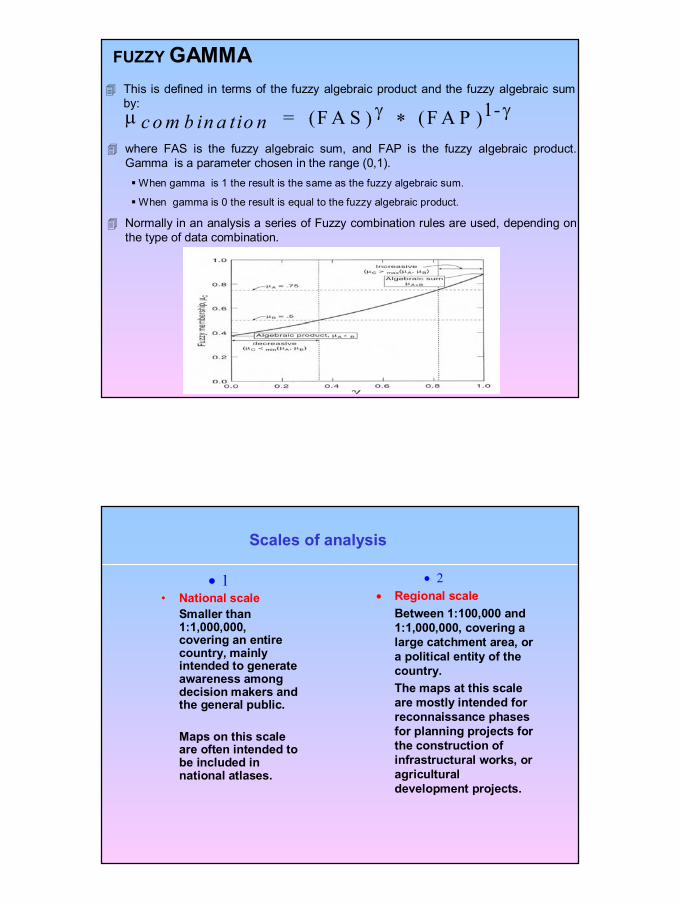
This is defined in terms of the fuzzy algebraic product and the fuzzy algebraic sum by:
FUZZY GAMMA
where FAS is the fuzzy algebraic sum, and FAP is the fuzzy algebraic product. Gamma is a parameter chosen in the range (0,1).
When gamma is 1 the result is the same as the fuzzy algebraic sum.
When gamma is 0 the result is equal to the fuzzy algebraic product.
Normally in an analysis a series of Fuzzy combination rules are used, depending on the type of data combination.
c o m b in a tio nµ γ γ = (F A S ) (F A P 1-)∗
Scales of analysis
• 1• National scale
Smaller than 1:1,000,000, covering an entire country, mainly intended to generate awareness among decision makers and the general public.
Maps on this scale are often intended to be included in national atlases.
• 2• Regional scale
Between 1:100,000 and 1:1,000,000, covering a large catchment area, or a political entity of the country. The maps at this scale are mostly intended for reconnaissance phases for planning projects for the construction of infrastructural works, or agricultural development projects.
7
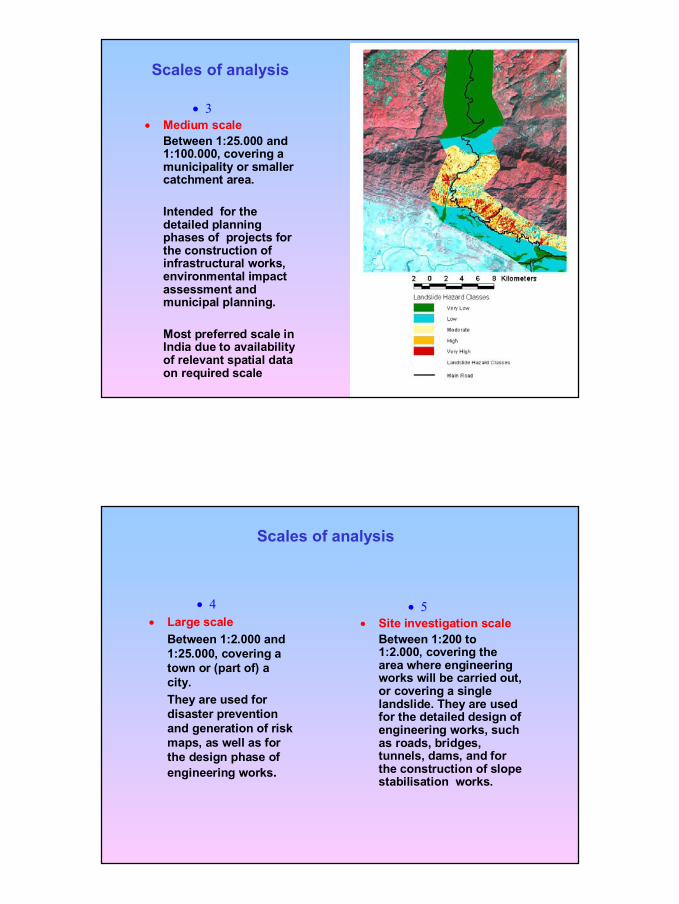
• 3• Medium scale
Between 1:25.000 and 1:100.000, covering a municipality or smaller catchment area.
Intended for the detailed planning phases of projects for the construction of infrastructural works, environmental impact assessment and municipal planning.
Most preferred scale in India due to availability of relevant spatial data on required scale
Scales of analysis
• 4• Large scale
Between 1:2.000 and 1:25.000, covering a town or (part of) a city. They are used for disaster prevention and generation of risk maps, as well as for the design phase of engineering works.
Scales of analysis
• 5• Site investigation scale
Between 1:200 to 1:2.000, covering the area where engineering works will be carried out, or covering a single landslide. They are used for the detailed design of engineering works, such as roads, bridges, tunnels, dams, and for the construction of slope stabilisation works.

8
Disaster Management Framework:Landslide hazard zonation maps are required at large scale i.e 1:25,000 or even larger for urban planning and disaster management
Current situation: • LHZ Maps for very limited areas on 1:25,000 scale along
major roads have been generated in an organisedmanner under National Landslide Project using Remote Sensing (Optical) and GIS.
• Many more critical areas to be covered under similar programme
Tasks/ responsibilities of various organisations: • Landslide inventory • Landslide hazard maps on 1:25,000 or larger for
urban/ infrastructure planning• Early warning/ hazard mitigation strategy development
Landslide hazard Assessment – Indian Scenario
• Direct mapping of landslides and associated mass wasting features
• Mapping of old and potential landslide areas• Derivation of information on causative factors of landslides• Landslide displacement/ movement measurement
Earth Observation Tools/Techniques
• Aerial photography • Satellite and RADAR images• Interferometry • Digital photogrammetry
Role of EO techniques in Landslide Studies

9
Field & Satellite image Of
Earthquake Induced Rock Fall
AroundGopeshwar, Uttaranchal
Field & satellite view Of Rotational slide
At Kandey, Uttaranchal
10
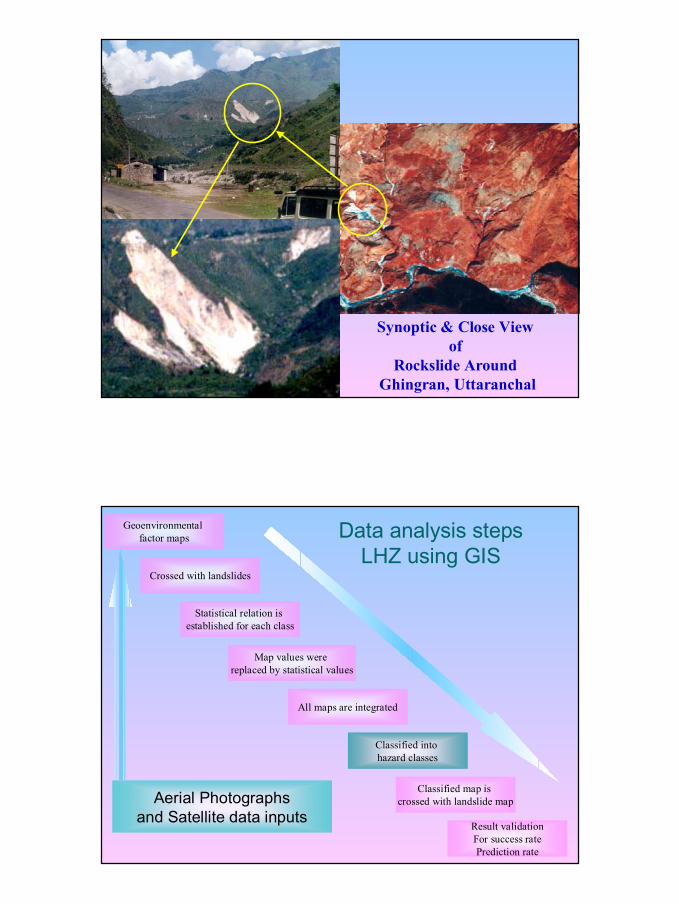
Synoptic & Close Viewof
Rockslide AroundGhingran, Uttaranchal
Data analysis stepsLHZ using GIS
Geoenvironmental factor maps
Map values were replaced by statistical values
Crossed with landslides
Statistical relation is established for each class
Classified map is crossed with landslide map
Classified into hazard classes
All maps are integrated
Result validationFor success ratePrediction rate
Aerial Photographsand Satellite data inputs
11
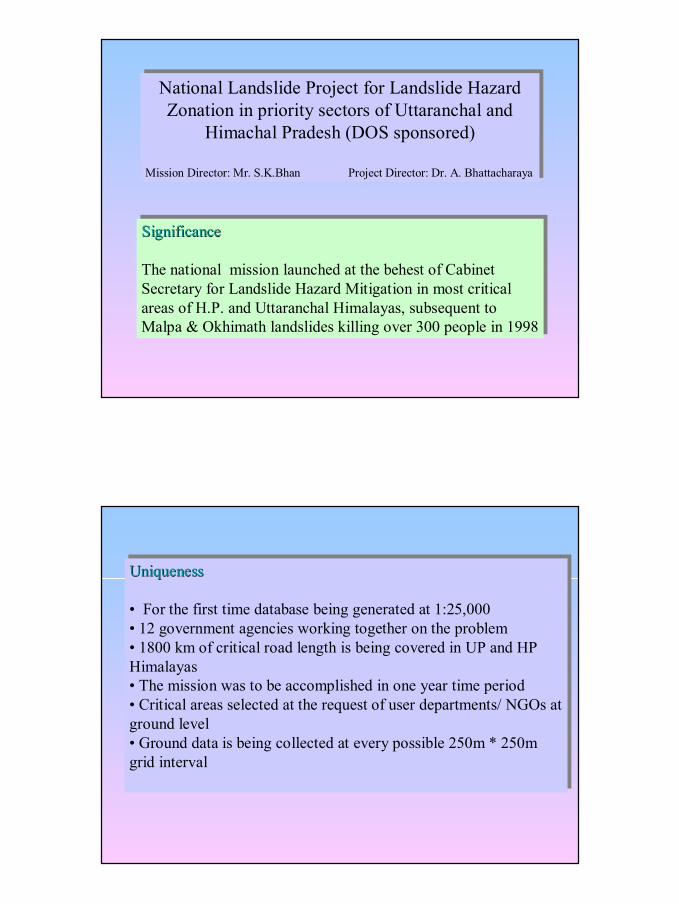
Significance
The national mission launched at the behest of Cabinet Secretary for Landslide Hazard Mitigation in most critical areas of H.P. and Uttaranchal Himalayas, subsequent to Malpa & Okhimath landslides killing over 300 people in 1998
SignificanceSignificance
The national mission launched at the behest of Cabinet Secretary for Landslide Hazard Mitigation in most critical areas of H.P. and Uttaranchal Himalayas, subsequent to Malpa & Okhimath landslides killing over 300 people in 1998
National Landslide Project for Landslide Hazard Zonation in priority sectors of Uttaranchal and
Himachal Pradesh (DOS sponsored)
Mission Director: Mr. S.K.Bhan Project Director: Dr. A. Bhattacharaya
National Landslide Project for Landslide Hazard Zonation in priority sectors of Uttaranchal and
Himachal Pradesh (DOS sponsored)
Mission Director: Mr. S.K.Bhan Project Director: Dr. A. Bhattacharaya
Uniqueness
• For the first time database being generated at 1:25,000• 12 government agencies working together on the problem• 1800 km of critical road length is being covered in UP and HP Himalayas• The mission was to be accomplished in one year time period• Critical areas selected at the request of user departments/ NGOs at ground level• Ground data is being collected at every possible 250m * 250m grid interval
UniquenessUniqueness
• For the first time database being generated at 1:25,000• 12 government agencies working together on the problem• 1800 km of critical road length is being covered in UP and HP Himalayas• The mission was to be accomplished in one year time period• Critical areas selected at the request of user departments/ NGOs at ground level• Ground data is being collected at every possible 250m * 250m grid interval
12
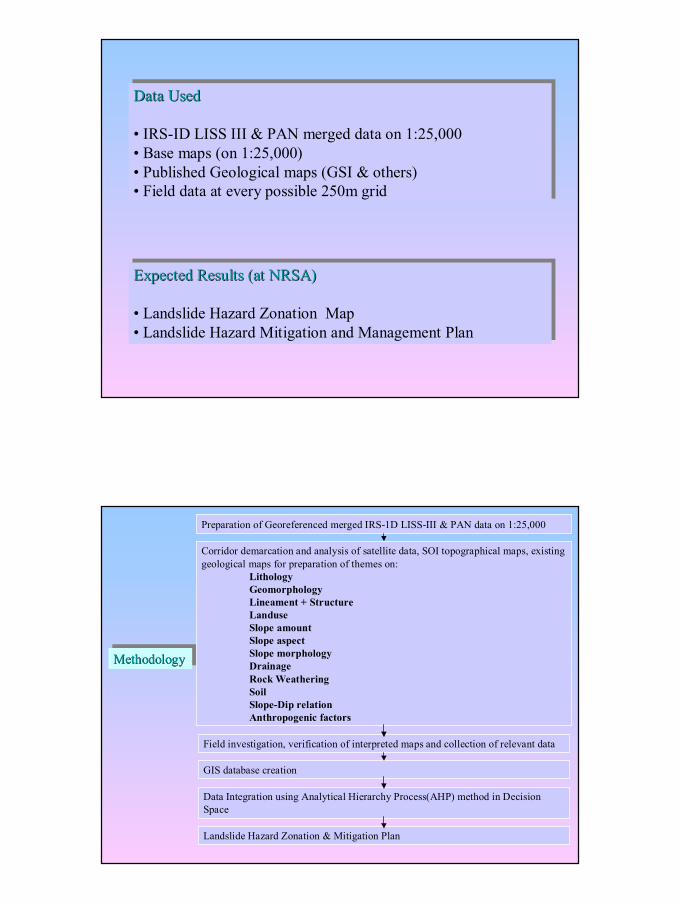
Data Used
• IRS-ID LISS III & PAN merged data on 1:25,000• Base maps (on 1:25,000)• Published Geological maps (GSI & others)• Field data at every possible 250m grid
Data UsedData Used
• IRS-ID LISS III & PAN merged data on 1:25,000• Base maps (on 1:25,000)• Published Geological maps (GSI & others)• Field data at every possible 250m grid
Expected Results (at NRSA)
• Landslide Hazard Zonation Map• Landslide Hazard Mitigation and Management Plan
Expected Results (at NRSA)Expected Results (at NRSA)
• Landslide Hazard Zonation Map• Landslide Hazard Mitigation and Management Plan
MethodologyMethodologyMethodology
Preparation of Georeferenced merged IRS-1D LISS-III & PAN data on 1:25,000
Corridor demarcation and analysis of satellite data, SOI topographical maps, existing geological maps for preparation of themes on:
LithologyGeomorphologyLineament + StructureLanduseSlope amountSlope aspectSlope morphologyDrainageRock WeatheringSoilSlope-Dip relationAnthropogenic factors
Field investigation, verification of interpreted maps and collection of relevant data
GIS database creation
Data Integration using Analytical Hierarchy Process(AHP) method in Decision Space
Landslide Hazard Zonation & Mitigation Plan
13
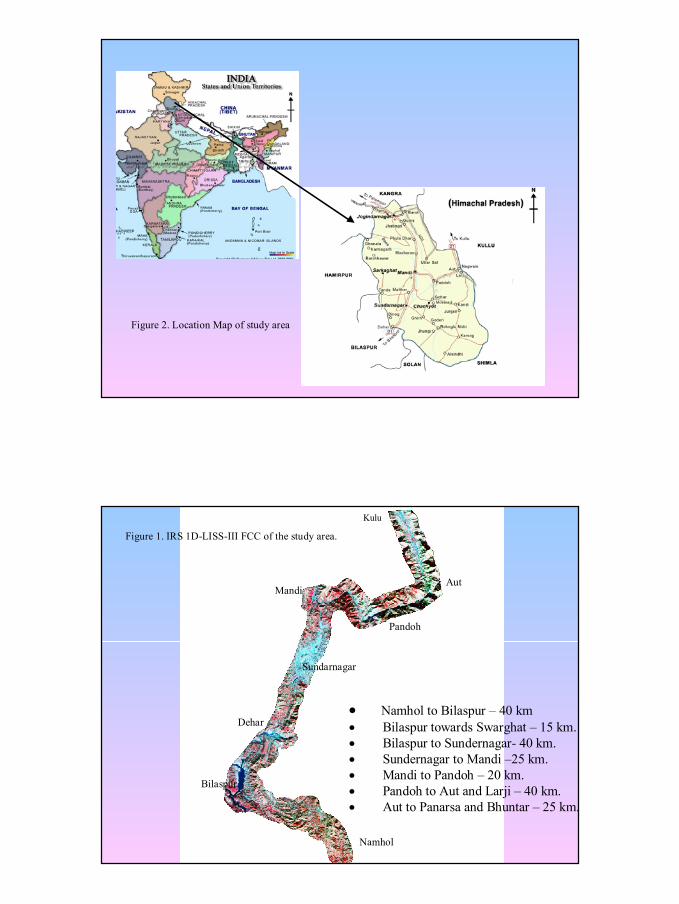
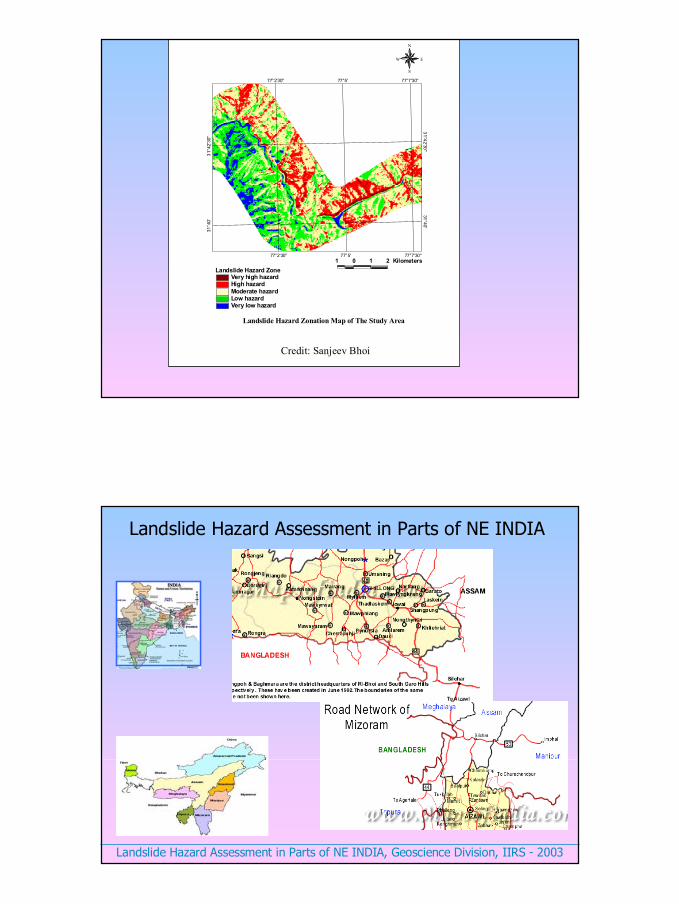
Figure 2. Location Map of study area
Mandi
Pandoh
Aut
Sundarnagar
Bilaspur
Kulu
Namhol
Dehar
Figure 1. IRS 1D-LISS-III FCC of the study area.
• Namhol to Bilaspur – 40 km• Bilaspur towards Swarghat – 15 km. • Bilaspur to Sundernagar- 40 km.• Sundernagar to Mandi –25 km.• Mandi to Pandoh – 20 km.• Pandoh to Aut and Larji – 40 km.• Aut to Panarsa and Bhuntar – 25 km.
14
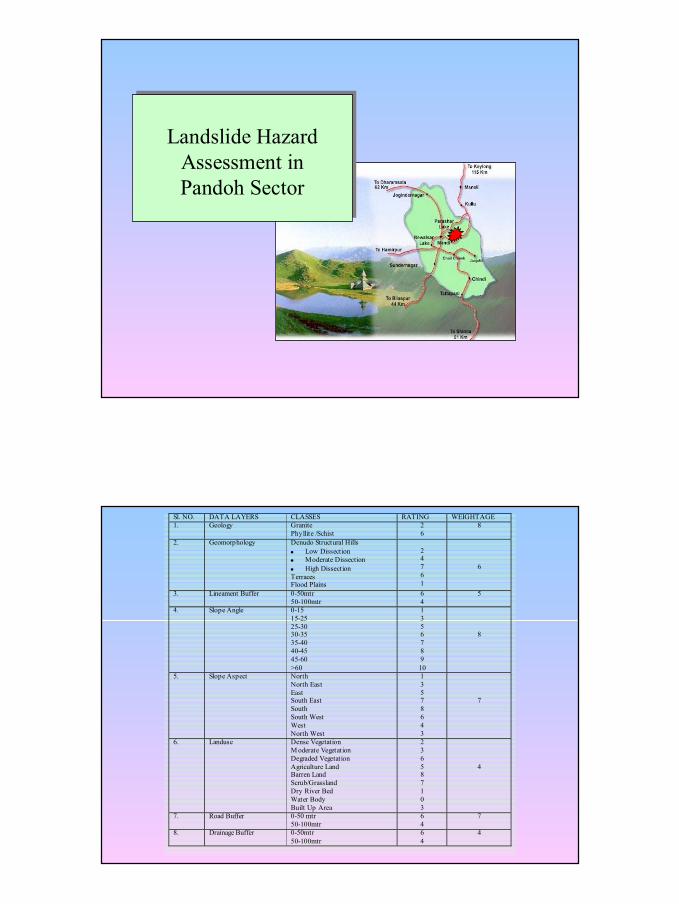
Landslide Hazard Assessment in Pandoh Sector
Landslide Hazard Assessment in Pandoh Sector
Sl. NO. DATA LAYERS CLASSES RATING WEIGHTAGE1. Geology
Granite Phyllite /Schist
2 6
8
2. Geomorphology
Denudo Structural Hills • Low Dissection • Moderate Dissection • High Dissection Terraces Flood Plains
2 4 7 6 1
6
3. Lineament Buffer
0-50mtr 50-100mtr
6 4
5
4. Slope Angle
0-15 15-25 25-30 30-35 35-40 40-45 45-60 >60
1 3 5 6 7 8 9 10
8
5. Slope Aspect
North North East East South East South South West West North West
1 3 5 7 8 6 4 3
7
6. Landuse
Dense Vegetation M oderate Vegetation Degraded Vegetation Agriculture Land Barren Land Scrub/Grassland Dry River Bed Water Body Built Up Area
2 3 6 5 8 7 1 0 3
4
7. Road Buffer
0-50 mtr 50-100mtr
6 4
7
8. Drainage Buffer
0-50mtr 50-100mtr
6 4
4
15
77°2'30''
77°2'30''
77°5'
77°5'
77°7'30''
77°7'30''
31°4
0'
31°40'
31°4
2'30
''
31°42'30''1 0 1 2 Kilometers
N
EW
S
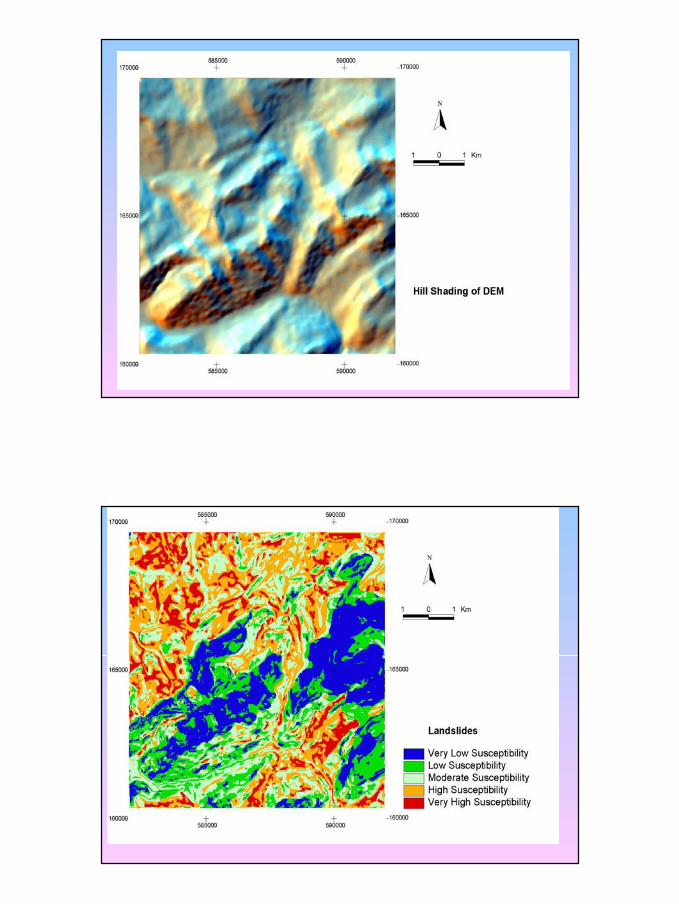
Landslide Hazard Zonation Map of The Study Area
Landslide Hazard ZoneVery high hazardHigh hazardModerate hazardLow hazardVery low hazard
Credit: Sanjeev Bhoi
Study Area
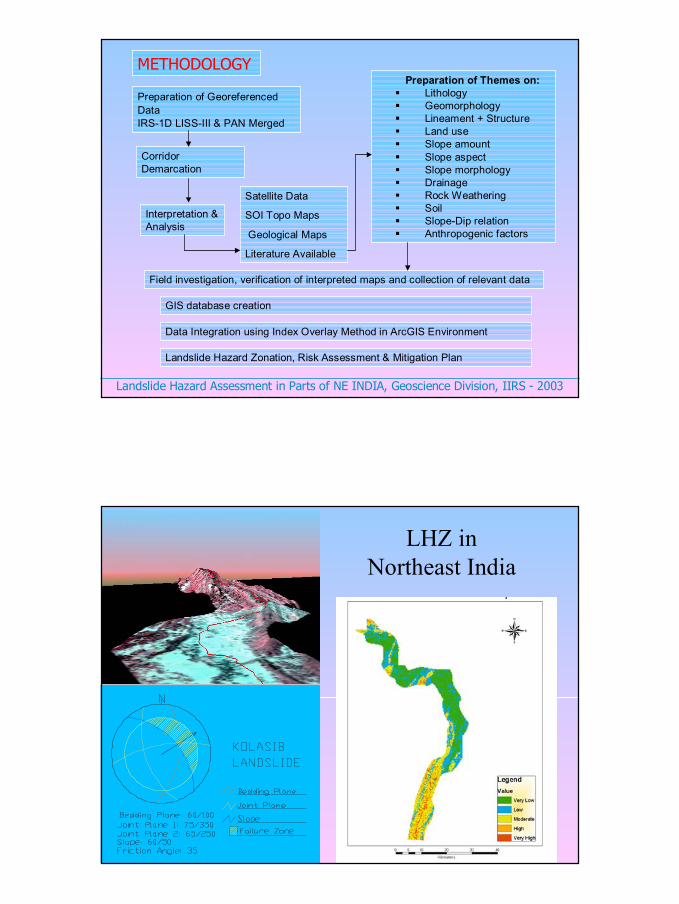
Landslide Hazard Assessment in Parts of NE INDIA, Geoscience Division, IIRS - 2003
Landslide Hazard Assessment in Parts of NE INDIA
16
Preparation of Georeferenced DataIRS-1D LISS-III & PAN Merged
Preparation of Themes on:LithologyGeomorphologyLineament + StructureLand useSlope amountSlope aspectSlope morphologyDrainageRock WeatheringSoilSlope-Dip relationAnthropogenic factors
Field investigation, verification of interpreted maps and collection of relevant data
GIS database creation
Data Integration using Index Overlay Method in ArcGIS Environment
Landslide Hazard Zonation, Risk Assessment & Mitigation Plan
METHODOLOGY
Corridor Demarcation
Interpretation & Analysis
Satellite Data
SOI Topo Maps
Geological Maps
Literature Available
Landslide Hazard Assessment in Parts of NE INDIA, Geoscience Division, IIRS - 2003
LHZ in Northeast India
17
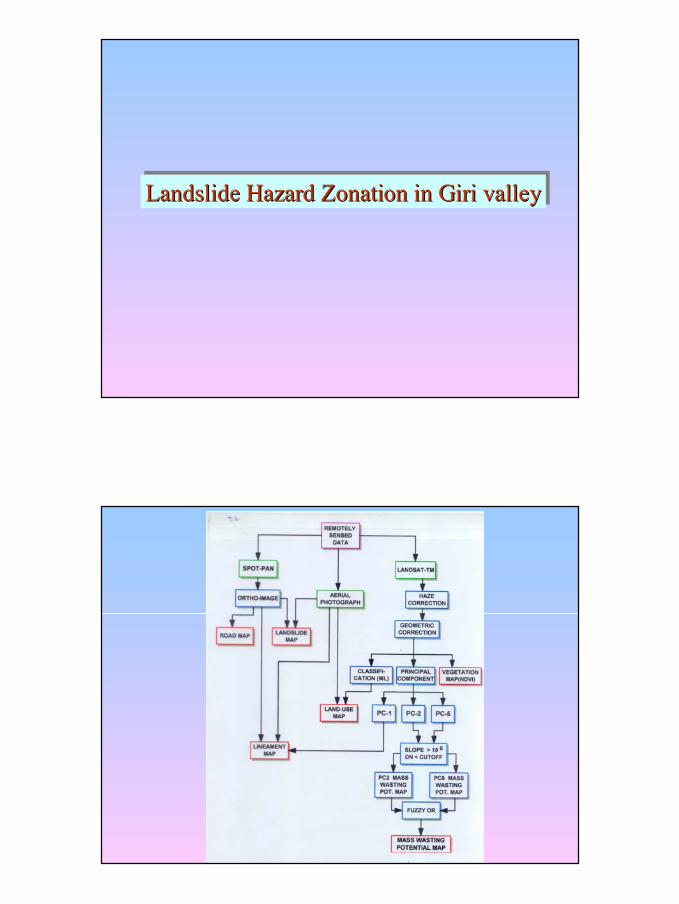
Landslide Hazard Zonation in Giri valleyLandslide Hazard Landslide Hazard Zonation Zonation in in Giri Giri valleyvalley
18
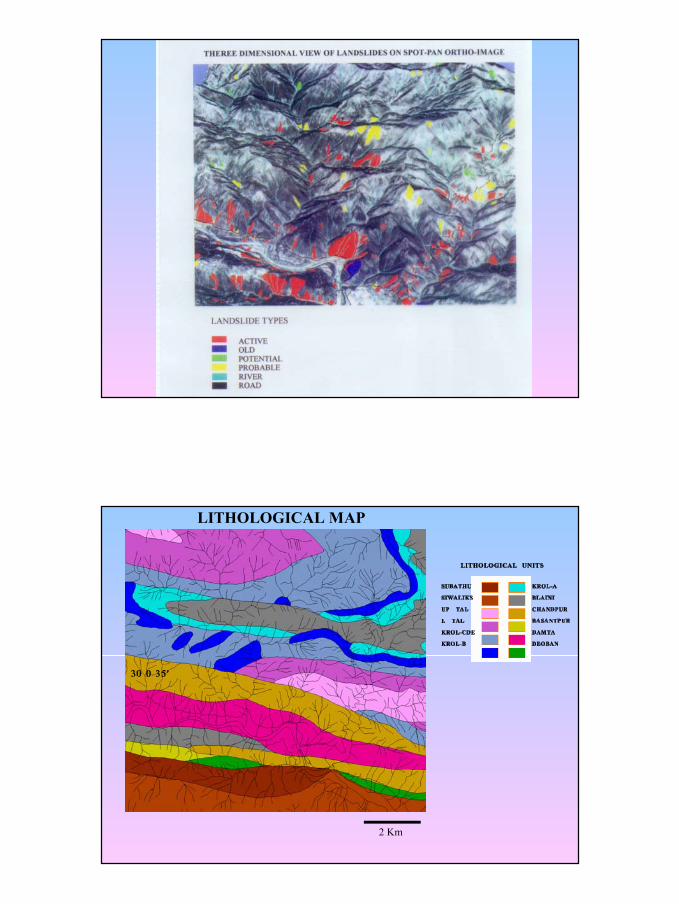
LITHOLOGICAL MAP
2 Km
19
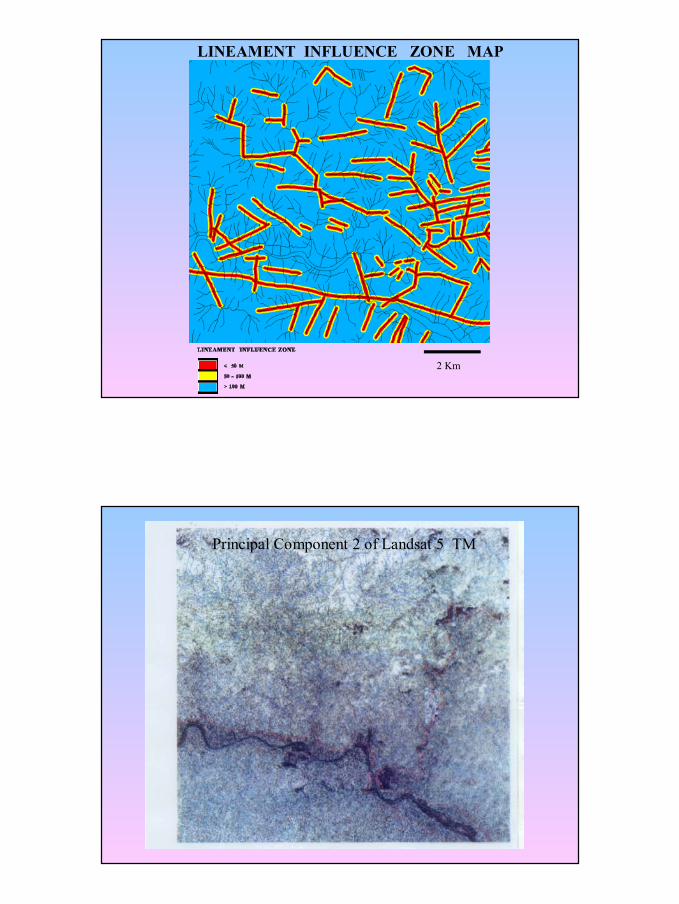
LINEAMENT INFLUENCE ZONE MAP
2 Km
Principal Component 2 of Landsat 5 TM
20
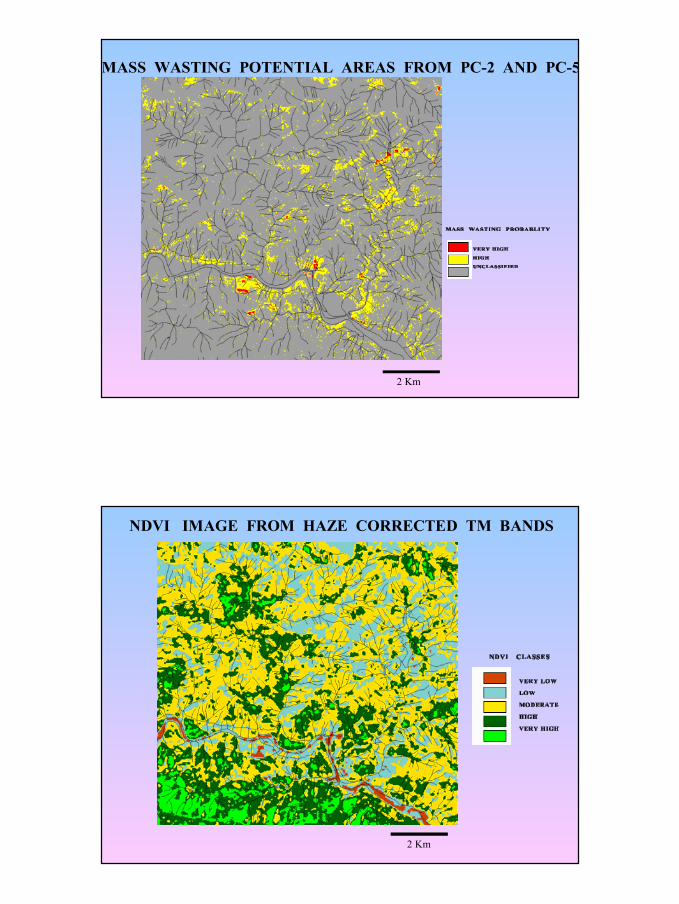
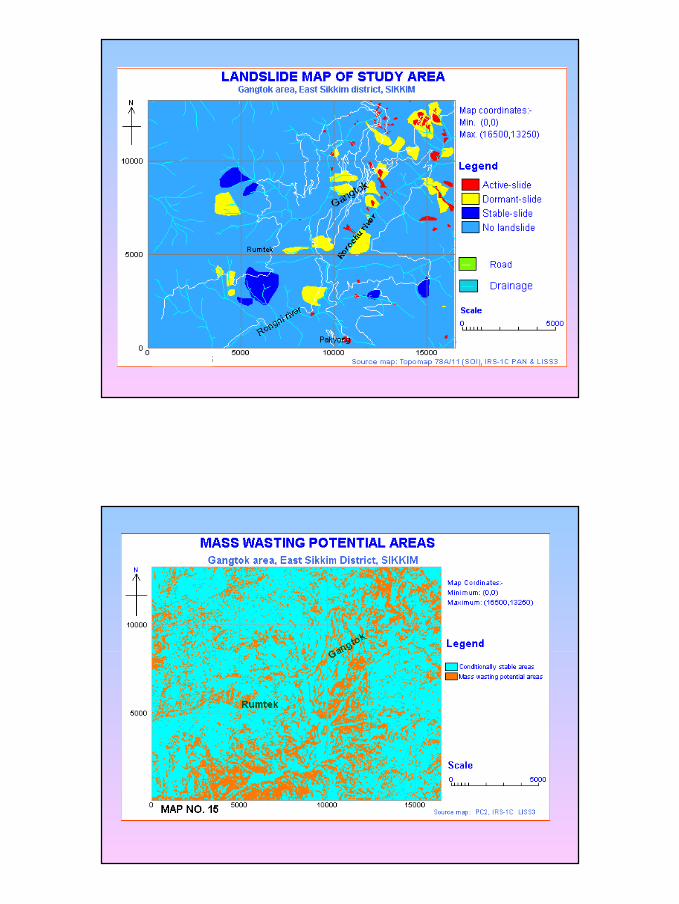
MASS WASTING POTENTIAL AREAS FROM PC-2 AND PC-5
2 Km
NDVI IMAGE FROM HAZE CORRECTED TM BANDS
2 Km
21
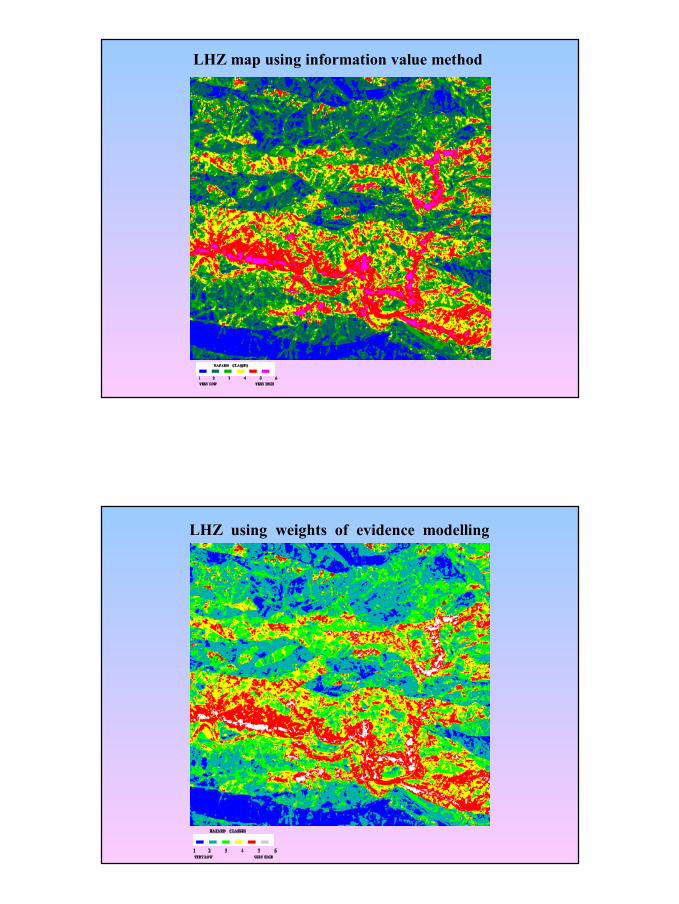
LHZ map using information value method
LHZ using weights of evidence modelling
22
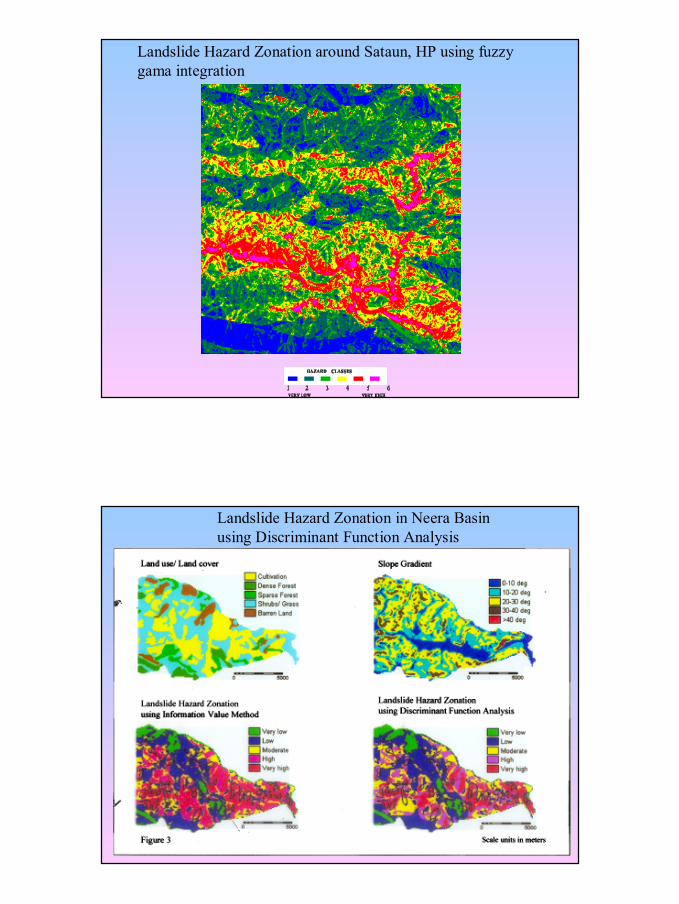
Landslide Hazard Zonation around Sataun, HP using fuzzy gama integration
Landslide Hazard Zonation in Neera Basin using Discriminant Function Analysis

23
Landslides in Uttaranchal
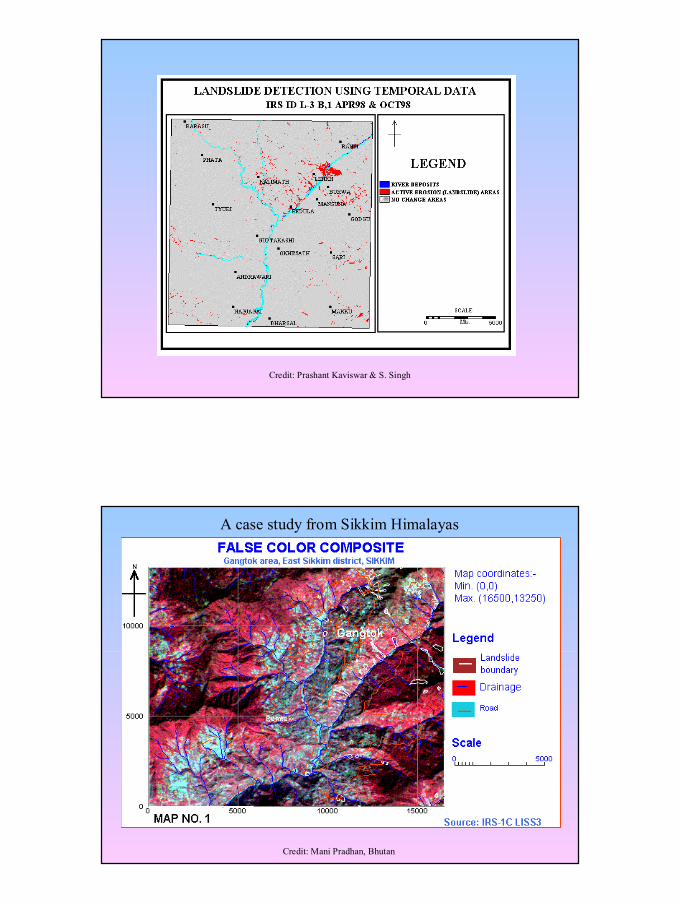
A case study from Okhimath region
24
Credit: Prashant Kaviswar & S. Singh
A case study from Sikkim Himalayas
Credit: Mani Pradhan, Bhutan
25
26
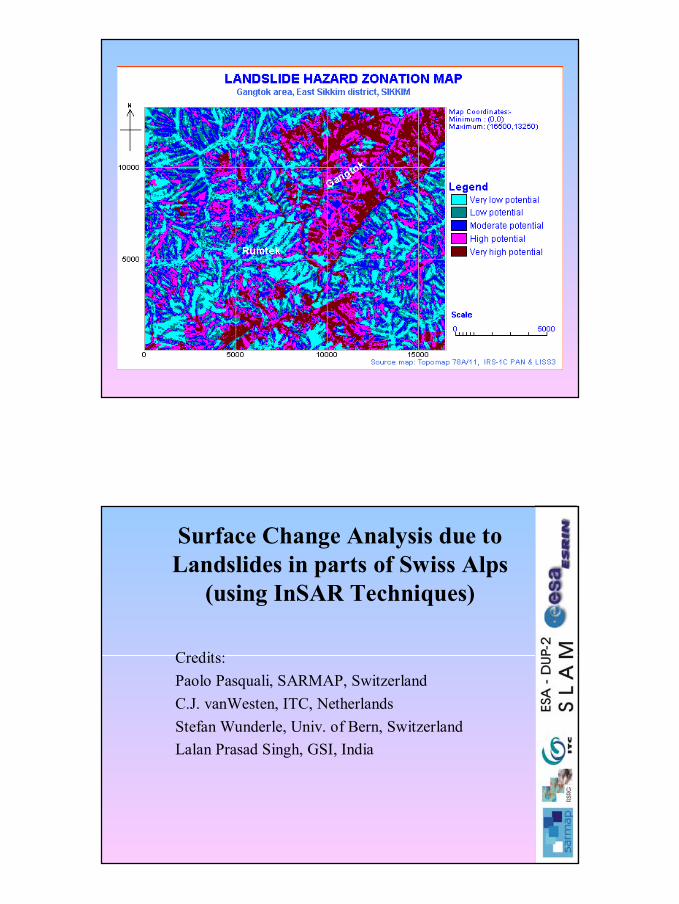
Surface Change Analysis due to Landslides in parts of Swiss Alps
(using InSAR Techniques)
Credits:Paolo Pasquali, SARMAP, SwitzerlandC.J. vanWesten, ITC, NetherlandsStefan Wunderle, Univ. of Bern, SwitzerlandLalan Prasad Singh, GSI, India
27
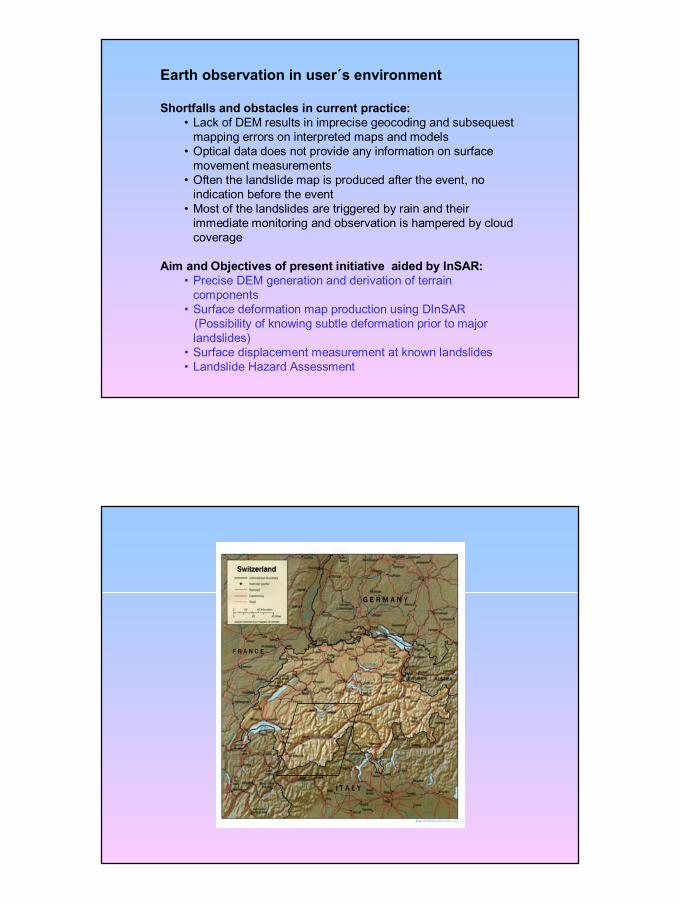
Earth observation in user´s environment
Shortfalls and obstacles in current practice:• Lack of DEM results in imprecise geocoding and subsequest
mapping errors on interpreted maps and models• Optical data does not provide any information on surface
movement measurements• Often the landslide map is produced after the event, no
indication before the event• Most of the landslides are triggered by rain and their
immediate monitoring and observation is hampered by cloud coverage
Aim and Objectives of present initiative aided by InSAR:• Precise DEM generation and derivation of terrain
components• Surface deformation map production using DInSAR
(Possibility of knowing subtle deformation prior to major landslides)
• Surface displacement measurement at known landslides• Landslide Hazard Assessment
28
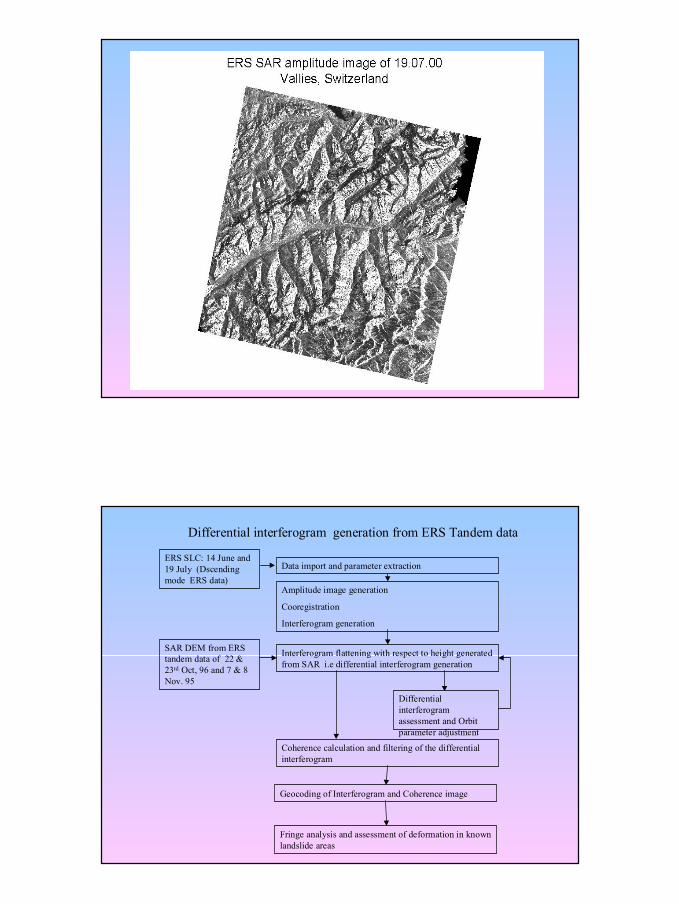
Differential interferogram generation from ERS Tandem data
ERS SLC: 14 June and 19 July (Dscendingmode ERS data)
Amplitude image generation
Cooregistration
Interferogram generation
Interferogram flattening with respect to height generated from SAR i.e differential interferogram generation
Data import and parameter extraction
Coherence calculation and filtering of the differential interferogram
Differential interferogramassessment and Orbit parameter adjustment
SAR DEM from ERS tandem data of 22 & 23rd Oct, 96 and 7 & 8 Nov. 95
Geocoding of Interferogram and Coherence image
Fringe analysis and assessment of deformation in known landslide areas
29
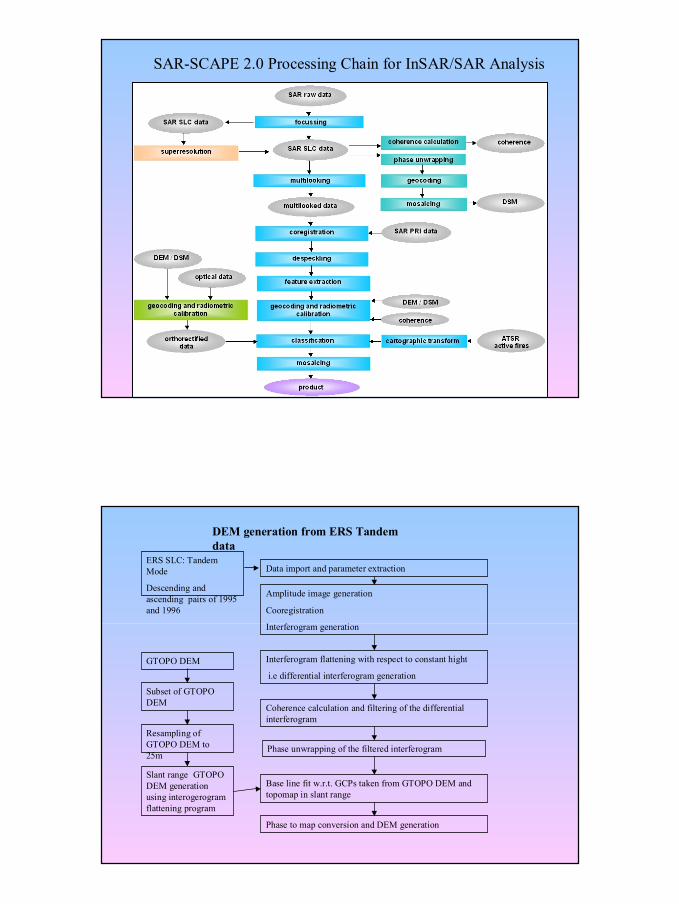
SAR-SCAPE 2.0 Processing Chain for InSAR/SAR Analysis
ERS SLC: Tandem Mode
Descending and ascending pairs of 1995 and 1996
Amplitude image generation
Cooregistration
Interferogram generation
Interferogram flattening with respect to constant hight
i.e differential interferogram generation
Phase unwrapping of the filtered interferogram
Data import and parameter extraction
Coherence calculation and filtering of the differential interferogram
Base line fit w.r.t. GCPs taken from GTOPO DEM and topomap in slant range
GTOPO DEM
Subset of GTOPO DEM
Resampling of GTOPO DEM to 25m
Slant range GTOPO DEM generation using interogerogramflattening program
Phase to map conversion and DEM generation
DEM generation from ERS Tandem data
30
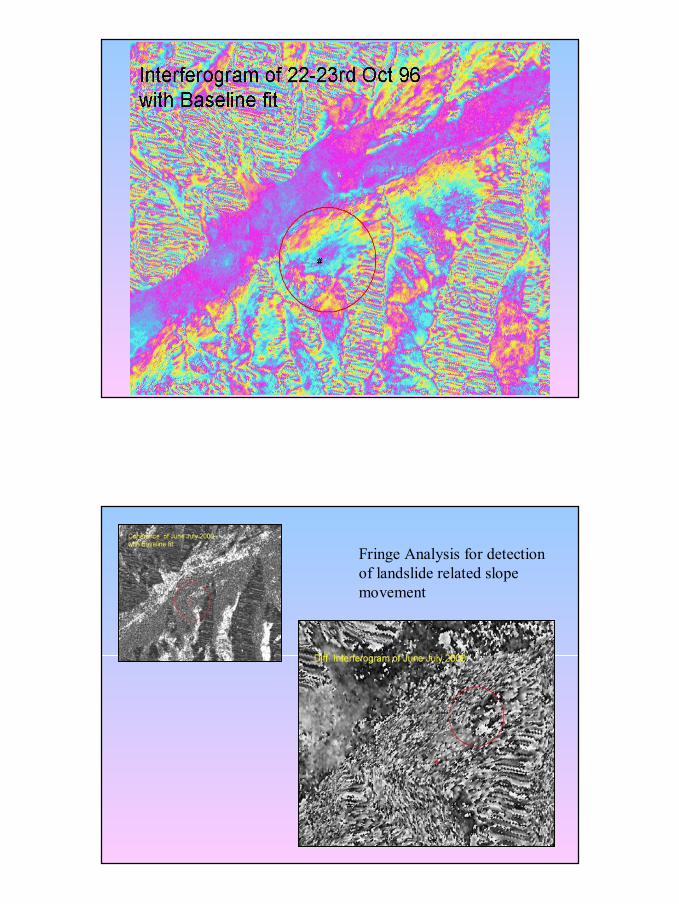
Fringe Analysis for detection of landslide related slope movement
31
32
0102030405060708090
100
Very Low Low Moderate High Very High
Landslide Density
0102030405060708090
100
Very Low Low Moderate High Very High
Landslide %
Landslide
0102030405060708090
100
0 20 40 60 80 100
Class Area %
Lan
dsl
ide
%
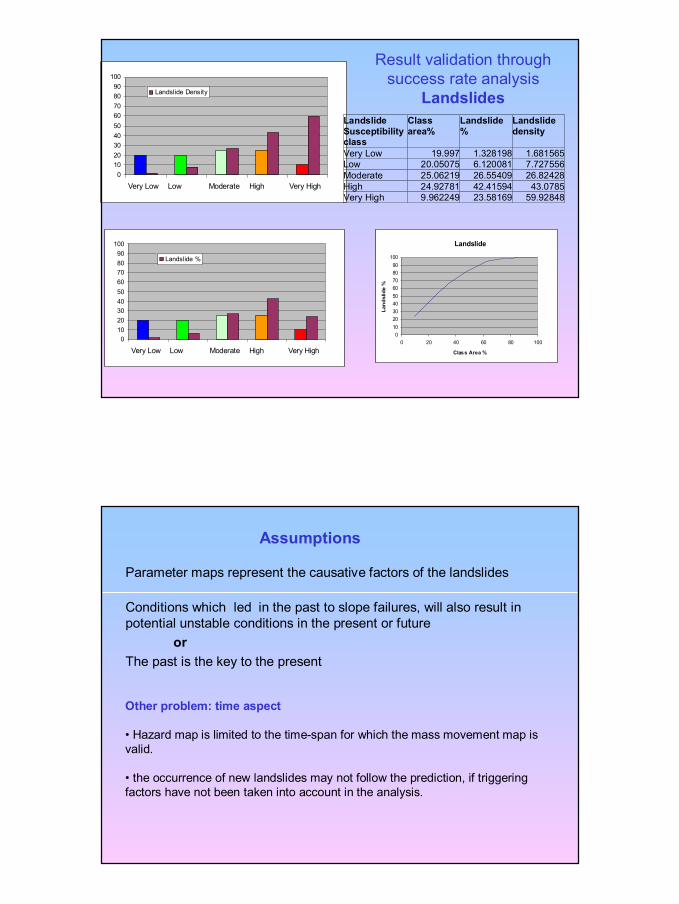
Result validation through success rate analysis
Landslides
Landslide Susceptibility class
Class area%
Landslide %
Landslide density
Very Low 19.997 1.328198 1.681565Low 20.05075 6.120081 7.727556Moderate 25.06219 26.55409 26.82428High 24.92781 42.41594 43.0785Very High 9.962249 23.58169 59.92848
Assumptions
Other problem: time aspect
• Hazard map is limited to the time-span for which the mass movement map is valid.
• the occurrence of new landslides may not follow the prediction, if triggering factors have not been taken into account in the analysis.
Parameter maps represent the causative factors of the landslides
Conditions which led in the past to slope failures, will also result in potential unstable conditions in the present or future
orThe past is the key to the present
33
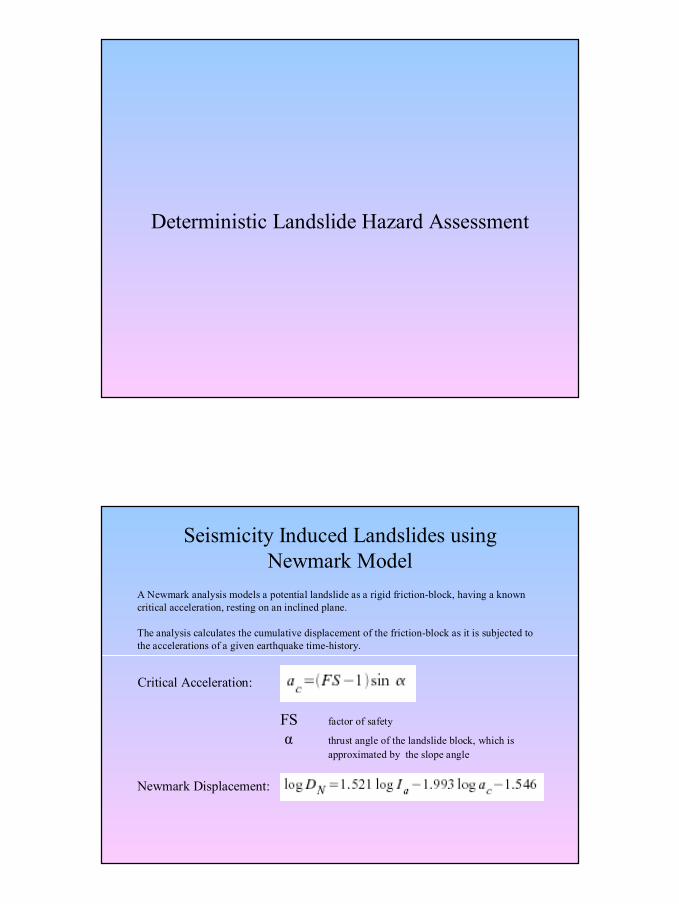
Deterministic Landslide Hazard Assessment
Seismicity Induced Landslides using Newmark Model
A Newmark analysis models a potential landslide as a rigid friction-block, having a known critical acceleration, resting on an inclined plane.
The analysis calculates the cumulative displacement of the friction-block as it is subjected to the accelerations of a given earthquake time-history.
Critical Acceleration:
FS factor of safety
α thrust angle of the landslide block, which is approximated by the slope angle
Newmark Displacement:
34
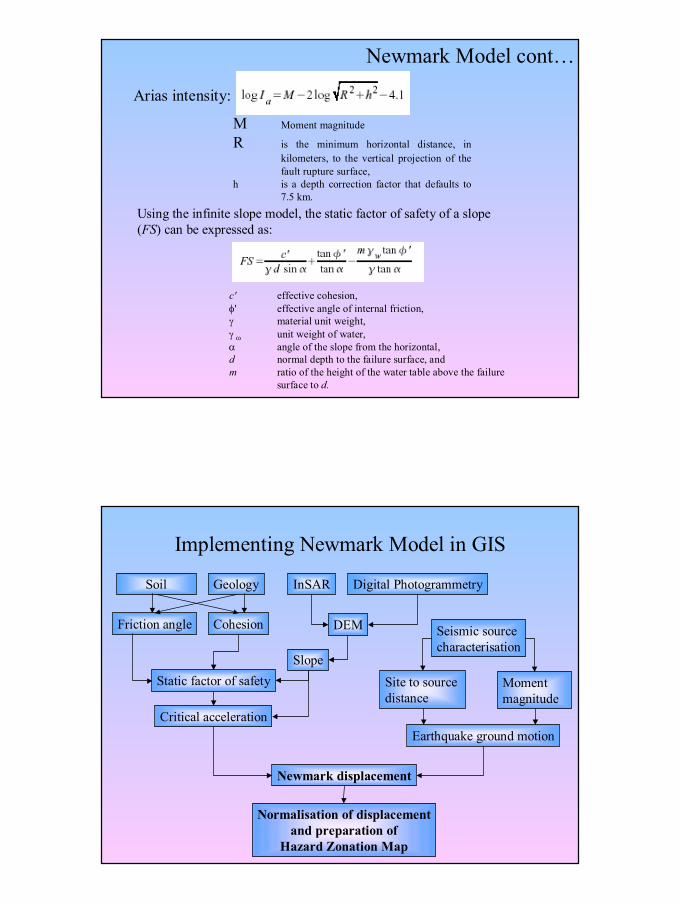
Newmark Model cont…
M Moment magnitude
R is the minimum horizontal distance, in kilometers, to the vertical projection of the fault rupture surface,
h is a depth correction factor that defaults to 7.5 km.
Arias intensity:
Using the infinite slope model, the static factor of safety of a slope (FS) can be expressed as:
c' effective cohesion, φ' effective angle of internal friction, γ material unit weight, γ ω unit weight of water, α angle of the slope from the horizontal, d normal depth to the failure surface, and m ratio of the height of the water table above the failure
surface to d.
Soil Geology
Friction angle Cohesion
Static factor of safety
Critical acceleration
Newmark displacement
Seismic source characterisation
Site to source distance
Moment magnitude
Earthquake ground motion
InSAR Digital Photogrammetry
DEM
Slope
Implementing Newmark Model in GIS
Normalisation of displacementand preparation of
Hazard Zonation Map
35
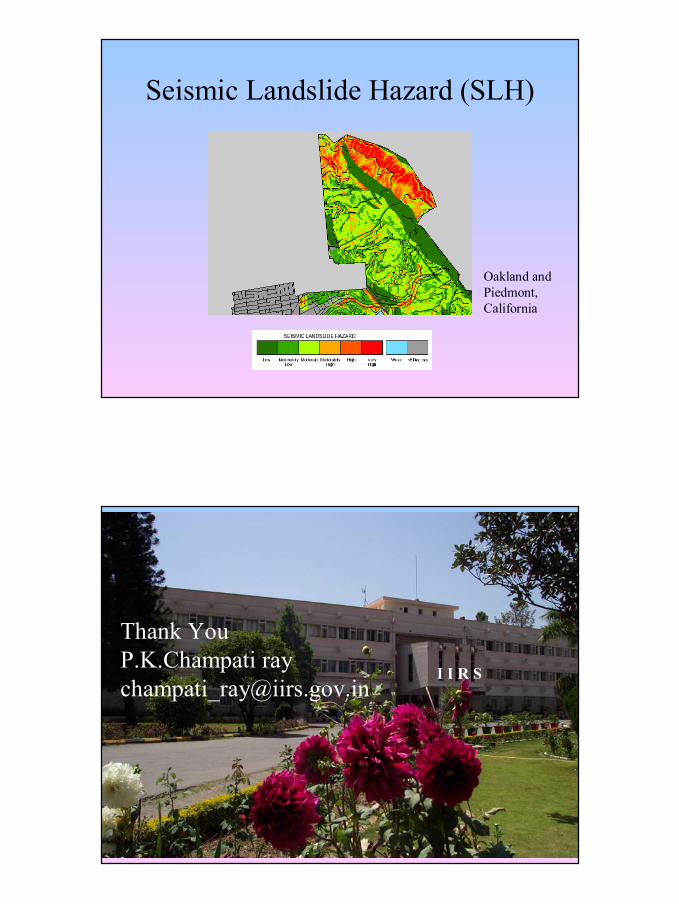
Seismic Landslide Hazard (SLH)
Oakland and Piedmont, California
Thank YouP.K.Champati [email protected]
I I R S