plant genetic resources for agriculture, plant breeding ... · ifpri discussion paper 00762 april...
TRANSCRIPT
IFPRI Discussion Paper 00762
April 2008
Plant Genetic Resources for Agriculture, Plant Breeding, and Biotechnology
Experiences from Cameroon, Kenya, the Philippines, and Venezuela
José Falck-Zepeda, International Food Policy Research Institute Patricia Zambrano, International Food Policy Research Institute Joel I. Cohen, Science, Technology and Education Associates
Orangel Borges, Universidad Central de Venezuela Elcio P. Guimarães, Food and Agriculture Organization of the United Nations
Desiree Hautea, University of Philippines Los Baños Joseph Kengue, Institut de Recherche Agricole pour le Développement
and Josephine Songa, Kenya Agricultural Research Institute
Environnment and Production Technology Division

INTERNATIONAL FOOD POLICY RESEARCH INSTITUTE
The International Food Policy Research Institute (IFPRI) was established in 1975. IFPRI is one of 15 agricultural research centers that receive principal funding from governments, private foundations, and international and regional organizations, most of which are members of the Consultative Group on International Agricultural Research (CGIAR).
FINANCIAL CONTRIBUTORS AND PARTNERS IFPRI’s research, capacity strengthening, and communications work is made possible by its financial contributors and partners. IFPRI gratefully acknowledges the generous unrestricted funding from Australia, Canada, China, Finland, France, Germany, India, Ireland, Italy, Japan, Netherlands, Norway, Philippines, Sweden, Switzerland, United Kingdom, United States, and World Bank.
Published by
INTERNATIONAL FOOD POLICY RESEARCH INSTITUTE 2033 K Street, NW Washington, DC 20006-1002 USA Tel.: +1-202-862-5600 Fax: +1-202-467-4439 Email: [email protected]
www.ifpri.org
Notices 1 Effective January 2007, the Discussion Paper series within each division and the Director General’s Office of IFPRI were merged into one IFPRI–wide Discussion Paper series. The new series begins with number 00689, reflecting the prior publication of 688 discussion papers within the dispersed series. The earlier series are available on IFPRI’s website at www.ifpri.org/pubs/otherpubs.htm#dp. 2 IFPRI Discussion Papers contain preliminary material and research results. They have not been subject to formal external reviews managed by IFPRI’s Publications Review Committee but have been reviewed by at least one internal and/or external reviewer. They are circulated in order to stimulate discussion and critical comment.
Copyright 2008 International Food Policy Research Institute. All rights reserved. Sections of this material may be reproduced for personal and not-for-profit use without the express written permission of but with acknowledgment to IFPRI. To reproduce the material contained herein for profit or commercial use requires express written permission. To obtain permission, contact the Communications Division at [email protected].

iii
Contents
Acknowledgements vi
Abstract vi
Abbreviations and Acronyms viii
1. Introduction 1
2. Rationale, Goal and Objectives 3
3. A Conceptual Framework for Plant Breeding and Biotechnology Innovation 5
4. Methodology 7
5. Country Data 10
6. Policy Implications and Recommendations 30
7. Summary 43
Appendix A: The Furman, Porter and Stern National Innovative Capacity Framework 44
Appendix B: Potential Variables for the Estimation of the Determinants of National Biotechnology Innovation Capacity 45
References 47

iv
List of Tables
1. Innovative outputs for developing economies in the FAO survey 9
2. Basic economic, production, and population data for study countries 11
3. Participating countries, numbers of institutes, and experience with plant breeding and biotechnology by country 12
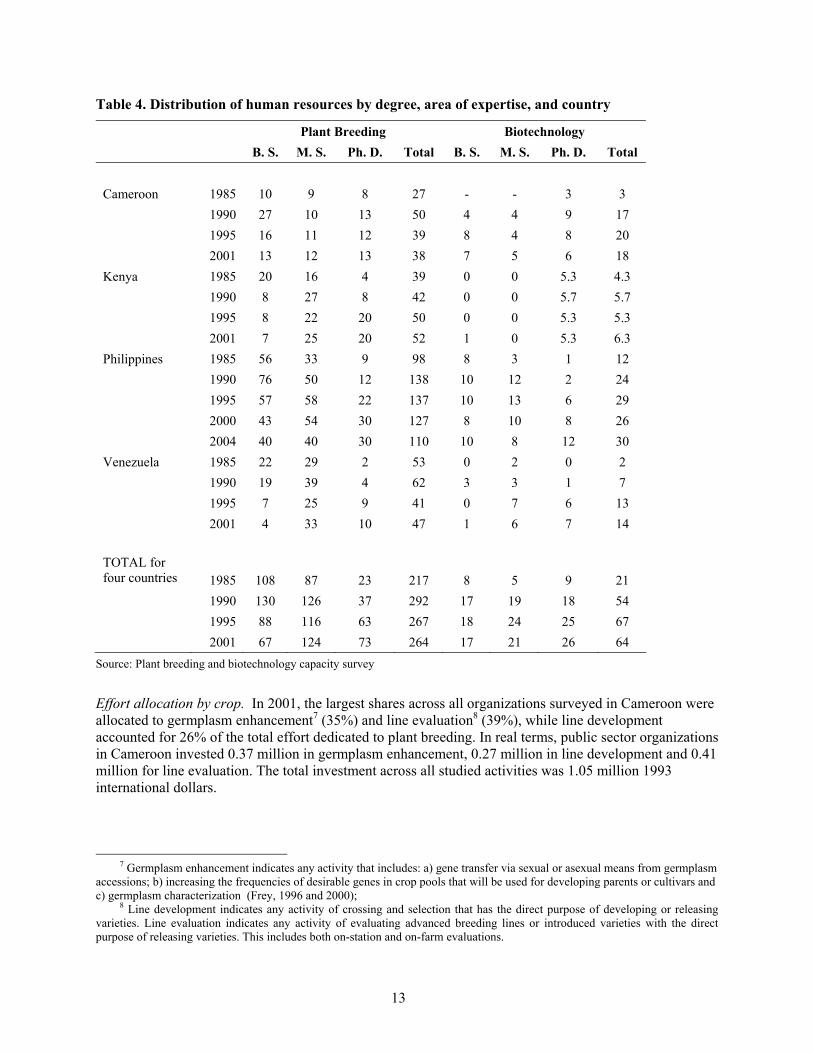
4. Distribution of human resources by degree, area of expertise, and country 13
5. Financial resources and resources per researcher (1993 international PPP dollars) 14
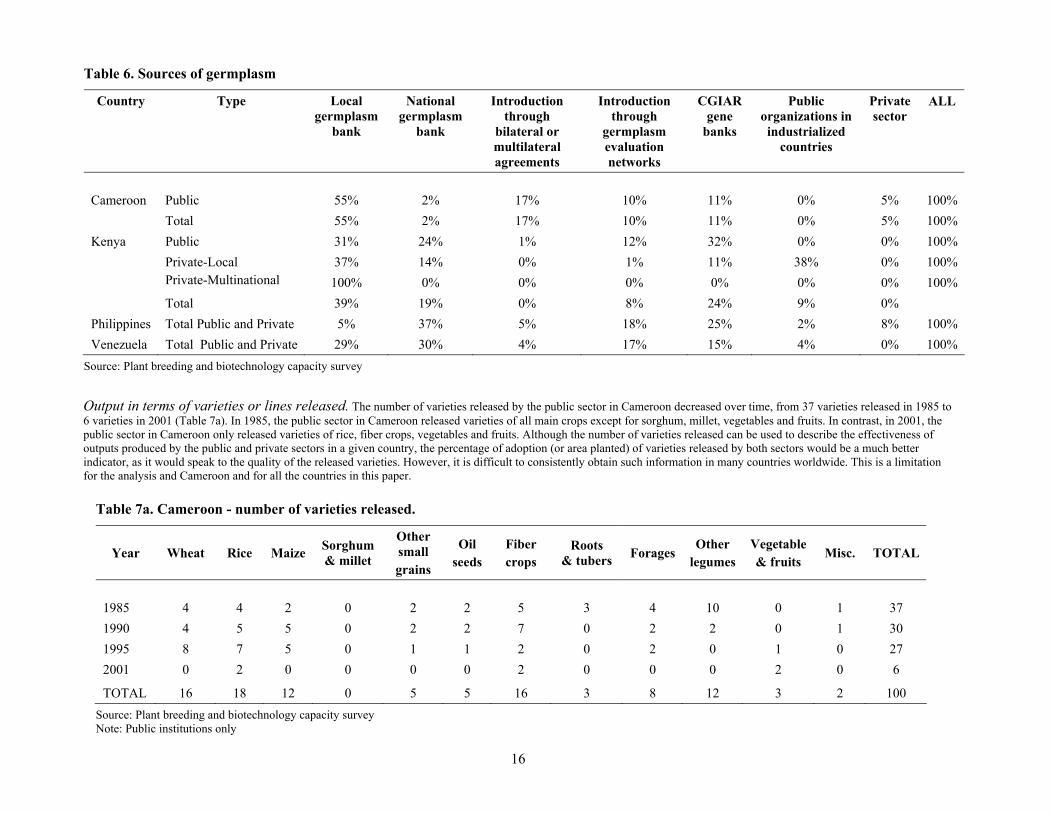
6. Sources of germplasm 16
7a. Cameroon - number of varieties released 16
7b. Kenya - number of varieties released 20
7c. The Philippines - number of varieties released 26
7d. Venezuela - Number of varieties released 28
8a. Determinants of innovation, R&D, and technology transfer 30
8b. Determinants of innovative capacity for developing economies in the FAO survey - common innovation infrastructure and contributing outcome factors 31
8c. Determinants of innovative capacity for developing economies in the FAO survey - common innovation infrastructure and contributing outcome factors (continued) 32
8d. Determinants of innovative capacity for developing economies in the FAO survey - cluster-specific 33
8e. Determinants of innovative capacity for developing economies in the FAO survey – links, networks and technology transfer capacity 33
9. Policies tools, objectives, and tools for plant breeding and biotechnology 37
10. Comparative indicators among countries 39
v
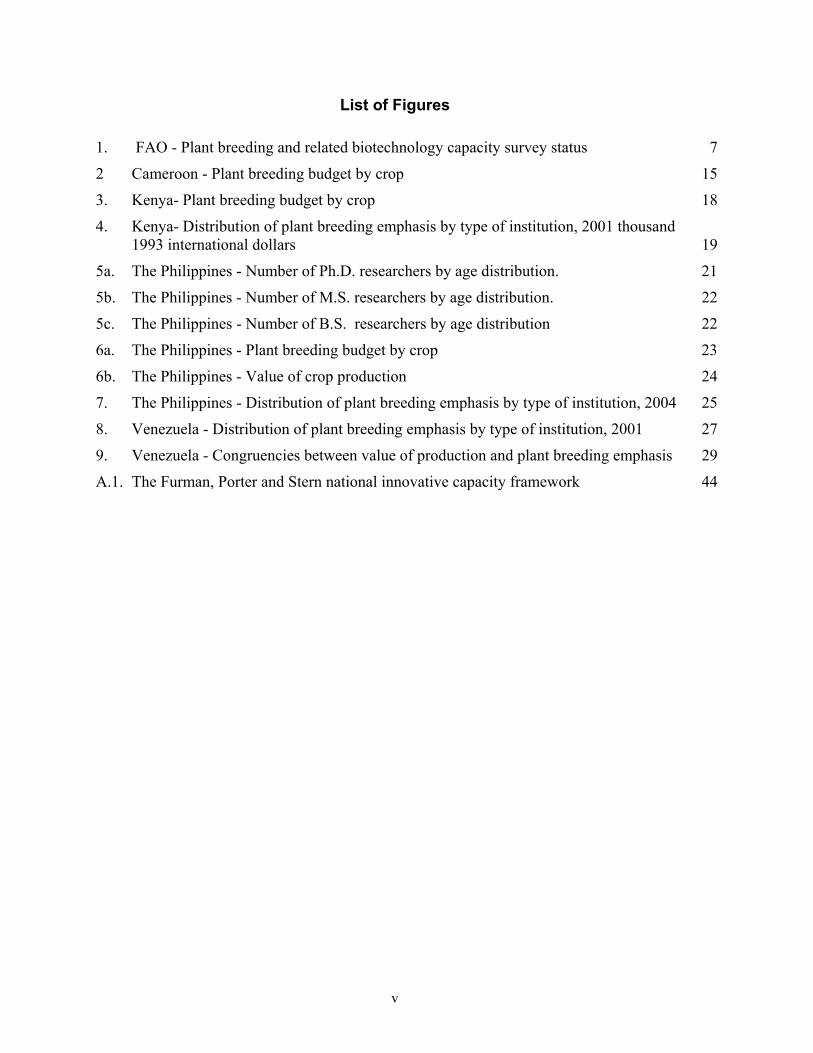
List of Figures
1. FAO - Plant breeding and related biotechnology capacity survey status 7
2 Cameroon - Plant breeding budget by crop 15
3. Kenya- Plant breeding budget by crop 18
4. Kenya- Distribution of plant breeding emphasis by type of institution, 2001 thousand 1993 international dollars 19
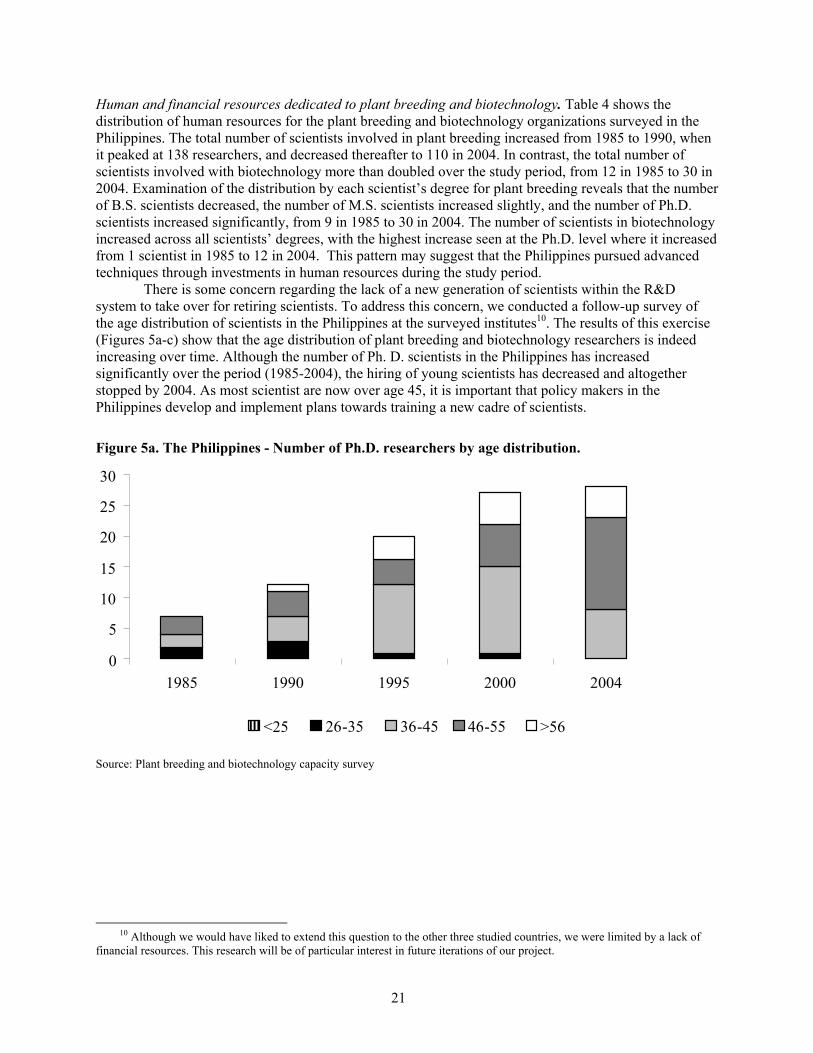
5a. The Philippines - Number of Ph.D. researchers by age distribution. 21
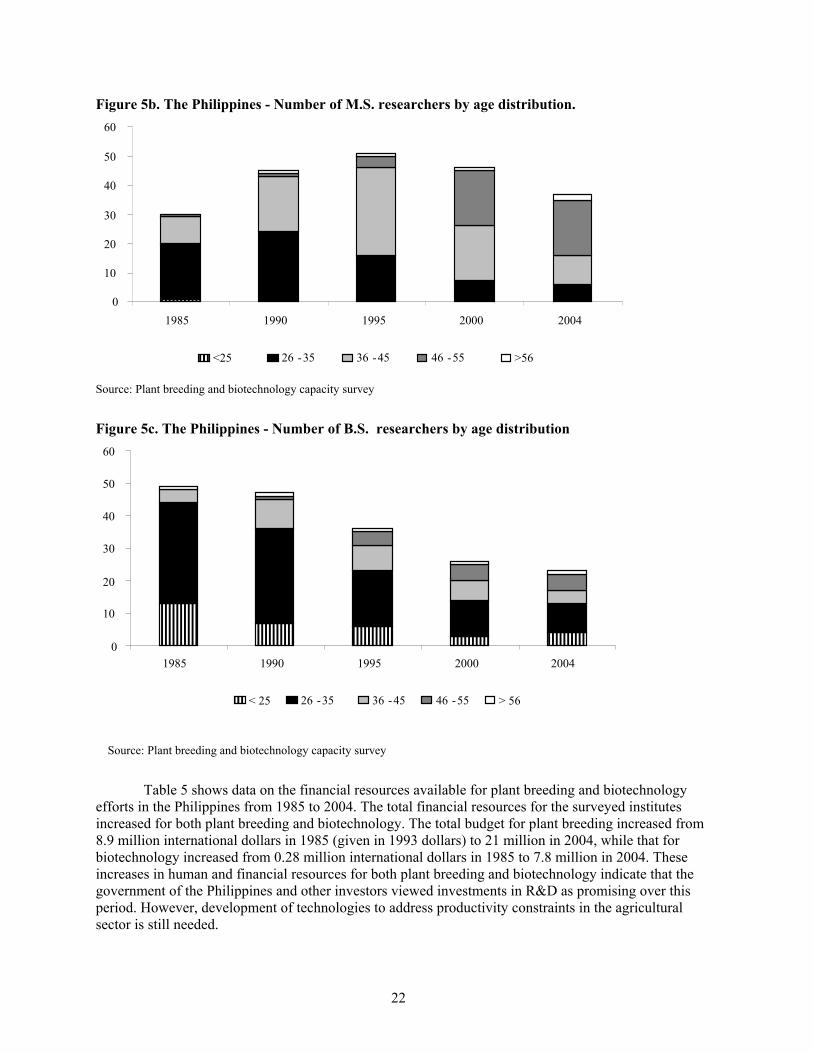
5b. The Philippines - Number of M.S. researchers by age distribution. 22
5c. The Philippines - Number of B.S. researchers by age distribution 22
6a. The Philippines - Plant breeding budget by crop 23
6b. The Philippines - Value of crop production 24
7. The Philippines - Distribution of plant breeding emphasis by type of institution, 2004 25
8. Venezuela - Distribution of plant breeding emphasis by type of institution, 2001 27
9. Venezuela - Congruencies between value of production and plant breeding emphasis 29
A.1. The Furman, Porter and Stern national innovative capacity framework 44

vi
ACKNOWLEDGEMENTS
We wish to acknowledge the long-term collaborative nature of this activity between the Food and Agriculture Organization of the United Nations (FAO) and the International Food Policy Research Institute (IFPRI), and more recently with the Global Partnership Initiative for Plant Breeding Capacity Building (GIPB) and commentaries on multiple drafts of this paper by FAO staff, specially Eric Kueneman and Michela Paganini. Appreciation is extended to James Hancock of Michigan State University for sharing the results and papers of the plant breeding symposium held at MSU in 2005.
Special thanks are extended to those who provided expert review and summaries of earlier drafts including Eduardo Trigo and Don Doering. We also thank the many people who have contributed papers, thoughts, and analyses of plant breeding, in particular Ken Frey, Donald Duvick, and Greg Traxler. We dedicate this work to Dr. Duvick, who passed away in 2006.
This paper has been produced as part of the activities of IFPRI’s Genetic resource Policies for the Poor: Biodiversity and Biotechnology Policies (Theme 9.1).
vii
ABSTRACT
Local farming communities throughout the world face binding productivity constraints, diverse nutritional needs, environmental concerns, and significant economic and financial pressures. Developing countries address these challenges in different ways, including public and private sector investments in plant breeding and other modern tools for genetic crop improvement. In order to measure the impact of any technology and prioritize investments, we must assess the relevant resources, human capacity, clusters, networks and linkages, as well as the institutions performing technological research and development, and the rate of farmer adoption.
However, such measures have not been recently assessed, in part due to the lack of complete standardized information on public plant breeding and biotechnology research in developing countries. To tackle this void, the Food and Agricultural Organization of the United Nations (FAO), in consultation with the International Food Policy Institute (IFPRI) and other organizations, designed a plant breeding and biotechnology capacity survey for implementation by FAO consultants in 100 developing countries.
IFPRI, in collaboration with FAO and national experts contracted by FAO to complete in-country surveys, identified and analyzed plant breeding and biotechnology programs in four developing countries: Cameroon, Kenya, the Philippines, and Venezuela. Here, we use an innovation systems framework to examine the investments in human and financial resources and the distribution of resources among the different programs, as well as the capacity and policy development for agricultural research in the four selected countries. Based on our findings, we present recommendations to help sustain and increase the efficiency of publicly- and privately-funded plant breeding programs, while maximizing the use of genetic resources and developing opportunities for GM crop production. Policy makers, private sector breeders, and other stakeholders can use this information to prioritize investments, consider product advancement, and assess the relative magnitude of the potential risks and benefits of their investments.
Keywords: plant breeding, biotechnology, public research, funding, innovation systems, capacity building

viii
ABBREVIATIONS AND ACRONYMS
ASTI Agricultural Science and Technology Indicators CARBAP Le Centre Africain de Recherches sur le Bananiers et Plantains (Banana and Plantain
African Research Center) CGIAR Consultative Group for International Agricultural Research FAO Food and Agricultural Organization of the United Nations FTE Full Time Equivalent IFPRI International Food Policy Research Institute IPB Institute of Plant Biotechnology - Philippines IRAD Institut de Recherche Agricole pour le Développement, Cameroon KARI Kenyan Agricultural Research Institute KEPHIS Kenya Plant Health Inspectorate Services PGRFA Plant Genetic Resources for Agriculture STAK Seed Traders Association of Kenya

1
1. INTRODUCTION
Population projections by the United Nations (2004) indicate that the world’s population will increase to approximately 8.2 billion persons by 2030. Other estimates vary between 7.6 and 8.8 billion depending on the utilized assumptions, and the numbers have been continuously revised- mostly downward- in the last few decades to reflect changes in birth and mortality rates and the effects of natural and man-made disasters. However, all of these projections agree on two basic issues: first, the world population will continue to grow, and second, this growth will occur mainly in the less and least developing countries, which are ill-equipped to supply increasing food demands from growing populations.
Some authors (Douthwaite 2001; Moore-Lappé et al. 1998) have suggested that the problem of world hunger is one of unequal distribution rather than quantity, as there is currently sufficient food to feed the world’s population. However, even if the distribution problem could be solved today, larger food amounts will still be needed for the growing population of tomorrow. In the context of the global agricultural food system, the challenge is not only the need to feed an increasing population, but to do so within productivity constraints that are not always addressed by policy makers and scientists. Such productivity constraints may include limitations on the amount of arable land and non-renewable resources (particularly water), increases in urban populations, decreases in the number of people engaged in agriculture, the effects of climate change in agriculture, and increased competition for land due to urbanization or other land uses (Dyson 1999; Kishore and Shewmaker 1999; Conway 1999).
To date, productivity constraints have been addressed by technological innovations brought about through investments in research and development. Agricultural innovations have contributed to poverty alleviation efforts in the past by attempting to reduce vulnerability and in many cases by enhancing and/or increasing a given community’s asset base and/or productivity (Falck-Zepeda et al. 2002, Adato and Meinzen-Dick 2003). These innovations have had different degrees of success in influencing the policies, institutions and processes in rural communities, and the development of alternative or better strategies to support livelihood improvement.1
One such agricultural innovation is the use of improved crop varieties, landraces, hybrids, and other plant genetic materials. Collectively, genetic materials conserved and used for breeding have been referred to as ‘plant genetic resources for food and agriculture,’ or PGRFA (see FAO 2001). These unique and diverse resources have been the backbone of crop improvement for centuries, ever since crop domestication began. New varieties are continuously derived from PGRFA and are essential for agricultural improvement, just as they were during the Green Revolution, when PGRFA helped raise production levels, provide greater food security, and increase the incomes of numerous farmers in the developing world (Evenson and Gollin 2003). Newer biotechnology techniques also rely on PGRFA to ensure transfer of valuable traits for the benefit of poor farmers.
Farmers around the world can benefit from crops that have higher (maintained) yield potential, increased productivity, and cutting-edge resistance to biotic and abiotic stresses. These improvements, however, require public and private investment in plant breeding and biotechnology. Applications from modern biotechnology have the potential to be useful in addressing specific needs of the poor, but cannot realize their potential without investments in plant breeding research (Huang et al. 2002). Investments in pro-poor plant crop improvement research (including those that use biotechnology) may be hampered by a shift towards privatization and the inability of seed systems to deliver innovations to farmers (Pingali and Traxler 2003.) Conventional plant breeding has been shown to account for 50-60% of yield increases (Duvick 1997, Fernandez-Cornejo 2004), but plant breeders around the world continue to face challenges
1 In some cases, the agricultural innovative process may have fulfilled specific technical goals without successfully
addressing broader livelihood issues; while in others they have not only been unsuccessful in addressing specific needs but may have actually worsened vulnerability and food insecurity. The latter situation has been a wake-up call, warning the innovation system (particularly within the public sector) that it must better serve the needs of poor communities globally.

2
similar to those of the past, including the need to increase productivity, improve environmental quality, and provide new crop options for farmers.2
2 The importance (past, present and future) of plant breeding and related technologies for wheat and maize are summarized
by Hoisington et al. (1999).

3
2. RATIONALE, GOAL AND OBJECTIVES
Despite the recognized importance of reliable information on crop improvement, minimal data are available for public and private plant breeding in developing countries. To address this gap, the FAO launched a research project with several national and international partners in 2002. This research project included the design and implementation of a survey of all relevant organizations in multiple countries around the world. The FAO survey was designed to answer two main questions: 1) how are plant breeding programs directing financial, human, and institutional resources towards innovations derived from PGRFA that will help address food and production needs; and 2) based on the information analyzed, what policy changes can be recommended? To answer these questions, the survey examined and contrasted five critical factors over a 16-year timeline (1985-2001). The critical factors included:
• institutes with mandates for plant breeding and biotechnology,
• the trends and focus of each country’s plant breeding research,
• full-time equivalent (FTE) scientists working in plant breeding/biotechnology and their associated research budgets,
• PGRFA used for cultivar/variety development, and
• capacities and approaches for crop biotechnology and breeding.
After data collection was completed, an in-depth, standardized analysis of the trends and conditions for plant breeding in the public and private sector was undertaken by the FAO in collaboration with IFPRI and other Consultative Group for International Agricultural Research (CGIAR) centers. Here, we use the results of the in-depth analysis made by IFPRI on the FAO survey data collected for Cameroon, Kenya, the Philippines, and Venezuela. The data collected in the surveys measured the plant breeding and biotechnology capacity of each country, and their ability to deliver innovations based on PGRFA.3
The overarching goal of the FAO research study is to promote sustainable use of PGRFA through plant breeding. The present paper supports this goal by assessing the current state of, and trends associated with, national agricultural research capacities. Our background analysis and concluding recommendations provide a starting point for future strengthening of national plant breeding programs.4
Although not an explicit objective of the FAO survey, we frame our discussion within the broader context of an innovation capacity and systems framework. In addition, we outline a conceptual framework for plant breeding and biotechnology innovations based on studies done by Furman et al. (2003) and others. The innovative systems approach allows a broader and inclusive conceptual foundation, from which we derive potential policy instruments and approaches for the four countries included in the study. The innovation framework described here allows us to propose strategies for the four studied countries (and similar countries) and supports status mapping based on a country’s current plant breeding and biotechnology capacity and policy status relative to the overall strengths, limitations and opportunities of their national innovative capacity. In addition, the innovation framework allows us to identify explicit determinants of innovative capacity that may be used to pinpoint the gaps, limitations and/or strengths of the overall innovation system containing the components of plant breeding and biotechnology. Within this framework, it is possible to delineate a set of relevant policy interventions for internal discussion.
In the next section of this paper, we outline the conceptual framework we use to analyze plant breeding and biotechnology innovations. The fourth section describes the methodology we use to collect the data, and the limitations of these data. The fifth section analyzes the actual data by evaluating and
3 However, the scope of the survey did not include participative plant breeding programs. 4 The analyses and findings of this study are comparable to those from the plant breeding symposium held at Michigan State
University in March 2005 (Hancock 2006).

4
comparing national trends for financial allocation, output, and professional capacity. Section six identifies the determinants of innovation in plant breeding and biotechnology, and outlines policy situations and tools that could potentially be used as recommendations and guidelines for policy makers. The final section identifies opportunities to strengthen PGRFA use and priority-setting by plant breeding programs.

5
3. A CONCEPTUAL FRAMEWORK FOR PLANT BREEDING AND BIOTECHNOLOGY INNOVATION
The design and implementation of national policies aimed at addressing constraints can be significantly improved if these policies are drawn from a broad, inclusive and flexible conceptual framework. Such a conceptual framework will help develop better policy interventions by identifying the relative strength of intervening factors (the “determinants of innovation”) and by supporting strategic interventions based on the current and expected capacity to implement in-country research. Countries may use a conceptual framework to identify areas where gaps, limitations, and threats are rendering the innovative system inefficient, ineffective or unresponsive. This approach, in conjunction with a robust priority-setting process, development of policy matrixes, and other strategic approaches for technology assessment, will provide additional support for policy development. However, proper policy development requires that the chosen conceptual framework consider all stakeholders, linkages and institutions within the innovation and technology transfer system. This is the case with plant breeding, biotechnology, and PGRFA, which converge to produce crop bio-innovations for farmers. The discussion of the agricultural bio-innovation system in the present paper is based on the author’s adaptation of the Furman, Porter, and Stern (FPS) conceptual framework (Furman, et al. 2002).
The FPS conceptual framework considers two distinct levels of innovation and their linkages, as described in Appendix A. At an aggregate (national) level, the FPS model considers those determinants of innovation common to all innovative activities, which are included under the group titled “Common Innovation Infrastructure.” The Common Innovation Infrastructure is the foundation of a nation’s ability to support innovative activities, and in some cases even enable new ones. While it may be possible for specific groups or firms in a country to create innovation in the absence of a common national innovation infrastructure, the long-term national capacity to create innovations across a broader spectrum of disciplines is significantly hindered by the absence of a common innovation infrastructure. The minimum common innovation infrastructure needed to support group-specific (i.e. plant breeding and biotechnology) innovation is likely to vary from country to country, but it is critical to first view the system as a whole, and then examine the factors likely to affect innovation at the group-specific level.
Many innovations arise from specific groups conducting research. These groups, called “clusters” by Furman, Porter, and Stern (and other authors), are the basic unit of innovative capacity, and may consist of a group of researchers, institutes, firms or consortia of research teams. Each individual cluster is connected to other related clusters, and they interact to support innovative capacity (See Appendix A). Furthermore, each individual cluster (or group of clusters) is subject to a set of factor (input) and output demand conditions, as well as a firm-specific context of strategy and rivalry. At the same time, each cluster is closely tied to activities among related and supporting industries. This is a very dynamic process, where opportunities and ideas arise through the strength of the innovative system.
Although the figure in Appendix A shows plant breeding and biotechnology as two distinct clusters, they overlap quite significantly and may be combined into a single cluster that can be thought of as the “crop improvement” cluster. Note that the cluster-specific environment resides within the common innovative structure; thus, the quality of linkages between those levels of innovation (and between clusters) becomes critical in determining the national innovative capacity. In many empirical studies, these linkages have proven to be as critical to the innovation process as the internal cluster factors themselves.
The main objective of the FPS framework is to describe national innovative capacity by simultaneously examining the common infrastructure, linkages, and multiple clusters pertaining to innovation within a nation. Here, we limit our analysis to the common innovation infrastructure of a given country, and focus our discussion on the use/conservation of PGRFA, plant breeding and biotechnology (and all other related) clusters. The disadvantage of this abstraction is that it may reduce the explanatory ability of national innovative capacity in terms of quantitative analysis. However, this disadvantage may not be as large when the FPS national innovative framework is considered in terms of output (limited to

6
use/conservation of PGRFA, plant breeding and biotechnology outputs) and/or is used in a more qualitative analysis.
The components of the above-described national innovative capacity framework can be quite complex in nature but may be described using specific variables. In Appendix B, we propose a set of variables for use in examining the plant breeding and biotechnology innovative framework. These variables closely mimic those used in Furman, Porter and Stern (2002) and should be used in future discussions and analyses, in order to ensure general applicability in developing-country settings. To develop a quantitative FPS national innovative capacity framework it would be necessary to obtain a long-term time series for all these variables, a task that goes beyond the scope of this paper. Given this limitation we opted to use a subset of these frameworks, as the best workable alternative. In this strategy, it is critical to identify alternatives that fully describe the national common infrastructure for innovation, the cluster specific data, and the linkages between levels and components.
A major limitation of the FPS model is that it focuses on innovation, and thus fails to describe the process by which innovative outputs move from the laboratory into the hands of farmers. Furman, Porter and Stern recognize this limitation and use patents as a proxy for innovative outputs. Despite the potential flaws associated with this strategy, the authors rationalize that the parameter indicates the innovator’s willingness to commercialize an invention and potentially transfer it to end-users.
In the specific case of plant breeding and biotechnology, seed systems and other mechanisms for technology delivery to farmers are extremely important. Papers by Atanassov et al. (2004) and Cohen (2005) argue quite strongly that most public sector institutions have not yet been successful in transferring GM crops to farmers. 5 Significant investments are required for transferring the technology to farmers (e.g. obtaining biosafety regulatory approval, post-release monitoring, etc.) including generating knowledge about technology use. In fact the generated knowledge must accompany the technology in order to maximize its value to farmers (see Tripp 2001 and Falck-Zepeda 2006 for similar arguments). Therefore, public sector institutions need to find alternative strategies to deal with this new technology transfer environment; additional studies are warranted to optimize technology transfer supporting GM biotechnologies and monitor individual countries supporting such policies.
In this paper, we implement a simplified alternative framework and analyses previously described by Fuglie and Pray (2000) and Trigo (2003), and use it to demonstrate the advantages of the innovative capacity approach in supporting policy development. Both approaches are closely related to the Furman, Porter and Stern (2003) framework. The methodology used in our paper is described in the next section.
5 The only two exceptions are China and India, where public sector institutes released insect-resistant cotton developed
nationally. In the Indian case, the technology was developed by a public organization but technology transfer was done through a public-private partnership.

7
4. METHODOLOGY
FAO Plant Breeding Survey Development
Frey (2000) conducted a short, comprehensive survey of all plant breeding research institutes in the United States of America to identify and quantify all human and financial resources in the area. Thereafter, FAO identified the need to extend this seminal survey to national plant breeding programs in developing countries. The FAO survey was designed by a team of experts that met at FAO in 2003; this collaboration yielded an FAO project aimed at complete national surveying of plant breeding research and resources in developing countries (FAO 2005, 2006). As of October 2007, the FAO surveys had been completed in 50 countries and were in-progress in an additional 23 countries, as shown in Figure 1. Well recognized in-country plant breeding experts were recruited to conduct the survey in their respective countries. These in-country consultants were asked to survey all public and private sector organizations involved with plant germplasm conservation, enhancement and use in their respective countries.
Figure 1. FAO - Plant breeding and related biotechnology capacity survey status
Source: http://www.fao.org/AG/AGP/AGPC/doc/PBBC
Following data collection, FAO entered into a formal collaboration with IFPRI. IFPRI researchers assessed FAO data from 17 countries where survey had been completed at that time and chose to pursue further analysis of the four countries chosen for this study. IFPRI based its decision on two main criteria. The first criterion was data robustness, both in terms of the surveyed institutions and data quality. The second criterion was the location of the chosen countries, as the purpose of the initial analysis was to assess, compare and contrast countries on different continents. The present paper builds upon the

8
available individual country reports and data submitted by the consultants of each country chosen by IFPRI (Borges 2005, Songa 2005, and Kengue 2004)
FAO Survey Data Verification, Limits, and Approach
The original survey was designed to collect information up to 2001. At IFPRI’s request, some stakeholders updated the information to 2004, as important changes had occurred over the intervening years. In addition, IFPRI and other participants spoke at an FAO plant breeding meeting (Rome, February 11, 2005), requesting collection of additional data on the age distribution of human resource capacity, which had been identified as a critical issue. FAO was able to request this information from countries that were still in the process of completing their surveys, but budgetary constraints precluded data collection from all countries on this parameter.
The survey requested information on average overall budgets for plant breeding and biotechnology, and asked for a breakdown of percent allocation of resources. The rationale behind this approach, following that of Frey (1996, 1997, 1998), was to obtain an estimate from responsible individuals within the organization, and to override their natural hesitancy to provide information that may be viewed as confidential (by private firms) or may be hard to recall (as is sometimes the case for the public sector). Each national consultant collected data across five general categories:
1. institutional information, 2. human and financial resources dedicated to plant breeding and biotechnology, 3. effort allocation by crop, 4. sources of germplasm, and 5. output in terms of varieties released.
Since the Rome meeting in 2005, IFPRI has contacted four national experts from the Rome meeting to clarify inconsistencies and gaps in the country-level data. However, at present there are still questions regarding some of the responses in each country. In particular, the data on budgets and financial resources may be somewhat questionable as we identified a variation in terms how to measure financial resources and what to include in such estimation. From this standpoint, data on financial resources has to be viewed with some caution.
Innovative Capacity and the Mapping of Countries and Their Policy Situations
In Table 1, we introduce the general framework proposed by Fuglie and Pray (2000), which seeks to explain innovation and technology transfer of biotechnology innovations in terms of explanatory factors. The Fuglie and Pray approach explains biotechnology innovation using four distinct factors or “determinants” of innovative capacity: crop improvement, biotechnology capacities, field trials, and market size. Each of these determinants is in turn described by a distinct set of innovative influencing policies. As can be seen in Table 1, we should be able to use these indicators to cluster countries based on their functional capacity, and derive generic policy situation categories and tools for further analysis.
The approach taken in this paper is similar to that outlined by Trigo (2003), who uses a set of variables to rank countries in terms of their current potential to implement biotechnology and/or plant breeding. With the variables included in his framework, Trigo classifies countries according to three policy situations (or stages) ranked here from more to less advanced in capacity:
1. Building capacities to develop biotechnology based innovations. 2. Improving the efficiency and products of agricultural research through the use of
biotechnological tools (classified under large, medium and small markets). 3. Setting the stage for using biotechnology products.

9
The data analyzed in the next section will enable us to use the proposed conceptual framework to map the four countries examined in this study, within the above-described specific policy stages.
Table 1. Innovative outputs for developing economies in the FAO survey
Innovation Output
Indicator Unit Philippines Kenya Venezuela Cameroon
Improved varieties releases
Total number of improved varieties produced1
Number 138 (215) 153 192 100
Average of total number of varieties produced1
Number 43 33 48 25
Average growth rate of the number of varieties produced by public/private sectors across years and crops1
% 78 126 13 -36
Biotech products Biotechnology approved for confined/ small-scale field trials to 20062
Number 3 0 0
Biotechnology products approved for food/feed consumption and number of crops to 2006
Number/number 37/7 0/0 0/0 0/0
Source: Plant breeding and biotechnology capacity survey
10
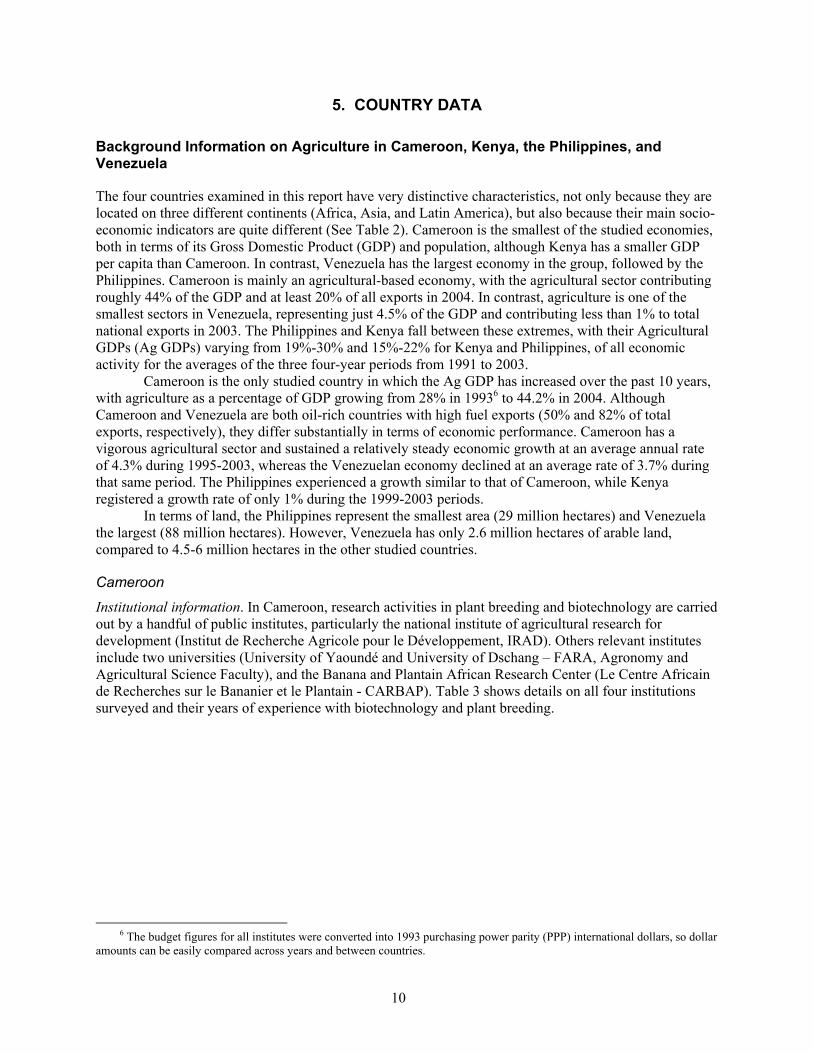
5. COUNTRY DATA
Background Information on Agriculture in Cameroon, Kenya, the Philippines, and Venezuela
The four countries examined in this report have very distinctive characteristics, not only because they are located on three different continents (Africa, Asia, and Latin America), but also because their main socio-economic indicators are quite different (See Table 2). Cameroon is the smallest of the studied economies, both in terms of its Gross Domestic Product (GDP) and population, although Kenya has a smaller GDP per capita than Cameroon. In contrast, Venezuela has the largest economy in the group, followed by the Philippines. Cameroon is mainly an agricultural-based economy, with the agricultural sector contributing roughly 44% of the GDP and at least 20% of all exports in 2004. In contrast, agriculture is one of the smallest sectors in Venezuela, representing just 4.5% of the GDP and contributing less than 1% to total national exports in 2003. The Philippines and Kenya fall between these extremes, with their Agricultural GDPs (Ag GDPs) varying from 19%-30% and 15%-22% for Kenya and Philippines, of all economic activity for the averages of the three four-year periods from 1991 to 2003.
Cameroon is the only studied country in which the Ag GDP has increased over the past 10 years, with agriculture as a percentage of GDP growing from 28% in 19936 to 44.2% in 2004. Although Cameroon and Venezuela are both oil-rich countries with high fuel exports (50% and 82% of total exports, respectively), they differ substantially in terms of economic performance. Cameroon has a vigorous agricultural sector and sustained a relatively steady economic growth at an average annual rate of 4.3% during 1995-2003, whereas the Venezuelan economy declined at an average rate of 3.7% during that same period. The Philippines experienced a growth similar to that of Cameroon, while Kenya registered a growth rate of only 1% during the 1999-2003 periods.
In terms of land, the Philippines represent the smallest area (29 million hectares) and Venezuela the largest (88 million hectares). However, Venezuela has only 2.6 million hectares of arable land, compared to 4.5-6 million hectares in the other studied countries.
Cameroon
Institutional information. In Cameroon, research activities in plant breeding and biotechnology are carried out by a handful of public institutes, particularly the national institute of agricultural research for development (Institut de Recherche Agricole pour le Développement, IRAD). Others relevant institutes include two universities (University of Yaoundé and University of Dschang – FARA, Agronomy and Agricultural Science Faculty), and the Banana and Plantain African Research Center (Le Centre Africain de Recherches sur le Bananier et le Plantain - CARBAP). Table 3 shows details on all four institutions surveyed and their years of experience with biotechnology and plant breeding.
6 The budget figures for all institutes were converted into 1993 purchasing power parity (PPP) international dollars, so dollar
amounts can be easily compared across years and between countries.

11
Table 2. Basic economic, production, and population data for study countries
Indicator Country 1991-1994 Average
1995-1998 Average
1999-2003 Average
Cameroon 30 42 44 Kenya 30 29 19 Philippines 22 20 15
Agriculture, value added (% of GDP)
Venezuela 5 5 4 Cameroon 2,420,666,784 3,064,765,817 4,032,175,922 Kenya 1,593,777,536 1,739,067,186 1,808,417,223 Philippines 10,337,120,387 11,045,273,223 12,399,414,375
Agriculture, value added (constant 2000 US$)
Venezuela 4,524,134,441 4,681,181,172 4,790,506,939 Cameroon -3.2 4.6 4.6 Kenya 0.9 3.1 1.0 Philippines 1.6 3.8 4.3
GDP growth (annual %)
Venezuela 3.4 2.6 -3.7 Cameroon 569 545 604 Kenya 360 361 346 Philippines 886 946 1003
GDP per capita (constant 2000 US$)
Venezuela 5429 5333 4691 Cameroon 46,540,000 46,540,000 46,540,000 Kenya 56,914,000 56,914,000 56,914,000 Philippines 29,817,000 29,817,000 29,817,000
Land area (hectares)
Venezuela 88,205,000 88,205,000 88,205,000 Cameroon 5,957,500 5,960,000 5,960,000 Kenya 4,225,000 4,350,000 4,550,000 Philippines 5,496,750 5,512,500 5,662,500
Land use, arable land (hectares)
Venezuela 2,657,750 2,587,750 2,556,500 Cameroon 12,538,758 13,931,825 15,440,691 Kenya 25,014,750 27,705,500 30,700,838 Philippines 64,608,033 70,737,140 78,253,712
Population, total
Venezuela 20,890,000 22,729,250 24,767,400
Source: World Development Indicators, 2005

12
Table 3. Participating countries, numbers of institutes, and experience with plant breeding and biotechnology by country
Country Contact expert Surveyed institutions
Type of institution
Plant breeding experience
Biotechnology experience
number years years Cameroon Dr. Joseph Kengue 5 Public 15-50 14-18 Kenya Dr. Josephine
Songa 10 Public 7-85 0-22
Private 1-27 0 Philippines Dr. Desiree Hautea 5 Public & Private 18-80 5-26 Venezuela Prof. Orangel
Borges 3 Public & Private 14-53 0-13
Source: Plant breeding and biotechnology capacity survey Note: 1) Public includes universities and national research organizations. Private includes national and multinational companies as well as private foundations. 2) Cameroon had no private sector organizations 3) The Philippines and Venezuela each had an institution type with only one respondent. Accordingly and based on the confidentiality agreement in our survey, we pooled the data for both public and private organizations.
Human/financial resources dedicated to plant breeding and biotechnology. Table 4 presents the distribution of scientists by degree and whether they conducted research in plant breeding or biotechnology during the study period. The total number of scientists involved in plant breeding research increased from 27 in 1995 to 38 in 2001. The increase in total number of scientists involved with plant breeding was the result of increases in the number of scientists’ at all educational levels. There was also an increase in the total number of scientists involved in biotechnology research in Cameroon, from 3 in 1985 to 18 in 2001. The number of Ph.D. scientists reached a maximum of 9 scientists in 1990 and decreased to 6 in 2001. The number of M.S. scientists remained fairly stable at 4-5, while the number of scientists with a B.S. degree increased from 4 in 1995 to 7 in 2001.
While these numbers represent an overall increase in the pool of knowledgeable people, the financial resources attributed to plant breeding did not increase at the same pace (See Table 5). In fact, there was a significant drop in plant breeding expenditures from a little over 4 million 1993 international dollars in 1985 to 905,000 in 1990, with the budget remaining around this level in the following years, showing only a slight increase over time. On the other hand, biotechnology-targeted resources peaked briefly in 1990 (at 403,000 1993 international dollars) and otherwise remained fairly stable around 218,000 1993 international dollars.
The sharp fall in resources for plant breeding seen around 1990 (Table 5) reflects the economic crisis experienced by Cameroon. The GDP fell almost 4% annually during the period 1987-1994, with a record 7.8% decrease rate seen in 1988. These circumstances forced the government to reduce its overall expenditures, thereby affecting all programs, including the crop breeding budgets.
These decreases in plant breeding resources, coupled with the observed increases in the number of scientists, meant that the expenditures per researcher decreased drastically after 1985. Indeed, expenditures per researcher in both plant breeding and biotechnology decreased significantly from 1985 to 2001. Expenditures for plant breeding fell from 169,000 to 27,000 1993 international dollars per researcher, while those for biotechnology fell from roughly 76,000 to 12,000. Although there is no available standard that we can use to judge this level of per-researcher expenditure, policy makers in Cameroon should probably be concerned about the sustainability of research and development (R&D) activities with such a limited per researcher budget.
13
Table 4. Distribution of human resources by degree, area of expertise, and country
Plant Breeding Biotechnology B. S. M. S. Ph. D. Total B. S. M. S. Ph. D. Total
Cameroon 1985 10 9 8 27 - - 3 3 1990 27 10 13 50 4 4 9 17 1995 16 11 12 39 8 4 8 20 2001 13 12 13 38 7 5 6 18 Kenya 1985 20 16 4 39 0 0 5.3 4.3 1990 8 27 8 42 0 0 5.7 5.7 1995 8 22 20 50 0 0 5.3 5.3 2001 7 25 20 52 1 0 5.3 6.3 Philippines 1985 56 33 9 98 8 3 1 12 1990 76 50 12 138 10 12 2 24 1995 57 58 22 137 10 13 6 29 2000 43 54 30 127 8 10 8 26 2004 40 40 30 110 10 8 12 30 Venezuela 1985 22 29 2 53 0 2 0 2 1990 19 39 4 62 3 3 1 7 1995 7 25 9 41 0 7 6 13 2001 4 33 10 47 1 6 7 14 TOTAL for four countries
1985 108 87 23 217 8 5 9 21 1990 130 126 37 292 17 19 18 54 1995 88 116 63 267 18 24 25 67 2001 67 124 73 264 17 21 26 64
Source: Plant breeding and biotechnology capacity survey
Effort allocation by crop. In 2001, the largest shares across all organizations surveyed in Cameroon were allocated to germplasm enhancement7 (35%) and line evaluation8 (39%), while line development accounted for 26% of the total effort dedicated to plant breeding. In real terms, public sector organizations in Cameroon invested 0.37 million in germplasm enhancement, 0.27 million in line development and 0.41 million for line evaluation. The total investment across all studied activities was 1.05 million 1993 international dollars.
7 Germplasm enhancement indicates any activity that includes: a) gene transfer via sexual or asexual means from germplasm
accessions; b) increasing the frequencies of desirable genes in crop pools that will be used for developing parents or cultivars and c) germplasm characterization (Frey, 1996 and 2000);
8 Line development indicates any activity of crossing and selection that has the direct purpose of developing or releasing varieties. Line evaluation indicates any activity of evaluating advanced breeding lines or introduced varieties with the direct purpose of releasing varieties. This includes both on-station and on-farm evaluations.

14
Table 5. Financial resources and resources per researcher (1993 international PPP dollars)
Financial resources Financial resources per researcher Country Year Total Plant breeding Biotechnology Plant breeding Biotechnology
1993 international PPP dollars, thousands 1993 international PPP dollars Cameroon 1985 20,212 4,589 231 169,967 76,942 1990 5,880 905 403 18,091 23,687 1995 15,977 1,030 208 26,399 10,383 2001 27,145 1,050 218 27,643 12,122 Kenya 1985 15,138 9,096 736 232,640 171,242 1990 32,070 18,068 2,837 426,123 497,673 1995 14,210 7,927 1,337 159,825 252,263 2001 13,629 6,773 1,634 129,744 259,380 Philippines 1985 12,059 8,982 280 91,653 23,317 1990 18,281 10,907 1,371 79,038 57,135 1995 26,209 10,952 2,562 79,940 88,333 2000 57,068 14,896 6,608 117,293 254,172 2004 149,219 21,619 7,808 196,532 260,275 Venezuela 1985 3,028 615 7 11,602 3,628 1990 3,753 546 16 8,804 2,220 1995 20,871 1,688 117 41,182 9,033 2001 8,749 1,384 79 29,445 5,618
Source: Plant breeding and biotechnology capacity survey
The distribution of expenditures by crop (Figure 2) shows that in 1985 the four crops and crop groups with the highest emphasis in terms of expenditures were maize, rice, vegetables and fruits, and roots and tubers. By 2001, however, the highest expenditures were on vegetables and fruits, followed by fiber crops (cotton), roots and tubers, and maize.

15
Figure 2 Cameroon - Plant breeding budget by crop (as a percentage of total breeding budget)
Source: Plant breeding and biotechnology capacity survey
Sources of germplasm. As shown in Table 6, the highest share of germplasm source (55%) was represented by local germplasm banks, which included local and national sources. The public sector tapped unto bilateral agreements, CGIAR and germplasm evaluation networks, accounting for 38% of germplasm sources. The private sector supplied only 5% of all sources of germplasm to the public sector in Cameroon.
0 5
10 15 20 25 30 35 40 45
whe
at
rice
ma
ize
sorg
hum
smal
l gr
ains
oils
eed
fiber
cro
ps
root
s &
tu
bers
suga
rca
ne
legu
mes
(c
owpe
a)
veg
& fr
uits
mis
c..
1985 1990 1995 2001
16
Table 6. Sources of germplasm
Country Type Local germplasm
bank
National germplasm
bank
Introduction through
bilateral or multilateral agreements
Introduction through
germplasm evaluation networks
CGIAR gene
banks
Public organizations in industrialized
countries
Private sector
ALL
Cameroon Public 55% 2% 17% 10% 11% 0% 5% 100% Total 55% 2% 17% 10% 11% 0% 5% 100% Kenya Public 31% 24% 1% 12% 32% 0% 0% 100% Private-Local 37% 14% 0% 1% 11% 38% 0% 100% Private-Multinational 100% 0% 0% 0% 0% 0% 0% 100% Total 39% 19% 0% 8% 24% 9% 0% Philippines Total Public and Private 5% 37% 5% 18% 25% 2% 8% 100% Venezuela Total Public and Private 29% 30% 4% 17% 15% 4% 0% 100%
Source: Plant breeding and biotechnology capacity survey
Output in terms of varieties or lines released. The number of varieties released by the public sector in Cameroon decreased over time, from 37 varieties released in 1985 to 6 varieties in 2001 (Table 7a). In 1985, the public sector in Cameroon released varieties of all main crops except for sorghum, millet, vegetables and fruits. In contrast, in 2001, the public sector in Cameroon only released varieties of rice, fiber crops, vegetables and fruits. Although the number of varieties released can be used to describe the effectiveness of outputs produced by the public and private sectors in a given country, the percentage of adoption (or area planted) of varieties released by both sectors would be a much better indicator, as it would speak to the quality of the released varieties. However, it is difficult to consistently obtain such information in many countries worldwide. This is a limitation for the analysis and Cameroon and for all the countries in this paper.
Table 7a. Cameroon - number of varieties released.
Year Wheat Rice Maize Sorghum & millet
Other small grains
Oil seeds
Fiber crops
Roots & tubers Forages
Other legumes
Vegetable & fruits
Misc. TOTAL
1985 4 4 2 0 2 2 5 3 4 10 0 1 37 1990 4 5 5 0 2 2 7 0 2 2 0 1 30 1995 8 7 5 0 1 1 2 0 2 0 1 0 27 2001 0 2 0 0 0 0 2 0 0 0 2 0 6
TOTAL 16 18 12 0 5 5 16 3 8 12 3 2 100 Source: Plant breeding and biotechnology capacity survey Note: Public institutions only

17
Overall, the above-described survey results for Cameroon suggest that instead of diverting resources to biotechnology, particularly modern biotechnology, policy makers in this country should probably place more emphasis on improving the basic infrastructure and human resources for agricultural research, in order to develop a more solid conventional plant breeding program.
Kenya
Institutional information. At least ten institutions in Kenya, including both public and private, have on-going programs for plant breeding research. These organizations include one public research institution, four public universities, and five private seed companies (Table 3). The oldest and largest among them is the Kenyan Agricultural Research Institute (KARI), which has been involved in plant breeding for more than 85 years. In 1999, the Agricultural Science and Technology Indicators (ASTI) database estimated that KARI accounted for more than half of the national agricultural research expenditure and staff.
A major player representing the private seed sector in Kenya is a producers’ organization called the Seed Traders Association of Kenya (STAK), which was established in 1982. STAK, through the auspices of the Kenya Plant Health Inspectorate Services (KEPHIS), is licensed to produce, process and/or distribute seeds in Kenya. STAK members are currently involved in the research and multiplication activities of most important crops in this country, such as maize, wheat, beans, sunflower, vegetables and fodder. The member seed companies, which currently comprise 20 private firms, contribute nearly 90% of Kenya’s total formal seed sector. Out of the 20 firms, only four support R&D activities (namely breeding and varietal release). Most biotech research in Kenya especially that focused on maize is carried out by the multinational firms9.
Kenya is one of the few African countries with an ongoing research agenda in biotechnology. The IFPRI Next Harvest 2002 study (Atanassov et al. 2004) documented six GM projects led by KARI, aimed at improving insect, herbicide and virus resistance in maize, cotton, sweet potatoes, and potatoes. However, the overall budget and resources for biotechnology have declined since 1990 while the number of researchers has increased, signaling detrimental decreases in per-researcher resources.
Human and financial resources dedicated to plant breeding and biotechnology. Table 4 shows the total number of research staff members employed in plant breeding and biotech (FTE employees) in Kenya from 1985 to 2001. Overall, the total number of research staff members increased in both areas, from 39 to 52 and from 0.3 to 6.3 for plant breeding and biotechnology, respectively.
In contrast, the total financial resources for public and private plant breeding in Kenya declined from 1985 to 2001, at almost the same rate as the decline in this country’s overall agricultural research budget (Table 5). Funding for plant breeding increased to 18 million 1993 international dollars in 1990, but decreased significantly thereafter, until the funding in 2001 was below that seen in 1985. In contrast, the funding for biotechnology R&D steadily increased from 0.73 million in 1985 to 1.6 million in 2001.
The 25 percent decline in the level of financial resources allocated for plant breeding from 1985 to 2001, concurrent with increases in the number of research staff members (particularly at the Ph.D. level) reduced the level of per-researcher expenditure. Expenditures per researcher decreased almost in half from 1985 to 2001, whereas biotechnology saw a small increase in funding. The serious decline in per-researcher expenditure for plant breeding is likely to limit Kenya’s research capabilities in this area
Total allocations by institutions participating in agricultural research for plant breeding and biotechnology R&D increased from 1985 to 1990, and decreased thereafter until the 2001 levels were similar to those of 1985. A similar trend was seen in the budget for plant breeding. These fluctuations are consistent with ASTI findings for overall trends in agricultural R&D expenditures during this period.
Effort allocation by crop. In the case of fund allocation in Kenya, line evaluation comprised the largest share (55%) of investments, whereas germplasm enhancement and line development represented 23% and
9 When asked about perceived causes underlying the slow growth of the private sector and research capabilities in Kenya, survey respondents cited heavy government restrictions on access to new germplasm for further development across the east African countries in the region.

18
22% of those expenditures in plant breeding, respectively. These trends show that research efforts in Kenya during the study period were geared more toward adapting existing lines rather than developing new seeds.
As seen in Figure 3, the percent shares of resources dedicated to maize, oilseeds, forages, and wheat decreased in Kenya over the study period. The percent shares of roots and tubers, fiber crops, rice, and other small grains remained fairly constant, but represented a relatively small part of the overall breeding budget. Finally, the percent shares of sorghum/millet, other legumes and vegetables and fruits increased over time.
Figure 3. Kenya- Plant breeding budget by crop (as a percentage of total breeding budget).
Source: Plant breeding and biotechnology capacity survey
Contrary to the case in Cameroon, Kenya had a functional private sector investing in plant and/or biotechnology R&D, allowing us to separate effort allocation by type of institution. Figure 4 shows germplasm enhancement, line development and line evaluation differentiated into their public and private sector effort allocations. As expected, the Kenyan private sector invested the most in line evaluation and the least in germplasm enhancement during the study period. Unexpectedly, the public sector targeted an even higher share of its investments into line evaluation activities, compared to the private sector. We speculate that this is probably due to the ongoing evolution of the plant breeding system in Kenya, where the public sector has traditionally dominated and the private sector is just starting to enter the market.
0 5
10 15 20 25 30 35 40
whe
at
rice
mai
ze
sorg
hum
mill
et
othe
r sm
all
grai
ns
oils
eed
fiber
cro
ps
root
&tu
bers
fora
ges
othe
r le
gum
es
veg
&
frui
t
mis
c.
1985 1990 1995 2001

19
Figure 4. Kenya- Distribution of plant breeding emphasis by type of institution, 2001 thousand 1993 international dollars
Source: Plant breeding and biotechnology capacity survey
Sources of germplasm. As shown in Table 6, the sources of germplasm for plant breeding efforts in Kenya came mainly from local and national germplasm banks (58%), with a smaller percentage coming from CGIAR gene banks (24%), public organizations in industrialized countries (9%), and the private sector (8%). The survey results indicate that private multinational companies in Kenya drew 100% of their sources from local germplasm banks during the study period, whereas private local companies were more diversified, with 51% of their germplasm coming from local and national germplasm banks and another 38% from public organizations in industrialized countries.
Output in terms of varieties or lines released. In 2001, Kenya saw 45 varieties released from the public sector and 15 from the private sector (Table 7b). These numbers were higher than those for 1985, when the public and private sectors released 15 and four varieties, respectively.
The Philippines
Institutional information. The Philippines have a significant number of institutions dedicated to agricultural research. The survey contained consistent data across five public and private sector institutions, representing 18-80 and 5-26 years of experience in plant breeding and biotechnology, respectively (see Table 3). We herein report aggregated public-private sector data because only one out of the five institutes was from the private sector.
0 500
1000 1500 2000 2500 3000 3500 4000
Germplasm Enhancement Line Development Line Evaluation
Public Private Total

20
Table 7b. Kenya - number of varieties released
Institution type Year Wheat Rice Maize
Sorghum &
millet
Other small grains
Oil seeds
Fiber crops
Roots &
tubers Forages
Other legumes
Vegetables & fruits
Misc.
TOTAL
Public 1985 5 0 2 4 2 2 0 0 0 0 0 0 15 1990 4 1 0 0 0 3 0 0 0 2 0 0 10 1995 3 4 1 3 7 0 30 0 0 7 0 0 55 2001 5 0 1 1 3 0 0 5 0 19 11 0 45 Sub-total 17 5 4 8 12 5 30 5 0 28 11 0 125 Private 1985 0 0 2 0 0 2 0 0 0 0 0 0 4 1990 0 0 0 0 0 1 0 0 0 0 1 0 2 1995 0 0 5 0 0 2 0 0 0 0 0 0 7 2001 0 0 7 0 0 0 0 0 0 0 8 0 15 Sub-total 0 0 14 0 0 5 0 0 0 0 9 0 28 All 1985 5 0 4 4 2 4 0 0 0 0 0 0 19 1990 4 1 0 0 0 4 0 0 0 2 1 0 12 1995 3 4 6 3 7 2 30 0 0 7 0 0 62 2001 5 0 8 1 3 0 0 5 0 19 19 0 60 TOTAL 17 5 18 8 12 10 30 5 0 28 20 0 153 Source: Plant breeding and biotechnology capacity survey
21
Human and financial resources dedicated to plant breeding and biotechnology. Table 4 shows the distribution of human resources for the plant breeding and biotechnology organizations surveyed in the Philippines. The total number of scientists involved in plant breeding increased from 1985 to 1990, when it peaked at 138 researchers, and decreased thereafter to 110 in 2004. In contrast, the total number of scientists involved with biotechnology more than doubled over the study period, from 12 in 1985 to 30 in 2004. Examination of the distribution by each scientist’s degree for plant breeding reveals that the number of B.S. scientists decreased, the number of M.S. scientists increased slightly, and the number of Ph.D. scientists increased significantly, from 9 in 1985 to 30 in 2004. The number of scientists in biotechnology increased across all scientists’ degrees, with the highest increase seen at the Ph.D. level where it increased from 1 scientist in 1985 to 12 in 2004. This pattern may suggest that the Philippines pursued advanced techniques through investments in human resources during the study period.
There is some concern regarding the lack of a new generation of scientists within the R&D system to take over for retiring scientists. To address this concern, we conducted a follow-up survey of the age distribution of scientists in the Philippines at the surveyed institutes10. The results of this exercise (Figures 5a-c) show that the age distribution of plant breeding and biotechnology researchers is indeed increasing over time. Although the number of Ph. D. scientists in the Philippines has increased significantly over the period (1985-2004), the hiring of young scientists has decreased and altogether stopped by 2004. As most scientist are now over age 45, it is important that policy makers in the Philippines develop and implement plans towards training a new cadre of scientists.
Figure 5a. The Philippines - Number of Ph.D. researchers by age distribution.
Source: Plant breeding and biotechnology capacity survey
10 Although we would have liked to extend this question to the other three studied countries, we were limited by a lack of
financial resources. This research will be of particular interest in future iterations of our project.
0
5
10
15
20
25
30
1985 1990 1995 2000 2004
<25 26-35 36-45 46-55 >56
22
Figure 5b. The Philippines - Number of M.S. researchers by age distribution.
Source: Plant breeding and biotechnology capacity survey
Figure 5c. The Philippines - Number of B.S. researchers by age distribution
Source: Plant breeding and biotechnology capacity survey
Table 5 shows data on the financial resources available for plant breeding and biotechnology efforts in the Philippines from 1985 to 2004. The total financial resources for the surveyed institutes increased for both plant breeding and biotechnology. The total budget for plant breeding increased from 8.9 million international dollars in 1985 (given in 1993 dollars) to 21 million in 2004, while that for biotechnology increased from 0.28 million international dollars in 1985 to 7.8 million in 2004. These increases in human and financial resources for both plant breeding and biotechnology indicate that the government of the Philippines and other investors viewed investments in R&D as promising over this period. However, development of technologies to address productivity constraints in the agricultural sector is still needed.
0
10
20
30
40
50
60
1985 1990 1995 2000 2004
< 25 26 -35 36 -45 46 -55 > 56
0
10
20
30
40
50
60
1985 1990 1995 2000 2004
<25 26 -35 36 -45 46 -55 >56

23
Table 5 also shows that the financial resources available per researcher increased in both plant breeding and biotechnology from 1985 to 2004. The rate of increase was higher for biotechnology during this period, with per-researcher funds in plant breeding nearly doubling from a 1985 level of 91,000 1993 international dollars to 196,000 in 2004, while those for biotechnology increasing nearly 10-fold from 23,000 international dollars in 1985 to 260,000 in 2004.
A given country’s investments in financial and human resources for research activities should be evaluated in terms of their relative contribution to improving societal welfare and other metrics. One method of evaluation is to contrast the investments made in a particular crop with their relative contribution to the economy in terms of value of production. This metric is limited in that it tends to mask social impact of the crop and discriminate against intensive production crops such as vegetables and/or orphan crops, while not giving an estimation of potential future value11. Therefore, this metric is combined with others to properly assess priority setting and post-activity evaluation processes, in both private and social terms. Here, we include this metric in order to showcase the utility of such analyses in countries that have a fairly mature market economy, such as the Philippines.
To start assessing the congruency of plant breeding spending by crop with the actual importance of those crops in the economy, we compare the percentages spent for the main crops/groups with their participation in terms of value of crop production. Ideally, this comparison would be done with the same base year. Since this information is not available, we examine the value of production calculated with FAO 1986-91 average international prices in dollars, versus the plant breeding expenditure in 1993 international dollars. Although these figures have different base years and are thus not strictly comparable, we can get a rough estimate by comparing the percentages rather than absolute values (see Figures 6a and 6b).
Figure 6a. The Philippines - Plant breeding budget by crop (as a percentage of total breeding budget)
Source: Plant breeding and biotechnology capacity survey
11 We thank an anonymous reviewer for pointing out the need to present these well known limitations in this paper.
0.010.020.030.040.050.060.070.080.090.0
100.0
whe
at
rice
mai
ze
coco
nut
sesa
me
oo fi
ber
crop
root
&
tube
rs
oo le
gum
es
vege
tabl
es
frui
ts
orna
men
tals
mis
c .
1985 1990 1995 2000 2004

24
Figure 6b. The Philippines - Value of crop production (as a percentage of total value of crop production)
Source: Plant breeding and biotechnology capacity survey
Our analysis reveals that the most important crops in the Philippines in terms of value of production during the examined time period were rice, coconut, bananas, fresh vegetables, and tropical fruits. These five groups accounted for more than 70% of the value of crop production in 2004. Figures 6a and 6b show that there is not a smooth congruency between the economic importance of a given crop or group of crops and the corresponding expenditure in plant breeding. For example, the production value share of rice in the Philippines (crops only) was around 30% over the past 20 years, whereas the FAO survey results indicate that plant breeding expenditures in rice oscillated between 18% and 60% of total expenditures in plant breeding during this period. Plant breeding expenditures in vegetables showed similar percentages, but their participation in the crop economy was only around 10%. Unfortunately, the FAO survey only collected data for vegetables as an aggregated group, meaning that we lack access to plant breeding investment data broken down by vegetable type. Our preliminary analysis, however, suggests that vegetable-type correlations between investment and value could be an important part of future efforts to assess the direction of plant breeding expenditures.
Effort allocation by crop. Allocation of plant breeding efforts in the Philippines over the study period was relatively balanced across germplasm enhancement (28%), line development (36%) and line evaluation (36%) activities, as shown by the financial resources invested in these areas. In terms of actual resources invested, the surveyed organizations invested 5.9 million dollars in germplasm enhancement, 7.7 million in line development, and 7.6 million in line evaluation, for a total plant breeding investment of 21.3 million dollars (all expressed as 1993 international dollars).
Figure 7 shows these data disaggregated by plant breeding emphasis and by type of institution in the Philippines. As expected, the private sector tended to focus more on line development and evaluation, and less on germplasm enhancement, compared to the public sector (however, private investments were made in all three areas). This is congruent with the suggestion made by Falck-Zepeda and Traxler (2000), who proposed that private sector plant breeding institutions tend to concentrate their efforts more on applied rather than basic research.
0.0
10.0
20.0
30.0
40.0
50.0
60.0
70.0 w
heat
rice
mai
ze
coco
nut
sesa
me
oo fi
ber
crop
root
&tu
bers
oo le
gum
es
vege
tabl
es
frui
ts
mis
c.
1990 1995 2001 2004

25
Sources of germplasm. As shown in Table 6, 42% of all germplasm in the Philippines was sourced from local or national germplasm banks during the study period, with an additional 25% coming from CGIAR gene banks, 2% from public organizations in other industrialized countries, and 8% from the private sector.
Figure 7. The Philippines - Distribution of plant breeding emphasis by type of institution, 2004 (thousand 1993 international dollars).
Source: Plant breeding and biotechnology capacity survey
Output in terms of varieties or lines released. The number of varieties released reported in Table 7c for the Philippines were estimated differently than for the other three countries in this paper. The procedure followed by the consultant hired by FAO in the Philippines was to estimate a three-year average of the number of varieties reported for each crop, centered on the year reported in the first column of the table. The total number of varieties is the sum of each row in the table. Total varieties released increased up to the year 2000, but decreased slightly in 2004. Vegetables and fruits have the highest number of varieties released over the period of the survey, followed by oilseeds and then rice.
0
1000
2000
3000
4000
5000
6000
7000
8000
9000
Germplasm Enhancement Line Development Line Evaluation
Public Private Total

26
Table 7c. The Philippines - number of varieties released
Year Wheat Rice Maize Sorghum &
millet
Other small grains
Oil seeds
Fiber crops
Roots &
tubers
Forages Other legumes
Vegetables &
fruits
Ornamentals Total
1985 0 0 0 0 0 0 0 0 0 0 0 0 0
1990 1 2 1 0 0 2.5 1 4 0 0.5 5 0 17
1995 0 3 5 0 0 3.5 0 3 0 0.5 28 0 43
2000 0 9 7 0 0 7.5 1 9 0 0.5 26 18 78
2004 0 13 0 0 0 25.1 0 2 0 0.5 31 6 77.6
TOTAL 1 27 13 0 0 38.6 2 18 0 2 90 24 215.6
Source: Plant breeding and biotechnology capacity survey Notes: a) Data include public and private institutions; b) oilseeds include soybeans, coconut and sesame.
Venezuela
Institutional information. Although five institutes in Venezuela were identified and surveyed, this report includes only those three for which complete financial data were available. Even though the social importance of agriculture is small within the Venezuelan economy, due to the abundant resources provided by oil production, we can see from Table 3 that the organizations in our survey have made long-term commitments to plant breeding and biotechnology efforts.
Human and financial resources dedicated to plant breeding and biotechnology. As shown in Table 4, the total number of scientists involved in plant breeding in the surveyed Venezuelan institutes decreased slightly from 53 in 1985 to 47 in 2001. In contrast, the total number of scientists involved with biotechnology increased seven-fold, from two in 1985 to 14 in 2001. Examination of the distribution by each scientist’s degree reveals that in the case of plant breeding, the number of B.S. scientists decreased over the study period, the number of M.S. scientists increased slightly, and the number of Ph.D. scientists increased significantly from two in 1985 to 10 in 2001. In biotechnology, the number of both M.S. and B. S. scientists in biotechnology decreased, while there was a significant increase at the Ph.D. level. This pattern seems to suggest that Venezuela pursued technical advancement in plant breeding and biotechnology through investments in human resources during the survey period.
The total financial resources for both plant breeding and biotechnology among the surveyed institutes, expressed as 1993 international dollars, increased overall between 1985 and 2001, although a small decline was seen in 2001 (Table 5). The investments were relatively small in comparison to those of the other surveyed countries. The total budget for plant breeding increased from 615,000 1993 international dollars in 1985 to 1.38 million in 2001. The change in biotechnology spending was much larger in relative terms, as it increased from 7,000 dollars in 1985 to 79,000 dollars in 2001. This small level of investment reflects the relatively low value of agriculture in the Venezuelan economy. However, the increases in both human and financial resources for both plant breeding and biotechnology among the public and private sector organizations in Venezuela suggest that these areas are gaining increased attention and investors are seeking to address productivity constraints in the agricultural sector.
Table 5 also shows that the financial resources available per researcher increased in both plant breeding and biotechnology from 1985 to 2001, with the rate of increase in plant breeding exceeding that in biotechnology. The average financial resources per plant breeder totaled 11,602 (in 1993 international dollars) in 1985, and increased by 153% to $29,445 in 2004. In contrast, the per-researcher funding for a biotechnologist increased by only 55%, from $3,628 in 1985 to $5,618 in 2004. Although there are no real standards for comparing these indicators, the level of financial resources per researcher in Venezuela was the lowest during this period compared to any of the three other countries studied herein.
27
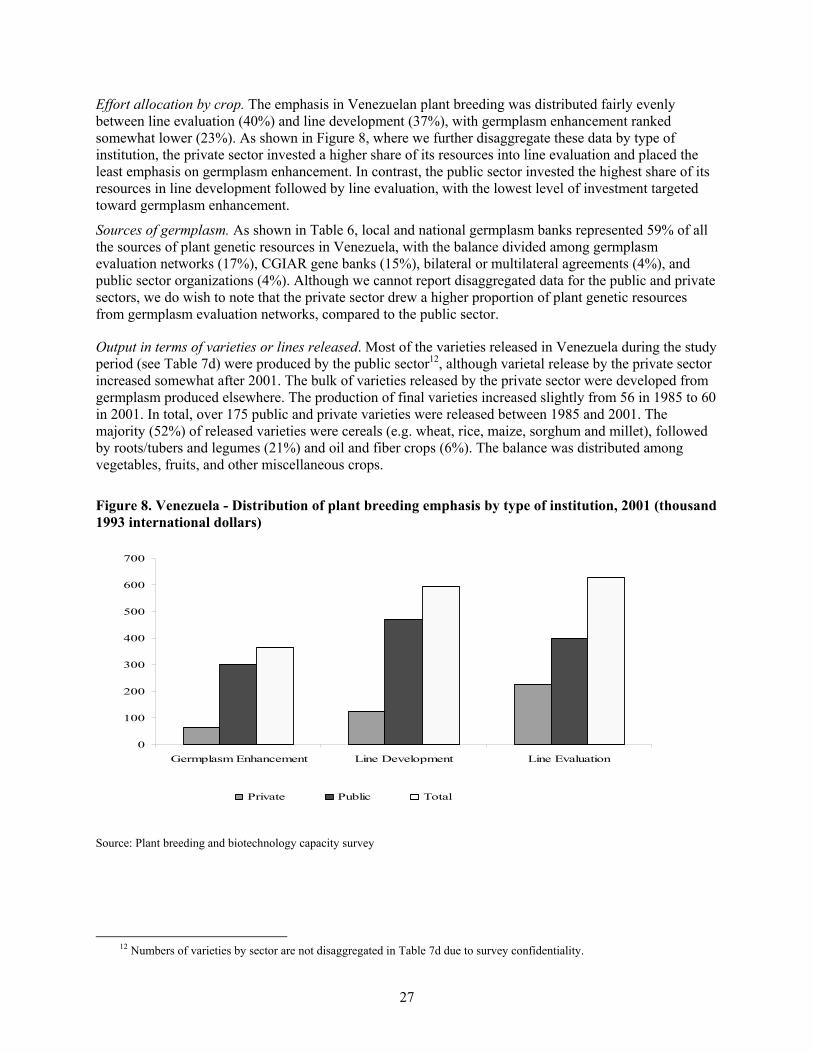
Effort allocation by crop. The emphasis in Venezuelan plant breeding was distributed fairly evenly between line evaluation (40%) and line development (37%), with germplasm enhancement ranked somewhat lower (23%). As shown in Figure 8, where we further disaggregate these data by type of institution, the private sector invested a higher share of its resources into line evaluation and placed the least emphasis on germplasm enhancement. In contrast, the public sector invested the highest share of its resources in line development followed by line evaluation, with the lowest level of investment targeted toward germplasm enhancement.
Sources of germplasm. As shown in Table 6, local and national germplasm banks represented 59% of all the sources of plant genetic resources in Venezuela, with the balance divided among germplasm evaluation networks (17%), CGIAR gene banks (15%), bilateral or multilateral agreements (4%), and public sector organizations (4%). Although we cannot report disaggregated data for the public and private sectors, we do wish to note that the private sector drew a higher proportion of plant genetic resources from germplasm evaluation networks, compared to the public sector.
Output in terms of varieties or lines released. Most of the varieties released in Venezuela during the study period (see Table 7d) were produced by the public sector12, although varietal release by the private sector increased somewhat after 2001. The bulk of varieties released by the private sector were developed from germplasm produced elsewhere. The production of final varieties increased slightly from 56 in 1985 to 60 in 2001. In total, over 175 public and private varieties were released between 1985 and 2001. The majority (52%) of released varieties were cereals (e.g. wheat, rice, maize, sorghum and millet), followed by roots/tubers and legumes (21%) and oil and fiber crops (6%). The balance was distributed among vegetables, fruits, and other miscellaneous crops.
Figure 8. Venezuela - Distribution of plant breeding emphasis by type of institution, 2001 (thousand 1993 international dollars)
0
100
200
300
400
500
600
700
Germplasm Enhancement Line Development Line Evaluation
Private Public Total
Source: Plant breeding and biotechnology capacity survey
12 Numbers of varieties by sector are not disaggregated in Table 7d due to survey confidentiality.
28
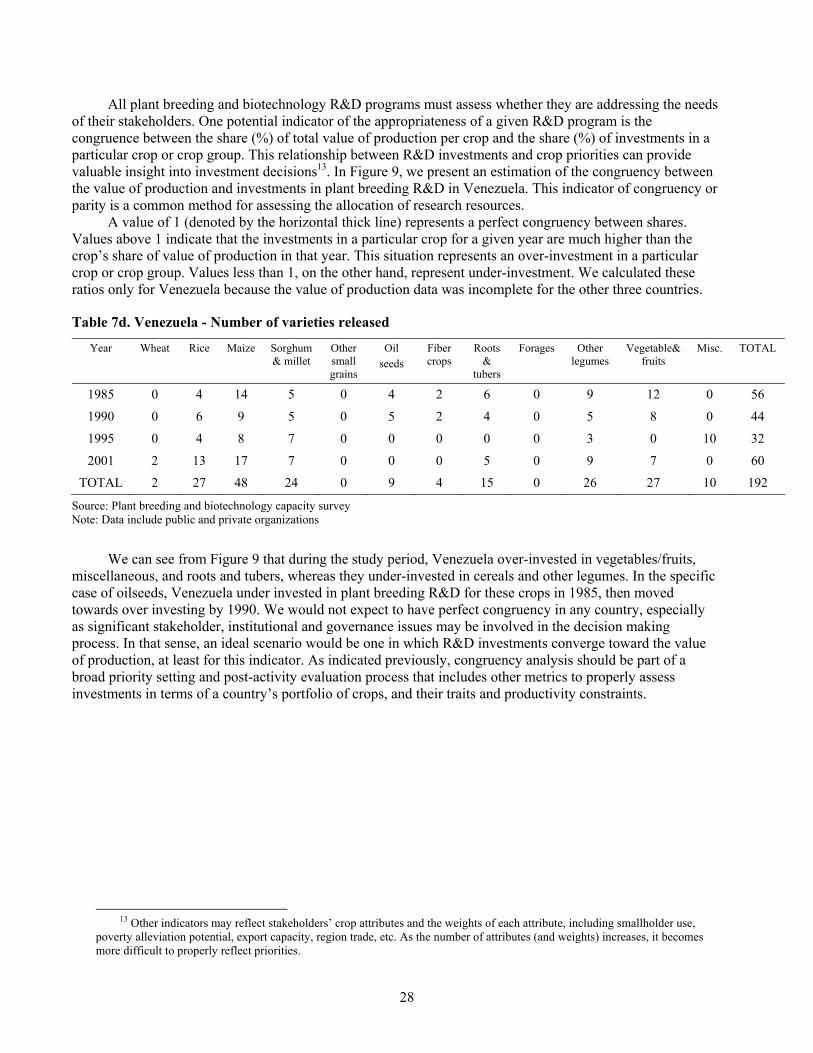
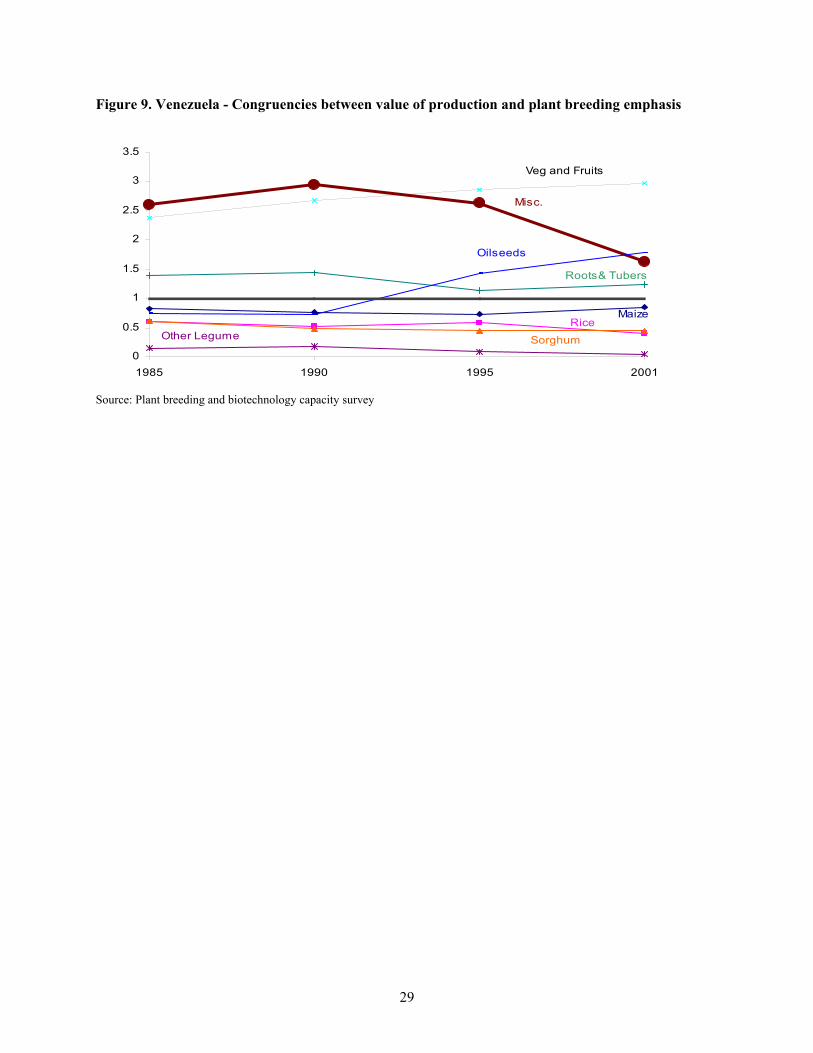
All plant breeding and biotechnology R&D programs must assess whether they are addressing the needs of their stakeholders. One potential indicator of the appropriateness of a given R&D program is the congruence between the share (%) of total value of production per crop and the share (%) of investments in a particular crop or crop group. This relationship between R&D investments and crop priorities can provide valuable insight into investment decisions13. In Figure 9, we present an estimation of the congruency between the value of production and investments in plant breeding R&D in Venezuela. This indicator of congruency or parity is a common method for assessing the allocation of research resources.
A value of 1 (denoted by the horizontal thick line) represents a perfect congruency between shares. Values above 1 indicate that the investments in a particular crop for a given year are much higher than the crop’s share of value of production in that year. This situation represents an over-investment in a particular crop or crop group. Values less than 1, on the other hand, represent under-investment. We calculated these ratios only for Venezuela because the value of production data was incomplete for the other three countries.
Table 7d. Venezuela - Number of varieties released
Year Wheat Rice Maize Sorghum & millet
Other small grains
Oil seeds
Fiber crops
Roots&
tubers
Forages Other legumes
Vegetable& fruits
Misc. TOTAL
1985 0 4 14 5 0 4 2 6 0 9 12 0 56
1990 0 6 9 5 0 5 2 4 0 5 8 0 44
1995 0 4 8 7 0 0 0 0 0 3 0 10 32
2001 2 13 17 7 0 0 0 5 0 9 7 0 60
TOTAL 2 27 48 24 0 9 4 15 0 26 27 10 192
Source: Plant breeding and biotechnology capacity survey Note: Data include public and private organizations
We can see from Figure 9 that during the study period, Venezuela over-invested in vegetables/fruits, miscellaneous, and roots and tubers, whereas they under-invested in cereals and other legumes. In the specific case of oilseeds, Venezuela under invested in plant breeding R&D for these crops in 1985, then moved towards over investing by 1990. We would not expect to have perfect congruency in any country, especially as significant stakeholder, institutional and governance issues may be involved in the decision making process. In that sense, an ideal scenario would be one in which R&D investments converge toward the value of production, at least for this indicator. As indicated previously, congruency analysis should be part of a broad priority setting and post-activity evaluation process that includes other metrics to properly assess investments in terms of a country’s portfolio of crops, and their traits and productivity constraints.
13 Other indicators may reflect stakeholders’ crop attributes and the weights of each attribute, including smallholder use,
poverty alleviation potential, export capacity, region trade, etc. As the number of attributes (and weights) increases, it becomes more difficult to properly reflect priorities.
29
Figure 9. Venezuela - Congruencies between value of production and plant breeding emphasis
MaizeRice
Sorghum
Veg and Fruits
Other Legume
Misc.
Roots& Tubers
Oilseeds
0
0.5
1
1.5
2
2.5
3
3.5
1985 1990 1995 2001
Source: Plant breeding and biotechnology capacity survey

30
6. POLICY IMPLICATIONS AND RECOMMENDATIONS
General Policy Interventions
Tables 8a-e show the modified version of Trigo’s table (Trigo, 2003) that we used to incorporate some of the innovative influencing policies discussed by Furman, Porter and Stern into the Fuglie and Pray frameworks. We modified both approaches to explain PGRFA, plant breeding and biotechnology as distinctive innovative activities.
Table 8a. Determinants of innovation, R&D, and technology transfer
Innovation- R&D and technology transfer determinants
Policies
General state of the economy Macroeconomic stability Public infrastructure General education and training Development of capital and insurance markets Size of input markets Market share of state-owned enterprises Trade restrictions on inputs Price interventions in input or product markets Technological opportunity and the cost of research inputs
Public investments in agricultural research and education
Registration and testing requirements for new seed and agricultural chemicals Biosafety requirements for biotechnology field trials Public subsidies for private research Appropriability Intellectual property laws Technology licensing requirements and regulations affecting technology
imports Competitiveness and antitrust policies
Source: Fuglie and Pray (2000)
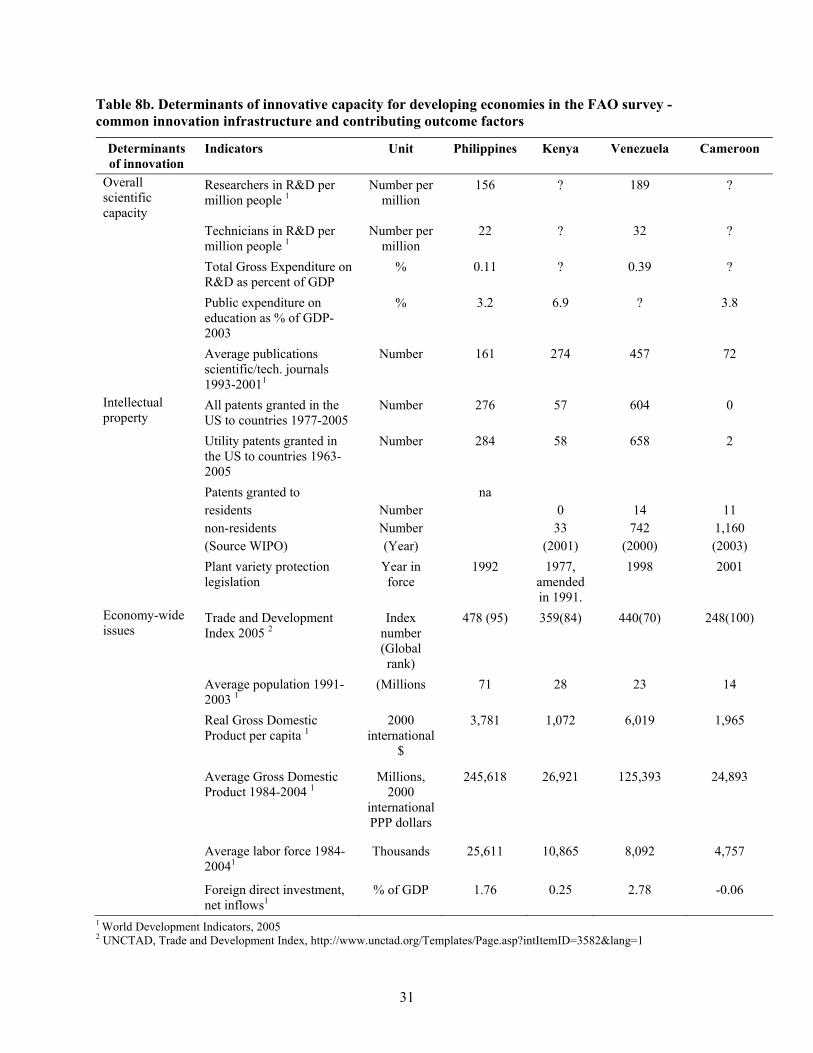
31
Table 8b. Determinants of innovative capacity for developing economies in the FAO survey - common innovation infrastructure and contributing outcome factors
Determinants of innovation
Indicators Unit Philippines Kenya Venezuela Cameroon
Overall scientific capacity
Researchers in R&D per million people 1
Number per million
156 ? 189 ?
Technicians in R&D per million people 1
Number per million
22 ? 32 ?
Total Gross Expenditure on R&D as percent of GDP
% 0.11 ? 0.39 ?
Public expenditure on education as % of GDP- 2003
% 3.2 6.9 ? 3.8
Average publications scientific/tech. journals 1993-20011
Number 161 274 457 72
Intellectual property
All patents granted in the US to countries 1977-2005
Number 276 57 604 0
Utility patents granted in the US to countries 1963-2005
Number 284 58 658 2
Patents granted to residents non-residents (Source WIPO)
Number Number (Year)
na 0
33 (2001)
14
742 (2000)
11
1,160 (2003)
Plant variety protection legislation
Year in force
1992 1977, amended in 1991.
1998 2001
Economy-wide issues
Trade and Development Index 2005 2
Index number (Global rank)
478 (95) 359(84) 440(70) 248(100)
Average population 1991-2003 1
(Millions 71 28 23 14
Real Gross Domestic Product per capita 1
2000 international
$
3,781
1,072
6,019
1,965
Average Gross Domestic Product 1984-2004 1
Millions, 2000
international PPP dollars
245,618
26,921
125,393
24,893
Average labor force 1984-20041
Thousands
25,611
10,865
8,092
4,757
Foreign direct investment, net inflows1
% of GDP 1.76 0.25 2.78 -0.06
1 World Development Indicators, 2005 2 UNCTAD, Trade and Development Index, http://www.unctad.org/Templates/Page.asp?intItemID=3582&lang=1
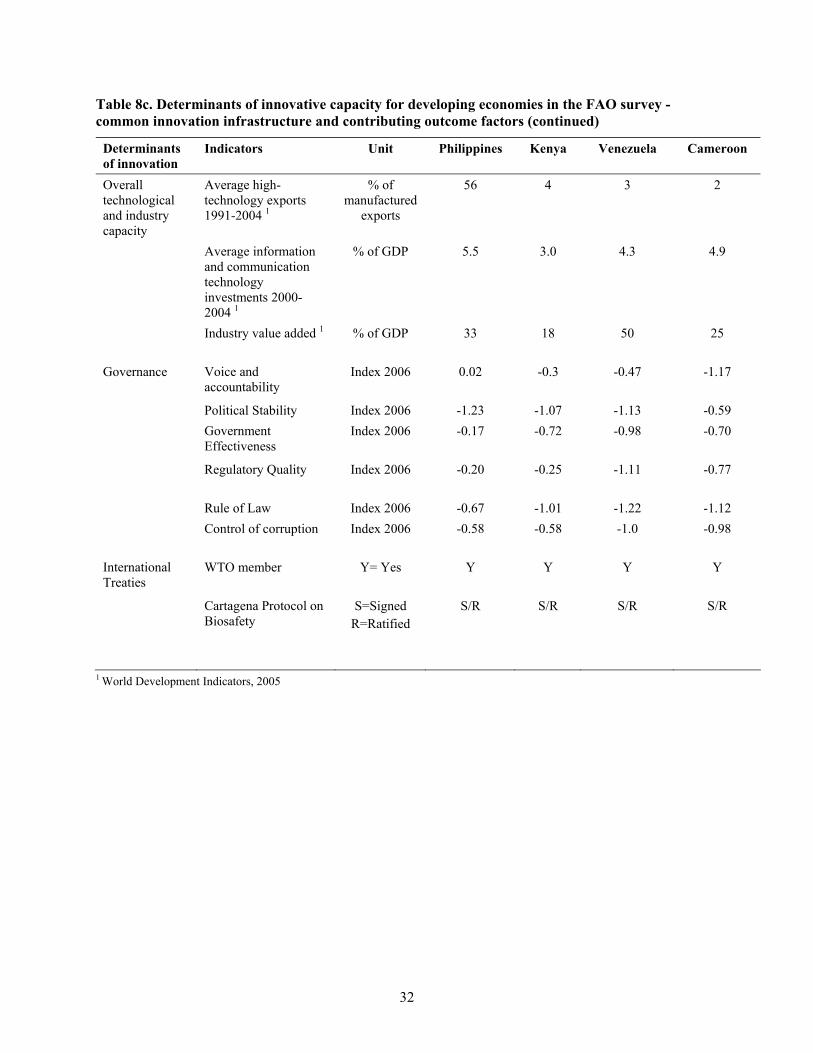
32
Table 8c. Determinants of innovative capacity for developing economies in the FAO survey - common innovation infrastructure and contributing outcome factors (continued)
Determinants of innovation
Indicators Unit Philippines Kenya Venezuela Cameroon
Overall technological and industry capacity
Average high-technology exports 1991-2004 1
% of manufactured
exports
56 4 3 2
Average information and communication technology investments 2000-2004 1
% of GDP
5.5 3.0 4.3 4.9
Industry value added 1 % of GDP 33
18
50
25
Governance Voice and accountability
Index 2006 0.02
-0.3
-0.47
-1.17
Political Stability Index 2006 -1.23 -1.07 -1.13 -0.59 Government
Effectiveness Index 2006 -0.17
-0.72
-0.98
-0.70
Regulatory Quality Index 2006 -0.20
-0.25
-1.11
-0.77
Rule of Law Index 2006 -0.67 -1.01 -1.22 -1.12 Control of corruption Index 2006 -0.58
-0.58
-1.0
-0.98
International Treaties
WTO member Y= Yes Y
Y
Y
Y
Cartagena Protocol on Biosafety
S=Signed R=Ratified
S/R
S/R
S/R
S/R
1 World Development Indicators, 2005

33
Table 8d. Determinants of innovative capacity for developing economies in the FAO survey - cluster-specific
Determinants of innovation
Innovative indicators
Unit Philippines Kenya Venezuela Cameroon
Conservation and enhancement of PGRFA
Average investments in germplasm enhancement 1985-2001 1
Thousands 1993
international dollars
5,976
1,426 363 224
Average investments in germplasm enhancement relative to total budget institutions, four observations 1985-2001 1
% 4.0 1.9 4.2 0.82
Conventional plant breeding
Capacity level 2 Subjective xx xx x x
Average full time equivalent number of scientists in plant breeding 1985-2001 1
Number of FTE
122 46 51 39
Average investments in plant breeding 1985-2001 1
Thousands 1993
international dollars
13,471 10,446 1,058 1,894
Number of PVP registrations
Number
Biotech capacities
Capacity level 2 Subjective xx x x x
Biotech patents 2 Number 0 7 ? ? Number of scientists in
biotech R&D1 FTE, average
1985-2001 24 5 9 15
Average investments in biotech R&D 1
1993 international PPP dollars, thousands
3,726 1,636 55 265
Field trials – Total 2 Number 7 4 0 0 Field trials – university /
NARs/NAROs 2 Number 2 1 0 0
Events approved (number of crops) for food and/or feed consumption 3
Number 37 (7) 0(0) 0(0) 0(0)
Overall crop improvement cluster relative strength
Percentage of total plant breeding R&D performed by public sector 1
% 57 60 92 100
Percentage of total plant biotechnology R&D performed by public sector 1
% 90 99.8 100 100
1 Data taken (or estimated) from FAO survey in Kenya, the Philippines, Venezuela, and Cameroon. Averages taken from four observations in the survey, including 1985. 2 Trigo, 2003 3 AGBIOS GM Database http://www.agbios.com/dbase.php?action=ShowForm

34
Table 8e. Determinants of innovative capacity for developing economies in the FAO survey – links, networks and technology transfer capacity
Determinants of innovation
Innovative indicators
Unit Philippines Kenya Venezuela Cameroon
Market size Arable land1
Category Med. Med. Med. Med.
Value added Agriculture2
Percentage of GDP
16 26 5 39
Internal seed market4
Million US$ n.a. 50 n.a. n.a.
Number seed firms5,6
Number At least 19 18 n.a. n.a.
Seed imports4 Million US$ (FOB)
8 11 13 ?
Strength of the private sector
Domestic credit to private sector 2004 2
% of GDP 34.8 26.8 11.2 9.9
Ease of doing business 3
Global rank 2005
121 80 144 147
Cost of business startup procedures (average 2001-2003) 2
% of GNI per capita
21 51 15 182
1 Trigo, 2003 2 World Development Indicators, 2005 3 World Bank Doing Business Database http://www.doingbusiness.org/ 4 Seed Statistics World Seed http://www.worldseed.org/statistics.htm 5 Data for Kenya from African Seed Trade Association http://www.afsta.org/ 6 For the Philippines, the Philippines Planting Seeds Annual 2004 GAIN report (available at http://www.fas.usda.gov/gainfiles/200406/146106548.pdf) lists 18 private sector members plus the University f the Philippines Los Baños Seed Technology Programme of the Department of Horticulture as members of the Philippines Seed Industry Association.
The value of discriminating countries into distinct polity situation categories based on specific indicators and policies influencing innovation (as done in Trigo’s. approach) is that it makes it possible to qualitatively map countries against the general policy interventions. Ideally, if enough data were available, it would be possible to quantitatively determine the relative importance and value of each factor or determinant in explaining innovation, pinpointing gaps and limitations within the innovation process. In fact, this is the process followed by Furman et al. (2003) in their model for the Organization for Economic Co-operation and Development (OECD) member countries. As datasets for developing countries are not as rich as those available for OECD member countries, we intend to pursue a combination of the Furman et al. (2003), Fuglie and Pray (2000), and Trigo (2003) approaches in our future research.
An important lesson from the typology and classification procedures described by Trigo (2003) is that countries that fall into the category “setting the stage for using biotechnology products” may need to concentrate more on developing the basic infrastructure for performing agricultural research while using
35
and conserving PGRFA and for conventional plant breeding, rather than trying to develop new biotechnology capacities. One of the potential outcomes of these countries’ investments in their “common innovative infrastructure” is the creation of the basic platforms needed to take advantage of spillovers from innovator countries or from those in the “improving the efficiency” category. Of the four countries in our survey, Cameroon fits into this category.
In contrast, countries in the category of “improving the efficiency and products of agricultural research through the use of biotechnological tools” have significant capacity to perform agricultural research but may not yet be advanced enough to create biotechnology innovations by themselves. These countries may be readily able to take advantage of direct spillovers from other countries, and to do adaptive research supporting the use of technology developed elsewhere. The capacity of these countries may be influenced by their market size. The range of factors and tools available to countries in this category increase significantly as more research and development opportunities arise; this, in turn, changes the sophistication level of their innovative system. Three of the four countries in our sample fall into this category, namely the Philippines, Kenya and Venezuela.
Finally, those countries in the category of “building capacities to develop biotechnology-based innovations” have achieved a distinct capacity to internally generate innovations from basic concepts at the discovery phase of research, and develop them all the way to commercial applications. It is worth noting that none of the14 four countries in our survey fall into this category. In fact, Trigo identified only nine developing countries in this category: China, Brazil, India, Mexico, Argentina, South Africa, Thailand, Russian Federation and Indonesia. Below, we present a detailed discussion of the four countries examined in the present work.
Table 9 shows the policy status, objectives, and tools for supporting germplasm enhancement, plant breeding and biotechnology, and cross-cutting issues for each country. Building from the country-specific situations analyzed in this paper, we suggest a series of targeted policy guidelines that should also serve other countries in similar policy situations. Table 9 includes the policy status category “building capacities to develop biotechnology based innovations;” however, none of the four studied countries has yet reached this stage of innovation, which requires a significant biotechnology capacity.
We use Trigo’s (2003) process to map the four countries included in this study in terms of their potential policy situations at a particular point in time. As Cameroon was not included in Trigo’s original table, we first outline Cameroon’s profile based on Trigo’s guidelines. Note that in terms of policy situations, Trigo classified the Philippines, Kenya, and Venezuela into the category of “improving the efficiency and products of agricultural research, through increased use of biotechnological tools – medium markets” (see Table 4, Trigo 2003, p. 69). Based on our own estimations and survey data, we in principle classify Cameroon into the category of “setting the stage for using biotechnology products.”
We herein modify Trigo’s original table, separating tools available for plant breeding and biotechnology from those that cut across clusters (see Table 9). For the specific category containing Kenya, Venezuela, and the Philippines (“improving the efficiency…”), there are very specific tools for countries seeking to improve the efficiency of existing capacity. This relates not only to their ability to develop specific areas such as biotechnology, plant breeding, and use/conservation of PGRFA, but also the different factors that contribute to the deployment of the technology to farmers. The policy tools and interventions for specific areas are shown in columns 3-6 of Table 9.
Current policy interventions in Cameroon are focused towards improving the common national innovative infrastructure, facilitating basic research into the use and conservation of PGRFA, and promoting conventional plant breeding. In this sense, the current state of development of the innovation system may indicate higher payoffs to investments in more conventional plant biotechnology, and perhaps the adaptation of advanced biotechnologies that have been developed elsewhere. As this is a dynamic process, these steps will enable the country to improve its innovation system and allow it to move forward
14 As of the writing of this report, political, economic and biosafety regulatory issues have significantly reduced the ability
of countries such as Thailand, Indonesia, and probably South Africa to develop biotechnology-based innovations, while the ability of the Russian Federations remain questionable.
36
to the next phase (that of “improving the efficiency…”), where greater emphasis will be put on the use and development of new biotechnology innovations. For Kenya, Venezuela and the Philippines, which are classified under “improving the efficiency...,” specific tools need to be identified to effectively address the cluster-specific gaps and limitations affecting crop improvement. Greater emphasis should be placed on the abilities of these countries to evaluate, adapt, and use advanced biotechnology innovations. Nevertheless, the capacity to use and conserve PGRFA remains as critical as it is in the other categories, because biotechnology innovations cannot advance in the absence of previous (“intermediate”) PGRFA innovations.
The Philippines are at a more advanced stage of development than the other two studied countries in that group and are moving forward in terms of producing GM biotechnologies within their innovation system. The Philippines have invested significant resources in both the common national innovation capacity and in cluster-specific groups for crop improvement. However, additional resource investments may be needed to improve the links between national clusters and other international groups, as well as technology transfer mechanisms.
Our analysis shows that although Kenya has invested both in plant breeding and biotechnology, it may need to re-assess its long-term national goals for investments in plant breeding, biotechnology and PGRFA conservation. In contrast, it is fairly difficult to recommend policy interventions for Venezuela, as the value of its agriculture is distorted by the oil-based economy. Despite the petroleum distortion, however, Venezuela has invested in the use and conservation of PGRFA and biotechnology.

37
Table 9. Policies tools, objectives, and tools for plant breeding and biotechnology
Policy Status Policy Objectives Tools – PGRFA Conservation Enhancement
Tools – Plant Breeding Tools – Biotechnology Tool – Cross Cutting
Setting the stage for using biotechnology products
• Development of conventional capacities
• Establishment of a regulatory system to facilitate access to biotechnology products
• Improvement of the technology delivery system
• Invest in germplasm bank • Characterization of plant
genetic material
• Support for NARS applied and adaptive research in agronomy and conventional plant breeding (infrastructure and human resource development)
• Development of operational IPR regulatory frameworks
• Design of seed legislation
• Development of operational biosafety frameworks
• Support for NARS applied and adaptive research in molecular biology and associated sciences within innovative cluster (infrastructure and human resource development)
• Promotion of agricultural technical services industry
• Support entry of private sector into seed and R&D systems
Improving the efficiency and products of agricultural research through increased used of biotechnological tools
For countries with small and medium markets • To create the environment
for accessing potential spill-over benefits from existing R&D investments
For countries with larger markets • To build/strengthen
capacities for technology exploitation in plant and animal health R&D
• To target GM research in important crops
• Invest in germplasm bank • Characterization of plant
genetic material • Explicit investments in
plant genetic material that may be used as input for biotechnology innovations
• IPR legislation, biosafety regulations and enforcement capacities
• Strengthening seed legislation and seed distribution systems
• Promotion of risk and venture capital mechanisms
• Mechanisms for facilitating public/private joint ventures in plant breeding and biotechnology- related R&D projects
• Development of quality certification and identity preservation systems
• Funding research in area related to technology and biosafety evaluation
• Mechanisms for facilitating public/private joint ventures in biotechnology related R&D projects
• Support of NARS and S&T institutions
• Support incipient private sector investments
• Help define and support public and private sector roles, coordination and collaboration
• Funding research projects that integrate capacities from different institutions, including those abroad
Building capacities to develop biotechnology- based innovations
• To promote and support basic and strategic research directed at improving the efficiency and scope of technology development
• To consolidate the investment environment, including FDI, biosafety and IPRs
• Invest in germplasm bank • Characterization of plant
genetic material • Explicit investments in
improving characterizing plant genetic material that may be used as source and input for biotechnology innovations
• Strengthening of IPR legislation, biosafety regulations and enforcement capacities
• Strengthening seed legislation and seed distribution systems
• Promotion of risk and venture capital mechanisms
• Mechanisms for facilitating public/private joint ventures in plant breeding and biotechnology related R&D projects
• Strengthening of quality certification and identity preservation systems
• Invest in discovery processes to identify local genes of interest
• Increased investments in adapting transformation protocols for crops of national interest
• Funding research in area related to technology and biosafety evaluation
• Mechanisms for facilitating public/private joint ventures in biotechnology related R&D projects
• Support of NARS and S&T institutions
• Support incipient private sector investments
• Help define and support public and private sector roles, coordination and collaboration
• Funding research projects that integrate capacities from different institutions, including those abroad
• Development strategic alliances to support deployment of technologies
Source: Modified from Table 3 in Trigo (2003, pg. 66)
38
The data evaluated in this study seem to indicate that this country has a significant common national innovation structure, and has made important investments in plant breeding clusters. If Venezuela decides to make future investments in the biotechnology cluster, policy makers should probably address the question of aligning their investments with crop priorities (see next section). Countries may be classified according to their capacity to perform biotechnology innovations. An example of this is the approach developed by Trigo (2003), wherein countries are categorized according to their innovative capacity and ability to tap into capacities developed elsewhere. The four categories described by Trigo are: 1) importers of technology – non-selective; 2) importers of technology – selective; 3) tool users; and 4) innovators. Among the four countries examined herein, Trigo (Table 5, p. 70) classified Venezuela and Kenya as “selective importers of technology with a medium market” and the Philippines within the category of “tool users with a medium market”15. Based on available survey and other data, we believe that Cameroon falls into the category of “non-selective importers of technology with a medium market.” The only developing countries that Trigo classifies as “innovators” are India, Brazil, and China, all of which have large markets. The implication of this classification is that countries categorized as “importers of technology” may be able to tap into the work of the “innovators” and/or “tool users” to overcome the limitations of their internal innovative capacity.
Potential Country-Specific Policy Interventions
Based on our analysis of the available data for the four studied countries (summarized in Table 10), we propose a set of country-specific policy interventions derived from the survey data, IFPRI’s analysis and experience, and particularly the authors’ in-country experience with plant breeding and biotechnology issues. Some of the policy interventions described here are meant to initiate discussions of alternative policy options for addressing the gaps, limitations, and shortcomings of the human and financial investments in the four studied countries.
Cameroon
Two of the most pressing policy issues in Cameroon are the low overall funding for plant breeding and biotechnology, and the low available funds per scientist. As shown in our analysis, Cameroon’s budget for plant breeding and biotechnology has declined greatly since 1985, and it has the lowest rate of funding available per researcher among the studied countries. This would seem rather counterintuitive, given the economic importance of the agricultural sector and the growing value of agriculture in this country, as measured by its share of total GDP.
15 Notably, our experience working in East Africa indicates that Kenya should be considered an innovation leader in the
region, as the innovation system in this country has been able to create innovations and tap into both internal and external resources.

39
Table 10. Comparative indicators among countries
Indicator
Cameroon
Kenya
Philippines
Venezuela
Population 2003, million hab. 15 31 78 25 Ag GDP, as a percentage of total GDP 44 19 15 4 Number of Ph.D. plant breeders in most recent year, FTE 13 20 30 10 Number of Ph.D. plant breeders in 1985, FTE 8 4 9 2 Key crop groups for breeding, number 3 5 1 5 Number of surveyed institutes 5 10 5 3 Budget for plant breeding, annual average 1,894 10,446 13,471 1,580 Budget for plant breeding, most recent year 1,050 6,773 21,619 1,384 Budget per researcher, most recent year 27,643 129,744 196,532 29,445 Budget for biotechnology, most recent year 265 1,636 3,726 55 Number of varieties released, most recent year 6 45 78 60 Number of varieties released per year, average 25 31 43 48 Value added as a percentage of GDP 39 26 16 5
Source: Author’s survey and World Band Indicators Budget figures are in 1993 international dollars
An additional concern in Cameroon is the relatively low crop coverage by scientists in terms of crop investment and priority preferences and outputs (varieties released). The 13 FTE scientists available for plant breeding in Cameroon are spread over five institutes and work on multiple crops. Notably, in the earlier years studied, Cameroon pursued a more diversified breeding strategy that included wheat, maize, rice, and fiber crops, three of which (maize, rice, and wheat) were basic global food security crops. By the end of the studied timeframe, however, only rice, fiber crops, vegetable and fruits varieties were being released. In addition, crop selected for research in development and posterior release in Cameron (as in Table 7a), should be contrasted with Cameroon’s staple foods, which include corn, millet, peanuts, yams, cassava, and plantains, as well as their major export commodities, such as cocoa beans, coffee and cotton. In terms of outputs, we note that the average number of varieties released declined from 25 to six over the study period. Future work is warranted to examine whether this decrease is due to decreased funding and/or the low number of scientists, each working on multiple crops.
Declining resources and a shift in crop prioritization is likely to curtail both breeding and biotechnology programs in Cameroon. One way to expand the knowledge base and research in this country might be to implement incentives aimed at encouraging the private sector to become involved in meeting the needs of farmers. This may be possible for crops having significant investments at the international level (e.g. maize), provided there is a market and cash base to support further market development in Cameroon. However, as shown by our analysis of the national innovating capacity, there are only limited opportunities for national private sector investment in plant breeding and biotechnology in Cameroon. This may represent an opportunity for the government of Cameroon to support governance and targeted support of private sector investments in the country, which will indirectly aid the development of agricultural technologies in general.
It may be useful to examine each institute’s program in light of the findings from this report. For example, how are the new crops of importance related to Cameroon’s agricultural GDP? Is the release of six new varieties annually enough to satisfy the needs of farmers? Is the recent decrease in the numbers of varieties released annually part of a planned pull-back? With resources so short, Cameroon may wish to

40
explore these issues and determine how its resources are best applied. This process could involve farmer surveys, as well as an analysis of the adoption rates of the new Cameroonian varieties.
Kenya
A major consequence of Kenya’s expected future population growth is the need for crop productivity improvements, including development of new varieties or hybrids through conventional plant breeding and other less traditional approaches. The experience worldwide is that in cases of stagnant productivity, farmers tend to expand production to marginal lands in order to meet expanding demand and food security needs and this may well be the case for Kenya. However, these developments needs may conflict with other land use purposes (conservation, game reserves, etc.), making it important to also examine the possibility of significantly increasing the productivity of the farmland that is already in use.
Our analysis shows that the Kenyan budgets for plant breeding and biotechnology decreased from 1990 to 2001. The largest (although decreasing) investments were made for maize and legumes; in 2001, legumes represented the largest share of the national plant breeding budget, followed by maize, with a major emphasis on line evaluation over germplasm enhancement and line development. Over the study period, the plant breeding capacity, as measured by the number of Ph.D. increased from 4 to 20, with these scientists spread over 10 institutes. Among the four studied countries, Kenya was second only to the Philippines in total number of Ph.D. scientists in plant breeding. Kenya also invested a significant amount of financial resources in plant breeding over the period of the survey; this built a strong foundation for variety development, resulting in the release of 45 releases by the public sector in 2001, which is well over the period-average of 31.
One potential problem for the plant breeding system in Kenya is that the available funds per researcher are approximately $130,000 (1993 international PPP dollars) per year in 2001. In the authors’ personal experience, agricultural research tends to be very difficult to maintain with per-researcher operating funds of less than $100,000. Although Kenya is above this value, we believe policy makers should consider increasing the country’s investment in the most important food security and export crops. Alternatively, additional support could be provided to the emerging private seed sector in Kenya. As this sector becomes more active, public funds can be directed more efficiently to fewer crops of greater importance, in order to meet the demands of Kenya’s rising population. It would also be advisable to improve research funding by diversifying its sources. Given the high potential for further development of plant breeding and biotechnology research, and the possibility of tapping into the rich expertise and on-going programs available in Kenya, such improvements could greatly benefit national and regional farmers.
As is often stated, biotechnology, especially GM research, relies on a firm foundation of classical breeding. While Kenya has such a foundation, the country has been slow to expand its capacity in biotechnology. The biotechnology budget in Kenya is only about a quarter the size of its plant breeding budget and funding decreased over the study period, both by discipline and by crop. If this trend continues, the amount of financial resources available to each scientist will also fall.
The size of the Kenyan budget, and the fact that it does not seem entirely sufficient even at such levels, underscores the fact that plant breeding and biotechnology are expensive endeavors. Both research activities are labor intensive, field trial-dependent, and take many breeding cycles (time) before results are seen. In addition, it is important for breeders to constantly update their understanding of crops and strategies, keep their institute from becoming isolated, and help plan adoption strategies. Our analysis revealed that the Kenyan plant breeding system emphasized line evaluation over the study period. In terms of future work, the Kenyan Agricultural Research Institute could take the lead in a strategic study of Kenyan crop priorities for breeding, rates of adoption, and the degree of international collaboration. Over the study period, varietal production appears to have matched expectations for the available funding. However, yield and other genetic improvements should be confirmed at the level of farmers’ fields, and contributions to GDP value added should be assessed.

41
In addition, the interests and priorities of private sector breeding programs should be contrasted with those of the public sector, with an aim toward exploring their complementarity and assessing which potential products could be quickly delivered. This would help create proper incentives for the private sector to continue investing in plant breeding and biotechnology, and to collaborate with the public sector in current initiatives. Such an analysis could lead to further explorations, such as possible public-private partnerships that may enable KARI and other public sector institutions to get their innovations into farmers’ hands, by allowing the private sector to serve as a conduit for technology transfer. This approach would redirect KARI and the Kenyan public sector R&D institutions, encouraging them to bring their technologies up to a development level that demonstrates potential usefulness, thus supporting uptake by the private sector.
The Philippines
Among the studied countries, the Philippines are subject to the highest population pressure that combined with the limited area available for agriculture, places the highest demands to increase agricultural productivity. This fact may partially explain the relatively high levels of biotechnology and plant breeding R&D funding by the public and private sector in the Philippines seen during the study period. In contrast to the other surveyed countries, researchers in the Philippines had per-researcher funding of a generous $196,532 in 2004. This indicates that the public sector places significant importance and trust on the research system, and believes that technology development is crucial to improving existing productivity. This is also reflected in the capabilities of the plant breeders and biotechnologists, and the complex nature of their programs. One area of concern would be the need for drafting explicit policies to address the pending retirement of aging researchers, and the need to train and replace them with younger scientists. Policy makers should recognize that it is important to link older and newer researchers, in order to tap into the accumulated knowledge pool and ensure a smooth transition.
The observed funding per researcher in the Philippines was the highest among the four countries studied, and this investment supported the release of approximately 78 new varieties in 2004. The major emphasis of all investments was on rice, vegetables and fruit, and oilseed crops. The Philippines were involved in broad international collaborations, and had a solid in-country breeding program at the Institute of Plant Breeding (IPB). Plant breeders were equally focused on germplasm evaluation and line development, with line evaluation receiving less attention, indicating that these researchers placed more emphasis on the development, rather than testing, of new varieties. This advanced capability is a major strength of the Philippines’ R&D system.
In addition, unlike the other countries in this study, regulators and decision makers in the Philippines have approved the growth and use of commercially-provided GM maize for food and feed, and have invested public resources in the development of a number of GM crops (Cohen 2005). For this reason, the Philippines offer the best opportunity among the studied countries to explore the link between biotechnology and breeding in the public sector. In the future, this sort of study would be very useful for informing policy makers and helping guide resource allocations, and the results could be extended to the other countries in this study. The financial and human capacity for biotechnology is considerable in the Philippines, which had the highest annual budget for biotechnology among the studied countries. However, it is too soon to determine the absolute value of these efforts, as that can only really happen when public GM varieties are approved for commercialization and made available to farmers.
Compared to the other countries in our sample, the Philippines has a relatively vibrant private seed sector. Therefore significant opportunities exist to establish innovative approaches including public-private partnerships and cottage industries that will support seed systems in rural areas. In addition, as shown by our examination of national innovation capacities from data in Tables 8a-8d, the Philippines may need to exploit current plant breeding and biotechnology capacities through strategic alliances and delivery, and explore additional involvement of public sector institutions in product development and transfer. These new institutional arrangements would likely result in an improved environment for delivery of technological interventions.

42
Venezuela
Venezuela is a rich oil country with a very small agricultural sector. This country has the lowest population pressure of the four studied countries, and the smallest share for agriculture in the nation’s GDP. Even though its plant breeding and biotechnology budget was the lowest among the four studied countries, Venezuela released among the most varieties from the fewest institutes (although the bulk of private sector releases were derived from varieties developed elsewhere). The largest focus for these releases was rice, maize, and legumes, followed by sorghum and millet, and vegetables and fruit. The human and financial resources invested by Venezuela were lower than those invested by the Philippines and Kenya. The main concerns identified in the present work are the need to assure congruence between investments in PGRFA use and conservation and crop priorities. Taking a long-term perspective, it may also be important to assess how Venezuela’s petroleum-based economy will move into a post-petroleum economy, and how long-term investments in the common innovation infrastructure and cluster-specific areas of interest could support such a move. The process of shifting from a petroleum-based economy to a more diversified economy may be gradual, but it will take time to develop an innovation infrastructure and R&D targeted toward crop improvement innovation.
As noted above, Venezuelan institutes have typically tapped into varieties developed elsewhere, selecting and developing them for national needs. This approach has been complemented by internal efforts to select domestically-derived varieties. The established capacity to release varieties derived from spillovers may be complementary to the use of biotechnologies derived internally or externally. In the end, the quality of a given biotechnology product is heavily dependent on the quality of the parent germplasm, the gene product and the transformation process. Having a functional seed system is necessary (but not sufficient) to ensure the future viability and suitability of a biotechnology-supported agriculture.
It will be necessary to assess the medium- to long-term viability of strategies aimed at utilizing alternative pathways to address national capacities, versus continued use of spillovers and adaptation of innovations developed elsewhere. In practice, this should probably be based on a long-term plan by the Venezuelan government for the future transition to a less fossil fuel-dependent, diversified economy. Although agriculture in Venezuela has decreased in terms of its share of overall national GDP, it has not diminished in terms of the number of stakeholders and its value as a social valve. Thus, addressing the needs and constraints of the rural sector should be seen as a long-term investment with potentially enormous payoffs.

43
7. SUMMARY
This report discusses the plant breeding and biotechnology innovative capacity of four countries (Cameroon, Kenya, the Philippines and Venezuela) included in a survey conducted by FAO. We introduce a conceptual framework that can be used to describe innovative capacity, in order to expand the discussion on agricultural R&D capacity to the broader context of national innovative capacity. Our analysis focuses on examining the human and financial resources available to conduct research, as well as assessment of crop priorities, and the output produced in each country.
With the exception of Venezuela, all of the countries described in the study made significant investments in plant breeding and biotechnology capacity in terms of human and financial resources. This reflects the countries’ belief in the use of agricultural technology to help alleviate national poverty. However, in most cases these investments have declined over time, particularly in the case of plant breeding. This may reflect an overall reduction in the value of agriculture to these economies. In other cases, public sector investments may decrease when private sector investments increase to the point where they are able to support internal R&D.
All four countries produced significant outputs in terms of varieties over time. We are unable to quantify how many of the varieties produced by the private and public sector organizations in these countries actually reached the farmers. Nevertheless, the R&D systems in these countries managed to meet significant milestones in terms of creating varieties that may be useful to farmers. In some of the countries described in this paper, however, the number of varieties and/or the number of crops in the R&D portfolio declined over the study period. This may be a result of decreased investments in financial resources, reductions in the number of scientists, or a shift in a given country’s crop and food security priorities, rather than reflecting actions of the R&D systems themselves.
There are two important issue identified in the literature that are critical for the future strengthening of plant breeding and biotechnology capacity and for shaping policies pursuing this goal. The first issue is that plant breeding is a long term venture and its success builds slowly and cumulatively. Plant breeding cannot operate successfully on a stop-go basis, as loss of continuity has negative consequences for future improvements. Currently, public sector investments in agricultural research, particularly in plant breeding, are rapidly losing ground on a global basis to private investment (Heisey et al. 2001; Tripp and Byerlee 2000) although there are existing efforts to support public sector investments in plant breeding efforts. As seen in this paper investment in plant breeding and biotechnology in some countries have fluctuated over time. Therefore the funding uncertainty can only serve to reduce the effectiveness of such programs especially those of public good or which are of a long term research nature.
Second issue is that specific plant breeding goals such as long-term research, addressing orphan and/or neglected species and traits addressing resource poor farmers, may be best suited for the public sector. Given public financial constraints observed in this paper, it seems unlikely that many of these crops will receive the attention needed for diversification. The private sector may be unable to invest in these areas, as the private sector cannot support research where there are not sufficient financial gains, particularly in the long term. Moreover, the public sector is able to make the results of its efforts in research and plant breeding available to all, rather than the results coming from private investment that may be restricted by intellectual property rights. This is an investment gap that will need to be closed by international donor community and multilateral development agencies and other interested stakeholder and investors in plant genetic resources for agriculture. As such, there is great scope for coordinated efforts all stakeholders. We certainly hope that this paper serves as a roadmap for deriving policies that will lead to innovative alternatives for solving gaps and limitations described in this paper and ultimately fulfill the potential contained in the plant genetic resources for agriculture.

44
APPENDIX A: THE FURMAN, PORTER AND STERN NATIONAL INNOVATIVE CAPACITY FRAMEWORK
Figure A.1. The Furman, Porter and Stern national innovative capacity framework
Cumulative technology sophistication
Human capital and financial resources available for R&D activity
Set of resource commitments and policy choices• Investments in education/training• Intellectual property protection• Information and communication technologies •Openness to international trade
Common InnovationInfrastructure
Plant Breeding
Biotechnology
Cluster-Specific EnvironmentFor Innovation
Quality of Linkages
Context for Firm Strategy and Rivalry
Factor (Input) Conditions
Demand Conditions
Related & Supporting Industries
Note: Based on Furman, Porter and Stern (2002)

45
APPENDIX B: POTENTIAL VARIABLES FOR THE ESTIMATION OF THE DETERMINANTS OF NATIONAL BIOTECHNOLOGY INNOVATION CAPACITY
Here we propose a set of variables for use in describe national innovative capacity in countries, as well as the plant breeding- and biotechnology-specific clusters. The variables described here closely mimic those used in the conceptual framework proposed by Furman, Porter and Stern (2003). Variables names in the text are denoted by fully capitalized text.
1) Innovative output(s) a) BIOTECHNOLOGY AND PLANT BREEDING PRODUCTS- Those currently staged at least at the confined/small-scale field trials level within the Next Harvest and other databases. This specific group is used rather than the group containing all innovations from the advanced lab stage onward because further development of the technology brings us closer to the concept of a true innovation. It would be interesting (but not critical) to cross-check this with: b) PATENTS: Patents granted in the US to the establishments in country j in year (t+3), OR c) PATENTS/MILION: International patents per million persons. This will give us an idea of the strategic importance attached to innovations as well as their relative importance with regard to population. The value of using patents in these studies is that we can assume that firms/organizations see enough value in these innovations to incur the cost and effort of patenting. Thus, patents may serve as a proxy for innovation.
2) Common innovation infrastructure to all innovative capacity in the country (Quality) These variables are useful because both plant breeding and biotechnology benefit (contribute to) the overall existing scientific capacity within the country. Disciplines within the scientific community are harder pressed to thrive when there is not enough basic and applied knowledge accumulated in the country, or no easy access to innovation knowledge. In the age of modern communication methods, this is slowly shifting from the national to the international arena. a) GDP per CAPITA: Gross Domestic Product (1985 international dollars) per capita. b) PATENT STOCK: Cumulative PATENTS granted during the study period. There is the need to find alternatives to this metric, as the numbers of patents for agricultural biotechnologies in developing countries are likely to be small. An alternative may be number of literature citations in international or regional journals. c) R&D: Total R&D aggregate expenditures in all sectors in millions (1985 international dollars) d) FTE SCIENTISTS: Aggregate scientists in all sectors measured in Full Time Equivalent (FTE) units. e) OPENESS: Openness to international trade. f) OPENESS TO INFORMATION ACCESS: This is a new variable that measures internet connectivity, telephone lines, etc. This variable should provide an idea of how well the scientific community is able to access outside knowledge, which may substitute for internal capacity. g) IP: Strength of intellectual property protection. Higher levels of protection are associated with a higher degree of innovation. However, excessive IP protection may stifle innovation, as the agents may use the protection to gain monopolistic pricing of the innovation. Patents grant a level of monopoly to the grantee, but it is limited in scope and time. h) ED SHARE: Importance of education investments relative to the overall economy. This will be measured as public spending on secondary and tertiary education, divided by the GDP. The variable provides an idea of the political will to support education, while also proxying for the potential pool of scientists in the country. i) ANTITRUST: Stringency of antitrust policies. This metric measures the degree of state control over innovative capacity. On one hand, excessive monopolistic power may stifle innovation by smaller companies or the public sector. On the other hand, excessive control may render compliance costs too high, pricing-out smaller companies.

46
j) POPULATION: Population provides a measurement of the capacity to absorb/demand innovations, while also giving an idea of the economies of scale and scope within the country.
3) Biotechnology and plant breeding cluster specific innovation environment a) REGULATION: From the Next Harvest and other databases we can obtain the cumulative density of technologies at each regulatory stage for the country of interest. The assumption may be that an efficient regulatory system has predictable time spans for each stage of the regulatory process. A better metric is the time accumulated in each biosafety regulatory stage. b) PRIVATE R&D: R&D funded by private industry. c) PUBLIC R&D: R&D funded by public sector. d) SPECIALIZATION: Relative concentration of innovative output in the biochemical and biotechnology Unites States Patent and Trademark Office (USPTO) patent classes.
4) Quality of linkages among biotechnology, plant breeding and other clusters a) UNIV R&D PERFORMANCE: Percentage of R&D performed by universities. b) VC: Strength of venture capital markets.
5) Contributing and related outcome factors a) GDP: Gross Domestic Product in purchasing power parity ( PPP) -adjusted 1985 US$. b) LABOR: Labor force measured as full-time equivalent persons employed. MARKET SHARE HITECH: Share of exports in high-technology industries. c) MARKET SHARE AGRICULTURE: Share of exports of agriculture, which gives an idea of the potential markets. d) EXPORTS TO SENSITIVE MARKETS: Share of exports to sensitive markets, particularly those in the EU, Japan and the Middle East. e) LEVEL OF POTENTIAL BENEFITS: Provides an idea of the potential demand for the product. f) PUBLIC/PRIVATE GOOD INNOVATION SHARE: Proxy for market versus public investment types of distribution.
47
REFERENCES
Adato, M. and R. Meinzen-Dick. 2003. Assessing the impact of agricultural research on poverty and livelihoods, Quarterly Journal of International Agriculture 42(2):149-167.
Atanassov, A., A. Bahieldin, J. Brink, M. Burachik, J. I. Cohen, V. Dhawan, R. V. Ebora, J. Falck-Zepeda, L. Herrera-Estrella, J. Komen, F. C. Low, E. Omaliko, B. Odhiambo, H. Quemada, Y. Peng, M. J. Sampaio, I. Sithole-Niang, A. Sittenfeld, M. Smale, Sutrisno, R. Valyasevi, Y. Zafar, and P. Zambrano. 2004. To Reach The Poor. Results from the ISNAR-IFPRI Next Harvest Study on Genetically Modified Crops, Public Research, and Policy Implications. EPTD Discussion Paper 116. Washington, D.C.: International Food Policy Research Institute.
Borges, O. 2005. Programas de fitomejoramiento de Venezuela: Capacidad y prioridades. Country report submitted to the Food and Agriculture Organization (FAO). El Limón, Maracay, Venezuela: Universidad Central de Venezuela, Facultad de Agronomía.
Conway, G., and V. Ruttan. 1999. The Doubly Green Revolution: Food for All in the 21st Century. London: Penguin Books.
Cohen, J. I. 2005. Poorer nations turn to publicly developed Gm crops. Nature, Vol. 23 (1), January, pp. 27-33.
Douthwaite, B. 2001. Enabling innovation. A practical guide to understand and fostering technological change. London: Zed Books Ltd.
Duvick, D.N. 1997. Genetic rates of gain in hybrid maize yields during the past 40 years. Maydica, 22:187-196.
Dyson, T. 1999. World food trends and prospects to 2025. Proceedings of the National Academy of Sciences of the United States of America PNAS 96 (11): 5929-5936.
Evenson, R.E and D. Gollin. 2003. Assessing the impact of the green revolution, 1960 to 2000. Science 300 (May): 758-762.
Falck- Zepeda, J. B. 2006. Coexistence, Genetically Modified Biotechnologies and Biosafety: Implications for Developing Countries. American Journal of Agricultural Economics 88 (5):1200–1208.
Falck-Zepeda, J. and G. Traxler. 2000. The role of federal, state, and private institutions in seed technology generation. In Fuglie, K. O. and D. E. Schimmelpfenning (eds) Public-Private Collaboration in Agricultural Research – New Institutional Arrangements and Economic Implications. Ames, Iowa: Iowa State University Press.
Falck-Zepeda, J. B., J. Cohen, R. Meinzen-Dick and J. Komen. 2002. Biotechnology and Sustainable Livelihoods: Findings and Recommendations of an International Consultation. ISNAR Briefing Paper 54, The Hague, Netherlands.
FAO. 2005. The way forward to strengthen national plant breeding and biotechnology capacity. Report of a workshop; 9-11 February 2005.
FAO. 2006 Towards the Sustainable Use of Plant Genetic Resources Food and Agriculture (PGRFA): Strengthening Plant Breeding. Prepared for the Working Group on PGRFA of the CGRFA (CGRFA/WG-PGR-2/03/2) at FAO.
FAO. 2001. The International Treaty On Plant Genetic Resources For Food And Agriculture. Available at http://www.fao.org/ag/cgrfa/itpgr.htm#text
Fernandez-Cornejo, J. 2004. Improved seed is a major contributor to crop yield grains and agricultural productivity. In The Seed Industry in U.S. Agriculture. Agriculture Information Bulletin No. AIB786. Washington DC: ERS.
Frey, K. J. 2000. A National Strategy for Plant Breeding in the United States. In Fuglie, K. O. and D. E. Schhimmelpfenning (eds.) Public-Private Collaboration in Agricultural Research – New Institutional Arrangements and Economic Implications. Ames, Iowa: Iowa State University Press

48
Frey, K. J. 1998. National Plant Breeding Study III: National Plan for Genepool Enrichment of U.S. crops in the United States. Iowa Agriculture and Home Economics Experiment Station. Special Report 101. Ames, Iowa.
Frey, K.J. 1997. National plant breeding study II: National plan for promoting breeding programs for minor crops in the United States. Iowa Agriculture and Home Economics Experiment Station. Special Report 100. Ames, Iowa.
Frey, K.J. 1996. National plant breeding study-I. Human and financial resources devoted to plant breeding research and development in the United States in 1994. Iowa Agriculture and Home Economics Experiment Station. Special Report 98. Ames, Iowa.
Fuglie, K. and C. Pray. 2000. The Private Sector and International Technology Transfer in Agriculture. In: Public-Private Collaboration in Agricultural Research- New Institutional Arrangements and Economic Implications. K. Fuglie and D. E. Schimmelpfenning. Iowa State University Press, Ames, Iowa. Pp 269-299.
Furman, J. L., M. E. Porter, and S. Stern. 2002. The determinants of national innovative capacity. Research Policy 31(6), 899–933.
Heisey, P.W., C.S. Srinivasan, and C. Thirtle. 2001. Public Sector Plant Breeding in a Privatizing World. Agricultural Information Bulletin No. 772. Washington, D.C.: Economic Research Service, U.S. Department of Agriculture.
Huang, J., C. Pray, and S. Rozelle. 2002. Enhancing the crops to feed the poor. Nature 418 (August): 678-684.
Kengue, J. 2004. Enquête nationale sur la sélection végétale et la biotechnologie au Cameroun. - Country report submitted to the Food and Agriculture Organization (FAO). Yaoundé, Cameroun: Institut de Recherche Agricole pour le Développement (IRAD).
Kishore, G. M. and C. Shewmaker. 1999. Biotechnology: Enhancing human nutrition in developing and developed world. PNAS 93: 5968-5972.
Moore-Lappé, F. J. Collins, P. Rosset, L. Esparza. 1998. 12 Myths about hunger based on World Hunger: 12 Myths. 2nd Edition. New York: Grove/Atlantic and Food First Books. Available at http://www.foodfirst.org/pubs/backgrdrs/1998/s98v5n3.html
Pingali, P. and G. Traxler. 2003. Changing Locus of Agricultural Research: will the poor benefit from biotechnology and privatization trends. Food Policy 27(3):223-238.
Songa, J. M. 2005. National plant breeding and biotechnology survey for Kenya. Report Submitted to the Food and Agriculture Organization (FAO). Nairobi, Kenya: Kenyan Agricultural Research Institute
Trigo, E. 2003. Developing and Accessing Agricultural Biotechnology in Emerging Countries: Policy Options in Different Country Context. In Accessing Agricultural Biotechnology in Emerging Economy, Proceedings of the OECD Global Forum on Knowledge Economy, OECD, Paris, 18-19 November, 2002.
Tripp, R. 2001. Can biotechnology reach the poor? The adequacy of information and seed delivery. Food Policy 26(3):249-264.
United Nations Secretariat, Population Division of the Department of Economic and Social Affairs. 2004. World Population Prospects: The 2004 Revision. New York: United Nations. Available at http://esa.un.org/unpp.


RECENT IFPRI DISCUSSION PAPERS
For earlier discussion papers, please go to www.ifpri.org/pubs/pubs.htm#dp. All discussion papers can be downloaded free of charge.
761. How change agents and social capital influence the adoption of innovations among small farmers: Evidence from social networks in rural Bolivia. Mario Monge, Frank Hartwich, and Daniel Halgin, 2008.
760. Gender Difference in the Long-Term Impact of Famine. Ren Mu and Xiaobo Zhang, 2008.
759. Rural innovation systems and networks: Findings from a study of Ethiopian smallholders. David J. Spielman, Kristin E. Davis, Martha Negash, and Gezahegn Ayele, 2008.
758. A Tale of two countries: spatial and temporal patterns of rice productivity in China and Brazil. Liangzhi You, 2008.
757. Must conditional cash transfer programs be conditioned to be effective? The impact of conditioning transfers on school enrollment in Mexico. Alan de Brauw and John Hoddinott, 2008.
756. From the ground up: Impacts of a pro-poor community-driven development project in Nigeria. Ephraim Nkonya, Dayo Phillip, Tewodaj Mogues, John Pender, Muhammed Kuta Yahaya, Gbenga Adebowale, Tunji Arokoyo, and Edward Kato, 2008.
755. Child labor and schooling responses to production and health shocks in Northern Mali. Andrew Dillon, 2008.
754. Decentralization, local government elections and voter turnout in Pakistan. Kamiljon T. Akramov,Sarfraz Qureshi, Regina Birner, and Bilal Hasan Khan, 2008.
753. Regional biotechnology regulations: Design options and implications for good governance. Regina Birner and Nicholas Linacre, 2008.
752. The rise of supermarkets and their development implications: International experience relevant for India. Thomas Reardon and Ashok Gulati, 2008.
751. Investing in African agriculture to halve poverty by 2015. Shenggen Fan, Michael Johnson, Anuja Saurkar, and Tsitsi Makombe, 2008.
750. Accelerating growth and structural transformation: Ghana’s options for reaching middle-income country status. Clemens Breisinger, Xinshen Diao, James Thurlow, Bingxin Yu, and Shashidhara Kolavalli, 2008.
749. Seed value chains for millet and sorghum in Mali: A state-based system in transition. Lamissa Diakité, Amadou Sidibé, Melinda Smale, and Mikkel Grum, 2008.
748. The impact of CAFTA on employment, production and poverty in Honduras, Samuel Morley, Eduardo Nakasone, and Valeria Piñeiro, 2008.
747. Asian-driven resource booms in Africa: Rethinking the impacts on development. Clemens Breisinger and James Thurlow, 2008.
746. Trading millet and sorghum genetic resources: Women vendors in the village fairs of San and Douentza, Mali. Melinda Smale, Lamissa Diakité Brahima Dembélé, Issa Seni Traoré, Oumar Guindo, Bouréma Konta, 2008.
745. Determinants of smallholder commercialization of food crops: Theory and evidence from Ethiopia. John Pender and Dawit Alemu, 2007.
744. Benefit-cost analysis of Uganda’s clonal coffee replanting program: An ex-ante analysis. Samuel Benin and Liangzhi You, 2007.
743. The impact of CAFTA on poverty, distribution, and growth in El Salvador. Samuel Morley, Eduardo Nakasone and Valeria Piñeiro, 2007.
742. Impact of contract farming on income: Linking small farmers, packers, and supermarkets in China. Sachiko Miyata, Nicholas Minot, and Dinghuan Hu, 2007.
741. Spatial coordination in public good allocation: Nonparametric evidence from decentralized Indonesia. Futoshi Yamauchi, Shyamal Chowdhury, and Reno Dewina, 2007.
740. Genetically modified food and international trade: The case of India, Bangladesh, Indonesia, and the Philippines. Guillaume Gruère, Antoine Bouët, and Simon Mevel, 2007.
INTERNATIONAL FOOD POLICY RESEARCH INSTITUTE
www.ifpri.org
IFPRI HEADQUARTERS
2033 K Street, NW Washington, DC 20006-1002 USA Tel.: +1-202-862-5600 Fax: +1-202-467-4439 Email: [email protected]
IFPRI ADDIS ABABA
P. O. Box 5689 Addis Ababa, Ethiopia Tel.: +251 11 6463215 Fax: +251 11 6462927 Email: [email protected]
IFPRI NEW DELHI
CG Block, NASC Complex, PUSA New Delhi 110-012 India Tel.: 91 11 2584-6565 Fax: 91 11 2584-8008 / 2584-6572 Email: [email protected]